Embed Size (px)
Citation preview
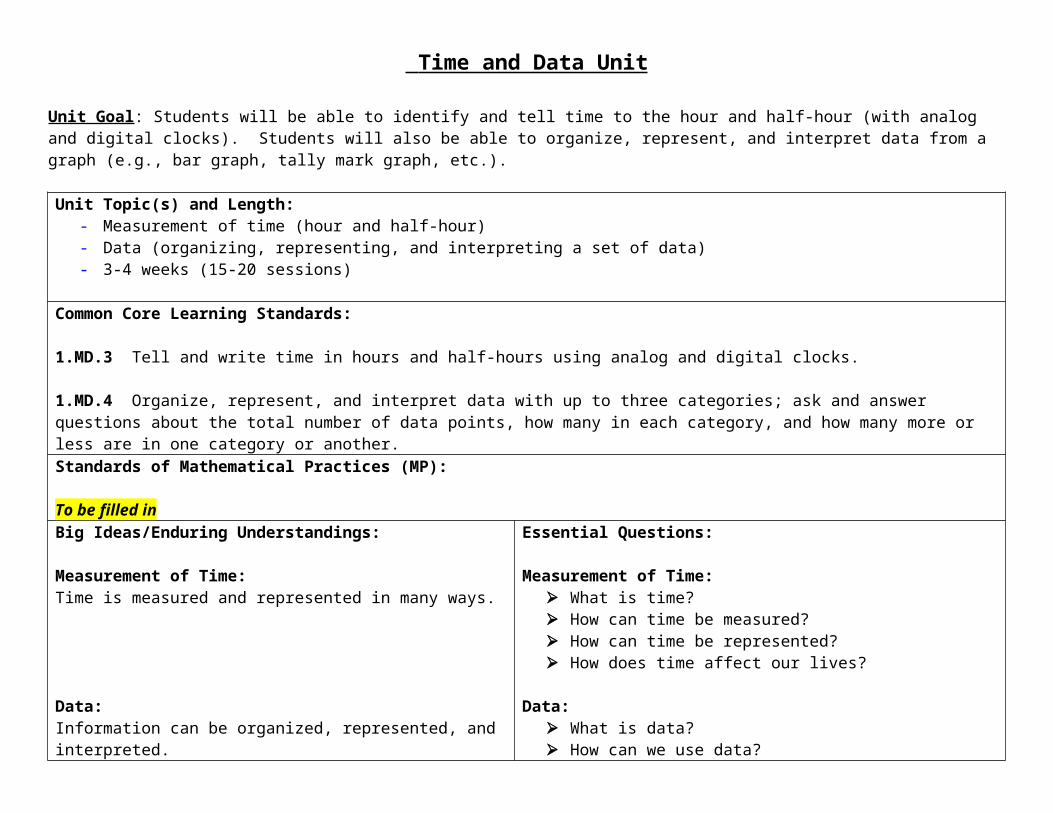
Time and Data Unit
Unit Goal: Students will be able to identify and tell time to the hour and half-hour (with analog and digital clocks). Students will also be able to organize, represent, and interpret data from a graph (e.g., bar graph, tally mark graph, etc.).
Unit Topic(s) and Length:- Measurement of time (hour and half-hour)- Data (organizing, representing, and interpreting a set of data)- 3-4 weeks (15-20 sessions)
Common Core Learning Standards:
1.MD.3 Tell and write time in hours and half-hours using analog and digital clocks.
1.MD.4 Organize, represent, and interpret data with up to three categories; ask and answer questions about the total number of data points, how many in each category, and how many more or less are in one category or another.Standards of Mathematical Practices (MP):
To be filled inBig Ideas/Enduring Understandings:
Measurement of Time:Time is measured and represented in many ways.
Data:Information can be organized, represented, and interpreted.
Essential Questions:
Measurement of Time: What is time? How can time be measured? How can time be represented? How does time affect our lives?
Data: What is data? How can we use data?
Content:Students will understand that…
time helps us determine activities; time is represented in different ways; information can be shown in different ways.
Skills:Students will be able to…
Measurement of Time: Count 1-30 Identify and compare analog and digital clocks
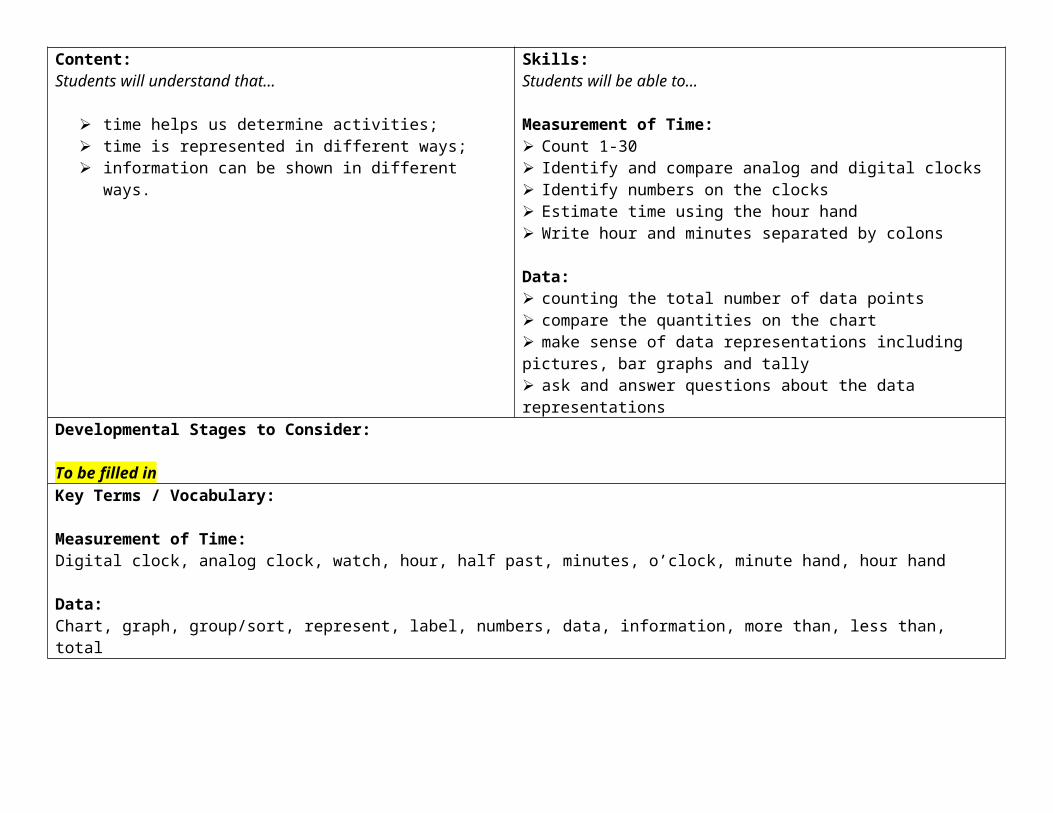
Identify numbers on the clocks Estimate time using the hour hand Write hour and minutes separated by colons
Data: counting the total number of data points compare the quantities on the chart make sense of data representations including pictures, bar graphs and tally ask and answer questions about the data representations
Developmental Stages to Consider:
To be filled inKey Terms / Vocabulary:
Measurement of Time:Digital clock, analog clock, watch, hour, half past, minutes, o’clock, minute hand, hour hand
Data:Chart, graph, group/sort, represent, label, numbers, data, information, more than, less than, total
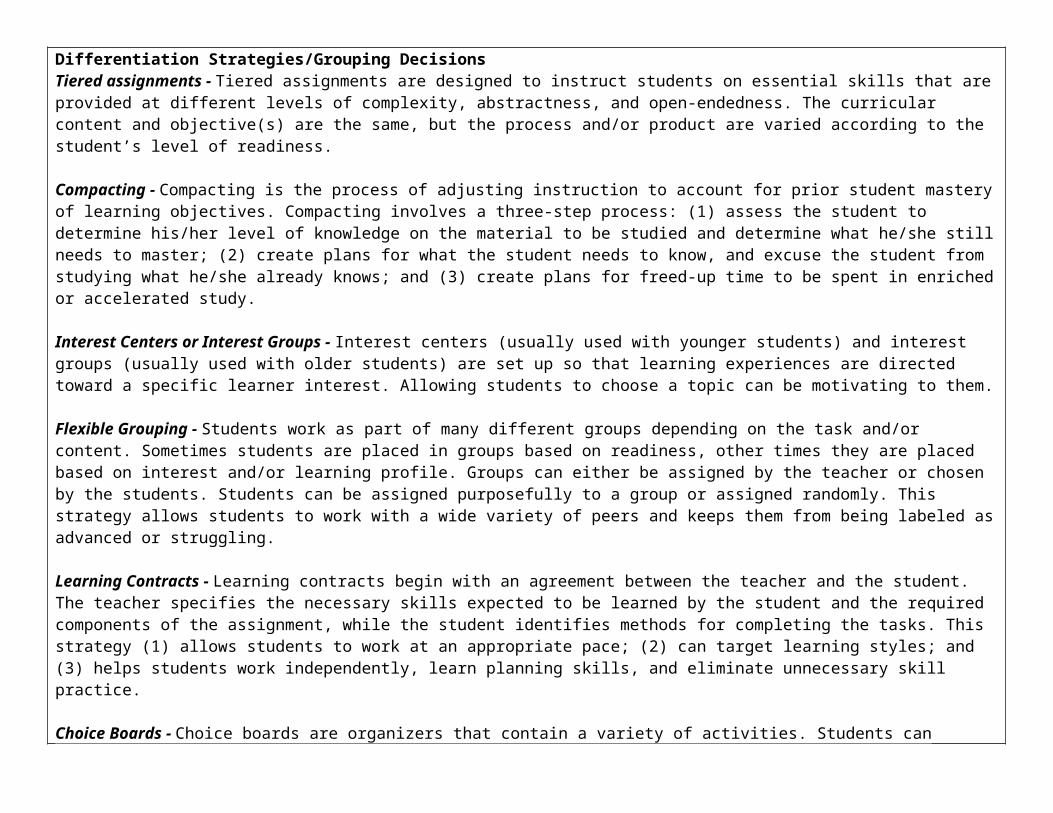
Differentiation Strategies/Grouping DecisionsTiered assignments - Tiered assignments are designed to instruct students on essential skills that are provided at different levels of complexity, abstractness, and open-endedness. The curricular content and objective(s) are the same, but the process and/or product are varied according to the student’s level of readiness.
Compacting - Compacting is the process of adjusting instruction to account for prior student mastery of learning objectives. Compacting involves a three-step process: (1) assess the student to determine his/her level of knowledge on the material to be studied and determine what he/she still needs to master; (2) create plans for what the student needs to know, and excuse the student from studying what he/she already knows; and (3) create plans for freed-up time to be spent in enriched or accelerated study.
Interest Centers or Interest Groups - Interest centers (usually used with younger students) and interest groups (usually used with older students) are set up so that learning experiences are directed toward a specific learner interest. Allowing students to choose a topic can be motivating to them.
Flexible Grouping - Students work as part of many different groups depending on the task and/or content. Sometimes students are placed in groups based on readiness, other times they are placed based on interest and/or learning profile. Groups can either be assigned by the teacher or chosen by the students. Students can be assigned purposefully to a group or assigned randomly. This strategy allows students to work with a wide variety of peers and keeps them from being labeled as advanced or struggling.
Learning Contracts - Learning contracts begin with an agreement between the teacher and the student. The teacher specifies the necessary skills expected to be learned by the student and the required components of the assignment, while the student identifies methods for completing the tasks. This strategy (1) allows students to work at an appropriate pace; (2) can target learning styles; and (3) helps students work independently, learn planning skills, and eliminate unnecessary skill practice.
Choice Boards - Choice boards are organizers that contain a variety of activities. Students can choose one or several activities to complete as they learn a skill or develop a product. Choice boards can be organized so that students are required to choose options that focus on several different skills.
Formative Assessment: (see Measurement and Data Assessment)The initial assessment will determine students’ knowledge of:-determining time;-representing time;-understanding time’s progression through activities; and-interpreting dataSummative Assessment:The summative assessment will re-evaluate student knowledge of:-determining time;-representing time;
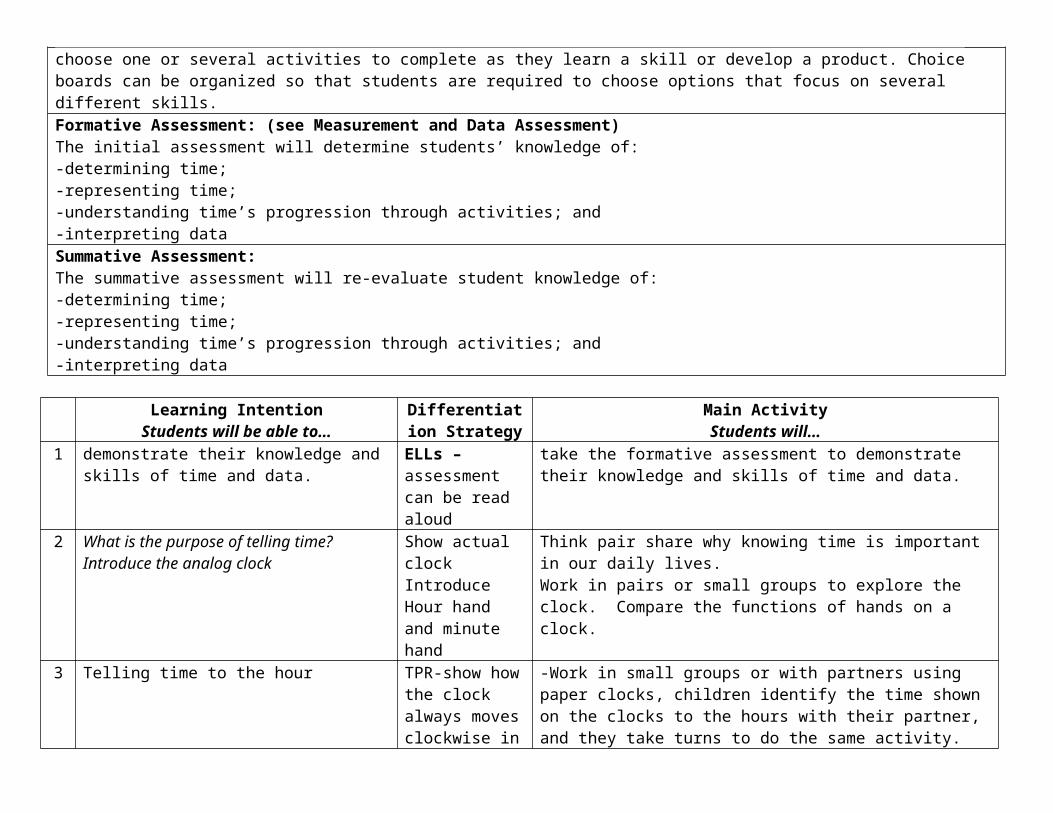
-understanding time’s progression through activities; and-interpreting data
Learning IntentionStudents will be able to…
Differentiation Strategy
Main ActivityStudents will…
1 demonstrate their knowledge and skills of time and data.
ELLs – assessment can be read aloud
take the formative assessment to demonstrate their knowledge and skills of time and data.
2 What is the purpose of telling time? Introduce the analog clock
Show actual clockIntroduce Hour hand and minute hand
Think pair share why knowing time is important in our daily lives.Work in pairs or small groups to explore the clock. Compare the functions of hands on a clock.
3 Telling time to the hour TPR-show how the clock always moves clockwise in the same direction
-Work in small groups or with partners using paper clocks, children identify the time shown on the clocks to the hours with their partner, and they take turns to do the same activity.
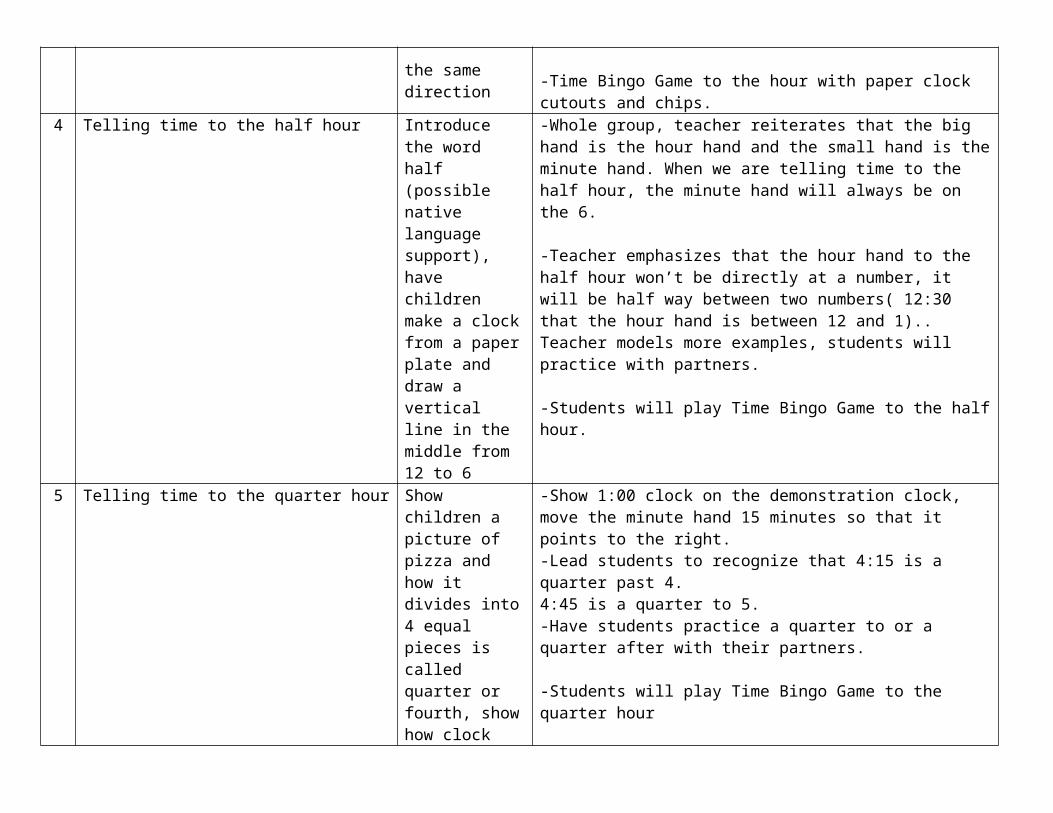
-Time Bingo Game to the hour with paper clock cutouts and chips.4 Telling time to the half hour Introduce the
word half (possible native language support), have children make a clock from a paper plate and draw a vertical line in the middle from 12 to 6
-Whole group, teacher reiterates that the big hand is the hour hand and the small hand is the minute hand. When we are telling time to the half hour, the minute hand will always be on the 6.
-Teacher emphasizes that the hour hand to the half hour won’t be directly at a number, it will be half way between two numbers( 12:30 that the hour hand is between 12 and 1).. Teacher models more examples, students will practice with partners.
-Students will play Time Bingo Game to the half hour.5 Telling time to the quarter hour Show children a
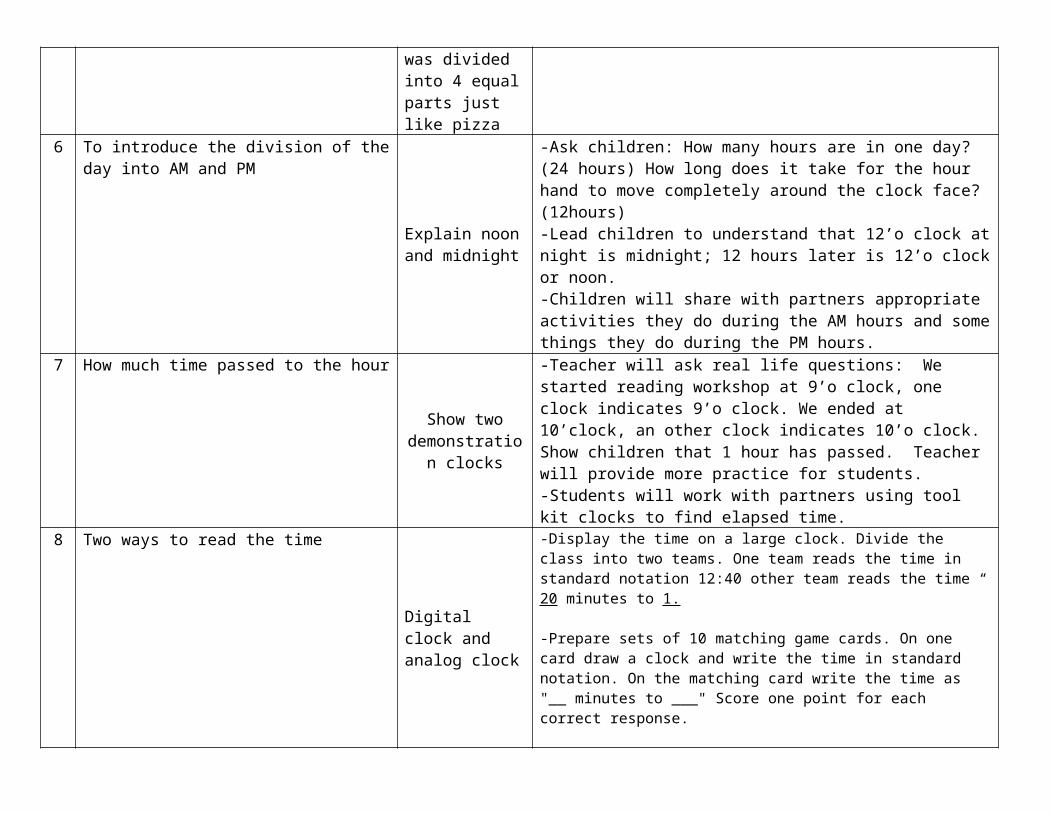
picture of pizza and how it divides into 4 equal pieces is called quarter or fourth, show how clock was divided into 4 equal parts just like pizza
-Show 1:00 clock on the demonstration clock, move the minute hand 15 minutes so that it points to the right.-Lead students to recognize that 4:15 is a quarter past 4.4:45 is a quarter to 5.-Have students practice a quarter to or a quarter after with their partners.
-Students will play Time Bingo Game to the quarter hour
6 To introduce the division of the day into AM and PM
Explain noon and midnight
-Ask children: How many hours are in one day? (24 hours) How long does it take for the hour hand to move completely around the clock face? (12hours)-Lead children to understand that 12’o clock at night is midnight; 12 hours later is 12’o clock or noon.-Children will share with partners appropriate activities they do during the AM hours and some things they do during the PM hours.
7 How much time passed to the hour
Show two demonstration
clocks
-Teacher will ask real life questions: We started reading workshop at 9’o clock, one clock indicates 9’o clock. We ended at 10’clock, an other clock indicates 10’o clock. Show children that 1 hour has passed. Teacher will provide more practice for students.-Students will work with partners using tool kit clocks to find elapsed time.
8 Two ways to read the time
Digital clock and analog clock
-Display the time on a large clock. Divide the class into two teams. One team reads the time in standard notation 12:40 other team reads the time “ 20 minutes to 1.
-Prepare sets of 10 matching game cards. On one card draw a clock and write the time in standard notation. On the matching card write the time as "__ minutes to ___" Score one point for each correct response.
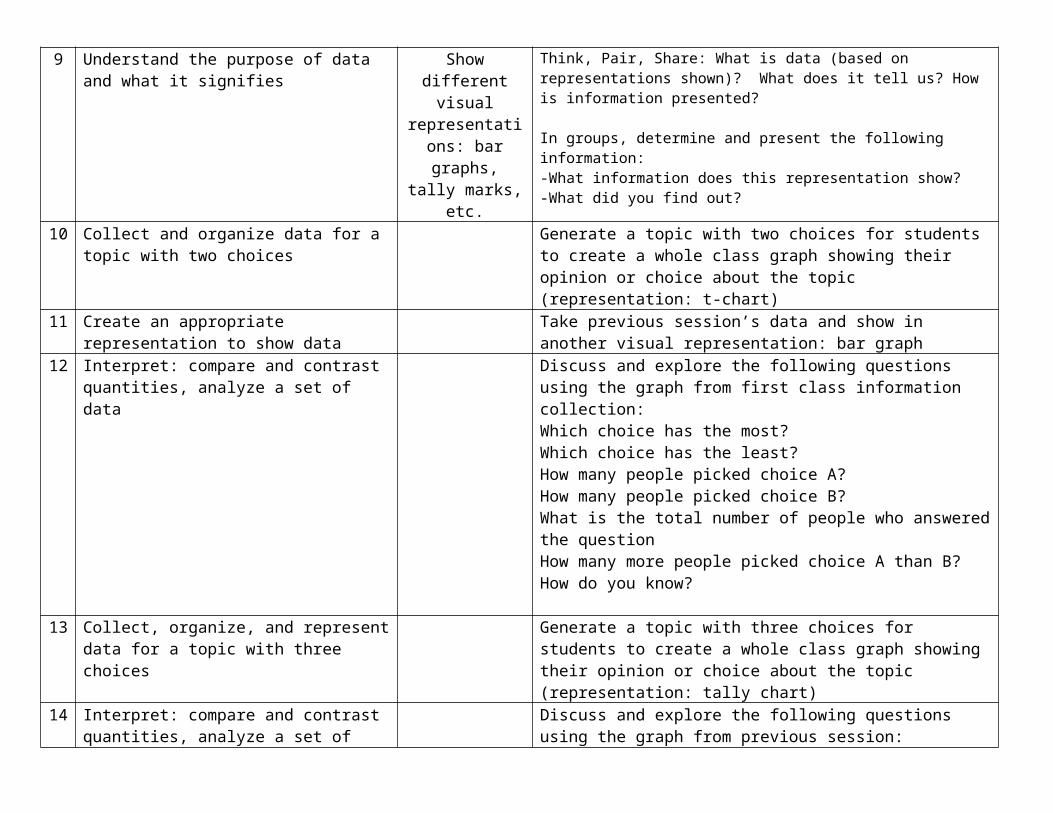
9 Understand the purpose of data and what it signifies
Show different visual
representations: bar graphs, tally
marks, etc.
Think, Pair, Share: What is data (based on representations shown)? What does it tell us? How is information presented?
In groups, determine and present the following information:-What information does this representation show?-What did you find out?
10 Collect and organize data for a topic with two choices
Generate a topic with two choices for students to create a whole class graph showing their opinion or choice about the topic (representation: t-chart)
11 Create an appropriate representation to show data
Take previous session’s data and show in another visual representation: bar graph
12 Interpret: compare and contrast quantities, analyze a set of data
Discuss and explore the following questions using the graph from first class information collection:Which choice has the most?Which choice has the least?How many people picked choice A?How many people picked choice B?
What is the total number of people who answered the questionHow many more people picked choice A than B?How do you know?
13 Collect, organize, and represent data for a topic with three choices
Generate a topic with three choices for students to create a whole class graph showing their opinion or choice about the topic (representation: tally chart)
14 Interpret: compare and contrast quantities, analyze a set of data
Discuss and explore the following questions using the graph from previous session:Which choice has the most?Which choice has the least?How many people picked choice A?How many people picked choice B?What is the total number of people who answered the questionHow many more people picked choice A than B?How do you know?
15 Create their own investigation using real-life situations
Beginner-level: 2 choices (possible yes/no question)
Advanced-level: 3-4 choices
-brainstorm list of appropriate questions that can be used for individual exploration;-choose topic;-plan procedures (see, Math Investigations Unit 4 Sessions 2.3-2.5)
16 Collect and organize data after planning investigation
Think of how students will keep track of
who answered and who didn’t
-review procedures;-prepare collection chart;-collect and organize data based on individual exploration question
17 Create a representation of collected and organized data
-review collected and organized data;-choose appropriate visual representation for data;-create representation for data
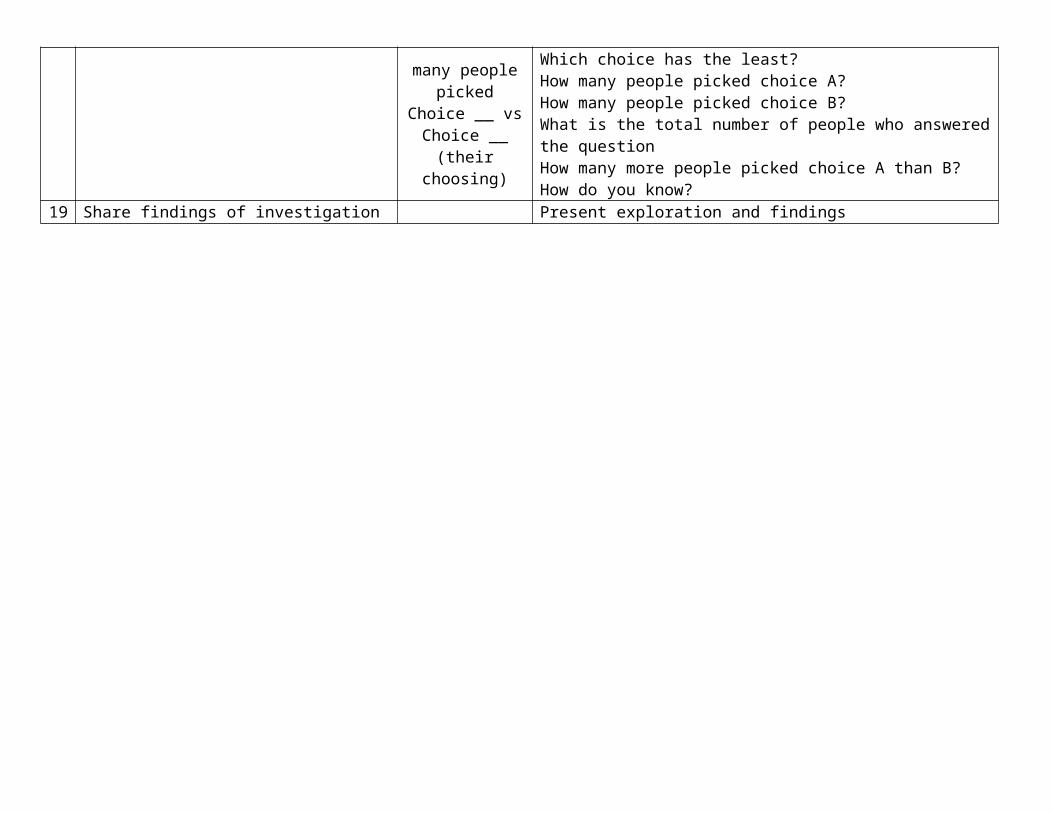
18 Analyze and interpret data Advanced level: 3-4 choices, can
compare how many people
picked Choice __ vs Choice __
(their choosing)
-review data presented;-think about and jot down noticings for following:Which choice has the most?Which choice has the least?How many people picked choice A?How many people picked choice B?What is the total number of people who answered the questionHow many more people picked choice A than B?
How do you know?19 Share findings of investigation Present exploration and findings

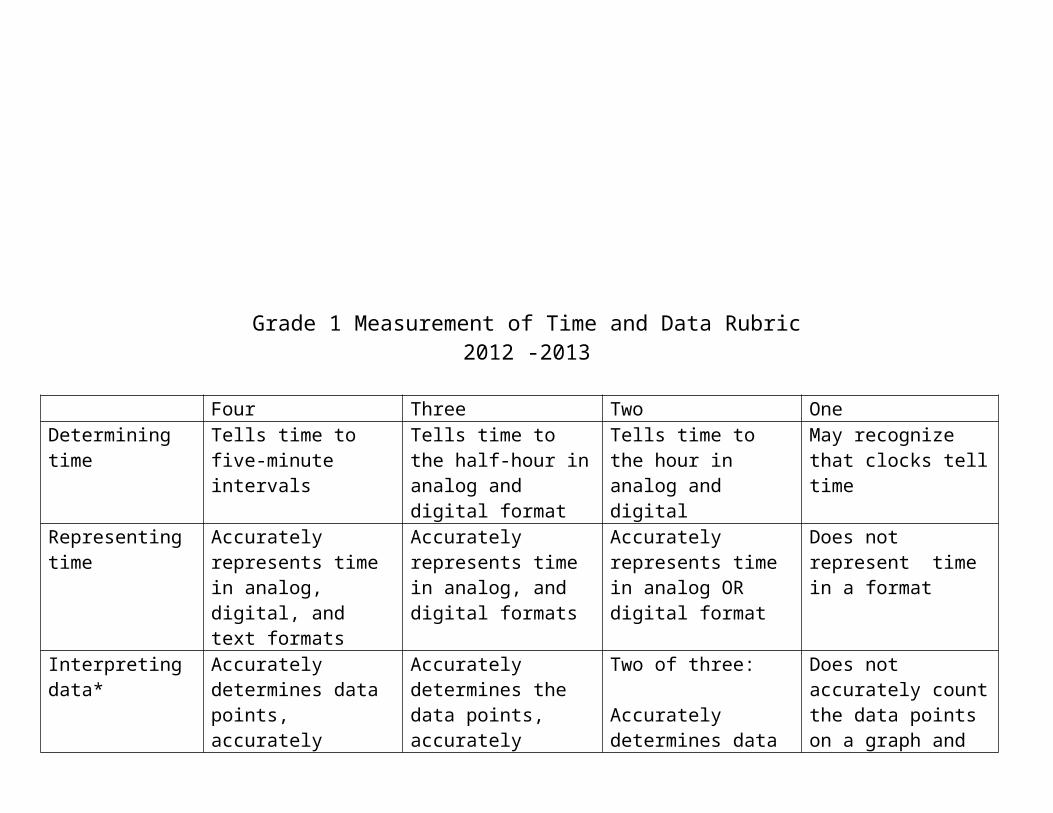
Grade 1 Measurement of Time and Data Rubric2012 -2013
Four Three Two OneDetermining time Tells time to five-
minute intervalsTells time to the half-hour in analog and digital format
Tells time to the hour in analog and digital
May recognize that clocks tell time
Representing time Accurately represents time in analog, digital, and text formats
Accurately represents time in analog, and digital formats
Accurately represents time in analog OR digital format
Does not represent time in a format
Interpreting data* Accurately determines data points, accurately counts within data points, and accurately compares the quantities of data points.
Shows an alternate way to solve the problem
Accurately determines the data points, accurately counts within data points, and accurately compares the quantities of data points
Two of three:
Accurately determines data points
Accurately counts within data points
Accurately compares quantities of data points
Does not accurately count the data points on a graph and does not compare the quantities of the data points
*e.g., Data points = 5 people (Jerry, Sam, Eli, Ben, Julia); Counting within data points = 6 books, 1 book, 3 books, 4 books, 3 books (books read by each person); Comparing quantities = How many more books did Jerry read than Sam? (6-1=5 more books)


Unit 2 Time and Data
Name of student
Tell and show time to the
hour
Tell and show time to the half hour
Analyze data(a-d)
Explain/show work Overall
PRE POST PRE POST PRE POST PRE POST PRE POST
1
2
3
4
5
6
7
8
9
10
11
12
13
14
15
16
17
18
19
20
21
22
23
24
25
26
27
28
29
30
31
32