Embed Size (px)
Citation preview

A strategic modelling approach to brown planthopper managementJ. Holt and G.A. Norton, Silwood Centre for Pest Management, Imperial College, Silwood
Park, Ascot, SL5 7PY; andT.J. Perfect and A. G. Cook, Tropical Development and Research Institute, College House, Wrights
Lane, London W85SJ, United Kingdom
We monitored populations of the brown planthopper (BPH) Nilaparvata lugens and associated rice fauna at a field site in Laguna, Philippines, throughout each growing season from 1979 to 1983. These data and other information obtained from the literature are being used to construct a population model to explain BPH population dynamics observed on rice crops at different Philippine sites. The model will subsequently be used to study the impact of BPH on changes in management, including resistant varieties and insecticides, in different climatic zones.
Two modelling techniques are being used. Initially, interaction matrices and other qualitative modelling techniques were used to identify the major relationships between components likely to contribute to BPH population changes.
The interaction matrix is shown in Figure 1. Each cell is concerned with the primary effect of the column component on the row component. Secondary effects can be determined by working through the matrix. For example, column 11 and row 28 indicate that pesticides affect canopy predators, while column 28 and rows 40, 43, and 48 indicate that predators affect BPH egg survival and adult survival. Thus, the model incorporates the resurgence effect of pesticides caused by predator suppression. The matrix provides an overview of the system and is a valuable tool for problem analysis; we hope that publishing the matrix will stimulate discussion.
The second modelling technique involves computer simulation of BPH population processes. It works on a timestep of 1 day from transplanting to harvest, is written in Pascal, and is being run on a CDC 855 under NOS 2.3 operating system. Initial simulations of the observed changes in BPH populations at one Philippine site have used coefficients and relationships obtained from other sources. The model will be tested using data sets for different sites and seasons.
During the modelling process, possible causes of discrepancies between model simulation and observed data are identified and systematically reviewed before modifying the model. The construction of the initial population model and incorporation of those interactions indicated as (■) in Figure 1 is almost complete. A simulation generated by this model and the observed population curve for the initial data set are compared in Figure 2. The preliminary model has been used to test the hypothesis that polyphagous predators are an important cause of BPH mortality.
It was found that a 50% reduction in the attack rates of the major polyphagous predators (spiders, Microvelia atrolineata, and Cyrtorhinus lividipennis ) caused a threefold increase in the peak of the simulated BPH population (Fig. 2).
The role of the model is to formulate explicit hypotheses that describe important parameters affecting BPH population dynamics. These parameters can be used to identify potential strategies for improved BPH management.
Holt J, GA Norton, TJ Perfect, AG Cook. 1985. A strategic modelling approach to brown planthopper management. International Rice Research Newsletter 10 (5): 23-25.
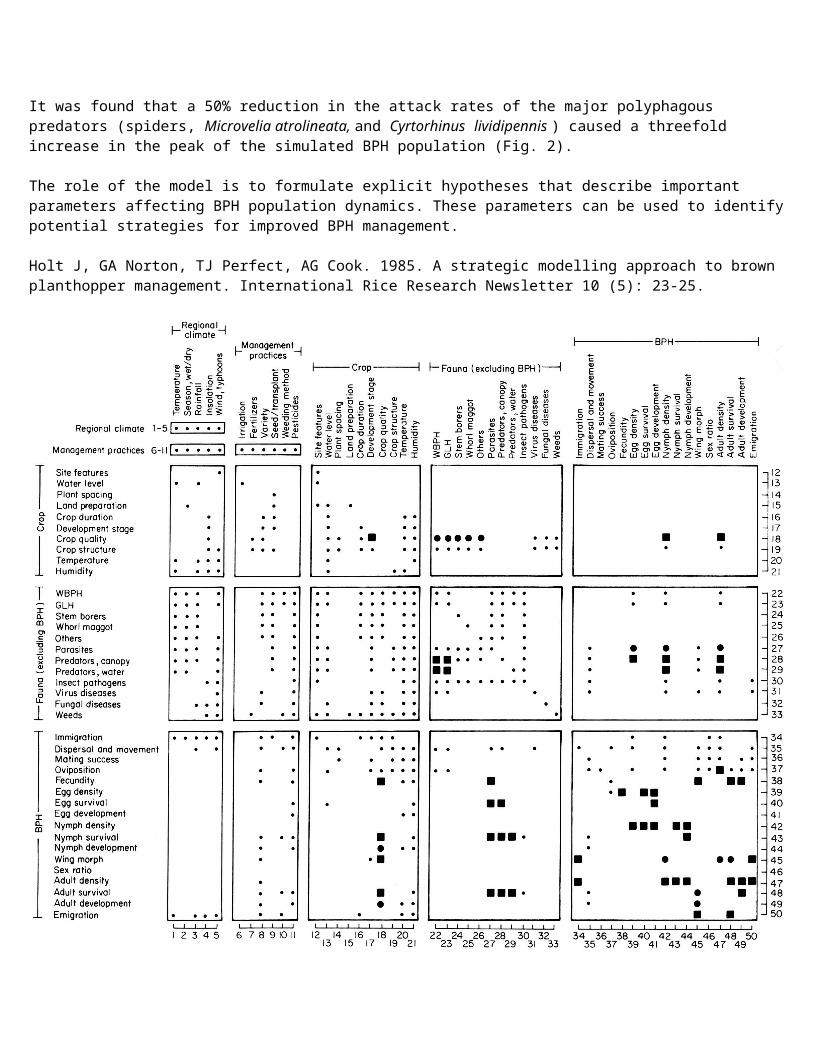
1. An interaction matrix for BPH on a rice crop in the Philippines. Key to symbols: (■) interaction explicitly included in the model; (●) interactions planned for immediate inclusion; (•) interactions for future consideration; blank = no interaction.

2. Simulation of BPH population changes at the first test site compared with the observed population (solid line). Simulation of BPH population when predation is reduced by 50% (dashed line).


![Three Kinds of Niche Construction · 2021. 1. 23. · Lewontin ([1983]; Levins and Lewontin [1985]) and Odling-Smee ([1988]) argued early on that in many cases, organisms construct](https://img.pdfslide.us/doc/110x75/60b9e42b9eb9ba60d408a564/three-kinds-of-niche-2021-1-23-lewontin-1983-levins-and-lewontin-1985.jpg)