Embed Size (px)
Citation preview
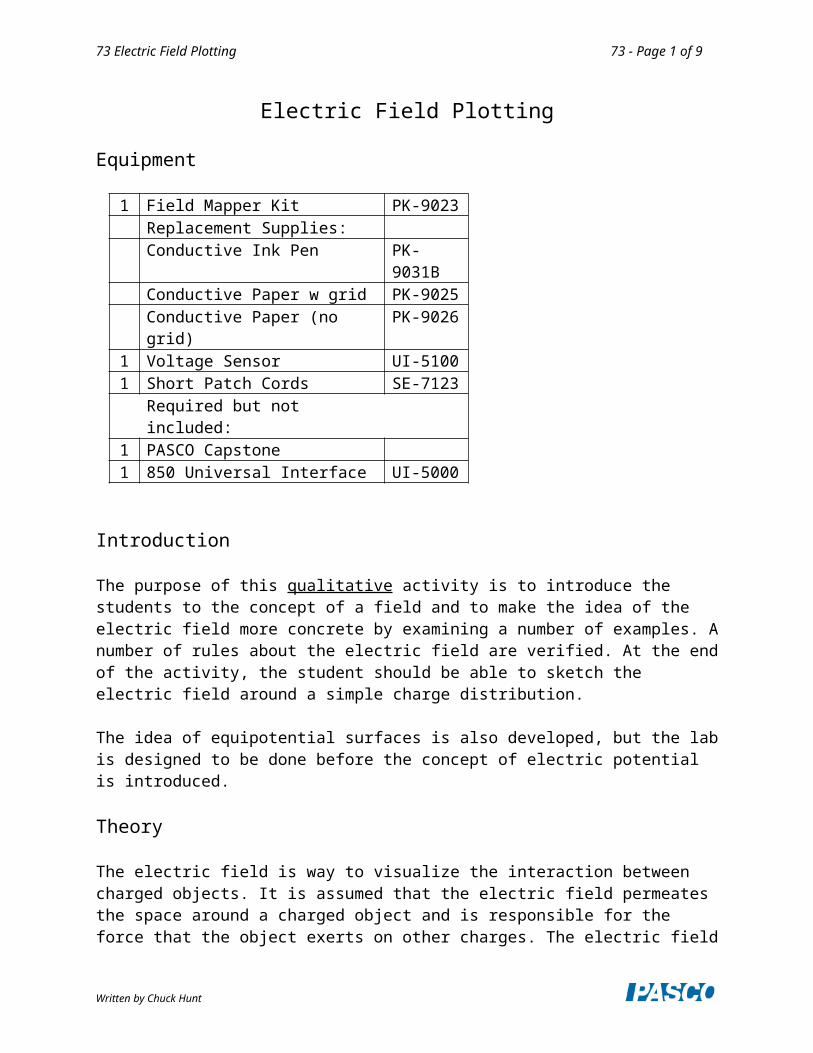
73 Electric Field Plotting 73 - Page 1 of 6
Electric Field Plotting
Equipment
1 Field Mapper Kit PK-9023 Replacement Supplies:Conductive Ink Pen PK-9031B Conductive Paper w grid PK-9025 Conductive Paper (no grid) PK-9026
1 Voltage Sensor UI-51001 Short Patch Cords SE-7123
Required but not included:1 PASCO Capstone1 850 Universal Interface UI-5000
Introduction
The purpose of this qualitative activity is to introduce the students to the concept of a field and to make the idea of the electric field more concrete by examining a number of examples. A number of rules about the electric field are verified. At the end of the activity, the student should be able to sketch the electric field around a simple charge distribution.
The idea of equipotential surfaces is also developed, but the lab is designed to be done before the concept of electric potential is introduced.
Theory
The electric field is way to visualize the interaction between charged objects. It is assumed that the electric field permeates the space around a charged object and is responsible for the force that the object exerts on other charges. The electric field (strength) is defined as the force per unit charge on a vanishingly small test charge q.
E = F/q (1)
Note that this is a vector relationship where E and F must lie in the same (or opposite if q is negative) direction.
To help visualize the field we use the concept of electric field lines where, by convention, the lines begin on positive charges and terminate on negative charges. These lines must satisfy two conditions. First, E must be tangent to the lines at all places. Second, the magnitude of E is directly proportional to the density of the lines. This second requirement is only true in a three dimensional space. The patterns in this activity will be essential two dimensional (due to the conductive paper), but it will still be true that where the lines are close together, the field is strong.
Written by Chuck Hunt

73 Electric Field Plotting 73 - Page 2 of 6
There are a number of rules about the field lines that help draw them for the static case:
1. The lines should have the same symmetry as does the charge distribution.
2. The number of lines from a charge q should be proportional to q. Note: Due to the way the power supply works, the charge due to the positive terminal is equal and opposite to the charge due to the negative terminal.
3. Near a point charge, the point charge dominates (due to 1/r2) and the field is that of an isolated point charge (fully symmetric).
4. The lines cannot stop in space. They begin on a + charge and end on a – charge. (Otherwise the force does not fall off as 1/r2.)
5. Field lines cannot cross (otherwise violate conservation of energy.)
6. Field lines cannot pass through a conductor (otherwise charge moves.)
7. Field lines must be perpendicular to the surface of a conductor (otherwise charge moves.)
8. The lines must be perpendicular to any equipotential surface (see below.)
Figure 1: Equipotential Lines in Pink; E-field Lines in Blue with Arrows
An equipotential surface is a surface upon which no work is required to move a charge on that surface. How can we move a charge in a region where there is a force on it due to the electric field and yet do no work? The answer lies in the fact that the work, W, done is the scalar product of force, F, and displacement, d, so depends on the angle.
W = Fd cos θ
Written by Chuck Hunt

73 Electric Field Plotting 73 - Page 3 of 6
If θ is 900, the work done is zero. For example, a satellite in a circular orbit around the Earth does no work against gravity so does not need any additional energy (i.e. firing its engine) to orbit. So an equipotential surface must be perpendicular to the force and thus an equipotential surface must be perpendicular to the electric field (strength) and field lines (see Figure 1). The electric field is difficult to measure directly, but it is very easy to find the equipotential surfaces using a voltmeter (we’ll see how a voltmeter works later in the course). For example, all the points where the voltage is 4 volts form an equipotential surface. In the case of our two dimensional pattern, the equipotential “surfaces” will be lines.
Figure 2: Electrode Patterns: The dots represent the position of pins to which the power supply leads are attached.
Setup
1. Prepare the desired patterns using the conductive pen and conductive paper. The patterns must dry completely before use or being stacked. Some suggested patterns are shown in Figure 2. The letters are for reference only and should not be drawn on the paper. The + and – are to show where to connect the electrodes and should not be drawn on the paper. The circles in patterns C and F are free floating and should not be connected to the power supply. The only pattern using three electrodes is G where an extra wire is required to connect to the second positive electrode. The primary region of interest in G is around the two positive charges. The dashed line in pattern D is a hole cut in the paper to simulate an insulator in the field. Patterns B, C, E, and F are very interesting and should not be skipped.
2. Attach the conductive paper with the pattern on it to the cork board with push pins at the four corners. The paper is not very conductive, but must carry a little current for the voltage sensor to work. The fact that the paper carries a small current actually affects the electric field somewhat and near the edges of the paper the affects may be noticeable.
Written by Chuck Hunt

73 Electric Field Plotting 73 - Page 4 of 6
Figure 3: Setup
3. Attach a red patch cord to the red terminal of Output 1 (attach a second red for pattern G). Attach a black patch cord to the black terminal. Attach an alligator clip to the other end of each patch cord and clip each to a silver push pin (see Figure 3). Insert the push pins into the appropriate electrodes on the pattern drawn on the conductive paper. It is important that you do not bump the electrode push pins during the experiment since doing so may change the voltages on the paper. This is not a disaster since the shapes of the equipotential surfaces will not be affected, but it is frustrating to be tracing a 4.0 V surface that suddenly becomes a 3.0 V surface.
4. Click on Signal Generator at the left of the screen. Set Output 1 for a 15 V DC signal and click Auto so it will turn on any time you click Record. Click the Signal generator again to close it.
5. Insert the Voltage Sensor in Channel A on the 850 Universal Interface. Attach the black lead to the black terminal on Output 1 of the 850. Leave the sample rate at the default rate of 20 Hz. Create a Digits display with the Voltage (Ch. A) selected.
Procedure
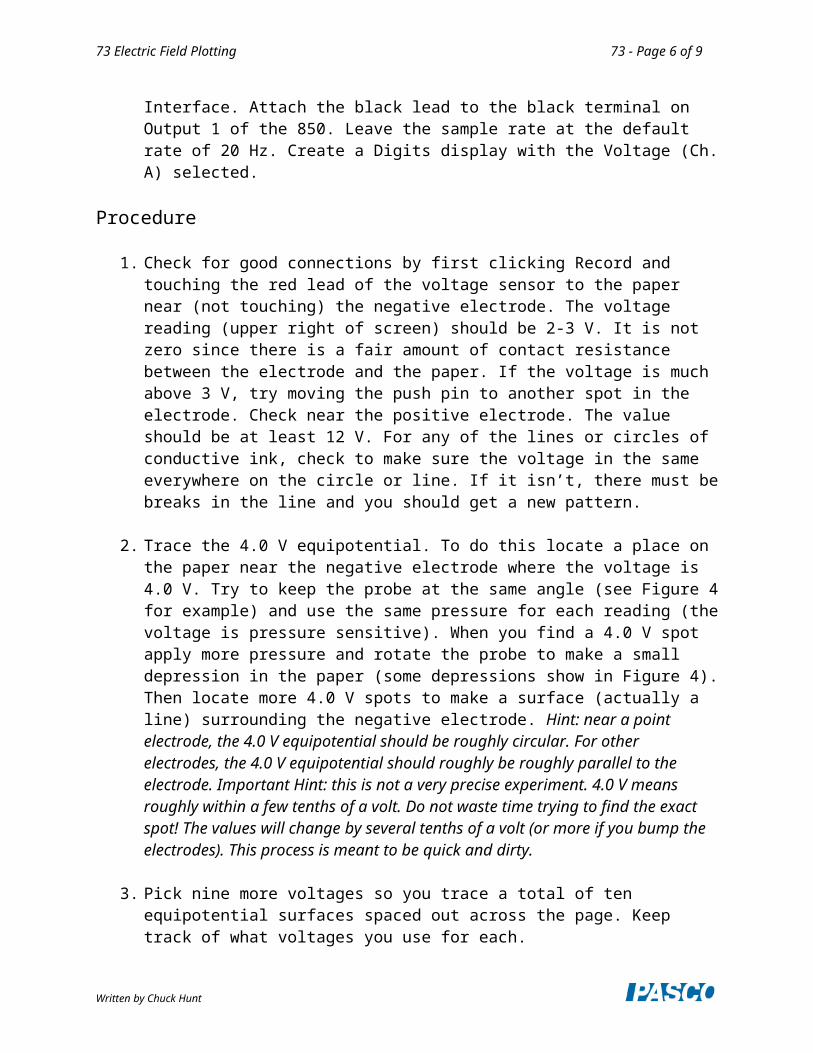
1. Check for good connections by first clicking Record and touching the red lead of the voltage sensor to the paper near (not touching) the negative electrode. The voltage reading (upper right of screen) should be 2-3 V. It is not zero since there is a fair amount of contact resistance between the electrode and the paper. If the voltage is much above 3 V, try moving the push pin to another spot in the electrode. Check near the positive electrode. The value should be at least 12 V. For any of the lines or circles of conductive ink, check to make sure the voltage in the same everywhere on the circle or line. If it isn’t, there must be breaks in the line and you should get a new pattern.
2. Trace the 4.0 V equipotential. To do this locate a place on the paper near the negative electrode where the voltage is 4.0 V. Try to keep the probe at the same angle (see Figure 4 for example) and use the same pressure for each reading (the voltage is pressure sensitive). When you find a 4.0 V spot apply more pressure and rotate the probe to make a small depression in the paper (some depressions show in Figure 4). Then locate more 4.0 V spots to make a surface (actually a line) surrounding the negative electrode. Hint:
Written by Chuck Hunt

73 Electric Field Plotting 73 - Page 5 of 6
near a point electrode, the 4.0 V equipotential should be roughly circular. For other electrodes, the 4.0 V equipotential should roughly be roughly parallel to the electrode. Important Hint: this is not a very precise experiment. 4.0 V means roughly within a few tenths of a volt. Do not waste time trying to find the exact spot! The values will change by several tenths of a volt (or more if you bump the electrodes). This process is meant to be quick and dirty.
3. Pick nine more voltages so you trace a total of ten equipotential surfaces spaced out across the page. Keep track of what voltages you use for each.
4. When you have ten equipotential lines, click Stop.
Figure 4: Probe Position
Analysis
1. Copy the pattern you made onto a sheet of white paper by sliding the white paper under the black paper and securing the white paper with a couple of push pins. Then push a push pin through each of the dimples in the black paper. It is easiest to follow the equipotential lines you used. Don’t worry if in some places they are so close that you lose track of which line is which. Also use the push pin to make the positions of the electrodes.
2. Smooth fit equipotential lines to your data points. Draw smooth curves even if they don’t go exactly through each data point.
3. Now use rules 2, 3, 4, and 8 from Theory to sketch the electric field lines. See Figure 1. Remember that the electric field is a vector field and you should draw an arrow on each line, directed from the positive charge to the negative charge. Hint: If there are any point charges in the field, start at the point charges, drawing eight symmetric lines, and then keep the lines perpendicular to the equipotential surfaces as you draw them in (see Figure 1).
Written by Chuck Hunt
73 Electric Field Plotting 73 - Page 6 of 6
4. Note: The odd-shaped curve that shows in the 5.0 V line (and others) is due to the edge of the conducting paper. The system is not quite static since some current is required for the voltage sensor to function. The E field lines show the path that charge (current) follows. Current cannot flow from the conducting paper into the air, so the field lines must either run parallel to the edge or avoid it. Places to the left and right of the pattern show an almost constant voltage, so in these places the electric field must be nearly zero (why?). At the top and bottom of the pattern, the E field lines run parallel to the edge and the equipotential lines must be perpendicular to the edge. This modification of the field is produced by surface charge on the edge of the paper.
Conclusions
Discuss any interesting points about your pattern. As appropriate, answer each of the questions below. It is interesting to note that pattern A is the attractive dipole and G is the repulsive dipole that show in most textbooks. Pattern B is a parallel plate capacitor (what is special about it?) and pattern E is a coaxial cable (where is it used in your house and why?)
1. Does your pattern have the same symmetry as the charge distribution?
2. Do the field lines cross each other?
3. Are the field lines perpendicular to the surface of any conductor?
4. Where in the pattern is the field strongest/weakest? Note that where the equipotential surfaces are close together, the electric field must be strong (why?)
5. What is the distribution of charge like on any conductor in your pattern? Remember that charge begins on positives and ends on negatives. Where more lines begin/end there is more charge. Also remember that your conductors have some thickness, so really have two surfaces. Is the charge the same on both? It helps to put a + where each line begins and a – where each line terminates.
6. Is there any evidence of charge polarization?
Written by Chuck Hunt