Embed Size (px)
Citation preview
REPUBLIC OF BURUNDIMINISTRY OF PUBLIC HEALTH AND FIGHT AGAINST HIV/AIDS
ANNUAL REPORT OF IMPLEMENTATION OF PERFORMANCE BASED FINANCING BURUNDI
- Year 2011 -
FINAL DRAFT /APRIL 2012

THANKS
The National Technical Unit responsible for implementation of Performance Based Financing like to thank first the Ministry of Public Health and the fight against AIDS, which provides technical, institutional and financial support without which the work of the CT-PBF would be doomed to failure. Our thanks go particularly to the place of the Minister of Public Health and the fight against AIDS, Honorable Dr. Sabine Ntakarutimana, the General Director of Health Services and the fight against AIDS, Dr. NGIRIGI Liboire and General Director of Resources, Mr. Hicuburundi Sosthenes.
Technical and financial partners provide invaluable support in the implementation of the PBF. Indeed, through the Extended CT PBF, they provide technical support to the CT PBF and contribute to ideas and proposals aimed at improving the PBF in Burundi. PTFs are also involved in the overall governance of PBF through the CPSD and in the financing of PBF strategy at all levels.
CT PBF also deserves congratulations for their work since 2010. It is coordinated by Dr Jean Kamana and is composed of Dr. Olivier BASENYA, Dr. Emmanuel SEHEYE, Dr. Thaddée NDINDURWAHA, Dr. Galbert FEDJO, Mr Rigobert MPENDWANZI, Ms. Josiane Manirambona, Ms. Carmen MUHORANE and Ms. Claudine HAKIZIMANA.
Under the overall coordination of Dr Jean Kamana, this report was written by a team of 13 people from the Extended CT PBF composed as follows: Dr. Olivier BASENYA (Chairman), Dr Jean François BUSUGORO (Vice-Chairman), Dr. Juvenal NDAYISHIMIYE, Dr. Thaddée NDINDURWAHA, Dr. Emmanuel SEHEYE, Dr. Galbert FEDJO, Dr. George NSENGIYUMVA, , Mr Leonard Ntakarutimana, Mr Sylvestre NKIZWANAYO, Ms. Josiane Manirambona, Ms. Carmen MUHORANE, Mrs. Immaculée Niyongere and Miss Anisa BERDELLIMA.
Photo Editorial report Team

INTRODUCTION
The Ministry of Public Health and the fight against AIDS has initiated a series of reforms in the health sector to strengthen the health system and hope to achieve the Millennium Development Goals. One of these reforms is the generalization since April 2010, at the national level, of the Performance Based Financing (PBF), and reimbursement of free care given to children under five and pregnant women through this mechanism for allocating resources.
In the first year of implementation, as noted in the 2010 annual PBF report1, PBF mechanisms have contributed to improving the implementation of the policy of targeted free care by (i) reducing by half the delays of costs repayment to health facilities, (ii) to fight against fraud by the establishment of an effective system of verification and counter verification, (iii) reducing the administrative procedures for reimbursement of free care package. The same report highlights the contribution of PBF in strengthening the health system, with (i) improving the use of health services and quality of care, (ii) greater motivation of health personnel, (iii) strengthening the public-private partnership and (iv) community participation.
Several areas for improvement were identified in the 2010 PBF report: (i) The lack of an effective referral-counter referral system between different levels of care, makes the health care system unfair and inefficient, (ii) the lack of emphasis on the analysis of medical records in particular and in general on clinical aspects in the checklists do not provide sufficiently specific measure of quality of services in health facilities, (iii) Rationality in the control of eligibility criteria of beneficiaries of free health care package is also low, and (iv) the financing gap for the implementation of PBF over a period of five years remains an important challenge.
Also, three strong recommendations are made at the end of the first year of implementation of the PBF (i) the establishment of an effective system of reference-counter reference, (ii) streamlining the implementation of the targeted free care and (iii) mobilization of additional resources from the State and the Technical and Financial Partners to fill the financing gap.
Following the publication of the 2010 annual report, covering the period April 2010 to March 2011, the present report describes the implementation of PBF during the period January to December 2011 to cover the calendar year 2011.
It will document the implementation of PBF associated with the repayment of the package of free care. It is a channel of communication with the players in the national health system but also with international actors for the experience of Burundi that could inspire several African Countries. It is also an advocacy document for the mobilization of resources from the
1 Annual report of Performance Based Financing implementation in Burundi-April 2010 to March 2011

State and the Technical and Financial Partners (TFP) in that it shows how the resources in the health sector can be harnessed to decentralization efficiently, to benefit primarily the financing of health facilities and local health systems.
Structured into eight chapters, the report analyzes the contribution of PBF in achieving some results, especially in terms of access to health care, utilization of services and quality of health services, community participation, public-private partnerships and strengthening the general health system. It also shows the changes in the institutional structure of the PBF, the adaptations of implementation tools as grid measuring quality of health services and the changes made in the system of verification and counter verification.
Report writing was carried out by a team of 15 people from the Extended PBF CT. The team analyzed the use of health services, the evolution of the quality of health services and the financing of the implementation of PBF, in the light of quantitative, qualitative and financial data extracted from the PBF database available online2. It also used the quarterly reports of the CT-PBF, the evaluation of the performance of regulators reports, monthly reports of services validation developed by the Provincial Committees of Verification and Validation, counter verification reports and the study report oncost of health care performed by MSH and Pathfinder International. These reports have allowed to analyze the activities carried out, the observed constraints and recommendations periodically made by different actors in the health system.
Policy documents and strategies of the Ministry of Public Health and the Fight against AIDS (MSPLS) were used to anchor the FBP particular strategy within the overall framework of the National Health Policy and the National Health Development Plan 2011 - 2015.
The first version of the report has been submitted to the Extended CT-PBF for observations then to different actors in the health system for improvements. The final report was sent to the Partnership Framework for Health and Development (CPSD), which approved it in its meeting .................................................................. ............
2 Link to PBF database : www.fbpsanteburundi.bi

CHAPTER I : BACKGROUND OF PBF IMPLEMENTATION
Burundi has a National Health Development Plan II (PNDS II) covering the period 2011-2015. The PNDS II provides a framework for implementation of the National Health Policy of Burundi (2005-2015). It is consistent with the National Strategic Framework for the Fight against Poverty (CSLP II) as well as the Millennium Development Goals.
PNDS II priorities are focused on (i) mother and child health, (ii) the fight against communicable and non-communicable diseases, (iii) strengthening the fight against HIV / AIDS in a multisectoral approach, (iv) strengthening actions against malnutrition (v) increasing the demand for health care (vi) strengthening the health system through its six pillars (services, human resources, drugs and health products, financing, health information, monitoring and evaluation, leadership and governance), (vii) strengthening and sustainability of Performance Based Financing associated with free health care, (viii) the contribution to the control of population growth .
To strengthen its health system and achieve the Millennium Development Goals, Burundi has undertaken a series of reforms. These include the decentralization of the health system through the creation of health districts that are the most peripheral operating units of the health system, targeted free care for children under five and pregnant women to promote access to care for the most vulnerable groups, the Performance-Based Financing to efficiently provide population health quality services, human resources development policy to ensure the availability of staff sufficient qualified at all levels of the health pyramid, the pharmaceutical sector reform to ensure access to medicines and other health products in an improved quality of pharmaceutical regulatory framework.
These reforms are beginning to produce positive effects. Indeed, from 2005 to 2010, the infant mortality rate declined from 120 per thousand live births (MICS 2005) to 59 per thousand live births (DHS 2010), the rate of child mortality from 176 per thousand live births (MICS 2005) to 96 per thousand live births (DHS 2010), the maternal mortality ratio of 655 per 100,000 live births (MICS 2005) to 499 per 100,000 live births (DHS 2010).
I.1. History of PBF in Burundi
PBF is a health financing strategy based on the results (output, performance) and evidenced by a contractual relationship between the various actors in the health system. It is different from conventional financing input type (input) where health facilities receive all inputs required for their operation without any obligation of results.
The Performance Based Financing Strategy aims to (i) improve the use and quality of health services to the population, (ii) to improve the mechanisms of verification and reimbursement of services of the Free health care package for pregnant women and children
under 5 years, (iii) to motivate and stabilize health personnel, (iv) to encourage health personnel working in peripheral health facilities, (v ) strengthen management, autonomy and organization of health facilities, (vi) to take into account the point of view of the beneficiaries in the management and resolution of health problems.
The first PBF pilots have been implemented since 2006 in three provinces of Burundi. They were accompanied by the national contracting policy, developed and adopted as a framework of reference to various contractual arrangements.
In 2008, the PBF mechanisms extended from three to nine of the seventeen provinces of the country. In view of the positive results of these experiments, the MSPLS decided to generalize this approach nationwide from April 1, 2010.
Taking advantage of the scaling of PBF and to overcome the difficulties related to the implementation of the policy of targeted free care observed in the field (delayed reimbursement of health facilities, over billing of medical procedures, work overload and motivation of health personnel, lack of medicines and equipment), the MSPLS and donors have retained the idea of pay free care packages through PBF mechanisms.
I.2. PBF institutional framework
The institutional PBF framework was guided by the principle of separation of functions: The provision of care is provided by the Hospitals and Health Centers; The regulation is provided by the central services of MSPLS, the BPS and BDS; Verification of services is provided by the CPVV verification team for quantitative
verification, the BPS and BDS for quality assessment at the CDS. A peer review is organized for the quality level of Hospitals. Community organizations provide community verification;
The purchase of services is provided by the validation team of CPVV; The counter verification is performed by an independent external body; Funding PBF is provided by the Ministry of Finance and the Technical and Financial
Partners MSPLS.
The technical coordination of the PBF implementation at all levels of the health pyramid is entrusted to a National Technical PBF Unit (CT-PBF).
During the year 2011, an amendment was made to the institutional arrangements with the establishment of the Extended National Technical Unit replacing the National Platform. The CPVV missions were extended to contract management and performance monitoring of the implementation of the PBF at the decentralized level.

I.3. Evolution of the verification system
As part of the PBF implementation, four types of verification are performed.
I.3.1. The quantitative verification
It is carried out monthly by the CPVV evaluators. From 2011, they are required to ensure that the health facility has the HIS report month checked with the attached data sheet reported on indicators contracted. The bills are not validated in the absence of HIS report, but the verification is performed, and the data are entered into the database for this purpose.
In the system of quantitative verification, were also introduced penalties in cases of discrepancy of more than 5% between data reported by health facilities and data verified by the evaluators.
I.3.2. Evaluation of the quality of services of health facilities
It is made quarterly by the Provincial Health Office (BPS) and the District Health Offices (BDS) at health centers, peer-level for hospitals. When the PBF manual was revised in September 2011, it was decided that the evaluation of the quality of the hospitals that used to be done by peers in the same province will be carried out by peers in other provinces from January 2012. The Hospitals assessment teams will systematically be supported by executives of the Extended National Technical Unit.
This assessment is entitled to a bonus of quality if the score is greater than or equal to 70%. The penalization of low quality scores was introduced in 2011 with the application of a quality penalty for any FOSA with a quality score of less than 50% overall.
Rubrics of quality at hospitals level have been modified to better take into account the clinical services and the management of medical records.
I.3.3. Community verification
It is conducted every quarter by community associations and seeks to authenticate reported services by health facilities, and measure the degree of satisfaction of the population. When the PBF manual was revised in September 2011, it was decided to move from a quarterly to a bi-annual basis. This amendment comes into force in 2012.

I.3.4. Counter verification
It is conducted quarterly by an independent external organization at all levels. During the year 2011, the National Hospitals have been counter verified, unlike 2010.
I.4. Funding circuit
The first stage of the financing circuit of health facilities in the PBF is the development of the HIS report and a sheet of data reported. Subsequently, the CPVV evaluators conduct data verification which leads to the establishment of a bill that is signed by the head of the health facility and evaluators.
After the verification, the evaluators enter data into a PBF database FBP and produce a provincial summary of claims for payment for each health facility. These quantitative and financial data are validated by the CPVV and transmitted to the central level to the PBF National Technical Unit. It develops a national synthesis of data and payment claims that valids. All these data are transmitted to the General Directorate of Resources (DGR) for verification and signing for transmission to the Office of MSPLS. After signature by the Cabinet, the DGR sends payment requests to the Ministry of Finance and the technical and financial partners. TFP shall direct transfer of funds to the account of health facilities and the Ministry of Finance instructed the Bank of the Republic of Burundi for the same operation. This circuit funding lasts 44 open days.
I.5. Partnership in PBF implementation
The institutional framework of PBF was designed to foster partnerships between the various actors in PBF implementation. This collaboration is evident in the following structures:
The Extended PBF National Technical Unit composed of executives of MSPLS and donors working in synergy for an efficient implementation of PBF;
The sub-unit validation under the Provincial Committee of Validation and Verification whose membership includes local administration, health administration, civil society, NGOs, donors;
The sub-unit verification of Provincial Committee of Validation and Verification which includes civil servant evaluators and contracted staff recruited by the PTF;
Secondary contracts between public and private health facilities also promote collaboration / complementarity between the two sub-sectors;
Technical support of the provinces in the implementation of the PBF highlights collaboration between MSPLS and NGOs responsible for this support;
The Consultative Framework Partners for Health and Development (CPSD), governing body of the health sector in general and in PBF in particular provides a framework for collaboration and partnership between MSPLS and donors;
Funding for the PBF strategy is carried out by the Government and donors.

CHAPTER II. PERFORMANCE BASED FINANCING AND ACCESS TO CARE
One of the objectives of the PBF and free health care is to improve the use of health services for the general population and vulnerable groups in particular. The quality of care and consideration of equity in access to care dimensions are also priority areas for implementation of PBF. Community participation in the management of health problems is a fundamental lever advocated by the PBF.
II.1. Performance Based Financing on and Free care
The free care policy says that for pregnant women and children under 5 years of age receive free services and health care provided by public health facilities and approved facilities, and that they are reimbursed for the services of care under this policy.
The reimbursement will be made by direct transfer of funds to the bank account of each health facility after a process of verification and validation of services invoiced as described in the flow of funds (see Chapter I).
The package of free care and services for beneficiaries include:
Consultation and curative care, including pediatric medicines; The management of pregnancy-related pathologies, including deliveries and C-
section; Preventive care such as Family Planning, the Prenatal Consultation, Immunization and
Monitoring of Growth; The post-natal care and nutritional supplement; The detection and treatment of PLWHA; The detection and treatment of tuberculosis; The first-line treatment of uncomplicated malaria.
At the beginning of the implementation of the policy of free health care for children under 5 and pregnant women, several difficulties, mainly related to its financing system have been observed:
The Government has suffered delays from 4 to 6 months to reimburse bills (and some have not been paid);
The absence of an effective verification system of services provided by the health facilities gave rise to overcharging;
The lack of motivation of health personnel, increasingly burdened by an increase in the use of health services;
The frequent shortages of medicines in the health facilities; The high administrative burden: 2500 pages of forms to fill per month per health
facility before being reimbursed.

The integration of the policy of free health care and the strategy Performance Based Financing implemented at the national level since April 2010, had the merit to correct some of these weaknesses.
II.2. Performance Based Financing and equity in care access
During the development of action plans, specific strategies for each FOSA are proposed after analyzing the situation, to provide care to the most vulnerable people in their area of responsibility. Indeed, in the context of the development of these action plans, community participates, through its various representations (board or management committee to the district hospital, the health committee in the Health Centers), to the co-management of health facilities and the evaluation of the objectives of the action plan.
The Health Committees (COSA) include vulnerable groups, particularly the Batwa whose integration began in 2011. The COSA are involved in the identification of vulnerable groups such as the poor who can benefit from appropriate pricing. Moreover, in the context of the implementation of the PBF, the health facilities are framed to present an action plan which includes among other things, the plan to improve the quality of services and strategies to improve accessibility of care (geographical, cultural and financial).
Public health facilities and approved facilities continue to apply the free health care for vulnerable groups including pregnant women with pathologies related to pregnancy, birthing women, children under 5 years old; indigent who are identified by the community and recent returnees. These poor are supported by the Ministry in charge of National Solidarity, and they are also counted as cases paid under the PBF.
As part of the PBF implementation, there is an interprovincial equity bonus which is applied on the basis of criteria relating inter alia to the isolation of the province, the number of poor and vulnerable in the province and score of poverty in the province. Thus, the various provinces are classified into five different categories with five different levels of rates by indicator.The testimony below shows how the various reforms in the health sector have improved access to health care in the general population and vulnerable groups, including Batwa in particular:
MADAME KAMURENZI ESPERANCE SAYS HER GREAT JOY OF BEING FREE HEALTH CARED (Extract from an interview conducted with vulnerable groups Batwa from Mukoni, Province Muyinga )
I'm Kamurenzi Esperance. I’m mutwakazi. I am 28 years old. With my first husband, I had five children but all died! Now I'm with another man and we have two children only!

During the crisis, I was living in displaced people camps. Yes, it's where I lived with other Batwa. In the camps, life was very hard. I never went me to the health center: ISHWI DA! = Never, ever, I do go me to the hospital. I've never been to a doctor. No time. I was afraid to go to the hospital without money. ISHWI DA! I could not go. Others would make fun of me!
I have always given birth at home. I do not even know what the ANC. I never brought child to immunization. ISHWI DA! And I think that's why my kids are dead (she seems to cry)! My husband did not know him also go see a doctor! We all stayed at home. We were very unhappy!
Today things have changed. First I live in a beautiful house by Mukoni! The state has given us these beautiful houses covered with sheets. I no longer have the constant concern to always get straw to cover the house. It is very good (with a smile).
One day I was doing my peddling pots and I stopped to listen to the radio. They said that pregnant women are not going to pay anything or the consultation or at delivery. I asked is that the Batwa are also affected? I then told my husband. We danced. All night we danced. Even that one 3 came we raise to go to the health center. He said that now the question of money is no longer an obstacle.
Today I'm going to pre natal consultation and ask me nothing. Not once asked me for money. Each time I had a cesarean section. Nursing welcomed me very well. They do not look I'm Mutwa. No, they do not hate me. After regaining some energy, I hear their voices telling me, SPE 4, get up and go home. Things went well! And I take my child. And we're going home. Without paying anything! We are very happy. I extend my sincere thanks. Eh! MUNTU WE5, tell doctors this: Espérance said, big thank you! Even God tells you thank you.
II.3. Results and progess in health care access
The comparison of data for indicators of general health and maternal and child health in particular shows, on the one hand, significant progress between the period before and after the implementation of the Free Care (see table ...), and secondly, from the merger of the Free Health Care and the Performance Based Financing, as overall health indicators continue to improve.
Table xx : Evolution of maternal and child health indicator between 2005 and 2011
Indicator 2005 2010 2011
Utilization rate of services for under 5 ND 280% (BDD PBF) 349% (DB PBF)
ANC utilization rate 92% (MICS 2005) 99% (DHS2010)86% (DB PBF)
3 She shows the TPS who joins as a guide
4 Elliptic word to call Espérance
5 Expression used to call someone

Percentage of assisted deliveries in FOSA 34% (MICS 2005) 60% (DHS 2010) 68% (DBPBF)
Rate of contraceptive prevalence 8% (MICS 2005) 18% (DHS 2010) 21,9% (PNSR)
Percentage of children between 12-23 months fully immunized (BCG, Anti rougeole, DTC-3, VAT, Antipolio)
45% (MICS 2005) 83% (DHS 2010)95% (DBPBF)
Note: Comparison of results from surveys MICS (2005), DHS (2010) et PBF database (2011)
II.4. Performance Based Financing and Strengthening community participation
Community participation is an important stimulus for the emergence of collective responses to public health problems related to primary health care, reducing maternal and neonatal mortality and the specific problems posed by diseases such as malaria, STIs, HIV / AIDS, tuberculosis, malnutrition, diarrhea and other diseases. It results in the active involvement of groups and local communities in all stages of a health program6.
It is expected from community involvement increasing in the use of health services including birth in health facilities and preventive care for children, as well as improving the quality of care that contributes to the significant reduction in difficulties in achieving the MDGs, through Maternal and Child Health indicators (nutritional status, prenatal care, assisted delivery in health facilities, postnatal care and the use of modern family planning methods ...).
The involvement of the community in the management of health problems in general, and to achieve the MDGs in particular, is considered an effective strategy to improve the health of populations.
Thus, to further strengthen community involvement, MSPLS with the support of CORDAID initiated a PBF community pilot in the province of Makamba since January 2011, the evaluation of the results is planned in the month of September 2012, prior to, if necessary, the implementation of the strategy at the national level.
The community PBF pilot in MAKAMBA Province
The community PBF pilot in the province of Makamba overall objective is to improve the health of the population of the province by strengthening the work of CHWs (Community Health Workers) .
The project's specific objectives are:
Bringing Community Health Workers (CHWs) to perform their duties of community reference;
6 PBF procedures manual, revised version
To raise awareness for behavior change;
Motivate community providers;
Coordinate CHWs by structuring them in CHWs’ Groups ;
Strengthen the technical and organizational skills at the community level by making the appropriate training.
This community PBF pilot project focuses on: (i) awareness for behavior change, (ii) the reference of cases and recovery of dropouts and (iii) the completion of a number of health services such as distribution of drugs, mosquito nets, condoms and other activities required by the needs of the health system.
Preliminary results from the community pilot experience are encouraging especially at the following aspects:
• References to the health centers and recovery of dropouts
Table ……Summary of quantitative results of services of 27 CHWs groups between April and November 2011
Subsidized indicators for referral and recovery of dropouts Number of cases
HIV: CDV referred client and arrived at CDS 4 235Malaria: Fever cases referred and arrived at CDS 2 492Malnutrition : malnutrition detected, and got referred to CDS 549Pregnant women referred for delivery and arrival at CDS 2 650FP Client referred and arrived at CDS 2 140Pregnant women referred for ANC and arrival at CDS 9 335 Mother referred for CPON and arrival at CDS 845ARV lost case recovered 86Lost PMTCT recovered 40Case of abandonment EPI recovered 147Suspect confirmed by the CDT (confirmed as suspect)) 235If patient is TPM (suspected case confirmed with TPM) 74Review of Control (C2, C5, C6, C8), by sputum 135 TB Drug 214 Declared TB cured 56
As indicated in the table below, most community interventions are services related to maternal and child health. However, it remains a problem of determining the target which does not allow to appreciate the performance achieved.
• Organization of key community stakeholders:

27 Groups of Community Health Workers in the 27 health areas that counts the health province of Makamba are organized and all involved in the Performance Based Financing;
Supports for gathering information for GCHW (FBP community tools) exist and facilitate reporting and data verification before payment;
An integrated training manual and user guide of CHW (in Kirundi) were produced. These have allowed to better focus and clarify the role of community actors in Makamba.
During the implementation of the Community PBF in the province of Makamba, some challenges were observed, the main ones being:
determining performance indicators to entrust GCHW (MSPLS / CORDAID) considering national strategies of care not yet decentralized to the community level;
difficulties of calculating targets and develop a budget for such an arrangement; difficulties of coordination of actors with different incentives on the same target
audience and in the same area of intervention; confusion in the field on the PBF concepts and supervision of community actors.
CHAPTER III. UTILIZATION AND QUALITY OF HEALTH SERVICES
III.1. Health facilities under contracts
III.1.1. Health facilities with main contract
To qualify for the main contract, a CDS must be responsible for its area of responsibility assigned by the MSPLS, have a population of at least 7,500 covered people, achieve at least 70% of MPA and agree to implement free care for children under five and pregnant women. All District Hospitals and National Hospitals have a main contract.
During the year 2011, 563 health facilities had a main PBF contract which 513 health centers and 50 hospitals.
III.1.2. Health facilities with secondary contract
A secondary contract is a contract between two health facilities; one of which have a main contract and the other is in the same area of responsibility. Health facility with a secondary contract can be a private health facility, or a public health facility or confessional which does not meet the conditions for obtaining a main contract.

At the end of 2011, 166 health facilities had secondary contracts, including 71 public health facilities, 60 private health facilities, 22 associative structures and 13 faith based facilities.
III.2. Utilization of health services
Curative care is the contact of an ill person with a health facility for an episode of illness requiring hospitalization or not.
III.2.1. Utilization of curative consultation
The analyzes below are based on the assumption that 90% of the population visit the CDS at least once a year and 10% Hospitals. Overall, the use of services is high from January to June and then a decrease was observed from July to September before experiencing a new rise from October to December. These trends are explained by seasonal variations.
The following graphs are arranged to present the data of health services by age group at all health facilities (health centers and hospitals), then disaggregated data at the health centers and at the Hospitals.
III.2.1.1. Curative consultation for all age groups at health facilities.

TTAPMA : All groups of age MPA (Health centers) TTAPCA : All groups of age CPA (Hospitals)
The chart above shows the use of curative services consultations in slightly above the target of 1 NC / hab / year during the years 2010 and 2011 at health facilities. This use is substantially equal in 2010 and 2011 with a 1.12 average annual NC / hab / year and 1.10 NC / hab / year respectively.
At the health centers level, the use has increased from an average of 1.16 NC / hab / year to 1.10 NC / hab / year from 2010 to 2011 while over the same period, the use at hospitals level increased from an average of 0.73 to 1.10 NC / hab / year.

III.2.1.2. Curative consultations for 5 years old and above at Health Facilities level
At the age of 5 years and older, the number of new contacts at the level of health facilities remained stationary, the average has been 0.78 in 2010 and 0.76 in 2011.
At the health centers, use declined slightly from 2010 to 2011 from an average of 0.78 and 0.72 NC / hab / year. At Hospitals, the number of new contacts remained, from January to August 2010, around 0.5 NC / hab / year. From September 2010 until December 2011, the number of new contacts increased and is close to the average level of 2011, that is to say 1.08 NC / hab / year.
III.2.1.3. Curative consultations for under 5 years old at Health Facilities
The chart above shows a high use of curative care services by children under 5 years in the health facilities. Indeed, the number of new contacts per capita per year from an average of 3.18 to 3.49 NC / hab / year from 2010 to 2011. The increase was much more pronounced at the Hospitals (from 1.66 to 2.30 NC / hab / year) whereas for Health Centers, use remained close with respective averages of 3 30 and 3.61 N / hab / year during the same period.

III.2.2. Births attended by skilled personnel
III.2.2.1. Births attended by skilled personnel at health facilities level
The graph above shows an increase in the rate of births attended by skilled health staff from 58% to 68% between 2010 and 2011 at all health facilities (health centers and hospitals). At the health centers, the increase is from an annual average of 53% to 62% from 2010 to 2011, while for the same period, the percentage of births attended by skilled personnel increased from 74% to 90% at the Hospitals.
It should be noted that the expected level of health centers deliveries correspond to 90% of the expected national level against 10% for Hospitals deliveries..

III.2.2.2. Eutocic delivery at hospitals
In principle, eutocic deliveries must take place at the health centers, but there is at the national level, nearly 20% of eutocic births still take place at Hospitals in 2011.
III.2.2.3. Proportion of caesarean sections compared to all attended births
The proportion of caesarean sections in all assisted deliveries by qualified staff at the health centers and hospitals saw an increase from 2010 to 2011 from an average of 4.9% to about 6% . This rate is lower than the standard recommended by WHO (10 to 15%).

III.2.3. Children fully immunized
The rate of fully immunized children has increased from an average of 85% in 2010 to 95% in 2011.
III.2.4. Family Planning
The proportion of old and new acceptors of contraceptive methods has increased in 2011 compared to the situation in 2010. In fact, the average of the old and new acceptors increased from 36% in 2010 to 41% in 2011.

III.2.5. Voluntary HIV testing
Between 2010 and 2011, the rate of voluntary HIV AIDS testing has shown a marked increase from 75% to 98%. It should be noted that the target is 7% of the general population.
III.3. Quality of services in health facilities
III.3.1. Overall quality of health services
The technical quality of health facility is evaluated using a scale developed from the start of the implementation of PBF in Burundi in 2011 and revised in order to incorporate more criteria for clinical services and analysis medical records at the Hospitals. The quality perceived by the population is estimated at the end of Community surveys while the overall quality score is a combination of technical quality and perceived quality score in a respective proportion of 60% and 40%.

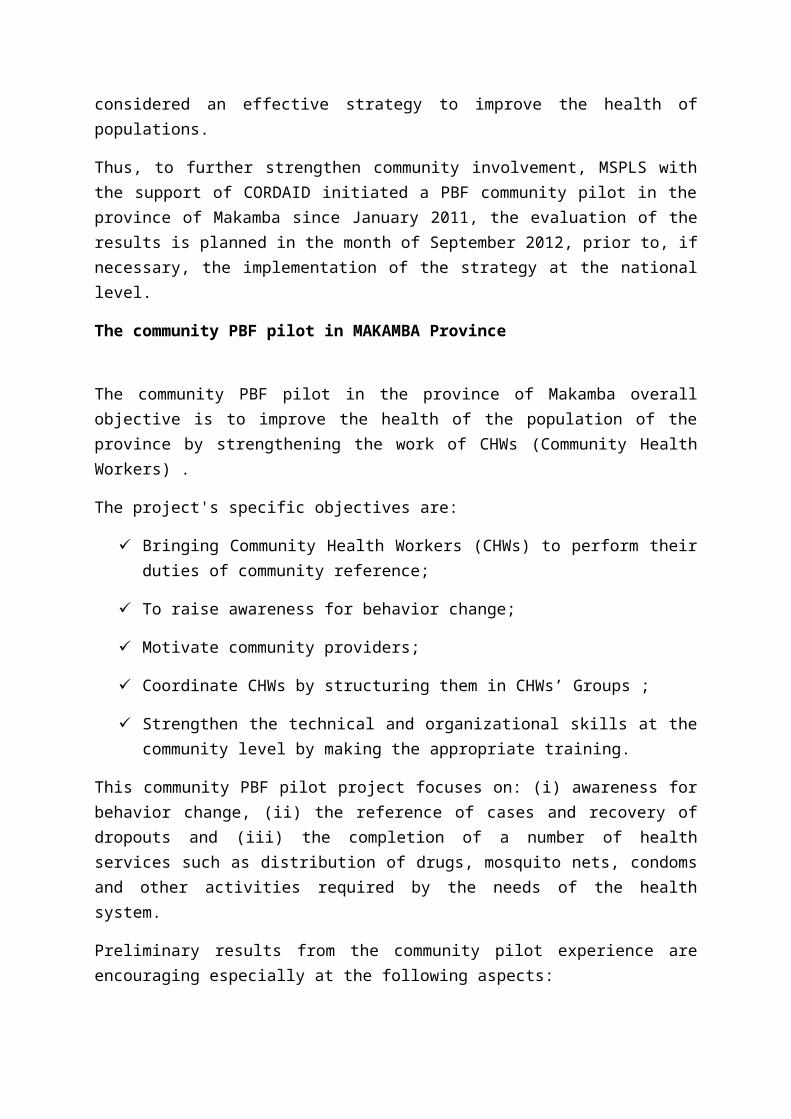
III.3.1.1. Evolution of the average quality score by Province
In 2011, four of the 17 provinces in the country, namely Bujumbura Mairie, Gitega, and Karusi Muramvya had an overall quality score of less than 70% (threshold required to receive a quality bonus) only Kayanza, reached a global quality score of 80%.
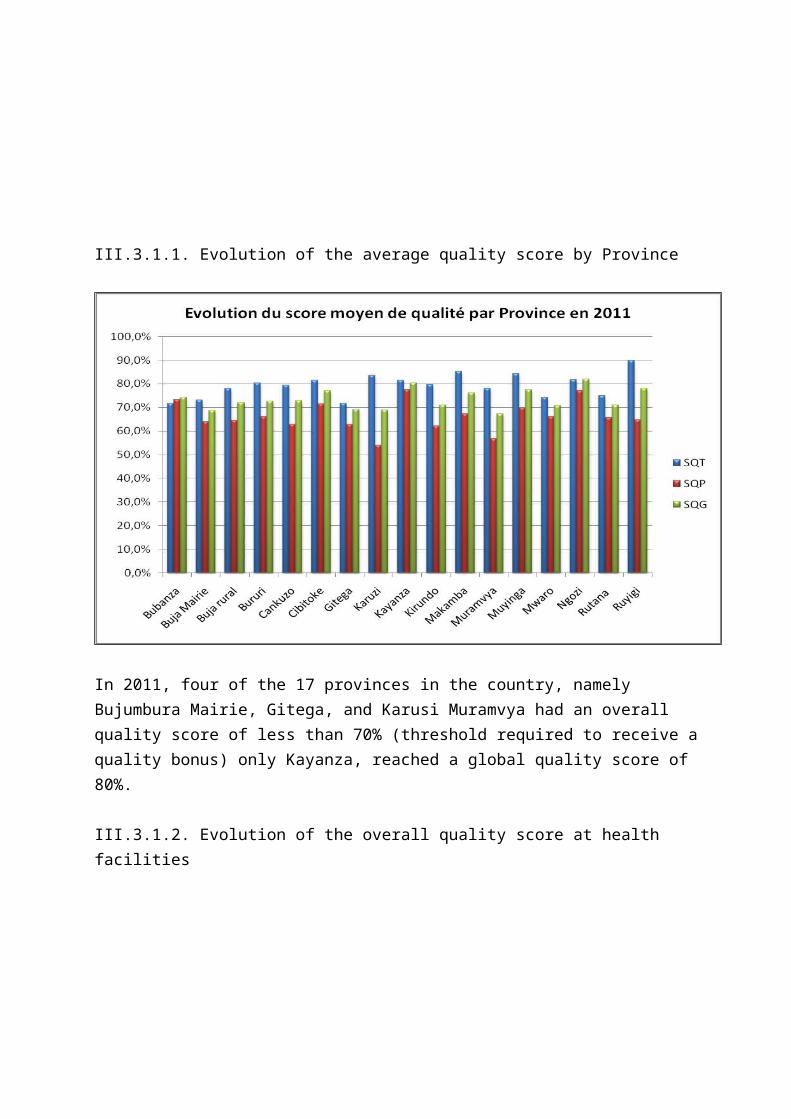
III.3.1.2. Evolution of the overall quality score at health facilities

The overall quality score was gradually increased over the quarters of 2011 with a decrease in the fourth quarter at all levels of service. Average scores for overall quality at CDS, District Hospitals and National Hospitals levels are respectively 72%, 73% and 78%.
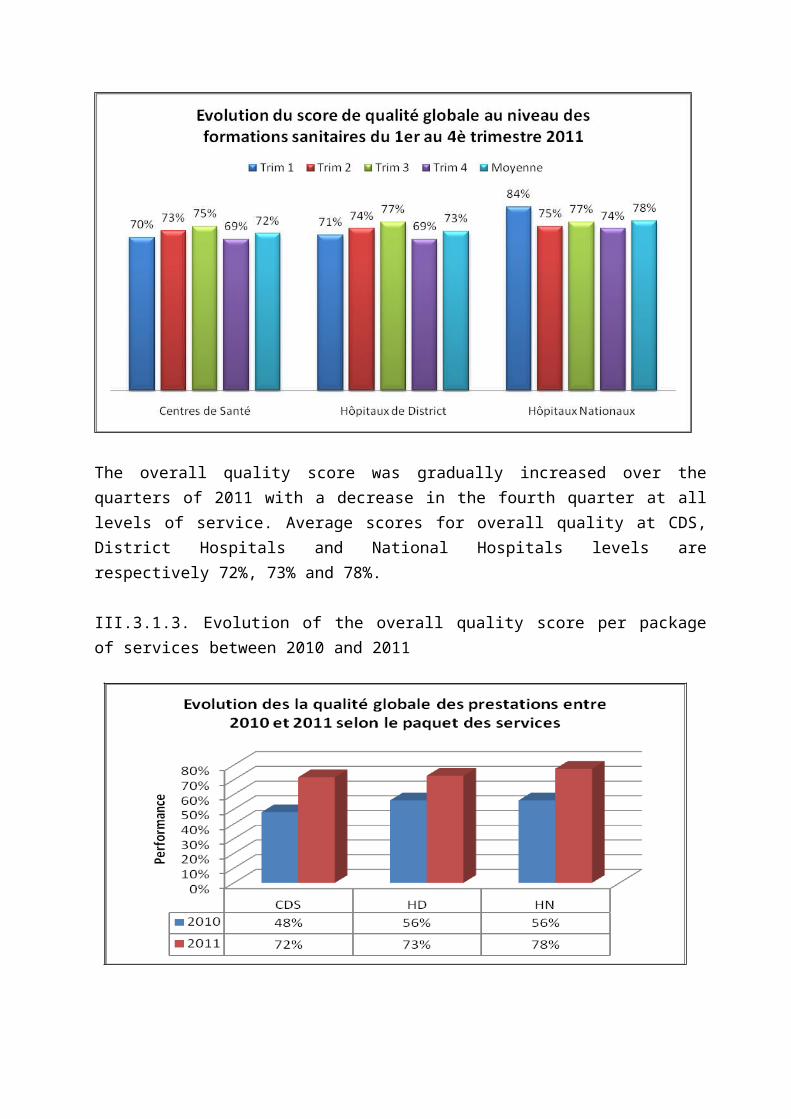
III.3.1.3. Evolution of the overall quality score per package of services between 2010 and 2011
The overall quality score increased markedly between 2010 and 2011 at all levels of service as objectified by the graph above.
It should be noted that the quality scores above and following different scores are calculated based on a sample of 516 CDS, 42 District Hospitals and 5 National Hospitals for 2010, and 513 CDS, 45 Hospitals districts 5 and National Hospitals for 2011. From 2010 to 2011, three health centers were transformed into District Hospitals.

III.3.2. Technical quality at health facilities
III.3.2.1. Evolution of technical quality score at health facilities
The score for technical quality of CDS and District Hospitals experienced a gradual increase all throughout the four quarters of 2011 with respectively an annual average of 77% and 85%. In national hospitals, there is a decrease in the score in the third quarter followed by a rise in the fourth quarter with an average of 85%.

III.3.2.2. Evolution of technical quality score by package between 2010 and 2011
The score for technical quality of service has increased from 2010 to 2011 at all levels of service delivery care.
III.3.3. Quality of care perceived by the population
III.3.3.1. Evolution of perceived quality score at health facilities level
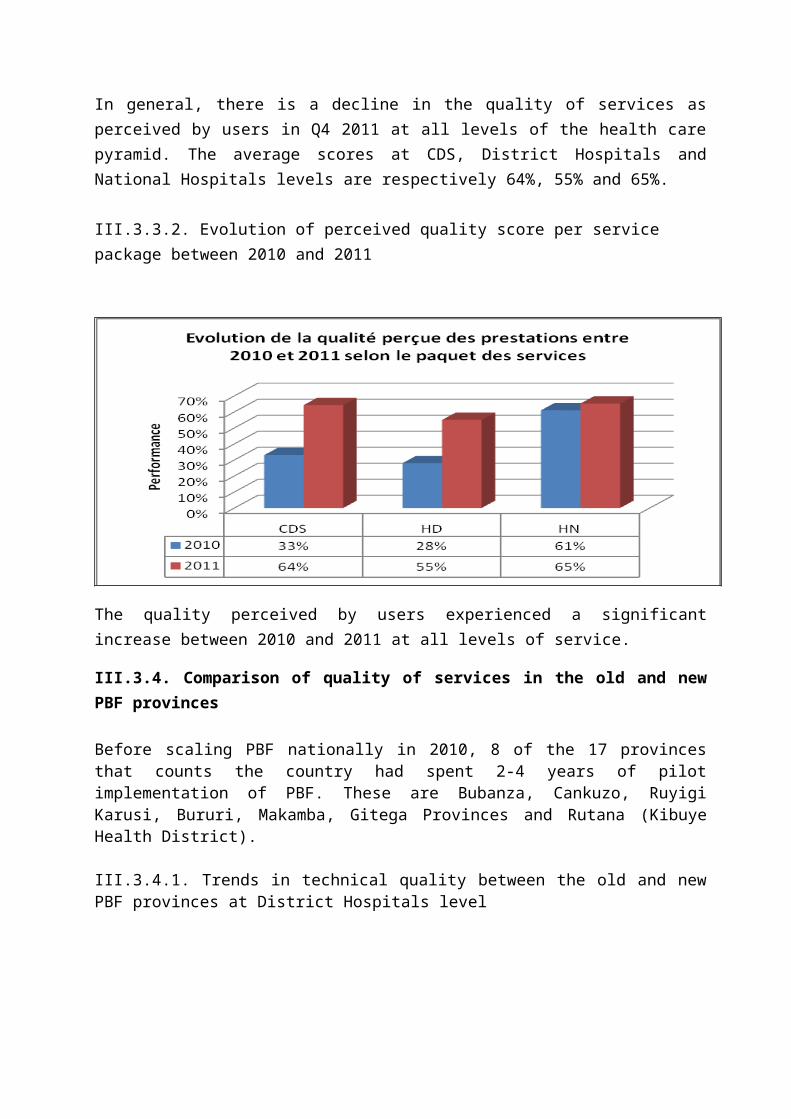
In general, there is a decline in the quality of services as perceived by users in Q4 2011 at all levels of the health care pyramid. The average scores at CDS, District Hospitals and National Hospitals levels are respectively 64%, 55% and 65%.

III.3.3.2. Evolution of perceived quality score per service package between 2010 and 2011
The quality perceived by users experienced a significant increase between 2010 and 2011 at all levels of service.
III.3.4. Comparison of quality of services in the old and new PBF provinces
Before scaling PBF nationally in 2010, 8 of the 17 provinces that counts the country had spent 2-4 years of pilot implementation of PBF. These are Bubanza, Cankuzo, Ruyigi Karusi, Bururi, Makamba, Gitega Provinces and Rutana (Kibuye Health District).
III.3.4.1. Trends in technical quality between the old and new PBF provinces at District Hospitals level

At the District Hospitals level, the chart above shows that in 2010, the former PBF provinces had a score of technical quality higher than new PBF Provinces but in 2011, the new provinces caught up with the old one with a respective overall quality score of 84% and 85%.
III.3.4.2. Trends in technical quality between the old and new PBF provinces at health centers level
At the health centers level, the score of technical quality in the former PBF provinces was slightly higher than in the new Provinces, but in 2011, the gap has widened in favor of the former PBF provinces with an average score of technical quality 74.7% against 65.4%.

III.4. Average performance score at BPS, BDS and CPVV levels
Overall, the performance score of BPS, BDS and CPVV during the year 2011 was very satisfactory with respective scores of 93.44%, 91.33% and 97.44%.

CHAPTER IV. VERIFICATION AND COUNTER VERIFICATION OF SERVICES OF HEALTH FACILITIES IV.1. Verification of services of health facilities
Verification within PBF includes verification of quantitative services, the evaluation of the technical quality and the evaluation of the perceived quality at the community level.
IV.1.1. Verification of quantitatives services
The quantitative verification of services is made monthly by CPVV. During the year 2011, all facilities under contract (CDS, district hospitals and national hospitals) have been checked and in most cases, the HIS reports were completed within the first 5 days of the following month.
Findings were identified and recommendations made by the evaluators following the monthly checks in health facilities.
StrengthsDuring monthly quantitative verification activities, it was found that: i) quantitative data of health facilities that have signed contracts have been verified and validated monthly by the CPVV on time ii) most health facilities verified had filled their HIS reports in the first five days of the month, iii) an improvement in the filling of different registers and their resilience iv) an improvement in the identification of recipients of care v) Qualified personnel are now able to work with the evaluator and the verification is easy even in the absence of the head of the health facility.
WeaknessesDeficiencies in the verification were also identified. These included: i) data collection tools that are often in use in the various services, which makes it difficult to verify, ii) stock-outs of HIS data collection tools at the health facility, (iii) errors in numbering and counting in registers, which causes discrepancies between reported and verified data iv) failure to consider referrals and counter referrals in hospitals due to lack of register in which these cases are reported v) the persistence of confusion in understanding the definitions of the indicators.
RecommendationsDuring monthly checks, the main recommendations that have been made are the following: i) strengthen the capacity of care providers in the correct filling of HIS data collection tools, (ii) strengthen the capacity of service providers in the control of definitions of indicators contracted, (iii) Support HF managers in developing HIS reports iv) Make available new tools for data collection at health facilities, (v) Ensure that the drafting and analysis HIS reports to be made as a team at the health facility prior to transmission.
32
IV.1.2. Evaluation of quality of care
The quantitative production of services by the health facilities must be weighted by the quality of services. The management teams of BPS associated with BDS conducted quarterly performance assessments of the technical quality of CDS (4 times during the year 2011). For hospitals, the evaluation of the technical quality was performed by peers (peer Hospitals in collaboration with BPS) 4 times in all hospitals (district and national).
Strengths
During the year 2011, (i) the assessment of the quality of services were held each quarter in all health facilities under contract and in a timely manner, (ii) the assessment of the quality was on most relevant aspects of a health facility: work environment, work organization, clinical services, preventive services, preventive and corrective maintenance, human resources management, medication management, financial management, (iii) the results of the assessment of technical quality have been returned to the Health Facility.
.Weaknesses
Although there is an improvement of quality in hospitals, (i) there is a risk of complacency related to peer reviews of hospitals. As the evaluation periods are known in advance, (ii) hospitals are preparing but in reality it is difficult to ensure the regularity of good practices between assessments.Other weaknesses include: iii) the non-capitalization of the experience gained by the evaluation teams following a staff instability, iv) lack of control over the evaluation methodology.
Recommendations
The main recommendations are as follows: i) Conduct assessments with interprovincial peers with participation of members of the Extended CT PBF to avoid the risk of complacency, ii) Focusing the evaluation of the technical quality on the medical record at the Hospitals, iii) Strengthen the capacity of teams of evaluators on the control of quality assessment grids.
.
IV.1.3. Community verification
The performance based financing strategy has in its objectives the strengthening the voice of the people. Thus, in the community component of PBF, the population as a user of health services, through quarterly surveys of community verification by local associations under contract, had the opportunity to assess the quality of services available and provide suggestions for improving
33
health services. In this area, 500 local associations had a contract with the Community CPVV to perform verification during 2011.
In total, four community surveys (one per quarter) were carried out in 2011 by local organizations under contract. The information was collected on the existence of patients reported in the records of FOSA, confirmation of the services received by users and the satisfaction of the latter in relation to care and services in different health facilities under contract.
Strengths
Community verification (i) strengthens the reliability of data related to the performance of health facilities, (ii) is an opportunity offered to the people to give their views on the services provided by the health facilities, (iii) strengthening the collaboration links between the health facility and community. In addition, (iv) the involvement of local associations for a neutral assessment of the quality of services has an important role in contributing to the improvement of health services and the development of health facilities’ action plans.
Weaknesses
The problems observed are: i) the incomplete identification of beneficiaries in the health facilities that investigators fail to find, ii) improper filling survey forms by the CBOs, iii) some patients from the sample are not found in the community following the false documents and false addresses, iv) collection tools poorly filled or lost data in the health facilities at the time of sampling, v) outline of some data collection tools does not capture all the elements necessary to the achievement of community surveys, (v) poor capacity of analysis and use of data on the results of community surveys by CPVV evaluators .
Recommendations
The main recommendations are as follows: i) Provide tools for data collection containing all the necessary information to achieve the community surveys, (ii) strengthen the capacity of service providers for proper filling of tools for data collection, (iii ) Strengthen the capacity of local organizations in achieving community surveys, (iv) Strengthen the capacity of CPVV evaluators in the analysis and use of the results of community surveys.
IV.2. Counter verification
The counter verification is performed quarterly by an independent external body. For 2011, the Rwandan NGOs HDP (Health Development and Performance) completed this activity. Counter verification includes four main components: quantitative counter verification, qualitative counter

34
verification, the assessment of compliance with procedures and satisfaction of beneficiaries of care at the health facility.
The various reports of the Counter verification were shared with all members of Extended CT-PBF, who is responsible for making proposals to MSPLS for corrective strategies are adopted.
Key findings of the counter verification
The consolidated bills are well made and transmitted in time by CPVV to the BPS and the latter to the CT-PBF;
The HIS reports are completed and submitted on time to all levels (CDS, BDS, BPS);
Existence of differences between the quantities checked and counter verified for medical consultations, hospitalization and references / counter references to CDS and hospital days. These differences are not related to fraud attempts but (i) recording errors and inattention from attendants to work, (ii) a poor filling of tools for data collection, (iii) that some data collection tools are not available at the time of counter verification;
The CT-PBF revised indicator definitions to avoid confusion in statements and verification;
Report writing of community survey by CPVV is lacking especially in terms of methodology, data collection, analysis of results, interpretation and presentation of results;
Weaknesses were regularly found in financial management in health facilities and within regulatory bodies, each turn of the counter-verification, and lack of trained personnel in the field has often been cited as being one of the causes;
Gaps were identified at the BPS, BDS and hospitals over the availability and proper use of management tools such as bank books, cash books, tracking receivables and payables, management cartage and capital;
On the quality of care, general indicators, those of hygiene, and hospitalization received the lowest scores in both hospitals and in the CDS.
Key recommendations of the Counter verification
Strengthen the technical supervision of CPVV especially in conducting community surveys and the preparation of its report;

35
Increase staff at the CPVV given workload to ensure periodically (in proportion to the total number of health facilities in the province) could contribute to improving the quality of verification and validations;
Adopt innovative strategies to improve the hygiene in health facilities;
Define precisely the responsibilities of providers, patients and patients guards in the correct use of equipment and hygiene of equipment available to them;
Provide drinking water in some health facilities to ensure a healthy work environment;
Provide the service standard framework for all activities of the District Hospitals and CDS;
Strengthen capacity for financial management at hospitals and health centers.

36
CHAPTER V. LEADERSHIP AND THE REGULATION FUNCTION OF THE MINISTRY OF PUBLIC HEALTH AND THE FIGHT AGAINST AIDS IN THE IMPLEMENTATION OF PBF
The Ministry of Public Health and the fight against AIDS (MSPLS) has played a leadership role in the regulation and implementation of the PBF. In fact, after a year of implementation at the national level, it led the process of change and adaptation of methods and tools for implementation of the PBF. In addition, the MSPLS played an important role in advocacy and communication for PBF but also in mobilizing resources from the State and donors.Leadership and regulation roles of MSPLS materialized in the following sections through the main activities carried out by the central level.
V.1. PBF Manual revision and development of a harmonized index tool
At the beginning of the implementation of the PBF in April 2010, a manual of procedures for the implementation of the PBF called original version was developed. The actors of the health system who participated in its development were aware that this procedures manual should be dynamic in the sense that its operational implementation would necessarily lead to adjustments based on observations in the field.
So after a year of implementation and in the light of field observations and on the basis of recommendations of a joint external review on the implementation of the PBF conducted in October 2010, MSPLS has led a revision process of the original version of the PBF manual which began with a workshop in Gitega from February 28 to March 5, 2011. After this retreat, discussions were held with all stakeholders in the health system and the outcome of this process, a revised manual of procedures has been developed with the following main changes:
V.1.1. Changing the institutional arrangements
The institutional structure has been slightly modified with the establishment of an extended PBF Technical Unit with CT-PBF, cadres MSPLS and TFP. This extended Technical Unit's role is to support the CT PBF in all its missions and meets once a month in regular session. Its role is also to support the players at the intermediate and peripheral levels (BPS, BDS, CPVV) in the implementation of the PBF.
The Provincial Committee of Validation and Verification (CPPVV) was in fact divided into two subunits: a subunit-validation and subunit-verification but with a unique coordination. The CPVV missions were extended to monitoring and evaluating the implementation of PBF at Provincial level and thus its composition was extended to Medical District Chiefs and their managers in the health information system
V.1..2. Changing the quality assessment grid at Hospitals
The quality assessment grid at the Hospital was changed to include more clinical aspects and analysis of medical records.
37
V.1.3. Changing performance grid of regulatory bodies
Performance grids of regulatory bodies have been adjusted for problems observed during the implementation but also new missions assigned to them in the revised PBF manual. And the grids of the CT-PBF, DGR, BPS, BDS and CPVV have changed.
V.1.4. Frequency of action plans, community surveys and length of contracts
The periodicity of the action plans was changed from a quarterly basis to twice a year. This was dictated by the observation that as they only started running quarterly action plan, the health facilities should be put to the task to develop a new plan without sufficient time to evaluate the achievement of the previous quarterly plan. Consequently, the duration of contracts has also been extended to six months instead of three.
Community audits conducted by local organizations (ASO) have changed from quarterly to twice a year; given the complex logistics of carrying out these surveys and data analysis work necessary.
V.2. Introduction of Performance Based Financing at the central level of the Ministryof Public Health and the fight against AIDS
The leadership of the Ministry of Public Health and the fight against AIDS, which provides the functions of regulation and control of the health system, is crucial in the implementation of the PBF. As for all other reforms in the sector, the objectives will be achieved only if the commitment of central staff is assured. Also, strengthening the human factor is a priority. Thus the contracting process accompanied by the introduction of PBF in the central services was accelerated, even if the signature of the majority of contracts do not occur as expected in 2011.
The purpose of contracting the central level is to contribute to the achievement of PNDS II results by accompanying health services in their organization, planning and monitoring and evaluation by the central services of MSPLS who play their normative and regulator roles. This is to focus the central level on their core functions, reducing the counterproductive temptation of their cadres to carry out operational tasks. Thus, one might limit their negative interference in the operation of intermediate and peripheral levels. To do this will require:
Improve coordination and effectiveness of services in the implementation of the reforms undertaken by the MSPLS
Promoting efficiency and the rational management of resources at all levels of the health pyramid;
Develop a work culture based on results;
Develop a process of changing attitudes and behaviors in order to stimulate the development of talents and sense of initiative;

38
Improving the conditions and the working environment in MSPLS central services.
The roadmap developed in the month of March 2011 for the introduction of PBF at central level planned rationalization activities that should enable them to perform better. The CT-PBF chose to develop a timetable with the most optimistic assumptions to hasten the signing of the first contract.Although 70% of the planned activities were carried out, the CT-PBF was not mastering the timetable for the implementation of some of them, including some prior to contracting central services: reorganization of MSPLS made in 2011 through the publication of a new organization, streamlining the management of human resources in the production of standards in human resources and redeployment of staff, decentralization of resource management, harmonization mechanisms for granting bonuses at the central level, capacity building in planning and monitoring and evaluation.
V.2.1. Selecting Delivery Units (DU) eligible to contracting
Planning skills development aims to create the minimum conditions necessary for the establishment of a "quality culture", an environment conducive to the improvement of performance. These conditions are evaluated by so-called eligibility indicators, which are not entitled to compensation, but are the sine qua non for the signing or renewal of performance contracts between the DU and the Minister's Office. Thus, during the third quarter of 2011, a commission appointed by the Minister of Public Health and the Fight against AIDS evaluated DU at central level, after amended and adopted the grid proposed by the CT-PBF.
The main problems identified were:
Insufficient mastery by DU of their workloads;
The inadequate allocation of human and material resources between services and departments;
The shortcomings of norms and standards for the allocation of human and material resources;
The shortcomings in the planning and monitoring of the development of human potential;
The difficulties in building team spirit within the DU;
The shortcomings in the coordination and monitoring of activities of staff and DU;
The shortcomings in the systematization and dissemination of strategic information.
V.2.2. Support to Delivery Units
To help the various departments to expedite the resolution of the problems mentioned above, the

39
CT-PBF provided the allocation of a portion of the funds available for the payment of performance contracts to upgrade delivery units . It intensified advocacy to General Directorates of Health Services and Planning for the retraining of staff.
Management training was organized in April 2011 in order to improve the transformational capabilities (as opposed to transactional capabilities) of MSPLS cadres. It has not achieved all its objectives, but a recycling of managers of different delivery units is expected in 2012. It is desirable that recycling emphasizes: (1) the delegation of responsibilities and decentralization of decision making, (2) the supervision and coaching, (3) evaluation of staff and quality circles (4 ) construction and management teams, (5) the communication between the teams and the flow of information.Planning Recycling for at least two cadres of each delivery unit is also expected in 2012. At the end of it, the action plans will be updated. It is also desirable that steps be taken to stabilize the beneficiaries of the training, in order not to lose the benefit of different trainings, and the institutional memory of MSPLS.
V.2.3. Distribution of PBF grants at central level
The consensus from the institutional MSPLS audit made in 2009 proposed that the amounts to be allocated to each delivery unit were based on the number of agents necessary to carry out its missions. Standards for staff is not finalized as mentioned above, new working hypotheses have been developed to enable the payment of performance subsidies in the first quarter of 2012.
Thus, the CT-PBF drafted a guidance document on the allocation of grants and the distribution of bonuses in accordance with the following principles:
The bonuses are awarded to teams that will make the distribution between individuals themselves respecting the maximum amount defined by agent: performance contracts signed by the Minister's Office are therefore not with persons, but teams called delivery Units ;
The amount of bonus payments to teams are adapted at the beginning of each year with available budget;
The assumptions used in the calculation of budgets by delivery unit admit that at equal qualification and responsibility, central staff receive less bonuses than their colleagues who provide at the intermediate and peripheral levels;
Following the recommendations of the 2011 joint annual review, vertical programs identify, before the signing of performance contract, those of their financing that can be repaid to the PBF envelope;

40
The performance bonuses are not systematic. They reward the efforts of the structure to identify and correct its own shortcomings, achieve results and contribute to the objectives of the PNDS II.
The instructions on the allocation of grants and bonuses in structures which recover costs on some of their services will be specified in 2012.
V.2.4. Performance Indicators of Delivery Units at central level
Performance grids have been developed and adopted by the extended CT-PBF. A training session on the procedures of the Performance Based Financing was organized for managers at the central level, including national hospitals. Classified into five groups, the performance criteria are defined in terms of annual action plans tailored each quarter to delivery Units programs. These are the eligibility indicators, improving the work environment, implementation of plans of action and producing periodic reports accompanying the intermediate level as well as indicators for specific missions each unit of delivery.
V.3. Contribution of Performance Based Financing in the visibility of actionsof Ministry of Public Health and the fight against AIDS
V.3.1. Forums for the exchange of experience in the Performance-Based FinancingOfficials from the Ministry of Public Health and the fight against AIDS (MSPLS) participated in several forums for the exchange of PBF experience in the year 2011.
From 14 to 17 February 2011, Burundi has hosted an International Conference on Performance-Based Financing. The conference was jointly organized by the MSPLS, Cordaid and COPED in a multi-country project funded by the European Commission. This project brings together seven countries, namely Burundi, Rwanda, Zambia, Tanzania, DRC, Cameroon and Central African Republic. It aims to improve the functioning of the health sector through an active exchange of different experiences in the field of PBF.

41
The
Minister of Public Health and the fight against AIDS, Honorable Dr. Sabine Ntakarutimana, making the opening of the conference at the Hotel Source du Nil.
The conference was attended by policy makers, actors implementing PBF in several countries as well as international experts in health financing in general and in PBF in particular. Experiences of implementation of PBF in seven countries were presented and special topics were namely the Community PBF, PBF and free care, PBF and health mutuals. During the conference, two expert groups were established to consider and make recommendations on the issue PBF and health information system; PBF and quality of care.
April 15, 2011, a delegation from Burundi participated in the spring meeting on PBF organized by the World Bank in Washington DC (USA). During this workshop, Burundi presented its experience in implementing the PBF, the results achieved and challenges.
Dr. Basenya Olivier, Member of the CT PBF, presenting PBF experience in Burundi at the World Bank in Washington DC, USA.
42
From 11 to 13 May 2011, the Centre for Studies and Research on International Development (CERDI) held in Clermont Ferrand (France), an international symposium on Performance Based Financing in developing and emerging countries. Two presentations on Burundi were made, one in connection with the contribution of PBF in strengthening the health system, the other in connection with the PBF and the strengthening of health districts. Burundi's team also participated in a roundtable on universal coverage.
From 24 to 28 July 2011, Burundi has participated in a workshop on PBF in the region of Southeast Asia, held in Dhaka (Bangladesh). It was a training workshop on the PBF for countries in Southeast Asia, and the Burundi presented its experience implementing the PBF and free health care. A particular focus was placed on the verification system.
From 17 to 21 October 2011, a delegation from Burundi participated in a workshop on the impact on Results Based Financing held in Bangkok (Thailand) evaluation. The need for an impact evaluation study and to program it at the beginning of the implementation has been emphasized in order to produce scientific evidence. The different countries that start PBF pilot have integrated impact evaluation component and showed the progress of the studies. For Burundi, which is already at the stage of generalization, a classic impact evaluation is not possible, but other types of impact assessment have been proposed by the delegation of Burundi. During the workshop, Burundi made a presentation on the lessons learned from the implementation of the PBF and another on the consideration of the equity in the national PBF model dimension.
From left to right : Gyuri Fritsch (World Bank), Hicuburundi Sosthène (DGR), Dr Kamana Jean (Coordonnator CT PBF) and Dr Basenya Olivier (Member CT PBF) during the Bangkok conference
43
From November 29 to December 2, 2012 more than 70 African experts met in Limbe (Cameroon) to discuss the challenges of implementing PBF in the countries of francophone Africa. Three presentations were made by the delegation of Burundi: (i) The challenges of implementing PBF coupled to free health care, (ii) the results and lessons learned after a year of implementation of PBF and free healthcare and (iii) the challenges of costing PBF coupled to free funding for sustainability: lessons learned from the experience of Burundi.
From 7 to 9 December 2011, a delegation from Burundi participated in Freetown (Sierra Leone) to a regional conference on PBF and the Millennium Development Goals related to health. On this occasion, Burundi presented its experience implementing PBF. The Burundi delegation also noted that reforms in the health sector have helped reduce infant and child mortality and maternal mortality ratio between 2005 and 2010. Exchange of experiences with the participating countries and a field visit to the health facilities in Sierra Leone have yielded lessons learned and recommendations for better implementation of PBF.
V.3.2. Experience exchange visits of foreign delegations in Burundi
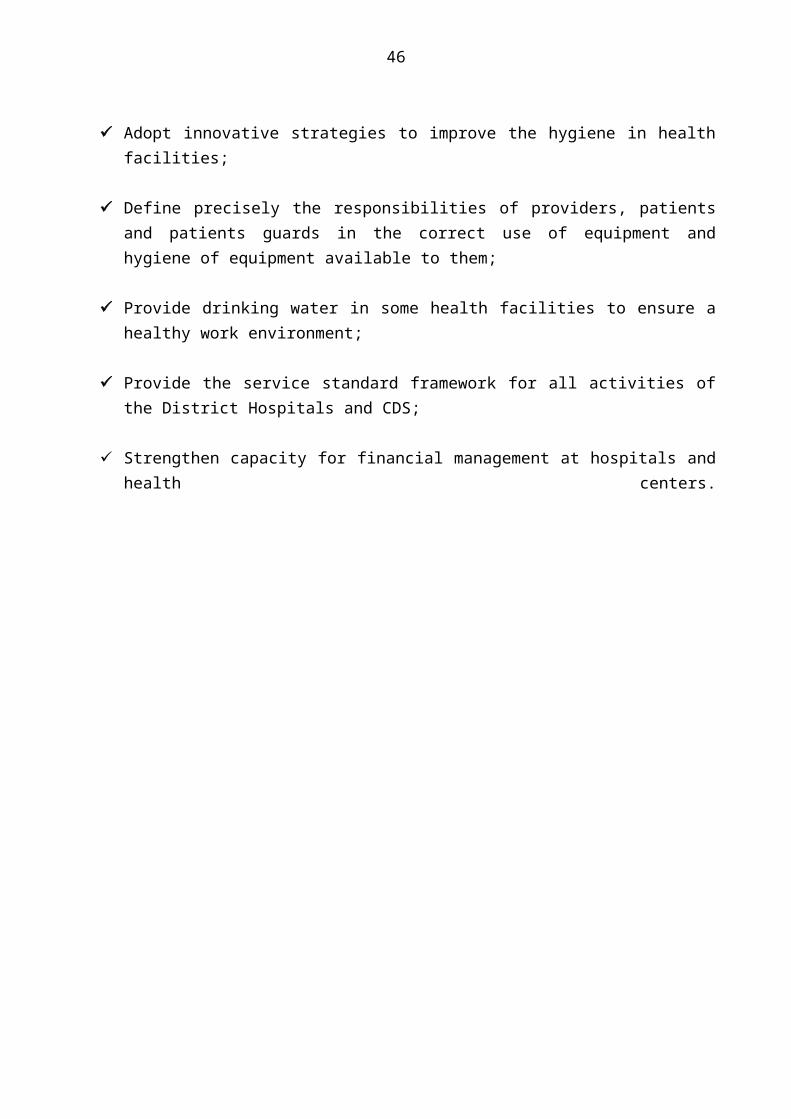
From 10 to 12 October 2011, a delegation of officials from the Ministries of Health of CHAD and COMOROS visited Burundi to inquire about the experience of Burundi in the implementation of Performance Based Financing (PBF) and share experiences underway in their respective countries.
The visit began with a presentation of PBF system in Burundi which has the distinction of being associated with the repayment of the package of free care. The presentation focused on the institutional arrangements, the separation of functions, the system of verification and counter verification, the results obtained, challenges and constraints.
The delegation then visited the Prince Regent Charles Hospital, Ngozi Hospital, Hospital Mivo, CDS Gashikanwa and Ngozi. At the end of the visit, a debriefing was held and lessons have been learned and recommendations.

44
Visiting delegations of CHAD and COMOROS at Health Center Ngozi
From 7 to 9 November 2011, a delegation of Sierra Leone visited Burundi in an experience exchange visit for implementation of Performance Based Financing (PBF).
Sierra Leone, which had started in April 2011 the implementation of the PBF at health centers throughout the country and implements a policy of free health care for children under 5, pregnant women and lactating women, came to learn from the experience of Burundi.
An overview of the Burundi PBF model was made and emphasized the institutional arrangement, the combination PBF and free health care, the verification and counter verification system, the emphasis on the technical quality of care and quality perceived community participation, public-private partnership, taking into account equity.
The delegation then visited the Provincial Office of the Municipality of Bujumbura, the District Health Office Rumonge the Tertiary Prince Regent Charles Hospital, the Health Center Kigwena, the Provincial Committee of Validation and Verification in Bururi. Lessons learned and challenges were shared with the team of Sierra Leone. Receiving the delegation at the end of its mission, the Permanent Secretary of the Ministry of Public Health and the fight against AIDS in Burundi wished that PBF is a gateway to a stronger partnership between African countries and even in other areas than PBF.

45
Visit of the delegation of Sierra Leone at Health Center Kigwena, District Rumonge, Bururi Province
V.3.3. Communication on Performance Based Financing
V.3.3.1. Articles on Burundi PBF
Some items on the PBF Burundi have already been published:
The performance-based financing as a strategy to improve the implementation of free health care: first lessons from the experience of Burundi
This article was written by Olivier Basenya, Nimpagaritse Manasseh, Busogoro Jean Francois, Ndayishimiye Juvenal, Nkunzimana Canute, Ntahimpereye Gerard, Michel Bossuyt, Ndereye Juma and Ntakarutimana Leonardo. It was published in October 2011 in Working Paper 5 of the PBF Community of Practice. It shows how the PBF has helped to improve the implementation of the free health care by reducing the repayment, stock-outs and the administrative burden on health facilities while strengthening the health information system, with a an effective verification system and establishing a financial incentive for health personnel. The article can be downloaded from the website http://www.hha-online.org/hso/financing/pillar/documentation or on the website PBF Burundi namely www.fbpsanteburundi.bi.
The district health system and on performance based financing: synergies and possible contradictions
46
It is an article written by Dr. Nsengiyumva George and Dr. Musango Laurent and published in September 2011 in the working paper 4 of the PBF Community of practices. The article highlights the salient experience of synergy between the district health system and PBF in the field with a particular emphasis on the counterproductive effects that PBF can induce to the process of setting up a district health system. Corrective measures are proposed to the initiators of these reforms. The article can be downloaded from the website http://www.hha-online.org/hso/financing/pillar/documentation or on the PBF Burundi website namely www.fbpsanteburundi.bi
Burundi’s adoption of performance based financing to fund fee exempt health services
This is an article published by the World Health Organization in the series of success stories of health financing for universal coverage reforms under the initiative provinding for Health (P4H). The article traces the constraints observed in the implementation of free health care for children under five and pregnant women and how some of them have been settled by the payment of free care package through PBF. The article can be downloaded from the website of the PBF Burundi www.fbpsanteburundi.bi
The sudden removal of user fees: the perspective of a frontline manager in Burundi
This is an article published by Dr. Nimpagaritse Manasseh and Paola Maria Bertone in Health Policy and Planning, 2011, 26: ii63-ii71. This article focuses on the measure of free healthcare for children under five and pregnant women, taken in 2006 by the President of the Republic of Burundi. The study states that even if free health care for vulnerable groups can help reduce inequities and improve the accessibility of these groups to health care, it is important that this kind of measure is carefully prepared to avoid some of the perverse effects as that was the case in Burundi. The authors recommend that policy makers can closely associate technicians in taking such drastic measures as free care. The article can be downloaded from the website of the PBF Burundi namely www.fbpsanteburundi.bi
V.3.3.2. Production of a leaflet on the Performance Based Financing
A leaflet on the PBF Burundi was produced. It describes the background and history of implementing PBF in Burundi, the objectives, the institutional arrangement, the verification system, the main achievements, challenges and prospects.
V.3.3.3. TV studio on PBF
In November 2011, a TV show on the PBF was held in the studios of the National Radio and Television of Burundi. This program was attended by the Permanent Secretary of MSPLS, the Director General of Resources and Coordinator CT PBF. The reforms in the health sector were discussed at first and then, a focus was placed on the PBF, its principles, strengths, challenges and

47
constraints. Resource mobilization for the FBP and free health care has also caught the attention of the panelists.
Views of participants on the television set on the reform of the performance-based financing
V.3.3.4. Production of a documentary movie on the Performance Based Financing
A documentary film on PBF and free care was produced in December 2011. This film gives voice to actors of the implementation of the PBF in particular actors at health decentralized level, the territorial government and the population. All these actors show the improvements made by the

48
PBF to correct deficiencies. MSPLS officials at the highest level also expressed through this documentary.
V.3.3.5. Organizing monthly meetings of the Extended CT PBF
Each month, a meeting of the Extended CT PBF is organized and is an opportunity for exchanges and discussions between executives MSPLS and donors on the implementation of the PBF. Several topics were discussed during the year 2011 which include the presentation of the results of implementation and constraints, the state performance of execution of PBF budget, the pilot on the Community PBF in Makamba, changes to the procedures manual.

49
CHAPTER VI. PBF CONTRIBUTION TO STRENGTHEN HEALTH SYSTEM
In this chapter, the annual report seeks to assess the contribution of PBF in strengthening the health system across five of its six pillars as defined by WHO (i) the availability of human resources and self-responsibility, (ii) health information and data management, (iii) drugs / vaccines and technologies, (iii) financing and management autonomy, and (vi) governance, leadership and community involvement in the management of health structures. It should be noted that the first pillar in connection with the services and quality of care was discussed in Chapter III.
Some data is not available, this report addresses only certain aspects of these pillars, others can be objects of search.
VI.1. Availability of human resources
The presence of high quality human resources in sufficient numbers is the engine of the health system. The greater autonomy in the management of health facilities, among others stimulated by PBF, strengthens leadership in the adoption and implementation of strategies to accelerate the achievement of the objectives of the action plans. It is in this context that health facilities have the freedom to recruit qualified personnel without waiting any authorization from the hierarchy. This helps to gradually fight against the problems associated with the lack of human resources especially in health facilities remote from urban centers. To help assess the true value of the contribution of PBF in the availability of human resources at the intermediate and peripheral level, a study by CORDAID within the project "7 countries" will be performed in April 2012.
VI.2. Health Information System
The health information system (HIS) is a key lever for successful PBF strategy. Since the introduction of PBF in Burundi, a new verification function of reported data by health facilities was initiated in order to pay for services actually performed in the PBF. To verify the data contracted, each health facility must first have completed the HIS report in a timely manner if not the verification is not performed. This has improved the completeness and timeliness of the data transmitted to the HIS.

50
Source : National Service of Health Information (SNIS)
The completion rate of HIS data has evolved to higher-level for health facilities from 2009 (before the scaling up of PBF) in 2011. Indeed, at the health centers level, the rate rose from 83% in 2009 to 98.2% in 2011 whereas at Hospital, it moved from 75.4% to 82.4% during the period. The rate of readiness has followed the same trend during the same period from 81% to 98.1% at the health centers and 72% to 79.7% at the Hospitals.
At the time of the verification, there is comparison of the data reported by health facilities and those verified by the evaluators in cases of discrepancy, an adjustment is made, which allows health facilities to transmit the HIS verified and validated data. This approach contributes to improving the reliability of the HIS data.
Before the implementation of PBF, the different registers of the health services were poorly filled with often no complete identification of the patient or the treatment administered. Since the PBF repay services to output after verification in the registers, FOSA improved filling tools for data collection.
An analysis of data from HIS is performed each month at the health facility, at BDS, at the BPS and even at CPVV during validation sessions. In addition, each quarter BPS organize discussion meetings and restitution on analyzes of data from HIS and the different assessments at the FOSA.

51
VI.3. Availability of drugs
Availability of drugs, vaccines and other inputs is one of the indicators of functioning health system.
Source : PBF database
The proportion of health facilities that have not been out of stock for 15 tracer drugs increased from 2010 to 2011 from an annual average of 46.61% to 60.80%. The financial resources provided by the PBF directly at the health facility at a steady pace allow the latter to provide liquidity to purchase drugs for their needs and at the appropriate time.
VI.4. Financing and management autonomy
Through performance based financing, financial resources are made directly to the health facilities through a direct transfer of funds. The availability of financial resources in cash allows health facilities to reply promptly to priority needs, particularly in terms of availability of essential drugs, operation and investment. This strengthens the autonomy of management of health facilities.

52
Source : diretory EPISTAT 2010 and 2011
The chart above shows that the total revenues at the health centers have almost quadrupled between 2010 and 2011 from more than 5.5 billion FBU to just over 22 billion Burundian francs. The average revenue per CDS is 7,484,184 FBU in 2010 and 17,511,110 in 2011 Fbu.
However, the actual financial situation of the CDS could not be assessed because data on expenses, receivables and payables are not usable.
Similarly, data on the financial situation at the Hospital level will be part of a study to be conducted in 2012.
VI.4. Governance, Leadership and Community Involvement
The implementation of PBF is accompanied by good practices that enhance good governance, leadership and community involvement in the management of health facilities.
The principle of separation of functions advocated by PBF (provision, regulation, verification and purchase) helps to prevent conflicts of interest between stakeholders and to strengthen respect for the responsibilities of the different actors.
In Burundi, the PBF promotes public-private partnership. Indeed, public or private nonprofit health facilities negotiate major performance contracts and associate private health facilities of their area of responsibility to this performance through subcontracts. This is an opportunity for the public sector to frame and to better collaborate with the private sector.
PBF came to establish a practice of preparing quarterly and annual action plans by each provider that enters the system. This practice gives providers an autonomy to identify at their level and at their beneficiaries level the priority issues, effective and efficient strategies to solve them, the resources and the contribution of each actor in their area of responsibility.

53
Through an action plan developed by a provider, it is clear the means that will be used in terms of human, material and financial resources. This shows how the PBF empowers providers to better allocate their resources. Health committees and private providers located in the area of responsibility are associated with this planning.
PBF has introduced a financial planning tool that allows transparency in the management of financial resources of the facility. Each month, facility manager and staff representatives analyze revenue and expenditure plan and set priorities for investment and operation of the clinic.
With regard to community participation in the use of health services, health committees and community health workers are involved in the mobilization and sensitization of the population under the supervision of the CDS. In the process of verifying services, local associations have the mission to authenticate the achievements of health facilities and measure the degree of satisfaction of the population. In counterpart, they receive an incentive bonus in accordance with the contract previously established by CPVV.

54
CHAPTER VII. FINANCING PBF
VII.1 Costing model and PBF web database
VII.1.1. Costing model
The costing model is mainly used to estimate the annual cost of implementing the PBF at national level, by province and by type of activity. It includes all sources confirmed by various partners funding PBF and is updated regularly ensuring continuous budget monitoring to guide decisions and / or consider adjustments whenever necessary.
The costing model of 2010, at the beginning of the implementation of PBF, was based on national targets by activity for performance prediction and estimation of the corresponding budget. These targets were defined in terms of national health policy in Burundi and, for some, with reference to international health standards. Rate "of achieving the target" was assumed for each indicator under the assumption that health care facilities could not reach 100% of the target during the first year of implementation of the PBF.
In October 2011, the "costing" model has been revised taking into account the use of services for the first twelve months of PBF implementation. Thus, instead of the assumptions that were used in developing the first model, the data on the actual services then available were the basis of calculation for determining budgets.
Page of the costing model PBF Burundi, 2011 version
As in the 2010 model, the principle of budgeting by province was adopted. Moreover, instead of reusing the same criteria for interprovincial equity, provincial budgets have been calculated based

55
on the actual use of services by province during the previous period, including changes in use over time. The principle of equity is preserved through the determination of rates of indicators by province.
The new model also incorporates various assumptions that are designed to keep costs in PBF mobilized envelope. An annual increase of 4% compared to the budget rate used in 2010 was used for 2011. Some strategies to streamline the health care system have been considered (see VII.5. Streamlining the implementation of PBF). The estimate of expected effects of these measures on the results paid under the PBF indicators has enabled to make projections in determining budgets.
VII.1.2. Performance based financing database
The PBF database is an application accessible through internet. It was developed using technology "open source" software with PHP and MySQL and has been operational since 2010 (http://www.fbpsanteburundi.bi/bddfbp/). This database was designed primarily to facilitate data management and billing processes in the PBF.
The web application includes the following data: health facilities and administrative structures; indicators for the performance of health facilities and administrative structures; budgets at all levels of intervention; amounts per indicator and processing invoices; principles and basic rules of management and data access.
Various statements and reports can be generated by different users depending on their access levels. Following may be mentioned:
invoices and tabular reports (monthly and quarterly invoices, payment plans, budget monitoring reports, other reports of monitoring and evaluation);
tables and graphs of the various services (quantity and quality) to monitor the trends; budget monitoring.
In order to strengthen PBF communication, the application also includes a website interface where are published various information and documents. Thus, it provides a platform for the exchange of information between different actors in PBF implementation in particular, and the public in general.
VII.2. Cofinancing PBF implementation
The performance based financing strategy benefited from the financial support of various partners during the year 2011.

56
Some partners involved in the payment of bills in their area, while others prefer to pay for a specific type of indicators in accordance with their mission, and up to the budget they have. However, quotas set changed for some partners during the year for reasons of non-availability of funds. Government funds and the IDA funds through PADSS Project were used to pay the bills in areas non/ or partially covered by other partner. The regulatory bodies at the central level (CT-PBF, DGR), counter verification and support were paid only on IDA funds.
According to estimates in 2011, thirteen potential stakeholders had offered to finance the implementation of PBF. From the graph above, three partners were committed to finance more than 70% of the budget: the Government (40.96%), the World Bank / IDA (18.79%) and the European Union via CORDAID (12.53%).
Most partners have honored their commitments. However, some of them were not able to directly fund PBF strategy but supported health facilities through the provision of inputs. The Government has funded more than half of the budget with 51.9%, the World Bank / IDA 28.2%, the European Union through the project more health and CORDAID 6.6% as shown in Figure 2.
57
VII.3. Use of budget estimates by Province
In 2010, ten provinces out seventeen had exceeded the provincial budget estimate and at national level, the budget was exceeded by 13%. During the year 2011, control strategies of budget use were taken and only Bubanza exceeded its provisional budget while the national budget estimate was used at 91%. This situation is illustrated in Figure 3.

58
VII.4. Expenses incurred for the implementation of the PBF of health facilities during the year 2011
VII.4.1. Budget used for quantity and quality indicators in 2011
Table ….. : Budget used at health facilities (MPA + CPA) for quantity and quality indicatorsby Province in the year 2011
PROVINCE Total quantity 2011 Bonus quality 2011 Quantity+Bonus quality % Bonus qualityBUBANZA 1 129 241 295 194 775 198 1 324 016 493 14,71BUJA-MAIRIE 3 117 108 617 436 182 890 3 553 291 507 12,28BUJA-RURAL 1 036 419 929 111 867 842 1 148 287 771 9,74BURURI 1 250 103 078 145 698 674 1 395 801 752 10,44CANKUZO 676 757 212 90 382 401 767 139 613 11,78CIBITOKE 1 289 582 011 156 629 665 1 446 211 676 10,83GITEGA 2 318 455 248 200 579 717 2 519 034 965 7,96KARUZI 980 309 502 122 490 820 1 102 800 322 11,11KAYANZA 1 299 869 308 226 708 759 1 526 578 067 14,85KIRUNDO 1 652 698 782 148 523 022 1 801 221 804 8,25MAKAMBA 1 422 707 852 189 889 389 1 612 597 241 11,78MURAMVYA 659 779 958 56 050 767 715 830 725 7,83MUYINGA 1 684 355 707 200 729 588 1 885 085 295 10,65MWARO 497 307 008 40 471 643 537 778 651 7,53NGOZI 2 086 734 486 368 283 623 2 455 018 109 15,00RUTANA 820 274 392 113 928 027 934 202 419 12,20RUYIGI 1 394 703 906 197 500 278 1 592 204 184 12,40TOTAL 23 316 408 291 3 000 692 303 26 317 100 594 11,40
During the year 2011, the budget used for the reimbursement of health facilities (health centers and hospitals) totaled 26,317,100,594 Fbu including 3 .000.692.303 Fbu under quality bonus, or 11.40% budget. Ngozi Province received the largest proportion of quality bonus compared to the overall budget, or 15%. The lowest proportion of quality bonus was observed in the province of Gitega (7.96% of the total budget). In gross numbers, the provinces of Bujumbura Mairie, Gitega and Ngozi received highest quality bonus amounts .
Table ..... : En chiffres bruts, les Provinces de Bujumbura Mairie, Gitega et Ngozi ont reçu les montants de bonus de qualité les plus élevés.
Tableau ….. : Budget used at Health Centres (MPA) for the quantity and quality indicatorsby Province in the year 2011

59
PROVINCE Total quantity 2011 Bonus quality 2011 Quantity+Bonus quality % Bonus qualityBUBANZA 580 938 740 98 970 693 679 909 433 14,56BUJA-MAIRIE 747 951 591 26 108 576 774 060 167 3,37BUJA-RURAL 641 317 537 90 125 738 731 443 275 12,32BURURI 776 178 943 81 286 326 857 465 269 9,48CANKUZO 505 799 732 62 018 058 567 817 790 10,92CIBITOKE 884 336 266 97 614 755 981 951 021 9,94GITEGA 1 126 965 368 100 599 719 1 227 565 087 8,20KARUZI 808 040 602 114 796 212 922 836 814 12,44KAYANZA 932 949 653 168 843 180 1 101 792 833 15,32KIRUNDO 1 212 943 882 105 422 877 1 318 366 759 8,00MAKAMBA 774 265 280 74 934 586 849 199 866 8,82MURAMVYA 410 572 422 20 145 857 430 718 279 4,68MUYINGA 1 351 207 385 151 702 422 1 502 909 807 10,09MWARO 297 502 301 18 132 462 315 634 763 5,74NGOZI 1 056 289 751 144 533 671 1 200 823 422 12,04RUTANA 558 883 812 83 303 503 642 187 315 12,97RUYIGI 860 612 400 114 993 567 975 605 967 11,79TOTAL 13 526 755 665 1 553 532 202 15 080 287 867 10,30
The budget used for the reimbursement of health centers in 2011 was 15,080,287,867 Fbu with 1,553,532,202 Fbu of which under quality bonus, or 10.30% of the budget. The higher share of the quality bonus compared to the overall budget is observed in Kayanza Province (15.32%) and lowest in the province of Muramvya (4.68%). In gross numbers, the provinces of Muyinga, Kirundo, Gitega and Ngozi received the highest quality bonus amounts.
Tablea….. : Budget used at Hospitals (CPA) for the quantity and quality indicatorsby Province in the year 2011
PROVINCE Total quantity 2011 Bonus quality 2011 Quantity+Bonus quality % Bonus qualityBUBANZA 548 302 555 95 804 505 644 107 060 14,87BUJA-MAIRIE 2 369 157 026 410 074 314 2 779 231 340 14,75BUJA-RURAL 395 102 392 21 742 104 416 844 496 5,22BURURI 473 924 135 64 412 348 538 336 483 11,97CANKUZO 170 957 480 28 364 343 199 321 823 14,23CIBITOKE 405 245 745 59 014 910 464 260 655 12,71GITEGA 1 191 489 880 99 979 998 1 291 469 878 7,74KARUZI 172 268 900 7 694 608 179 963 508 4,28KAYANZA 366 919 655 57 865 579 424 785 234 13,62KIRUNDO 439 754 900 43 100 145 482 855 045 8,93MAKAMBA 648 442 572 114 954 803 763 397 375 15,06MURAMVYA 249 207 536 35 904 910 285 112 446 12,59

60
MUYINGA 333 148 322 49 027 166 382 175 488 12,83MWARO 199 804 707 22 339 181 222 143 888 10,06NGOZI 1 030 444 735 223 749 952 1 254 194 687 17,84RUTANA 261 390 580 30 624 524 292 015 104 10,49RUYIGI 534 091 506 82 506 711 616 598 217 13,38TOTAL 9 789 652 626 1 447 160 101 11 236 812 727 12,88
The budget used for the reimbursement of hospitals in 2011 was 11,236,812,727 Fbu with 1,447,160,101 FBU FBU for bonus quality, or 12.88% of the budget. The higher share for the quality bonus compared to the overall budget is observed in Ngozi Province (17.84%) and lowest in the province of Karuzi (4.28%). In gross numbers, the Provinces Mairie of Bujumbura, Gitega and Ngozi received the highest quality bonus amounts.
VII.4.2. Expenditures by level of services
During the period April-December 2010, health centers received 69% of the total budget for health facilities against 31% for hospitals. In 2011, health centers received 57% against 43% for hospitals. The decrease in the proportion allocated to health centers is explained by the fact that during the year 2011, in the context of respect for the budget, unit prices indicators were dropped for Health Centers in several provinces while for Hospitals, these rates have remained the same for the most part and even increased for national hospitals. This was decided in the light of the financial situation of hospitals already precarious due to many structural problems. However, the objective is to use at least 60% of the budget for the MPAs and 40% for the CPA.

61
VII.4.3. Spending for free care and non free care indicators
The indicators measuring free healthcare for children under five and pregnant women which have been taken into account are:
for MPA: new curative consultation of under five years, day observation under five, childbirth eutocic, consultation pregnant women, antenatal visit, postnatal consulation;
for CPA: curative consultation by a doctor for under five years old children, day of hospitalization for children under five, pregnant women consulting a doctor, eutocic childbirth, obstructed labor, cesarean section, antenatal visit, postnatal consultation.
Based on this distribution, free care indicators used 51% of the budget against 49% for non-free care indicators. On the assumption that the funds for the quality bonuses are distributed in the same proportions for free and not free care indicators, it appears that the free care indicators consumed 58% of the funds used for the MPA and CPA (15,263 918,346 FBU) against 42% for non-free care indicators (11,053,182,251 FBU).7
This proportion is different at MPA and CPA : at MPA, free care indicators consumed 50% of the budget against 53% at the Hospitals.
7 Average exchange rate 2011 : 1USD=1 250 Fbu
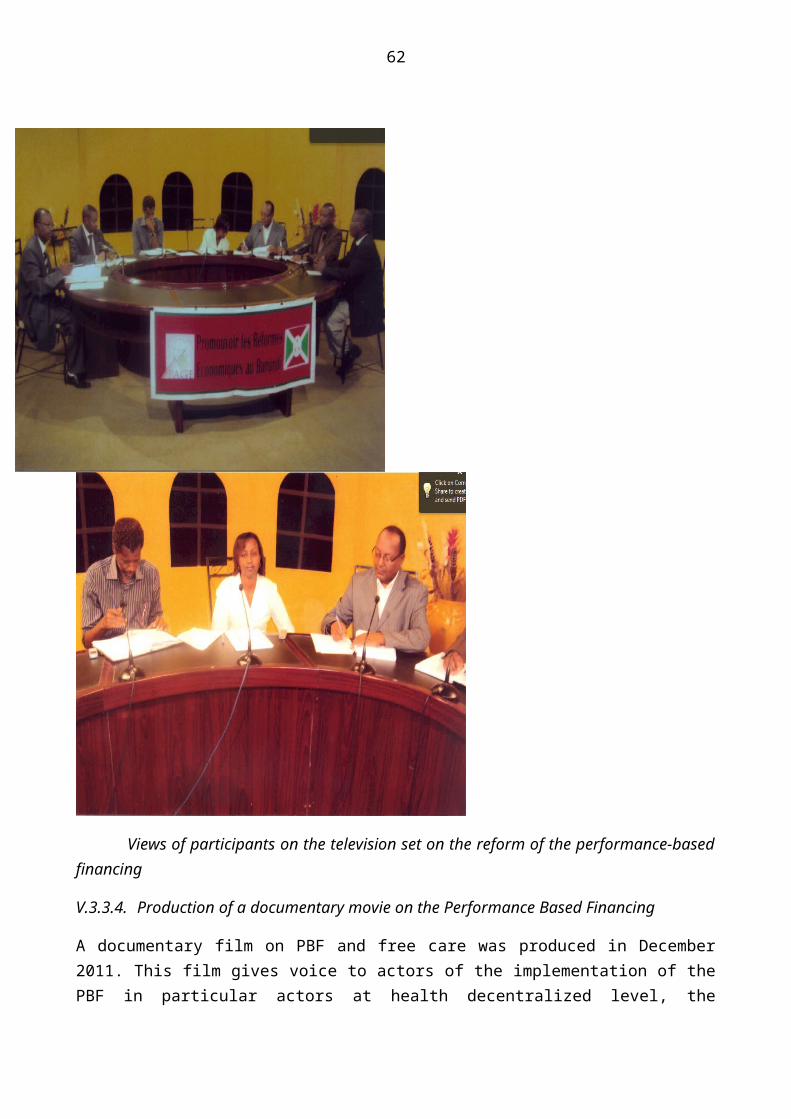
62
In reality, the funds used for free care indicators are underestimated because the refund is not made to the actual price. Thus, a portion of the funds allocated to non-free care indicators are used to fund the free care package. In addition, preventive care, care for HIV / AIDS and certain services of reproductive health are offered but are not included in the cost of free care indicators.
As shown in the table below, the real cost of free care indicators for 2011, estimated based on unit prices from the cost study conducted by MSH care and Pathfinder International, is 28,403,786 034 Fbu.
Table ….. : Real Cost of free care for children under five years and pregnant women in2011
Indicators MPA Quantity 2011
Unit costs (excluded human resources and indirect costs) Total amount
New curative visit < 5 5 185 691 1 883 9 764 656 153Observation day < 5 125 915 1 050 132 210 750Eutocic delivery 197 951 12 651 2 504 278 101Curative visit pregnant woman 367 352 3 000 1 102 056 000ANC visit 1 165 019 3 659 4 262 804 521PoNC visit 216 058 3 659 790 556 222TOTAL MPA 18 556 561 747
Indicators CPA Quantity 2011
Unit costs (excluded human resources and indirect costs) Total amount
New curative visit < 5 345 805 15 078 5 214 047 790Hospitalisation day < 5 387 731 4 000 1 550 924 000Eutocic delivery 37 289 17 109 637 977 501Dystocic delivery 11 188 18 941 211 911 908
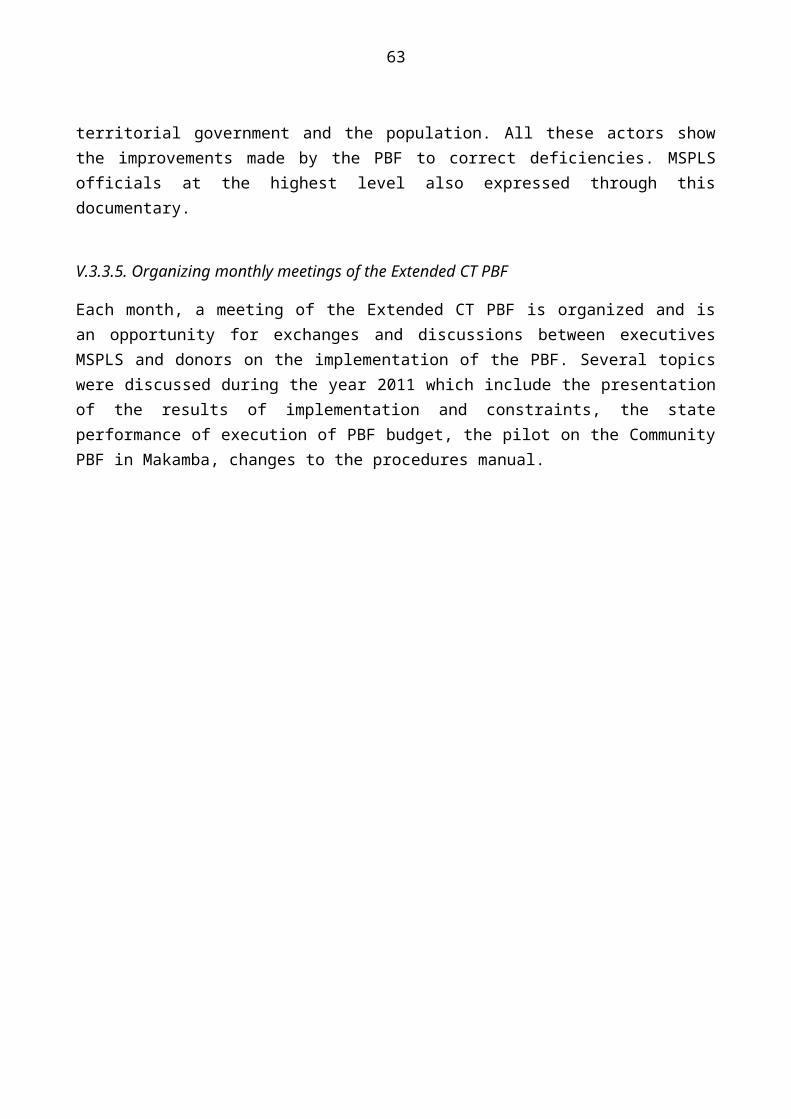
63
C-Section 16 702 104 989 1 753 526 278Curative visit pregnant woman 41 029 6 150 252 328 350ANC visit 27 539 4 260 117 316 140PoNC visit 25 632 4 260 109 192 320TOTAL CPA 9 847 224 287TOTAL MPA+CPA 28 403 786 034
It appears from the previous analyzes on the costs reimbursed for free care indicators and from above table that the funds used in 2011 for the PBF + Free care does not have enough to cover the actual costs of the only freecare indicators. The Government and the Technical and Financial Partners should therefore mobilize more resources for free health care and PBF.
VII.4.4. Expenditures by type of service (curative, preventive, reproductive health)
Expenditures at the health facility for MPA and CPA are distributed to 58% for curative services, 29% for reproductive health services and 13% for preventive actvities.
64
The curative services represent 47% of MPA expenditure against 71% of CPA. The reproductive health services represent 31% of expenditures at the MPA against 25% at the CPA while preventive activities represent only 4% of expenses at the CPA against 22% at the MPA.
VII.4.5. Expenditures for regulators
Table…… : Budget use by regulators for PBF implementation Regulators Estimated Budget Used Budget Percentage Observations
DGR 21 913 680 14 024 755 64,004th quarter not included
CT-PBF 111 255 000 97 531 272 87,66 BPS 617 500 000 577 358 054 93,50 BDS 1 474 590 000 1 348 161 973 91,43 CPVV verification team 768 600 000 759 986 250 98,88 CPVV validation team 201 542 120 196 467 913 97,48 ASLO/ community Verification 521 216 000 505 036 217 96,90 Paramedical schools services 15 962 400 14 491 198 90,78
The consumption rate of the budget for the regulatory bodies exceeds an average of 90% for entities for which data are available for the four quarters of 2011. The lack of data for certain entities (DGR, CT PBF, Services responsible paramedical schools) is explained by the fact that, on the one hand their verification is related to the availability of data for all other entities, which takes much time, and secondly to a delay in evaluation by the authorized bodies.
VII.4.6. Overall expenditures for PBF implementation by body

65
Table …… : Expenditures for PBF implementation by body in 2011 2011
Implementing Structures Used Budget PercentageMPA (Health centers) 15 080 287 867 46,31CPA (Hospitals) 11 236 812 727 34,50CT PBF 76 310 987 0,23INSP 16 749 600 0,05DGR 14 024 755 0,04BDS 1 348 161 973 4,14BPS 577 358 054 1,77Paramedical schools services 14 491 198 0,04Sub total Payment to structures 28 364 197 161 87,10Counter verification 411 541 587 1,26ASLO/community verification 505 036 217 1,55CPVV /civil servant verification 351 986 250 1,08CPVV/contracted verification 408 000 000 1,25CPVV Validation 196 467 913 0,60Support 17 Provinces (y compris rent cars+carburant) 2 040 000 000 6,26Rent offices 17 CPVV 122 400 000 0,38Capacity building 166 453 000 0,51Sub total Operational costs 4 201 884 967 12,90GENERALTOTAL 32 566 082 128 Population 2011 8 631 400 Cost per capita (Fbu) 3 772,98 Cost per capita (USD) 3,02
Average exchange rate : 1 USD=1250 Fbu for 2011
The total expenditure for the implementation of thePBF and free care during the year 2011 amounted to 32,566,082,128 Fbu which 87.1% was used by the structures of implementation of PBF and 12.9 % as operating costs. The cost per capita is 3 USD / year.

66
The graph ... shows that:
81% of the budget used for the implementation of the PBF in 2011 was directed to health facilities (health centers and hospitals) to fund MPA and CPA;
Regulatory bodies (DRG, CT-PBF, BPS, BDS) used 6% of the total budget;
Verification and validation bodies (CPVV verification Team and CPVV validation team) have meanwhile used 5% budget;
Other operational costs (support, office rent, capacity building) represent 7% of the budget used;
Counter verification used 1% of the overall budget.
VII.5. Contracting budget for central level
A budget has been developed for the introduction of PBF at central level. Funding can be taken for granted for the subsidy of DUs for at least 30 months of the 48 referred to cover from 1 January 2012, the period of implementation of the PNDS II.
The Support Program for the development of the health sector (PADSS) of the World Bank (WB) will fund for the year 2012 the regulatory function for the central level for an amount of $ 3,815,105.

67
As part of improving the initial training, the Health Sector Institutional Support Program (PAISS) of the Belgian cooperation has planned for the period from February 2011 to February 2015 a total of 535,000 euros. It also provides funding of EUR 900 000 for other central services for the years 2011, 2012 and 2013.
The contribution of the Government of Burundi to PBF central level is not evaluated, but may be taken of PBF funds available. It will increase gradually as to ensure the sustainability of interventions.
VII.6. Rationalization of implementation costs of PBF
After two years of PBF implementation, the increase in the use of health services was higher than forecast and medium-term projections show the same trend as the funds available are insufficient. In view of this situation, cost control strategies have been adopted and their implementation started in 2011 and will continue over the coming years. These strategies are described below:
VII.6.1. Reduction of indicators’ tariff
An analysis of provincial budgets used by quarter was systematically performed. For provinces exceeding the provisional budget, a reduction in tariffs by indicator was conducted in April and July 2011, the objective being that each province is in its projected budget.
VII.6.2. Removal of some indicators contracted
Two indicators contracted at MPA (Health Centers) were deleted during the year 2011, "newly constructed latrines" and "distribution of insecticide-treated nets".
The "newly constructed latrines" indicator was difficult to ascertain at health centers level because it is a service provided at the community level. In addition, it was found that some health centers tended to overestimate the number of newly built latrines in their area of responsibility.
Regarding the indicator "distribution of insecticide-treated nets," the MSPLS considers a large number of ITNs has been and continues to be distributed in the community and currently the focus must be on the actual use of these nets.
However, these indicators have not been abandoned; it was suggested to integrate them into a community package to contract in the coming years after learned from the Community PBF pilot on the underway in the province of Makamba.
VII.6.3. Penalization measures at quantitative and qualitative services level
In terms of quantitative services, any discrepancy greater than or equal to ± 5% between quantities reported by health facilities and verified by the auditors is subject to penalties as indicated below:
>± 5% and ≤ to± 10% discrepancy: -5% of the amount on the relevant indicator;
68
>±10% and ≤ to± 20% discrepancy: -10% of the amount on the relevant indicator;
More than ± 20% discrepency: 0 Fbu given for the indicator concerned.
Regarding the quality of services, any health facility with a overall quality score of less than 50% is applied with a quality penalty under the conditions described below:
overall quality score between 40% and 49.9%: - 10% of PBF funds received in the previous quarter on quantitative services;
overall quality score between 30% and 39.9%: - 20% of PBF funds received in the previous quarter on quantitative services;
overall quality score less than 30%: - 25% of PBF funds received in the previous quarter on quantitative services.
VII.6.4. Prevention and control of abuse in the implementation of the free care
After two years of PBF implementation combined with free health care, it was found that the use of services by children under five years beneficiaries of free health care remains high. Indeed, during the year 2011, this use is 3.49 New contacts / capita per year, whereas it is 0.76 New contacts / capita per year for children above five years old.
One explanatory hypothesis could be that children over 5 years pose for children under 5 years to be eligible for free health care.
To remedy this situation, several actions have been taken or are envisaged:
Eligibility control for beneficiaries of free health care at health facilities: a team to check the eligibility of beneficiaries of free health care (children under five years and pregnant women) at the National Hospitals was introduced. If the experiment is successful, the MSPLS will put in place mechanisms to control this eligibility at all health facilities.
Multiplication and dissemination of regulations on free care to the community, care providers and political and administrative authorities. These texts contain clear provisions on the eligibility of beneficiaries and terms of payment for eligible beneficiaries receiving coverage by health insurance. The observation made is that these provisions are not complied with, and the reason often cited by managers of health facilities is the ignorance of the law. This is why a wide dissemination of these texts is necessary.
These statutory instruments are:

69
• Decree N ˚ 100/136 of 16 June 2006 on subsidy for care for child under 5 years and deliveries in public health facilities and similar• Decree 100/38 of 16 March 2010 amending subsidy for care for children under 5 years and deliveries in public health facilities and similar• Ministerial Order N ˚ 630/848 on the terms of the Decree N ˚ 100/136 subsidy for care for children under 5 years and deliveries in public health facilities and similar• Joint Ministerial Order N ˚ 630/877 of 20.4.2010 laying down implementing Decree 100/38 of 16 March 2010 amending the Decree 100/136 of 16 June 2006 on health care subsidy for children under 5 years and deliveries in public health facilities and similar
Strengthen the referral and counter referral system: the beneficiaries of free health care (children under five and pregnant women) should be treated first at the health center which will then refer them to the Hospital if necessary. Those seeking help directly to the hospital should pay for their care. This would reduce the cost of free care (as services are more expensive at the Hospital) and would relieve Hospitals which would then be focused on their primary mission to care for complicated cases. This clause is also specified in the Ordinance of implementation of free health care, but is not yet applied.
VII.6.5. Controlling the risk of double payment of contracted indicators
During the year 2011, it was found that certain indicators related to the management of HIV / AIDS were doubly funded. Indeed, some indicators such as "circumcision" and "support for PLWHAs on ART" are contracted by the national PBF strategy and the PRIDE project for the fight against HIV / AIDS. Given this situation, the National Technical Unit PBF and the PRIDE proposed integration of the contracting of all HIV / AIDS indicators in the national strategy to improve efficiency and ensure quality care for PLWHAs.
VII.7. Mobilization of financial resources for the implementation of PBF
Mobilization of financial resources for the implementation of PBF should be a permanent work of MSPLS. During the year 2011, the Government increased its contribution to the PBF and free health care from 12.3 billion in 2011 Fbu to 18.2 billion Burundian francs in 2012.The European Commission through the project Amagara meza has increased its financial contribution to the implementation of PBF from € 3.5 million over three years (2008-2010) to 7 million euros for a period of four years (2011-2014).
USAID, through its ROADS II project, implemented by FHI 360, has agreed to join the PBF strategy in its operations by funding HIV / AIDS indicators in Kayanza, Karuzi Muyinga and Kirundo. The actual funding is announced for the month of January 2012.
CHAPTER VIII. FINDINGS AND RECOMMENDATIONS

70
VIII.1. Monitoring the implementation of recommendations of the 2010 annual PBF
RECOMMENDATION ETAT DE MISE EN OEUVRE OBSERVATIONS
1 Mobilize additional resources to fill the financing gap
Mobilization took place with the Government which has increased its contribution, and with TFP also increased their support
This is an ongoing process that must continue
2 Streamline the implementation of the policy of free health care
An experience of rationalization started at the National Hospitals by sending MSPLS teams responsible for monitoring eligibility for free care
This experience will be extended to other health facilities if it is conclusively
3 Establish a functional system of reference and counter reference against
A note to the Minister of Public Health and the fight against AIDS to respect the reference system and counter reference primarily to the beneficiaries of the free care reference was produced. This note states that to be treated at the Hospital, one must be referred by a Health Centre
The implementation of this provision will be made with the entry into force of the CAM restructured in May 2012
4 Install efficient internet equipment at central and intermediate level
Equipment was installed at the central and intermediate level but failure occurred in several provinces, making it internet connectivity difficult
Repairs of these failures are ongoing
5 Recruit an expert in computer programming and network administrator
Both experts were recruited and are operational
6 Strengthen the technical platform of health facilities
is achieved gradually through investment funds of the Government and the support of donors
7 Determine areas of responsibility of all health facilities of the country
Not yet carried Scheduled for 2012

71
8 Revise assessment tools for implementing PBF
Done
9 Strengthen monitoring and evaluation of the implementation of the PBF at all levels
Done At the intermediate level, to strengthen its monitoring and evaluation role, the CPVV was strengthened by the integration of medical district officers and HIS district officials
At the central level, the Extended CT PBF plays the role of monitoring and evaluation
10 Involving members of the Extended CT-PBF in the monitoring and evaluation of the implementation of PBF at all levels
Members of the Extended CT-PBF participated in the various assessments at intermediate and peripheral levels and monitoring of the implementation work at all levels
In 2012, the Extended CT PBF will attend CPVV validation and quality assessment meetings at all levels
11 Accelerate the process of contracting at central level
All implementation tools were produced
Initial assessments of delivery units at the central level are planned for April 2012
12 Incorporate strategies to finance the demand for care within the overall health financing : community mutual and health insurance
Reflections in this direction are underway including the restructured Medical Assistance Card (CAM)
13 Establish mechanisms for effective integration of community-based interventions in the PBF
A pilot of Community PBF started in January 2011 in the province of Makamba
Lessons from this experience will generalize this approach to national scale
VIII.2. Main findings
VIII.2.1. Strengths
Continuous improvement of the use of health services; Improvement of some health indicators: births attended by trained personnel, fully
immunized children; Gradual improvement in the quality of care; 50% increase in the contribution of the Government; Financing PBF implementation by the Government to nearly 52%; Increased financial contribution of some technical and financial partners;

72
Improved governance of the health system: planning culture, culture of accountability, transparency in the management by using the index tool;
Increase the proportion of health facilities with no stock outs of essential drugs; Integration of a new partner in the financing of PBF: FHI with USAID funding; Strengthening routine HIS: filling improvement of tools for data collection, improving in the
Completeness and Timeliness; Strengthening the regulatory function of BPS and BDS; Strengthening the monitoring function of CPVV with the integration of Chief Medical
Officers and District officials HIS in CPVV teams ; Strengthening monitoring and evaluation by Extended CT PBF; Strengthening public private partnership through private health facilities involvement in
the implementation of the PBF and free health care; Strengthening community participation in the management of health problems involving
Health Committees and Community Health Workers in the performance of health centers, involvement of local associations in community surveys;
Increased visibility of the implementation of the PBF: production of a documentary on the Burundi PBF, there is a website dedicated to the PBF.
VII.2.2. Weaknesses
Persistence of some cases of discrepancy between the data reported by the health facilities and the data verified by the evaluators;
The system for measuring the quality of care that is not yet properly developed: system based on a predetermined schedule and known in advance to the health facility to prepare for the evaluation without certainty that the quality level is measured during continuous time;
Weakness in the analysis of epidemiological and financial data of health facilities by CPVV; Low capacity to analyze and use data from community surveys by CPVV; Low supervision of health facilities by BDS and accompanying NGOs especially in the
planning process and in the use of the index tool; Poor communication on the implementation of PBF between different actors at all levels; Low supervision of health committees and local associations in the implementation of the
Community PBF; No application of equity bonus between health facilities within the same province; Weakness in financial management at the health centers, BPS and BDS; Late payment from certain technical and financial partners; Disruption of PBF web based data following a failure of a submarine cable in the Indian
Ocean which caused some delays in data validation; Action Research on PBF embryonic.

73
VIII.2.3. Opportunities to exploit
Involvement of Government in financing the implementation of the PBF and free health care through a particular "PBF" budget line and a commitment to increase its contribution each year;
Continuous involvement of donors in the funding and implementation of PBF; Experience Community PBF pilot underway in Makamba Province; Existence Strategy Papers on Community Health; Study on the financial viability of National Hospital proposed in 2012; Submission of a proposal to strengthen the health system to GAVI with a PBF component; Call for specific PBF proposal to be launched in September 2012 by GAVI; Increase the contribution of the World Bank in financing through the PBF Trust fund; Project to strengthen the network of six national laboratories under the East African
Community with funding from the World Bank with PBF component.
VIII.2.4. Threats to mitigate
Reference and counter reference system not yet properly functional: access to care at the hospitals is not yet conditioned by a reference by the Health Center level;
Overall funding problem at Hospitals level: arrears due to services for the poor and the CAM, high payroll plethora of staff, increased salaries of health staff decided by the State in 2009 but not yet reimbursed to hospitals that have pre-funded;
The lack of control of areas of responsibility of health facilities; Anarchic development of health facilities in the context of lack of health map at the
national level; Low level of capitalization of skills at positions of responsibility at the operational level; Low internet connectivity or failure of V-SAT in some Provinces delaying entry work and
data validation at the intermediate level; Low level of training of financial managers at Health Centers; Delay in the signing of financing agreements for PBF strategy between the MSPLS and
some technical and financial partners; Lack of funding for the implementation of the PBF in the medium term; The lack of control of the eligibility of beneficiaries of free health care; Uncontrolled integration of mechanisms of health financing in Burundi: PBF, Free Health
Care, CAM, Community Mutual Weak financial viability of hospitals.
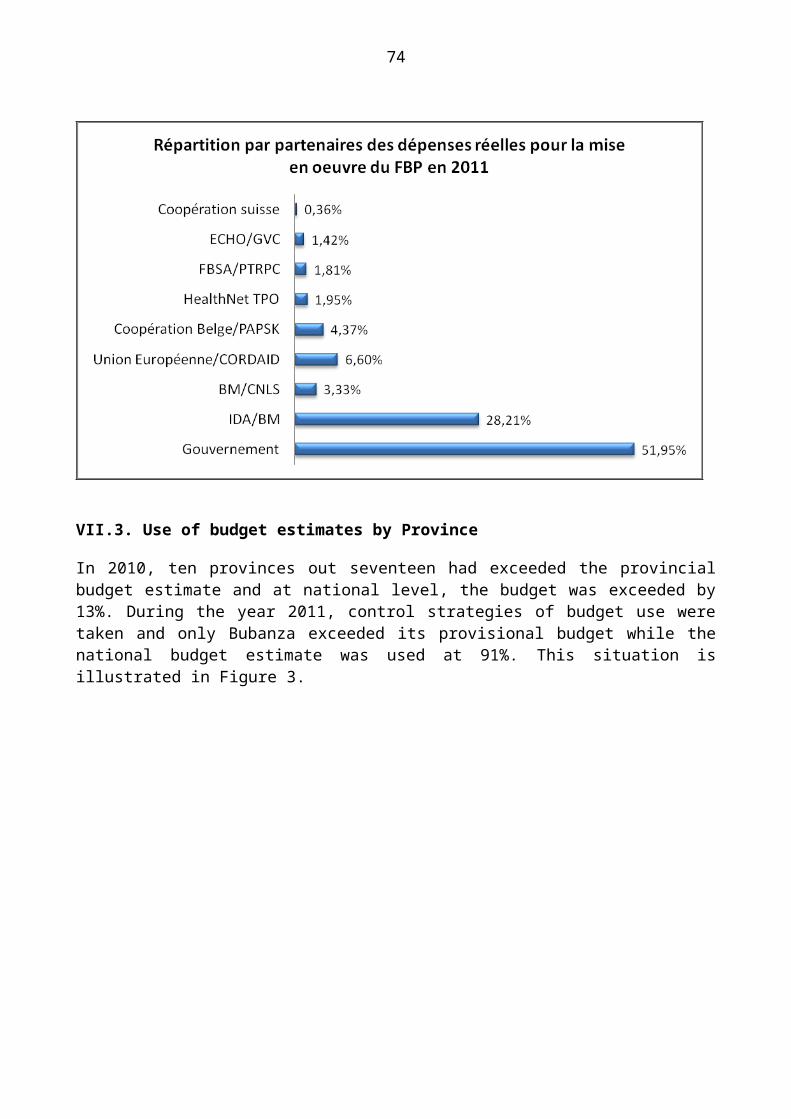
74
VIII.3. Recommendations
The successful implementation of PBF is bound to strengthen the health system in general and to improve its implementation. It is in this context that the following recommendations are made for the different stakeholders in the health system:
VIII.3.1. To the Ministry of Public Health and the fight against AIDS
Making functional reference and counter reference system with respect for different levels of care;
Building first level Hospitals in Districts that do not have them; Strengthen the regulatory role of the delivery units at the central level for the operational
level; To accelerate the development of health standards at all levels; Develop a health mapping at national level; Identify areas of responsibility of all health facilities; Continue advocacy for the mobilization of additional financial resources from the
Government and the Technical and Financial Partners; Strengthen the financial viability of hospitals by analyzing their financial situation, paying
the arrears and determining objective criteria for awarding grants to State Hospitals.
VIII.3.2. To the National Technical Unit (CT PBF)
Develop a system and methodology for measuring quality allowing to permanently maintain a culture of quality in health facilities;
Strengthen the capacity of CPVV for better data analysis and validation of the results of community surveys;
Develop a guide for verification and a guide for validation to facilitate the work of CPVV Accelerate the process of contracting delivery units at the central level; Organize exchange workshops on the implementation of PBF between actors in
implementation of PBF at all levels; Ensuring the functionality of the Web-based PBF data; Develop action research activities on the implementation of PBF.
VIII.3.3. To Health District Offices (BDS), Health Province Offices (BPS) and supporting NGOs
Strengthen the supervision of health facilities; Strengthen monitoring and evaluation of the implementation of PBF; Strengthen the supervision of health facility planning, financial management and use of the
index tool; Strengthen the supervision of Health Committees and local associations in the
implementation of the Community PBF