Embed Size (px)
Citation preview

Blood TfR+ exosomes separated by a pH-responsive
method deliver chemotherapeutics for tumor therapy
Lijun Yang2, Donglin Han3, Qi Zhan3, Xueping Li3, Peipei Shan1, Yunjie Hu4, Han
Ding1, Yu Wang1, Lei Zhang1, Yuan Zhang1, Sheng Xue1, Jin Zhao3, Xin Hou3, Yin
Wang1, Peifeng Li1, Xubo Yuan3,*, Hongzhao Qi1,*
1. Institute for Translational Medicine, Qingdao University, Qingdao 266021, China
2. College of Materials Science and Engineering, Qingdao University of Science and
Technology, Qingdao 266042, China
3. Tianjin Key Laboratory of Composite and Functional Materials, School of
Materials Science and Engineering, Tianjin University, Tianjin 300072, China
4. School of Clinical Medicine, Weifang Medical University, Weifang 261042, China
* Corresponding author: Dr. Hongzhao Qi, Institute for Translational Medicine,
Qingdao University, Qingdao 266021, China. E-mail address: Hongzhao Qi
([email protected]) or Xubo Yuan ([email protected])
Abstract
Blood transferrin receptor-positive (TfR+) exosomes are a kind of optimized drug
delivery vector compared with other kinds of exosomes due to their easy access and
high bio-safety. Their application facilitates the translation from bench to bedside of
exosome-based delivery vehicles.
Methods: In this study, a pH-responsive superparamagnetic nanoparticles cluster
(denoted as SMNC)-based method was developed for the precise and mild separation
of blood TfR+ exosomes. Briefly, multiple superparamagnetic nanoparticles (SPMNs)
labeled with transferrins (Tfs) could precisely bind to blood TfR+ exosomes to form
an exosome-based cluster due to the specific recognition of TfR by Tf. They could
realize the precise magnetic separation of blood TfR+ exosomes. More importantly,
the pH-responsive dissociation characteristic of Tf and TfR led to the mild collapse of
clusters to obtain pure blood TfR+ exosomes.

Results: Blood TfR+ exosomes with high purity and in their original state were
successfully obtained through the pH-responsive SMNC-based method. These can
load Doxorubicin (DOX) with a loading capacity of ~10% and dramatically increase
the tumor accumulation of DOX in tumor-bearing mice because of their innate
passive-targeting ability. In addition, blood TfR+ exosomes changed the
biodistribution of DOX leading to the reduction of side effects. Compared with free
DOX, DOX-loaded blood TfR+ exosomes showed much better tumor inhibition
effects on tumor-bearing mice.
Conclusion: Taking advantage of the pH-responsive binding and disaggregation
characteristics of Tf and TfR, the SMNC-based method can precisely separate blood
TfR+ exosomes with high purity and in their original state. The resulting blood TfR+
exosomes showed excellent bio-safety and enable the efficient delivery of
chemotherapeutics to tumors, facilitating the clinical translation of exosome-based
drug delivery systems.
Keywords: blood TfR+ exosomes, superparamagnetic nanoparticles, pH-responsive,
drug delivery, tumor therapy
Introduction
Exosomes have attracted increasing attention in recent years due to their huge
potential in the field of drug delivery [1,2]. Since the first report on the delivery of
exogenous siRNA [3], various therapeutic drugs, such as chemotherapeutics [4,5],
sonosensitizers [6], small-molecule inhibitors [7], proteins [8,9], and genes [10], have
been delivered by exosome-based delivery vehicles. The state-of-art CRISPR/Cas9
system has also been successfully transported through exosomes recently [11,12].
Although great progress has been made, the clinical translation of these systems has
still been a big challenge. The number of exosomes separated from current sources,
such as cell culture medium, is extremely limited, hindering their mass production
[13]. In addition, the bio-safety of these exosomes is modest since they often contain
oncogenic or immunogenic components [14,15]. Therefore, it is necessary to choose
the appropriate kind of exosomes as optimized vectors to facilitate their translation
from bench to bedside.
The blood of healthy animals contains plenty of transferrin receptor-positive
(TfR+) exosomes, which are without immune-stimulating activity and cancer-
stimulating properties [16]. For example, reticulocytes (RTCs) release ~1014 (at least
200 μg) TfR+ exosomes during their maturation into erythrocytes [17]. Their easy
access and high bio-safety imply that blood TfR+ exosomes can be a promising
alternative delivery vector. In addition, the successful blood transfusion between
people of the same blood types further proves the operability and clinical translation
potential of allogeneic blood TfR+ exosomes for drug delivery [16]. However, there
are no reports on blood TfR+ exosomes-based drug delivery until now because the
classical methods for exosomes separation cannot realize the precise separation of
blood TfR+ exosomes. Exosomes separated by the “gold standard” ultracentrifugation
method are frequently contaminated with other proteins and particulates [18].
Combining differential ultracentrifugation with a density-based technique helps
remove these contaminants, but the non-ideal clumping of the exosomes is
unavoidable [19]. Commercial precipitants, such as ExoQuick Precipitation Solution,
can be adversely affected by contaminating proteins, which require additional
filtration or ultracentrifugation steps for removal [20]. High-performance liquid
chromatography on a gel exclusion column (HPLC-GEC) is also non-specific because
of the size dependence of column packing materials. In addition, the interaction of
exosomes with the elution buffer can cause them to degrade or aggregate, resulting in
poor fractionation and decreased yields [19]. Taking advantage of the
physicochemical characteristics of exosomes, such as viscoelasticity, many novel
methods can obtain exosomes without the contamination of proteins or other kinds of
vesicles [21]. However, further improvements in the ability to separate specific kinds
of exosomes are needed. Therefore, exploiting an advanced method for the precise
separation of blood TfR+ exosomes is the precondition for drug delivery.
Magnetic particle-based or microfluidic-based magnetic separation methods,
which depend on the surface composition of exosomes, have the potential for the
precise separation of blood TfR+ exosomes. These methods have been utilized to
separate specific kinds of exosomes, such as epithelial cell adhesion molecule
(EpCAM) positive exosomes [22] and epidermal growth factor receptor (EGFR)
positive exosomes [23]. However, the mild release of these exosomes from magnetic
particles or microfluidic tubes has never been considered seriously. The commonly
used methods for the dissociation of antibody and antigen, such as very low pH
conditions (<3), would damage the structure and function of exosomes [24,25]. In
addition, the large size of magnetic beads may also result in the destruction of
exosomes. For example, Clayton et al. have proved that two or more exosomes
potentially fuse together at the magnetic bead surface [26]. Hence, developing an
upgraded magnetic separation method is an appropriate way to separate blood TfR+
exosomes for drug delivery.
Here a superparamagnetic nanoparticles cluster (denoted as SMNC)-based
method is developed for the precise and mild separation of blood TfR+ exosomes. In
this upgraded immunomagnetic separation method, superparamagnetic nanoparticles
(SPMNs) are adopted to reduce the potential risk to exosomes due to their small size.
In addition, transferrin (Tf) is used as the ligand to obtain blood TfR+ exosomes. The
specific recognition of TfR by Tf can realize the precise magnetic separation of blood
TfR+ exosomes. More importantly, the dissociation of Tf and TfR is responsive to pH
[27]. As shown in Scheme 1, holo-transferrin (contain ferric ion) could combine with
TfR at pH 7.4. When pH is changed to 5.0, holo-transferrin releases ferric ion to form
apo-transferrin (ferric ion-free). However, apo-transferrin still combines with TfR
until the pH is changed to 7.4 again. In view of the pH of the medium surrounding
exosomes being shifted from 5.0 (in the multi-vesicular body) to 7.4 (in the
extracellular space) during their formation process [28], we deduce the pH change
between 5.0 and 7.4 would not damage exosomes. Therefore, the pH-responsive
binding and dissociation characteristics of Tf and TfR can be used for the mild release
of exosomes from SPMNs.
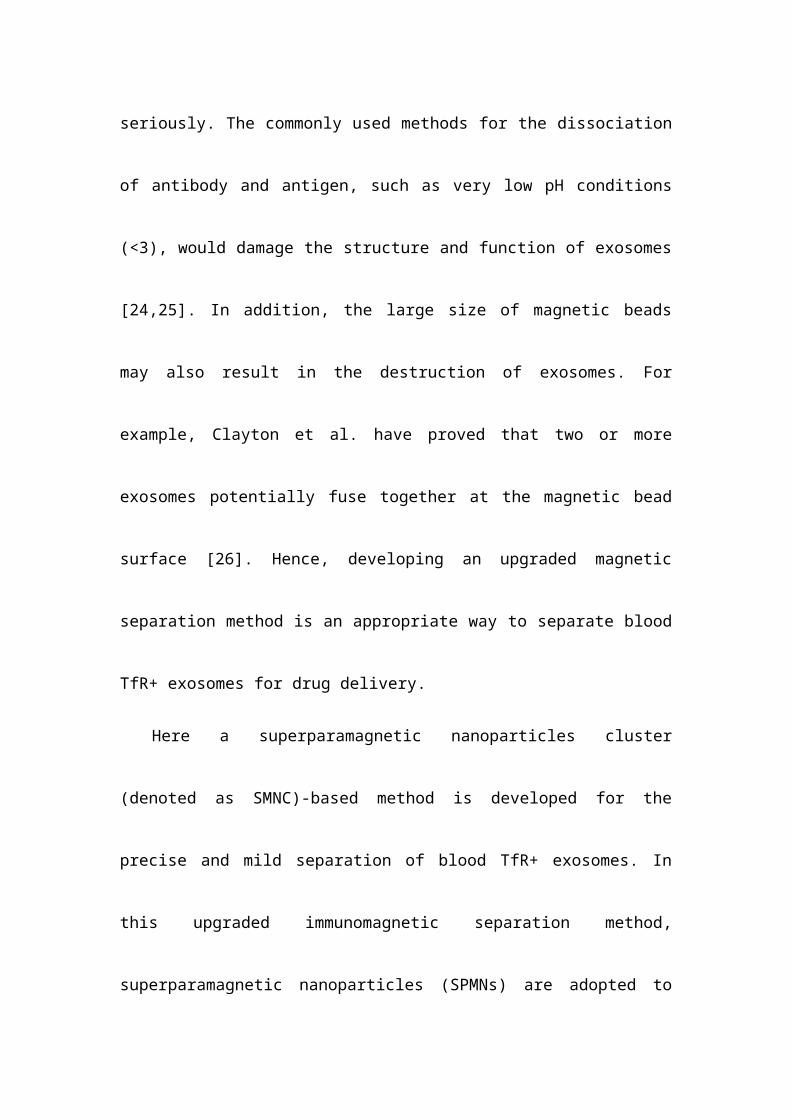
Scheme 1. The dissociation characteristic of transferrin and transferrin receptor. As shown in Scheme 2, holo-transferrin is chosen as the ligand and is labeled on
SPMNs. SPMNs can combine with blood TfR+ exosomes through the interaction of
Tf and TfR to form SPMN-exosome complexes (denoted as SMNC-EXOs) at pH 7.4.
Under an external magnetic field, SMNC-EXOs can be separated, and they are easily
re-dispersed once the magnetic field is removed. Although holo-transferrin transforms
to apo-transferrin when the pH is changed to 5.0, SMNC-EXOs are still stable. Only
when the pH is changed to 7.4 again, are they dissociated, and pure blood TfR+
exosomes (denoted as M-EXOs) can be obtained through magnetic removal of free
SPMNs. The drug delivery potential of the resulting M-EXOs is confirmed using
doxorubicin (DOX) as the model drug. The DOX-loaded M-EXOs (denoted as D-M-
EXOs) show excellent in vivo tumor suppression. The SMNC-based method for the
first time realizes the precise and mild separation of blood TfR+ exosomes,
facilitating the clinical translation of exosome-based drug delivery. Furthermore, this
methodology can inspire other researchers to exploit new ways for the exosomes
separation from animal body fluid.

Scheme 2. Schematic illustration of the separation of blood TfR+ exosomes for tumor-targeting drug delivery by the pH-responsive method.
Experimental section
Materials and reagents
Carboxyl-group functionalized superparamagnetic Fe3O4 nanoparticles were
purchased from Nanjing Nanoeast Biotech Co., Ltd. Holo-transferrin, Fluorescein
isothiocyanate (FITC), Doxorubicin hydrochloride (DOX), triethylamine, 1-ethyl-3-
(3-dimethylaminopropyl) carbodiimide hydrochloride (EDC), sulfo-NHS and 2-
mercaptoethanol were purchased from Sigma-Aldrich. A Bicinchonininc acid (BCA)
protein assay kit and an enzyme-linked immune-sorbent (ELISA) assay kit were both
purchased from Thermo Scientific. A Cell Counting Kit-8 was purchased from
Dojindo Molecular Technologies Inc. NHS-Cy 5.5 was purchased from ApexBio
Technology.
The modification of SPMNs with Tf
Carboxyl-group-functionalized superparamagnetic Fe3O4 nanoparticle solution
(40 μL, 2.5 mg/mL) was mixed with EDC and sulfo-NHS at a molar ratio of 1:2:3
(pH 5.5), and the mixture was incubated at room temperature for 1 h. Then, 1 μL of 2-
mercaptoethanol was added to terminate the reaction. The activated
superparamagnetic Fe3O4 nanoparticles were magnetically separated and were re-
suspended in 200 μL of borate buffer (20 mM, pH 8.5). Then, 10 μg of holo-

transferrin was added, and the mixture was incubated for 12 h at 4°C under nitrogen.
Finally, the SPMN-Tf complexes were purified by magnetic separation and washed
three times with PBS. The resulting solution (200 μL) was stored at 4°C.
The separation of SMNC-EXOs from serum
First, 1 mL of serum was added to an ultrafiltration tube (Millipore, 100kDa) and
centrifuged at 4000×g for 30 min at 4°C. Then, the serum solution was mixed with
SPMN-Tfs solution and blended homogeneously using a vortex shaker. This mixture
was incubated for 1 h at 37°C. The products were obtained after 40 min of magnetic
separation and were washed three times with PBS. The resulting SMNC-EXOs were
re-dispersed in PBS and were stored at 4°C until they were used.
The separation of M-EXOs
To obtain TfR+ exosomes, the stored SMNC-EXOs solution (pH 7.4) was firstly
dialyzed against acetate buffer (pH 5.0) for 12 h at 4°C. The dialyzate was changed
every 2 h. Then the dialysate was changed to PBS (pH 7.4) again, and the SMNC-
EXOs solution was dialyzed for 12 h at 4°C. The dialyzate was also changed every 2
h. After dialysis, free SPMNs were magnetically separated (magnetic field intensity:
1T) and the supernatant was collected. M-EXOs dispersed in the supernatant were
stored at 4°C until they were used.
To determine the separation efficiency of exosomes, the change in CD63
concentration during the separation process was tested. The concentrations of CD63
in SMNC-EXOs solution (pH 7.4 and pH 5.0, separated from 1 mL of serum) and in
the separated M-EXOs (pH 7.4, separated from 1 mL of serum) were measured by
using a CD63 ELISA kit. 1 mL of PBS and 1 mL of serum were used as negative
control and positive control.
The measurement of the ferric ions concentration
First, 300 μL of fresh separated SMNC-Tf solution and SMNC-EXOs solution
were both divided into three equal parts (100 μL) and were placed into solution with
different pH values (7.4, 5.0, and 7.4). After 12 h, they were mixed with 100 μL of 10

mM HCl and 100 μL of the iron-releasing reagent (1.4 M HCl and 4.5%(w/v) KMnO4
in H2O). These mixtures were incubated for 2 h at 60°C. After the mixtures had
cooled to room temperature, 30 μL of the iron-detection reagent (6.5 mM ferrozine,
6.5 mM neocuproine, 2.5 M ammonium acetate, and 1 M ascorbic acid dissolved in
H2O) were added to each solution. After 30 min, each solution was transferred into a
well of a 96-well plate, and the absorbance was measured at 550 nm on a microplate
reader. The iron content of the sample was calculated by comparing its absorbance to
that of a range of standard concentrations of equal volume that had been prepared in a
way similar to that of the sample (mixture of 100 μL of FeCl3 standards (0-128 μM) in
10 mM HCl, 100 μL 50 mM NaOH, 100 μL releasing reagent, and 30 μL detection
reagent).
The characterization of M-EXOS
The size and number of M-EXOs were determined by recording and analyzing
the Brownian motion of particles using a NanoSight NS300 system and Nanoparticles
Tracking Analysis (NTA) software (Malvern, Worcestershire, United Kingdom). Zeta
potentials of the M-EXOs were measured by dynamic light scattering (BI-90Plus,
Brookhaven Instruments Ltd., USA), and their morphology was visualized using a
high-resolution transmission electron microscope (TEM, JEM-2100F, JEOL Ltd.,
Japan) and scanning electron microscope (SEM, FEI Quanta 200, USA).
The obtainment of M-EXOs was confirmed by western blot analysis. Briefly, M-
EXOs were lysed, and lysates were separated and transferred to PVDF membranes.
Membranes were rinsed with PBS for several minutes and blocked with Odyssey
blocking buffer for 1 h at 22°C. Then, they were incubated with primary antibodies
against CD9, CD63, CD81, and TfR (Zhongshan Bio Corp, Beijing, China), followed
by incubation with fluorescent secondary antibodies (Zhongshan Bio Corp, Beijing,
China). Images were acquired with an Odyssey infrared imaging system and analyzed
using software specified by the Odyssey systems. As a control group, exosomes
separated by ultracentrifugation (denoted as UC-EXOs) were manipulated according
to the abovementioned method.

The cellular uptake of M-EXOs
Confocal fluorescence microscopy was used to assess the intracellular trafficking
of M-EXOs. Cells that had grown on the glass coverslips (pretreated with polylysine)
of a six-well plate were incubated with FITC-labeled M-EXOs (FITC-M-EXOs) for
24 h. Following incubation, the cells were washed three times with PBS and fixed in
paraformaldehyde for 15 min. Localization of FITC-M-EXOs in cells was visualized
using a confocal microscope (Carl Zeiss Microscope Systems, Jena, Germany) with
identical settings for each confocal study. To quantify the cellular uptake efficiency,
FITC signal uptake rates were detected using flow cytometry (Becton, Dickinson and
Company, USA).
To assess the intracellular trafficking of M-EXOs, H22 cells grown on the glass
coverslips of a 6-well plate were incubated with FITC-M-EXOs for 4 h. Then, the
cells were incubated with culture medium containing 50 nM of LysoTracker blue
DND-22 for 0.5 h. The cells were then washed three times with PBS and localization
of FITC-M-EXOs in cells was visualized by confocal microscopy with identical
settings for each confocal study. In addition, FITC signal uptake rates were detected
using flow cytometry (Becton, Dickinson and Company, USA).
Cell viability assay
The cytotoxicity of M-EXOs in H22 cells was evaluated using a Cell Counting
Kit-8. First, 4000 cells were seeded into 96-well plates and grown in complete
medium at 37°C for 24 h. Subsequently, the culture medium in each well was
replaced with a fresh medium that contained M-EXOs in a series of concentrations.
Cells without the addition of M-EXOs were used as a control group. Each group
included six replicates. After culturing for an additional 48 h, CCK solution was
added and cell viability was calculated as the ratio of the absorbance of test and
control wells. The absorbance was measured at 450 nm using a microplate reader.
Blood compatibility assay
First, 4 mL of mice whole blood was added to 8 mL of saline, and red blood cells
(RBCs) were isolated by centrifugation at 1,000 g for 15 min. RBCs were washed five
times with sterile saline solution. Following the final wash, the RBCs were diluted
with 40 mL of saline. Then, 0.2 mL of the diluted RBC suspension was added to 0.8
mL of M-EXOs to achieve final M-EXOs concentrations of 10, 100, and 1,000
μg/mL. The suspension was vortexed briefly before leaving it under static conditions
at room temperature for 4 h. Thereafter, the mixture was vortexed briefly again and
centrifuged at 1,000 g for 10 minutes. Next, 400 μL of supernatant was measured
using UV-Vis absorbance spectrum scanning. After that, 0.2 mL of diluted RBC
suspension, which was incubated with 0.8 mL of saline and 0.8 mL of distilled water,
was used as the negative or positive control.
Drug loading and releasing
DOX was used as the model drug. First, 20 μL of DOX solution (2 mg/mL) was
added to the M-EXOs solution (200 μL, 1 mg/mL) with moderate stirring. After 30
min, 5 μL of triethylamine was added, and then the solution was stirred 1 h. D-M-
EXOs were obtained via magnetic separation at 4°C. The amount of DOX that was
loaded into the M-EXOs was calculated from a calibration curve acquired from UV-
Vis spectrophotometer measurements based on the absorbance intensity at 485 nm.
The release of DOX was performed as described previously with slight modifications.
In short, 4 mL of D-M-EXOs solution was transferred into a dialysis tube (molecular
weight cut-off: 14 kDa). The tube was first placed into 10 mL of PBS buffer (pH 7.4).
After 10 h, the tube was placed into 10 mL of acetate buffer (pH 5.0). The release of
DOX was performed at 37°C. At selected time intervals, the dialysate was removed
for UV-Vis spectrophotometer analysis and replaced with a fresh buffer solution. The
concentrations of DOX were determined according to standard curves at the
corresponding buffer solutions.
Inhibition of tumor cells by D-M-EXOs
The tumor inhibition effects of DOX and D-M-EXOs were evaluated using a
CCK-8. First, 4000 H22 cells or 4T1 cells were seeded into 96-well plates and grown
in complete medium at 37°C for 24 h. Subsequently, the culture medium was replaced
with complete medium containing 0, 0.25, 0.5, 1, 2, 4, 8, 10, and 12 µg/mL of DOX.

The same procedure was carried out to study the influence of D-M-EXOs (with
equivalent concentrations of DOX) on cell viability. At 48 h, CCK-8 solution was
added and cell viability was assessed. The cells without treatment were used as the
control and cell viability was calculated as the ratio of the absorbance of the test and
control cells.
Confocal fluorescence microscopy was used to assess the intracellular trafficking
of M-EXOs and DOX. Cells that had grown on the glass coverslips of a six-well plate
were incubated with DOX and FITC-labeled D-M-EXOs for 24 h. Following
incubation, the cells were washed three times with PBS and fixed in
paraformaldehyde for 15 min. Localization of FITC-M-EXOs and DOX in cells was
visualized using confocal microscopy with identical settings for each confocal study.
The H22 and 4T1 cells were seeded in a dish at a density of 5×10 5 cells/mL for
24 h to bring the cells to the desired confluence. The medium was replaced with fresh
medium containing different drugs, and the cells were incubated for 48 h. Then
protein lysates were separated using SDS-PAGE gel and were transferred onto PVDF
membranes, then incubated with primary antibodies that could detect caspase-3 and
Bcl-2 (1:1000 dilution, Zhongshan Bio Corp.), followed by incubation with a
secondary antibody (1:1000 dilution, Zhongshan Bio Corp.). The density of target
protein signals was visualized by a chemiluminescent imaging system (Syngene G:
BOX Chemi XR5) using an enhanced chemiluminescent detection kit.
In vivo bio-distribution of D-M-EXOs
To investigate the bio-distribution of D-M-EXOs and the change in bio-
distribution of DOX by M-EXOs, free DOX and Cy5.5 labeled D-M-EXOs (Cy5.5-D-
M-EXOs) were injected intravenously into tumor-bearing mice. D-M-EXOs were
labeled by NHS-Cy5.5 (mass ratio of 1000:1) in pH 8.5 buffer solution. Kunming
mice, four- to six-weeks-old, were purchased from Charles River (Beijing, China).
H22 cells were suspended in serum-free DMEM medium and inoculated
subcutaneously to the flank of mice (2×10⁶ cells per mice). All animal experiments
were performed according to the protocols approved by the Institute Animal Care

Committee. After tumors had grown to ~100 mm3, the mice were divided randomly
into three groups. One group was injected intravenously with Cy5.5-D-M-EXOs
solution (5 mg/mL, 200 μL per mice). Another group was injected intravenously with
DOX solution (0.5mg/mL, 200 μL per mice). The control group was injected with
PBS (200 μL). After 24 h, whole-animal imaging was recorded using an IVIS
Spectrum imaging system (IVIS 100, USA). After that, the mice were euthanized by
cervical dislocation. Tumors and major organs were harvested, washed with PBS, and
placed in a dish. Next, fluorescence imaging results and fluorescence intensities were
recorded using an IVIS Spectrum imaging system. In addition, the tumors and major
organs were harvested, washed with PBS, stored in liquid nitrogen, and triturated in
mortar. The powder was then dissolved in 1 mL of borate buffer solution and
ultrasonically lysed. After 30 min, 1 mL of chloroform was added to the solution, and
the mixed solution was shaken for 30 min. Finally, the solution was allowed to remain
stationary, and the lower solution was absorbed. According to the absorption standard
curve of DOX, the absorbance was measured at 480 nm to determine the DOX
content.
The distribution of D-M-EXOs in the tumor tissue was also confirmed. Kunming
mice bearing H22 tumor were separated into three groups with six mice in each
group. A single-dose of either PBS, DOX, or FITC-D-M-EXOs (5 mg/mL, 200 μL
per mice) was injected via the tail vein. After 24 h, tumor tissues were isolated and
were embedded in optimal cutting temperature (OCT) compound. Then, they were
frozen rapidly at -20°C for 24 h. Tumor tissues were cut into 8 μm histology slices
using a cryostat. Each section was dyed with 4',6-diamidino-2-phenylindole (DAPI)
and covered with a coverslip. The frozen sections were observed using a fluorescence
microscope from Olympus Corporation (FV1200, Tokyo, Japan).
Cardiotoxicity and hepatotoxicity of D-M-EXOs
Kunming mice, four- to six-weeks-old, were divided randomly into three groups.
One group was injected intravenously with a solution of D-M-EXOs (~100 μg of
DOX) and one group was injected intravenously with DOX solution (100 μg of
DOX). The control group was injected with PBS. After 48 h, blood was collected
through the tail cut. Then, the mice were euthanized, and livers and kidneys were
harvested. The serum levels of aspartate aminotransferase (AST), alanine
aminotransferase (ALT), alkaline phosphatase (ALP), creatine kinase (CK), creatine
kinase-MB (CK-MB), and creatine kinase (LDH) were determined using
commercially available ELISA kits. The organs were stored overnight in 2.0% (V/V)
formaldehyde solution in PBS and were then washed twice with PBS to remove
excess formaldehyde. Paraffin-embedded tissue sections were stained with
hematoxylin and eosin (H&E) and observed through a microscope.
In vivo antitumor efficiency of D-M-EXOs
H22 or 4T1 cells were suspended in serum-free DMEM medium and were
inoculated subcutaneously to the flank of the mice (2×10⁶ cells per mice). After
tumors had grown to ~100 mm3, the mice were divided randomly into three groups
(PBS, DOX, and D-M-EXOs). Each group had five mice. Solutions were
administered by intravenous injections every three days (5 mg of DOX/kg of body
weight per dose) for three weeks. Tumor volume was measured from: volume =
length×width2/2. The mice were euthanized and the tumors were harvested. The
tumors were photographed and their average masses were measured.
Immunohistochemistry (IHC) was performed for analyzing the expression levels of
Caspase-3 and Bcl-2. For the observation of tumor cell apoptosis, tumor slices were
stained with H&E and terminal deoxynucleotidyl transferase (TdT)-mediated dUTP
nick end labeling (TUNEL), respectively.
Statistical analysis.
Statistical comparisons were achieved using a one-way ANOVA with a Dunnett
post-hoc test using GraphPad Prism 6.0 software.
Results
pH-responsiveness of SMNC-based method
Figure 1A shows the representative TEM images of magnetically separated
samples at different pH values. The morphology of samples magnetically separated
from serum (pH 7.4) was first observed. Dark spots surround spherical vesicles
representing the cluster structures were formed during synthesis. When the pH was
changed to 5.0, the structure of clusters was still stable. However, spherical vesicles
disappeared in magnetically separated samples when pH was changed to 7.4. This
may be because SPMNs were dissociated from blood TfR+ exosomes, and the re-
dispersed magnetically separated products were actually SPMNs. The size of samples
at different pH values was also detected (Figure 1B). The mean size of initial samples
(pH 7.4) was ~100.36 nm and was similar to that of samples (~91.26 nm) re-dispersed
in pH 5.0 solution. However, when samples were again re-dispersed in pH 7.4
solution, the mean size of magnetically separated samples was ~9.65 nm. These
samples may be SPMNs since the mean size of commercial SPMNs was ~10 nm. In
addition, the protein concentration of samples at different pH values was also
measured (Figure 1C). The protein concentration of samples in pH 7.4 and pH 5.0
solutions was similar and it was dramatically reduced when samples were again re-
dispersed in pH 7.4 solution. These results imply that SMNC-EXOs were formed in
pH 7.4 serum and were stable even when they were dispersed in pH 5.0 solution.
However, when they were again re-dispersed in pH 7.4 solution, SMNC-EXOs
disintegrated, proving the pH-responsiveness of the SMNC-based method.
To further demonstrate the pH-dependent separation of TfR+ exosomes, the
ferric ions concentration changes during the preparation process were tested by a
colorimetric ferrozine assay. Figure S1-A was the absorbance of the Fe2+-ferrozine
complex formed with increasing concentration of the standard FeCl3. The increase in
absorbance was linear between 0.5-128 μM (A) and between 0.5-4 μM (B) of FeCl3.
Furthermore, the absorbances at 550 nm of Fe2+-ferrozine complex in SPMN-Tfs
solution and SMNC-EXOs solution were both measured. As shown in Figure S1-B,
the pH change from 7.4 to 5.0 and again to 7.4 dramatically reduced the absorbance
since ferric ions have been released from Tfs. According to the standard curve, the
ferric ions concentration in SPMN-Tfs solution at initial pH 7.4 was ~6 μM, which
was similar to the theoretical value (5.2 μM). However, the ferric ions concentration

in SMNC-EXOs solution at an initial pH of 7.4 was ~40 μM, which was much higher
than the theoretical value. This may be attributed to the composition of TfR+
exosomes. For example, TfR+ exosomes also contained holo-transferrins [29]. In
addition, it should be specially noted that the ferric ions concentration at pH 5.0 was
obviously higher than that a later pH 7.4. We deduced that SPMNs would release
ferric ions in acidic conditions and disturb the measurement [30]. Regardless, the pH
changes during the preparation process reduced the ferric ions concentration of the
solution, which would induce the dissociation of TfR and Tf, indicating the separation
of TfR+ exosomes was pH-dependent.
To determine the separation efficiency of exosomes, the change in CD63
concentration during the separation process was tested. As shown in Figure S2, we
measured the concentration of CD63 in 1 mL serum (positive control), in SMNC-
EXOs solution (pH 7.4 and pH 5.0), and in the separated M-EXOs (pH 7.4). The
results show that the total concentration of CD63 in 1 mL serum is ~106.44 pg/mL
and is ~52 ± 2 pg/mL in SMNC-EXOs solution (both at pH 7.4 and pH 5.0). A
calculation shows that ~50% of total blood exosomes can be separated, and they are
blood TfR+ exosomes. Furthermore, the total concentration of CD63 in M-EXOs
solution is ~40.43 pg/mL, which demonstrates that 70%-80% of blood TfR+
exosomes can be separated from SMNC-EXOs solution by this pH-responsive
method.

Figure 1. The pH-responsiveness of SMNC-based method. (A) Representative TEM images of magnetically separated samples with the change of pH. (B) The diameter of magnetically separated samples at different pH values. (C) The protein concentration of magnetically separated samples at different pH values.
The characterization of M-EXOs
To further test whether a change in pH can lead to the disintegration of SMNC-
EXOs, the morphologies of M-EXOs were characterized. As shown in the
representative TEM images (Figure 2A), a typical spherical structure was observed in
M-EXOs solution, implying the existence of exosomes. The representative SEM
image also proved the existence of spherical vesicles (Figure 2B). The specific marker
proteins of exosomes (CD9, CD63, and CD81) were detected in M-EXOs solution
(Figure 2C), and exosomes separated by ultracentrifugation (denoted as UC-EXOs)
were used as a control, proving the spherical vesicles were exosomes. The existence
of TfR proved that these exosomes were TfR+ exosomes. Nanoparticles Tracking
Analysis (NTA) was performed to further characterize the separated exosomes. As
shown in Figure 2D, the size distribution of M-EXOs was centered at approximately
111 nm. Furthermore, the concentration of M-EXOs was estimated to be 1.05×10¹² ±

1.59×10¹¹ particles/mL serum. In addition, the mean zeta potential of M-EXOs was ~-
17 mV (Figure 2E). The negative zeta potential was beneficial to the drug delivery of
TfR+ exosomes since nanoparticles with too high or too low surface potential were
easily cleared by the immune system [31].
To prove the high purity of M-EXOs, we compared M-EXOs with exosomes
separated by ultracentrifugation and commercial precipitant. Figure S3-A shows the
representative TEM images of exosomes separated by ultracentrifugation and
commercial precipitant. Exosomes separated by ultracentrifugation were
contaminated with proteins (indicated by the red arrows). Besides proteins, exosomes
separated by commercial precipitant were also contaminated with large-size vesicles
(indicated by the red arrows). These results imply that M-EXOs had a higher purity.
To further prove this conclusion, we compared the amount of CD63 with that of total
proteins in the exosomes solution (both separated from 1 mL of serum) (Figure S3-B).
The ratio of the CD63 amount to the total proteins amount was the highest in M-
EXOs solution, indicating their high purity. In addition, we investigated the stability
of exosomes separated by different methods. At 4 , the mean size of exosomes℃
increased with the increase of storage time (Figure S3-C). This may be because of the
aggregation of proteins or exosomes. Comparatively speaking, the size increase
amplitude of M-EXOs was the smallest, further implying their high purity and high
stability.

Figure 2. The characterization of M-EXOs. (A) Representative TEM images of M-EXOs. (B) Representative SEM image of M-EXOs. (C) Western blot analysis of specific exosome marker proteins (CD9, CD63, and CD81) and TfR in M-EXOs solution. (D) The size distribution of M-EXOs. E) The zeta potential of M-EXOs. The cellular uptake and bio-safety of M-EXOs
The cellular uptake of the M-EXOs was tested. Protein concentration was used to
denote the content level of exosomes, similar to other researchers [3]. After 4 h
incubation, the fluorescence signal of M-EXOs was detected in the cytoplasm (Figure
3A, left picture). Quantitative results showed that the cellular uptake efficiency of M-

EXOs was respectively 35.20% and 75.13% at 100 μg/mL and 200 μg/mL (Figure
S4). These results demonstrated the cellular uptake of blood TfR+ exosomes was
concentration-dependent. The intracellular distribution of M-EXOs was also
observed. We firstly labeled endosomes/lysosomes with LysoTracker. The
fluorescence signal of M-EXOs was matched to that of endosomes/lysosomes (Figure
3A, right picture). A previous study has shown that exosomes were recruited to
endosomes by clathrin-mediated endocytosis [32]. To test whether this mechanism
was applicable to our research, we measured the cellular uptake efficiency of M-
EXOs by H22 cells with or without incubation of chlorpromazine, which was usually
used to inhibit clathrin-mediated endocytosis [33]. The flow cytometry analysis
revealed that the cellular uptake efficiency of M-EXOs was reduced from 86.15% to
27.07% (Figure S5) when H22 cells were pre-incubated with chlorpromazine. These
results demonstrated the main cellular uptake mechanism of M-EXOs was clathrin-
mediated endocytosis.
The bio-safety of M-EXOs was evaluated. A Cell Counting Kit-8 (CCK-8) cell
viability assay was performed on H22 cells to assess the cytotoxic effects of M-EXOs.
In a 640 μg/mL M-EXOs solution, cells maintained as high as 85% viability (Figure
3B). To study the biocompatibility of M-EXOs in vivo, hemolytic activity tests were
performed to evaluate blood compatibility. No hemolysis was observed (Figures 3C),
demonstrating that M-EXOs are biocompatible as a drug delivery vehicle.

Figure 3. The cellular uptake and bio-safety of M-EXOs. (A) Intracellular distribution in H22 cells of M-EXOs (exosomes were labeled with FITC). The bar is 200 μm. (B) Cytotoxicities of different concentrations of M-EXOs as examined in H22 cells by CCK-8 assay. (C) Hemolytic activities of M-EXOs and comparison with distilled water (positive control) and saline (negative control).The drug loading and tumor cell inhibition
The drug loading ability of M-EXOs was tested. Different amounts of DOX were
respectively added to M-EXOs solution (100 μg/mL), and the mixed solution was
dialyzed to remove un-encapsulated DOX. The DOX-loaded M-EXOs were denoted
as D-M-EXOs. The greater the amount of DOX added, the darker the color of the D-
M-EXOs solution was (Figure 4A, inserted picture). Furthermore, the ultraviolet-
visible absorbance of the D-M-EXOs solution at 480 nm was gradually increased
upon increasing the added amount of DOX, and the quantitative analysis indicated a
DOX loading capacity of ~10% (Figure 4A).
To evaluate the drug-release behavior of D-M-EXOs, we determined the in vitro
release profile of DOX from M-EXOs (Figure 4B). The pH of dialysate was changed
to more realistically simulate the in vivo circulation process of D-M-EXOs. In the first

10 h, D-M-EXOs were placed in PBS dialysate (pH 7.4). The release curve reached a
plateau quickly (~77% DOX was retained) indicating M-EXOs could effectively
prevent the leakage of DOX in blood circulation. The released DOX (~30%) may be
adsorbed on the surface of blood TfR+ exosomes rather than loaded in the
phospholipid bilayer. After 10 h, the dialysate was changed to an acetic acid buffer
solution (pH 5.0). The releasing rate of DOX speeded up rapidly and ~70% of loaded
DOX was released after 24 h. Decreasing the pH resulted in the protonation of DOX
and accelerated their release. This result suggested that DOX was released rapidly and
massively from M-EXOs after entering an acidic environment, such as late
endosomes and lysosomes, of tumor cells. In addition, the result that not all DOX
released from M-EXOs in 60 h implied there might be other paths for DOX loading
apart from hydrophobic interaction. For example, DOX could be loaded onto
nanoparticles by using supramolecular Π-Π stacking [34].
The distribution of D-M-EXOs in tumor cells was examined. Both in H22 cells
and 4T1 cells, nearly all DOX was distributed in the nucleus after 24 h of incubation
(Figure 4C and 4D). These results implied D-M-EXOs had effective tumor inhibition
ability. To prove this conclusion, the expression of Bcl-2 and Caspase-3 was assessed
via western blot analysis after tumor cells were respectively treated with DOX and D-
M-EXOs for 48 h. The DOX and D-M-EXOs groups both showed significantly
increased Caspase-3 and an obvious decrease of Bcl-2 compared to the control group
(Figure 4E). However, the half-maximal inhibitory concentrations (IC50) of D-M-
EXOs on H22 cells and 4T1 cells were ~0.36 μg/mL and ~0.38 μg/mL, slightly higher
than that of DOX (~0.29 μg/mL and ~0.35μg/mL) (Figure 4F and 4G). These
unsatisfactory results may be due to the incomplete and delayed release of DOX from
D-M-EXOs. Although M-EXOs didn't enhance the tumor cell inhibition effect of
DOX, they could improve the in vivo performance of drugs.


Figure 4. The drug loading and tumor cell inhibition. (A) Absorption spectra of D-M-EXOs, with inset showing the image of D-M-EXOs. Significance level is shown as nsp>0.05. (B) Release profiles of DOX from D-M-EXOs. (C) Intracellular distribution of DOX and D-M-EXOs in H22 cells and the bar is 20 μm. (D) Intracellular distribution of DOX and D-M-EXOs in 4T1 cells and the bar is 20 μm. (E) Western blot analysis of Bcl-2 and Caspase-3 protein expression in H22 and 4T1 cells after treatment with DOX and D-M-EXOs. Cell cytoskeleton protein (β-Actin) was used as internal controls. (F) Cell viability of H22 cells exposed to different concentrations of DOX and D-M-EXOs. (G) Cell viability of 4T1 cells exposed to different concentrations of DOX and D-M-EXOs.In vivo bio-distribution
The in vivo bio-distribution of D-M-EXOs in tumor-bearing mice was tested. As
shown in Figure 5A and 5B, the fluorescence signal of D-M-EXOs is observed at
tumor sites. Furthermore, the fluorescence intensity in the tumor was higher than that
observed in other tissues (heart, spleen, lung, and kidney) except for the liver. The
quantitative test result also proved the high accumulation of D-M-EXOs in tumor and
liver (Figure 5C). The accumulation of D-M-EXOs in the tumor may be because of
the innate passive-targeting ability of blood TfR+ exosomes. In addition, the
fluorescence intensity of D-M-EXOs in the liver was much higher, implying their
metabolism clearance was mainly through the liver, which was consistent with other
researches [29,35]. It should be noted that the fluorescence excitation wavelength was
selected as 670 nm for the detection of Cy 5.5. However, the fluorescence signal of
DOX cannot be excited under this condition. Therefore, no fluorescence signal was
observed in the DOX group in the heart and liver, yet this didn’t necessarily mean that
DOX didn’t distribute in the heart and liver.
M-EXOs changed the bio-distribution of DOX. As shown in Figure 5D, when
compared with free DOX, D-M-EXOs could enhance the concentration of DOX in the
tumor, potentially improving the tumor suppression efficiency. Furthermore, D-M-
EXOs reduced the amount of DOX in the heart and liver. This was facilitated to
diminish the side effects of DOX. The fluorescence signal of DOX from the D-M-
EXOs in the tumor section was much stronger than that of free DOX further
indicating that D-M-EXOs improved the tumor-targeting efficiency of DOX (Figure
5E).

Figure 5. In vivo bio-distribution of D-M-EXOs. (A) Noninvasive NIRF imaging of Cy5.5-labeled D-M-EXOs in Kunming mice after 24 h intravenous injection. (B) Representative ex vivo NIRF optical images of tumor and major organs. 1: heart; 2: liver; 3: spleen; 4: lung; 5: kidney; 6: tumor. (C) Radiant efficiency of Cy5.5-labeled D-M-EXOs in tumors and major organs. (D) Levels of DOX in tumors and major organs. (E) Accumulation of FITC-labeled D-M-EXOs in tumor section was evaluated using fluorescence microscopy, and the bar is 200 μm. Significance levels are shown as nsp>0.05, *p<0.05, **p<0.01, and ****p<0.001. Cardiotoxicity and hepatotoxicity
To verify whether D-M-EXOs indeed reduced the side effects of DOX, their
cardiotoxicity and hepatotoxicity were tested. The serum levels of alanine
aminotransferase (ALT), aspartate aminotransferase (AST), and alkaline phosphatase
(ALP) were respectively measured (Figure 6A). Compared with free DOX, D-M-
EXOs didn’t obviously induce the expression of ALT, AST, and ALP. In addition, the
serum levels of creatine kinase (CK), creatine kinase-MB (CK), and creatine kinase
(LDH) in the D-M-EXOs group were much lower than that in the free DOX group
(Figure 6B). The serum levels of these factors reflected the function of the liver and
heart. The normal expression of these factors indicated that D-M-EXOs showed mild
cardiotoxicity and hepatotoxicity. The results of the histological sections of liver and
heart stained with H&E (Figure 6C) further proved this conclusion. In addition, the
histological sections of other main organs (spleen, lung, and kidney) stained with
H&E were also examined (Figure S6). There was no obvious toxicity of DOX in these
organs. This may be because the accumulation amount of free DOX in these organs
was low and D-M-EXOs can control the release of DOX.

Figure 6. The cardiotoxicity and hepatotoxicity of D-M-EXOs. (A) Effects of D-M-EXOs on serum levels of alanine aminotransferase (ALT), aspartate aminotransferase (AST) and alkaline phosphatase (ALP). (B) Effects of D-M-EXOs on serum levels of creatine kinase (CK), creatine kinase-MB (CK) and creatine kinase (LDH). (C) Histological sections of liver and heart stained with H&E, and the bar is 200 μm. Significance levels are shown as nsp>0.05, *p<0.05, ***p<0.005 and ****p<0.001. Tumor suppression by D-M-EXOs
The tumor inhibition effects of D-M-EXOs on H22-bearing mice were
investigated. Mice were injected intravenously with free DOX and D-M-EXOs on
days 7, 10, 13, 16, 19, 22, and 25. To examine the kinetics of tumor growth, tumor
volume was monitored using a caliper before each injection and calculated as [(length
× width2)/2]. The tumor volumes of mice treated with PBS increased rapidly within
six days (Figure 7A). In contrast, DOX could inhibit the tumor growth to some extent
and the tumor volume of mice in the free DOX group was obviously smaller than that

in the control group. D-M-EXOs showed a stronger ability to inhibit tumor growth
compared with DOX. This result indicated the enhanced bioavailability of DOX as a
result of the passive targeting ability of blood TfR+ exosomes. The tumor masses
harvested from the mice on day 25 were ~3.12 g, ~1.35 g, and ~0.67 g in mice treated
with PBS, DOX, and D-M-EXOs, respectively (Figure 7B). We also examined the
expression levels of Caspase-3 and Bcl-2 in tumor tissues harvested from these mice
by using immunohistochemistry analyses (Figure 7C). D-M-EXOs could dramatically
inhibit tumor growth and up-regulate apoptosis in H22 cells by decreasing Bcl-2
expression and increasing Caspase-3 expression. The fact that D-M-EXOs could
effectively trigger the apoptosis of the tumor cells was also confirmed by the direct
observation of the slices stained with H&E (Figure 7D) and TUNEL (Figure 7E),
respectively. The effective inhibition of tumor growth indicated the feasibility of
applying the blood TfR+ exosomes-based drug delivery system.
Figure 7. Efficacy of D-M-EXOs for H22 subcutaneous tumor therapy. (A) Growth evaluation of H22 subcutaneous tumor in Kunming mice after sample administration; tumor volume was examined every three days for 18 consecutive days. (B) The average mass of the obtained tumor tissues. (C) Immunohistochemistry analyses of the expression of Caspase-3 and Bcl-2 in each group, nuclei are stained blue, and the proteins are stained brown. The bar is 200 μm. (D) H&E staining and (E) TUNEL analysis of the tumor tissues from the mice in each treatment group. In TUNEL staining, normal cell nuclei are stained blue and apoptotic cell nuclei are stained red.

Significance levels are shown as *p<0.05, **p<0.01, and ****p<0.001.To further confirm the therapeutic effect, the in vivo tumor inhibition effects of
D-M-EXOs on 4T1-bearing mice were investigated. The tumor volumes of mice
treated with PBS increased rapidly within nine days (Figure 8A). The tumor volume
of mice in the free DOX group was obviously smaller than that in the control group
indicating the tumor inhibition efficiency of DOX, while D-M-EXOs showed a
stronger ability to inhibit tumor growth compared with DOX. The tumor masses
harvested from the mice on day 25 were ~3.15 g, ~1.58 g, and ~0.8 g in mice treated
with PBS, DOX, and D-M-EXOs, respectively (Figure 8B). Figure 8C was the picture
of 4T1 tumor tissues obtained from euthanized mice. The results of
immunohistochemistry analyses (Figure 8D), H&E (Figure 8E), and TUNEL (Figure
8F) further proved the effective inhibition of tumor growth by D-M-EXOs.
Figure 8. Efficacy of D-M-EXOs for 4T1 subcutaneous tumor therapy. (A) Growth evaluation of 4T1 subcutaneous tumor in Kunming mice after sample administration; tumor volume was examined every three days for 18 consecutive days. (B) The average mass of the obtained tumor tissues. (C) 4T1 tumor tissues obtained from euthanized mice 18 days after sample administration. (D) Immunohistochemistry analyses of the expression of Caspase-3 and Bcl-2 in each group, nuclei are stained blue, and the proteins are stained brown. The scale bar is 200 μm. (E) H&E staining and (F) TUNEL analysis of the tumor tissues from the mice in each treatment group. In TUNEL staining, normal cell nuclei are stained blue and apoptotic cell nuclei are stained red. The scale bar is 200 μm. Significance levels are shown as *p<0.05 and ****p<0.001.
Discussion
Here we exploited a kind of pH-responsive method for the separation of blood
TfR+ exosomes. In this method, the pH of reaction solutions changed from 7.4 to 5.0
and again to 7.4. In our opinion, the pH change couldn’t cause serious damage to
exosomes because they went through a similar pH change during their formation
process. The inward budding of endosomal membranes led to the accumulation of
intraluminal vesicles (ILVs) in large multi-vesicular bodies (MVBs, pH 5.0).
Intracellular MVBs can either traffic to lysosomes where they are degraded or to the
cell membrane to release ILVs into the extracellular space (pH 7.4). ILVs released
into the extracellular space were denoted as “exosomes” [36]. Therefore, the
separated blood TfR+ exosomes could effectively maintain their structural and
functional integrity.
SMNC-EXOs, actually, could be directly applied to drug delivery since the
labeled SPMNs had little influence on blood TfR+ exosomes [37]. However, the
potential cumulative toxicity of SPMNs would limit their long-term clinical
application. Blood TfR+ exosomes separated by the pH-responsive SMNC-based
method were natural nanocarriers without any modification, avoiding the potential
side effects during long-term application. Recently, cells membrane was often used as
a coating to shield the surfaces of nanoparticles, such as gold nanoparticles [38],
silicon nanoparticles [39], polymeric nanoparticles [40], metal-organic framework
nanoparticles [41], and magnetic nanoparticles [42], for enhancing their
biocompatibility. Therefore, the high bio-safety of blood TfR+ exosomes was
foreseeable because of the similar structure and composition between exosomes
membrane and cells membrane. In addition, the successful in vivo drug delivery using
nanoparticles that were coated with blood cells membrane implied the feasibility of
blood TfR+ exosome-based drug delivery. Furthermore, blood cells membrane needed
to be extruded during the coating process [43]. The membrane structure of blood
TfR+ exosomes was potentially more complete than that of blood cells membrane-
coated nanoparticles, which might be more conducive to the in vivo application of

blood TfR+ exosomes. All in all, the high bio-safety of blood TfR+ exosomes is their
inherent advantage compared with synthetic nanocarriers.
In some respects, however, the performance of blood TfR+ exosomes is still
insufficient when compared to synthetic nanocarriers. As an example, the drug
loading capacity of blood TfR+ exosomes was moderate, and some artificial
nanoparticles had a better performance. This might because of the difference in the
drug loading mode. Current nanoparticles often utilized their large volume and
hydrophobic cores to load drugs [44], but it was difficult to access the interior of
blood TfR+ exosomes due to their membrane structure. We utilized the hydrophobic
interaction between DOX and the lipid bilayer of blood TfR+ exosomes to form D-M-
EXOs. Therefore, taking advantage of the internal space of exosomes was a feasible
way to further enhance their drug loading capacity.
In addition, the uniformity of blood TfR+ exosomes was poorer than that of
synthetic nanoparticles. The size distribution of blood TfR+ exosomes was much
broader. More importantly, blood TfR+ exosomes may derive from different cell
types. These exosomes may have different properties. For example, chlorpromazine
didn’t inhibit the cellular uptake of M-EXOs completely. This may be because the
cellular uptake pathway of blood TfR+ exosomes derived from varied parent cells was
different. Furthermore, even the same exosomes may possess two or more cellular
uptake pathways [45].
This work was a continuation of our previous research [37], wherein the focus
was on the formation of SMNC-EXOs to simultaneously realize the separation,
purification, and tumor targeting of exosomes. In contrast, here, the dissociation of
SMNC-EXOs was our purpose, since the lesser modification of exosomes betters their
long-term application. How to realize the separation of ligands labeled on SPMNs and
receptors expressed on exosomes was the focus. Fortunately, it had been proved that
the disaggregation of Tf and TfR was responsive to pH, and blood TfR+ exosomes
were widespread in the blood. Therefore, we successfully separated exosomes from
blood using a pH-responsive method for the first time. We believed that this study

could inspire researchers to exploit new methods for the precise separation of
exosomes. For example, other stimulating factors, such as temperature and ion
strength, could lead to the disaggregation of ligands and receptors realizing the
separation of exosomes.
Conclusion
In summary, taking advantage of the pH-responsive binding and disaggregation
characteristics of transferrin and transferrin receptor, the SMNC-based method can
precisely separate blood TfR+ exosomes and realize their mild release from
superparamagnetic nanoparticles. The resulting blood TfR+ exosomes show excellent
bio-safety and enable the efficient delivery of chemotherapeutics to the tumor. This is
the first time that their structural features were taken advantage of to realize the
precise and mild separation of blood exosomes. Furthermore, the investigation of the
drug delivery potential of blood exosomes facilitates the clinical translation of
exosome-based drug delivery systems.
Abbreviations
DOX: doxorubicin; Tf: transferrin; TfR: transferrin receptor; SPMNs:
superparamagnetic nanoparticles; SMNC-EXOs: superparamagnetic nanoparticles-
exosome complexes; M-EXOs: blood TfR+ exosomes separated by SMNC-based
method; UC-EXOs: blood exosomes separated by ultracentrifugation; D-M-EXOs:
doxorubicin-loaded blood TfR+ exosomes.
Acknowledgements
This work was supported by grants from the National Nature Science Foundation
of China (Grant Nos. 51673146 and 31430041), the Nature Science Foundation of
Shandong Province (Grant Nos. ZR2019BC020) and Medical and Health Technology
Development Program of Shandong Province (2017WSB25010).
Competing Interests
The authors have declared that no competing interest exists.

Reference
1. Batrakova EV, Kim MS. Using exosomes, naturally-equipped nanocarriers, for
drug delivery. J Control Release. 2015; 219: 396-405.
2. He C, Zheng S, Luo Y, Wang B. Exosome theranostics: biology and translational
medicine. Theranostics. 2018; 8: 237-55.
3. Alvarez-Erviti L, Seow Y, Yin H, Betts C, Lakhal S, Wood MJ. Delivery of
siRNA to the mouse brain by systemic injection of targeted exosomes. Nat
Biotechnol. 2011; 29: 341-5.
4. Tian Y, Li S, Song J, Ji T, Zhu M, Anderson GJ, et al. A doxorubicin delivery
platform using engineered natural membrane vesicle exosomes for targeted
tumor therapy. Biomaterials. 2014; 35: 2383-90.
5. Wang P, Wang H, Huang Q, Peng C, Yao L, Chen H, et al. Exosomes from M1-
Polarized Macrophages Enhance Paclitaxel Antitumor Activity by Activating
Macrophages-Mediated Inflammation. Theranostics. 2019; 9: 1714-27.
6. Liu Y, Bai L, Guo K, Jia Y, Zhang K, Liu Q, et al. Focused ultrasound-
augmented targeting delivery of nanosonosensitizers from homogenous
exosomes for enhanced sonodynamic cancer therapy. Theranostics. 2019; 9:
5261-81.
7. Bellavia D, Raimondo S, Calabrese G, Forte S, Cristaldi M, Patinella A, et al.
Interleukin 3-receptor targeted exosomes inhibit in vitro and in vivo Chronic
Myelogenous Leukemia cell growth. Theranostics. 2017; 7: 1333-45.
8. Yim N, Ryu SW, Choi K, Lee KR, Lee S, Choi H, et al. Exosome engineering for
efficient intracellular delivery of soluble proteins using optically reversible
protein-protein interaction module. Nat Commun. 2016; 7: 12277.
9. Zhu L, Kalimuthu S, Gangadaran P, Oh JM, Lee HW, Baek SH, et al. Exosomes
derived from natural killer cells exert therapeutic effect in melanoma.
Theranostics. 2017; 7: 2732-45.
10. Ohno SI, Takanashi M, Sudo K, Ueda S, Ishikawa A, Matsuyama N, et al.
Systemically injected exosomes targeted to EGFR deliver antitumor microRNA

to breast cancer cells. Mol Ther. 2013; 21: 185-91.
11. Kim SM, Yang Y, Oh SJ, Hong Y, Seo M, Jang M. Cancer-derived exosomes as a
delivery platform of CRISPR/Cas9 confer cancer cell tropism-dependent
targeting. J Control Release. 2017; 266: 8-16.
12. Lin Y, Wu J, Gu W, Huang Y, Tong Z, Huang L, et al. Exosome-liposome hybrid
nanoparticles deliver CRISPR/Cas9 system in MSCs. Adv Sci. 2018; 5: 1700611.
13. Jang SC, Kim OY, Yoon CM, Choi DS, Roh TY, Park J, et al. Bioinspired
exosome-mimetic nanovesicles for targeted delivery of chemotherapeutics to
malignant tumors. ACS Nano. 2013; 7: 7698-710.
14. Syn N, Wang L, Sethi G, Thiery JP, Goh BC. Exosome-mediated metastasis:
from epithelial-mesenchymal transition to escape from immunosurveillance.
Trends Pharmacol Sci. 2016; 37: 606-17.
15. Kurywchak P, Tavormina J, Kalluri R. The emerging roles of exosomes in the
modulation of immune responses in cancer. Genome Med. 2018; 10: 23.
16. Usman WM, Pham TC, Kwok YY, Vu LT, Ma V, Peng B, et al. Efficient RNA
drug delivery using red blood cell extracellular vesicles. Nat Commun. 2018; 9:
2359.
17. Blanc L, De Gassart A, Géminard C, Bette-Bobillo P, Vidal M. Exosome release
by reticulocytes-an integral part of the red blood cell differentiation system.
Blood Cells Mol Dis. 2005; 35: 21-6.
18. Li P, Kaslan M, Lee SH, Yao J, Gao Z. Progress in exosome isolation techniques.
Theranostics. 2017; 7: 789-804.
19. Petersen KE, Manangon E, Hood JL, Wickline SA, Fernandez DP, Johnson WP,
et al. A review of exosome separation techniques and characterization of B16-
F10 mouse melanoma exosomes with AF4-UV-MALS-DLS-TEM. Anal Bioanal
Chem. 2014; 406: 7855-66.
20. Yamada T, Inoshima Y, Matsuda T, Ishiguro N. Comparison of methods for
isolating exosomes from bovine milk. J Vet Med Sci. 2012; 74: 1523-5.
21. Liu C, Guo J, Tian F, Yang N, Yan F, Ding Y, et al. Field-free isolation of
exosomes from extracellular vesicles by microfluidic viscoelastic flows. ACS
Nano. 2017; 11: 6968-76.
22. Tauro BJ, Greening DW, Mathias RA, Ji H, Mathivanan S, Scott AM, et al.
Comparison of ultracentrifugation, density gradient separation, and
immunoaffinity capture methods for isolating human colon cancer cell line
LIM1863-derived exosomes. Methods. 2012; 56: 293-304.
23. Shao H, Chung J, Lee K, Balaj L, Min C, Carter BS, et al. Chip-based analysis of
exosomal mRNA mediating drug resistance in glioblastoma. Nat Commun. 2015;
6: 6999.
24. Cheng Y, Zeng Q, Han Q, Xia W. Effect of pH, temperature and freezing-
thawing on quantity changes and cellular uptake of exosomes. Protein Cell.
2019; 10: 295-9.
25. Zhang J, Sun Y, Dong H, Zhang X, Wang W, Chen Z. An electrochemical non-
enzymatic immunosensor for ultrasensitive detection of microcystin-LR using
carbon nanofibers as the matrix. Sens Actuators B Chem. 2016; 233: 624-32.
26. Clayton A, Court J, Navabi H, Adams M, Mason MD, Hobot JA, et al. Analysis
of antigen presenting cell derived exosomes, based on immuno-magnetic
isolation and flow cytometry. J Immunol Methods. 2001; 247: 163-74.
27. Dautry-Varsat A, Ciechanover A, Lodish HF. pH and the recycling of transferrin
during receptor-mediated endocytosis. Proc Natl Acad Sci USA. 1983; 80: 2258-
62.
28. Kowal J, Tkach M, Théry C. Biogenesis and secretion of exosomes. Curr Opin
Cell Biol. 2014; 29: 116-25.
29. Qu M, Lin Q, Huang L, Fu Y, Wang L, He S, et al. Dopamine-loaded blood
exosomes targeted to brain for better treatment of Parkinson's disease. J Control
Release. 2018; 287: 156-66.
30. Shen Z, Liu T, Li Y, Lau J, Yang Z, Fan W, et al. Fenton-reaction-acceleratable
magnetic nanoparticles for ferroptosis therapy of orthotopic brain tumors. ACS
Nano. 2018; 12: 11355-65.
31. Blanco E, Shen H, Ferrari M. Principles of nanoparticle design for overcoming
biological barriers to drug delivery. Nat Biotechnol. 2015; 33: 941-51.
32. Tian T, Zhu YL, Zhou YY, Liang GF, Wang YY, Hu FH, et al. Exosome uptake
through clathrin-mediated endocytosis and macropinocytosis and mediating
miR-21 delivery. J Biol Chem. 2014; 289: 22258-67.
33. Gratton SE, Ropp PA, Pohlhaus PD, Luft JC, Madden VJ, Napier ME, et al. The
effect of particle design on cellular internalization pathways. Proc Natl Acad Sci
USA. 2008; 105: 11613-8.
34. Wei X, Wang Y, Xiong X, Guo X, Zhang L, Zhang X, et al. Codelivery of a π-π
stacked dual anticancer drug combination with nanocarriers for overcoming
multidrug resistance and tumor metastasis. Adv Funct Mater. 2016; 26: 8266-80.
35. Wang Ql, Zhuang X, Sriwastva MK, Mu J, Teng Y, Deng Z, et al. Blood
exosomes regulate the tissue distribution of grapefruit-derived nanovector via
CD36 and IGFR1 pathways. Theranostics. 2018; 8: 4912-24.
36. Théry C, Zitvogel L, Amigorena S. Exosomes: composition, biogenesis and
function. Nat Rev Immunol. 2002; 2: 569-79.
37. Qi H, Liu C, Long L, Ren Y, Zhang S, Chang X, et al. Blood exosomes endowed
with magnetic and targeting properties for cancer therapy. ACS Nano. 2016; 10:
3323-33.
38. Gao W, Hu CMJ, Fang RH, Luk BT, Su J, Zhang L. Surface functionalization of
gold nanoparticles with red blood cell membranes. Adv Mater. 2013; 25: 3549-
53.
39. Parodi A, Quattrocchi N, Van De Ven AL, Chiappini C, Evangelopoulos M,
Martinez JO, et al. Synthetic nanoparticles functionalized with biomimetic
leukocyte membranes possess cell-like functions. Nat Nanotechnol. 2013; 8: 61-
8.
40. Hu CMJ, Zhang L, Aryal S, Cheung C, Fang RH, Zhang L. Erythrocyte
membrane-camouflaged polymeric nanoparticles as a biomimetic delivery
platform. Proc Natl Acad Sci USA. 2011; 108: 10980-5.
41. Min H, Wang J, Qi Y, Zhang Y, Han X, Xu Y, et al. Biomimetic Metal-Organic
Framework Nanoparticles for Cooperative Combination of Antiangiogenesis and
Photodynamic Therapy for Enhanced Efficacy. Adv Mater. 2019; 31: 1808200.

42. Ren X, Zheng R, Fang X, Wang X, Zhang X, Yang W, et al. Red blood cell
membrane camouflaged magnetic nanoclusters for imaging-guided photothermal
therapy. Biomaterials. 2016; 92: 13-24.
43. Rao L, Bu LL, Xu JH, Cai B, Yu GT, Yu X, et al. Red blood cell membrane as a
biomimetic nanocoating for prolonged circulation time and reduced accelerated
blood clearance. Small. 2015; 11: 6225-36.
44. Xing H, Hwang K, Lu Y. Recent developments of liposomes as nanocarriers for
theranostic applications. Theranostics. 2016; 6: 1336-52.
45. Escrevente C, Keller S, Altevogt P, Costa J. Interaction and uptake of exosomes
by ovarian cancer cells. BMC Cancer. 2011; 11: 108.