Embed Size (px)
Citation preview

Dear Editor,
Please find enclosed our submission entitled “Assessment of the Macroeconomic Effects of Integration in
North America from 1995 to 2009” by María Victoria Román and Iñaki Arto. This manuscript has not been
previously published, in whole or in part, and it is not under consideration by any other journal. All authors
are aware of, and accept the responsibility for, the manuscript.
The number of preferential trade agreements in the world has continuously increased in the last 70 years.
They have become a key instrument of trade policy that aims to promote regional integration and growth.
Several studies have dealt with the estimation of the cost and benefits associated to these agreements, but
most of them rely on numerous assumptions, such as causality relationships.
In this paper we propose an alternative method that enables us to produce ex-post estimates of the economic
impact of one particular trade agreement, i.e. the NAFTA. This method consist on using a state-of-the art
global multi-regional input-output (GMRIO) database to quantify the realized effect of observed changes in
trade patterns between the signatory countries (Canada, Mexico and US) in the period of implementation of
the NAFTA (1995-2009). Effects are estimated in terms of number of jobs and income, and at the regional,
country and industry level.
Results enable us to extract conclusions about the economic consequences of changes in regional trade
patterns. For example, the increased integration between US and Mexico produced positive effects on the
level of employment in Mexico. Our analysis also provides evidence on the influence of each country over the
rest. In this case, results make clear the significant influence of changes in US trade patterns over its own
economy and in its trade partners.
Our approach can be useful to inform trade policies. This paper also proves that GMRIO models have great
potential to contribute to multiple discussions on international trade policy.
We look forward to receiving your final feedback. Yours sincerely,
The authors
1
Maria Victoria RománJRC-SevilleEdificio Expo, Calle Inca Garcilaso, 3, 41092 Sevilla, Spain.Tel: +34 954 48 83 18 E-mail: [email protected]

Authors’ names and affiliation
María Victoria Román (a) and Iñaki Arto (b).
(a) Basque Centre for Climate Change, BC3. Sede Building 1-1, Scientific Campus of the
University of the Basque Country, Barrio Sarriena s/n, 48940 Leioa, Spain. Tel: +34 944
014 690, [email protected]. Corresponding author
(b) Basque Centre for Climate Change, BC3, Sede Building 1-1, Scientific Campus of the
University of the Basque Country, Barrio Sarriena s/n, 48940 Leioa, Spain. Tel. +34 94 401
46 90 ext. 142. E-mail: [email protected]
Title. Assessment of the Macroeconomic Effects of Integration in North America from
1995 to 2009.
Running title. North America´s integration effects 1995-2009
2

ABSTRACT This paper aims at isolating the employment and income effects of changes
in trade patterns occurred during the period of implementation of NAFTA in North
America. Using a multiregional input-output model, with data from the World Input-Output
Database, we obtain that while effects are positive for Mexico and Canada, they are
negative for the US. Capital owners profit more than the labor force, and most affected
workers are medium-skilled ones. These results are associated with the outsourcing of
certain stages of the production of manufacturing industries, and reflect the global trend of
a decreasing labor share of income.
Keywords: Global Multiregional Input-Output model, NAFTA, economic integration,
international trade
JEL codes: F14, F15, F16, R15
1. Introduction
International agreements related to trade have been increasing in the last decades. In 2016
the number of signed and in force preferential trade agreements in the world exceeded 250
(World Bank, 2010). For this reason it is interesting to learn from previous experiences. In
this exercise we aim to assess the effects of changes in the regional trade patterns
experienced after the adoption of the North American Free Trade Agreement (NAFTA).
This case is especially interesting due to its big size in terms of area, population and GDP,
and because it comprises countries with very different productive specializations
participating in cross-border production chains (Caliendo & Parro, 2014). Moreover, the
debate about the effects of NAFTA is again1 highly topical and its supposed negatives
1 NAFTA was controversial since the beginning with proponents arguing that it would create jobs and reduce inequality in the region, while opponents warning about the loss of jobs that movement of companies from the US to Mexico would generate in the US (Villarreal and Fergusson 2017).
3

effects are of major concern for the Trump administration (e.g. in September, 2015
President Trump declared in an interview that NAFTA was "the single worst trade deal
ever approved in [the United States]" and proposed its renegotiation2).
In the last decades of the past century, Canada, United States (US) and Mexico promoted
trade openness within the region in the search of increased integration and convergence. In
October 1988 Canada and the US signed the Free Trade Agreement (FTA or CUSTA). This
agreement eliminated restrictions to trade and foreign investment over a period of 10 years
(Ferrarini, 2011). In 1994 the regional integration process culminated with the entry into
force of NAFTA. This accord implied the progressive suppression of tariff and non-tariff
barriers and of barriers to foreign investment in the region within a period of fifteen years
(Smith et al., 2002). Furthermore, it included complicated rules of origin that conditioned
tariff exemptions to a minimum content of regional value added in exports (Krueger, 2000).
For Mexico this was the result of decades of reforms towards trade openness starting
already in the early 1960s. Probably, the most relevant and known of the programs
launched to stimulate trade with the US was the 'maquiladora' program. This program was
intended to create employment by attracting US labor-intensive manufacturers. To that end,
the construction of industrial parks was subsidized and US companies were allowed to own
and operate factories in Mexico, and to import equipment and intermediate goods duty free
with the condition that the products were exported. Maquiladoras were usually assembly
plants of the apparel, automobile and electronics industries, whose activity consisted of
importing pieces, processing and exporting them. The US government also conceded tax
2 https://www.cbsnews.com/news/is-donald-trump-right-to-call-nafta-a-disaster/
4
exceptions to companies investing in extraterritorial assembly of domestically produced
pieces (Biles, 2004). 3
There are numerous studies about the effects of the trade liberalization between NAFTA
partners. Gruben (2001), Hanson (2004), Truett y Truett (2007), Chiquiar (2008), Airola
(2008), Prina (2015) and Waldkirch (2010) carry out econometric studies on the influence
of NAFTA on employment, value added, salaries and productivity in Mexico. Regarding
effects on the Canadian economy, we can mention the studies, also econometric, by Gaston
and Trefler (1997), Beaulieu (2000) and Zhang et al. (2015) on the effect of the FTA on
employment, productivity and salaries. Among the studies on the US it is worth mentioning
those by Hinojosa-Ojeda (2000), Yoskowitz et al. (2002), Hakobyan and McLaren (2016),
Coughlin and Wall (2003) and Elsby et al. (2013). These studies analyze the effects of the
FTA and NAFTA on US trade, employment and income with partial equilibrium and
econometric models. Romalis (2007) and Caliendo and Parro (2014) study with general
equilibrium and econometric models the effects of NAFTA on trade, prices and welfare in
the three countries.
Main findings of these antecedents about the effect of trade liberalization in the region are
summarized next. On employment no significant effects are found for Mexico (specifically
in maquiladoras, according to Gruben 2001), while for Canada and US effects are negative,
especially for low skilled workers (Gaston and Trefler 1997, Beaulieu 2000, Zhang et al.
2015, and Yoskowitz et al. 2002). Regarding value added, no significant effects have been
found neither for the maquiladoras (Truett and Truett 2007), nor for the skill premium or
3
5

wages in Mexico (Airola 2008, Prina 2015 and Waldkirch 2010)4, nor for wages in Canada
(Gaston and Trefler 1997 and Beaulieu 2000). Negative effects have been found however
for the earnings of low skilled workers in the US (Hakobyan and McLaren 2016), for the
US labor share (Elsby et al. 2013) and also on per capita income in the US side of the US-
Mexico border region (Yoskowitz et al. 2002). A Congressional Research Service report
(Villarreal and Fergusson 2017) states that the economic impacts of NAFTA on the US
economy in terms of GDP and employment were modest. Regarding other variables
analyzed, NAFTA might have provided benefits in terms of long-term productivity for
Canada (Trefler 2004), welfare increases in Mexico and the US (Caliendo and Parro 2014,
Burfisher et al. 2001) and inequality and poverty reduction in Mexico (Hanson 2004).
Cervantes-Martínez and Villaseñor-Becerra (2016), and Portella-Carbó (2016) represent the
closest methodological antecedents of our work. In the former study, the intra-NAFTA
trade flows in terms of value added (distinguishing capital and labor income per skill level)
and employment are estimated for the period 1995-2009 using a multiregional input-output
(MRIO) model with information from the World Input-Output Database (WIOD). The
latter study consists of a decomposition analysis of changes in employment in several
countries (including the US) where the regional integration is one of the factors considered.
They use a global MRIO supermultiplier model and the WIOD as the information source.
Our study adds to this strand of literature that has incorporated to the study of the effects of
trade what Timmer et al. (2018) called "second generation" trade statistics: those which
using input-output tables enable to distinguish the domestic and foreign part of each
4 However, when looking specifically at more exposed regions in Mexico an increase in wages and a decrease in the skill premium is found by Chiquiar (2008).
6
country's exports. This is the main advantage compared to analyses based on gross trade
balances, which ignoring the origin of value added in exports can result in trade policies
that harm domestic firms that rely on imported inputs or export intermediate goods that are
later incorporated in imports.
The objective of this paper is to quantify the contribution of changes in intra-NAFTA trade
patterns (i.e. regional integration) to the evolution of employment and value added of
NAFTA members between 1995 and 2009. In this case the MRIO framework is used to
answer the following question: What would the level of employment and value added have
been in Canada, Mexico and the US in 2009 if trade between them had remained as it was
in 1995?
This methodological framework enables us to differentiate the contribution of changes in
intra-NAFTA trade structure to the evolution of observed macroeconomic variables (ceteris
paribus) without requiring causality relationships affecting this changes in trade patterns,
such as elimination of tariffs, differences in the prices of production factors, etc.5
Accordingly, while the results of the analysis should not be interpreted as the impact of the
implementation of NAFTA, they can be used to better understand the employment and
GDP effects of the changes in the trade structure of the region, which are among the main
sources of controversy of the agreement (e.g. on September 20th 2018, President Trump
declared “NAFTA was a disaster […] We lost millions of jobs”)6.
5 While MRIO methods are valid to answer the research question, it is important to have in mind the assumptions underlying these models such as homogeneity of outputs, sectoral aggregation, linearity of technological coefficients and missing interactions between prices (Murray and Lenzen, 2013). 6 Previous studies (e.g. Waldkirch 2010 and Yoskowitz et al. 2002) also address NAFTA indirectly through the effect of changes in specific variables (such as FDI or trade) during the time period of the implementation of NAFTA. In the same fashion, we do not aim to focus on an observed variable (intra-NAFTA trade) whose evolution is probably influenced by NAFTA. Besides, this assumption that intra-NAFTA trade changes are driven (at least partially) by NAFTA is supported by previous evidence (i.e.
7
Like in Portella-Carbó (2016), ours is an ex-post accounting exercise in which the reasons
behind the changes are not modeled but taken as exogenous. Our approach enables us to
distinguish which part of the value-added effect goes to the capital owners and which part
goes to the labor force (differentiating skill levels). We obtain the aggregate and separate
effects of changes in trade of final and intermediate goods, and results are presented at
regional, country and industry level. This enables us to identify the industries in which most
relevant effects are concentrated.
The rest of the paper is structured as follows: Section 2 explains the methodology, Section
3 shows the results, which are later discussed in Section 4, and, finally, Section 5
concludes.
2. Methodology
Given the increasing globalization of productive processes, multiregional input-output
tables at global level are increasingly used in the global value chains literature (Johnson &
Noguera, 2012; Koopman et al., 2012, 2014; Los et al., 2015; Timmer et al., 2014). These
tables are especially configured to reflect the current interconnection between the world
economies. They contain information about the participation of different industries and
countries in the production process of each good and service. This enables to isolate a
specific change and trace its effect along the supply chain back to the industry and country
where the impact occurs.
In this case, the change in question is the trade structure between NAFTA members, and its
effects are measured in terms of employment and value added. To do this we use a similar
Caliendo and Parro 2014 and Romalis 2007 find causality between NAFTA and intra-NAFTA trade changes).
8

methodological approach to that employed in a previous paper (Markandya, et al., 2016).
That paper estimated the employment effect of the transition to renewable energy sources
in the European Union. To that end, the authors quantified the effect of the technological
change in the electricity supply industry. In this case, since the purpose is to disentangle the
effect of changes in regional trade, the procedure is slightly different, as detailed below.
The database used is the WIOD 2013 Release (Timmer et al., 2015), which contains MRIO
tables with 35 industries in 41 regions for the years 1995 to 2011, and satellite accounts
with several socio-economic indicators (i.e. socio-economic accounts). Amongst these
indicators are data on employment, value added, capital and labor compensation, and the
distribution of labor income by skill level (high, medium and low) which are used in this
exercise.
Since the aim of the paper is to analyze the change in the intra-NAFTA trade structure, we
have to isolate the main components of the NAFTA countries from the world MRIO table
in order to derive a symmetric MRIO table for the NAFTA region. This table describes (in
monetary terms) the flows of goods and services between each industry of the NAFTA
countries, the final demand of goods and services (including the demand of final products
by NAFTA countries and the exports to non-NAFTA countries) and the use of primary
inputs (imports from non-NAFTA countries, compensation of employees and operating
surplus). This table is directly derived from the world MRIO of WIOD by: 1) aggregating
the intermediate and final exports from NAFTA countries to the rest of the world in a
column vector that is part of the bloc of the final demand, 2) aggregating the intermediate
imports of NAFTA countries from the rest of the word in a vector that is part of the bloc of
the primary inputs, and 3) eliminating the trade flows between non-NAFTA countries and
9
the final imports of NAFTA countries from the rest of the word. Table 1 shows the
structure of the MRIO of the NAFTA region.7
Table 1. Multiregional Input-Output Table for NAFTA countries
Intermediate
consumptionFinal uses
Total
OutputCountries C M U C M U
Exports
to RoW
Intermediate
consumption
C ZCC ZCM ZCU yCC yCM yCU pC xC
M ZMC ZMM ZMU y MC y MM y MU pM xM
U ZUC ZUM ZUU yUC yUM yUU pU xU
Use of
imported
products
RoW (mC ) ' (mM ) ' (mU ) '
Compensation of
employees(lC ) ' (lM )' (lU ) '
Operating surplus (k C )' (k M ) ' (k U )'
Total supply ( xC ) ' ( xM ) ' ( xU ) '
Source: Own work. Abbreviations: Canada (C), Mexico (M), United States (U), Rest of the
World (RoW).
The MRIO table distinguishes seven components: the bloc of intermediate deliveries
between the three NAFTA countries represented by the (3×35 )× (3 × 35 ) matrix Z, the bloc 7 Bold-faced lower-case letters are used to indicate vectors, bold-faced capital letters indicate matrices, italic lower-case letters indicate scalars (including elements of a vector or matrix). Subscripts indicate industries and superscripts indicate countries. Vectors are columns by definition, row vectors are obtained by transposition, denoted by a prime (e.g. x ' ). Diagonal matrices are denoted by ❑(e.g. x).
10

of final demands of the NAFTA countries is represented by the(3 ×35 )×3 matrix Y , the
(3 ×35 )×1 vector p of final demand of the rest of the world outputs (i.e. exports to non-
NAFTA countries)8, the (3 ×35 )×1 vector x of total outputs, the (3 ×35 )×1 vector m of
imports from the rest of the world, the (3 ×35 )×1 vector l of labor compensation, and the
(3 ×35 )×1 vector k of capital compensation. The (3 ×35 )×1 vector of total value added w
can be defined as the sum the vectors of labor and capital compensation: w=l+k .
Additionally, the socio-economic accounts of WIOD also report data on employment by
country and sector, represented by the (3 ×35 )×1 vector of employment e. In partitioned
form, these matrices and vectors can be represented as,
Z=[ ZCC ZCM ZCU
ZMC ZMM ZMU
ZUC ZUM ZUU ] , Y =[Y CC Y CM Y CU
Y MC Y MM Y MU
Y UC Y UM Y UU ]x=( xC
xM
xU ) ,m=(mC
mM
mU ) , l=( lC
lM
lU ) , k=( kC
kM
kU ) ,l=( lC
lM
lU ) , w=( wC
wM
wU ) , e=(eC
eM
eU )
The relation between x, Z, Y and p is defined by the following accounting equation:
x=Z u(3 ×35)×1+Y u3×1+ p [1]
where u(3× 35) is the (3×35 )×1 summation vector with ones and u3 × 1 is the 3 ×1 summation
vector.
The input coefficients matrix is defined as A=Z ( x )−1. In partitioned form, we have
8 This vector is calculated as the sum of the intermediate and final exports from the NAFTA region to the 38 non-NAFTA countries of WIOD.
11

A=[ ACC ACM ACU
AMC AMM AMU
AUC AUM AUU ]where the element a ij
rs indicates the inputs of industry i and region r that are used in industry
j of region s to produce one unit of output. The matrix of intermediate deliveries of country
r can thus be expressed as A x and equation [1] now be written as the standard input-output
equation:
x=A x+Y u3 ×1+p [2]
For an arbitrary final demand (Y u3×1+ p¿, the solution to equation [2] is given by
x=L (Y u3×1+ p ) [3]
where L ≡ ( I−A )−1, is the Leontief inverse. That is
L ≡ ( I−A )−1=[ LCC LCM LCU
LMC LMM LMU
LUC LUM LUU ]where I is an identify matrix of the appropriate dimension. L contains the output
multipliers and the element lijrs represents the total (direct and indirect) output of industry i
in country r that is required to satisfy one unit of final demand for the goods produced by
industry j in country s.
The vector of employment coefficients is defined as c= ( x )−1 e and the vector of value
added coefficients as v=( x )−1 w. Accordingly, the vectors of employment and value added
12

can be expressed as e= c x and w= v x respectively, and from [3] we have that these two
vectors can be calculated as:
e= c L ( Y u3× 1+ p ) [4]
w= v L (Y u3 ×1+ p ) [5]
Next, we define the matrix of total technical coefficients B, whose elements b ijs=∑
raij
rs
indicate the inputs of industry i that are used by industry j of region s to produce one unit of
output (regardless of the NAFTA country of origin of the inputs).
The matrix of the intra-NAFTA trade structure of intermediate goods is defined as T , and
its elements t ijrs=z ij
rs /∑r
zijrs indicate for each industry j of country s the share of inputs that
are produced domestically (when r = s) or imported (when r ≠ s). This way the matrix of
technical coefficients can be expressed as A=T ° B (where ° indicates the element-by-
element product or Hadamard product).
Thus, the Leontief inverse can be expressed as
L ≡ ( I−A )−1=( I−T ° B )−1 [6]
We define the matrix of the regional (intra-NAFTA) final demand, D, whose element
d jt =∑
sy j
st indicates the final demand in country t of goods produced by industry j,
regardless of the NAFTA country of origin. In partitioned form,
D= [dC d M dU ]
13

The matrix of intra-NAFTA trade structure of final goods is defined as τ , and its element
τ jst= y j
st /∑s
y jst represents the fraction of final demand in country t for goods of industry j
imported from country s (when s ≠ t) or produced domestically (when s = t). In partitioned
form,
τ=[ τCC τCM τCU
τMC τMM τ MU
τUC τUM τUU ]Then, it follows that the final demand of NAFTA countries can be expressed as,
Y=τ ° D [7]
Using [6] and [7] we can re-write the expression for the calculation of the employment [4]
and value added [5] of the NAFTA region, for a specific year t, as follows,
e t=c t ( I−T t ° Bt )−1 ( τ t ° Dt u3 ×1+p t ) [8]
w t= v t ( I−T t ° Bt )−1 (τ t ° Dt u3 ×1+ pt ) [9]
Equation [8] ([9]) shows, for year t, the employment (value added) of each of the 35
industries of the 3 countries of the NAFTA region as a function of the employment (value
added) coefficients, the trade structure of intermediate goods of the NAFTA region, the
structure of intermediate inputs from the NAFTA region, the trade structure of intermediate
goods of the NAFTA region, the trade structure of final goods of the NAFTA region, the
total final demand of the NAFTA region, and the final exports of the NAFTA region to the
rest of the world.
14

The effect of changes in the trade structure (i.e. changes in T t and τ t) is obtained as the
difference between the actual employment and value added linked to the final demand of
NAFTA for 2009 (e09 and w09) and the hypothetical employment and value added of 2009
calculated with the trade structure of final and/or intermediate goods of the year 1995 (~e95
and ~w95 ) 9, with all the remaining factors constant (i.e. as in 2009):
e09−~e95=e09−c09 ( I−T 95° B09 )−1 (τ 95° D 09u3 ×1+ p09 ) [10]
w09−~w 95=w09−v09 ( I−T 95° B09 )−1 ( τ95° D09u3× 1+ p09 ) [11]
The share of impact on value added corresponding to capital is:
k 09−~k95=( w09−~w95 ) [ ( w09 )−1 k09 ] [12]
and the share of impact corresponding to labor is similarly obtained, using data on labor
remuneration in 2009. Likewise, the share of value-added impact corresponding to each
skill level is calculated using the vector of shares of labor remuneration by skill level of
2009.
Results
This section is divided into four subsections. First of all, a descriptive analysis of the
evolution of intra-NAFTA trade during the period of study is included. Next, the
9 Employment is measured as Number of persons engaged (thousands) (EMP variables in the socioeconomic accounts of WIOD, release 2013). Value added is measured in US dollars (million). We express the value added corresponding to the year 1995 in 2009 prices using the deflator of the total output used in WIOD to construct the MRIO tables at previous year prices. These deflators can therefore be derived by dividing, for each year, the total output by industry and country of the MRIO in current prices by that in the MRIO table at previous year price. Alternatively, these deflators can be calculated using the information on the deflators of the total output in national currencies of the socio-economic accounts of WIOD and the exchange rates used in WIOD to convert national currencies in to US dollars. The resulting yearly deflators for the time series 1995-2009 are then used to express the trade structure of 1995 at 2009 prices.
15

accumulated effects of changes in trade structure on employment and value added are
described at regional and country level. Next, results at industry level are used to identify
the most affected industries. Finally, the distribution of the value-added effect between
primary factors of production and by labor skill level (high, medium and low) is displayed.
2.1. Evolution of Regional Trade between 1995 and 2009
Since the entry into force of NAFTA, trade between the three members of this treaty has
increased notably. Table 2 depicts the increase in exports to the region between 1995 and
2009 as a percentage of the exports level of 1995, distinguishing between intermediate and
final goods. The most relevant increase occurs in Mexican exports of both intermediate and
final goods. With regards to the volume of bilateral trade in the region (also contained in
Table 2), the largest rise in relative terms is that of trade between Canada and Mexico,
which is due to the low initial level. The bilateral trade between Mexico and the US
duplicates in the period studied.
Table 2. Relative increases of exports to NAFTA members and bilateral trade (1995-2009)
Intermediate goods Final goods
Canadian exports to the region 49% 16%
Mexican exports to the region 107% 151%
US exports to the region 38% 60%
Bilateral trade Canada-Mexico 247% 437%
Bilateral trade US-Mexico 87% 134%
Bilateral trade US-Canada 35% 25%
Abbreviations: CAN (Canada), MEX (Mexico), US (United States). Source: WIOD.
16

As already mentioned, the purpose of this exercise is to quantify the impact of changes in
regional trade patterns. Figure 1 shows the change in the intra-regional trade structure (in
other words, the change in the geographic origin of purchases from the region) of Canada
(Figure 1a), Mexico (Figure 1b) and US (Figure 1c) between 1995 and 2009. Colors
indicate the country of origin. For example, the blue part of the first column of the figure
indicates that Canada increased the share of the use of Canadian intermediate goods by 4
percentage points.
Figure 1. Change in trade structure by country and type of good (1995-2009)10.
a) Canada
Intermediate Final
-5-4-3-2-1012345
United StatesMexicoCanada
b) Mexico
10 Changes in trade structures for intermediate and final goods are calculated T 09 −T 95*100 and τ 09−τ95*100, respectively.
17
Intermediate Final
-5-4-3-2-1012345
United StatesMexicoCanada
c) United States
Intermediate Final
-5-4-3-2-1012345
United StatesMexicoCanada
Source: WIOD.
Larger changes in trade structures are the increase of domestic purchases of intermediate
goods in Canada (around 4 percentage points) at the expense of imports from the US, and
the decrease of domestic purchases of intermediate goods in Mexico (around 2 percentage
points) in favor of imports, especially from the US, but also from Canada. Changes in the
trade structures of these two countries for final goods follow the same patterns, but are less
relevant11. Changes in the trade structure of the US, which do not reach 1 percentage point,
consist of the substitution of domestic goods by imports mainly from Mexico. In summary,
11 However, it could be that that while the changes are smaller, their effects are more significant. This is the case of Mexico, as we will see in Table 4.
18

Figure 1 suggests that between 1995 and 2009 Mexico and the US became more dependent
on each other. In other words, during these 15 years the economic integration of the US and
Mexican economies increased. In contrast, the integration between the US and Canada
suffered a setback. At the end of the period, Canada had become more self-sufficient, while
its trade partners in the region had become more dependent on Canadian products. The
Canadian case is the result of a combination of increased penetration into partners' markets
and decreased openness of its own market.
Figure 2 shows the industries experiencing the largest changes in the trade structures of
intermediate and final goods. In the case of Canada (Figure 2a and Figure 2d), domestic
products generally increased their share in the domestic market, especially those related to
transport equipment and other manufacturing (with some exceptions, such as leather and
electric equipment final goods). The opposite pattern is observed in the case of Mexico
(Figure 2b and Figure 2e), where the Canadian and US share of the market increased to the
detriment of the domestic share. Textile final products are an exception in this case.
Similarly, US products lost out in the domestic market in favor of imports from the other
NAFTA members, with some exceptions such as the chemicals intermediate goods (Figure
2c and Figure 2f).
19

Figure 2. Change in trade structure by country, type of good and top five industries (1995-
2009) 12.
a) Canada – Intermediate goods
Elec. E
q.
O. Man
ufactu
ring
Transp.
Eq.Pap
er
W. T
rade
-6
-4
-2
0
2
4
6
United StatesMexicoCanada
b) Mexico – Intermediate goods
Minig
Electric
ity
Agricu
lture
Fuels
Real Esta
te
-6
-4
-2
0
2
4
6
United StatesMexicoCanada
c) United States – Intermediate goods
12 Changes in trade structures are calculated similarly as for Figure 1 but at industry level.
20

Agricu
lture
Plastic
s
Chemica
ls
Mineral
sFue
ls
-6
-4
-2
0
2
4
6
United StatesMexicoCanada
d) Canada – Final goods
Leathe
r
Transp.
Eq.
Elec. E
q.
O. Man
ufactu
ring
Metals
-100
-80
-60
-40
-20
0
20
40
60
80
100
United StatesMexicoCanada
e) Mexico – Final goods
21

Transp.
Eq.
Textile
s
Plastic
s
Machine
ryMeta
ls
-100
-80
-60
-40
-20
0
20
40
60
80
100
United StatesMexicoCanada
f) United States – Final goods
Metals
Leathe
r
Textile
s
O. Man
ufactu
ring
Plastic
s
-100-80-60-40-20
020406080
100
United StatesMexicoCanada
Abbreviations: Elec. Eq. (Electric equipment), Transp. Eq. (Transport equipment), W.
Trade (Wholesale trade). O. Manufacturing (Other Manufacturing). Source: WIOD.
2.2. Accumulated Effects
Changes in trade structures displayed in Figure 1 produce an impact on employment and
value added that is summarized in Table 3 as a percentage of 1995 levels. Rows contain the
22

country where the impact takes place and columns indicate the country originating the
impact. For example, the figure in the second row and second column (0.2%) indicates that
the change in the trade structure of intermediate goods of Mexico (in other words, the
change in the trade structure of the Mexican industry) increases the employment in Canada
by 0.2% relative to 1995 levels.
Table 3. Accumulated effects by country (percentage change with respect to 1995 levels)
Employment Value added
Effects
on:Good type
Due to changes in: Due to changes in:
CAN MEX US Total CAN MEX US Total
CAN
Total 3.10 0.20 2.00 5.40 5.10 0.30 4.40 9.80
Intermediates 1.80 0.20 2.40 4.30 3.00 0.40 5.10 8.50
Final 1.60 0.00 -0.10 1.60 2.60 0.00 -0.10 2.50
MEX
Total 0.20 1.50 2.20 3.90 0.10 0.20 1.10 1.40
Intermediates 0.30 -1.70 2.70 1.20 0.10 -0.40 1.40 1.00
Final 0.00 3.10 -0.10 3.00 0.00 0.60 0.00 0.60
US
Total -0.10 0.00 -0.60 -0.70 -0.20 0.10 -1.30 -1.50
Intermediates -0.20 0.00 -0.40 -0.50 -0.30 0.10 -1.00 -1.20
Final 0.00 0.00 -0.30 -0.20 0.00 0.00 -0.50 -0.40
Total
Total 0.20 0.30 0.10 0.60 0.20 0.10 -0.40 -0.10
Intermediates 0.10 -0.30 0.40 0.20 0.00 0.00 -0.10 -0.10
Final 0.10 0.60 -0.20 0.5 0.20 0.10 -0.40 0.00
Abbreviations: CAN (Canada), MEX (Mexico), US (United States). Source: Own work.
There are both positive and negative effects with a maximum increase of 9.8% (in the value
added of Canada) to a maximum decrease of 1.5% (in the US value added). The most
23
relevant effects in order of magnitude are the following: (1) the value added increase in
Canada (9.8%), mainly due to the substitution by US industries of domestic inputs by
Canadian intermediate goods; (2) the creation of employment in Canada (5.4%), mostly
related to changes in the trade structure of US and Canadian industries (like the former
effect, this reflects the increase of the market share of Canadian intermediate goods in the
region); (3) the job creation in Mexico (3.9%), explained by the changes in the trade
structures of the domestic final demand and of US industries; (4) the decrease of value
added in the US (1.5%), which is mainly a consequence of the changes in the trade
structure of the domestic industry and final demand, i.e. the substitution of national
products by imports.
In the case of Canada and the US, most of the impacts originate from changes in their own
trade structure13, while in the case of Mexico most of the impact is due to changes in the US
trade structure14. The most relevant transboundary or spillover effects are associated to
changes in the trade structure of the US industry. These are the increases in value added in
Canada (5.1%), employment in Mexico (2.7%), employment in Canada (2.4%), and value
added in Mexico (1.4%). The most relevant negative spillover effect is produced by the
change in the trade structure of the Canadian industry on the value added of the US (-
0.3%).
13 See in Table A.1. in the Appendix that more than 80% of the jobs lost in the US are due to changes in its trade structure. These changes also account for 90% of the negative impact on American value added. Around 60% of the jobs created in Canada and 50% of the value-added impact in this country are associated to changes in its own trade structure (the remaining part is due to changes in the American trade structure).14 Table A.1. in the Appendix shows that 60% of the new jobs created in Mexico and 80% of the impact in terms of value added in this country are produced by changes in the trade structure of the US.
24

In general, we observe that changes in the trade structure of US and Canadian industries
(i.e. trade in intermediate goods)15 create jobs and income in Canada and Mexico, and
destroy jobs and income in the US. Also, changes in the trade structure of the Mexican
industry create jobs and income in Canada and the US, and destroy jobs and income in
Mexico. Thus, changes in the US industries damage the domestic economy while producing
positive spillovers in Mexico and vice versa (i.e. changes in Mexican industries produce
positive spillovers in the US at the expense of the domestic economy). This is the result of
the increased integration between both economies. In contrast, changes in the Canadian
industry stimulate the domestic economy and create negative spillovers for the US
economy. Furthermore, changes in the trade structure of the US final demand destroy jobs
and income in the three countries, while those of the Canadian and Mexican final demand
have a positive effect on employment and income in the three countries.
Table 4 summarizes the results in absolute terms in number of jobs and income expressed
in 2009 prices. Changes in the trade structure of NAFTA members created around 1.1
million jobs in the region while resulting in a loss of value added of more than
USD 9 billion. At country level, the impact was positive in Canada (approximately 730
thousand new jobs and USD 74 billion) and in Mexico (1.3 million new jobs and over
USD 28 billion), but negative in the US (a loss of 900 thousand jobs and USD 100 billion).
Table 4. Accumulated effects by country (1995-2009)
Due to changes in: Tota
l
Due to changes in: Total
15 Note that when we talk about trade structures of some country’s industries we implicitly refer to intermediate goods.
25
Good type Canad
a
Mexic
o
US
A
Canad
a
Mexic
o
USA
Canad
a
Total
Empl
oym
ent
(thou
sand
s of j
obs)
425 28 276 729
Val
ue-a
dded
(USD
2009
mill
ion)
38,36
5
2,587 32,956 73,907
Intermedia
te
241 29 320 591 22,34
5
2,723 38,365 63,433
Final 222 3 -9 215 19,71
3
258 -927 19,044
Mexic
o
Total 80 489 726 1,29
4
1,415 4,599 22,227 28,241
Intermedia
te
88 -578 897 407 1,533 -7,811 26,901 20,623
Final 8 1,021 -22 1,00
7
187 11,803 -546 11,443
USA Total -163 57 -
795
-900 -
18,03
7
6,809 -
100,01
3
-
111,24
1
Intermedia
te
-221 31 -
478
-668 -
25,02
1
3,822 -
70,693
-
91,892
Final 23 28 -
384
-333 2,784 3,027 -
39,012
-
33,201
Total Total 342 574 207 1,12
3
21,74
3
13,995 -
44,830
-9,093
Intermedia
te
108 -518 739 330 -1,143 -1,266 -5,427 -7,836
Final 253 1,052 - 889 22,68 15,088 - -2,714
26

415 4 40,485
Source: Own work.
2.3. Most Affected Industries
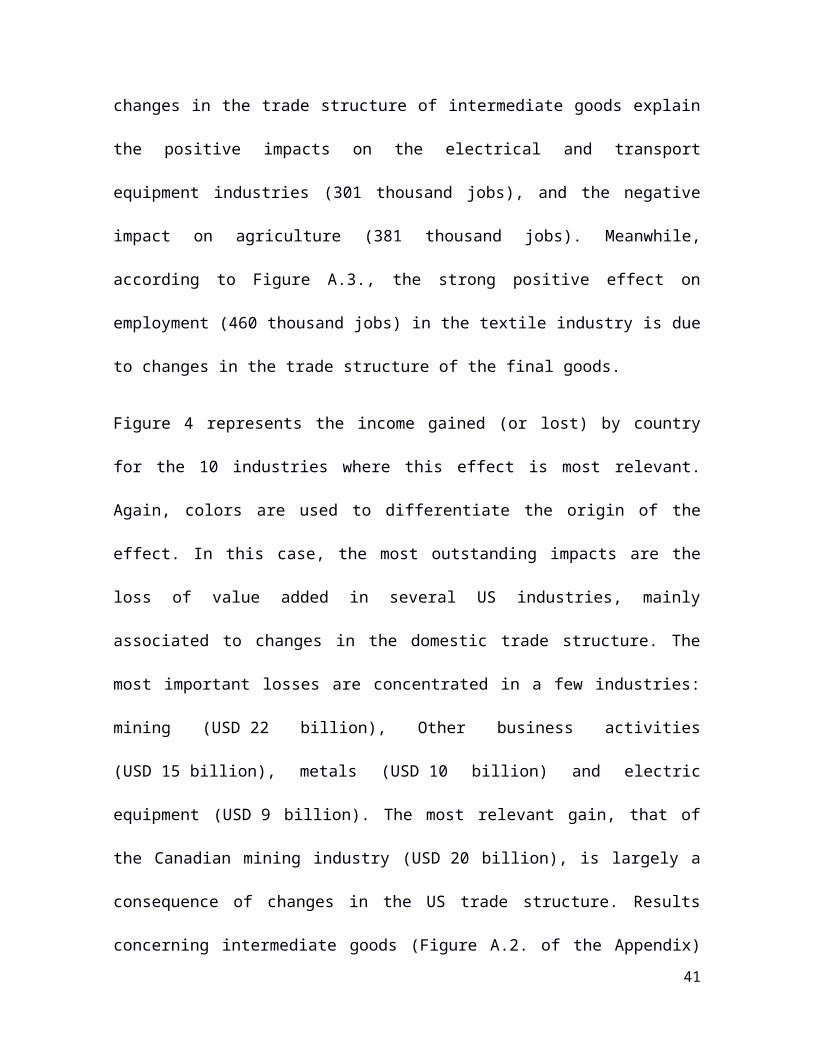
Figure 3 shows, for the 10 industries where effects on employment are most relevant, the
number of jobs created (or destroyed) by country. Colors indicate the country whose
change in trade structure has originated the effect.
According to this figure, Mexico is the NAFTA member where the effect of changes of
trade structures is the most relevant in terms of job creation. Its own trade structure is
responsible for the jobs created in textiles (approximately 428 thousand) and other
manufacturing (160 thousand). Two other industries with sizeable impacts in terms of new
jobs are the electric and transport machinery industries. In these cases, an important part of
the impact is due to the change of the US trade structure (211 and 82 thousand,
respectively). Mexican workers are also the most affected by the negative effects of the
changes in the trade structure. In particular, those in the agriculture sector, where around
395 thousand jobs were lost due to changes in the domestic trade structure. Figure A.1. in
the Appendix shows that changes in the trade structure of intermediate goods explain the
positive impacts on the electrical and transport equipment industries (301 thousand jobs),
and the negative impact on agriculture (381 thousand jobs). Meanwhile, according to
Figure A.3., the strong positive effect on employment (460 thousand jobs) in the textile
industry is due to changes in the trade structure of the final goods.
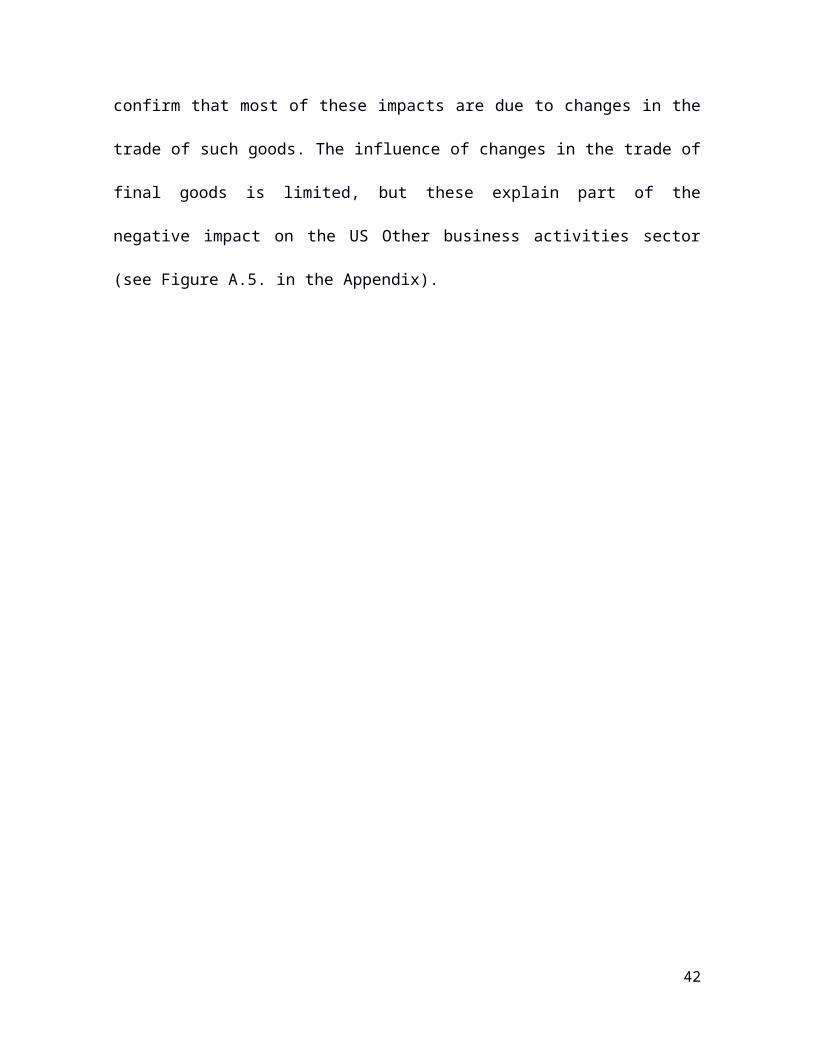
Figure 4 represents the income gained (or lost) by country for the 10 industries where this
effect is most relevant. Again, colors are used to differentiate the origin of the effect. In this
27
case, the most outstanding impacts are the loss of value added in several US industries,
mainly associated to changes in the domestic trade structure. The most important losses are
concentrated in a few industries: mining (USD 22 billion), Other business activities
(USD 15 billion), metals (USD 10 billion) and electric equipment (USD 9 billion). The
most relevant gain, that of the Canadian mining industry (USD 20 billion), is largely a
consequence of changes in the US trade structure. Results concerning intermediate goods
(Figure A.2. of the Appendix) confirm that most of these impacts are due to changes in the
trade of such goods. The influence of changes in the trade of final goods is limited, but
these explain part of the negative impact on the US Other business activities sector (see
Figure A.5. in the Appendix).
28
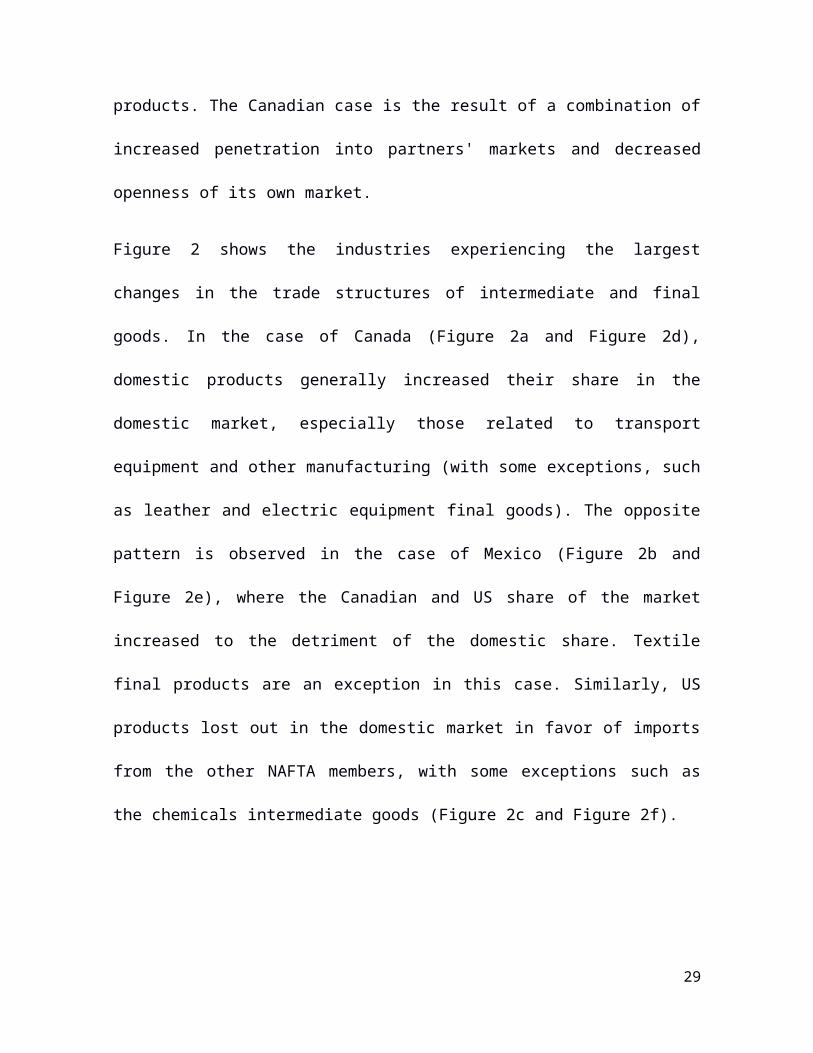
Figure 3. Cumulative employment effect in top 10 industries by country (thousands of
jobs, 1995 to 2009).
CanadaMexico
United StatesCanadaMexico
United StatesCanadaMexico
United StatesCanadaMexico
United StatesCanadaMexico
United StatesCanadaMexico
United StatesCanadaMexico
United StatesCanadaMexico
United StatesCanadaMexico
United StatesCanadaMexico
United States
Agr
icul
ture
Elec
. Eq.
O. M
anuf
.O
BA
Pers
onal
serv
.Pla
stic
sPP
.AA
.R
. Tra
deTe
xtile
sTr
ansp
. Eq.
-400 -300 -200 -100 0 100 200 300 400 500
CanadaMexicoUnited States
29

Abbreviations: Transp. Eq. (Transport equipment), R. Trade (Retail trade), PP.AA. (Public
Administrations), Personal serv. (Personal services), OBA (Other business activities), Elect.
Eq. (Electric equipment), O. Manuf. (Other Manufacturing). Source: Own work.
Figure 4. Cumulative Value-added effect in top 10 industries by country (billion USD,
1995-2009).
30

Canada
Mexico
United States
Canada
Mexico
United States
Canada
Mexico
United States
Canada
Mexico
United States
Canada
Mexico
United States
Canada
Mexico
United States
Canada
Mexico
United States
Canada
Mexico
United States
Canada
Mexico
United States
Canada
Mexico
United States
Che
mic
als
Mac
hine
ryO
. Man
uf.
Met
als
Min
ing
OB
ATe
xtile
sTr
ansp
. Eq.
W. T
rade
Elec
t. Eq
.
-25 -20 -15 -10 -5 0 5 10 15 20 25
CanadaMexicoUnited States
Abbreviations: Transp. Eq. (Transport equipment), W. Trade (Wholesale trade), OBA
(Other business activities), Elect. Eq. (Electric equipment), O. Manuf. (Other
Manufacturing). Source: Own work.
31

2.4. Distribution of Value-Added Impacts
Next, we analyze the distribution of the impact on value added, distinguishing between
capital and labor compensation. Table 5 shows in absolute terms the impact on capital and
labor income. This way it can be noted that the net loss16 of more than USD 9.1 billion in
the region is a consequence of an increase in capital compensation of USD 5.2 billion and a
decrease in labor remuneration of almost USD 14.3 billion. While in Canada and Mexico
both the capital and labor income effects are positive, in the US both effects are negative.
Therefore figures for the whole region are due to the fact that the positive effects in Canada
and Mexico counteract the negative effects in the US in the case of capital income, but not
in the case of labor income. The impact of the trade of intermediate goods accounts for
most of the total effect. The change in the trade of final goods produces a similar
distribution of value-added effects, although smaller than trade in intermediate goods.
Table 5. Cumulative impact on capital and labor income by country and type of good
(billion USD2009, 1995-2009)
Labor Capital Total
CAN
Total 37.50 36.41 73.91
Final 10.88 8.16 19.04
Intermediate
s30.91 32.53 63.43
MEXTotal 7.72 20.52 28.24
Final 4.14 7.30 11.44
16 Since the loss of labor income is significantly larger than the gain of capital income, at regional level changes in trade structure result in a net loss of value added. By definition, value added is equal to final demand, which means that the detected loss of income corresponds to a leakage towards other regions of the world.
32

Intermediate
s4.53 16.09 20.62
US
Total -59.50 -51.74 -111.24
Final -18.88 -14.32 -33.20
Intermediate
s-48.13 -43.76 -91.89
Total -14.28 5.19 -9.09
Abbreviations: CAN (Canada), MEX (Mexico), US (United States).
Source: Own work.
Figure 5 illustrates the distribution of income effects between capital and labor by skill
levels (high, medium and low) in NAFTA members17. In Canada (Figure 5a), the positive
effect on income is quite evenly distributed between labor and capital, with labor capturing
a slightly larger share (53%). Of the portion of income that goes to labor, about 70% goes
to medium-skilled workers in this country. In the case of Mexico (Figure 5b) most of the
positive impact in income goes to capital compensation (73%). Medium-skilled workers are
also those who benefit most (around 74% of labor compensation). In the case of the US
(Figure 5c), income losses affect labor more than capital (53% versus 47%). Again,
medium-skilled workers are the most (in this case, negatively) affected by income losses
(around 50% of labor compensation).
Figure 5. Distribution of the cumulative impact on primary factors by skill levels (%).
a) Canada
17 This distribution is calculated from the income effects obtained applying equation [12] with the vectors of factor shares of 2009 from WIOD, as explained in the methodology.
33

Capital49%
High14%
Medium36%
Low1%
b) Mexico
Capital73%
High4%
Medium20%
Low3%
c) United States
Capital, 48%
High, 24%
Medium, 27%
Low, 3%
Source: Own work.
3. Discussion
34

Next, we analyze the results in relation to the findings of previous studies, tackling each
country in turn, and we start with Mexico. In this case, the most relevant impact is the job
creation associated to changes in the trade structure of the domestic final demand, which is
mostly concentrated in textiles. This impact is consistent with the process of the relocation
of the US textile industry to Mexico after NAFTA (as explained by Biles, 2004).
The next most relevant impact on Mexico is a spillover effect from the US economy. The
change in the trade structure of intermediate goods in the US industry (i.e. the substitution
of domestic inputs with Mexican products) has created new jobs in the Mexican automotive
and electric/electronics industries. This effect could be related to the development of
regional production chains, in which (as explained by G. Hanson, 1996 and Timmer et al.
2014) the US is responsible for knowledge-intensive services (product design, processing
technology and marketing), and outsources assembly services based on unskilled labor to
branch plants in Mexico (i.e. the aforementioned maquiladoras). This way the US industry
manages to reduce costs because in Mexico unskilled labor is abundant, and therefore
cheap, while in the US the abundant and cheap factor is skilled labor (Logan, 2008)18.
These chains of regional production, whose plants in Mexico are dependent on unskilled
labor (Airola, 2008; Chiquiar, 2008), are responsible for a large proportion of the increase
of trade between Mexico and its NAFTA partners (especially with the US industries of
transport and electric equipment), which seems to explain this positive effect on
employment in Mexico19.18 In addition, facilities that maquiladoras have under various programs represent a cost reduction of 30% compared to plants using local inputs (Moreno-Brid, Santamaria, & Rivas Valdivia, 2005).19 This contrasts with the results of Gruben (2001), who found no significant influence of NAFTA on jobs of the assembly industry. Our results coincide in some points with other previous studies. The sizeable job creation in Mexico is also found in Cervantes-Martínez and Villaseñor-Becerra (2016). At the industry level, our results coincide with those of Truett and Truett (2007) for electrical and textile industries equipment. However, these authors find negative effects on the value added of the automobile and furniture industry, while our results are positive. The positive impact on the income of medium-skilled Mexican
35

Finally, it can be observed that the positive impacts on employment are not accompanied
by value-added impacts of a similar magnitude. As previously explained, one part of the
sizeable job creation effect detected for Mexico seems to be linked to the relocation of
labor-intensive processes of US companies looking for lower labor costs (Biles, 2004;
Elsby et al., 2013; G. Hanson, 1996). These labor-intensive processes (transformation,
assembly, testing) are typically the lowest paid tasks (Cervantes-Martínez & Villaseñor-
Becerra, 2016; Timmer et al., 2014), which explains the asymmetries in the employment
and income effects in this country. Besides, most of the value-added gains of Mexico are
captured, according to our results, by the metals, electrical machinery and automobile
industries. According to Waldkirch (2010), most foreign direct investment (FDI) in Mexico
is from the US and is concentrated in these industries20. This would mean that an important
part of the effects on capital income will return to US companies21. Previous studies
(Cervantes-Martínez & Villaseñor-Becerra, 2016; Timmer et al., 2014) also detected an
increasing gap between labor and capital income in Mexico (in favor of capital), and have
noted the possibility that a sizeable share of the capital compensation in Mexico accrues to
foreign capital (mainly from US multinational companies).
The most relevant impact on Canada is a spillover effect from the US economy: the gain in
value added associated to changes in the trade structure of the US industry, which is mostly
concentrated in the mining sector. This seems to be connected to the exports of crude oil
from Canada to the US, which have almost doubled in the period studied (EIA, 2016).
workers fits with the increase in wages of skilled workers in maquiladoras found by Hanson (2004), but does not match the increase in wages of low-skilled labor and the declining skill premium found by Airola (2008) and Chiquiar (2008) in Mexican regions most exposed to trade.20 In 2009, the American FDI reached 20% of Mexico's GDP according to the International Monetary Fund and World Bank data.21 This would not happen with gains in mining or losses in agriculture, sectors where, according to Waldkirch (2010), there is little FDI.
36

Hughes (2010) explains that energy export clauses in NAFTA have stimulated the
development of the tar sands in Canada, and the rapid growth of Canadian energy exports
(especially of crude oil and natural gas) to US in the period analyzed22.
Another relevant impact on Canadian income is that it is produced by changes in the trade
structure of intermediate goods (i.e. substitution of inputs imported from the US by
domestic inputs23). This effect is largely concentrated in the Canadian metal and service
sectors, which would suggest that these industries have gained competitive capacity in this
period (according to the interpretation of Portella-Carbó, 2016). This is in accordance with
the conclusions by Gu and Rennison (2005) on the comparative advantages of Canada
versus the US in the case of the metals sector.
The fact that the distribution of the income effect is more favorable for labor in Canada
could be related to a greater trade union strength and a higher minimum wage compared to
Mexico and the US (Airola, 2008; Elsby et al., 2013; Helliwell, 2001; Hinojosa-Ojeda et
al., 2000; Trefler, 2004; Waldkirch, 2010). And, as in the case of Mexico, it can be
assumed that a sizeable share of the positive impacts on capital income will go to US
companies24.
The positive impacts on employment of changes in the Canadian and US industry are also
very relevant. In this case our findings are in line with the results of Logan (2008), who
found a positive correlation between the reduction of tariffs and employment in Canada25.
22 NAFTA even includes a proportionality clause whereby any reduction in Canadian exports of crude oil to the US must be accompanied by a proportional reduction in the provision to Canadian consumers.23 In line with this, Cervantes-Martínez and Villaseñor-Becerra (2016) found that the content of domestic value added in Canadian exports increased during the same period.24 In 2009, the American FDI represented 21% of the Canadian GDP according to the International Monetary Fund and World Bank data.25 Several authors have detected negative effects on the Canadian economy immediately after the entry into force of the FTA (Beaulieu, 2000; Gaston & Trefler, 1997; Trefler, 2004; Zhang, Du, Hsiao, & Yin,
37

One of the activities that experienced considerable job creation is Other business activities,
a sector that is high in highly and medium-skilled labor.
Regarding the results obtained for the US, the most relevant one is the loss of value added,
basically caused by changes in its intermediate trade structures (i.e. substitution of domestic
inputs by imports). Yoskowitz et al. (2002) also found negative effects on the rate of US
income growth after NAFTA. According to our results, most of the loss of value added in
the US corresponds to the remuneration of labor. Logan (2008) explains that the reductions
in wages, more pronounced in jobs that require lower qualifications, were associated with
the relocation of activities from the US to Mexico. Hakobyan and McLaren (2016) arrive at
the same result and explain that even unskilled employees in industries not exposed to
competition from Mexico were affected if their city was heavily dependent on an industry
vulnerable to such competition (since abundance of labor supply reduced the wages in all
industries). Moreover, the larger loss due to labor compensation fits with the results of
Elsby et al. (2013), who found that the pressure exerted by imports negatively affects the
labor share of income. Income effects by skill level reflect a loss in US medium-skilled
workers that is comparable with the gain of their Canadian and Mexican peers. This could
be the result of the outsourcing of tasks towards Canada and Mexico. In the case of Canada
this could result in cost reduction since the wage premium for education in this country has
increased much less than in the US (Helliwell, 2001).
The negative (but small in relative terms) effect on employment in the US (mainly
produced by the substitution in the industry of domestic inputs by imports) is consistent
with the results of previous studies, like Hinojosa-Ojeda et al. (2000) and Scott (2014). The
2015). Our work focuses on a later period, which enables us to account for the long-term consequences of the FTA.
38

former study explain that the Transitional Adjustment Assistance program (or NAFTA-
TAA), conceived for mitigating the potential adverse effects on employment with training
and income supplements, received 44 thousand applications a year. This number is in the
same order of magnitude as the 60 thousand jobs per year lost, according to our results,
because of changes in regional trade in the period of study. The latter paper arrives to a
result in the same order of magnitude that ours, i.e. 851,700 US jobs displaced due to US
trade deficit with Mexico. Yoskowitz et al. (2002) and Logan (2008) found that NAFTA
had a negative impact on employment due to the increased trade between the US and
Mexico. The latter explains that job loss is related to increased competition with imports
from Mexico, and that it occurs especially in industries intensive in unskilled labor26.
Moreover, the slight positive effect on US agriculture has also been previously reflected in
the literature (Burfisher et al., 2001).
4. Conclusions
The methodology used in this paper enables us to differentiate the contribution of changes
in intra-regional trade to the observed evolution of macroeconomic variables. Similarly to
Portella-Carbó (2016), ours is an ex-post accounting exercise in which reasons behind such
changes (e.g. developments in prices, trade and monetary policy, labor market,
competitiveness, technology, exchange rates) are taken as exogenous. This is the main
novelty of our work compared to previous studies on the effects of NAFTA. Furthermore,
data availability conditions the choice of the period of study, when ideally, to capture the
full impact of NAFTA, it would have been better to start with the pre-NAFTA (1993) data
26 Note that our analysis does not distinguish the employment effect by skill level. Our results indicate that, in terms of income, medium-skilled workers are the most affected by changes in intra-regional trade structures
39

through its full implementation. The main changes observed in regional trade patterns
between 1995 and 2009 reflect a larger degree of economic integration between the US and
Mexico, and a decline in the openness of the Canadian market combined with a gain in the
regional market share of Canadian products. According to our results, these changes
produce relevant positive effects on Canadian income and on Mexican employment, and
negative effects on the US economy. We also quantify the influence of some countries over
others, finding that the US economy produces relevant spillover effects on Mexico and
Canada.
We provide an overview of the regional effects. The region-wide net profit in employment
and capital income comes at the expense of a significant reduction in labor income. This
suggests that what has occurred is an optimization at the regional level of capital income
(mobile factor precisely thanks to free trade agreements)27. The search for cheaper labor for
processes intensive in this factor (via offshoring) has consequently resulted in an increase
in the number of jobs in the NAFTA region, accrued in Mexico and Canada28. Timmer et al.
(2014) explains that, globally, increased openness of international capital markets (enabling
quick capital relocation) has also resulted in a decrease in the bargaining power of labor
and, therefore, of their income share.
Given the recent debate about trade policy, it is worth noting that negative impacts on the
US economy are limited in magnitude and mainly caused by changes in the geographical
sourcing of US industries. The effect of, for example, the Mexican intermediate and final
27 Other authors have concluded that the final aim of trade agreements is to provide freedom to foreign investment (Puyana, 2003), which facilitates this optimization and the appropriation of larger shares of income. 28 Note that, while the employment effect is entirely domestic, the effect on capital income is only partially domestic. One part of it goes to foreign companies with direct investments in the economy where the impact occurs.
40
demand on US income and employment is positive, although not large enough to counteract
the effect of changes in the US industry. Policies enhancing the competitive capacity of US
producers of intermediate goods and services could mitigate the potential negative effects
of trade liberalization. Protectionist policies would eliminate the existing positive spillover
effects on the US economy. At the same time it could impose an additional cost on US
consumers, leading to an increase in production costs and prices (but this is a topic for
future research).
Acknowledgements
This work was supported by Research Council of Norway (CICEP project), the Ministry of
Economy and Competitiveness of Spain (ECO2015-68023) and the Basque Government
(IT-799-13).
REFERENCES
Airola, J. (2008). A Regional Analysis of the Impact of Trade and Foreign Direct Investment on
Wages in Mexico, 1984–2000. Review of Development Economics, 12(2), 276–290.
Beaulieu, E. (2000). The Canada-US Free Trade Agreement and labour market adjustment in
Canada. Canadian Journal of Economics/Revue Canadienne D’économique, 33(2), 540–
563.
Biles, J. J. (2004). Export-oriented industrialization and regional development: a case study of
maquiladora production in Yucatán, Mexico. Regional Studies, 38(5), 517–532.
Burfisher, M. E., Robinson, S., & Thierfelder, K. (2001). The impact of NAFTA on the United
States. The Journal of Economic Perspectives, 15(1), 125–144.
Caliendo, L., & Parro, F. (2014). Estimates of the Trade and Welfare Effects of NAFTA. The
Review of Economic Studies, rdu035.
41
Cervantes-Martínez, R., & Villaseñor-Becerra, J. (2016). NAFTA Trade (and some extra NAFTA
trade) in Value Added and its Distribution, 1995-2011. Journal of Economic Structures, 5–
27
Chiquiar, D. (2008). Globalization, regional wage differentials and the Stolper–Samuelson
Theorem: Evidence from Mexico. Journal of International Economics, 74(1), 70–93.
Coughlin, C. C., & Wall, H. J. (2003). NAFTA and the changing pattern of state exports. Papers in
Regional Science, 82(4), 427–450.
EIA. (2016). U.S. Imports from Canada of Crude Oil. Retrieved from
https://www.eia.gov/dnav/pet/hist/LeafHandler.ashx?n=PET&s=MCRIMUSCA2&f=A
Elsby, M. W., Hobijn, B., & Şahin, A. (2013). The decline of the US labor share. Brookings Papers
on Economic Activity, 2013(2), 1–63.
Ferrarini, B. (2011). Mapping vertical trade (ADB Economics Working Paper Series No. 263).
Asian Development Bank. Retrieved from
http://www.adb.org/sites/default/files/publication/29012/economics-wp263.pdf
Gaston, N., & Trefler, D. (1997). The labour market consequences of the Canada-US Free Trade
Agreement. Canadian Journal of Economics, 18–41.
Gruben, W. C. (2001). Was NAFTA behind Mexico’s high maquiladora growth? (No. Third
Quarter). Federal Reserve Bank of Dallas. Retrieved from
http://search.proquest.com/openview/fb846f73ca69e3731ff1edb7df5ff9bf/1?pq-
origsite=gscholar
Gu, W., & Rennison, L. W. (2005). The effect of trade on productivity growth and the demand for
skilled workers in Canada. Economic Systems Research, 17(3), 279–296.
Hakobyan, S., & McLaren, J. (2016). Looking for Local Labor-Market Effects of NAFTA. Review
of Economics and Statistics, (0). Retrieved from
http://www.mitpressjournals.org/doi/abs/10.1162/REST_a_00587
42

Hanson, G. (1996). Localization Economies, Vertical Organization, and Trade. The American
Economic Review, 86(5), 1266.
Hanson, G. H. (2004). What has happened to wages in Mexico since NAFTA? In FTAA and
Beyond: Prospects for Integration in the Americas (Estevadeordal, Toni, Rodrick, Dani,
Taylor, Alan, Velasco, Andres). Cambridge: Harvard University Press. Retrieved from
http://www.nber.org/papers/w9563
Helliwell, J. F. (2001). Canada: Life Beyond the Looking Glass. The Journal of Economic
Perspectives, 15(1), 107–124.
Hinojosa-Ojeda, R., Runsten, D., De Paolis, F., & Kamel, N. (2000). The US employment impacts
of North American integration after NAFTA: A partial equilibrium approach. North
American Integration and Development Center/SPPSR/UCLA, mimeo, http://naid. sspr.
ucla. edu. Retrieved from
http://www.naid.ucla.edu/uploads/4/2/1/9/4219226/_c12_2000.pdf
Hughes, L. (2010). Eastern Canadian crude oil supply and its implications for regional energy
security. Energy Policy, 38(6), 2692–2699.
Johnson, R. C., & Noguera, G. (2012). Accounting for intermediates: Production sharing and trade
in value added. Journal of International Economics, 86(2), 224–236.
https://doi.org/10.1016/j.jinteco.2011.10.003
Koopman, R., Wang, Z., & Wei, S.-J. (2012). Estimating domestic content in exports when
processing trade is pervasive. Journal of Development Economics, 99(1), 178–189.
https://doi.org/10.1016/j.jdeveco.2011.12.004
Koopman, R., Wang, Z., & Wei, S.-J. (2014). Tracing value-added and double counting in gross
exports. The American Economic Review, 104(2), 459–494.
https://doi.org/10.1257/aer.104.2.459
Krueger, A. O. (2000). NAFTA’s effects: a preliminary assessment. The World Economy, 23(6),
761–775.
43

Logan, J. (2008). Belted by NAFTA? A look at trade’s effect on the US manufacturing belt.
Regional Studies, 42(5), 675–687.
Los, B., Timmer, M. P., & de Vries, G. J. (2015). Tracing Value-Added and Double Counting in
Gross Exports: Comment. American Economic Review, 106(7), 1958–66.
https://doi.org/10.1257/aer.20140883
Markandya, A., Arto, I., González-Eguino, M., & Román, M. V. (2016). Towards a green energy
economy? Tracking the employment effects of low-carbon technologies in the European
Union. Applied Energy, 179, 1342–1350. https://doi.org/10.1016/j.apenergy.2016.02.122
Moreno-Brid, J. C., Santamaria, J., & Rivas Valdivia, J. C. (2005). Industrialization and economic
growth in Mexico after NAFTA: the road travelled. Development and Change, 36(6),
1095–1119.
Murray, J. & Lenzen, M. (Eds.). (2013).The sustainability practicioner’s guide to multi–regional
input–output analysis. Champaign, IL, USA: Common Ground.
Portella-Carbó, F. (2016). Effects of international trade on domestic employment: an application of
a global multiregional input–output supermultiplier model (1995–2011). Economic Systems
Research, 28(1), 95–117.
Prina, S. (2015). Effects of Border Price Changes on Agricultural Wages and Employment in
Mexico. Journal of International Development, 27(1), 112–132.
Puyana, A. (2003). El camino mexicano hacia el regionalismo abierto: los acuerdos de libre
comercio de México con América del Norte y Europa. United Nations Publications.
Retrieved from http://books.google.es/books?
hl=es&lr=&id=zeFgEfFrOqIC&oi=fnd&pg=PA5&dq=puyana+el+camino+hacia+el+regio
nalismo+abierto&ots=VMyqr5t49q&sig=PZlyZP-US8PKMMg8g-L-5JYAIQs
Romalis, J. (2007). NAFTA’s and CUSFTA’s Impact on International Trade. The Review of
Economics and Statistics, 89(3), 416–435.
44

Scott, R. E. (2014). The effects of NAFTA on US trade, jobs, and investment, 1993–2013. Review
of Keynesian Economics, 2(4), 429-441.
Smith, A., Rainnie, A., Dunford, M., Hardy, J., Hudson, R., & Sadler, D. (2002). Networks of
value, commodities and regions: reworking divisions of labour in macro-regional
economies. Progress in Human Geography, 26(1), 41–63.
Timmer, M. P., Dietzenbacher, E., Los, B., Stehrer, R. and de Vries, G. J. (2015).
An Illustrated User Guide to the World Input–Output Database: the Case of Global
Automotive Production. Review of International Economics, 23, 575–605
Timmer, M. P., Erumban, A. A., Los, B., Stehrer, R., & de Vries, G. J. (2014). Slicing up global
value chains. The Journal of Economic Perspectives, 28(2), 99–118.
https://doi.org/10.1257/jep.28.2.99
Timmer, M. P., Miroudot, S., & de Vries, G. J. (2018). Functional specialisation in trade. Journal of
Economic Geography, 1-30.
Trefler, D. (2004). The long and short of the Canada-US free trade agreement. American Economic
Review, 94(4), 870–895.
Truett, L. J., & Truett, D. B. (2007). NAFTA and the maquiladoras: boon or bane? Contemporary
Economic Policy, 25(3), 374–386.
Villarreal, M. A. and Fergusson, I.J. (2017). The North America Free Trade Agreement. CRS
Report. Prepared for Members and Committees of Congress 7-5700. Congressional
Research Service.
Waldkirch, A. (2010). The effects of foreign direct investment in Mexico since NAFTA. The World
Economy, 33(5), 710–745.
[dataset] WIOD, Timmer, M. P., Dietzenbacher, E., Los, B., Stehrer, R. and de Vries, G. J. World
Input Output Database, 2013 Relese, http://www.wiod.org/release13
World Bank. (2010). Global Preferential Trade Agreements Database. Retrieved from
http://wits.worldbank.org/gptad/trade_database.html
45

Yoskowitz, D. W., Giermanski, J. R., & Pena-Sanchez, R. (2002). The influence of NAFTA on
socio-economic variables for the US-Mexico border region. Regional Studies, 36(1), 25–31.
Zhang, L., Du, Z., Hsiao, C., & Yin, H. (2015). The Macroeconomic Effects of the Canada–US Free
Trade Agreement on Canada: A Counterfactual Analysis. The World Economy, 38(5), 878–
892.
46

ANNEX A. Additional figures
Figure A.1. Employment effect in top 5 industries by country (thousand of jobs from 1995 to 2009). Only intermediate goods
Canada Mexico United States
Canada Mexico United States
Canada Mexico United States
Canada Mexico United States
Canada Mexico United States
Agriculture Metals OBA Transp. Eq. Elect. Eq.
-500
-400
-300
-200
-100
0
100
200
300
Abbreviations: CAN: Canada; MEX: Mexico; US: United States; OBA: Other business activities; Transp. Eq.: Transport equipment; Elect. Eq.: Electric equipment.
Source: Own work.
47

Figure A.2. Value-added effect in top 5 industries by country (USD million from 1995 to 2009). Only intermediate goods
Canada Mexico United States
Canada Mexico United States
Canada Mexico United States
Canada Mexico United States
Canada Mexico United States
Metals Mining OBA Transp. Eq. Elect. Eq.
-25,000
-20,000
-15,000
-10,000
-5,000
0
5,000
10,000
15,000
20,000
Abbreviations: CAN: Canada; MEX: Mexico; US: United States; OBA: Other business activities; Transp. Eq.: Transport equipment; Elect. Eq.: Electric equipment.
Source: Own work.
48

Figure A.3. Employment effect in top 5 industries by country (USD million from 1995 to 2009). Only final goods
Canada Mexico United States
Canada Mexico United States
Canada Mexico United States
Canada Mexico United States
Canada Mexico United States
Elect. Eq. O. Manufacturing R. Trade Textiles Trans. Eq.
-100
0
100
200
300
400
500
Abbreviations: CAN: Canada; MEX: Mexico; US: United States; Elect. Eq.: Electric equipment; R. Trade: Retail trade; Transp. Eq.: Transport equipment, O. Manufacturing: Other Manufacturing.
Source: Own work.
49

Figure A.4. Value-added effect in top 5 industries by country (USD million from 1995 to 2009). Only final goods
Canada Mexico United States
Canada Mexico United States
Canada Mexico United States
Canada Mexico United States
Canada Mexico United States
O. Manufacturing Metals OBA Textiles Transp. Eq.
-5,000
-4,000
-3,000
-2,000
-1,000
0
1,000
2,000
3,000
Abbreviations: CAN: Canada; MEX: Mexico; US: United States; OBA: Other business activities; Transp. Eq.: Transport equipment, O. Manufacturing: Other Manufacturing.
Source: Own work.
50

51