Embed Size (px)
Citation preview
2012-2013 ACT Public ServiceState of the Service Report
08Fall

AUSTRALIAN CAPITAL TERRITORY
C o m m i s s i o n e r f o r P u b l i c A d m i n i s t r a t i o n
Transmittal CertificateMs Katy Gallagher MLAChief MinisterACT Legislative AssemblyLondon CircuitCANBERRA ACT 2601
Dear Chief Minister
I am pleased to submit the annual report of the Commissioner for Public Administration (which is incorporated into the State of the Service Report 2013). The report provides an account of the management of the ACT public sector during the reporting period 1 July 2012 to 30 June 2013, and focuses on the exercise of the Commissioner’s statutory powers and functions under the Public Sector Management Act 1994.
This report has been prepared in accordance with section 7 of the Annual Reports (Government Agencies) Act 2004 and the requirements prescribed in the Chief Minister’s 2012–2013 Annual Report Directions. It has also been prepared in conformity with other relevant legislation.
I certify that the report is an honest and accurate account of the operations of the Office of Commissioner for Public Administration during the reporting period 1 July 2012 to 30 June 2013, that all relevant material information is included, and that it complies with the Directions. I also certify that fraud prevention has been managed in accordance with the Public Sector Management Standards 2006, Chapter 2, Division 2.1.3.
Section 13 of the Annual Reports (Government Agencies) Act 2004 requires that you present the report to the Legislative Assembly within 3 months of the end of the reporting period.
Yours sincerely
Andrew KeffordCommissioner for Public Administration
19 September 2013
GPO Box 158 Canberra ACT 2601Level 5, Canberra Nara Centre1 Constitution AvenueCanberra ACT 2601
Telephone: (02) 6205 0213Facsimile: (02) 6207 5376
C o m m i s s i o n e r f o r P u b l i c A d m i n i s t r a ti o n
ContentsINTRODUCTION 5
COMMISSIONER FOR PUBLIC ADMINISTRATION ANNUAL REPORT 2013 6
1.1 Performance and Financial Management Reporting 6The Office of the Commissioner for Public Administration 6The Commissioner for Public Administration 6Overview and the Management of the ACTPS 6
1.2 Highlights 13Annual Priorities 13ACT Public Service Values and Signature Behaviours 13ACT Public Service Awards for Excellence 15
1.3 Complaints 171.4 Outlook 181.5 Consultation and scrutiny reporting 18
Internal and External Scrutiny 18Legislative Assembly Committee Inquiries and Reports 19
1.6 Legislative and Policy Based Reporting 19Public Interest Disclosure 19Aboriginal and Torres Strait Islander Reporting 19Freedom of Information 20Human Rights Act 2004 20
1.7 Non-Applicable Reporting Requirements 21
AGENCY SURVEY 22
2.1 Introduction and Methodology 222.2 Values and Behaviour 23
Delivery Methods for Learning and Development 23Delivery Methods for Learning and Development – Tracking 24
2.3 Attraction and Retention 25Formal Performance Management/Development Framework 25Performance Management System Elements 25Performance Management System Elements – Tracking 26Workforce Planning Activity 27Workforce Planning Activity – Tracking 27Workforce Planning Challenges 28Workforce Planning Challenges – Tracking 29High Performers Identification Strategy 30High Performers Identification Strategy – Tracking 30Most Utilised Benefits 31Targeted Initiatives to Retain Specific Groups 32Breach Investigations34Time Taken to Complete Investigations 34Number of Alleged Breaches of s9 of PSMA 35Total Number of Sanctions Applied for Completed Investigations 36Measures to Ensure Consistency 37Measures to Ensure Consistency – Tracking 38Measures to Ensure Sanctions are Imposed 39Measures to Ensure Sanctions are Imposed – Tracking 39Preventing Bullying and Harassment 40Systems for Employees to Report Bullying and Harassment 40Employee Assistance Provider 41Bullying and Harassment Reports 41
2.4 Managing Underperformance 42
PAGE 3STATE OF THE SERVICE REPORT 2013

C o m m i s s i o n e r f o r P u b l i c A d m i n i s t r a ti o n
Underperformance Investigations 42Procedures for Managing Underperformance 43ACTPS Administrative Review and Investigations Panel Engagement 43
2.5 Respect, Equity and Diversity Framework 44RED Framework Measure 44Strategy 44Tools to Promote RED Framework 45Tools to Promote RED Framework – Tracking 45Access to RED Folder and Other Resources 46Method of Providing Staff Access to RED Resources 46Diversity Census Process 47Review of Recruitment Process, HR Process and Forms 47
2.6 People with a Disability 48Actions to Assist People with Disability 48Actions to Assist People with Disability – Tracking 48Recruitment Strategies for People with Disability 49Recruitment Strategies for People with Disability – Tracking 50Retention Strategies for People with Disability 51Retention Strategies for People with Disability – Tracking 51Reasonable Adjustment 51Applications to Employment Assistance Fund (EAF) 52Accessibility Audits (Timeline) 52Accessibility Audits (Timeline) – Reported in 2011/2012 53Disability Employment Network 54
2.7 Aboriginal and Torres Strait Islander People 55Strategies to attract Aboriginal and Torres Strait Islander People 55Strategies to attract Aboriginal and Torres Strait Islander People – Tracking 55Strategies to Retain Aboriginal and Torres Strait Islander People 56Strategies to Retain Aboriginal and Torres Strait Islander People – Tracking 57Further Strategies for Aboriginal and Torres Strait Islander Employees 58Further Strategies for Aboriginal and Torres Strait Islander Employees – Tracking 58Number of Aboriginal and Torres Strait Islander Liaison Officers 59Aboriginal and Torres Strait Islander Recruitment Package 59Aboriginal and Torres Strait Islander Recruitment Package – Tracking 59
2.8 Fraud and Risk 61Formal Risk Assessment of Agency 61Plans to Review the Risk Assessment 61Fraud and Corruption Prevention Plan 62Plans to review the Fraud and Corruption Plan 62Risk Category 62Risk Category – Tracking 63Occurrence of Risk Incidents 63
WORKFORCE PROFILE 2012-13 64
3.1 ACT public sector – ACT Public Service and other ACT public sector Agencies 64Table 1: ACT public sector - ACT Public Service and other ACT public sector agencies 65
3.2 ACT public sector – Workforce Summary 66Table 2: ACT public sector – Workforce Summary (2011-12 and 2012-13) 67
3.3 ACT Public Service – Workforce Summary 68Table 2a: ACTPS employee numbers (2008-09 to 2012-13) 69Table 2b: ACTPS workforce characteristics (2008-09 to 2012-13) 70Table 2c: ACTPS diversity (2008-09 to 2012-13) 71Table 3: ACTPS FTE and headcount by employment modes (June 2013) 72Figure 1: FTE by employment mode (June 2013) 72Table 4: ACTPS FTE and headcount by classification group (June 2012 and June 2013) 73Table 5: FTE by agency (June 2012 and June 2013) 74
PAGE 4STATE OF THE SERVICE REPORT 2013

C o m m i s s i o n e r f o r P u b l i c A d m i n i s t r a ti o n
Table 6: FTE by agency and employment mode (June 2013) 75Figure 2: FTE by agency and employment mode (June 2013) 75Table 7: Headcount by agency and employment mode (June 2013)76Table 8: Headcount by classification group and agency (June 2013) 77Table 9: FTE and headcount by agency and division (June 2013) 78
3.4 Remuneration 83Figure 3: Headcount by superannuation scheme (June 2013) 83Figure 4: Salary profile by gender (June 2013) 84Table 10: Full-time employee salaries by generation and gender (June 2013) 84Table 11: Full-time employee salaries by length of service and gender (June 2013) 85Table 12: Part-time employee salaries by generation and gender (June 2013) 85Table 13: Part-time employee salaries by length of service and gender (June 2013) 86Table 14: Gender pay gap in the ACTPS, ACT and Australia (June 2013) 87Figure 5: Gender pay gap by age cohort (June 2013) 87Table 15: Gender pay gap by classification group (June 2013) 88
3.5 Time-to-hire and separation rates 89Table 16: Time-to-hire (2012-13) 89Table 17: Separation rates by classification group (2012-13) 90Table 18: Separation rates by agency (2012-13) 91Table 19: Separation rates by generation (2012-13) 91
3.6 Age and Length of Service 92Table 20: Definition of generations 92Table 21: Headcount by generation and gender (June 2013) 92Figure 6: Generation and gender as a proportion of headcount (June 2013) 93Table 22: Age and length of service by agency and gender (June 2013) 93Figure 7: Age distribution by gender (June 2013) 94Table 23: Age and length of service by classification group and gender (June 2013) 95
3.7 Leave 96Table 24: Annual leave usage by classification group and gender (2012-13) 96Table 25: Annual leave usage by agency and gender (2012-13) 97Table 26: Personal leave usage and absence rate by classification group (2012-13) 98Table 27: Personal leave usage and absence rate by agency (2012-13) 99
3.8 Diversity 100Table 28: Diversity in the ACTPS (June 2013) 100Table 28: Diversity in the ACTPS (June 2013) (cont’d) 101Table 29: Diversity by classification group (June 2013) 102Table 30: Diversity by agency (June 2013) 103
Table 31: Cultural Facilities Corporation (June 2013) 1043.9 Summary of ACT public sector Agencies external to the ACT Public Service 105
Table 32: Summary of ACT public sector agencies external to the ACT Public Service (June 2013) 105Table 33: Divisions of ACT public sector agencies external to the ACT Public Service (June 2013) 106
3.10 Statutory Officer Holders 107
APPENDIX 1 - ABBREVIATIONS USED IN THIS REPORT 108
APPENDIX 2 - DEFINITIONS 110
PAGE 5STATE OF THE SERVICE REPORT 2013
C o m m i s s i o n e r f o r P u b l i c A d m i n i s t r a ti o n
Introduction
Through the course of 2012-13, the ACT Public Service (‘ACTPS’) has continued to provide crucial and valued infrastructure and services to the people of the Australian Capital Territory (‘ACT’) and the surrounding region. The year has been punctuated by a general election for the Legislative Assembly for the ACT (including the attendant caretaker period) and highlighted by an extensive program of events associated with the Centenary of Canberra.
The year has been one of consolidation for the ACTPS, during which there has been a continuing focus on embedding and fostering the values and signature behaviours articulated in the ACTPS Code of Conduct 2012, (‘the Code of Conduct’) promulgated in October 2012. Significant effort has been directed to an ongoing conversation about expectations of behaviour within the Service. Practical manifestations of that Code of Conduct have been developed and implemented including a new ACTPS Performance Framework, and in relation to employment and performance management for executives.
Important reform has been implemented in relation to public interest disclosure legislation, reflecting a continuing focus of effort in pursuit of the government’s integrity framework and agenda. The Public Interest Disclosure Act 2012 (‘PID Act’) came into effect on 1 February 2013, providing a new framework for the making of disclosures and establishing greater protections for disclosers. The PID Act provides for a range of opportunities for protected disclosures to be made, including directly to the media or a Member of the Legislative Assembly in limited circumstances.
During the year, the ACTPS has continued to strive for greater efficiency and effectiveness in service delivery in pursuit of the Government’s agenda and priorities. In part this has reflected the realities of the fiscal climate in Australia, and globally, which continue to challenge all public services around the country. Reflecting the ACTPS values of collaboration and innovation in particular, there are a number of pilot programs being run across the Service, for example in relation to supporting vulnerable families. These are beginning to show promising results in improving service delivery outcomes with a coordinated and cohesive approach adopted across directorates and with other providers of valued services.
The coming year will see a continuation of individual and collective effort across the Service to further embed the ACTPS values and signature behaviours and to foster positive workplace cultures across the Service. It will also see a continuation of reform to the Public Sector Management Act 1994, and efforts to streamline the administrative processes that support the efficient functioning of the ACTPS.
I have published as a companion to this report a separate volume reporting on my review of complaints of bullying, harassment and other misconduct at the Canberra Institute of Technology. The systemic learnings contained in that report are applicable across the ACTPS. It is my hope that the focus in that report on enhancing management skills and capabilities, early and local resolution of workplace issues, and dealing with colleagues fairly, decently and respectfully will be evident in all ACTPS workplaces in the coming year.
Andrew Kefford
PAGE 6STATE OF THE SERVICE REPORT 2013
C o m m i s s i o n e r f o r P u b l i c A d m i n i s t r a ti o n
Commissioner for Public Administration Annual Report 20131.1 Performance and Financial Management Reporting
The Office of the Commissioner for Public AdministrationUnder section 18 of the Public Sector Management Act 1994 (‘PSM Act’), the Chief Minister may appoint a person as Commissioner for Public Administration (‘the Commissioner’). During the reporting period the Commissioner held powers and responsibilities under the PSM Act and the Public Sector Management Standards 2006 (‘the Standards’) in relation to the management of the ACTPS including to:
advise the Chief Minister on the management of the Service as a whole; make or amend Public Sector Management Standards; with the approval of the Chief Minister, authorise management reviews in relation to the Service or
functions of the Service, in whole or in part; conduct inspections of, make inquiries or undertake investigations into the operations of government
agencies; exercise any other functions given to the Commissioner by law; and redeploy an officer from the Service in certain circumstances.
In addition to powers prescribed in the PSM Act and Standards, the Commissioner holds powers and/or obligations under the:
Public Interest Disclosure Act 2012; Safety, Rehabilitation and Compensation Act 1988 (Cwlth); Commissioner for the Environment Act 1993; ACTPS Enterprise Bargaining Agreements; Freedom of Information Act 1989; and Legal Aid Act 1977.
The Commissioner for Public AdministrationThe Commissioner is a part-time role. The incumbent, Mr Andrew Kefford, also serves as the Deputy Director-General Workforce Capability and Governance Division in the Chief Minister and Treasury Directorate (‘CMTD’). Mr Kefford held the Office of Commissioner during the whole reporting period.
For the purposes of management efficiency, the Commissioner makes use of the staff resources of the Workforce Capability and Governance Division within CMTD. Information on the Division can be found in the CMTD Annual Report which is available on the CMTD website (www.cmd.act.gov.au).
Overview and the Management of the ACTPSThe Commissioner plays a key role in promoting a positive workplace culture and standards of professional conduct across the ACT public sector. The ACTPS Code of Conduct and Public Interest Disclosure legislation are key examples of this work. The Commissioner champions strategic investment in capability and capacity building, including talent recruitment and leadership development programs at whole of government level.
The Commissioner also has investigative powers under the PSM Act and can provide information and recommendations to the Head of Service, Directors-General and agency heads. As a result of examining
PAGE 7STATE OF THE SERVICE REPORT 2013
C o m m i s s i o n e r f o r P u b l i c A d m i n i s t r a ti o n
individual grievances, the Commissioner is able to distil systemic learnings for application across the ACT public sector.
Strategic BoardThe Commissioner is a member of the ACTPS Strategic Board, which provides direction on whole of government issues, including in relation to the management and development of the ACTPS workforce.
Delegation of PowersUnder section 36 of the PSM Act, the Commissioner has the power to make delegations.
The Commissioner delegated the powers of the office on two occasions during the reporting period (during which he was either on leave or reassigned to other duties) to:
the Director and Acting Director, Public Sector Management in CMTD (Ms Liesl Centenera and Mr Greg Haustead respectively) at different times encompassing the period 15 December 2012 to 28 January 2013 inclusive; and
the Director, Workers Compensation and Continuous Improvement in CMTD (Ms Meg Brighton) for the period 6 May 2013 to 17 June 2013.
Work Safety, Rehabilitation and Workers’ CompensationBy notice under the Safety, Rehabilitation and Compensation Act 1988 (Cwlth) (‘SRC Act’), the Commissioner is identified as the principal officer of the Territory for the purposes of that Act and in that capacity has overall responsibility for workers’ compensation for the ACT public sector (excluding ACTEW Corporation Limited). During the reporting period, ACTEW exited the Comcare scheme.
The ACTPS Workers’ Compensation and Work Safety Improvement Plan (‘the Improvement Plan’) was instigated by the Government in the 2011-12 Budget having been endorsed by the Strategic Board in September 2011.
The Improvement Plan consists of a series of aligned and mutually reinforcing elements designed to significantly improve the ACTPS’s management of workers’ compensation and work health and safety issues. The elements include:
a sector-wide case management model; strengthening the capability of case managers; building stronger people management skills in managers of staff; implementing enhancements to the existing ACTPS redeployment framework; a strengthened partnership agreement and working relationship with Comcare; enhanced performance monitoring and reporting; establishment of a workers’ compensation review and disputes committee to assist the
ACT Government to fulfil its governance obligations; implementation of the Work Health and Safety Act 2011 (‘WHS Act’) in the ACTPS ; and development and implementation of a new accident and incident ICT system.
Throughout 2012-13 considerable progress was made on the improvement plan:
CMTD has continued to co-ordinate a meeting of work health and safety professionals from across the Service to identify, develop and execute a range of strategies to assist with the implementation of the Work Health and Safety Act 2011 (‘the WHS Act’).
Elements of the new case management model have been implemented, including:
PAGE 8STATE OF THE SERVICE REPORT 2013
C o m m i s s i o n e r f o r P u b l i c A d m i n i s t r a ti o n
o better screening and triage of injured workers;o application of new policy, processes and procedures to support injured workers to return to
work; o regular and systematic review of progress in returning injured workers to work; ando a case manager capability development and strengthening program.
Enhanced approaches to building people management capabilities for managers and supervisors across the ACTPS continued to be implemented with the piloting and implementation of:o HR master class training for experienced supervisors and managers; o training for supervisors and managers on managing workers with an injury; ando additional specific training on managing workers with a psychological injury provided by an
organisational and clinical psychologist. A new ‘fee for milestone and outcome’ based performance management and accountability model
for the engagement and management of rehabilitation provider services has been developed. Following an evaluation of the initial pilot, the model has been enhanced with a new methodology for varying the amount a workplace rehabilitation provider will be remunerated for achieving return to work outcomes in more complex cases. A revised model is currently being piloted. This continues a strong evidence-based approach to development and implementation of initiatives under the Improvement Plan.
Significant progress has been made on the development of an on-line accident and incident reporting system. This will allow faster reporting and improved support services to maintain an injured worker while at work or in returning them to work.
A quality assurance framework was developed to articulate the standards against which case management of injured workers will be measured. The framework provides for a quarterly internal audit against the standards to identify areas of strength and opportunities to improve performance.
New guidelines which detail requirements on how the ACT Government must execute its rehabilitation functions under the SRC Act commenced in July 2013. An independent assessment of the ACT Government’s rehabilitation management systems against the requirements of the guidelines was conducted and a work plan developed to ensure conformance.
A whole of government health and wellbeing policy and network has been established to encourage staff to lead a healthy lifestyle.
The Improvement Plan has been successful in improving performance by ACT public sector directorates and agencies in managing health and safety risks, providing support to injured workers, and supporting rehabilitation and return to work programs for individuals. In determining the outcome of the Commissioner’s appeal of the 2012-13 premium, Comcare recognised sustained improved performance in reducing the ACT public sector premium by $2.3 million. The ACT public sector total premium bill would have been $7 million higher in 2012-13 had it not been for the Improvement Plan.
Sustained effort will be required to continue the necessary improvements in the ACT public sector’s workers’ compensation performance. This will remain a significant area of focus for the Commissioner in 2013-14, as it will for all directorates and agencies.
Review of the Public Sector Management Act 1994Work has commenced on a comprehensive review of the PSM Act, to which the Commissioner has contributed, and will continue to do so. This process was recommended by Dr Allan Hawke AC in his review of the structure and capacity of the ACT public sector, which was published in February 2011, but the path adopted has evolved over time. Amendments were made to the PSM Act from 1 July 2011 giving
PAGE 9STATE OF THE SERVICE REPORT 2013

C o m m i s s i o n e r f o r P u b l i c A d m i n i s t r a ti o n
effect to the single enterprise structure of the ACTPS under the Head of Service. Following those structural changes, a process of dialogue and consultation with staff was undertaken, the end product of which was the ACTPS values and signature behaviours announced by the Head of Service in May 2012, and enshrined in the ACTPS Code of Conduct made by the Commissioner in October 2012.
A commitment has been given to release a discussion paper in late 2013 addressing a number of areas of possible reform and modernisation. The intention is that such reforms will be founded on the values and signature behaviours. A significant area for discussion in that context will be the employment framework.
The current ACTPS employment framework has enterprise agreements as the primary source of entitlements for non-executive staff, and this will continue given the status of those agreements under the Fair Work Act 2009 (Cwlth) (‘the Fair Work Act’). The PSM Act and Standards specify the values and principles underlying the ACTPS (including merit), create legal authority for actions in relation to staff and provides the main source of entitlements for executives. However, the PSM Act and Standards also include additional rights, protections, obligations and entitlements for non-executive staff. Supporting the agreements, PSM Act and Standards is a combination of whole of government and/or agency-based policies and guidelines that have grown out of the need to supplement and explain how the agreements and legislation operate alongside each other.
The result is a complex employment framework with sometimes overlapping and/or inconsistent obligations, which are susceptible to being interpreted differently within directorates. The lack of clarity and certainty has often resulted in staff misunderstanding their entitlements, which in turn has led to unnecessary confusion.
To simplify and modernise the employment framework, there will need to be an holistic approach to reforming all of its elements. This level of change will require consistent effort during the life of the next series of enterprise agreements (which are under negotiation at the time of writing) including in relation to necessary and detailed consultation with staff and their representatives.
With this in mind, a staged approach to the review of the PSM Act is envisaged, with Stage 1 encompassing:
public sector values and standards (including sanctions for their breach); the organisation of government (structural issues, machinery of government); and executive arrangements.
A further significant element of this stage will be consideration and clarification of the role of the Commissioner. This recognises the reallocation of powers from the Commissioner to the Head of Service in 2011, as well as the increasing role for the Commissioner in relation to setting and enforcing standards of conduct and behaviour.
A further issue for consideration will be whether or not it is necessary to formalise the powers assumed to rest with the Commissioner in relation to the conduct of investigations – short of a management review. Experiences in the conduct of the Commissioner’s review of allegations of bullying and other misconduct at the Canberra Institute of Technology will shape this aspect of the process.
Consequential Amendments to the Public Sector Management Act 1994Consequential amendments to the PSM Act were contained in the Legislative Assembly (Office of the Legislative Assembly) Act 2012 (‘the OLA Act’), which came into effect on 1 July 2012. The OLA Act removed provisions in the PSM Act relating to the clerk and the Assembly Secretariat and created a new Office of the
PAGE 10STATE OF THE SERVICE REPORT 2013

C o m m i s s i o n e r f o r P u b l i c A d m i n i s t r a ti o n
Legislative Assembly as an autonomous instrumentality. It also made changes to the role of the Commissioner.
The OLA Act provides for a process for the Commissioner to investigate the Office of the Legislative Assembly with the written approval of the Speaker. Once that approval is given, the Commissioner is not subject to the direction of the executive or the Speaker. This process parallels the management review process.
The OLA Act also repealed the provisions in the PSM Act relating to the appointment of the Clerk of the Legislative Assembly. Staff of the Office of the Legislative Assembly remain officials engaged under the PSM Act, but Head of Service powers are vested with the Clerk (appointed under the OLA Act) for matters relating to their employment. The OLA Act includes a provision to ensure the Office of the Legislative Assembly exists within an appropriate whole of government public sector management framework where good practice workplace environment programs and policies apply.
Amendments to the Public Sector Management Standards 2006The Commissioner is empowered under section 251 of the PSM Act, with the approval of the Chief Minister, to make and amend Standards for the purpose of the PSM Act. During the reporting period two sets of amendments to the Standards were made:
DI2012-238 (effective 1 July 2012)
This set of amendments substitutes a new Part 2 into the Standards.
Part 2.1 of the amended Standards requires the Commissioner to make a Code of Conduct that applies to all government agencies and employees engaged under the PSM Act. The ACTPS Code of Conduct supports the execution of public sector functions in accordance with the principles set out in the PSM Act sections 6 to 9. The new Code was launched by the Commissioner in October 2012.
The Standards allow the Commissioner to approve the creation of supplementary Codes of Conduct that enable the head of an agency to address aspects of conduct that are specific to a particular occupation, classification or workplace.
Part 2.2 of the amended standards introduces the employee values of respect, integrity, collaboration and innovation and requires them to be demonstrated by ACT public sector staff while performing their duties. The ACTPS Code of Conduct acknowledges the diversity of the workforce in the ACT public sector, and recognises the importance of being able to express the values in different ways depending on a person’s role and workplace. The values are used to inform and evaluate management practices, performance and the implementation of government policy.
Part 2.3 was renamed from ‘Integrity’ to ‘Fraud and Corruption’ in order to avoid confusion with the employee value of ‘integrity’.
Part 2.4 contains re-drafted provisions relating to ‘reasonable care and skill’, ‘conflict of interest’, ‘personal use of IT resources’ and ‘Commissioner’s functions and powers’ for improved clarity. The effect of the provisions has not changed.
DI2012-187 (effective 6 July 2013)
Although not commencing until after the reporting period, the Commissioner developed new standards in relation to the engagement and performance management of executives under the PSM Act. These
PAGE 11STATE OF THE SERVICE REPORT 2013
C o m m i s s i o n e r f o r P u b l i c A d m i n i s t r a ti o n
amendments addressed obstacles in relation to the recruitment of executives, as well as a desire to streamline appointment processes. This work also reflected a deliberate intention, in consultation with the Head of Service, to extend the ACTPS values and signature behaviours to the Executive and embed expectations relating to conduct and performance in a performance management framework.
The new standard provides for a degree of flexibility to respond to issues surrounding the recruitment of executive employees by creating a power for the Head of Service to fix remuneration above the level set by the Standards and the ACT Remuneration Tribunal in limited circumstances.
It also imports to the Standards conditions of employment that have previously been included in standard form executive employee contracts, either directly, by reference or implication. The aim of these changes is to simplify the employment framework that applies to executive employees by placing the majority of their conditions of employment in one instrument. It also establishes a new performance management regime for executive employees, mirroring that announced by the Head of Service for non-executve employees. The provisions create requirements for a more rigorous and contemporary performance arrangement, with particulars to be determined by policy. The provisions also specify procedures and consequences relating to misconduct and underperformance.
2012 General Election Guidance on Caretaker Conventions
In anticipation of the Legislative Assembly (‘the Assembly’) general election in October 2012, in June 2012 the Commissioner and Head of Service reissued revised Guidance on Caretaker Conventions. The guidelines provided direction on what government business could be undertaken during the pre-election period; restrictions on the use of government premises and resources during that period; and guidance for publicly funded communications. It also offered guidance to public servants wishing to participate in election activities.
The guidelines were updated in September 2012 to reflect the passage by the Assembly of the Election Commitments Costing Act 2012.
The Commissioner, along with the Head of Service, played a key role in providing on the interpretation and application of the guidelines to particular circumstances through the pre-election period.
The Standing Committee on Public Accounts, in the report of its inquiry into Annual and Financial Reports 2011-12, recommended the Commissioner undertake a review of aspects of the Caretaker Guidelines. This will be undertaken prior to the 2016 Assembly election.
Agency SurveyThe 2012-13 survey provided the Commissioner with a range of information in relation to broad management trends emerging across the ACTPS. To complement the ACTPS Workforce Profile, the Commissioner has sought more detailed information from agencies about people management practices across the ACTPS in the form of a short agency survey covering areas such as values, ethics and culture, workplace equity and diversity, workforce planning, attraction and retention, and human resource management.
The Agency Survey starts at page 22.
Workforce ProfileThe ACTPS Workforce Profile is published by the Commissioner each financial year and provides a comprehensive, quantitative picture of the ACTPS. The ACTPS Workforce Profile captures aggregate workforce statistics and identifies trends that impact the ACTPS.
PAGE 12STATE OF THE SERVICE REPORT 2013
C o m m i s s i o n e r f o r P u b l i c A d m i n i s t r a ti o n
The ACTPS Workforce Profile starts at page 64.
ACTPS Development ProgramsA number of whole of government professional development programs were offered across the ACTPS during the reporting period. In addition to strengthening the capabilities of participating staff, whole of government programs also offer the opportunity to build collaboration and strong networks across the ACTPS.
The Executive Leadership Development Program is designed to assist executives in forming a strategic mindset towards their roles and to identify and develop key capabilities required at the executive level. It was held over a number of sessions between October and December 2012 and had 13 participants.
The Future Leaders Development Program is designed to prepare managers for the challenges of operating effectively at the senior manager level. There were 25 participants for the course which ran from October 2012 to December 2012.
ACTPS Graduate ProgramThe ACTPS graduate program recruits talented graduates to the ACTPS. Participants undertake the Graduate Certificate in Public Administration within the Australian and New Zealand School of Government Institute for Governance (‘ANZSIG’) at the University of Canberra. This is a new initiative, introduced for the 2013 program, to offer an enhanced learning and development component that provides participants with a higher level qualification.
For the 2013 calendar year, 35 graduates are undertaking the ten-month work-based learning and development program. This has increased from the 28 Graduates who commenced the program in 2012.
Work Safety CouncilThe Work Safety Council is appointed by the Minister for Workplace Safety and Industrial Relations under the WHS Act. The Council is responsible for advising the Minister on matters relating to work safety and workers’ compensation. In 2012 -2013, the Work Safety Council gave advice on a range of proposals to improve the operation of the ACT private sector workers’ compensation scheme, including the development of an alternative regulatory funding model, asbestos disease compensation reform and insurer regulation and compliance auditing. The Commissioner is appointed to the Council as a representative of employers, and in that capacity represents the interests of the ACTPS on the Council.
Joint CouncilThe Commissioner chairs the ACTPS Joint Council established under the PSM Act. Joint Council is the peak union and management consultative committee for the ACTPS and provides a forum for the consideration and exchange of information on matters of strategic interest to ACT Government employees and staff organisations.
Matters of strategic interest to the ACTPS are not defined under the rules of the Joint Council, but instead are considered to be any significant issue that has, or might have, a multi-directorate impact upon the employment of ACT Government employees. These matters include:
significant whole of government industrial relations issues; significant whole of government human resource issues; and significant administrative and communication issues.
Industrial Relations
PAGE 13STATE OF THE SERVICE REPORT 2013
C o m m i s s i o n e r f o r P u b l i c A d m i n i s t r a ti o n
Enterprise agreements made under the Fair Work Act grant the Commissioner certain powers. In limited circumstances, agreement provisions permit the Commissioner to carry out certain tasks related to employment in the Service. These powers were not exercised in the reporting period.
1.2 HighlightsAnnual PrioritiesThe Commissioner’s annual priorities outline areas for specific focus within the responsibilities of the Commissioner and are endorsed by the Chief Minister. The Commissioner’s priorities for 2012-13 remained unchanged from the previous year and comprise:
with the Head of Service, fostering a positive workplace culture and high standards of behaviour in the ACTPS;
investigating individual employment related grievances with a view to distilling systemic learnings that might be applied across the ACTPS and assisting individuals to attain improved process outcomes; and
promoting high standards of public administration in the ACTPS, including in relation to complaints handling, and provision of guidance on acceptable behaviours and standards of conduct for officials.
At the time of writing, it is anticipated that an additional priority will be added in 2013-14 in relation to opportunities to remove or reduce internal red tape which adds inefficiency to ACTPS administrative procedures.
ACT Public Service Values and Signature Behaviours Following the development of the ACTPS Values and Signature Behaviours during 2011-12, further reforms have taken place to embed a positive workplace culture and behaviours into every everyday practice across the Service.
ACTPS Code of ConductIn October 2012 the Code of Conduct was made by the Commissioner for Public Administration under the Public Sector Management Standards 2006. The Code of Conduct builds on the Values and Signature Behaviours and provides further guidance on what demonstration of them looks like in practice. Given the diversity of work undertaken across the ACTPS, the way that individuals and teams display the values and signature behaviours will vary depending on the type of work they do. The Code of Conduct is not intended to impose standardised behaviours on all staff, but provides guidance on the sorts of behaviours that are expected of all ACTPS employees. In so doing, it provides guidance on behaviours that are consistent with the requirements of Section 9 of the PSM Act.
Following the launch of the Code of Conduct a series of workshops was held for executives recognising the critical role they play in leading change and modelling desired standards of behaviour. All executive staff across the ACT public sector were required to attend. The workshops supported executives in engaging their teams on the Values and Signature Behaviours and leading by example.
ACTPS Performance Framework The new ACTPS Performance Framework, which was launched by the Head of Service on 10 July 2013 further embeds Values and Signature Behaviours in work practice. The new framework explicitly defines staff work performance in terms of:
PAGE 14STATE OF THE SERVICE REPORT 2013

C o m m i s s i o n e r f o r P u b l i c A d m i n i s t r a ti o n
services, projects, outputs and deliverables: the work that staff do, the Services delivered and the outputs produced;
behaviour: how staff do their work and interact with people; and
knowledge and skills: the knowledge, skills and capabilities that staff need in order to do their jobs well.
This is the first time that the ACTPS has had a single common approach to performance management across agencies, and the ACTPS values and signature behaviours are the cornerstone.
All staff surveyIn late 2013 a survey of all ACT public sector staff will be conducted for the first time at a whole of service level. While a number of agencies currently undertake their own periodic staff surveys, a sector-wide survey will enable benchmarking and comparison across agencies. It will provide data on the first-hand experience of staff in relation to whether the values and signature behaviours are visible in their immediate workplaces. It will also provide data on the effectiveness of performance management arrangements.
It is intended that the survey be designed in a manner that will enable benchmarking of data and comparison of trends with other Australian public services. This has taken some time to establish and as a result the survey – originally foreshadowed to be included in this report - will be held later than planned and reported separately.
The 2013 survey findings will be published in a separate report. It remains the intention that the results of future surveys will be consolidated in the State of the Service.
Public Interest DisclosureThe Public Interest Disclosure Act 2012 (‘the PID Act 2012’) came into effect on 1 February 2013, repealing and replacing the former Public Interest Disclosure Act 1994. The new legislation provides stronger protection for whistle blowers and initiates more rigorous procedures for the making and investigation of public interest disclosures.
The PID Act 2012 creates significant new responsibilities and powers for the Commissioner. In effect, it establishes the Commissioner as one of a small number of disclosure officers with a remit covering the whole public sector. It establishes a general role for the Commissioner in setting guidelines on relevant processes and charges the Commissioner with overseeing the way that public sector organisations manage public interest disclosures. The PID Act 2012 requires that the Commissioner be kept informed of progress and any decisions made in relation to a disclosure.
The Commissioner is also able, in certain circumstances, to review and overturn decisions made by public sector organisations, and to direct organisations to take or not take particular actions in response to a disclosure. Recognising this power to intervene, and the general responsibility for the public interest disclosure regime, the Commissioner has no powers to investigate a disclosure at first instance, and must refer disclosures received in accordance with the procedures established in the PID Act.
The Commissioner has also been given an explicit power to report to the minister about a disclosure.
The Commissioner has developed the Public Interest Disclosure Guidelines 2013 to assist ACT public sector entities to meet their obligations under the PID Act. This serves as a foundation for all ACT public sector entities to develop their own internal procedures to deal with public interest disclosures.
PAGE 15STATE OF THE SERVICE REPORT 2013
C o m m i s s i o n e r f o r P u b l i c A d m i n i s t r a ti o n
The guidelines comprise two parts. Part one provides the overarching definition of what constitutes a public interest disclosure. Part two guides internal coordination and management of disclosures within the ACT public sector, and supports those with direct responsibility for managing public interest disclosures within their respective entity.
The guidelines have been developed in consultation with the Senior Executives Responsible for Business Integrity and Risk group, which comprises members from across the government, and will be reviewed periodically to ensure it meets the needs of users.
The guidelines were notified in June 2013 and relevant officers undertook training as provided jointly by the Commissioner and the Government Solicitor’s Office in July 2013.
In her article of 15 November 2012, The 5 Phases of Whistleblowing, Dr Suelette Dreyfus, Principal Researcher on the World Online Whistleblowing survey and Research Fellow at The University of Melbourne, notes: “the ACT’s law is presently the world’s best in a number of areas. It has garnered well-deserved praise from commentators and critics alike for raising the bar”.
A whole-of-government public interest disclosure management system is nearing completion and will provide a streamlined mechanism to permit the Commissioner to monitor and oversee the handling of public interest disclosures.
No disclosures were received by the Commissioner in the period July 2012 - February 2013. Five disclosures were received under the new legislation before 30 June 2013, all of which remained under investigation at that date.
ACT Public Service Awards for ExcellenceThe second ACTPS Awards for Excellence ceremony was held on Friday 31 May 2013 at which the Chief Minister, Ms Katy Gallagher MLA presented winners in all six categories: Respect, Integrity, Collaboration, Innovation, Leadership and Excellence.
There were 20 finalists from 110 nominations across the ACTPS including individuals and teams nominated for their outstanding commitment to serving the people of the Australian Capital Territory.
The first four categories centred on the ACTPS Values and Signature Behaviours (Respect, Integrity, Collaboration and Innovation) with the final two categories recognising Leadership and Excellence across the Service. The award winners are public servants who are acknowledged for their dedication and efforts in going ‘above and beyond’ in their day to day work.
The nominations included individuals, team level initiatives and larger projects from across the ACTPS. Six award winners were selected from these nominations by a judging panel comprising Mr Andrew Cappie-Wood, Head of Service, Ms Meg Brighton, Acting Commissioner for Public Administration, Ms Annwyn Godwin, Merit Protection Commissioner, Australian Public Service Commission, and Professor Mark Evans, Director of the Australian and New Zealand School of Government Institute for Governance at the University of Canberra.
Category 1 – Respect
Winner: Doug Gillespie, Justice and Community Safety Directorate:
Doug established GreaterGood, Canberra’s first and only public charitable foundation. The close of 2012 marked the tenth anniversary of Doug’s establishment of GreaterGood and to date the foundation has raised $11.5 million and supports 65 charitable accounts which will receive perpetual benefits. Doug works tirelessly to promote the work of the foundation.
PAGE 16STATE OF THE SERVICE REPORT 2013
C o m m i s s i o n e r f o r P u b l i c A d m i n i s t r a ti o n
Category 2 – Integrity
Winner: Lynette Marsh, Economic Development Directorate:
Lynette is the project manager of the Narrabundah Long Stay Project. She was recognised for her commitment and dedication to a complex and challenging project, and for the integrity she displayed in working with residents to find mutually satisfactory outcomes.
Category 3 – Collaboration
Winner: David Joyce, Chief Minister and Treasury Directorate:
David was recognised for his work as asbestos coordinator, establishing and enhancing linkages across many organisations to ensure that asbestos is dealt with safely and efficiently. David worked with Government and external agencies ensuring the coordination of effective communication and response strategies, allowing the ACT to respond quickly and effectively maintain public safety.
Category 4 – Innovation
Winner: Irene Lake, Health Directorate:
Irene was recognised for her work in the Research Centre for Nursing and Midwifery, specifically for her innovative management which reduced incidences of pressure injuries amongst hospital and aged care patients within the ACT. Irene educated and coordinated over 165 staff across ACT Health and Calvary Healthcare ACT, resulting in a sustained improved in patient outcomes and more cost effective clinical practices.
Category 5 – Leadership
Winner: Human Resources Team, Territory and Municipal Services Directorate:Sue Dever, Pamela Best, Rebecca Davis, Melina Gannon, Phil Haarburger, Michael Ireland, Kim Ivens, Georgina James, Pauline Jenkins, Jacob Mimilidis , Dione Nair, Jill Reay-Smith, Andrew Staniforth, Glenda Stewart, Roslyn Vest, Steven Wright and Justin Wunsch.
The Human Resources Team was recognised for demonstrating leadership through focusing on building organisational capacity across their diverse Directorate. The team showed leadership in developing innovative programs that added value in the support of all staff, which has been instrumental in sustaining a positive workplace culture.
Category 6 – Excellence
Winner: After Hours Bail Support Service Team, Community Services Directorate:
The After Hours Bail Support Service was developed and implemented by a small team of dedicated youth justice workers and delivered an excellent service response which has contributed to a decrease in the numbers of young people in detention. Through the efforts of the team, the long term benefits of the program are starting to become visible, with both numbers of young people detained and average custody nights declining significantly.
1.3 ComplaintsDuring the reporting period the Commissioner received 37 complaints from officials across the ACT public sector in relation to the conduct of their colleagues, as well as employment related processes (principally disciplinary) to which they were subject.
PAGE 17STATE OF THE SERVICE REPORT 2013

C o m m i s s i o n e r f o r P u b l i c A d m i n i s t r a ti o n
The level of activity continued to increase, and reflects in part at least, the impact of efforts made in embedding the RED Framework and Code of Conduct to create a common language, structure, and permission within the ACTPS for officials to speak out about alleged poor behaviour by their colleagues.
As was the case in 2011-12 complaints can be grouped under two broad headings:
allegations of misconduct (including bullying and harassment) by colleagues; and perceived process shortcomings in employment-related disciplinary and recruitment processes,
including most commonly in relation to provision of procedural fairness.
The Commissioner assisted in the resolution of 30 matters, with seven matters still in progress. In the reporting period the Commissioner received:
three issues from the Environment and Sustainable Development Directorate which are all ongoing; one issue from the Economic Development Directorate which is closed; two issues from the Territory and Municipal Services Directorate which are both closed; eleven issues from ACT Health, of which one is ongoing and ten are closed; three issues from the Education and Training Directorate which are all closed; four issues from the Justice and Community Safety Directorate, of which one is ongoing and three are
closed; six issues from the Community Services Directorate, of which one is ongoing and five are closed; two issues from the Commerce and Works Directorate, of which one is ongoing and one is closed; one issue from the Chief Minister and Treasury Directorate, which is closed; one issue from Independent Competition and Regulatory Commission, which is closed; two issues from the Canberra Institute of Technology, that were referred back to CIT in the first
instance; and one issue regarding the Australian National University, which was referred to the Commonwealth
Ombudsman Office.
Given the level of internal and external attention around conduct in the ACT public sector and the release of the Code of Conduct, an increase in reports of alleged misconduct is not unexpected. During the reporting period there was an increase in complaints received by the Commissioner and it will become a matter of concern if there is not a levelling out and subsequent decline in such reports as efforts to foster positive workplace cultures begin to take effect. The whole of government survey will provide another stream of data in relation to conduct and employees’ experience of work across the Service.
In addition to providing advice on necessary remedial action or other interventions in individual cases, the Commissioner has regular conversations with the Head of Service and directorates about systemic shortcomings in ACTPS processes. These are being addressed through work being overseen by the People and Performance Council on consolidation of workforce management policies and procedures, and have been fed into work underway to develop consistent, whole of service induction training for all staff, as well as targeted and detailed training and capability building for managers of staff across the Service.
No management reviews under section 22 of the PSM Act were commissioned during the reporting period.
CIT investigationsThe first stage of the Commissioner’s review of allegations of bullying and harassment and other misconduct at the Canberra Institute of Technology (‘CIT’) was completed in the 2012-13 reporting period. The second stage of the investigation will continue in the 2013-14 reporting period and will include evidence gathering, reviews, and audits, by the CIT investigations team.
PAGE 18STATE OF THE SERVICE REPORT 2013
C o m m i s s i o n e r f o r P u b l i c A d m i n i s t r a ti o n
While work is continuing on individual investigations of alleged misconduct, the Commissioner has published a report in conjunction with this State of the Service report which provides a systemic review of concerns raised about CIT’s management of workplace issues, allegations of bullying or other misconduct and its employees. That report seeks to draw lessons for CIT and the wider ACT public sector that might inform and improve the ongoing management practices relating to staff engaged under the PSM Act.
1.4 OutlookThe Commissioner will maintain focus during 2013-14 on fostering positive workplace cultures across the ACTPS and on establishing and supporting proper standards of conduct and behaviours across the Service. This will include:
continuing focus on implementing the ACTPS Performance Framework, which embeds the ACTPS values and signature behaviours into everyday work practices and recognises that how we do our work and interact with people is just as important as what we do in our jobs;
implementing the ACTPS All Staff Survey as a means of gathering first hand data on the workplace experiences of staff and establishing a benchmark measure against which future improvements in workplace cultures and behaviour can be measured;
reviewing the Respect, Equity and Diversity Framework to ensure it continues to support a positive workplace culture and enhance the productivity and sustainability of the ACTPS workforce;
contributing to the review of the PSM Act; and
embedding processes and approaches contained in the PID Act 2012.
1.5 Consultation and scrutiny reportingInternal and External ScrutinyOn 25 October 2012 the Auditor-General released the Auditor-General’s Report No. 8 of 2012: Australian Capital Territory Public Service Recruitment Practices. The report made seven recommendations to improve the management of recruitment and appointment of individuals to higher duties across the ACT public sector.
Recommendation 1 provides that “The Commissioner for Public Administration should regularly monitor and publicly report on whole-of-government recruitment activities and trends and periodically analyse whether these align with whole-of-government workforce strategies. This should specifically include higher duties (acting) arrangements.”
In responding to the Auditor-General’s report, the initial focus has been on the review and updating of the guidance document Recruitment in the ACT Public Service to ensure that it reflects current ACTPS administrative practices and requirements (Recommendation 4 of the report). The 2014 State of the Service Report will report on whole-of-government recruitment activities and trends and comment on their alignment with whole-of-government workforce strategies. Data on recruitment processes and appointment to higher duties, in particular, will be incorporated into the workforce profile reporting.
Legislative Assembly Committee Inquiries and Reports The Standing Committee on Public Accounts, in the report of its inquiry into Annual and Financial Reports 2011-12, recommended the Commissioner undertake a review of aspects of the Caretaker Guidelines. This will be undertaken prior to the 2016 Assembly election.
PAGE 19STATE OF THE SERVICE REPORT 2013

C o m m i s s i o n e r f o r P u b l i c A d m i n i s t r a ti o n
The Select Committee on Estimates 2012-13 made a number of recommendations in relation to reporting of the Commissioner’s inquiries in relation to CIT. That matter was addressed in the 2011-12 State of the Service Report and in the report published in conjunction with this years’ State of the Service report.
The Standing Committee on Public Accounts recommended in its report of its inquiry into the Auditor-General’s Report in Relation to Emergency Department Performance Information, the Commissioner undertake work in relation to policies around privacy of personal information. The Acting Commissioner wrote to all directors-general in this regard in June 2013.
1.6 Legislative and Policy Based ReportingPublic Interest DisclosureAs a statutory office holder with responsibilities across the ACT public sector, the Commissioner is an authority for the purposes of the PID Act. Under the PID Act, all government agencies must maintain a document setting out procedures for facilitating the making of public interest disclosures and for handling such disclosures. A PID reporting system is being developed and tested to capture disclosures within one online environment.
The Commissioner received five disclosures during the 2012-13 reporting period and has referred them all to the appropriate agency head for investigation.
There were no PID matters carried over from the previous reporting period.
Aboriginal and Torres Strait Islander Reporting
An update on the ACT Public Service Employment Strategy for Aboriginal and Torres Strait Islander People 2011-2015 was provided to the ACT Aboriginal and Torres Strait Islander Elected Body at its annual hearings in May 2013, and included matters such as: career development for Aboriginal and Torres Strait Islander staff, recruiting Aboriginal and Torres Strait Islander students to the ACTPS graduate program, recruitment advertising for Aboriginal and Torres Strait Islander people, the use of identified positions as prescribed in the Public Sector Management Standards 2006, matters around entry level into the ACTPS, cadetship programs, workforce statistics and issues around retention.
An update was also provided to the Standing Committee on Public Accounts Annual and Financial Report hearings of May 2013 which included information relating to recruitment of Aboriginal and Torres Strait Islander people to the ACTPS graduate program, and matters around the implementation of the Respect, Equity and Diversity Framework.
In May 2013, the ACT Legislative Assembly Standing Committee on Health, Ageing, Community and Social Service announced an Inquiry into ACT Public Service Aboriginal and Torres Strait Islander Employment. The Head of Service and the Commissioner for Public Administration commenced the development of a detailed high-level joint Submission to the Inquiry on behalf of the ACTPS.
Whole of government reporting was further enhanced with the diversity census held during 2012, which invited all staff to update their diversity status details to reflect information that had previously not been provided or where employee circumstances had changed.
In addition, the HR21 self reporting tool has been updated to allow individual staff to anonymously enter their diversity status at their leisure. This update supports an action item in the ACT Public Service Employment Strategy for Aboriginal and Torres Strait Islander People 2011-2015.
PAGE 20STATE OF THE SERVICE REPORT 2013
C o m m i s s i o n e r f o r P u b l i c A d m i n i s t r a ti o n
Freedom of InformationDuring the reporting period the Commissioner received one request under the Freedom of Information Act 1989 (‘FOI Act’).
Reporting of performance on FOI Act matters is reported in the CMTD Annual Report given the Commissioner’s reliance on the procedures and staff of that directorate in that regard.
Human Rights Act 2004The Commissioner had regard to the Human Rights Act 2004 (‘HR Act’) in the exercise of statutory functions. Given the Commissioner does not employ staff directly, the office is not in a position to provide education and training to staff on human rights principles. The promotion of human rights is, however, implicit in the work of the Commissioner as a fundamental guiding principle.
The Commissioner did not prepare any Cabinet Submissions during the reporting period and therefore was not required to ensure human rights compliance in this regard.
PAGE 21STATE OF THE SERVICE REPORT 2013

C o m m i s s i o n e r f o r P u b l i c A d m i n i s t r a ti o n
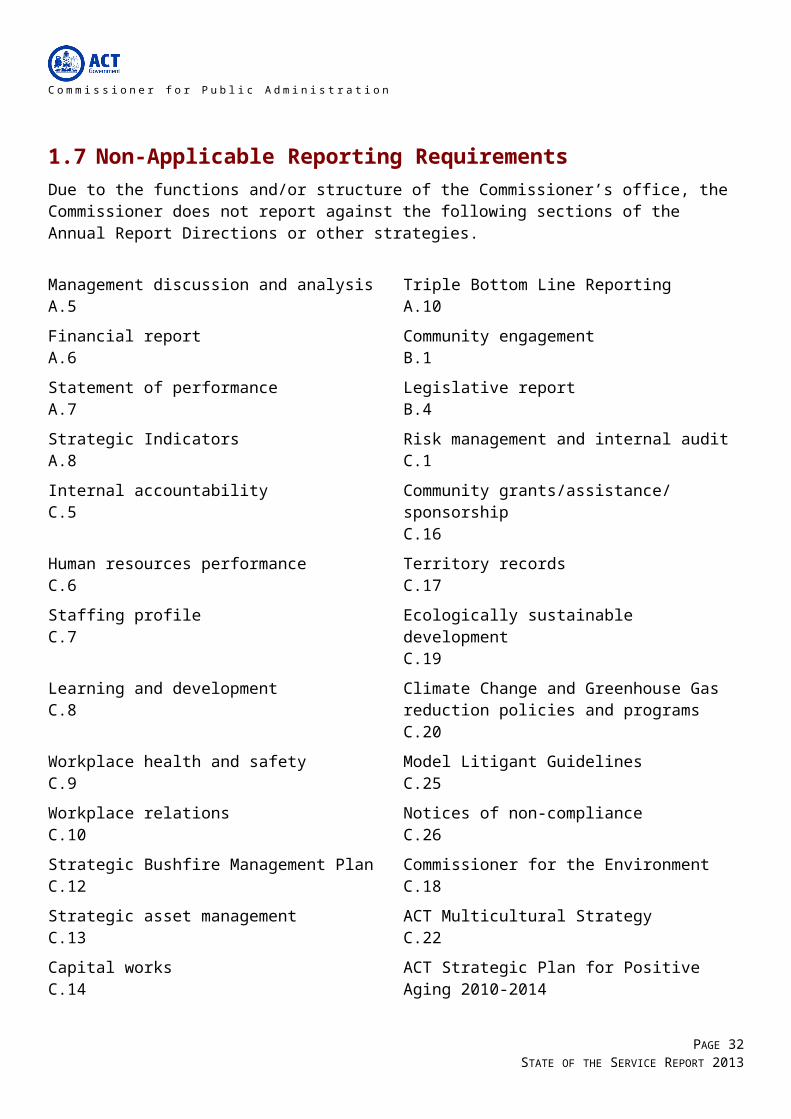
1.7 Non-Applicable Reporting RequirementsDue to the functions and/or structure of the Commissioner’s office, the Commissioner does not report against the following sections of the Annual Report Directions or other strategies.
Management discussion and analysisA.5
Triple Bottom Line ReportingA.10
Financial reportA.6
Community engagementB.1
Statement of performanceA.7
Legislative reportB.4
Strategic IndicatorsA.8
Risk management and internal auditC.1
Internal accountabilityC.5
Community grants/assistance/ sponsorshipC.16
Human resources performanceC.6
Territory recordsC.17
Staffing profileC.7
Ecologically sustainable developmentC.19
Learning and developmentC.8
Climate Change and Greenhouse Gas reduction policies and programsC.20
Workplace health and safetyC.9
Model Litigant GuidelinesC.25
Workplace relationsC.10
Notices of non-complianceC.26
Strategic Bushfire Management PlanC.12
Commissioner for the EnvironmentC.18
Strategic asset managementC.13
ACT Multicultural StrategyC.22
Capital worksC.14
ACT Strategic Plan for Positive Aging 2010-2014C.23
Government contractingC.15
ACT Women’s PlanC.24
Property Crime ReductionC.27
PAGE 22STATE OF THE SERVICE REPORT 2013
C o m m i s s i o n e r f o r P u b l i c A d m i n i s t r a ti o n
Agency Survey2.1 Introduction and MethodologyBackground and ObjectivesThe objectives of the 2013 Agency Survey are to identify, analyse and measure the progress of agencies in relation to the:
strategies employed by agencies in workforce management including attraction, retention, learning and development;
implementation of the Respect, Equity and Diversity (RED) Framework; and effectiveness of fraud and corruption strategies used by agencies.
Insightrix Research Pty Ltd was engaged to conduct the 2013 Agency Survey and host the questionnaire in an online platform. Survey results were collected between 1 July 2013 and 18 July 2013.
For the first time, the 2013 Agency Survey allows for time-series comparison, showing results for 2013 and 2012.
Machinery of Government Changes
Machinery of Government (MOG) changes, effective from 10 November 2012, saw elements of the former Treasury Directorate merged with the Chief Minister and Cabinet Directorate to form the Chief Minister and Treasury Directorate, and other elements of the former Treasury Directorate (including Shared Services) subsumed into the newly created Commerce and Works Directorate.
This has resulted in 14 agencies completing the survey in 2013 compared with 15 in 2012.
Surveyed Agencies
The agency respondents were:
Chief Minister and Treasury Directorate; Community Services Directorate; Commerce and Works Directorate; Economic Development Directorate; Education and Training Directorate; Environment and Sustainable Development Directorate; Health Directorate; Justice and Community Safety Directorate; Territory and Municipal Services Directorate; Auditor-General’s Office; Calvary Public Hospital; Canberra Institute of Technology; Director Public Prosecutions; and Office of the Legislative Assembly.
All of the 14 agencies contacted completed the survey.
PAGE 23STATE OF THE SERVICE REPORT 2013
C o m m i s s i o n e r f o r P u b l i c A d m i n i s t r a ti o n
Reporting notes
Questions that have multiple response options will result in percentages that could add up to more than 100%. In the case of open-ended questions, respondents often provide more than one reason for their response and in these cases, percentages will also add up to more than 100%.
Data has been rounded and as such, percentages may not add up to exactly 100% on certain graphs.
2.2 Values and BehaviourDelivery Methods for Learning and DevelopmentTo start the survey, Directorates were asked about the various learning and development activities and delivery methods provided to staff during 2012/13. Awareness-raising as part of induction/orientation is the most common delivery method reported followed by information on intranet/website.
Has your Agency provided staff with learning and development activities during 2012/2013 on either the ACTPS values (inclusive of those set out in the PSMA) and/or Agency specific values? Base: All respondents, n=14.
ACTPS Valuesand/or Section 9
Agency Specific Values
Executive Staff
Non-Executive
Staff
Executive Staff
Non-Executive Staff
Awareness-raising as part of induction/orientation
11 12 10 10
Information on intranet/website (other than on-line training)
9 9 9 9
Formal sessions on how the Values and Section 9 should operate in practice
7 7 5 6
Use of promotional material (e.g. bookmarks, brochures, posters) other than that used as part of induction/orientation
5 5 4 4
On-line training 3 3 2 2
Other 3 3 3 3
No training was provided 2 1 3 3
PAGE 24STATE OF THE SERVICE REPORT 2013
C o m m i s s i o n e r f o r P u b l i c A d m i n i s t r a ti o n
Delivery Methods for Learning and Development – Tracking
ACTPS Values and/or Section 9
Executive Staff Non-Executive Staff2011/2012 2012/2013 2011/2012 2012/2013
Awareness-raising as part of induction/orientation 10 11 13 12
Information on intranet/website (other than on-line training)
11 9 11 9
Formal sessions on how the Values and Section 9 should operate in practice
7 7 10 7
Use of promotional material (e.g. bookmarks, brochures, posters) other than that used as part of induction/orientation
7 5 7 5
On-line training 6 3 6 3
Other 1 3 2 3
No training was provided 3 2 1 1
Total 15 14 15 14
Agency Specific Values
Executive Staff Non-Executive Staff2011/2012 2012/2013 2011/2012 2012/2013
Awareness-raising as part of induction/orientation 10 10 13 10
Information on intranet/website (other than on-line training)
12 9 12 9
Formal sessions on how the Values and Section 9 should operate in practice
7 5 9 6
Use of promotional material (e.g. bookmarks, brochures, posters) other than that used as part of induction/orientation
8 4 8 4
On-line training 1 2 2 2
Other 5 3 5 3
No training was provided 2 3 0 3
Total 15 14 15 14
PAGE 25STATE OF THE SERVICE REPORT 2013
C o m m i s s i o n e r f o r P u b l i c A d m i n i s t r a ti o n
2.3 Attraction and RetentionFormal Performance Management/Development Framework
Does your Agency have a formal performance management/development framework? Base: All respondents, n=14.
Performance Management System ElementsMost commonly, staff participation in formal and informal feedback sessions, and individual performance management plans are used by Agencies.
Are any of the following elements included in your Agency’s performance management/development framework? Base: All respondents, n=14.
PAGE 26STATE OF THE SERVICE REPORT 2013
All respondents indicate that their Agencies have a formal performance management/development framework.14

C o m m i s s i o n e r f o r P u b l i c A d m i n i s t r a ti o n
Performance Management System Elements – Tracking
Included Not included2011/2012 2012/2013 2011/2012 2012/2013
Individual performance management/development plans linked to the agency business plan
14 14 1 0
Staff participation in formal feedback sessions 15 14 0 0
Staff participation in informal feedback sessions
15 14 0 0
Staff participation in the performance management/development system is monitored
12 13 3 1
Individual performance/development plans linked to Agency and/or service wide values
12 13 3 1
Total 15 14 15 14
PAGE 27STATE OF THE SERVICE REPORT 2013
C o m m i s s i o n e r f o r P u b l i c A d m i n i s t r a ti o n
Workforce Planning ActivityThe Agencies were further asked to indicate the workforce planning activities undertaken by them during 2012/2013. All Agencies mention that they obtain information on their Agency’s demographics and characteristics. A high number (13) obtain information to evaluate the effectiveness of learning and development and identify the capabilities required to deliver services in future.
During 2012/2013, did your Agency undertake any of the following workforce planning activities? Base: All respondents, n=14.
Workforce Planning Activity – Tracking
Undertook the activity
Did not undertake the activity
2011/2012 2012/2013 2011/2012 2012/2013
Obtaining information on your Agency’s demographics and characteristics
13 14 2 0
Identifying the capabilities required for your Agency to deliver services in the future
13 13 2 1
Obtaining information to evaluate the effectiveness of learning and development
9 13 6 1
Obtaining information on your Agency’s workforce capability
8 12 7 2
Succession planning for critical positions 8 11 7 3
Specific scenario planning for change(s) that are likely to impact on your Agency’s business
8 10 7 4
Total 15 14 15 14
PAGE 28STATE OF THE SERVICE REPORT 2013

C o m m i s s i o n e r f o r P u b l i c A d m i n i s t r a ti o n
Workforce Planning ChallengesSome of the major challenges indicated by Agencies include the difficulty to recruit people with the required skills (4), and loss of mature-aged employees (4). These were, however, considered major challenges by fewer than half of the Agencies reporting.
Of the challenges listed below, please choose one of the three options that best describes the challenge faced by your Agency in 2012/2013. Base: All respondents, n=14.
PAGE 29STATE OF THE SERVICE REPORT 2013
C o m m i s s i o n e r f o r P u b l i c A d m i n i s t r a ti o n
Workforce Planning Challenges – Tracking
Minor challenge Major challenge2011/2012 2012/2013 Difference 2011/2012 2012/2013 Difference
Difficulty in recruiting sufficiently strong leadership skills and/or potential at the senior manager level
5 8 3 3 1 -2
Difficulty recruiting graduates with required skills as part of a formal graduate program
3 2 -1 0 1 1
Ensuring that employees’ skills and/or knowledge meet your Agency’s requirements
10 9 -1 3 2 -1
Higher than acceptable employee turnover
8 3 -5 2 2 0
Difficulty in attracting and retaining entry level positions
3 5 2 1 1 0
Loss of employees with a disability 5 4 -1 0 0 0
Difficulty in reporting and analysing your Agency’s workforce due to limited workforce data or data quality
7 7 0 4 2 -2
Difficulty recruiting people (other than for a formal graduate program) with required skills
6 6 0 7 4 -3
Loss of mature-aged employees 6 8 2 4 4 0
Loss of Aboriginal and Torres Strait Islander employees
6 7 1 0 2 2
Difficulty in recruiting sufficiently strong leadership skills at the Executive levels
7 6 -1 1 0 -1
Loss of employees recruited as part of a formal graduate program
4 4 0 1 0 -1
Total 15 14 15 14
PAGE 30STATE OF THE SERVICE REPORT 2013

C o m m i s s i o n e r f o r P u b l i c A d m i n i s t r a ti o n
High Performers Identification StrategyThe most commonly used strategies to identify high performing individuals include participation in development opportunities and manager/supervisor identification which are used by all agencies (14). Performance management/development system (12) and Agency Head identification (12) are also frequently used.
What were the primary strategies used to identify high performing individuals? Base: All respondents, n=14
High Performers Identification Strategy – Tracking
Used this strategy Did not use the strategy2011/2012 2012/2013 2011/2012 2012/2013
Manager/Supervisor identification 12 14 3 0
Participation in development opportunities 13 14 2 0
Agency Head identification 9 12 6 2
Performance management/development system
11 12 4 2
Leadership development programs 12 10 3 4
Staff recognition awards 10 9 5 5
Pilot mentoring program 4 4 11 10
Career development assessment centres 1 1 14 13
Total 15 14 15 14
PAGE 31STATE OF THE SERVICE REPORT 2013
OTHERCommunity of Practice
Leadership and Strategy(Commerce and Works)
Identify staff awards that are values based. Executive and
Leader rounding in place across staff.
(Calvary Healthcare)
Auditor-General sends letters to staff for work well done.
(Auditor-General)
C o m m i s s i o n e r f o r P u b l i c A d m i n i s t r a ti o n
Most Utilised BenefitsSpecial employment arrangements, flexible work hours and commencement above base salary are the top three benefits most utilised by Agencies during 2012/2013 to specifically attract and retain people with critical skills.
Which of the following were the top three benefits most utilised by your Agency during 2012/2013 to specifically attract and retain people with critical skills? Base: All respondents, 2011/2012; n=15, 2012/2013; n=14.
2011/2012 2012/2013Benefits # of
Agencies% of
Agencies# of
Agencies% of
Agencies
Special Employment Arrangements (SEAs)
9 60% 11 79 %
Flexible work hours 10 67% 8 57 %
Commencement above base salary 11 73% 6 43 %
Provision of studies assistance 3 20% 4 29 %
Graduate programs 5 33% 3 21 %
Development opportunities (e.g. study awards, fellowships, secondments)
3 20% 3 21 %
Health and wellbeing programs 0 0 % 2 14 %
HR support case managers for trainees and apprentices
1 7% 1 7 %
Support for Transition to Retirement 0 0 % 1 7 %
Work placements/rotations 1 7% 0 0 %
Other 2 13% 3 21 %
Total 15 100% 14 100%
PAGE 32STATE OF THE SERVICE REPORT 2013

C o m m i s s i o n e r f o r P u b l i c A d m i n i s t r a ti o n
Targeted Initiatives to Retain Specific GroupsThe following graph illustrates the breakdown of initiatives (targeted and not targeted) for each of the specific groups. A high number of Agencies indicate that they have targeted initiatives for professional employees (11) and Aboriginal and Torres Strait Islanders (11).
In 2012/2013, did your Agency employ any specific and targeted initiatives to attract and/or retain any of the following groups? Base: All respondents, n=14.
PAGE 33STATE OF THE SERVICE REPORT 2013

C o m m i s s i o n e r f o r P u b l i c A d m i n i s t r a ti o n
Targeted Initiatives to Retain Specific Groups –Tracking
Targeted Not targeted2011/2012 2012/2013 2011/2012 2012/2013
Aboriginal and Torres Strait Islander people 10 11 5 3
Professional Employees 11 11 4 3
Entry level employees 9 9 6 5
People with disability 6 8 9 6
People from culturally and linguistically diverse backgrounds
3 5 12 9
Trades Employees 3 5 12 9
Young employees (under the age of 35) 6 4 9 10
Mature employees (over the age of 45) 2 2 13 12
Women 3 2 12 12
Part-time employees 1 2 14 12
Para-Professional Employees 6 2 9 12
Men 1 1 14 13
Total 15 14 15 14
PAGE 34STATE OF THE SERVICE REPORT 2013

C o m m i s s i o n e r f o r P u b l i c A d m i n i s t r a ti o n
Breach Investigations
Please provide details on the number of investigations into suspected breaches of s9 of the PSMA during 2012/2013? Base: All respondents, n=14.
Number of suspected breach investigations finalised during 2011/2012 = 99
Time Taken to Complete InvestigationsAgencies were further asked about the time taken to complete the investigations. Most commonly, respondents mention that the investigations take anywhere between 2 months and 1 year.
Respondents were not aware of the time it took to complete the investigations for all breaches. Some respondents were not able to provide timeframes for each investigation and this accounts for the difference in the total number of suspected breaches noted above and the totals shown below on time taken to complete investigations.
Please provide the approximate timeframes the finalised in 2012/2013 breach investigations took to complete? Base: Respondents who mentioned that there was a breach of s9 of PSMA during 2011/2012; n=11, 2012/2013; n=10.
Timeframe 2011/2012 2012/2013
<2 weeks 1 1
2 weeks to <1 month 17 13
1 month to <2 months 18 19
2 months to <4 months 27 22
4 months to <1 year 28 58
1 year + 2 7
Total 93 120
PAGE 35STATE OF THE SERVICE REPORT 2013
Number of suspected breach investigations finalised during 2012/2013
(All agencies combined) 125

C o m m i s s i o n e r f o r P u b l i c A d m i n i s t r a ti o n
Number of Alleged Breaches of s9 of PSMA
Of the investigations finalised during 2012/2013, please indicate the total number of employees alleged to have breached each subsection of s9 of the PSMA? (Please note that an individual investigation can be counted against more than one breach of s9 of the PSMA). Base: Respondents who mentioned that there was a breach of s9 of PSMA during 2011/2012; n=11, 2012/2013; n=10.
s9 of the PSMA Breach Category 2011/2012 2012/2013
Exercise reasonable care and skill 24 59
Treat members of the public and other public employees with courtesy and sensitivity to their rights, duties and aspirations
41 52
Comply with the Act, the management standards and all other Territory laws 21 36
Not harass a member of the public or another public employee, whether sexually or otherwise
16 35
Comply with any lawful and reasonable direction given by a person having authority to give this direction
25 32
Act with probity 21 26
Not make improper use of the property of the Territory 9 18
Not take, or seek to take, improper advantage of their position in order to obtain a benefit for the employee or any other person
11 7
Act impartially 0 4
If the employee has an interest, pecuniary or otherwise, that could conflict, or appear to conflict, with the proper performance of their duties –(i) disclose the interest to their supervisor; and (ii) take reasonable action to avoid the conflict as soon as possible after the relevant facts come to the employee’s notice
1 4
Not disclose, without lawful authority –(i) any information acquired by him or her as a consequence of their employment; or (ii) any information acquired by him or her from any document to which he or she has access as a consequence of their employment
2 4
Avoid waste and extravagance in the use of the property of the Territory 2 4
Not take, or seek to take, improper advantage, for the benefit of the employee or any other person, of any information acquired, or any document to which the employee has access, as a consequence of their employment
4 3
In dealing with members of the public, make all reasonable efforts to assist them to understand their entitlements under the laws of the Territory and to understand any requirements which they are obliged to satisfy under those laws
0 1
Not unlawfully coerce a member of the public or another public employee 0 1
Not make a comment that he or she is not authorised to make where the comment may be expected to be taken as an official comment
0 0
Report to an appropriate authority – (i) any corrupt or fraudulent conduct in the public sector that comes to their attention; or (ii) any possible maladministration in the public sector that he or she has reason to suspect
1 0
PAGE 36STATE OF THE SERVICE REPORT 2013
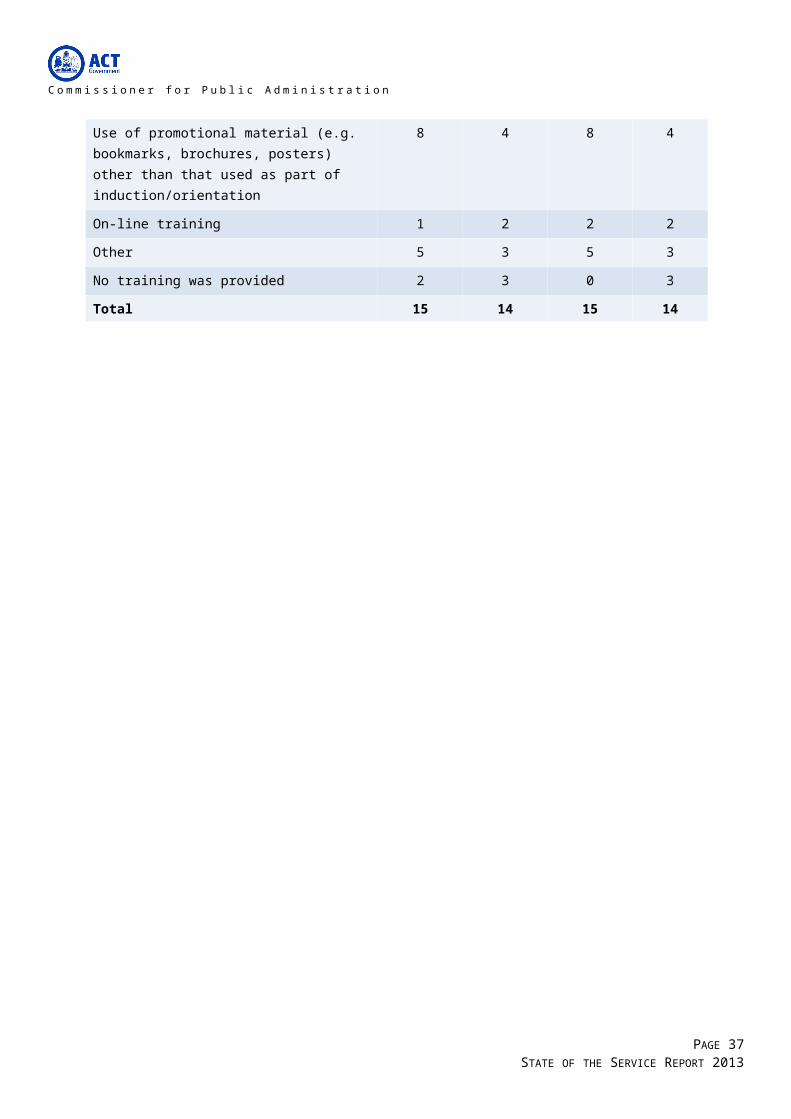
C o m m i s s i o n e r f o r P u b l i c A d m i n i s t r a ti o n
Total Number of Sanctions Applied for Completed InvestigationsAgencies that mentioned that they have completed the investigations for breach were asked about the specific sanctions that were applied. Respondents mention that counseling was provided to employees in 42 cases and a written warning was issued in 35 cases. This is consistent with previous year’s findings.
Of the investigations finalised in 2012/2013, please indicate the total number of employees receiving each sanction? Base: Respondents who mentioned that there was a breach of s9 of PSMA during 2011/2012; n=11, 2012/2013; n=10.
Completed Investigations – Sanction Applied 2011/2012 2012/2013
Counseling of the employee 29 42
First or final written warning 25 35
Termination of employment 12 16
Reduction in incremental point 3 12
Transfer to other duties (at or below current salary) 1 9
Complaint found, but no sanction applied 3 5
Financial penalty 2 5
A temporary or permanent reduction in classification/salary 4 5
Written admonishment 6 4
Deferral of increment 0 1
PAGE 37STATE OF THE SERVICE REPORT 2013

C o m m i s s i o n e r f o r P u b l i c A d m i n i s t r a ti o n
Measures to Ensure ConsistencyAgencies that mentioned there was a breach were further asked to indicate the measures to maintain consistency during the process of investigation. Use of Shared Services Centre was reported by nine out of ten Agencies and HR/Employee relations provides guidance and support to people who conduct investigations was reported by eight out of ten as was training an external panel to conduct investigations.
Did your Agency have any of the following measures in place during 2012/2013 to ensure the processes to investigate suspected breaches of s9 of the PSMA were consistent across the Agency? Base: Respondents who mentioned that there was a breach of s9 of PSMA during 2012/2013, n=10.
PAGE 38STATE OF THE SERVICE REPORT 2013

C o m m i s s i o n e r f o r P u b l i c A d m i n i s t r a ti o n
Measures to Ensure Consistency – Tracking
Had measures in place
Did not have measures in place
2011/2012 2012/2013 2011/2012 2012/2013
Use of Shared Services Centre 8 9 3 1
External panel trained to conduct investigations
9 8 2 2
HR/Employee Relations provides guidance and support to people conducting investigations
11 8 0 2
Central unit conducts all investigations
7 7 4 3
Detailed procedures available to people conducting investigations
8 7 3 3
Investigations referred to Senior Executives Responsible for Business Integrity Risk
9 7 2 3
Internal panel trained to conduct investigations
6 5 5 5
Service/Client Charters 4 5 7 5
Investigations referred to Commissioner for Public Administration
2 3 9 7
Base: Agencies who mentioned there was a breach, 2011/2012 n=11, 2012/2013 n=10
PAGE 39STATE OF THE SERVICE REPORT 2013
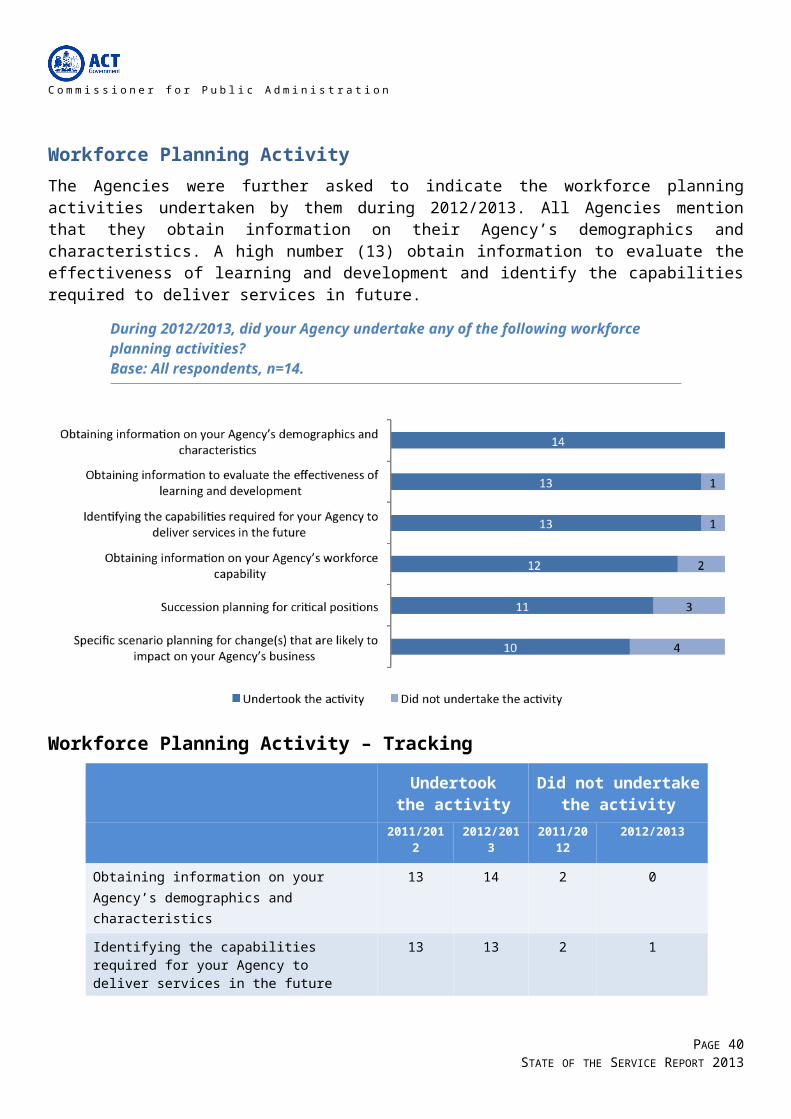
C o m m i s s i o n e r f o r P u b l i c A d m i n i s t r a ti o n
Measures to Ensure Sanctions are ImposedThe most common measures to ensure that sanctions are imposed include consulting the central HR and/or legal area when deciding the sanction and limiting the delegation for applying the sanctions.
Did your Agency have any of the following measures in place during 2012/2013 to ensure that sanctions imposed as a result of any determined breaches of s9 of the PSMA were applied appropriately and consistently across the Agency? Base: Respondents who mentioned that there was a breach of s9 of PSMA during 2012/2013, n=10.
Measures to Ensure Sanctions are Imposed – Tracking
Had measures in place
Did not have measures in place
2011/2012 2012/2013 2011/2012 2012/2013
Delegation for applying sanction is strictly limited
10 9 1 1
Central HR and/or legal area consulted when deciding sanction
10 9 1 1
Guidelines provided include considerations to be taken into account when deciding sanction
6 8 5 2
Database of sanctions maintained and referred to as part of process for deciding sanction
6 6 5 4
Sanctions recommended by central unit within the agency responsible for all investigations
6 5 5 5
PAGE 40STATE OF THE SERVICE REPORT 2013

C o m m i s s i o n e r f o r P u b l i c A d m i n i s t r a ti o n
Sanction recommended by Shared Services
6 5 5 5
Base: Agencies who mentioned there was a breach, 2011/2012 n=11, 2012/2013 n=10
Preventing Bullying and Harassment
Does your Agency have a formal reporting system for bullying and harassment? Base: All respondents, n=14.
Systems for Employees to Report Bullying and HarassmentAll the Agencies report that they have a number of systems in place for employees to report bullying and harassment.
Does your Agency use any of the following systems for employees to report bullying and harassment? Select all that apply. Base: All respondents, 2011/2012; n=15, 2012/2013; n=14.
2011/2012 2012/2013
Systems to Report Bullying and Harassment Count Percent Count Percent
Identified contact person(s) for reporting matters 15 100% 14 100 %
Procedures and policies in place to ensure appropriate confidentiality
15 100% 14 100 %
Awareness-raising with staff about bullying and harassment procedures and policies
15 100% 14 100 %
Option of additional support from an external provider (e.g. EAP)
15 100% 14 100 %
Specialised training for contact staff 14 93% 14 100 %
Accessible and effective reporting system(s) 14 93% 13 93 %
Use of promotional material (e.g. posters, brochures) 13 87% 12 86 %
External investigator 12 80% 11 79 %
Other 5 33% 2 14 %
Total 15 100% 14 100 %
PAGE 41STATE OF THE SERVICE REPORT 2013
All the Agencies report that they have a formal reporting system for bullying and harassment. 14
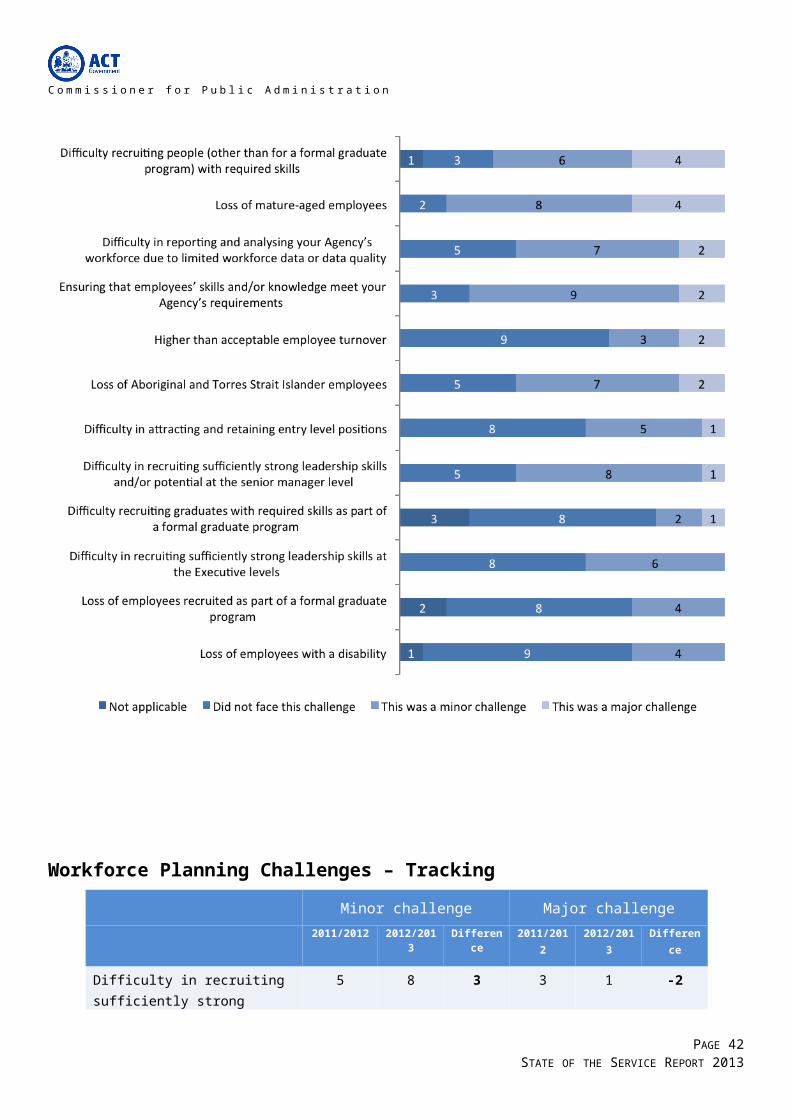
C o m m i s s i o n e r f o r P u b l i c A d m i n i s t r a ti o n
Employee Assistance Provider
Does your Agency have an Employee Assistance Provider? Base: All respondents, n=14.
Provider # of mentions
PPC Worldwide 10
Davidson Trahaire Corpsych 4
IPS Worldwide. 1
Converge 1
Bullying and Harassment Reports
Regarding formal reports of bullying and harassment within your agency during 2012/2013 please complete the following. Base: All respondents, n=14.
PAGE 42STATE OF THE SERVICE REPORT 2013
All 14 Agencies have an Employee Assistance Provider.100%

C o m m i s s i o n e r f o r P u b l i c A d m i n i s t r a ti o n
*These questions were not included in the 2012 Agency Survey.
**Please Note: Formal Reports include a report that is formally lodged and can include verbal referrals, incidents, complaints and any other matter that warrants further investigation
2.4 Managing UnderperformanceUnderperformance Investigations
Please provide details of the number of underperformance investigations finalised during 2012/2013. Base: All respondents, n=14.
Of those underperformance actions finalised, please indicate how often the following outcomes occurred:Base: Respondents who provided the details of the number of investigations finalised in 2011/2012, n=5, 2012/2013, n=6.
2011/2012 2012/2013
Underperformance action not finalised due to unavailability (e.g. resignation, long term leave, etc.)
4 16
Satisfactory performance standard attained 1 9
Development program instituted 12 6
Termination of employment 2 5
PAGE 43STATE OF THE SERVICE REPORT 2013
Number of investigations finalised during 2012/2013 40

C o m m i s s i o n e r f o r P u b l i c A d m i n i s t r a ti o n
Assignment to other duties 2 1
Reduction in classification 0 1
No action taken 0 3
Total 21 41
PAGE 44STATE OF THE SERVICE REPORT 2013
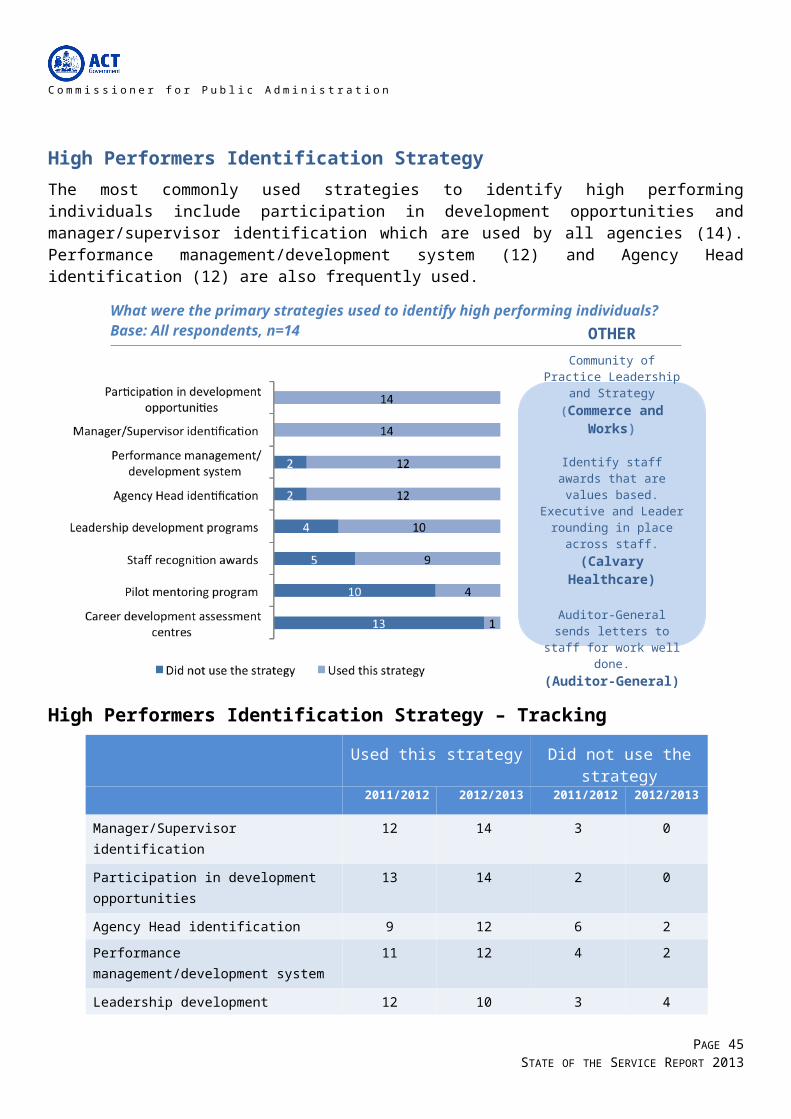
C o m m i s s i o n e r f o r P u b l i c A d m i n i s t r a ti o n
Procedures for Managing UnderperformanceThe Agencies were further asked to indicate the number of procedures for managing underperformance. A total of eight Agencies indicate that they do not have any procedures for managing underperformance. Further, five Agencies indicate that the Agency managers are not adequately trained to manage underperforming staff. These numbers are down from previous findings.
Does your Agency have in place procedures for managing underperformance that supplement the ACTPS Enterprise Agreements?Are your Agency managers adequately trained in managing underperforming staff? Did your Agency engage the Services of a provider from the ACTPS Administrative Review and Investigation Panel during the 2012/2013 reporting period?Base: All respondents, 2011/2012; n=15, 2012/2013; n=14.
Yes No2011/2012 2012/2013 2011/2012 2012/2013
Procedures for managing underperformance 5 6 10 8
Agency managers are adequately trained in managing underperforming staff
6 9 9 5
Engaged the Services of a provider from the ACTPS Administrative Review and Investigation Panel
5 9 10 5
Total 15 14 15 14
ACTPS Administrative Review and Investigations Panel Engagement
Please indicate the number of times your Agency engaged the Services of a provider from the ACTPS Administrative Review and Investigations Panel.Base: Respondents who mentioned that they have an Administrative review and investigation penal, 2011/2012; n=5, 2012/2013; n=9.
Matters commenced but not finalised
Matters finalised
ACTPS Administrative Review and Investigations Panel Engagement
2011/2012 2012/2013 2011/2012 2012/2013
Misconduct/Discipline (under ACTPS Enterprise Agreements)
9 20 5 22
Appeals (under ACTPS Enterprise Agreements) 1 5 3 10
Internal Reviews (under ACTPS Enterprise Agreements)
1 1 1 1
Fraud investigations (under the ACTPS Integrity Policy)
0 0 0 1
Other administrative review or investigation including complaints/grievances or public
0 2 0 0
PAGE 45STATE OF THE SERVICE REPORT 2013
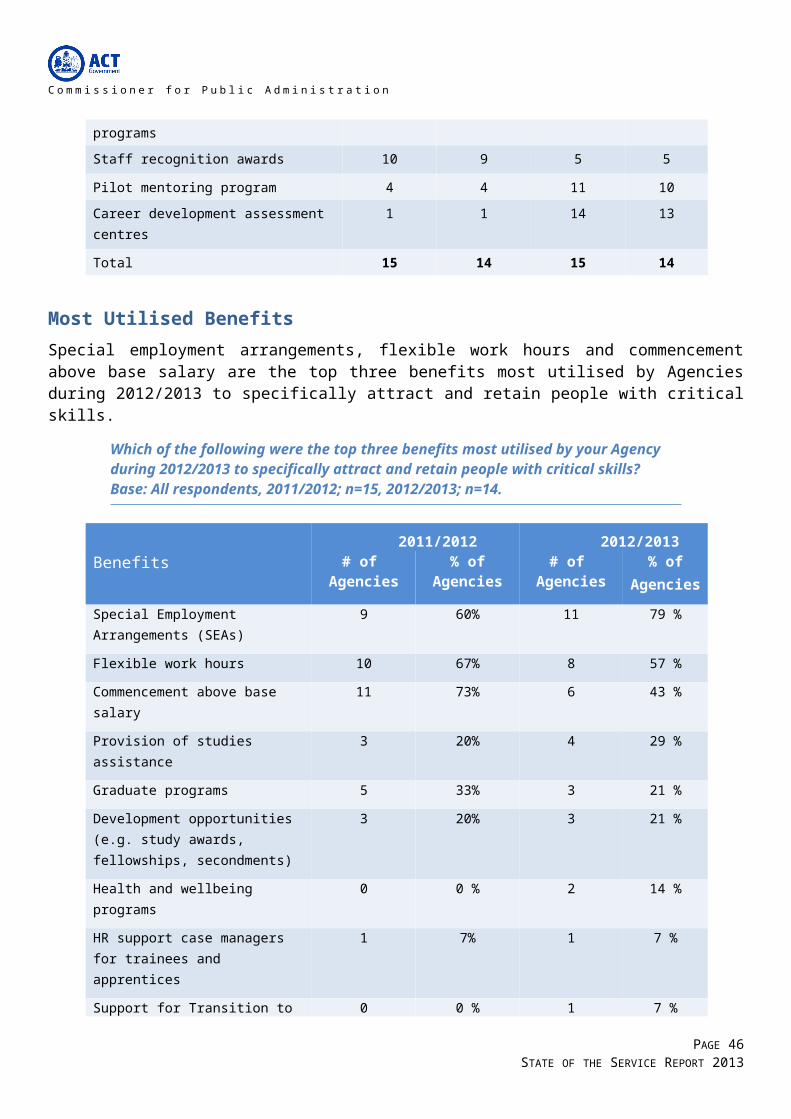
C o m m i s s i o n e r f o r P u b l i c A d m i n i s t r a ti o n
Interest Disclosure
2.5 Respect, Equity and Diversity FrameworkRED Framework Measure
How many of the following are there within your agency? Base: All respondents, n=14.
RED Framework Measure 2011/2012 2012/2013
Staff who have received RED training 4471 3214
RED Contact Officers 359 359
RED Contact Officers who have received RED training 272 299
Managers/Supervisors who have received RED training 2132 993
Executive Sponsor(s) 14 15
Changes to Executive Sponsor(s) N/A 4
Current Executive Sponsor(s) who have received RED training 12 13
Strategy
Which of the following did your Agency promote? Please select all that apply. Base: All respondents, 2011/2012; n=15, 2012/2013; n=14.
2011/2012 2012/2013Count Percent Count Percent
Respect at Work Policy 15 100% 13 93 %
Open Door Policy 15 100% 14 100 %
Preventing Work Bullying Guidelines
14 93% 14 100 %
Total 15 100% 14 100 %
PAGE 46STATE OF THE SERVICE REPORT 2013
C o m m i s s i o n e r f o r P u b l i c A d m i n i s t r a ti o n
Tools to Promote RED FrameworkA total of 13 Agencies include the information on bullying and harassment in the induction program and 12 Agencies use RED Resources.
Which of the following tools has your Agency used to promote the RED framework? Please select all that apply. Base: All respondents, n=14.
Tools to Promote RED Framework – Tracking
2011/2012 2012/2013
Inclusion of information on bullying and harassment in induction program 12 13
RED Resources (Framework folders & brochures) 14 12
Regular team meeting discussions regarding RED 9 9
A RED network that meets quarterly or more frequently 7 9
RED overview sessions (separate to RED training sessions) 8 8
Inclusion of information on bullying and harassment in staff surveys (exit and climate surveys)
10 8
Staff survey includes questions on bullying and harassment 4 6
Other 6 6
Total 15 14
PAGE 47STATE OF THE SERVICE REPORT 2013
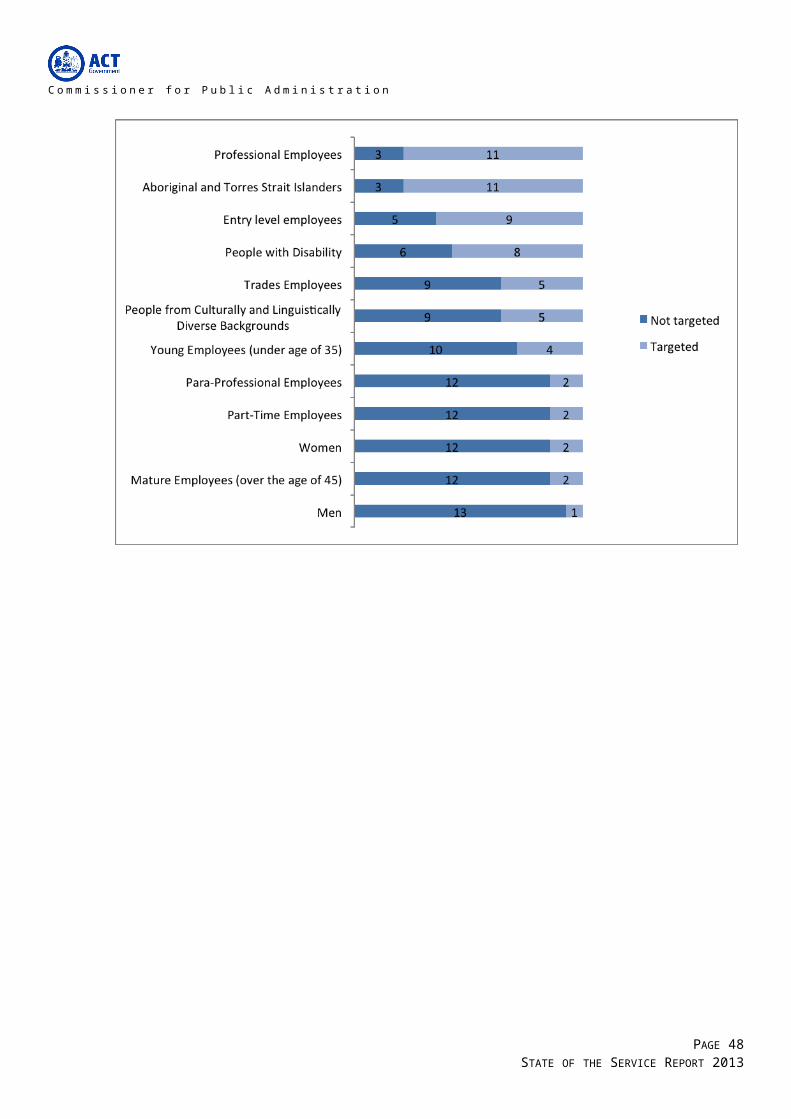
C o m m i s s i o n e r f o r P u b l i c A d m i n i s t r a ti o n
Access to RED Folder and Other Resources
Do all managers and teams have access to a RED folder and other resources? Base: All respondents, 2011/2012; n=15, 2012/2013; n=14.
2011/2012 2012/2013
Have access to RED folder 13 13
Do not have access to RED folder 1 1
Unsure 1 0
Total 15 14
Method of Providing Staff Access to RED Resources
How has your Agency provided all staff access to your RED Contact Officer details? Please select all that apply. Base: All respondents, 2011/2012; n=15, 2012/2013; n=14.
2011/2012 2012/2013Count Percent Count Percent
Intranet 13 87% 11 79 %
Common areas/noticeboards
9 60% 9 64 %
Staff directory 7 47% 8 57 %
Website 5 33% 5 36 %
Agency switchboard 2 13% 1 7 %
Other 8 53% 6 43 %
Total 15 100% 14 100 %
PAGE 48STATE OF THE SERVICE REPORT 2013

C o m m i s s i o n e r f o r P u b l i c A d m i n i s t r a ti o n
Diversity Census ProcessWhen asked if the Agency conducts a Diversity Census or “Update your Details” process to encourage the disclosure of diversity, five agencies each reported that they did conduct an Agency specific “Update your Details” process, conducted a different process or conducted none at all.
Did your Agency conduct a Diversity Census or ‘Update your Details’ process to encourage the disclosure of diversity? Please select all that apply. Base: All respondents, n=14. (Multiple selections possible).
Review of Recruitment Process, HR Process and Forms
Has your Agency reviewed your recruitment process, HR processes and forms to ensure: Please select all that apply. Base: All respondents, 2011/2012; n=15, 2012/2013; n=14.
2011/2012 2012/2013Count Percent Count Percent
They are written in plain English 12 80% 11 79 %
Reasonable adjustments are made for people with disability for interview arrangements
10 67% 11 79 %
Reasonable adjustments are made for successful applicants
9 60% 10 71 %
Training for panel members on the inclusion of the needs of diverse applicants
6 40% 5 36 %
Roles and responsibilities are clearly defined in job descriptions
14 93% 12 86 %
No, my agency has not reviewed the recruitment process, HR processes and forms
0 0% 1 7 %
PAGE 49STATE OF THE SERVICE REPORT 2013
Those who said ‘other’:ACT Health is currently getting approval from the Director General to
commence Diversity Census to be done annually.Conducted by mission on-site.Inclusion of requirement in induction process.Promoted Whole of Government Update your details program.Whole of Government Update your Details form promoted
to all staff via email and whole of government message on 25 July 2012.

C o m m i s s i o n e r f o r P u b l i c A d m i n i s t r a ti o n
Total 15 100% 14 100
2.6 People with a DisabilityActions to Assist People with Disability
Did your Agency perform any of the following actions to promote the employment of People with Disability? Base: All respondents, n=14.
Actions to Assist People with Disability – Tracking
Performed the action Did not perform the action
2011/2012 2012/2013 2011/2012 2012/2013
Promote flexible working conditions and reasonable adjustments available to ACTPS employees
13 14 2 0
Review any operational policies and procedures to ensure that they support inclusive work practices for people with disability
10 8 5 6
Promote and recognise International Day of People with Disability
7 6 8 8
Assist able-bodied employees across the ACTPS to build ‘disability confidence’ as co-workers, managers and hirers of people with disability and provide practical ideas and tools to make a difference on the ground
7 3 8 11
Provide a workplace orientation and induction 7 11 8 3
PAGE 50STATE OF THE SERVICE REPORT 2013

C o m m i s s i o n e r f o r P u b l i c A d m i n i s t r a ti o n
strategy that includes supporting people with disability in the workplace
Deliver mental health awareness training for managers, staff and employees
6 10 9 4
Ensure jobs are advertised in both mainstream and disability specialist employment services
3 1 12 13
Total 15 14 15 14
Recruitment Strategies for People with DisabilityDid your Agency use the any of the following strategies to attract people with disability to the ACT Public Service? If yes, how many? Base: All respondents, n=14.
PAGE 51STATE OF THE SERVICE REPORT 2013
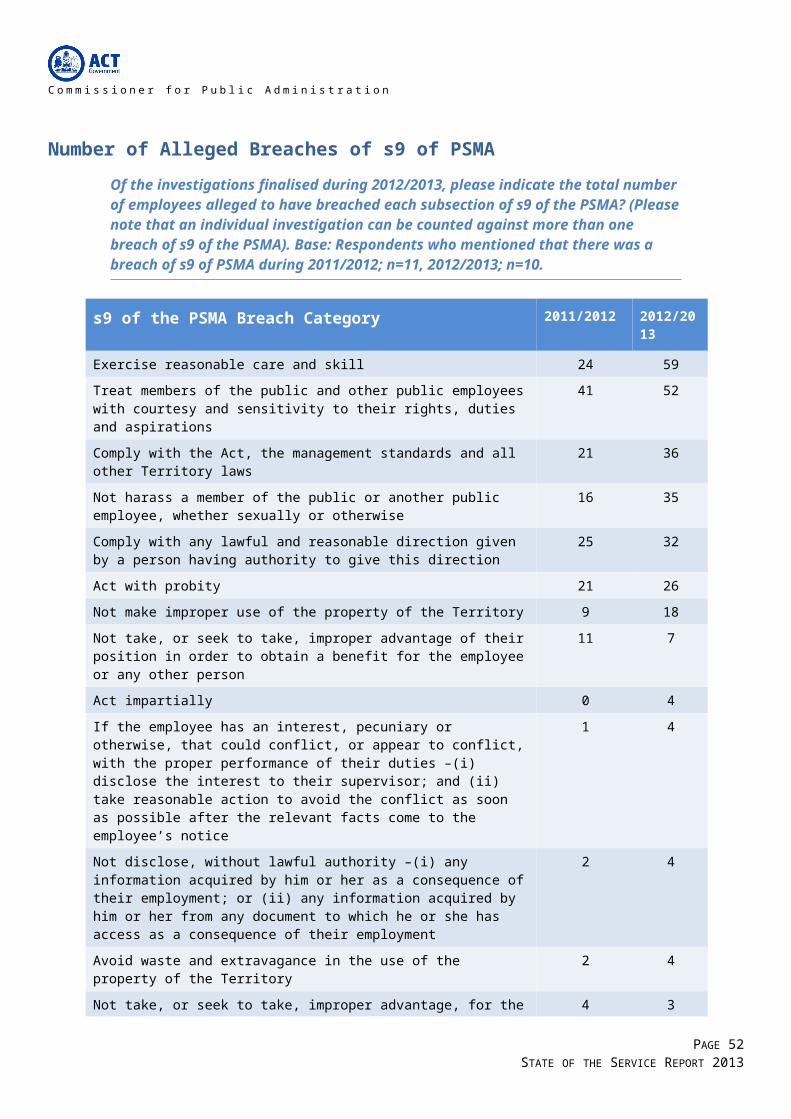
C o m m i s s i o n e r f o r P u b l i c A d m i n i s t r a ti o n
Recruitment Strategies for People with Disability – Tracking
Used the strategy Did not use the strategy2011/2012 2012/2013 2011/2012 2012/2013
Identified positions for People with Disability 5 5 10 9
Promote the ACTPS as an employer of choice for people with a disability
2 5 13 9
Work experience for People with Disability 3 3 12 11
Disability Traineeship 6 2 9 12
Positions in the Whole of Government Graduate Program for People with a Disability
1 1 14 13
Disability Cadetship 0 0 15 14
Willing and Able Mentoring program 0 0 15 14
School based apprenticeships for people with disability
0 0 15 14
Total 15 14 15 14
PAGE 52STATE OF THE SERVICE REPORT 2013

C o m m i s s i o n e r f o r P u b l i c A d m i n i s t r a ti o n
Retention Strategies for People with Disability
Does your Agency use any of the following strategies to retain employees with Disability in the ACT Public Service? Base: All respondents, n=14.
Retention Strategies for People with Disability – Tracking
Used the strategy Did not use the strategy2011/2012 2012/2013 2011/2012 2012/2013
Agency-based Reasonable Adjustment Policy
3 5 12 9
Agency-based Disability employee networks
5 2 10 12
Disability Awareness Training available to all staff
3 2 12 12
Total 15 14 15 14
Reasonable Adjustment
Are the managers/supervisors within your Agency aware of the requirements to make reasonable adjustment(s) following disclosure of a disability status? Base: All respondents, 2011/2012; n=15, 2012/2013; n=14.
2011/2012 2012/2013
Aware of requirements 9 7
Somewhat aware of requirements 6 7
Total 15 14
PAGE 53STATE OF THE SERVICE REPORT 2013

C o m m i s s i o n e r f o r P u b l i c A d m i n i s t r a ti o n
Applications to Employment Assistance Fund (EAF)
Were any applications for reasonable adjustment and/or financial assistance made to the Employment Assistance Fund (EAF) by your Agency in 2012/2013 (via the Job Access Fund)?Base: All respondents, n=14.
Accessibility Audits (Timeline)
During the period did your Agency conduct an ‘accessibility audit(s)’ (in accordance with the ACTPS Employment Strategy for People with disability) to assess the level of accessibility to your premises for people with disability? Base: All respondents2012/2013, n=14.
Accessibility Audits (Timeline) – Reported in 2011/2012
During the period did your Agency conduct an ‘accessibility audit(s)’ (in accordance with the ACTPS Employment Strategy for People with disability) to assess the level of accessibility to your premises for people with disability? Base: All respondents2011/2012, n=15.
PAGE 54STATE OF THE SERVICE REPORT 2013
2004 2005 2006 2007 2008 2009 2010 2011 2012 2013
Director of Public
ProsecutionsCIT Commerce
and Works Health
No agencies made applications for reasonable assistance to Employment Assistance Fund. 0
June May December February

C o m m i s s i o n e r f o r P u b l i c A d m i n i s t r a ti o n
Not aware of past audit (n=8)
Conducted an Accessibility Audit (n=7)
2004 2005 2006 2007 2008 2009 2010 2011 2012
CIT JACS Assembly CMCD Treasury, EDD, TAMS
PAGE 55STATE OF THE SERVICE REPORT 2013
July Nov Sept May Jan, Feb, March

C o m m i s s i o n e r f o r P u b l i c A d m i n i s t r a ti o n
Disability Employment Network
Did your Agency work with a Disability Employment Network to place people identifying with a disability in employment within your Agency? Base: All respondents, n=14.
Which Disability Employment Service Provider/s did your Agency use? Base: All respondents, n=14.
PAGE 56STATE OF THE SERVICE REPORT 2013
Agencies that worked with Disability Employment Network indicate that a total of 17 people were placed as follows: Seven ASO1, one contract ASO1; three ASO2, two contract ASO2; three contract GSO3; one CERT II in business – currently undergoing CERT III as an Administrative officer.
Service Providers No. of Mentions
Advance Personnel 5
Effective People 1
LEAD Employment 2
Nexus Human Services 1
Vision Australia 1
MAX Employment 1
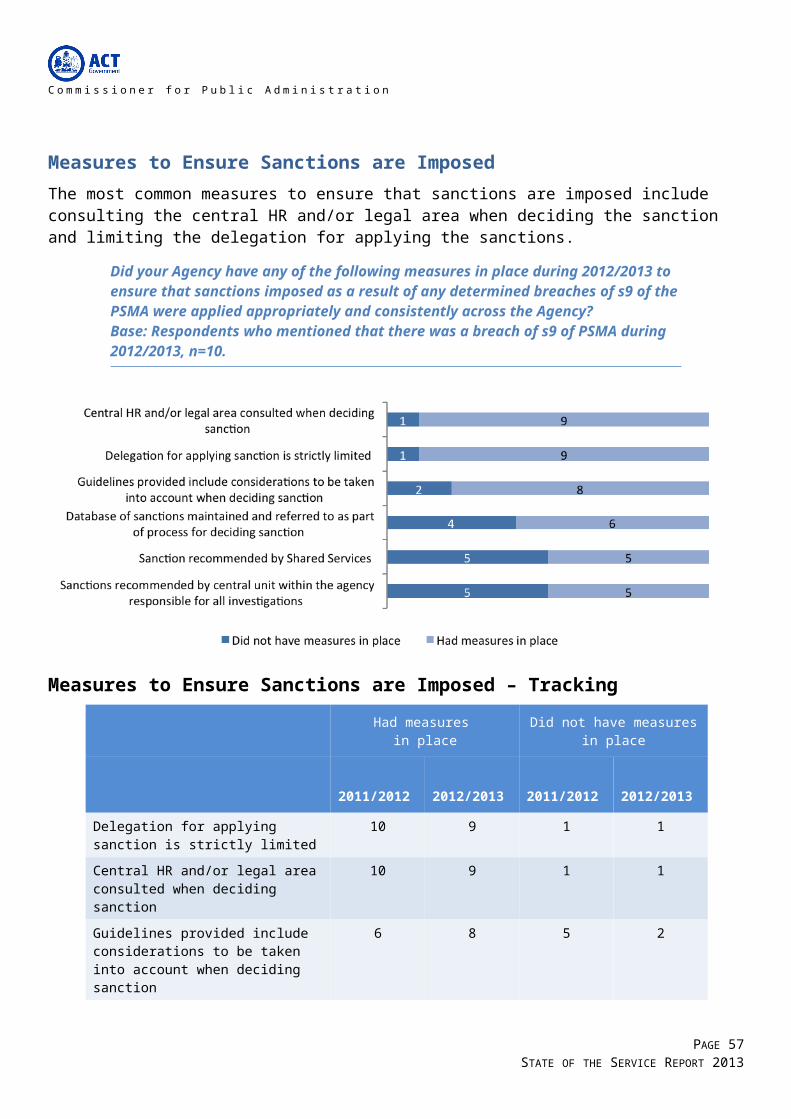
C o m m i s s i o n e r f o r P u b l i c A d m i n i s t r a ti o n
2.7 Aboriginal and Torres Strait Islander PeopleStrategies to attract Aboriginal and Torres Strait Islander People
Did your Agency use the any of the following strategies to attract Aboriginal and Torres Strait Islander people to the ACT Public Service? If yes, how many? Base: All respondents, n=14.
Strategies to attract Aboriginal and Torres Strait Islander People – Tracking
Used the strategy Did not use the strategy2011/2012 2012/2013 2011/2012 2012/2013
Identified Positions for Aboriginal and Torres Strait Islander people
9 7 6 7
Aboriginal and Torres Strait Islander Traineeship 7 7 8 7
Positions for Aboriginal and Torres Strait Islanders in the Whole of Government Graduate Program
3 5 12 9
Work Experience for Aboriginal and Torres Strait Islander People
4 2 11 12
Aboriginal and Torres Strait Islander Cadetship 0 1 15 13
Total 15 14 15 14
PAGE 57STATE OF THE SERVICE REPORT 2013

C o m m i s s i o n e r f o r P u b l i c A d m i n i s t r a ti o n
Strategies to Retain Aboriginal and Torres Strait Islander People
Does your Agency use any of the following strategies to retain Aboriginal and Torres Strait Islander people in the ACT Public Service?Base: All respondents, n=14.
PAGE 58STATE OF THE SERVICE REPORT 2013

C o m m i s s i o n e r f o r P u b l i c A d m i n i s t r a ti o n
Strategies to Retain Aboriginal and Torres Strait Islander People – Tracking
Used the strategy Did not use the strategy
2011/2012 2012/2013 2011/2012 2012/2013
Aboriginal and Torres Strait Islander Study Awards
2 2 13 12
Agency based Aboriginal and Torres Strait Islander employee networks
5 7 10 7
Advertise employment opportunities through a variety of media sources including Aboriginal and Torres Strait Islander publications/media
6 8 9 6
Promote the ACTPS as an employer of choice for Aboriginal and Torres Strait Islander people
6 8 9 6
Culturally-specific training programs 9 10 6 4
Special leave provisions 14 12 1 2
Aboriginal and Torres Strait Islander cultural awareness programs available to all staff
9 12 6 2
One day paid leave during NAIDOC week 14 13 1 1
Total 15 14 15 14
PAGE 59STATE OF THE SERVICE REPORT 2013

C o m m i s s i o n e r f o r P u b l i c A d m i n i s t r a ti o n
Further Strategies for Aboriginal and Torres Strait Islander Employees
Does your Agency have any of the following in place for Aboriginal and Torres Strait Islander employees? Base: All respondents, n=14.
Further Strategies for Aboriginal and Torres Strait Islander Employees – Tracking
Have in place Do not have in place
2011/2012 2012/2013 2011/2012 2012/2013
Access to trained mentors for new and existing employees
5 8 10 6
A buddy system for new employees 6 7 9 7
Rotations and exchanges 1 5 14 9
Work shadowing opportunities 6 5 9 9
Learning and Development programs 10 9 5 5
Career pathway plans 6 7 9 7
Total 15 14 15 14
PAGE 60STATE OF THE SERVICE REPORT 2013
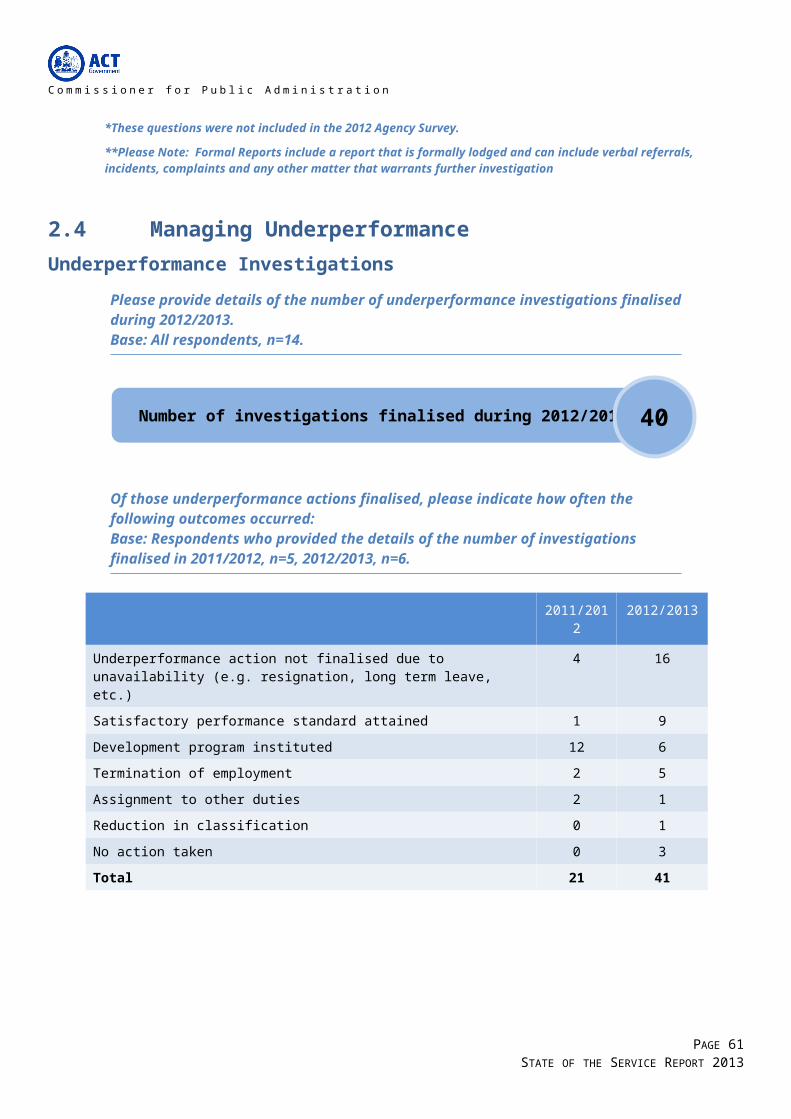
C o m m i s s i o n e r f o r P u b l i c A d m i n i s t r a ti o n
Number of Aboriginal and Torres Strait Islander Liaison Officers
How many Aboriginal and Torres Strait Islander Liaison Officers were recruited in 2012/2013? Base: All respondents, n=14.
Did you arrange for an Aboriginal Community member to be on the interview panel? Base: Respondents who recruited Aboriginal and Torres Strait Islander Liaison Officers, n=4.
Aboriginal and Torres Strait Islander Recruitment Package
When your Agency is recruiting to Agency Liaison Officer roles, does your Agency develop a specific Aboriginal and Torres Strait Islander recruitment package that ensures that roles and responsibilities are clearly defined and position descriptions relevant? Base: All respondents, n=14.
Aboriginal and Torres Strait Islander Recruitment Package – Tracking
2011/2012 2012/2013
Develop a specific Aboriginal and Torres Strait Islander recruitment package
3 2
Did not develop a specific Aboriginal and Torres Strait Islander recruitment package
5 2
Have not recruited in the past year 7 10
Total 15 14
PAGE 61STATE OF THE SERVICE REPORT 2013
Of those who completed the survey, Five Agencies recruited a total of eight Aboriginal and Torres Strait Islander Liaison Officers. Further, four Agencies report they arranged for an Aboriginal Community member to be on the interview panel.4

C o m m i s s i o n e r f o r P u b l i c A d m i n i s t r a ti o n
The Agencies were further asked if they ensure that a proportion of positions on management are allocated to Aboriginal and Torres Strait Islander employees. A high majority (13) of Agencies indicate that they do not do so while only one Agency reported that a proportion of positions on management development programs are allocated to Aboriginal and Torres Strait Islander employees.
Does your agency ensure a proportion of positions available on management development programs are allocated to Aboriginal and Torres Strait Islander employees, even if not all criteria for acceptance to a program are met? Base: All respondents, 2011/2012; n=15, 2012/2013; n=14.
2011/2012 2012/2013Count Percent Count Percent
Positions are allocated 2 13% 1 7 %
No positions are allocated 13 87% 13 93 %
Total 15 100% 14 100 %
PAGE 62STATE OF THE SERVICE REPORT 2013

C o m m i s s i o n e r f o r P u b l i c A d m i n i s t r a ti o n
2.8 Fraud and Risk
Formal Risk Assessment of Agency
Has a formal risk assessment of your Agency been undertaken in accordance with the Risk Management Standard and the ACTPS Integrity Policy (section 6.1)? Base: All respondents, 2011/2012; n=15, 2012/2013; n=14.
2011/2012 2012/2013Count Percent Count Percent
Undertook formal risk assessment 14 93 % 14 100 %
Did not undertake formal risk assessment 1 7 % 0 0 %
Total 15 100% 14 100 %
Plans to Review the Risk Assessment
Are there plans to review the risk assessment process within your Agency for this upcoming financial year? Base: All respondents, 2011/2012; n=15, 2012/2013; n=14.
2011/2012 2012/2013Count Percent Count Percent
Have plans to review the risk assessment process 12 80 % 12 86 %
Do not have plans to review risk assessment process 3 20 % 2 14 %
Total 15 100 % 14 100 %
PAGE 63STATE OF THE SERVICE REPORT 2013

C o m m i s s i o n e r f o r P u b l i c A d m i n i s t r a ti o n
Fraud and Corruption Prevention Plan
Does your Agency have a current Fraud and Corruption Prevention Plan? Base: All respondents, n=14.
Plans to review the Fraud and Corruption Plan
Are there plans to review the Fraud and Corruption Plan within your Agency for the next financial year? Base: All respondents, 2011/2012; n=15, 2012/2013; n=14.
2011/2012 2012/2013Count Percent Count Percent
Plans to review 12 80% 11 79 %
No plans to review 3 20% 3 21 %
Total 15 100% 14 100 %
Risk Category
Please use a scale of one to five to describe the following integrity risks within your Agency. Base: All respondents, n=14.
PAGE 64STATE OF THE SERVICE REPORT 2013
All the Agencies report that they have a current Fraud and Corruption
Prevention Plan.14

C o m m i s s i o n e r f o r P u b l i c A d m i n i s t r a ti o n
Risk Category – Tracking
Low risk 1 or 2 Medium risk 3 4 or Extreme risk 5
2011/2012 2012/2013 2011/2012 2012/2013 2011/2012 2012/2013
Fraud 13 10 1 2 1 2
Finance 11 9 2 2 2 3
Fraud & Integrity 10 6 3 7 2 1
Asset Management 13 6 1 7 1 1
IT Systems 7 5 6 7 2 2
Procurement & Contract Management
7 4 6 7 2 3
Occurrence of Risk IncidentsOverall, fraud and integrity risk is the most common risk category with Agencies reporting a total of 26 incidents of this type.
How many incidents occurred in the following risk categories within your Agency, in the period? Base: All respondents, 2011/2012; n=15, 2012/2013; n=14.
Number of Incidents
Risk Category 2011/2012 2012/2013
Fraud & Integrity 16 26
Asset Management 6 1
IT systems 5 4
Finance 4 5
Information/Record Management 2 0
Procurement & Contract Management 1 2
Fraud (client) 1 0
PAGE 65STATE OF THE SERVICE REPORT 2013

C o m m i s s i o n e r f o r P u b l i c A d m i n i s t r a ti o n
Workforce Profile 2012-13This report provides a holistic view of the ACT public sector to support robust workforce planning and management into the future. The report is a resource for the community, managers and employees within the ACT public sector to inform planning, policy development and decision-making.
The ACT public sector encompasses the employees of the nine directorates in the ACTPS that report to the Head of Service, as well as staff employed under the Public Sector Management Act 1994 (‘PSM Act’) in other ACT agencies. The data excludes contractors and staff of Territory Owned Corporations (‘TOCs’).
This workforce information has been published for the ACTPS based on the nine directorates and provides high-level time-series information over the past five years for the ACTPS. The nine directorates account for about 90 percent of the ACT public sector. The Workforce Profile provides a historical summary of indicators based on the ACTPS structure. This allows for time-series comparison and incorporates retrospective updates that help to remove time-lag in human resources data processing. ACT Shared Services, a division of the Commerce and Work Directorate, administers all but one percent of staff payroll across ACTPS directorates and provides the information for this report.
For reasons of administrative efficiency, historical information is based on employees administered by Shared Services. Historical figures may differ to figures from earlier publications however discrepancies will primarily be due to definitional change, including the structural movements within the ACT public sector, and to retrospective updates that reflect the time-lag in the processing of some human resource data. Similarly, some of the data definitions and treatment of data in directorate annual reports can differ.
The Workforce Profile includes indicators related to employee numbers, salaries, commencements and separations, age and length of service, leave usage and diversity. The profile provides workforce statistics based on information from ACTPS payroll systems as at the final pay of June 2013 (‘June 2013’) and indicators that apply to the period over the 2012-13 financial year (‘FY’). Workforce indicators are based on paid staff and exclude employees on leave without pay, board members, contractors and employees on secondment to other jurisdictions. These are point in time indicators and do not adjust for seasonal fluctuation, such as demand for casual teachers and back pay. Directorates and employee cohorts with small numbers are susceptible to fluctuation.
3.1 ACT public sector – ACT Public Service and other ACT public sector Agencies
The ACT public sector includes the nine directorates of the ACTPS as well as other ACT government agencies (see Table 1).
Table 1: ACT public sector - ACT Public Service and other ACT public sector agencies1
ACT Public Service Agencies ACT
Pub
lic
Ser ACT
pub
lic
sect
1 Workforce information throughout this report is presented as available from the CHRIS21 payroll system and data for independent agencies may be aggregated with that of a relevant directorate.
PAGE 66STATE OF THE SERVICE REPORT 2013

C o m m i s s i o n e r f o r P u b l i c A d m i n i s t r a ti o n
vice
or
Chief Minister and Treasury Directorate Long Service Leave Authority Independent Competition and Regulatory Commission
Commerce and Works Directorate Shared Services
Community Services Directorate Cultural Facilities Corporation
Economic Development Directorate Exhibition Park Corporation Land Development Agency Gambling and Racing Commission
Education and Training Directorate
Environment and Sustainable Development Directorate
Health Directorate
Justice and Community Safety Directorate
Territory and Municipal Services Directorate ACTION
ACT public sector Agencies
Auditor-General's Office
Director of Public Prosecutions
Calvary Health Care (Public)
Canberra Institute of Technology
Office of the Legislative Assembly
3.1 ACT public sector – Workforce SummaryAs at June 2013, the ACT public sector was represented by a full-time equivalent (‘FTE’) workforce of 19,793.3 (up from 19,344.4 as at June 2012), and headcount of 22,671 (up from 21,955 as at June 2012). Headcount for permanent officers, full-time and part-time, was 16,579 or 75.5 percent of all employees.
PAGE 67STATE OF THE SERVICE REPORT 2013
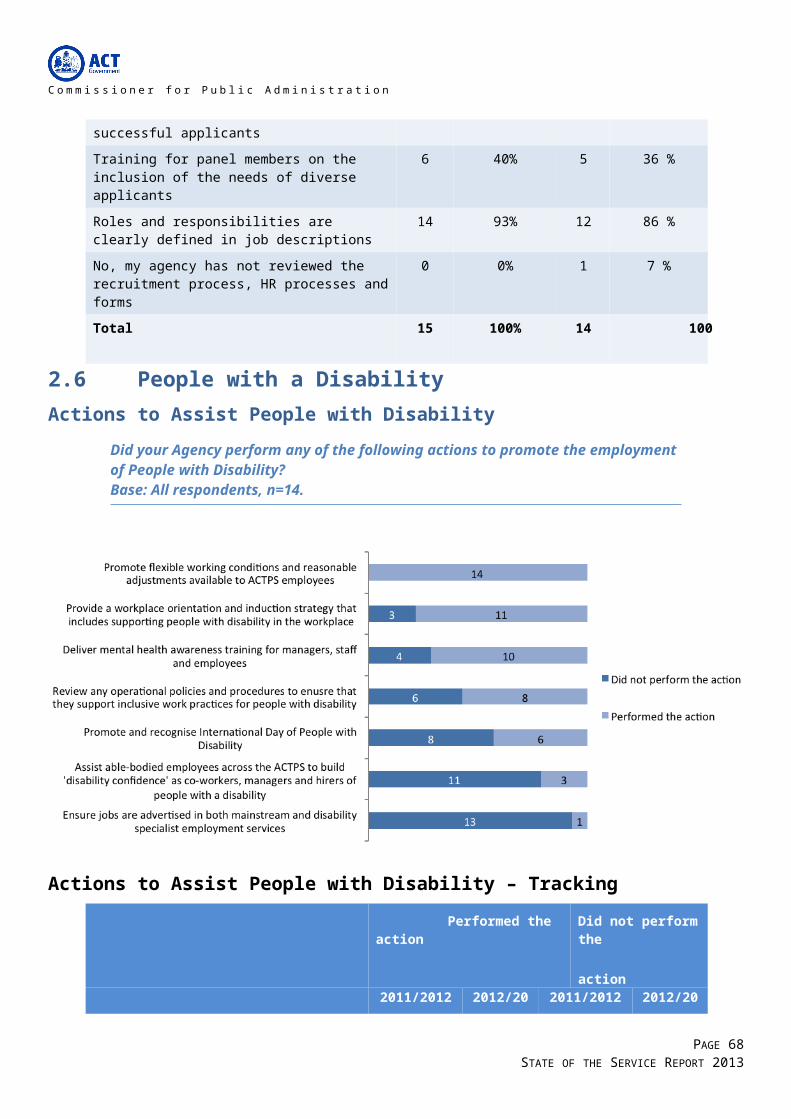
C o m m i s s i o n e r f o r P u b l i c A d m i n i s t r a ti o n
As a proportion of the ACT public sector, the health and education portfolios2 represent 34.2 percent and 29.3 percent of employees, respectively, or a combined 63.5 percent, based on FTE as at June 2013. Growth particularly in health has been observed in recent years and is expected to continue with higher demand, consistent with national trends.
As at June 2013, Aboriginal & Torres Strait Islanders were represented by a headcount of 258 (up from 224 as at June 2012), or 1.1 percent of all employees. Employees with culturally and linguistically diverse backgrounds were represented by a headcount of 3,399 (up from 2,847 as at June 2012) or 15.0 percent of all employees. People with a disability, were represented by a headcount of 408 (up from 375 compared to June 2012), or 1.8 percent of all employees. For comparison, representation in the ACT population is approximately 16 percent3 for people with disability and 1.4 percent4 for Aboriginal and Torres Strait Islanders.
2 The health portfolio includes the Health Directorate and Calvary Health Care (Public). The education portfolio includes the Education Directorate and Canberra Institute of the Technology (CIT).3 Based on Australian Bureau of Statistics (ABS) survey - Disability, Ageing and Carers, Australia, 2009.4 Based on the ABS Australian Demographic Statistics 2011 Census Edition - Preliminary.
PAGE 68STATE OF THE SERVICE REPORT 2013
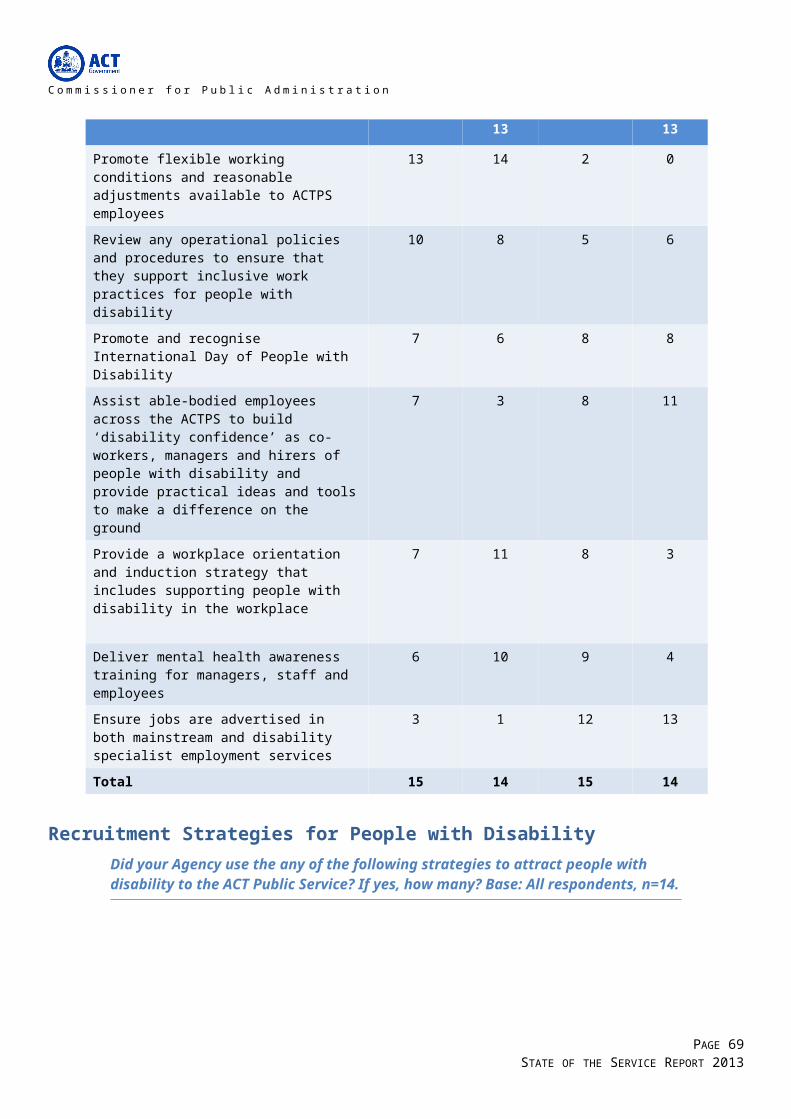
Table 2 provides a summary of the ACT public sector as at June 2012 and June 2013 (or financial years 2011-12 and 2012-13, as noted).
Table 2: ACT public sector – Workforce Summary (2011-12 and 2012-13)
June 2012 June 2013
Full-time equivalent (FTE) 19,344.4 19,793.3
Headcount 21,955 22,671
Proportion of ACT population5 5.9% 6.0%
Permanent 16,579 75.5% 18,197 80.3%
Temporary and casual 5,376 24.5% 4,474 19.7%
Full-time* 70.4% 70.5%
Part-time* 22.8% 22.4%
Executives (headcount)* 187 1.0% 197 1.0%
Age (average, incl. casuals)* 42.6 42.4
Length of service (average, excl. casuals)*
8.4 8.4
Salary (full-time, average)* $77,099 $80,012
Gender pay gap* 3.0% 2.9%
Separation rate (permanent officers, 2011-12 and 2012-13)*
8.5% 6.8%
Personal leave (average in days, 2011-12 and 2012-13)*
11.4 10.7
Female 14,339 65.3% 14,849 65.5%
Culturally and linguistically diverse 2,847 13.0% 3,399 15.0%
Aboriginal and Torres Strait Islanders 224 1.0% 258 1.1%
People with disability 375 1.7% 408 1.8%
*Indicates data based on the nine directorates of the ACTPS.
5 Percentage based on most recent available ACT population data, December 2011, sourced from the Australian Bureau of Statistics (ABS), Australian Demographic Statistics 2011 Census Edition – Preliminary.
PAGE 69STATE OF THE SERVICE REPORT 2013

3.2 ACT Public Service – Workforce SummaryThe ACTPS consists of nine directorates that report to the Head of Service (see Table 1), and together represent approximately 90 percent of the ACT public sector. As at June 2013, FTE was 17,848.5 (up from 17,196.1 as at June 2012) and headcount was 20,017 (up from 19,493 as at June 2012). As a proportion of ACT population, end of financial year data from June 2009 to June 2013, shows an increase from 4.4 percent to 4.7 percent based on FTE, and 5.0 percent to 5.3 percent based on headcount. The proportions do not encompass other public sector agencies of the ACT public sector nor regional population neighbouring the ACT.
Averages over the period from 2008-09 to 2012-13, and June 2009 to June 2013, provide some trend information. Average FTE (over each financial year) experienced an average year-on-year increase of 4.2 percent. Executive staff numbers as a proportion of total FTE and headcount at the end of each financial year have remained steady at 1.1 percent and 1.0 percent, respectively. ACTPS employment modes also show minor variation over the five year period. On average, permanent staff at the end of each financial year represented 78.3 percent of total headcount.
Full-time salaries from June 2009 to June 2013, have experienced an average year-on-year increase of 3.6 percent, based on the average as at the end of each financial year. Gender pay gap during this time has had minimal variation between 2.2 percent and 3.0 percent, comparing well to other jurisdictions. Females continue to represent over 60 percent of the workforce by FTE and by headcount. The composition of staff superannuation schemes includes 56.2 percent with a fund of choice, based on headcount as at June 2013 (up from 52.3 percent as at June 2012).
Of total appointments to permanent positions, approximately 34.7 percent were recruited from outside the organisation during 2012-13 (down on previous years) with the complement of 63.3 percent being appointments of internal staff, including temporary employees to permanent positions. The separation rate of permanent staff was 6.8 percent (down from 8.5 percent in 2011-12) and is the lowest it has been for the past five years.
The average age and length of service of ACTPS employees has remained virtually unchanged and was 42.4 years and 8.4 years, respectively as at June 2013. As at June 2013, the generational mix since June 2009 has changed, with generation Y as a proportion of total headcount increasing by approximately 10 percentage points to 26.9 percent, and conversely baby boomers decreasing by approximately 10 percentage points to 34.6 percent of all employees.
From 2008-09 to 2011-12, the usage of annual leave has remained virtually unchanged at an average of 18.6 days per person. Over the same period, personal leave usage has increased from 10.9 days per person to 11.1 days person, or equivalent to a 4.5 percent and 4.7 percent absence rate, respectively.
Table 2a, 2b and 2c provides an overview of ACTPS aggregate indicators, based on the one-ACTPS organisation, for the five year period 2008-09 to 2012-13. All data tables should be read in conjunction with definitions and limitations found in the introduction, and explanatory footnotes. Information is based on paid staff, as at the end of each financial year or over the financial year (FY), as noted.
PAGE 70STATE OF THE SERVICE REPORT 2013
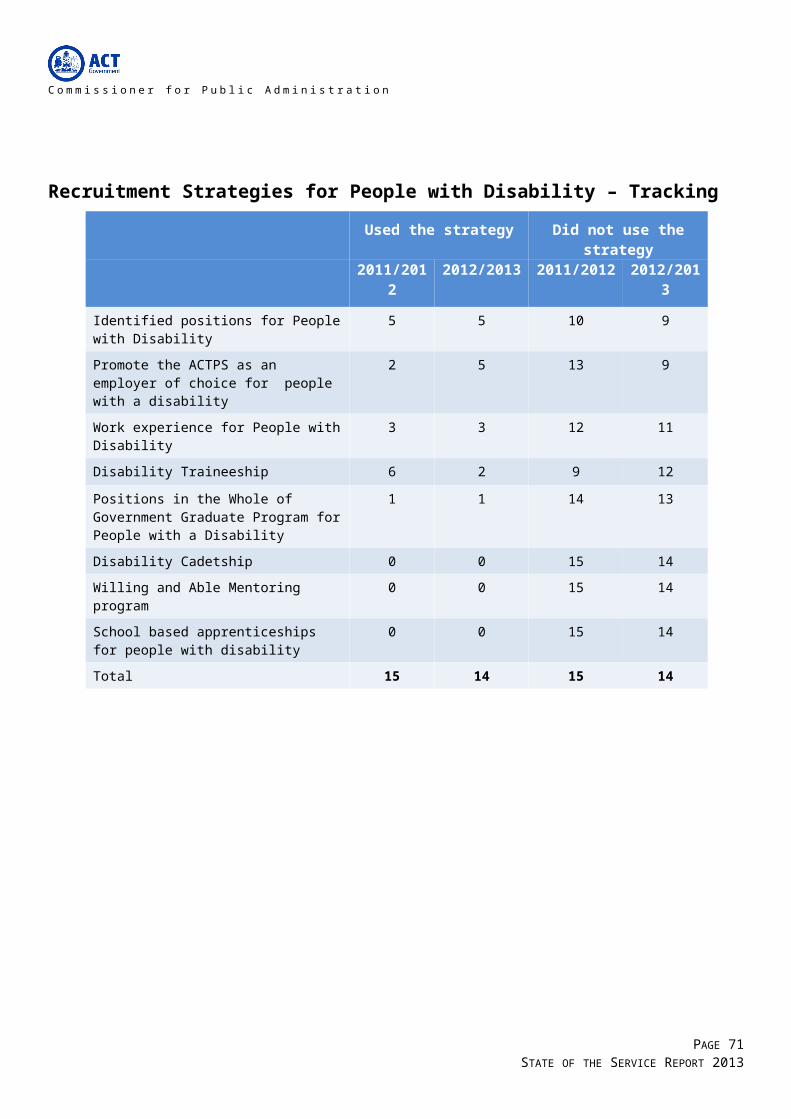
Table 2a: ACTPS employee numbers (2008-09 to 2012-13)
2008-09 2009-10 2010-11 2011-12 2012-13
Full-Time Equivalent (FTE)
FTE (end FY) 15513.9 15857.7 16509.6 17196.1 17848.5
Proportion of ACT population6
4.4% 4.4% 4.5% 4.6% 4.7%
FTE (average, during FY) 14930.9 15648.0 15970.6 16676.7 17329.2
Increase year-on-year 5.9% 4.8% 2.1% 4.4% 3.9%
Headcount
Headcount (end FY) 17495 17917 18599 19331 20017
Proportion of ACT population7
5.0% 5.0% 5.1% 5.2% 5.3%
Headcount (average, during FY)
16847.2 17643.6 18014.9 18818.0 19440.7
Increase year-on-year 5.1% 4.7% 2.1% 4.5% 3.3%
Executives (end FY)
FTE 169.5 175.4 183.6 186.0 196.7
Proportion of workforce 1.1% 1.1% 1.1% 1.1% 1.1%
Headcount 172 178 185 187 197
Proportion of workforce 1.0% 1.0% 1.0% 1.0% 1.0%
Employment modes (proportions of workforce, based on headcount, end FY)
Permanent 78.7% 79.3% 78.2% 77.9% 77.6%
Temporary 13.4% 12.9% 14.5% 15.3% 15.3%
Casual 8.0% 7.7% 7.3% 6.8% 7.1%
Full-time 70.3% 70.3% 70.2% 70.4% 70.5%
Part-time 21.7% 22.0% 22.5% 22.8% 22.4%
6 ACT estimated resident population, sourced from the Australian Bureau of Statistics (3101.0 - Australian Demographic Statistics, Dec 2012) is used to calculate employee numbers (FTE and headcount) as a proportion of population.7 Ibid.
PAGE 71STATE OF THE SERVICE REPORT 2013
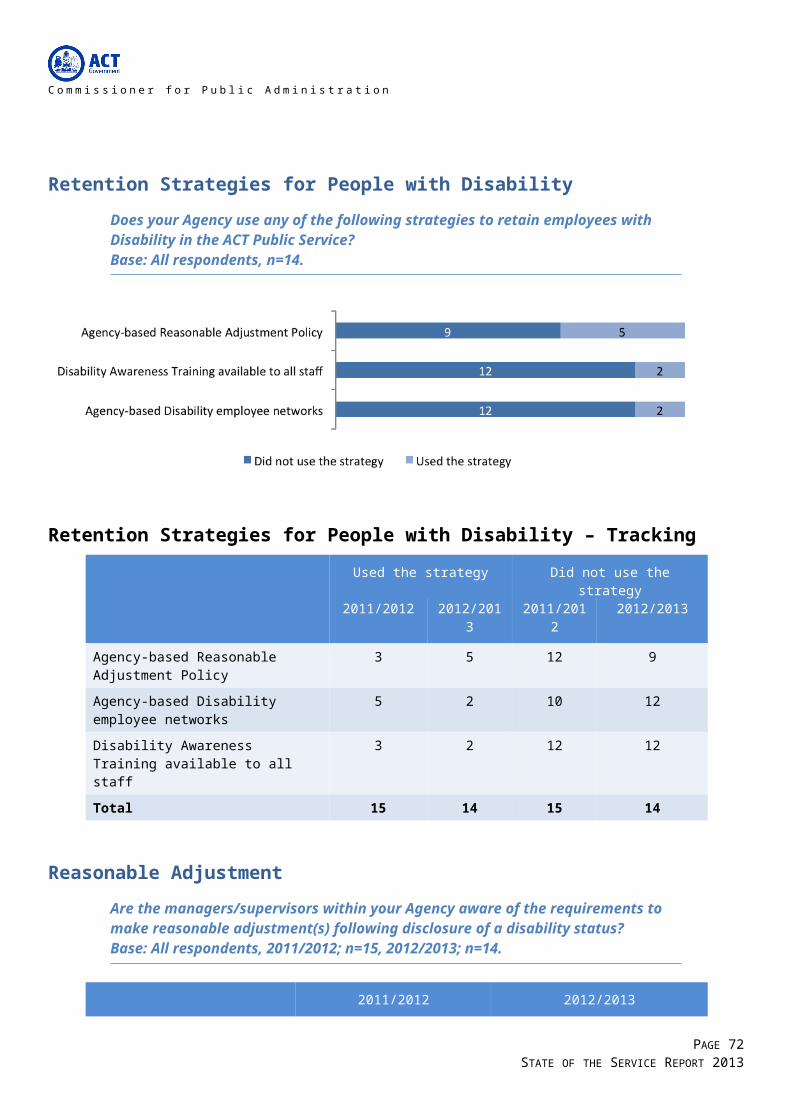
Table 2b: ACTPS workforce characteristics (2008-09 to 2012-13)
2008-09 2009-10 2010-11 2011-12 2012-13
Remuneration (base salaries)
Full-time (average) $70,086 $71,730 $73,832 $77,099 $80,012
Increase year-on-year 4.6% 2.3% 2.9% 4.4% 3.7%
Full-time (median) $65,886 $67,470 $69,153 $71,578 74082
Part-time $62,398 $64,152 $ 65,893 $69,043 71970
Part-time load (average) 0.70 0.70 0.69 0.69 0.69
Gender pay gap 2.9% 2.4% 2.2% 3.0% 2.9%
Commencements and separations (permanent staff)
External appointments as a proportion of total appointments8
Not avail. 38.8% 40.9% 40.9% 34.7%
Separation rate 7.4% 7.6% 9.8% 8.5% 6.8%
Age and length of service (average in years, end FY)
Age (includes casuals) 42.5 42.7 42.7 42.6 42.4
Length of service (excludes casuals)
8.3 8.5 8.4 8.4 8.4
Generations (proportions of workforce, based on headcount, end FY)
Generation Y 16.6% 18.5% 21.2% 24.0% 26.9%
Generation X 35.8% 36.4% 36.4% 37.0% 37.4%
Baby boomers 44.9% 42.8% 40.5% 37.6% 34.6%
Pre-baby boomers 2.8% 2.3% 1.9% 1.4% 1.1%
Leave usage9
Annual leave (average in days)
18.7 18.8 18.8 18.4 18.3
Personal leave (average in days)
10.9 11.4 11.4 11.1 10.7
Personal leave absence rate 4.5% 4.7% 4.8% 4.7% 4.4%
8 External appointments as a proportion of total appointments provide an indication of external recruits versus internal employees, appointed to permanent positions. 2008-09 data is not available.9 Leave data tends to endure a processing lag time, affecting 2012-13 data. Earlier years have been retrospectively updated to address processing time lag.
PAGE 72STATE OF THE SERVICE REPORT 2013
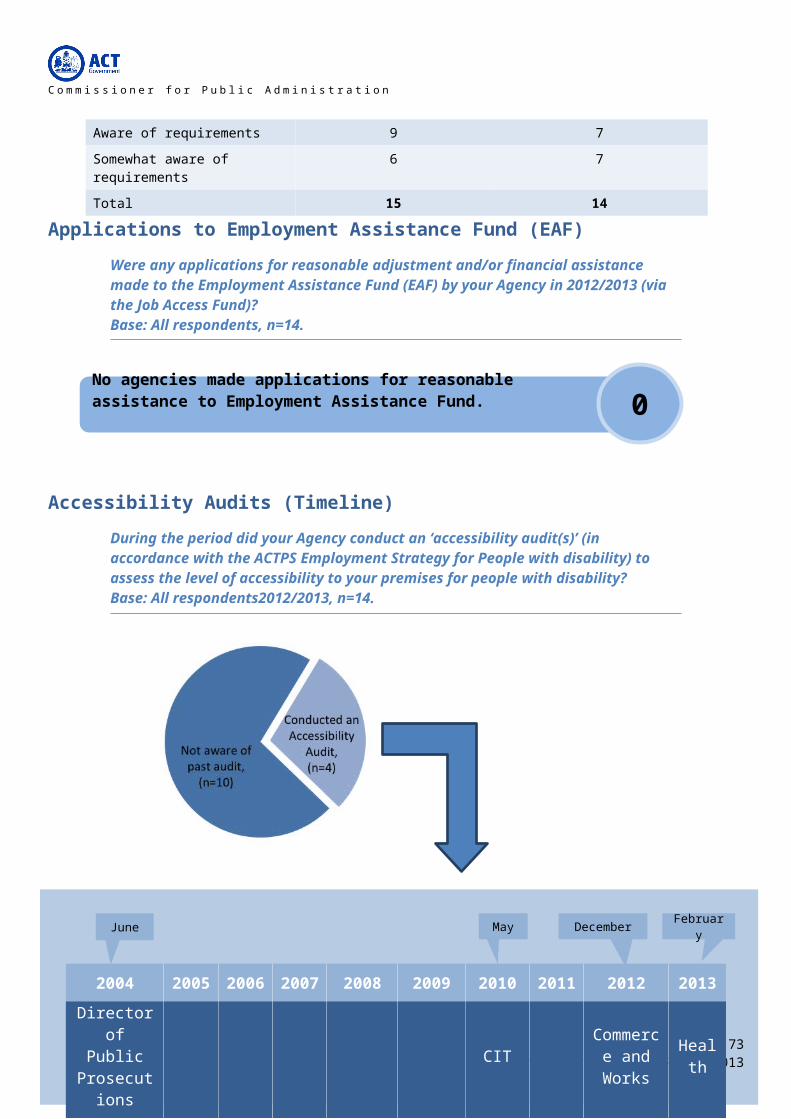
Table 2c: ACTPS diversity (2008-09 to 2012-13)
2008-09 2009-10 2010-11 2011-12 2012-13
Aboriginal and Torres Strait Islanders
FTE 140.4 139.4 175.2 186.0 216.7
Headcount 154 153 193 202 238
Proportion of workforce 0.9% 0.9% 1.0% 1.0% 1.2%
Culturally and linguistically diverse
FTE 1986.8 2128.4 2264.4 2408.3 2936.6
Proportion of workforce 12.6% 13.2% 13.4% 13.8% 16.1%
Headcount 2211 2363 2495 2663 3218
People with disability
FTE 251.6 273.6 306.5 305.0 345.1
Headcount 286 306 351 343 384
Proportion of workforce 1.6% 1.7% 1.9% 1.8% 1.9%
Females
Proportion of workforce - FTE 63.1% 63.4% 63.1% 62.7% 62.7%
Proportion of workforce – headcount
65.2% 65.5% 65.0% 64.7% 64.8%
PAGE 73STATE OF THE SERVICE REPORT 2013
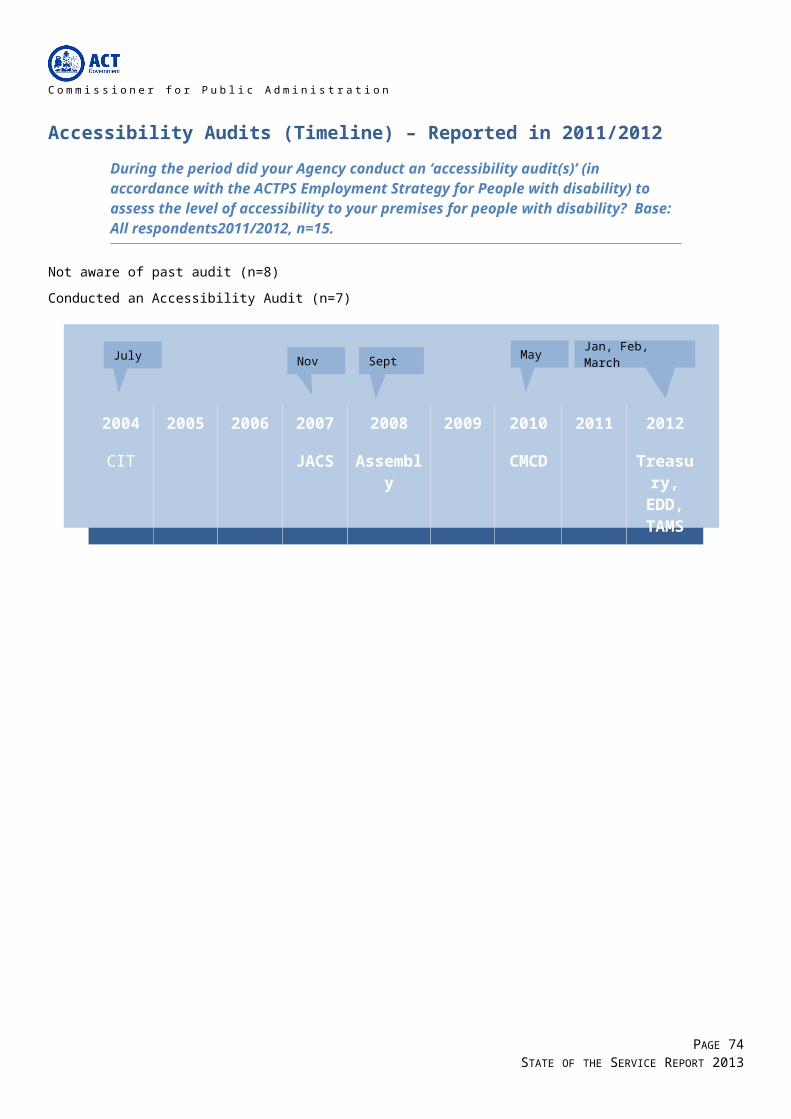
Table 3: ACTPS FTE and headcount by employment modes (June 2013)
Employment mode FTE Headcount FTE as proportion of headcount10
Permanent full-time 11721.0 11766 99.6%
Permanent part-time 2651.6 3777 70.2%
Temporary full-time 2317.6 2348 98.7%
Temporary part-time 443.2 705 62.9%
Casual 715.0 1421 50.3%
Total 17848.5 20017 89.2%
Figure 1: FTE by employment mode (June 2013)
10 FTE as a proportion of headcount provides an indicator of utilisation within each employment mode.
PAGE 74STATE OF THE SERVICE REPORT 2013

Table 4: ACTPS FTE and headcount by classification group (June 2012 and June 2013)
Classification group FTE Headcount
June 2012 June 2013 June 2012 June 2013
Administrative Officers 4130.3 4280.4 4737 4895
Ambulance Officers 189.4 203.8 201 216
Bus Operators 575.9 597.3 648 674
Correctional Officers 159.5 163.0 169 173
Dentists/Dental Officers 10.9 13.5 14 17
Disability Officers 237.6 251.4 262 283
Executive Officers 186.0 196.7 187 197
Fire and Rescue Officers 334.4 347.5 336 349
General Service Officers & Equivalent 977.3 1027.8 1060 1103
Health Assistants 42.8 56.1 47 64
Health Professional Officers 1126.9 1182.7 1286 1333
Information Technology Officers 147.5 163.5 151 166
Judicial Officers 10.7 10.0 12 15
Legal Officers 75.7 89.5 83 95
Legal Support 13.9 15.8 15 16
Linen Production & Maintenance 63.9 57.2 67 60
Medical Officers 666.3 742.5 739 814
Nursing and Midwifery 2154.8 2218.7 2579 2626
Professional Officers 113.8 114.4 124 132
Prosecutors 34.9 37.6 41 38
Rangers 39.2 35.6 41 38
School Leaders 717.7 740.3 734 753
Senior Officers 1953.7 2042.2 2022 2113
Statutory Office Holders 11.0 12.8 12 14
Teachers 2865.3 2893.0 3367 3433
Technical Officers 272.6 276.2 310 319
Trainees and Apprentices 42.6 40.0 43 40
Transport Officers (incl. trainer/assessors) 41.4 39.1 44 41
Total 17196.1 17848.5 19331 20017
PAGE 75STATE OF THE SERVICE REPORT 2013

Table 5: FTE by agency (June 2012 and June 2013)
Directorate June 2012 June 2013 Percentage change (%)
Chief Minister and Treasury11
339.2
279.1 -17.7%
Long Service Leave Authority 10.0 12.0 20.0%
Independent Competition and Regulatory Commission
9.2 8.0 -13.0%
Commerce and Works 911.6 1048.1 15.0%
Community Services 1221.5 1219.0 -0.2%
Economic Development 214.8 208.3 -3.0%
Exhibition Park Corporation 13.9 13.9 0%
Gambling and Racing Commission 29.3 27.6 -5.8%
Land Development Agency 85.5 89.2 4.3%
Education and Training 4927.8 5027.1 2.0%
Environment and Sustainable Development
466.8 452.3 -3.1%
Health 5416.0 5749.1 6.1%
Justice and Community Safety 1748.2 1820.6 4.1%
Territory and Municipal Services 1825.6 1894.3 3.8%
Total 17196.1 17848.5 3.8%
11 The reduction in FTE for the Chief Minister and Treasury Directorate is a result of the machinery of government changes in November 2012 and the merging of elements of the former Treasury Directorate with Chief Minister and Cabinet Directorate. The transfer of Shared Services and other smaller elements of the former Treasury Directorate to the newly created Commerce and Works Directorate accounts for the majority of this reduction.
PAGE 76STATE OF THE SERVICE REPORT 2013
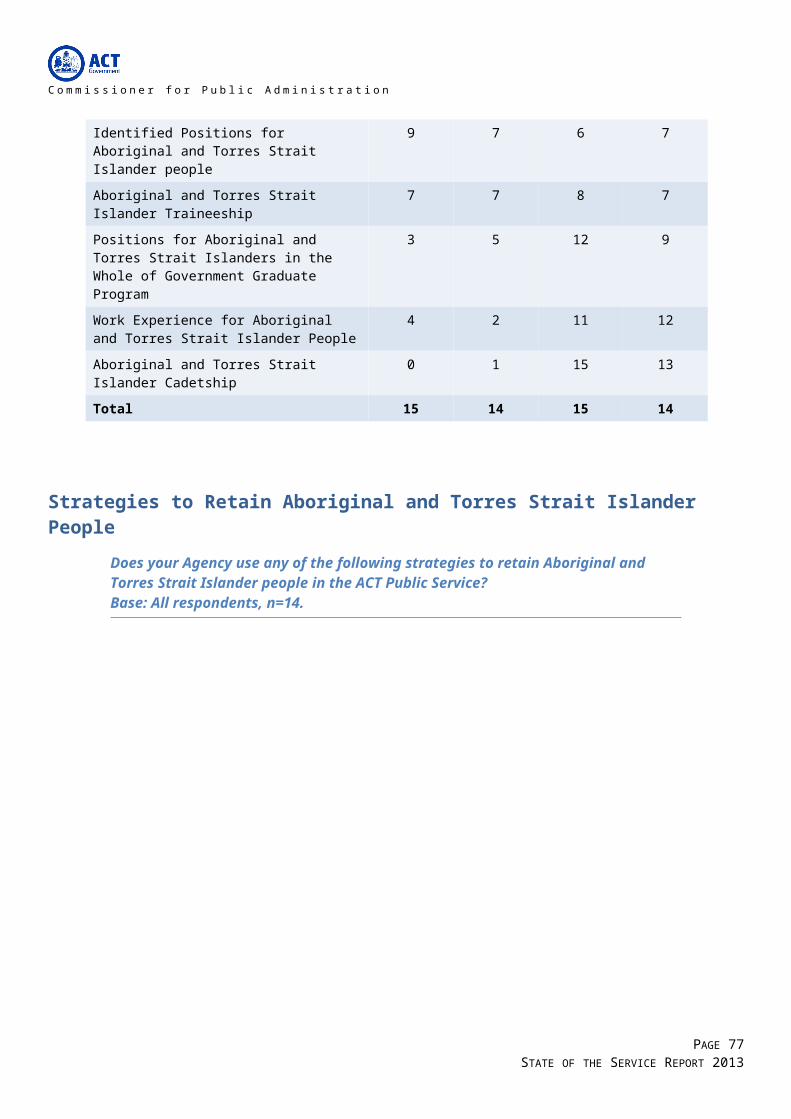
PAGE 77STATE OF THE SERVICE REPORT 2013
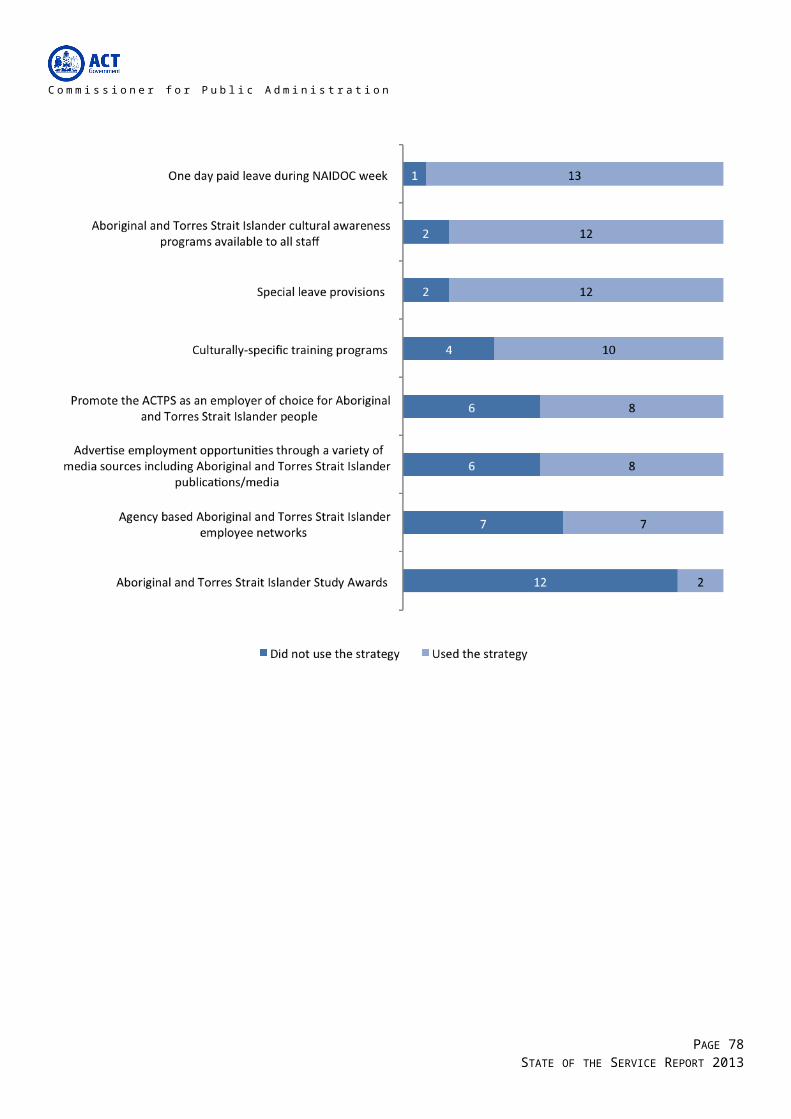
Table 6: FTE by agency and employment mode (June 2013)
Directorate Permanent Temporary Casual Total
Chief Minister and Treasury 201.4 77.6 0.0 279.1
Long Service Leave Authority 10.0 2.0 0.0 12.0
Independent Competition and Regulatory Commission
5.0 3.0 0.0 8.0
Commerce and Works 830.8 215.1 2.2 1048.1
Community Services 1044.7 127.2 47.1 1219.0
Economic Development 184.1 19.7 4.5 208.3
Exhibition Park Corporation 11.7 2.0 0.3 13.9
Gambling and Racing Commission 25.0 2.6 0.0 27.6
Land Development Agency 81.2 8.0 0.0 89.2
Education and Training 3993.4 663.1 370.6 5027.1
Environment and Sustainable Development 380.6 70.8 0.9 452.3
Health 4354.8 1194.4 199.8 5749.1
Justice and Community Safety 1600.0 202.5 18.1 1820.6
Territory and Municipal Services 1650.0 172.8 71.4 1894.3
Total 14372.7 2760.9 715.0 17848.5
Figure 2: FTE by agency and employment mode (June 2013)
PAGE 78STATE OF THE SERVICE REPORT 2013

Table 7: Headcount by agency and employment mode (June 2013)
Directorates Permanent Temporary Casual Total
Chief Minister and Treasury 210 82 0 292
Long Service Leave Authority 10 2 0 12
Independent Competition and Regulatory Commission
5 3 0 8
Commerce and Works Directorate 852 221 4 1077
Community Services 1114 138 68 1320
Economic Development 188 20 9 217
Exhibition Park Corporation 12 2 1 15
Gambling and Racing Commission 26 3 0 29
Land Development Agency 86 8 0 94
Education and Training 4377 801 819 5997
Environment and Sustainable Development 399 77 2 478
Health 4857 1307 376 6540
Justice and Community Safety 1644 211 45 1900
Territory and Municipal Services 1763 178 97 2038
Total 15543 3053 1421 20017
PAGE 79STATE OF THE SERVICE REPORT 2013
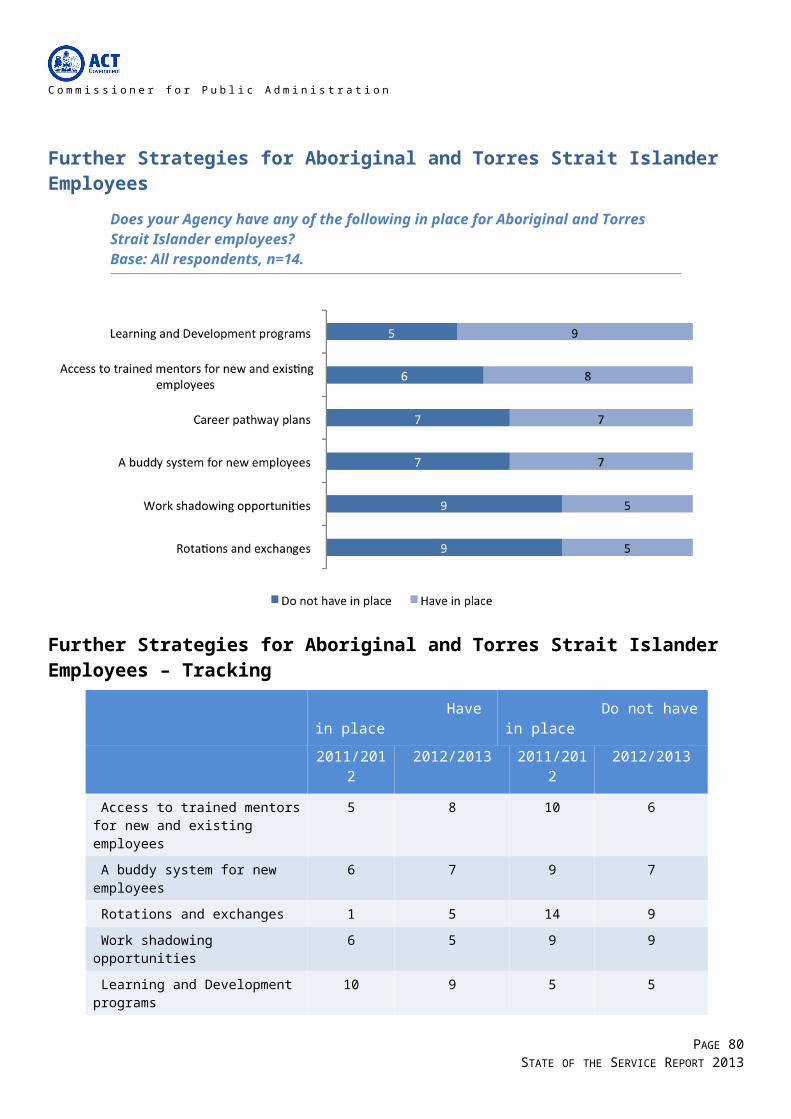
Table 8: Headcount by classification group and agency (June 2013)
Classification group CMTD CWD CSD EDD ETD ESDD HD JACSD TAMS Total
Administrative Officers 138 481 471 129 1495 212 940 662 367 4895
Ambulance Officers - - - - - - - 216 - 216
Bus Operators - - - - - - - - 674 674
Correctional Officers - - - - - - - 173 - 173
Dental - - - - - - 17 - - 17
Disability Officers - - 281 - 2 - - - - 283
Executive Officers 30 20 22 19 14 12 22 39 19 197
Fire and Rescue Officers - - - - - - - 349 - 349
General Service Officers & Equivalent - - 4 10 117 18 472 19 463 1103
Govt Advisors - - - - - - - - - 0
Health Assistant - - - - - - 64 - - 64
Health Professional Officers - - 301 - 4 - 1015 13 - 1333
Information Technology Officer - 138 - - 25 1 2 - - 166
Judicial Officers - - - - - - - 15 - 15
Legal Officers - - 1 - - 2 1 91 - 95
Legal Support - - - - - - - 16 - 16
Linen Production & Maintenance - - - - - - - - 60 60
Medical Officer - - - - - - 814 - - 814
Nursing and Midwifery - - - - - - 2626 - - 2626
Professional Officers - 13 7 5 22 20 12 7 46 132
Prosecutors - - - - - - - 38 - 38
Rangers - - - 4 - - - - 34 38
School Leaders - - - - 753 - - - - 753
Senior Officers 144 421 221 179 132 186 373 238 219 2113
Statutory Office Holders - - - - - 1 - 13 - 14
Teachers - - - - 3432 - 1 - - 3433
Technical Officers - - 10 7 - 26 177 8 91 319
Trainees and Apprentices - 4 2 2 1 - 4 3 24 40
Transport Officers (incl. trainer/assessors) - - - - - - - - 41 41
Totals 312 1077 1320 355 5997 478 6540 1900 2038 20017
CMTD Chief Minister and Treasury Directorate (inclusive of Long Service Leave Authority, Independent Competition and Regulatory Commission).CSD Community Services Directorate.CWD Commerce and Works Directorate (inclusive of Shared Services).EDD Economic Development Directorate (inclusive of Land Development Agency, Exhibition Park Corporation, Gambling and Racing
Commission). ESDD Environment and Sustainable Development Directorate.ETD Education and Training Directorate. HD Health Directorate.JACSD Justice and Community Safety Directorate (inclusive of Director of Public Prosecutions). TAMSD Territory and Municipal Services Directorate (inclusive of ACTION)
PAGE 80STATE OF THE SERVICE REPORT 2013
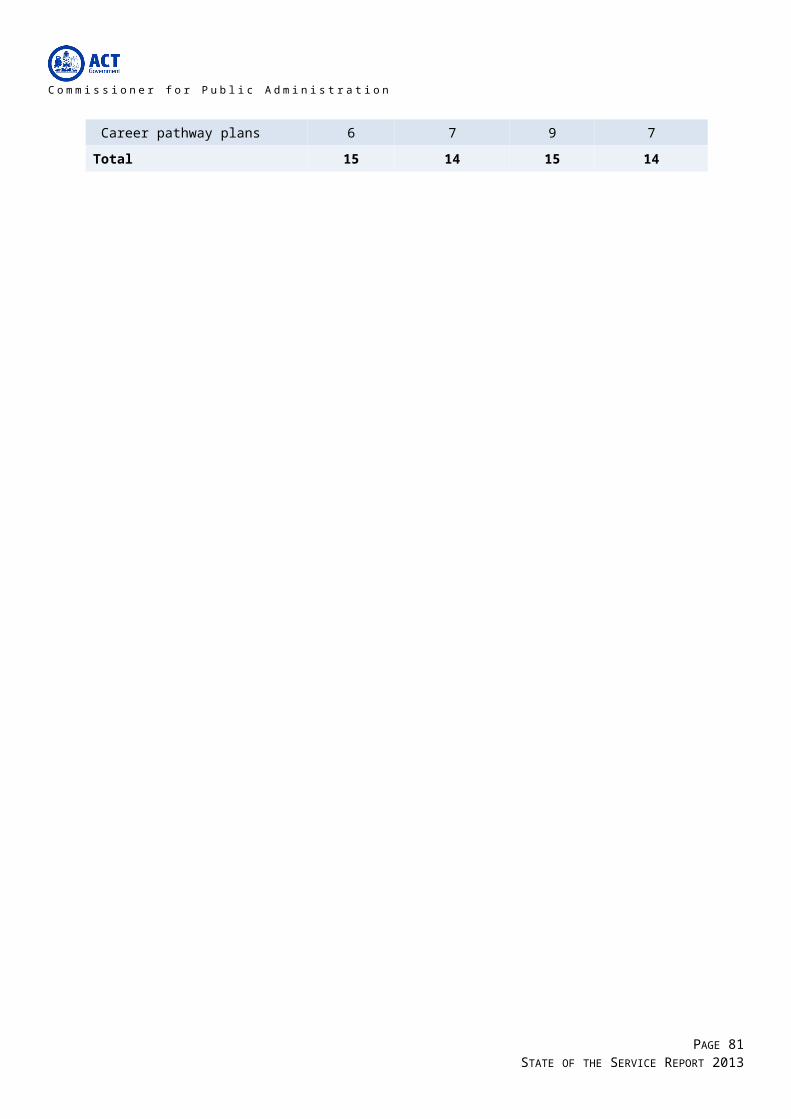
Table 9: FTE and headcount by agency and division (June 2013)
Directorate Division/agency FTE Headcount
Chief Minister & Treasury Directorate
Corporate Management and Strategic Finance
19.6 20
Culture and Communications 40.7 43
Default Insurance Fund 2.0 2
Workforce Capability and Governance Division
87.7 92
Independent Competition and Regulatory Commission
8.0 8
Investment & Economics 35.5 38
Office of the Director-General 4.0 4
Office of the Under Treasurer 6.0 6
Policy 37.1 39
Finance & Budget 46.5 48
Sub- total 287.1 300
Long Service Leave Authority - Total 12.0 12
Total 299.1 312
Directorate Division/agency FTE Headcount
Commerce and Works Directorate
ACT Insurance Authority 13.6 15
Business Services 74.3 76
Executive 6.0 6
Finance and Finance and Budget 127.2 132
Human Resources 205.0 216
Information and Communication Technology 419.7 424
Procurement 128.7 132
Revenue Management 73.6 76
Total 1048.1 1077
Machinery of Government (MOG) changes in November 2012 included the merging of the former Treasury Directorate with Chief Minister and Cabinet. This change resulted in injury management staff of Shared Services transferring to the Workforce Capability and Governance Division.
PAGE 81STATE OF THE SERVICE REPORT 2013

Directorate Division/agency FTE Headcount
Community Services Directorate
Child, Youth & Family Support 389.9 424
Disability ACT 335.1 371
Housing & Community Services 219.1 224
Office of the Director-General 8.0 8
Policy and Organisational Services 161.2 170
Therapy ACT 105.8 123
Total 1219.0 1320
Directorate Division/agency FTE Headcount
Economic Development Directorate
Capital Metro12 2.0 2
Economic Development, Policy and Governance 61.8 64
Land Strategy and Finance 26.6 27
Office of the Director-General 9.0 9
Office of the Coordinator General 1.0 1
Tourism, Events & Sport 107.9 114
Sub- total 208.3 217
Land Development Agency Land Development 52.1 55
Land Strategy and Finance 33.4 35
Gambling and Racing Commission 27.6 29
Exhibition Park Corporation 13.9 15
Total 335.3 351
12 The Capital Metro Agency was part of the Economic Development Directorate as of 30 June 2013. As of 1 July 2013 The Capital Metro Agency is a standalone Directorate.
PAGE 82STATE OF THE SERVICE REPORT 2013

Directorate Division/agency FTE Headcount
Education and Training Directorate
Casuals 364.0 804
Executive Director of Corporate Services 105.2 112
Office for Schools 4182.3 4669
Office of the Director-General 3.0 3
Office of the Deputy Director-General 2.0 2
Strategy & Coordination 41.4 44
Learning, Teaching and Student Engagement 233.3 264
Teacher Quality Institute 8.8 10
Tertiary Education and Performance 86.9 89
Total 5027.1 5997
Directorate Division/agency FTE Headcount
Environment & Sustainable Development Directorate
City Planning 48.9 51
Corporate 41.1 43
Office of the Director-General 15.3 17
Planning Delivery 73.5 79
Policy 73.9 78
Regulation and Services 199.7 210
Total 452.3 478
Directorate Division/agency FTE Headcount
Health Directorate Canberra Hospital and Health Services 4626.5 5326
Director-Generals Reports 300.6 320
Strategy and Corporate 808.4 877
Special Purpose Account 13.6 17
Total 5749.1 6540
PAGE 83STATE OF THE SERVICE REPORT 2013

Directorate Division/agency FTE Headcount
Justice & Community Safety Directorate
ACT Government Solicitor 84.6 88
Corporate 60.9 63
Corrective Services 302.9 320
Director of Public Prosecutions 73.1 75
Electoral Commission 6.4 7
Emergency Services 649.3 665
Human Rights Commission 20.3 22
Law Courts & Tribunal 152.0 165
Legislation, Policy & Programs 45.0 47
Office of the Director-General 6.9 7
Office of Regulatory Services 208.7 217
Parliamentary Counsel’s Office 22.9 28
Public Advocate of the ACT 14.4 16
Public Trustee for the ACT 38.8 41
Security Emergency Management 14.0 14
Strategic Finance 12.0 12
Transport & Infrastructure 92.7 93
Victim Support ACT 15.9 20
Total 1820.6 1900
Directorate Division/agency FTE Headcount
PAGE 84STATE OF THE SERVICE REPORT 2013
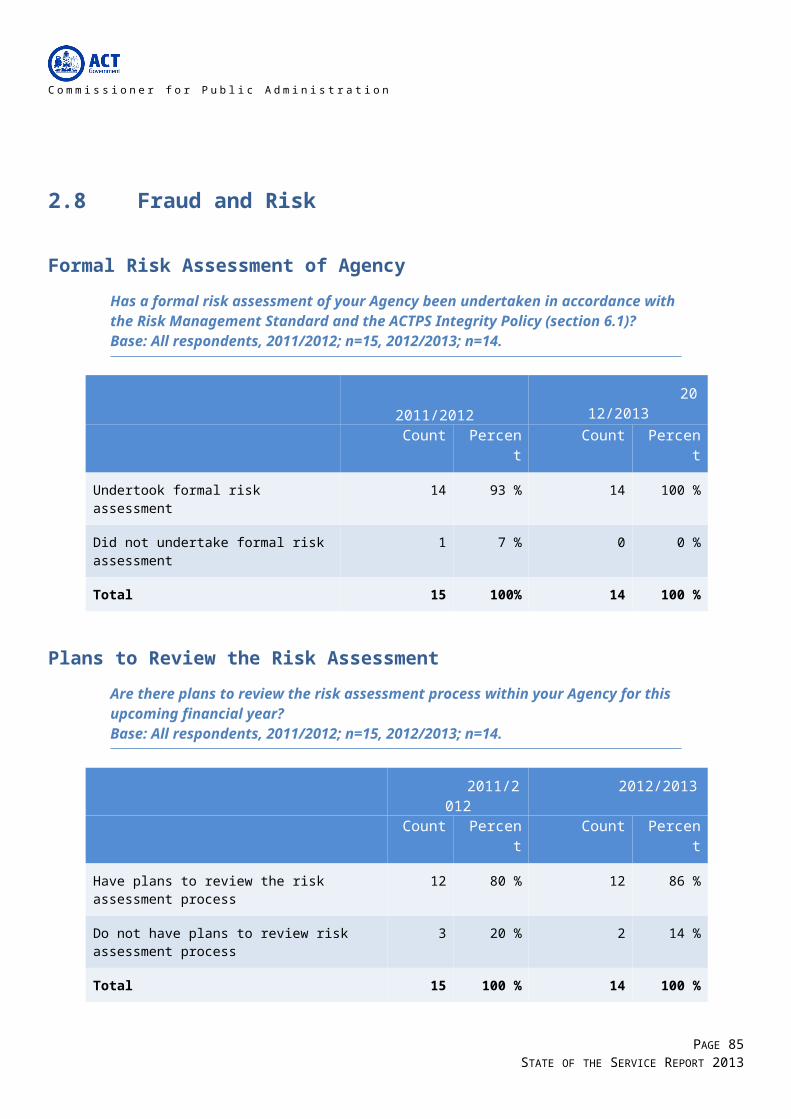
Territory & Municipal Services Directorate
Business Enterprises Division 191.6 199
Directorate Services Division 216.9 225
Canberra Connect 101.4 106
Corporate (incl. Executive) 72.5 76
Operations 43.0 43
Office of the Director-General 5.0 5
Parks & City Services Division 546.6 578
Roads & Public Transport 102.6 103
Sub-total 1062.3 1110
ACTION 831.6 928
Total 1894.3 2038
PAGE 85STATE OF THE SERVICE REPORT 2013

3.3 RemunerationFigure 3: Headcount by superannuation scheme (June 2013) 13
Notes from Figure 3:CSSDB – Commonwealth Superannuation Scheme - Defined Benefit
PSSDB – Public Sector Superannuation - Defined Benefit
PSSAP – Public Sector Superannuation – Accumulation Plan
Fund of Choice
13For information on superannuation schemes, see australia.gov.au. Superannuation data excludes ACTION staff paid through the Aurion payroll system.
PAGE 86STATE OF THE SERVICE REPORT 2013

Figure 4: Salary profile by gender14 (June 2013)
Table 10: Full-time employee salaries by generation and gender (June 2013)(full-time employees, average per annum)
Table 11: Full-time employee salaries by length of service and gender (June 2013)(full-time employees, average per annum)
Length of service Female Male Aggregate
14 Remuneration reflects base salary increment points, excludes superannuation and allowances.
PAGE 87STATE OF THE SERVICE REPORT 2013
Generation Female Male Aggregate
Generation Y $70,620 $68,231 $69,826
Generation X $83,973 $83,765 $83,874
Baby Boomers $85,427 $84,811 $85,159
Pre-Baby Boomers $80,785 $85,412 $83,792
Salary (average) $79,711 $80,388 $80,012

Less than 5 years $71,961 $74,825 $73,128
5 to 9 years $82,840 $81,624 $82,332
10 to 19 years $88,341 $87,116 $87,849
20 years or more $91,857 $87,490 $89,702
Salary (average) $79,711 $80,388 $80,012
Table 12: Part-time employee salaries by generation and gender (June 2013)(average per annum)
Generation Female Male Aggregate
Salary (average)
Part-time load
(average)
Salary (average)
Part-time load
(average)
Salary (average)
Part-time load (average)
Generation Y $66,803 0.68 $57,264 0.72 $65,243 0.68
Generation X $75,017 0.67 $74,258 0.70 $74,926 0.68
Baby Boomers $69,874 0.72 $76,602 0.71 $71,070 0.71
Pre-Baby Boomers
$78,778 0.60 $77,795 0.63 $78,427 0.61
Salary (average)
$71,927 0.69 $72,214 0.71 $71,970 0.69
PAGE 88STATE OF THE SERVICE REPORT 2013

Table 13: Part-time employee salaries by length of service and gender (June 2013)(part-time employees)
Length of service
Female Male Aggregate
Salary (average)
Part-time load
(average)
Salary (average)
Part-time load
(average)
Salary (average)
Part-time load (average)
Less than 5 years
$67,202 0.68 $67,687 0.69 $67,297 0.68
5 to 9 years
$70,910 0.70 $73,975 0.73 $71,293 0.70
10 to 19 years
$79,260 0.68 $82,582 0.71 $79,638 0.68
20 years or more
$78,064 0.71 $77,585 0.73 $78,009 0.71
Salary (average)
$71,927 0.69 $72,214 0.71 $71,970 0.69
The ACT Government supports the principles of pay equity across the ACTPS through the establishment of common terms and conditions in enterprise agreements - including standard salaries within classifications. These common terms and conditions also promote consistency and mobility within the ACTPS.
The gender pay gap assists with the review of gender pay equity within the ACTPS, by assessing average earnings of male and female employees to determine if a difference exists15. Factors that contribute to gender pay gap include gender workforce participation rates and length of service.
A positive pay gap indicates average earnings of females are less than average earnings of males, and conversely, a negative pay gap indicates the opposite.
15 The gender pay gap methodology used within this section is similar to the methodology used by the Western Australian Government’s Department of Commerce. Gender pay gap is equal to one minus {female weekly ordinary time earnings divide by male weekly ordinary time earnings} multiplied by 100.
PAGE 89STATE OF THE SERVICE REPORT 2013

Table 14: Gender pay gap in the ACTPS, ACT and Australia16 (June 2013)
Workforce Gender pay gap
ACTPS 2.9%
ACT 14.8%
Australia 17.5%
Figure 5: Gender pay gap by age cohort (June 2013)
The proportion of female employees and their average earnings affects the gender pay gap by classification.
16 ACT and national indicators are based on a calculation, using full-time adult ordinary time earnings published by the ABS, Commonwealth Government, Average Weekly Earnings - States & Territories: Trend - ABS 6302 average weekly earnings trend estimates, May 2013.
PAGE 90STATE OF THE SERVICE REPORT 2013

Table 15: Gender pay gap by classification group (June 2013) 17
Classification group Salary Proportion female
Gender pay gap
Female earnings(average, per
dollar of male earnings)
Average Median
Administrative Officers $62,813 $60,056 75.9% 5.6% $0.94
Ambulance Officers $75,561 $79,990 35.6% 2.8% $0.97
Bus Operators $63,875 $64,224 10.2% 0.5% $1.00
Correctional Officers $64,002 $63,245 21.4% 3.1% $0.97
Dentists/Dental Officers $114,316 $121,853 76.5% -7.0% $1.07
Disability Officers $48,873 $44,915 51.2% -2.0% $1.02
Executive Officers $184,003 $164,832 42.7% -5.0% $1.05
Fire and Rescue Officers $72,337 $69,563 2.0% 4.4% $0.96
General Service Officers & Equivalent
$49,091 $44,739 22.6% 10.1% $0.90
Health Assistants $52,063 $55,674 90.6% -8.1% $1.08
Health Professional Officers $84,088 $83,648 79.1% 2.1% $0.98
Information Technology Officers
$71,187 $72,341 15.7% -4.1% $1.04
Legal Officers $107,565 $113,833 61.1% 10.7% $0.89
Legal Support $57,462 $59,108 75.0% -11.3% $1.11
Linen Production & Maintenance
$49,096 $39,770 58.3% 12.4% $0.88
Medical Officers $119,881 $109,118 47.1% 13.5% $0.86
Nursing and Midwifery $74,050 $74,082 89.8% -2.5% $1.02
Professional Officers $78,619 $75,168 66.7% 8.3% $0.92
Prosecutors $98,867 $91,650 60.5% 14.7% $0.85
Rangers $60,730 $62,277 23.7% -4.8% $1.05
School Leaders $110,091 $102,311 72.2% 2.8% $0.97
Senior Officers $107,996 $98,770 51.9% 1.6% $0.98
17 Data inclusive of all employees and based on headcount.
PAGE 91STATE OF THE SERVICE REPORT 2013

Statutory Office Holders $222,200 $201,687 46.7% -5.5% $1.06
Teachers $79,292 $88,637 77.6% 0.5% $0.99
Technical Officers $63,618 $61,152 49.9% 15.6% $0.84
Trainees and Apprentices $33,298 $34,019 27.5% -17.5% $1.17
Transport Officers (incl. trainer/assessors)
$83,582 $83,856 9.8% 2.5% $0.97
ACTPS averages $78,053 $74,082 64.8% 2.9% $0.97
3.4 Time-to-hire and separation ratesTable 16: Time-to-hire (2012-13)
Directorate Time-to-hire18
(average, work days)
Panel selection (excl. processing by Shared
Services & Gazettal)
Time-to-hire (incl. Processing by Shared
Services & Gazettal)
Chief Minister and Treasury 33.4 50.9
Community Services 44.2 61.6
Commerce and Works 33.1 49.5
Economic Development 28.8 45.0
Education and Training 31.3 47.6
Environment and Sustainable Development
30.7 47.1
Health 37.6 54.7
Justice and Community Safety 38.0 54.8
Territory and Municipal Services 41.5 60.4
Time-to-hire19 32.7 50.3
18 Time-to-hire information available for clients of Shared Services and in the format shown and excludes ACTION. Health Directorate has a separate online application system.19 A total of 2285 vacancies were advertised during 2011-12. CIT and Auditor General’s Office is not separated from the overall time-to-hire statistic due to system limitation.
PAGE 92STATE OF THE SERVICE REPORT 2013
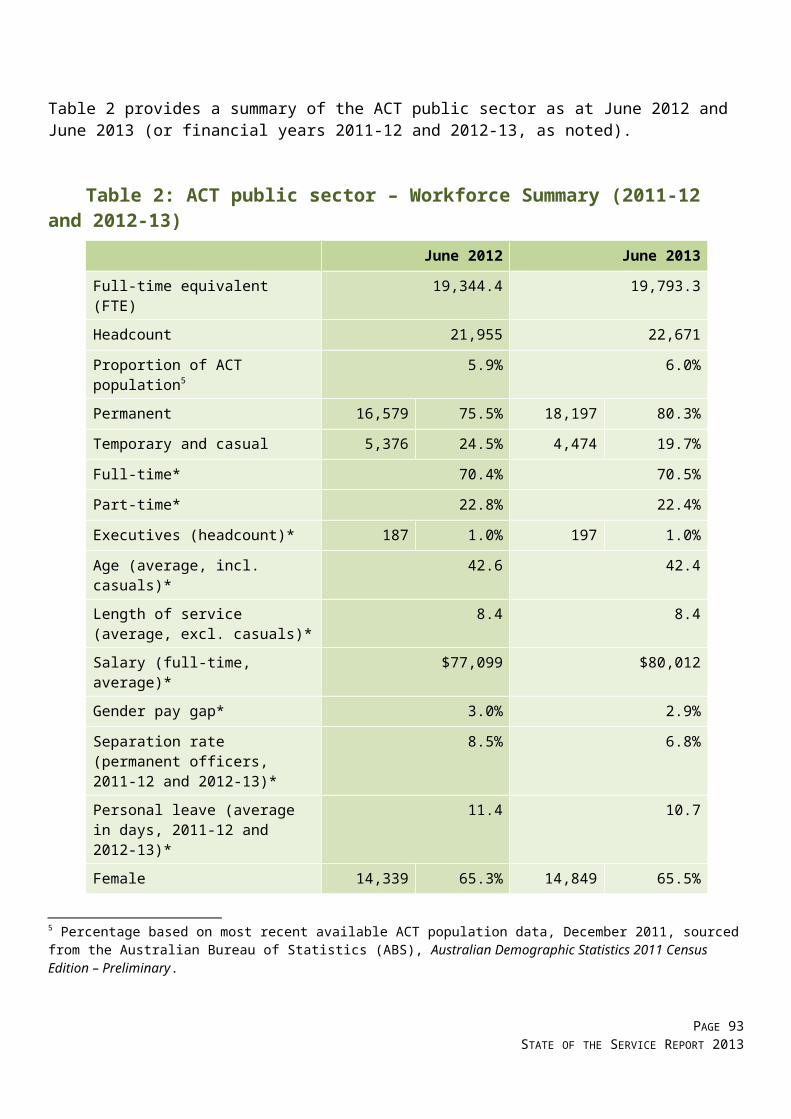
Table 17: Separation rates by classification group (2012-13)
Classification group Separation rate Average permanent officer headcount20
Administrative Officers 7.4% 3552
Ambulance Officers 3.0% 202
Bus Operators 6.2% 602
Correctional Officers 5.7% 141
Dentists/Dental Officers 17.8% 11
Disability Officers 7.8% 232
Executive Officers 0.0% 23
Fire and Rescue Officers 1.1% 350
General Service Officers & Equivalent 8.5% 846
Health Assistants 10.0% 40
Health Professional Officers 8.1% 1085
Information Technology Officers 6.9% 130
Judicial Officers 9.1% 11
Legal Officers 9.0% 78
Legal Support 0.0% 9
Linen Production & Maintenance 4.8% 62
Medical Officers 5.3% 245
Nursing and Midwifery 7.7% 2154
Professional Officers 7.1% 99
Prosecutors 27.3% 29
Rangers 9.2% 33
School Leaders 4.7% 722
Senior Officers 6.1% 1872
Statutory Office Holders 0.0% 2
Teachers 6.3% 2491
Technical Officers 4.1% 245
Trainees and Apprentices 44.1% 14
Transport Officers (incl. Trainer/Assessors) 6.9% 44
Separation rate and average headcount 6.8% 15331
20 Average permanent officer headcount is an average of paid headcount based on the 26 pay periods during 2012-13, to the nearest whole number.
PAGE 93STATE OF THE SERVICE REPORT 2013

Table 18: Separation rates by agency (2012-13)
Directorate Separation rate21
Chief Minister and Treasury 10.9%
Commerce and Works Directorate 6.3%
Long Service Leave Authority 10.2%
Community Services 7.5%
Economic Development 11.8%
Land Development Agency 6.9%
Education and Training 6.0%
Environment and Sustainable Development
8.6%
Health 7.6%
Justice and Community Safety 5.1%
Territory and Municipal Services22 6.7%
ACTPS Separation rate 6.8%
Table 19: Separation rates by generation (2012-13)
Generation Female Male Total
Generation Y 7.6% 8.1% 7.8%
Generation X 4.1% 4.1% 4.1%
Baby Boomers 8.9% 8.1% 8.6%
Pre-Baby Boomers 32.9% 15.5% 25.3%
Separation rate 7.0% 6.5% 6.8%
3.5 Age and Length of Service23
Table 20: Definition of generations
Generation Definition
21 Separation rates available in the form shown and represent permanent separations as a percentage of average permanent headcount. Executives are on temporary contract and are excluded. Directorates with relatively few employees are susceptible to misleading fluctuation. 22 TAMS separation rate is inclusive of ACTION bus operators and transport officers.23 The calculation of average age includes casuals. Note the average age for casuals is higher than for other employment types and this affects the average age of classifications with a high proportion of casuals, such as Teachers and nurses. Length of service in this report excludes casuals. The average length of service calculation does not differentiate between periods of leave with or without pay.
PAGE 94STATE OF THE SERVICE REPORT 2013
Generation Y Born from 1980 and onwards
Generation X Born 1965 to 1979 inclusive
Baby Boomers Born 1946 to 1964 inclusive
Pre-Baby Boomers Born prior to 1946
Table 21: Headcount by generation and gender (June 2013)
Generation Female Male Total
Generation Y 3711 1674 5385
Generation X 4758 2731 7489
Baby Boomers 4393 2529 6922
Pre-Baby Boomers 117 104 221
Total 12979 7038 20017
PAGE 95STATE OF THE SERVICE REPORT 2013
Figure 6: Generation and gender as a proportion of headcount (June 2013)
Table 22: Age and length of service by agency and gender (June 2013)
Directorate Age (average) Length of service (average)
Female Male Aggregate Female Male Aggregate
Chief Minister and Treasury 39.3 42.3 40.5 6.4 7.6 6.9
Long Service Leave Authority
47.6 42.0 45.3 7.3 7.4 7.4
Commerce and Works 39.5 41.4 40.5 8.5 7.9 8.2
Community Services 41.7 43.2 42.2 7.3 7.9 7.5
Economic Development 38.9 43.2 41.0 8.4 8.6 8.5
Land Development Agency 39.7 46.3 43.2 7.2 10.3 8.9
Education and Training 43.4 43.0 43.3 9.4 9.4 9.4
Environment and Sustainable Development
40.0 43.9 41.8 7.4 9.0 8.1
Health 41.5 40.6 41.3 7.6 6.5 7.4
Justice and Community Safety
39.7 43.4 41.8 7.1 10.5 9.1
Territory and Municipal Services
44.1 46.2 45.7 8.3 10.1 9.6
Age (average) 42.0 43.2 42.4 8.2 8.7 8.4
PAGE 96STATE OF THE SERVICE REPORT 2013

Figure 7: Age distribution by gender (June 2013)
PAGE 97STATE OF THE SERVICE REPORT 2013
Hea
dcou
nt
Age

Table 23: Age and length of service by classification group and gender (June 2013)
Classification group Age (average) Length of service (average)
Female Male Aggregate Female Male Aggregate
Administrative Officers 41.8 39.3 41.2 7.1 6.5 6.9
Ambulance Officers 36.9 40.4 39.2 7.3 8.0 7.7
Bus Operators 44.9 48.6 48.2 7.1 9.9 9.6
Correctional Officers 40.9 43.5 42.9 6.4 6.9 6.8
Dentists/Dental Officers 39.5 43.5 40.5 8.8 5.5 8.0
Disability Officers 45.8 44.1 45.0 8.6 8.1 8.4
Executive Officers 49.8 50.1 50.0 12.2 11.4 11.8
Fire and Rescue Officers 38.6 43.6 43.5 10.9 16.0 15.9
General Service Officers & Eq. 44.9 45.0 45.0 9.6 9.0 9.2
Health Assistant 37.1 27.0 36.2 5.9 1.3 5.5
Health Professional Officers 39.5 41.5 39.9 6.9 6.9 6.9
Information Technology Officers 38.1 35.2 35.7 6.3 5.7 5.8
Judicial Officers 54.0 62.7 59.8 10.7 14.6 12.9
Legal Officers 35.3 43.9 38.7 5.7 8.9 6.9
Legal Support 30.8 26.0 29.6 2.1 0.7 1.7
Linen Production & Maintenance 51.0 47.2 49.4 12.5 12.3 12.4
Medical Officers 35.8 39.9 38.0 3.2 4.7 4.0
Nursing and Midwifery 42.6 40.1 42.4 8.3 6.2 8.1
Professional Officers 41.3 41.0 41.2 5.9 7.0 6.3
Prosecutors 31.1 39.0 34.2 3.5 5.4 4.2
Rangers 37.1 41.6 40.5 6.4 8.7 8.1
School Leaders 46.1 44.9 45.8 15.6 15.7 15.6
Senior Officers 44.4 46.8 45.6 10.0 10.3 10.2
Statutory Office Holders 58.6 56.1 57.3 6.7 16.2 11.8
Teacher 41.5 41.8 41.6 8.8 8.3 8.7
Technical Officers 43.4 45.2 44.3 8.7 10.4 9.6
Trainees and Apprentices 26.6 21.8 23.2 1.8 1.8 1.8
Transport Officers (incl. trainer/ assessors)
44.8 51.8 51.1 13.1 18.0 17.5
Age and length of service 42.2 43.3 42.6 8.2 8.7 8.4
PAGE 98STATE OF THE SERVICE REPORT 2013
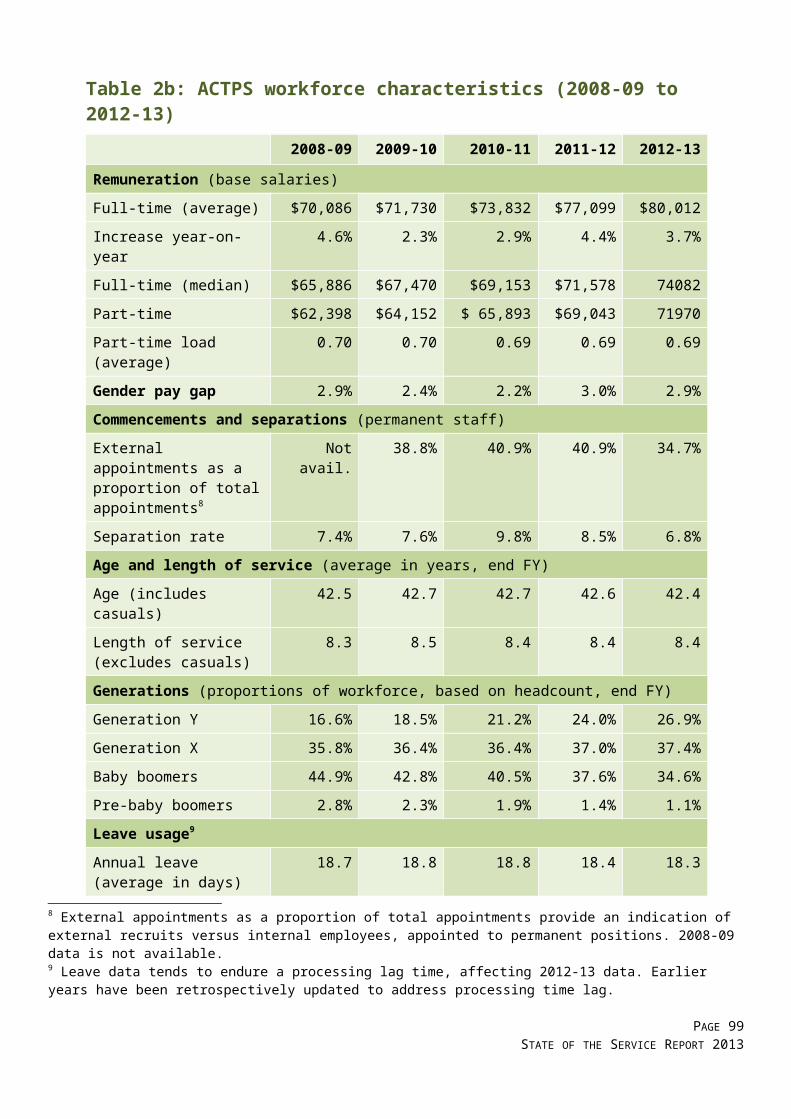
3.6 Leave24
Table 24: Annual leave usage by classification group and gender (2012-13)
Classification group Annual leave usage (average, days per person)
Female Male Aggregate
Administrative Officers 15.7 16.9 16.0
Ambulance Officers 32.6 39.2 36.9
Bus Operators 17.4 17.5 17.5
Correctional Officers 28.1 27.8 27.9
Dentists/Dental Officers 12.3 10.6 11.9
Disability Officers 21.2 18.3 19.8
Executives 21.5 17.2 18.9
Fire and Rescue Officers 29.4 32.6 32.5
General Service Officers and Equivalent 16.9 18.1 17.8
Health Assistants 17.1 32.9 18.0
Health Professional Officers 16.4 16.0 16.3
Information Technology Officers 19.4 16.0 16.5
Judicial Officers 15.4 9.4 12.1
Legal Officers 17.9 21.3 19.2
Legal Support 11.2 6.2 10.3
Linen Production and Maintenance Officers 20.7 18.3 19.7
Medical Officers 14.1 15.8 15.1
Nursing and Midwifery 22.6 23.0 22.6
Professional Officers 17.2 17.3 17.2
Prosecutors 17.1 20.8 18.7
Rangers 14.4 21.8 20.0
School Leaders 19.6 19.4 19.6
Senior Officers 18.6 19.0 18.8
Statutory Office Holders 11.0 24.7 18.1
Teachers 16.4 16.4 16.4
Technical Officers 17.2 17.7 17.4
Trainees and Apprentices 17.9 11.6 13.3
Transport Officers (incl. trainer/assessors) 23.1 18.2 18.7
ACTPS annual leave usage 17.9 19.3 18.3
24 Leave experiences processing lag time which affects 2012-13 data. Leave accrual methods can vary according to occupation and employment mode.
PAGE 99STATE OF THE SERVICE REPORT 2013
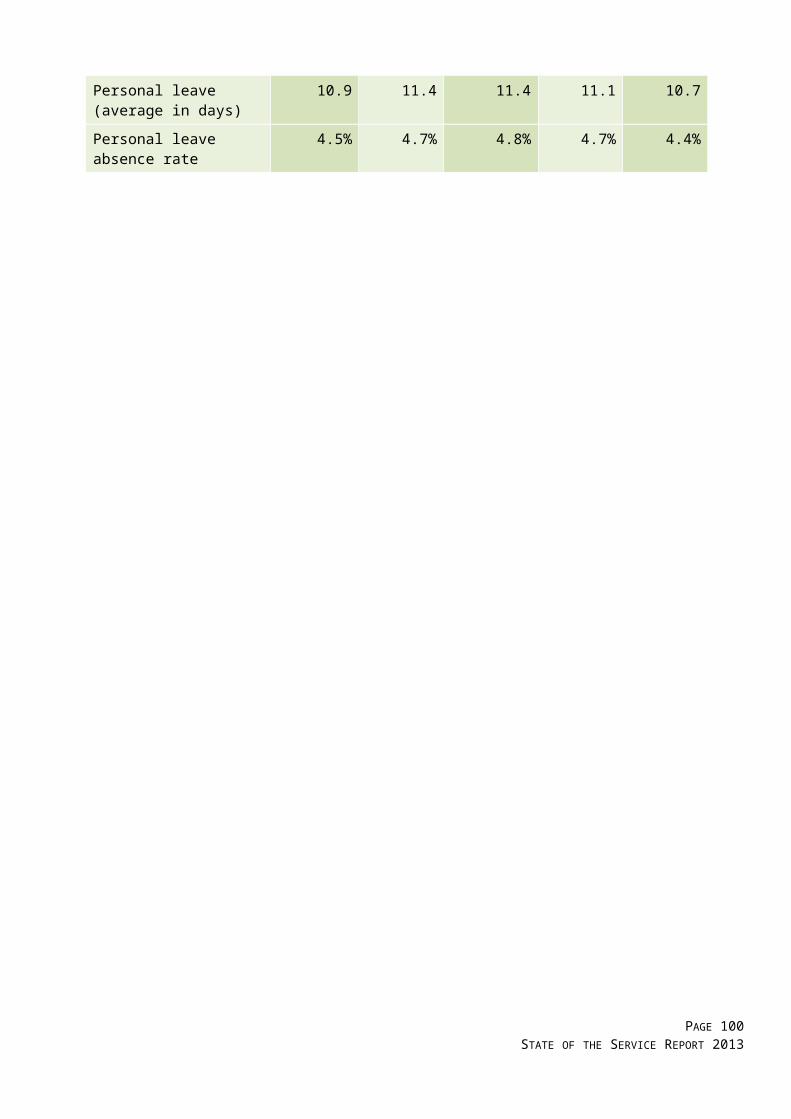
Table 25: Annual leave usage by agency and gender (2012-13)
Directorate Annual leave usage(average, days per person)
Female Male Aggregate
Chief Minister and Treasury 17.8 18.8 18.2
Long Service Leave Authority 24.5 21.7 23.5
Independent Competition and Regulatory Commission
1.2 2.6 1.9
Commerce and Works Directorate 17.9 17.4 17.6
Community Services 18.9 18.6 18.8
Economic Development 20.0 16.8 18.4
Exhibition Park Corporation 15.4 17.7 16.4
Gambling and Racing Commission 17.3 19.0 18.2
Land Development Agency 17.3 18.0 17.6
Education and Training 15.7 16.3 15.8
Environment and Sustainable Development 18.9 18.6 18.7
Health 19.1 17.4 18.7
Justice and Community Safety 19.6 26.4 23.5
Territory and Municipal Services 18.5 19.8 19.3
ACTPS annual leave usage 17.9 19.3 18.3
PAGE 100STATE OF THE SERVICE REPORT 2013
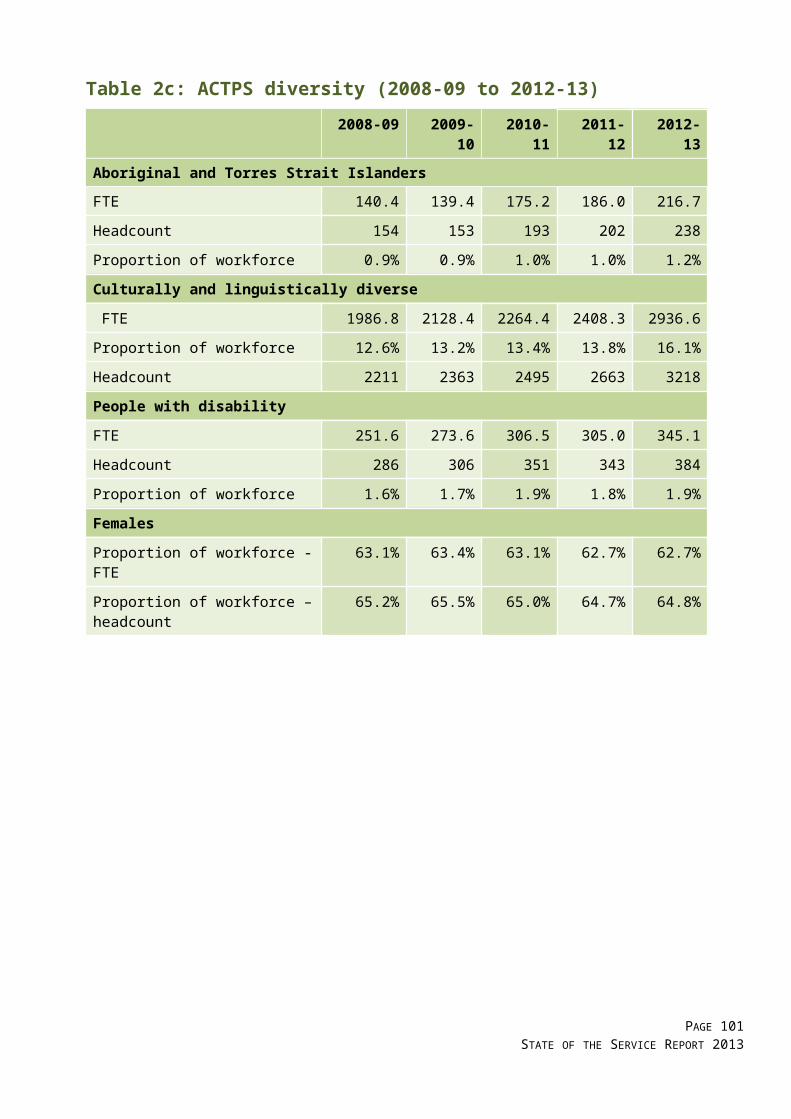
Table 26: Personal leave usage and absence rate by classification group (2012-13)Classification group Personal leave25 usage
(average, days per person)
Female Male Aggregate Absence rate
Administrative Officers 11.6 11.1 11.5 4.8%
Ambulance Officers 12.2 13.5 13.0 5.3%
Bus Operators 19.4 14.2 14.7 5.8%
Correctional Officers 18.7 13.9 15.0 5.8%
Dentists/Dental Officers 7.9 5.3 7.3 3.4%
Disability Officers 14.0 17.3 15.6 6.6%
Executives 7.6 6.6 7.0 2.7%
Fire and Rescue Officers 7.3 12.1 12.0 4.4%
General Service Officers and Equivalent 14.1 12.4 12.7 5.1%
Health Assistants 13.9 20.5 14.3 6.1%
Health Professional Officers 9.6 8.3 9.4 4.1%
Information Technology Officers 10.9 10.0 10.2 3.9%
Judicial Officers 6.9 0.7 3.5 1.4%
Legal Officers 8.5 7.3 8.1 3.3%
Legal Support 11.9 3.7 10.3 4.1%
Linen Production and Maintenance Officers 12.2 12.0 12.1 4.8%
Medical Officers 5.1 3.8 4.4 1.7%
Nursing and Midwifery 12.8 12.6 12.8 5.6%
Professional Officers 9.6 7.6 9.0 3.8%
Prosecutors 12.1 8.9 10.7 4.2%
Rangers 13.5 18.1 17.0 6.9%
School Leaders 10.7 9.3 10.3 4.0%
Senior Officers 11.4 9.2 10.3 4.0%
Statutory Office Holders 5.1 4.1 4.6 1.9%
Teachers 9.0 8.3 8.8 3.7%
Technical Officers 13.6 10.2 11.8 4.9%
Trainees and Apprentices 14.1 10.0 11.1 4.3%
Transport Officers (incl. trainer/assessors) 6.2 11.2 10.8 4.1%
Personal leave usage and absence rate 11.0 10.1 10.7 4.4%
25 Personal leave can be taken in instances of personal illness or injury, for bereavement, or when caring for a dependent due to illness or injury. The absence rate is calculated by dividing the total number of hours absent by the total number of available work hours.
PAGE 101STATE OF THE SERVICE REPORT 2013
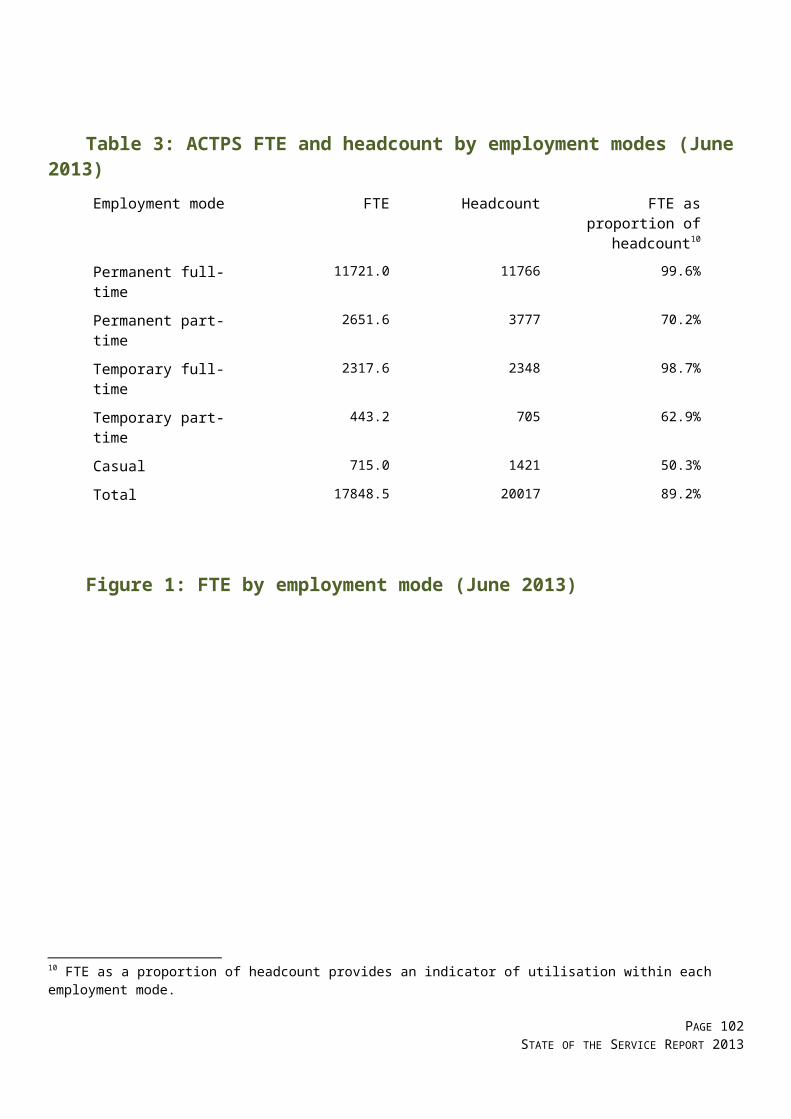
Table 27: Personal leave usage and absence rate by agency (2012-13)
Directorate Personal leave usage(average, days per person)
Female Male Aggregate Absence rate
Chief Minister and Treasury 12.3 7.9 10.5 4.2%
Long Service Leave Authority 9.3 28.7 16.4 6.3%
Independent Competition and Regulatory Commission
3.7 0.4 2.1 4.7%
Commerce and Works Directorate 12.7 9.8 11.1 4.3%
Community Services 12.9 13.1 12.9 5.3%
Economic Development 9.4 6.9 8.2 3.2%
Exhibition Park Corporation 9.6 3.5 6.8 2.7%
Gambling and Racing Commission 13.6 14.1 13.9 5.6%
Land Development Agency 12.0 7.5 9.7 3.1%
Education and Training 8.8 8.7 8.8 3.8%
Environment and Sustainable Development
12.0 11.8 12.0 4.9%
Health 11.7 9.1 11.1 4.7%
Justice and Community Safety 12.0 11.5 11.7 4.5%
Territory and Municipal Services 13.6 11.1 12.0 4.8%
Average Personal Leave Usage 11.0 10.1 10.7 4.4%
PAGE 102STATE OF THE SERVICE REPORT 2013

3.7 Diversity26
Table 28: Diversity in the ACTPS (June 2013)
ACTPS Females Culturally and linguistically
diverse
People with
disability
Aboriginal and Torres Strait
Islanders
FTE 17848.5 11198.3 2936.6 345.1 216.7
Headcount 20017 12979 3218 384 238
Employment status (headcount)
Permanent Full-time 11766 6785 1767 231 157
Permanent Part-time 3777 3225 534 81 27
Temporary Full-time 2348 1371 605 39 37
Temporary Part-time 705 582 88 14 9
Casual 1421 1016 224 19 8
Generation
Pre-Baby Boomers 221 117 30 8 1
Baby Boomers 6922 4393 990 145 53
Generation X 7489 4758 1388 136 72
Generation Y 5385 3711 810 95 112
Length of service
Less than 5 years 9336 5998 1848 195 165
5 to 9 years 4998 3353 705 83 45
10 to 19 years 3457 2337 426 51 21
20 years or more 2226 1291 239 55 7
26 The ACTPS continues to encourage voluntary disclosure by employees. Diversity percentages are based on total ACTPS headcount which assumes that all respondents do not identify as one or more of the diversity groups, which is likely to result in under-reporting of the actual proportion of diversity groups in the ACTPS. Diversity statistics are also provided in Annual Reports and monitored through the ACTPS Respect, Equity and Diversity Framework. Workforce data in this section has been presented in a way that protects the identity of individual employees.
PAGE 103STATE OF THE SERVICE REPORT 2013

Table 28: Diversity in the ACTPS (June 2013) (cont’d)
ACTPS Females Culturally and linguistically
diverse
People with
disability
Aboriginal and Torres Strait
Islanders
Separation rate 6.8% 5.5% 3.7% 6.3% 10.8%
Annual leave (average days per person during 2011-12)
18.3 17.9 0.7 0.7 0.7
Personal leave usage(average, days)
10.7 11.0 0.4 0.6 0.6
Personal leave absence rate(average)
4.4% 4.7% 4.0% 6.1% 5.4%
Salary
Average27 $78,053 $77,235 $75,867 $74,554 $70,137
Median $74,082 $74,082 $71,031 $71,031 $65,221
27 Salary averages here are inclusive of part-time and casual employees.
PAGE 104STATE OF THE SERVICE REPORT 2013

Table 29: Diversity by classification group (June 2013)
Classification group Females Culturally and linguistically
diverse
People with disability
Aboriginal and Torres Strait
Islanders
Administrative Officers 75.7% 14.2% 2.5% 2.1%
Ambulance Officers 35.6% 2.3% 0.5% 0.9%
Bus Operators 10.2% 39.2% 0.3% 1.0%
Correctional Officers 21.4% 9.2% 1.7% 0.0%
Dentists/Dental Officers 76.5% 52.9% 0.0% 5.9%
Disability Officers 51.2% 18.4% 3.2% 0.0%
Executive Officers 43.1% 6.6% 2.0% 0.0%
Fire and Rescue Officers 2.0% 1.4% 0.3% 0.6%
General Service Officers & Equivalent 22.2% 19.0% 3.7% 1.2%
Health Assistants 90.6% 18.8% 3.1% 1.6%
Health Professional Officers 79.1% 15.8% 1.9% 1.4%
Information Technology Officers 15.7% 19.9% 1.8% 1.2%
Judicial Officers 33.3% 0.0% 0.0% 0.0%
Legal Officers 61.1% 12.6% 2.1% 0.0%
Legal Support 75.0% 31.3% 0.0% 0.0%
Linen Production & Maintenance 58.3% 3.3% 1.7% 0.0%
Medical Officers 47.1% 31.4% 1.4% 0.4%
Nursing and Midwifery 89.8% 23.7% 1.7% 0.6%
Professional Officers 68.9% 17.4% 3.0% 0.8%
Prosecutors 60.5% 7.9% 0.0% 5.3%
Rangers 23.7% 5.3% 2.6% 5.3%
School Leaders 72.2% 7.2% 1.9% 0.8%
Senior Officers 51.6% 13.6% 2.2% 1.1%
Statutory Office Holders 42.9% 0.0% 0.0% 0.0%
Teachers 77.6% 10.0% 1.0% 0.8%
Technical Officers 51.4% 21.0% 1.6% 0.0%
Trainees and Apprentices 27.5% 2.5% 12.5% 22.5%
Transport Officers (incl. trainer/assessors)
9.8% 39.0% 0.0% 0.0%
ACTPS diversity 64.8% 16.1% 1.9% 1.2%
PAGE 105STATE OF THE SERVICE REPORT 2013

Table 30: Diversity by agency (June 2013)
Directorate Females Culturally and linguistically
diverse
People with
disability
Aboriginal and Torres Strait
Islanders
Chief Minister and Treasury 58.9% 14.0% 4.1% 0.7%
Long Service Leave Authority 58.3% 33.3% 0.0% 0.0%
Independent Competition and Regulatory Commission
37.5% 12.5% 12.5% 0.0%
Commerce and Works Directorate 47.1% 20.4% 2.8% 1.1%
Community Services 67.1% 15.0% 2.8% 3.0%
Economic Development 51.6% 6.5% 2.3% 1.4%
Exhibition Park Corporation 46.7% 0.0% 0.0% 0.0%
Gambling and Racing Commission 44.8% 3.4% 0.0% 3.4%
Land Development Agency 46.8% 10.6% 3.2% 2.1%
Education and Training 77.9% 10.1% 1.2% 1.0%
Environment and Sustainable Development
54.6% 16.1% 2.9% 1.5%
Health 75.9% 22.1% 1.9% 1.0%
Justice and Community Safety 42.3% 8.9% 1.7% 1.3%
Territory and Municipal Services 26.0% 21.1% 2.5% 1.2%
ACTPS Total 64.8% 16.1% 1.9% 1.2%
PAGE 106STATE OF THE SERVICE REPORT 2013
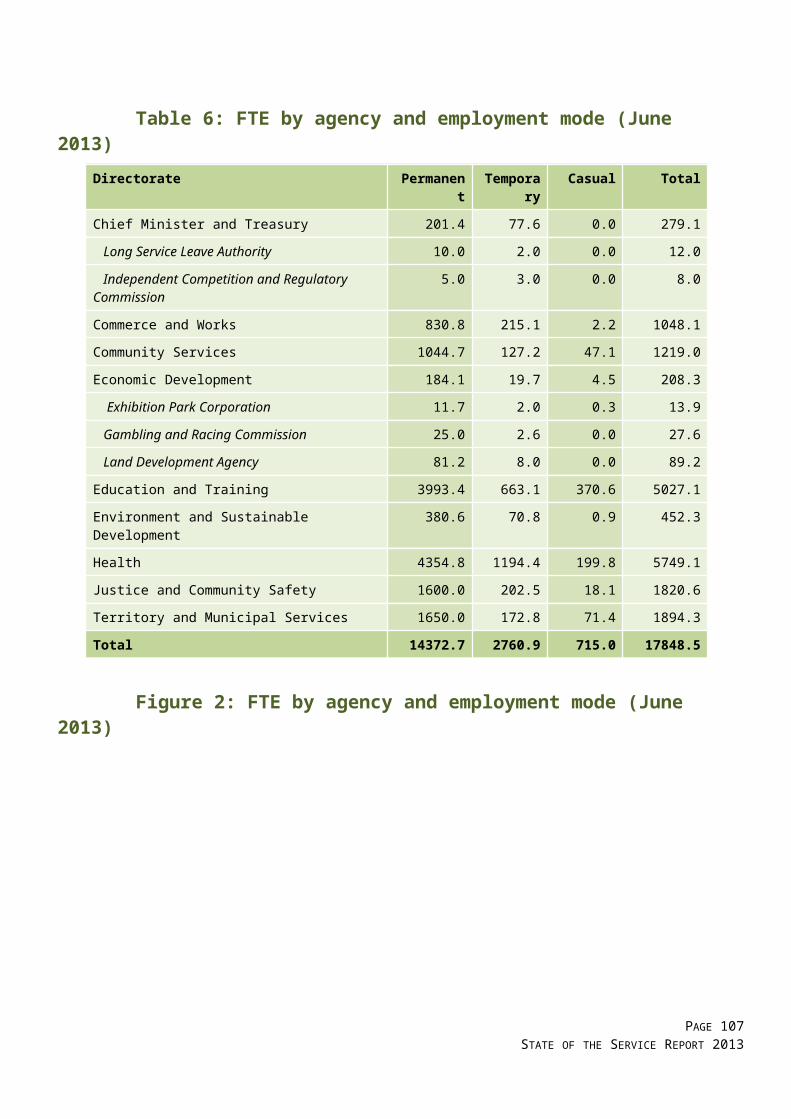
Table 31: Cultural Facilities Corporation (June 2013) 28
Agency Cultural Facilities Corporation
FTE 81.9
FTE – permanent 36.9
FTE – temporary 17.8
FTE – casual 27.2
Headcount 131
Headcount – permanent 41
Headcount – temporary 21
Headcount - casual 69
Age (average) 40.6
Length of service (average, years) 5.0
Separation rate 12.2%
Diversity (FTE, headcount):
Aboriginal and Torres Strait Islanders People with disability
0.33,12.0, 2
Culturally & linguistically diverse 5.3, 6
Female 44.0, 78
28 Cultural Facilities Corporation (CFC) has common reporting lines to Community Services Directorate (CSD). CFC reports to the Minister, CFC Board and/or CSD Director-General, as required.
PAGE 107STATE OF THE SERVICE REPORT 2013

3.8 Summary of ACT public sector Agencies external to the ACT Public ServiceTable 32: Summary of ACT public sector agencies external to the ACT Public Service (June 2013)
Agency Auditor-General’s
Office
Calvary Healthcare
(Public)
Canberra Institute of Technology
Office of the Legislative Assembly
FTE 39.3 1013.5 766.9 43.2
FTE - permanent 32.3 789.8 489.8 36.3
FTE - temporary 7.0 158.1 139.4 4.0
FTE - casual - 65.6 137.8 2.9
Headcount - Total 41 1423 994 65
Headcount - permanent 34 898 520 43
Headcount – Temporary 7 215 160 9
Headcount – Casual - 310 314 13
Age (average) 37.9 41.5 46.8 50.0
Length of service (average, years) 5.9 5.5 9.4 6.0
Separation rate 9.4% 11.0% 7.9% 16.3%
Diversity
by FTE and Headcount (HC)NA = Not Available
FTE HC FTE HC FTE HC FTE HC
Aboriginal and Torres Strait Islanders Nil NA 14.1 19 Nil
People with disability 1.0 1 NA 13.4 21 Nil
Culturally & linguistically diverse 15.9 16 NA 123.4 159 Nil
Female 16.4 18 979.5 1133 452.3 609 NA 40
Table 33: Divisions of ACT public sector agencies external to the ACT Public Service (June 2013)
Agency Division FTE Headcount
PAGE 108STATE OF THE SERVICE REPORT 2013
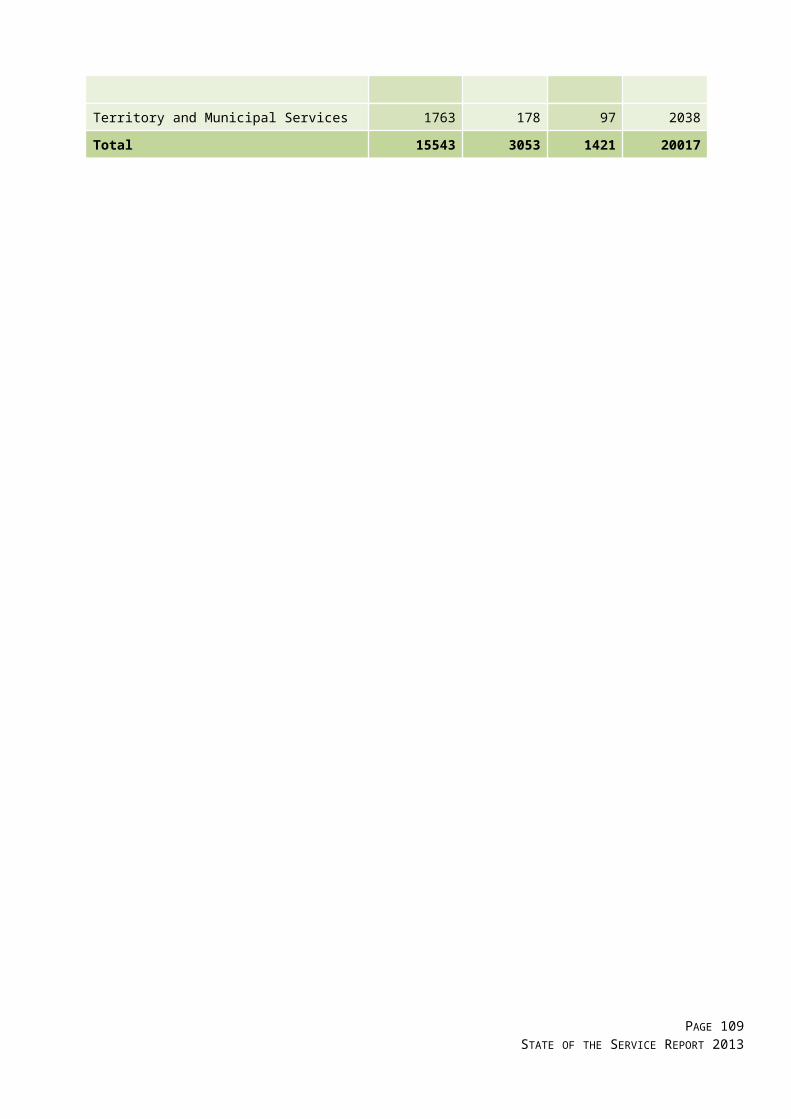
Calvary Health Care (Public) Allied Health 109.5 165
Administration, Finance and Executives 48.6 63
Medical Officers 64.8 86
Nursing 614.6 843
Support Staff 175.9 266
Total 1013.5 1423
Agency Division FTE Headcount
Canberra Institute of Technology
Administrative Officers, Professional Officers and Executives
266.1 295
General Service Officers and Technical Officers
49.5 59
VET Teachers and Teacher Managers 451.3 640
Total 766.9 994
PAGE 109STATE OF THE SERVICE REPORT 2013

3.9 Statutory Officer HoldersDuring 2012-13, there were 16 paid full-time Statutory Office Holders in the ACT, employed under the appointment provisions of the relevant legislation and whose salaries are determined by the ACT Remuneration Tribunal:
Auditor-General; General President, ACT Civil and Administrative Tribunal; Appeals President, ACT Civil and Administrative Tribunal; Director of Public Prosecutions; Electoral Commissioner; Chief Planning Executive, ACT Planning and Land Authority; Chief Executive Officer, Land Development Agency; Commissioner for the Environment; Clerk, Legislative Assembly; Chief Executive Officer, Legal Aid Commission (ACT); Assistant Executive Officer, Legal Aid Commission (ACT); Human Rights Commissioner; Children and Young People Commissioner; Disability and Community Services Commissioner; Discrimination Commissioner; Health Services Commissioner; Public Advocate; Victims of Crime Commissioner.
PAGE 110STATE OF THE SERVICE REPORT 2013

Appendix 1 - Abbreviations Used in This ReportABS
ACT
Australian Bureau of Statistics
Australian Capital Territory
ACTPS Australian Capital Territory Public Service
ACTION ACTION Buses
ASO Administrative Services Officer
CFC Cultural Facilities Corporation
CIT Canberra Institute of Technology
CMCD Chief Minister and Treasury Directorate
CSD Community Services Directorate
ESDD Environment and Sustainable Development Directorate
FTE Full-time Equivalent
HD
HR
Health Directorate
Human Resources
JACSD Justice and Community Safety Directorate
TAMSD Territory and Municipal Services Directorate
TD Treasury Directorate
VET Vocational Education & Training
PAGE 111STATE OF THE SERVICE REPORT 2013
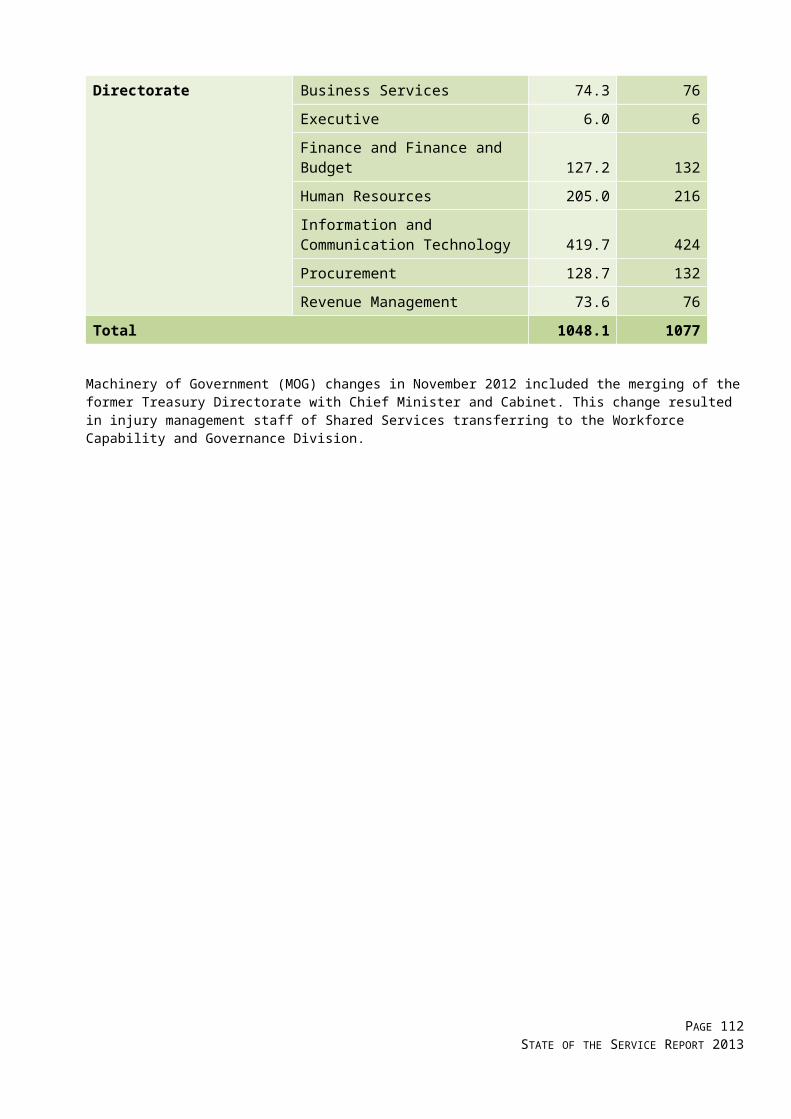
Current Administration Arrangements:HD Health Directorate
CMTD Chief Minister and Treasury Directorate
ETD Education and Training Directorate
CSD Community Services Directorate
CWD Commerce and Works Directorate
EDD Economic Development Directorate
ESDD Environment and Sustainable Development Directorate
JCSD Justice and Community Safety Directorate
TMSD Territory and Municipal Services Directorate
Other:AA Administration Arrangement
ACTPS ACT Public Service
CIT Canberra Institute of Technology
Commissioner Commissioner for Public Administration
SERBIR Senior Executive Responsible for Business Integrity and Risk
Legislation:FOI Act Freedom of Information Act 1989
FM Act Financial Management Act 1996
FW Act Fair Work Act 2009 (Cwlth)
HR Act Human Rights Act 2004
PID Act Public Interest Disclosure Act 2012
PSM Act Public Sector Management Act 1994
SRC Act Safety, Rehabilitation and Compensation Act 1988 (Cwlth)
Standards Public Sector Management Standards 2006
WR Act Workplace Relations Act 1996 (Cwlth)
PAGE 112STATE OF THE SERVICE REPORT 2013

Appendix 2 - DefinitionsACT Public Service (ACTPS)The ACTPS comprises nine Directorates (refer to Table 1 for details) that report to the Head of Service as constituted by the Administrative Arrangements 2011 (No 3).
ACT public sector The ACT public sector encompasses the employees of the nine Directorates that report to the Head of Service, as well as staff employed under the Public Sector Management (PSM) Act 1994 in other ACT Government agencies.
AppointmentsAppointments refer to the recruitment of people as permanent officers. Recruits can be people external to the organisation, or people already working internal to the organisation as temporary or casual employees.
EmployeesEmployees include permanent officers, temporary and casual employees.
Employees – casualCasual employees are those engaged on an ad hoc hourly or daily basis with no ongoing tenure of employment. This category of employment can also be referred to as non-ongoing and usually consists of an employment arrangement which is not considered systematic, continuous or permanent.
Employees – full-timeFull-time employees can be either permanent or temporary who work full-time hours in accordance with their provisions.
Employees – part-timeEmployees either permanent or temporary, who work less than full-time hours.
General Service Officers (GSOs)Examples include tradespeople, gardeners, drivers and labourers.
Generations
Generation Definition
Pre-Baby Boomers Born prior to 1946
Baby Boomers Born 1946 to 1964 inclusive
Generation X Born 1965 to 1979 inclusive
Generation Y Born from 1980 and onwards
PAGE 113STATE OF THE SERVICE REPORT 2013

Gender pay gapGender pay gap is equal to one minus female weekly ordinary time earnings, divide by male weekly ordinary time earnings, multiplied by 100. Annual salary represents the salary increment point, pro-rated for part-time employees, and does not include allowances or other pay components.
The methodology used to determine employee salary averages and the associated gender pay gap in this year’s report has been revised to remove causes of some minor statistical anomalies. The result of this change may cause some variation from previously published figures. The data in this report excludes remuneration of executives unless noted differently.
Headcount and FTEThis report is based on paid employees. Paid headcount for all employees includes employees on paid leave or with back pay, as at the end of the financial year. Headcount and FTE are standard measures of staff numbers. Headcount considers each employee as one regardless of whether they are full-time or part-time. In contrast, FTE represents total employee numbers based on equivalent full-time hours worked. For example, an employee working standard full-time hours attracts an FTE of 1.0 whereas an employee working half the standard full-time hours attracts an FTE of 0.5. The total FTE in this example would be 1.5 whereas the headcount would be two. Average FTE and average headcount are based on the 26 pay periods in each financial year. The average over time removes seasonality that can be experienced at a point in time, particularly with temporary and casual employees, and for this reason it is used to calculate year-on-year percentage increases.
LeaveStaff can access annual leave and personal leave entitlements. Annual leave is often referred to as recreational leave. Personal leave can be taken in instances of personal illness or injury, for bereavement, or when caring for a dependent due to illness or injury. Leave can experience a time-lag in processing.
Entitlements can be found in the relevant section of enterprise and collective agreements, see the website for details: http://www.sharedservices.act.gov.au/docs/agreements/
MedianThe median of a set of data values is the middle value of the data set when it has been arranged in ascending order. It is the point at which 50 percent of the data set has a greater value and 50 percent of the data has a smaller value.
Officer - permanentPermanent officers can be full-time or part-time, who have been appointed to an office or as an unattached officer under the Public Sector Management Act 1994.
Payroll system administrators - discrete sources of workforce data
ACTPS Shared Services (CHRIS21), Calvary Public Hospital, Cultural Facilities Corporation, Exhibition Park Corporation and the Office of the Legislative Assembly.
Separation rateThe separation rate is determined by dividing the total number of permanent separations by the average permanent headcount, over the financial year, for the ACTPS, and excludes transfers between Directorates. Previous years have been based on average headcount of all staff, including casuals and
PAGE 114STATE OF THE SERVICE REPORT 2013
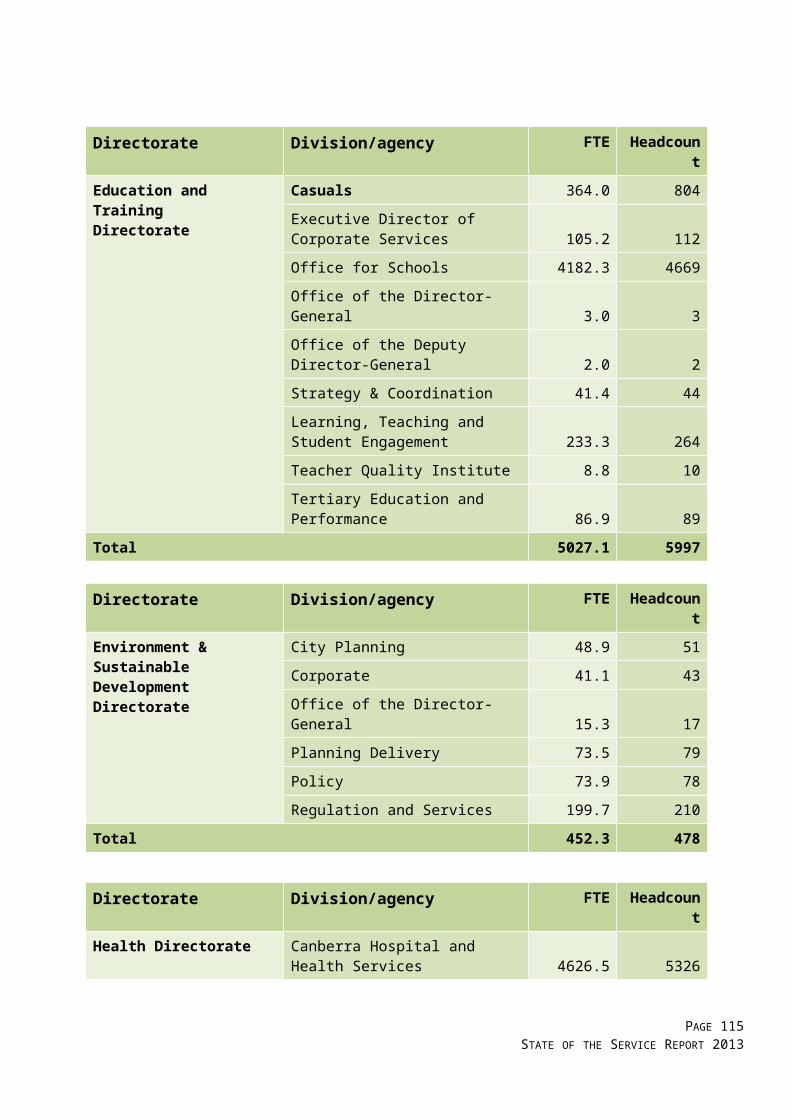
temporary employees, which deflates the result. The new calculation is consistent with other jurisdictions including the Australian Public Service.
Territory-owned Corporations (TOCS)Government enterprises (known as Territory-owned Corporations) under the Territory-owned Corporations Act 1990 (TOCS), are separate entities to the ACTPS and other ACT public sector agencies and are not included in this report. As at June 2012, TOCS are ACTEW Corporation Limited and ACTTAB Limited.
Workforce averageNote that the calculation of a workforce average is based on the total available data for ACTPS Directorates only. The ACTPS average is a weighted mean of groups that have varying numbers of employees and it is not a simple average of the figures for groups shown.
PAGE 115STATE OF THE SERVICE REPORT 2013