Embed Size (px)
Citation preview

Chapter 16 Adaptations and Competition
Name: ________________________
Class: ________________________
Date: ________________________
Time: 161 minutes
Marks: 161 marks
Comments:

Q1.Some students investigated the distribution of dandelion plants in a grassy field. The grassy field was between two areas of woodland.
Figure 1 shows two students recording how many dandelion plants there are in a 1 metre x 1 metre quadrat.
Figure 1
© Science Photo Library
Figure 2 shows a section across the area studied and Figure 3 shows a bar chart of the students’ results.
Figure 2
Distance in m
Figure 3
Distance in m
(a) How did the students use the quadrat and the 30-metre tape measure to get the results in Figure 3?
Use information from Figure 1.

___________________________________________________________________
___________________________________________________________________
___________________________________________________________________
___________________________________________________________________
___________________________________________________________________
___________________________________________________________________(3)
(b) (i) Suggest one reason why the students found no dandelion plants under the trees.
______________________________________________________________
______________________________________________________________(1)
(ii) Suggest one reason why the students found no dandelion plants at 16 metres.
______________________________________________________________
______________________________________________________________(1)
(c) The teacher suggested that it was not possible to make a valid conclusion from these results.
Describe how the students could improve the investigation so that they could make a valid conclusion.
___________________________________________________________________
___________________________________________________________________
___________________________________________________________________
___________________________________________________________________(2)
(Total 7 marks)
Q2.Animals and plants are adapted in different ways in order to survive.
(a) Plants may have to compete with other plants.
(i) Name two things for which plants compete.
1. ____________________________________________________________
2. ____________________________________________________________(2)
(ii) The drawing shows a creosote bush.

This bush lives in a desert.
The creosote bush produces a poison that kills the roots of other plants.
How does this poison help the creosote bush to survive in the desert?
______________________________________________________________
______________________________________________________________(1)
(b) The photograph shows an insect called a katydid.
By Ltshears (Own work) [Public domain], via Wikimedia Commons
The katydid is preyed on by birds.
How does the appearance of the katydid help it to survive?
___________________________________________________________________
___________________________________________________________________

___________________________________________________________________
___________________________________________________________________(1)
(Total 4 marks)
Q3.The photograph shows an aardvark.
By Beige Alert [CC BY 2.0], via Flickr
• Aardvarks feed on insects that they dig from the soil.
• Aardvarks hunt for these insects at night.
How does each of these adaptations help the aardvark?
(a) It has powerful claws.
___________________________________________________________________
___________________________________________________________________(1)
(b) It has a long, sticky tongue.
___________________________________________________________________
___________________________________________________________________(1)
(c) It has very large ears.
___________________________________________________________________

___________________________________________________________________(1)
(d) It can cover the end of its nose with flaps of skin.
___________________________________________________________________
___________________________________________________________________(1)
(Total 4 marks)
Q4.Many organisms are adapted to avoid being eaten.
(a) The photograph shows a gecko on a leafy branch.
© Thomas Marent/ardea.com
The gecko is adapted to avoid being eaten by predators.
Explain how.
___________________________________________________________________
___________________________________________________________________
___________________________________________________________________
___________________________________________________________________(2)
(b) Ants can give a painful bite.
The photograph shows a type of ant living on acacia trees.
Acacia trees have thorns on their branches.
Branch of acacia tree.

By Ryan Somma, cropped by Fama Clamosa,
20 January 2010 (UTC) [CC-BY-SA-2.0], via Wikimedia Commons
(i) Predators are less likely to eat ants living on acacia trees than ants living on the ground.
Suggest why.
______________________________________________________________
______________________________________________________________(1)
(ii) Giraffes eat the leaves of acacia trees.
Giraffes do not eat the leaves of acacia trees that have ants living on them.
Suggest why.
______________________________________________________________
______________________________________________________________(1)
(c) The photographs show a wasp and a hoverfly.
The wasp and the hoverfly both have black and yellow stripes.
Wasp Hoverfly
© Alexandr Pakhnyushchyy/iStock © Richard Majlinder/iStock
Wasps have stings, but hoverflies do not.

The stripes on the hoverfly help the hoverfly to avoid being eaten by predators.
Explain why.
___________________________________________________________________
___________________________________________________________________
___________________________________________________________________
___________________________________________________________________(2)
(Total 6 marks)
Q5.The photograph shows some features of a waterbuck.
Waterbuck live in areas of tall, brown grass.
By Nevit Dilmen (Own work) [CC-BY-SA-3.0], via Wikimedia Commons
Choose labels from the photograph to answer these questions.You should choose a label once only.
(a) Which feature helps to camouflage the waterbuck in the grass?
___________________________________________________________________(1)
(b) Which feature helps the waterbuck to detect predators?
___________________________________________________________________(1)
(c) Which feature helps the waterbuck to fight predators?

___________________________________________________________________(1)
(d) Which feature helps a baby waterbuck to follow a parent through the long grass?
___________________________________________________________________(1)
(Total 4 marks)
Q6.The drawing shows a jerboa. Jerboas live in sandy deserts.
Jerboas sleep in underground holes during the hot day and come out during the cold night.
The jerboa’s main food is small insects which run across the surface of the sand.
For each question write the correct letter in the box.
Which structure, A, B, C, D, E or F:
(a) helps to insulate the jerboa
(1)
(b) helps the jerboa to detect insects on a dark night
(1)
(c) helps the jerboa to hop quickly to catch an insect
(1)
(d) helps the jerboa to keep its balance when hopping
(1)
(e) helps the jerboa to know the width of its underground hole in the dark?
(1)(Total 5 marks)

Q7.The picture shows a basilisk lizard. Some of the adaptations of the lizard are labelled.
Basilisk lizards are often found resting on branches of trees that grow next to water.Basilisk lizards can run across the surface of the water.
(a) Draw one line from each adaptation of the lizard to the advantage of the adaptation.
Adaptation Advantage
For camouflage on branches of trees
Toes on the back feet are webbed
Helps the lizard to balance when running
Long tail
Warning colours to deter predators
Brown skin
Increases surfacearea in contact with
the water(3)
(b) Suggest one advantage to the basilisk lizard of being able to run across the surface of the water.
___________________________________________________________________
___________________________________________________________________(1)
(c) Animals, such as lizards, compete with each other.
Give two factors that animals compete for.
Tick ( ) two boxes.

Oxygen
Food
Territory
Light
(2)(Total 6 marks)
Q8.(a) Which term describes organisms that can tolerate very hot or very cold places?
Draw a ring around the correct answer.
an environmentalspecies
an extremophilespecies
an indicatorspecies
(1)
(b) Figure 1 shows photographs of an Adelie penguin and a chinstrap penguin. Adelie penguins and chinstrap penguins live in the Antarctic at temperatures below 0 °C.
Adelie penguins spend most of their time on the ice around the Antarctic.Chinstrap penguins live mainly in the sea around the ice.Since 1965 the number of Adelie penguins has decreased by 6 million.
Figure 2 shows changes to the ice around the Antarctic over the past 50 years.

(i) Use information from Figure 2 to explain why the number of Adelie penguins has decreased since 1965.
______________________________________________________________
______________________________________________________________
______________________________________________________________
______________________________________________________________
______________________________________________________________
______________________________________________________________(2)
(ii) Suggest what has happened to the number of chinstrap penguins since 1965.
Draw a ring around your answer. increase / decrease
Give a reason for your answer.
______________________________________________________________
______________________________________________________________(1)
(c) The number of penguins can be used to monitor changes in temperature of the environment.
Temperature readings could also be taken using a thermometer.
What is the advantage of using penguins, instead of a thermometer, to monitor changes in temperature of the environment?
Tick ( ) one box.
Living organisms show long-term changes.
Thermometers cannot measure temperatures below 0 °C.

Thermometers do not give accurate readings.
(1)(Total 5 marks)
Q9.Plants are adapted for survival in many different ways.
Use information from the drawings to answer each question.
(a) This plant lives in ponds. The leaves of the plant float on the surface of the water.
The leaf of this plant is adapted for floating on water.
Suggest how.
___________________________________________________________________
___________________________________________________________________(1)
(b) This plant lives in areas where a lot of snow falls.
The triangular shape helps the tree to survive in snowy conditions.
Suggest how.
___________________________________________________________________
___________________________________________________________________(1)
(c) This plant has sharp thorns on the stem.

Thorns help this plant survive.
Suggest how.
___________________________________________________________________
___________________________________________________________________(1)
(d) This plant lives in very dry areas.
The swollen leaves help this plant to survive in very dry places.
Suggest how.
___________________________________________________________________
___________________________________________________________________(1)
(Total 4 marks)
Q10.The drawing shows a bean caper plant.
The bean caper plant lives in hot desert conditions.

Explain two ways in which the bean caper is adapted for life in a hot desert.
Adaptation 1 ____________________________________________________________
_______________________________________________________________________
How this adaptation helps the bean caper to survive
_______________________________________________________________________
_______________________________________________________________________
Adaptation 2 ____________________________________________________________
_______________________________________________________________________
How this adaptation helps the bean caper to survive
_______________________________________________________________________
_______________________________________________________________________(Total 4 marks)
Q11.Organisms have adaptations that enable them to survive in extreme conditions.
(a) The photograph shows an arctic fox.
This fox lives in the arctic, where it is very cold.
Suggest two ways in which the arctic fox is adapted for life in very cold conditions.Explain how each adaptation helps the arctic fox to survive in very cold conditions.
Adaptation 1 ________________________________________________________
___________________________________________________________________
How this adaptation helps the arctic fox to survive in very cold conditions.
___________________________________________________________________

___________________________________________________________________
___________________________________________________________________
Adaptation 2 ________________________________________________________
___________________________________________________________________
How this adaptation helps the arctic fox to survive in very cold conditions.
___________________________________________________________________
___________________________________________________________________
___________________________________________________________________(4)
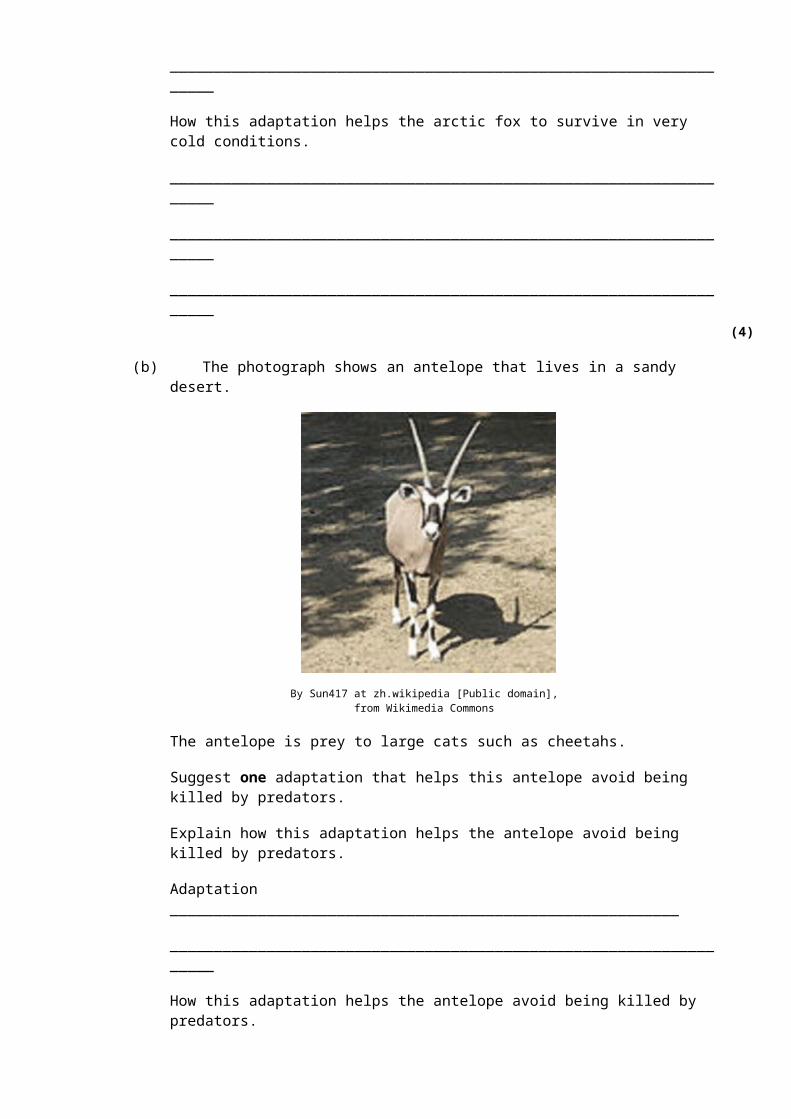
(b) The photograph shows an antelope that lives in a sandy desert.
The antelope is prey to large cats such as cheetah.
Suggest two adaptations that help this antelope to avoid being killed by predators.Explain how each adaptation helps the antelope to avoid being killed by predators.
Adaptation 1 ________________________________________________________
___________________________________________________________________
How this adaptation helps the antelope to avoid being killed by predators.
___________________________________________________________________
___________________________________________________________________
___________________________________________________________________
Adaptation 2 ________________________________________________________
___________________________________________________________________
How this adaptation helps the antelope to avoid being killed by predators.
___________________________________________________________________

___________________________________________________________________
___________________________________________________________________(4)
(Total 8 marks)
Q12.Seals are adapted for life in the sea.Use information from the drawings to answer the questions.
This drawing shows seal X.
(a) Give two ways in which seal X is adapted for swimming.
1. _________________________________________________________________
___________________________________________________________________
2. _________________________________________________________________
___________________________________________________________________(2)
(b) This drawing shows seal Y, drawn to the same scale as seal X.
Seal Y lives in much colder seas than seal X.

Explain one way in which seal Y is adapted for surviving in cold seas.
___________________________________________________________________
___________________________________________________________________
___________________________________________________________________
___________________________________________________________________(2)
(Total 4 marks)
Q13.In this question you will be assessed on using good English, organising information clearly and using specialist terms where appropriate.
Animals and plants have features (adaptations) that allow them to survive in the conditions in which they normally live.
Describe how animals and plants are adapted to survive in dry conditions such as deserts.
For each adaptation that you give, describe how the adaptation helps the animal or plant to survive in dry conditions.
To obtain full marks you should refer to both animals and plants.
_______________________________________________________________________
_______________________________________________________________________
_______________________________________________________________________
_______________________________________________________________________
_______________________________________________________________________
_______________________________________________________________________
_______________________________________________________________________
_______________________________________________________________________
_______________________________________________________________________
_______________________________________________________________________
_______________________________________________________________________
_______________________________________________________________________
Extra space _____________________________________________________________
_______________________________________________________________________
_______________________________________________________________________
_______________________________________________________________________
_______________________________________________________________________

_______________________________________________________________________
_______________________________________________________________________(Total 6 marks)
Q14.Organisms compete with each other.
(a) Figure 1 shows two types of seaweed which live in similar seashore habitats.
Most of the time the two seaweeds are covered with water.
Bladder wrack has bladders filled with air.
Bladder wrack grows more quickly than saw wrack.Suggest an explanation why.
___________________________________________________________________
___________________________________________________________________
___________________________________________________________________
___________________________________________________________________
___________________________________________________________________
___________________________________________________________________
___________________________________________________________________(3)
(b) Figure 2 shows an angler fish.

© Dante Fenolio/Science Photo Library
Angler fish live at depths of over 1000 m.
In clear water, sunlight does not usually reach more than 100 m deep.Many angler fish have a transparent ‘lure’ containing a high concentration of bioluminescent bacteria.Bioluminescent bacteria produce light.
Suggest an advantage to the angler fish of having a lure containing bioluminescent bacteria.
___________________________________________________________________
___________________________________________________________________
___________________________________________________________________
___________________________________________________________________
___________________________________________________________________(2)
(Total 5 marks)
Q15.Fruits contain seeds. Most plants produce fruits that are adapted for dispersing seeds.Seeds are dispersed so that young plants do not grow near their parents.
(a) Explain the advantage to plants of dispersing their seeds.
___________________________________________________________________
___________________________________________________________________
___________________________________________________________________
___________________________________________________________________(2)
(b) The photograph shows cocklebur fruits.

Photograph by Robert H. Mohlenbrock. Image in the public domain as a work of the U.S. federal government. Courtesy of USDA NRCS Wetland Science Institute.
The photograph is magnified.
Suggest how cocklebur fruits are adapted for dispersing their seeds.
___________________________________________________________________
___________________________________________________________________
___________________________________________________________________
___________________________________________________________________(2)
(Total 4 marks)
Q16.Students investigated the distribution of a green alga on a tree trunk.

The students:
• tied a piece of string horizontally round a tree
• put a quadrat on the string so that the quadrat faced south
• estimated the percentage of the area in the quadrat covered with the green alga
• repeated the observation with the quadrat facing south west, west, north west, north, north east, east and south east.
(a) The diagram shows the quadrat the students used.
Describe how you would estimate the percentage of the area covered with the green alga in one quadrat.
___________________________________________________________________
___________________________________________________________________
___________________________________________________________________
___________________________________________________________________(2)
(b) The bar chart shows the students’ results.

Direction the quadrat faced
(i) How does the direction that the quadrat faced affect the percentage area covered with the green alga?
______________________________________________________________
______________________________________________________________
______________________________________________________________
______________________________________________________________(2)
(ii) What was the mode of the percentage area covered with the green alga?
Mode = _________________________ %
Give the reason for your answer.
______________________________________________________________
______________________________________________________________(2)
(iii) Give three environmental factors that might affect the distribution of the green alga on the tree.
1. ____________________________________________________________
2. ____________________________________________________________
3. ____________________________________________________________(3)
(iv) Suggest how one of the factors you gave in part (b) (iii) might have caused the distribution of the green alga shown on the bar chart.
Factor _____________________________________________________
______________________________________________________________

______________________________________________________________
______________________________________________________________
______________________________________________________________
______________________________________________________________
______________________________________________________________(3)
(c) Nitrophyte lichens grow on the bark of trees. These lichens are indicators of air pollution by ammonia. Ammonia concentrations in the atmosphere are often high in agricultural areas.The graph shows the relationship between air quality and the distribution of nitrophyte lichens.
High atmospheric Low atmospheric ammonia ammonia
Air quality scores© U.S. Department of Agriculture
(i) Describe the relationship between atmospheric ammonia and the abundance of nitrophyte lichens.
______________________________________________________________
______________________________________________________________
______________________________________________________________
______________________________________________________________(2)
(ii) How useful would a particular value for the abundance of nitrophyte lichens be as an indicator of ammonia pollution of the atmosphere?Explain your answer.
______________________________________________________________
______________________________________________________________

______________________________________________________________
______________________________________________________________(2)
(Total 16 marks)
Q17.Organisms have adaptations that enable them to survive in extreme conditions.
(a) The photograph shows an arctic fox.
By Algkalv (Own work) [CC-BY-3.0], via Wikimedia Commons
This fox lives in the Arctic, where it is very cold.
Suggest two ways in which the arctic fox is adapted for life in very cold conditions.
Explain how each adaptation helps the arctic fox to survive in very cold conditions.
Adaptation 1 ________________________________________________________
___________________________________________________________________
How this adaptation helps the arctic fox to survive in very cold conditions.
___________________________________________________________________
___________________________________________________________________
___________________________________________________________________
Adaptation 2 ________________________________________________________
___________________________________________________________________
How this adaptation helps the arctic fox to survive in very cold conditions.
___________________________________________________________________
___________________________________________________________________
___________________________________________________________________(4)
(b) The photograph shows an antelope that lives in a sandy desert.

By Sun417 at zh.wikipedia [Public domain],
from Wikimedia Commons
The antelope is prey to large cats such as cheetahs.
Suggest one adaptation that helps this antelope avoid being killed by predators.
Explain how this adaptation helps the antelope avoid being killed by predators.
Adaptation __________________________________________________________
___________________________________________________________________
How this adaptation helps the antelope avoid being killed by predators.
___________________________________________________________________
___________________________________________________________________
___________________________________________________________________(2)
(Total 6 marks)
Q18.In this question you will be assessed on using good English, organising information clearly and using specialist terms where appropriate.
Ivy plants can grow up trees and walls.
Figure 1 shows two ivy leaves. One leaf is from an ivy plant growing up a tree in the centre of a shady woodland area. The other leaf is from an ivy plant growing up a tree in a sunny area at the edge of the woodland.

A student makes the following hypothesis.
“The size of ivy leaves decreases as light intensity increases.”
How would you use the apparatus shown in Figure 2 to test this hypothesis?
You should include details of how you would make sure the results are valid.
_______________________________________________________________________
_______________________________________________________________________
_______________________________________________________________________
_______________________________________________________________________
_______________________________________________________________________
_______________________________________________________________________
_______________________________________________________________________
_______________________________________________________________________
_______________________________________________________________________
_______________________________________________________________________(Total 6 marks)
Q19.Desert plants are adapted for survival in a dry climate.
(a) Joshua trees live in deserts.

By nyenyec [CC BY-SA 3.0], via Wikimedia Commons
Joshua trees have two different types of root:
• a system of shallow roots spread out over a large area• roots about 1 m in diameter, shaped like bulbs, deep in the soil.
Explain the advantage to the Joshua tree of having:
(i) shallow roots spread out over a large area
______________________________________________________________
______________________________________________________________
______________________________________________________________
______________________________________________________________(2)
(ii) large, bulb-like roots deep in the soil.
______________________________________________________________
______________________________________________________________(1)
(b) Creosote bushes also live in deserts.

By Sue in az (Own work) [Public domain], via Wikimedia Commons
The leaves of creosote bushes:• are covered with a layer of wax• fold together during the day.
Explain how the leaves of the Creosote bush help it to survive in deserts.
___________________________________________________________________
___________________________________________________________________
___________________________________________________________________
___________________________________________________________________
___________________________________________________________________
___________________________________________________________________(3)
(Total 6 marks)
Q20.Penguins live mainly in the Antarctic. Penguins eat mainly fish.Photograph 1 shows a penguin swimming underwater.
Photograph 1

© raywoo/iStock
(a) Use information from Photograph 1 to suggest three ways the penguin is adapted for catching fish.
1. _________________________________________________________________
___________________________________________________________________
2. _________________________________________________________________
___________________________________________________________________
3. _________________________________________________________________
___________________________________________________________________(3)
(b) The Antarctic winter is very cold. In the winter some species of penguin huddle together as shown in Photograph 2.
Photograph 2
© Fuse
Suggest how the behaviour shown in Photograph 2 helps the penguins to survive the Antarctic winter.
___________________________________________________________________
___________________________________________________________________
___________________________________________________________________

___________________________________________________________________
___________________________________________________________________
___________________________________________________________________(3)
(c) A student did an investigation to model the behaviour of the penguins shown in Photograph 2.
The diagram shows the apparatus the student used.
The student:
• held seven similar test tubes together with elastic bands as shown in the diagram
• stood a similar eighth tube in a test tube rack
• filled each of the eight tubes with hot water to the same level
• measured the temperature of the water in tubes A, B and C every 2 minutes for 20 minutes.
The table shows the student’s results.
Time inMinutes
Temperature in °C
Tube A Tube B Tube C
0 65 65 65
2 65 65 64
4 65 64 63
6 64 64 62
8 64 63 61
10 64 63 60
12 63 62 59
14 63 62 58
16 63 61 57

18 62 61 56
20 62 60 55
(i) Give two variables that were controlled in the investigation.
1. ____________________________________________________________
2. ____________________________________________________________(2)
(ii) Describe the patterns the data shows.
______________________________________________________________
______________________________________________________________
______________________________________________________________
______________________________________________________________(2)
(iii) How far does the data from the model support the suggestion you made in part (b)?
______________________________________________________________
______________________________________________________________
______________________________________________________________
______________________________________________________________(2)
(d) Describe how blood vessels help control human body temperature.
___________________________________________________________________
___________________________________________________________________
___________________________________________________________________
___________________________________________________________________
___________________________________________________________________
___________________________________________________________________
___________________________________________________________________
___________________________________________________________________(4)
(e) Penguins control their body temperature in similar ways to humans.Scientists investigated changes in body temperature of penguins when the penguins were diving to catch fish.
(i) Graph 1 shows the relationship between the temperature of the muscles moving a penguin’s wings and diving.
The shaded areas show when the penguin was diving.
Graph 1
Time© Reprinted from Comparative Biochemistry and Physiology Part A: Molecular & Integrative Physiology, Volume 135, P.J. Ponganis,R.P. Van Dam,D.H. Levenson,T. Knower,K.V. Ponganis,G. Marshall, Regional heterothermy and conservation of core temperature in emperor penguins diving under sea ice, pp 477-487, copyright 2003, with permission from Elsevier
Suggest an explanation for the changes in temperature inside the muscles moving the penguin’s wings.
______________________________________________________________
______________________________________________________________
______________________________________________________________
______________________________________________________________
______________________________________________________________
______________________________________________________________(3)
(ii) Graph 2 shows the relationship between the temperature inside a penguin’s foot and diving.
The shaded areas show when the penguin was diving.
Graph 2

Time© Reprinted from Comparative Biochemistry and Physiology Part A: Molecular & Integrative Physiology, Volume 135, P.J. Ponganis,R.P. Van Dam,D.H. Levenson,T. Knower,K.V. Ponganis,G. Marshall, Regional heterothermy and conservation of core temperature in emperor penguins diving under sea ice, pp 477-487, copyright 2003, with permission from Elsevier
Suggest an explanation for the changes in temperature inside the penguin’s foot as it dives.
______________________________________________________________
______________________________________________________________
______________________________________________________________
______________________________________________________________
______________________________________________________________
______________________________________________________________(3)
(Total 22 marks)
Q21.A grassy field on a farm measured 120 metres by 80 metres.
A student wanted to estimate the number of buttercup plants growing in the field.
The student found an area where buttercup plants were growing and placed a 1 m × 1 m quadrat in one position in that area.
Figure 1 shows the buttercup plants in the quadrat.

The student said, 'This result shows that there are 115 200 buttercup plants in the field.'
(a) (i) How did the student calculate that there were 115 200 buttercup plants in the field?
______________________________________________________________
______________________________________________________________
______________________________________________________________
______________________________________________________________(2)
(ii) The student’s estimate of the number of buttercup plants in the field is probably not accurate. This is because the buttercup plants are not distributed evenly.
How would you improve the student’s method to give a more accurate estimate?
______________________________________________________________
______________________________________________________________
______________________________________________________________
______________________________________________________________(2)
(b) Sunlight is one environmental factor that might affect the distribution of the buttercup plants.
(i) Give three other environmental factors that might affect the distribution of the buttercup plants.
1. ____________________________________________________________
2. ____________________________________________________________
3. ____________________________________________________________(3)

(ii) Explain how the amount of sunlight could affect the distribution of the buttercup plants.
(3)
(c) Figure 2 is a map showing the position of the farm and a river which flows through it.
Every year, the farmer puts fertiliser containing mineral ions on some of his fields.When there is a lot of rain, some of the fertiliser is washed into the river.
(i) When fertiliser goes into the river, the concentration of oxygen dissolved in the water decreases.
Explain why the concentration of oxygen decreases.
______________________________________________________________
______________________________________________________________
______________________________________________________________
______________________________________________________________
______________________________________________________________
______________________________________________________________
______________________________________________________________
______________________________________________________________
______________________________________________________________
______________________________________________________________(5)
(ii) There is a city 4 km downstream from the farm.
Apart from fertiliser, give one other form of pollution that might go into the river as it flows through the city.

______________________________________________________________(1)
(d) Three sites, A, B and C, are shown in Figure 2.
Scientists took many samples of river water from these sites.
The scientists found larvae of three types of insect in the water: mayfly, stonefly and caddisfly. For each type of insect the scientists found several different species.
The scientists counted the number of different species of the larvae of each of the three types of insect.
Figure 3 shows the scientists’ results.
(i) How many more species of mayfly were there at Site B than at Site A?
____________________(1)
(ii) Suggest what caused this increase in the number of species of mayfly.
______________________________________________________________
______________________________________________________________(1)
(iii) The scientists stated that the number of species of stonefly was the best indicator of the amount of oxygen dissolved in the water.
Use information from Figure 3 to suggest why.(1)
(Total 19 marks)
Q22.On a rocky shore, when the tide goes in and out, organisms are exposed to the air for different amounts of time.

(a) On hot, windy days when the tide is out the concentration of the salt solution in rock pools may become very high.
What term is used to describe organisms that can survive in severe conditions such as very high concentrations of salt solution?
___________________________________________________________________(1)
(b) Periwinkles are types of snail. Students surveyed the different types of periwinkle living on a rocky shore.
The diagram shows the results of the students’ survey.The highest position that the sea water reaches on the shore is called the high tide level. Each bar represents the range of habitats for each type of periwinkle.
(i) Which two types of periwinkle are likely to compete with each other to the greatest extent?
______________________________________________________________(1)
(ii) Explain your answer to part (b)(i).
______________________________________________________________
______________________________________________________________(1)
(iii) The small periwinkle can survive much nearer to the high tide level than the flat periwinkle.
Suggest two reasons why the flat periwinkle cannot survive near to the high tide level.
1. ____________________________________________________________
______________________________________________________________
______________________________________________________________
2. ____________________________________________________________
______________________________________________________________
______________________________________________________________(2)

(Total 5 marks)
Q23.Plant leaves have many stomata.The diagram shows a stoma.
(a) Name cell X ________________________________(1)
(b) The table shows the mean widths of the stomata at different times of the day for two
different species of plant.Species A grows in hot, dry deserts.Species B grows in the UK.
Time of day in
hours
Mean width of stomata as a percentage of their maximum width
Species A Species B
0 95 5
Dark 2 86 5
4 52 6
6 6 40
8 4 92
10 2 98
Light 12 1 100
14 0 100
16 1 96
18 5 54
20 86 6

Dark 22 93 5
24 95 5
The data in the table show that species A is better adapted than species B to living in hot, dry deserts.
Explain how.
___________________________________________________________________
___________________________________________________________________
___________________________________________________________________
___________________________________________________________________
___________________________________________________________________
___________________________________________________________________
___________________________________________________________________
___________________________________________________________________(4)
(Total 5 marks)