Embed Size (px)
DESCRIPTION
This report solely serves as a sample of Michael's works. All numbers, accounts are made up to protect confidentiality.
Citation preview
Monthly Performance Report Prepared for: www.theinterpreter.us For the month of April, 2014 Site Auditor: Michael Hoang
Page 2
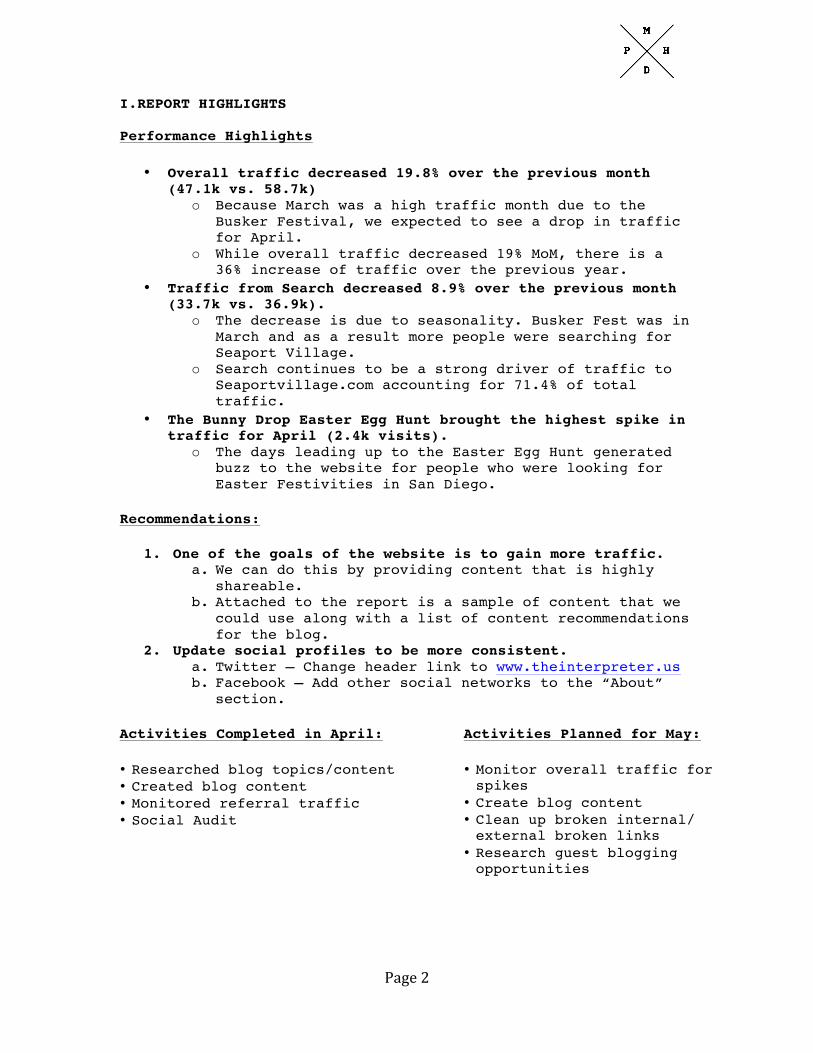
I.REPORT HIGHLIGHTS Performance Highlights
• Overall traffic decreased 19.8% over the previous month (47.1k vs. 58.7k)
o Because March was a high traffic month due to the Busker Festival, we expected to see a drop in traffic for April.
o While overall traffic decreased 19% MoM, there is a 36% increase of traffic over the previous year.
• Traffic from Search decreased 8.9% over the previous month (33.7k vs. 36.9k).
o The decrease is due to seasonality. Busker Fest was in March and as a result more people were searching for Seaport Village.
o Search continues to be a strong driver of traffic to Seaportvillage.com accounting for 71.4% of total traffic.
• The Bunny Drop Easter Egg Hunt brought the highest spike in traffic for April (2.4k visits).
o The days leading up to the Easter Egg Hunt generated buzz to the website for people who were looking for Easter Festivities in San Diego.
Recommendations:
1. One of the goals of the website is to gain more traffic. a. We can do this by providing content that is highly
shareable. b. Attached to the report is a sample of content that we
could use along with a list of content recommendations for the blog.
2. Update social profiles to be more consistent. a. Twitter – Change header link to www.theinterpreter.us b. Facebook – Add other social networks to the “About”
section.
Activities Completed in April:
• Researched blog topics/content • Created blog content • Monitored referral traffic • Social Audit
Activities Planned for May:
• Monitor overall traffic for spikes
• Create blog content • Clean up broken internal/ external broken links
• Research guest blogging opportunities
Page 3
II. COMPARISON TO LAST MONTH
Google Analytics 04/01/2014 – 04/30/2014
compared to: 3/1/2014 – 3/31/2014 Excluding paid search
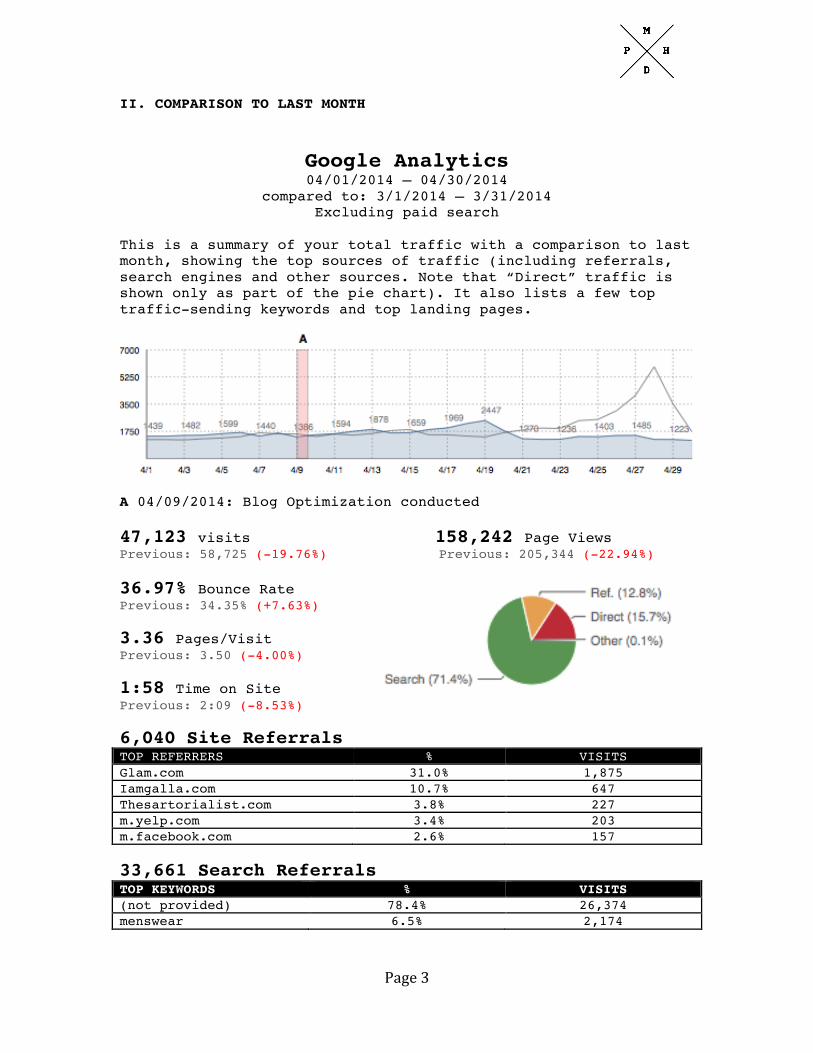
This is a summary of your total traffic with a comparison to last month, showing the top sources of traffic (including referrals, search engines and other sources. Note that “Direct” traffic is shown only as part of the pie chart). It also lists a few top traffic-sending keywords and top landing pages.
A 04/09/2014: Blog Optimization conducted 47,123 visits 158,242 Page Views Previous: 58,725 (-19.76%) Previous: 205,344 (-22.94%) 36.97% Bounce Rate Previous: 34.35% (+7.63%) 3.36 Pages/Visit Previous: 3.50 (-4.00%) 1:58 Time on Site Previous: 2:09 (-8.53%) 6,040 Site Referrals TOP REFERRERS % VISITS Glam.com 31.0% 1,875 Iamgalla.com 10.7% 647 Thesartorialist.com 3.8% 227 m.yelp.com 3.4% 203 m.facebook.com 2.6% 157 33,661 Search Referrals TOP KEYWORDS % VISITS (not provided) 78.4% 26,374 menswear 6.5% 2,174
Page 4
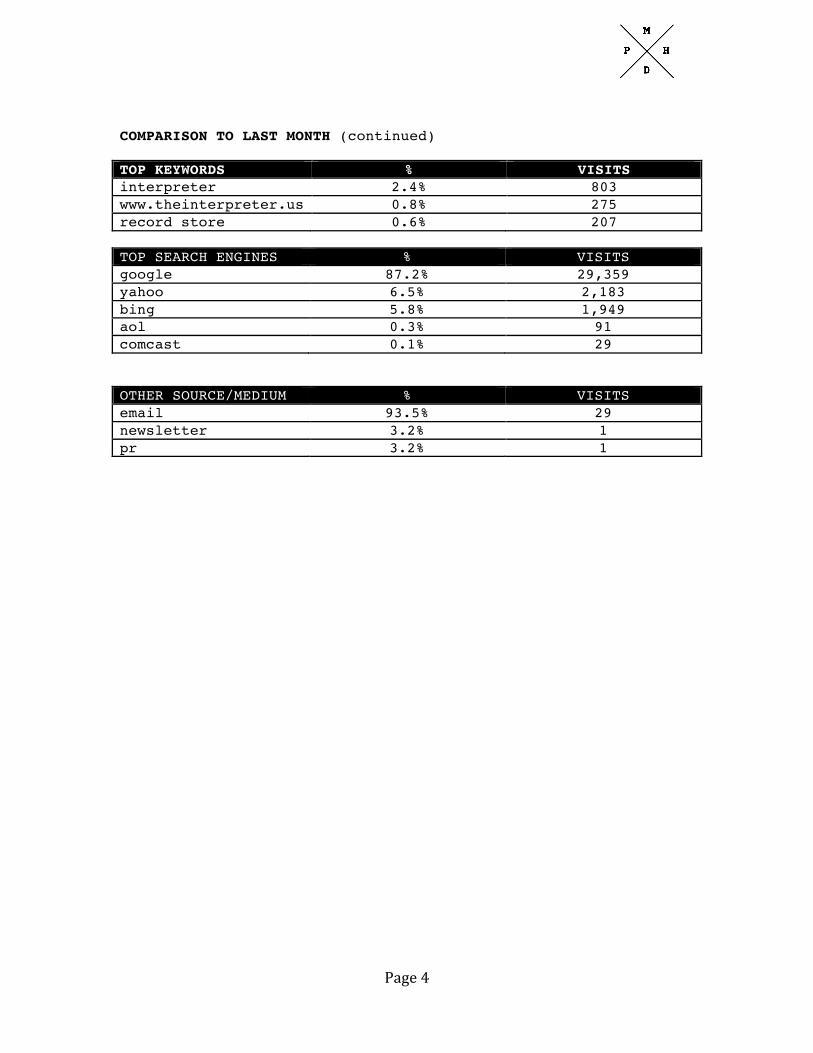
COMPARISON TO LAST MONTH (continued) TOP KEYWORDS % VISITS interpreter 2.4% 803 www.theinterpreter.us 0.8% 275 record store 0.6% 207 TOP SEARCH ENGINES % VISITS google 87.2% 29,359 yahoo 6.5% 2,183 bing 5.8% 1,949 aol 0.3% 91 comcast 0.1% 29 OTHER SOURCE/MEDIUM % VISITS email 93.5% 29 newsletter 3.2% 1 pr 3.2% 1
Page 5
III. YEAR OVER YEAR
Google Analytics 04/01/2014 – 04/30/2014
compared to: 3/1/2014 – 3/31/2014 Excluding paid search
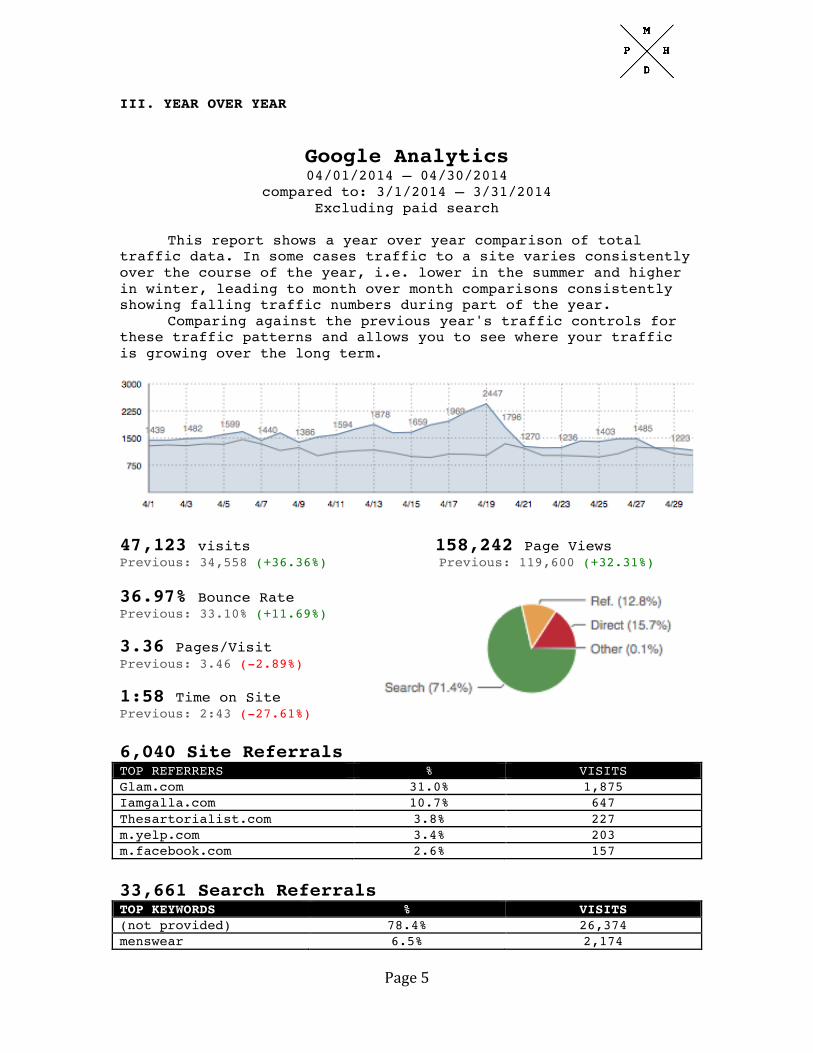
This report shows a year over year comparison of total
traffic data. In some cases traffic to a site varies consistently over the course of the year, i.e. lower in the summer and higher in winter, leading to month over month comparisons consistently showing falling traffic numbers during part of the year.
Comparing against the previous year's traffic controls for these traffic patterns and allows you to see where your traffic is growing over the long term.
47,123 visits 158,242 Page Views Previous: 34,558 (+36.36%) Previous: 119,600 (+32.31%) 36.97% Bounce Rate Previous: 33.10% (+11.69%) 3.36 Pages/Visit Previous: 3.46 (-2.89%) 1:58 Time on Site Previous: 2:43 (-27.61%) 6,040 Site Referrals TOP REFERRERS % VISITS Glam.com 31.0% 1,875 Iamgalla.com 10.7% 647 Thesartorialist.com 3.8% 227 m.yelp.com 3.4% 203 m.facebook.com 2.6% 157
33,661 Search Referrals TOP KEYWORDS % VISITS (not provided) 78.4% 26,374 menswear 6.5% 2,174
Page 6
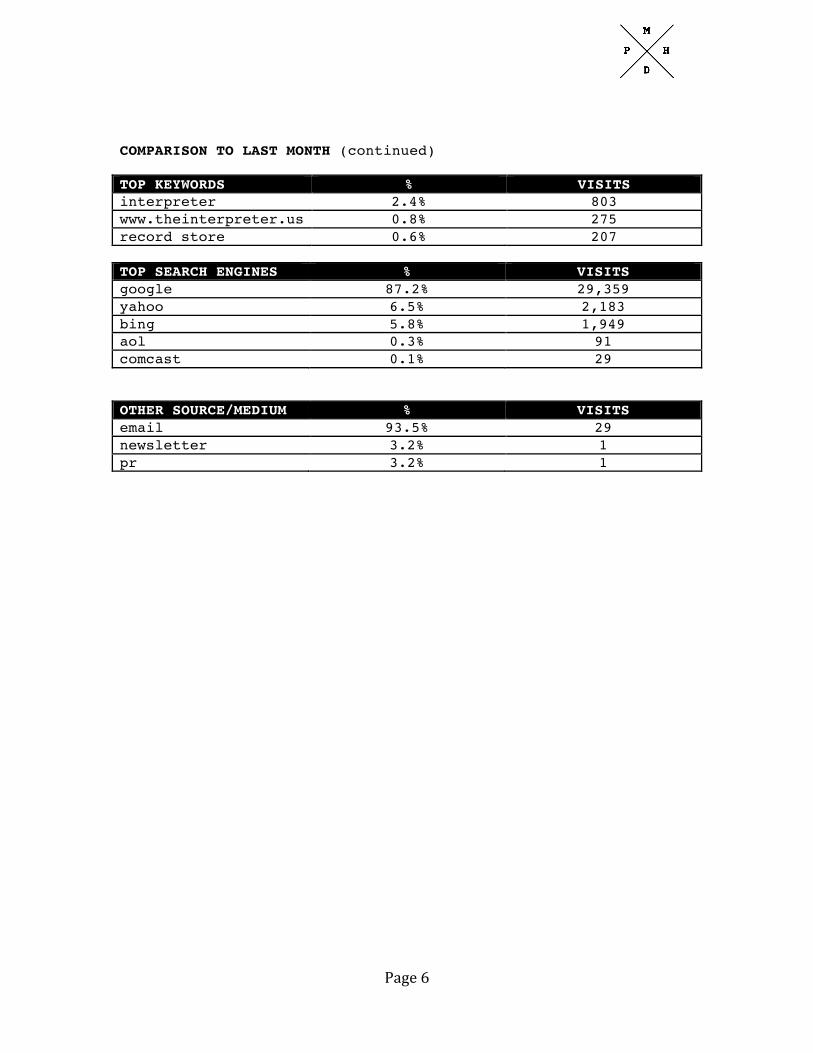
COMPARISON TO LAST MONTH (continued) TOP KEYWORDS % VISITS interpreter 2.4% 803 www.theinterpreter.us 0.8% 275 record store 0.6% 207 TOP SEARCH ENGINES % VISITS google 87.2% 29,359 yahoo 6.5% 2,183 bing 5.8% 1,949 aol 0.3% 91 comcast 0.1% 29 OTHER SOURCE/MEDIUM % VISITS email 93.5% 29 newsletter 3.2% 1 pr 3.2% 1
Page 7
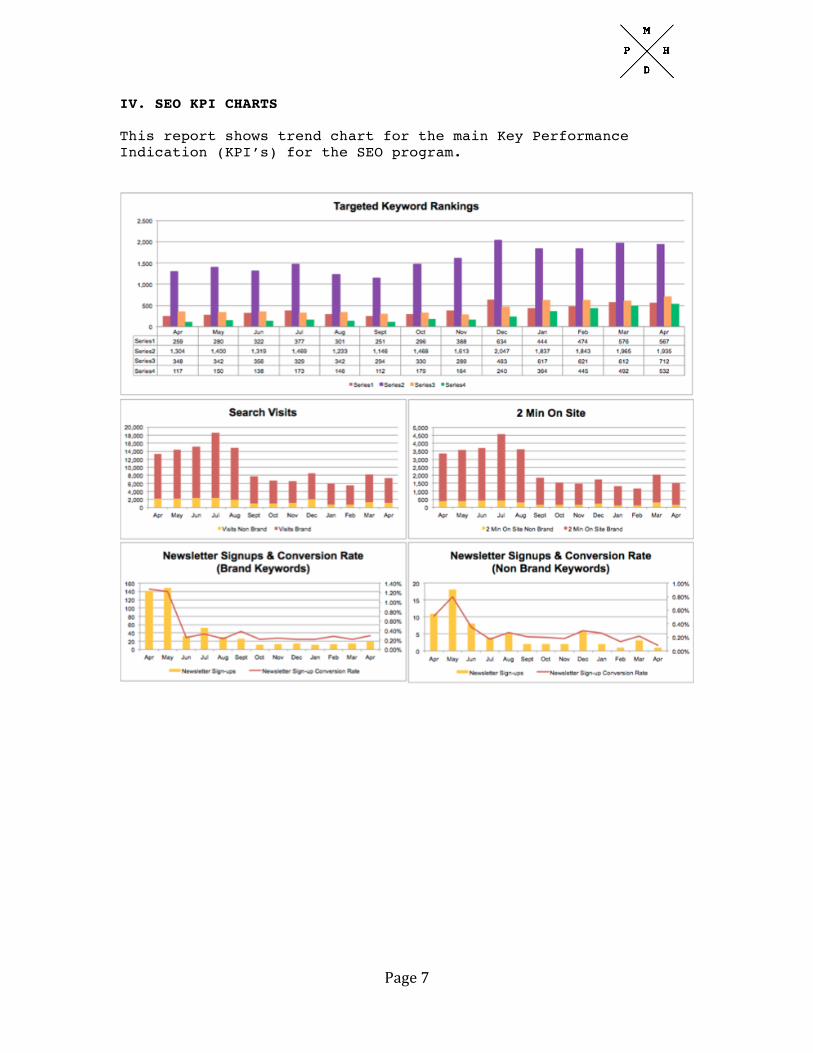
IV. SEO KPI CHARTS This report shows trend chart for the main Key Performance Indication (KPI’s) for the SEO program.
Page 8
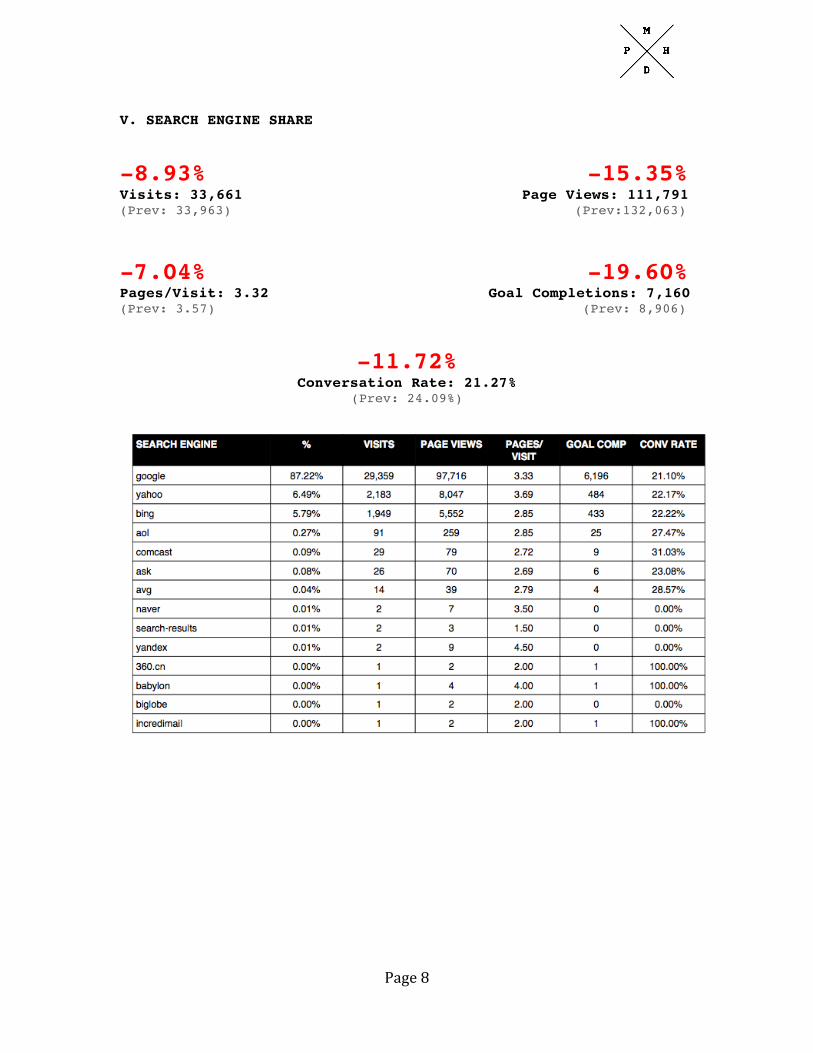
V. SEARCH ENGINE SHARE
-8.93% -15.35% Visits: 33,661 Page Views: 111,791 (Prev: 33,963) (Prev:132,063)
-7.04% -19.60% Pages/Visit: 3.32 Goal Completions: 7,160 (Prev: 3.57) (Prev: 8,906)
-11.72% Conversation Rate: 21.27%
(Prev: 24.09%)
Page 9
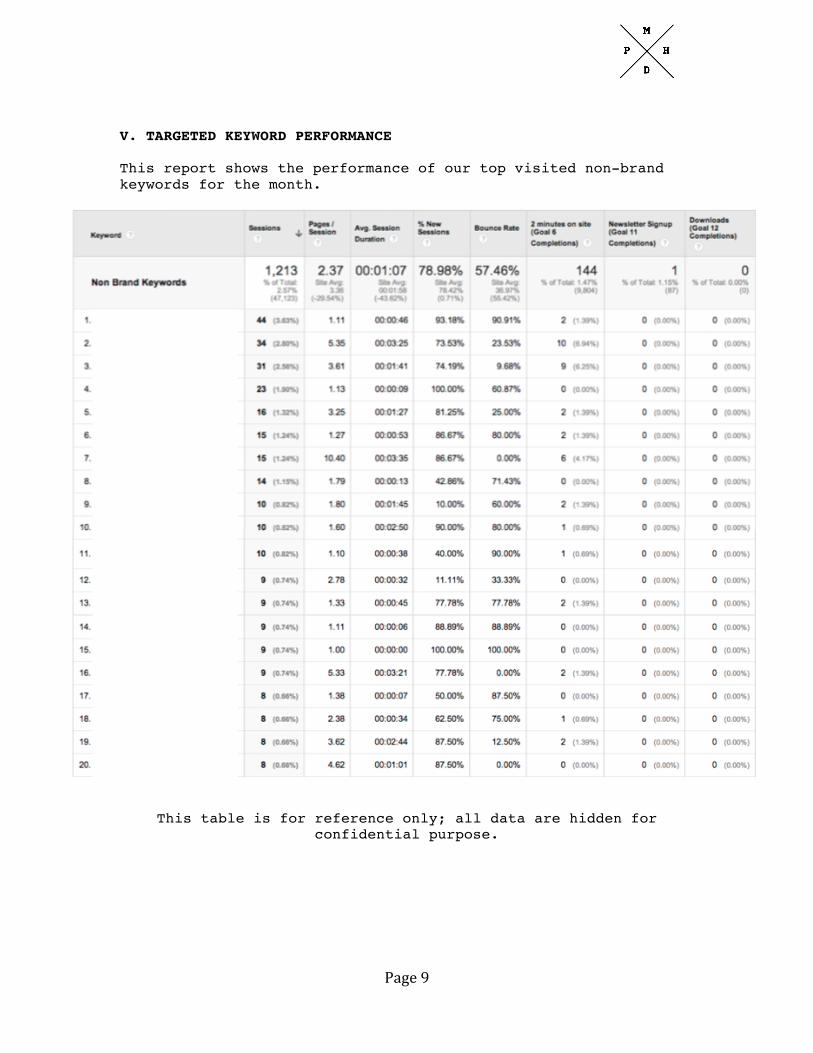
V. TARGETED KEYWORD PERFORMANCE This report shows the performance of our top visited non-brand keywords for the month.
This table is for reference only; all data are hidden for confidential purpose.
Page 10
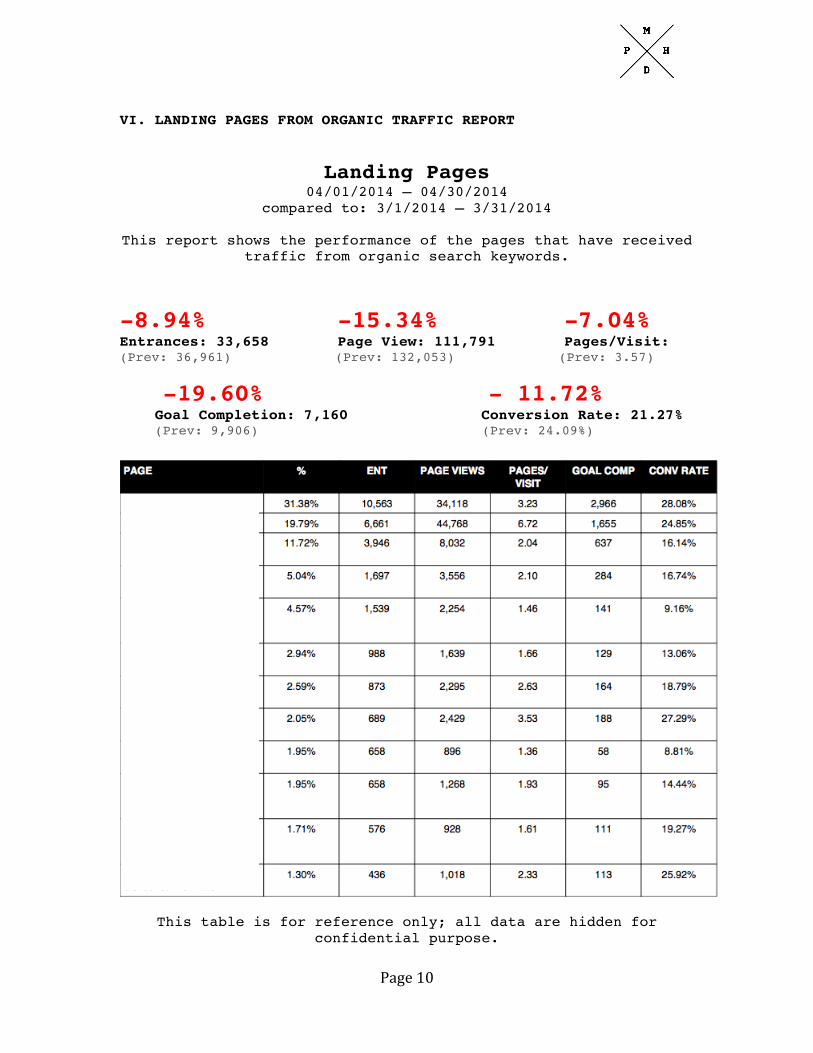
VI. LANDING PAGES FROM ORGANIC TRAFFIC REPORT
Landing Pages 04/01/2014 – 04/30/2014
compared to: 3/1/2014 – 3/31/2014
This report shows the performance of the pages that have received traffic from organic search keywords.
-8.94% -15.34% -7.04% Entrances: 33,658 Page View: 111,791 Pages/Visit: (Prev: 36,961) (Prev: 132,053) (Prev: 3.57)
-19.60% - 11.72% Goal Completion: 7,160 Conversion Rate: 21.27% (Prev: 9,906) (Prev: 24.09%)
This table is for reference only; all data are hidden for
confidential purpose.
Page 11
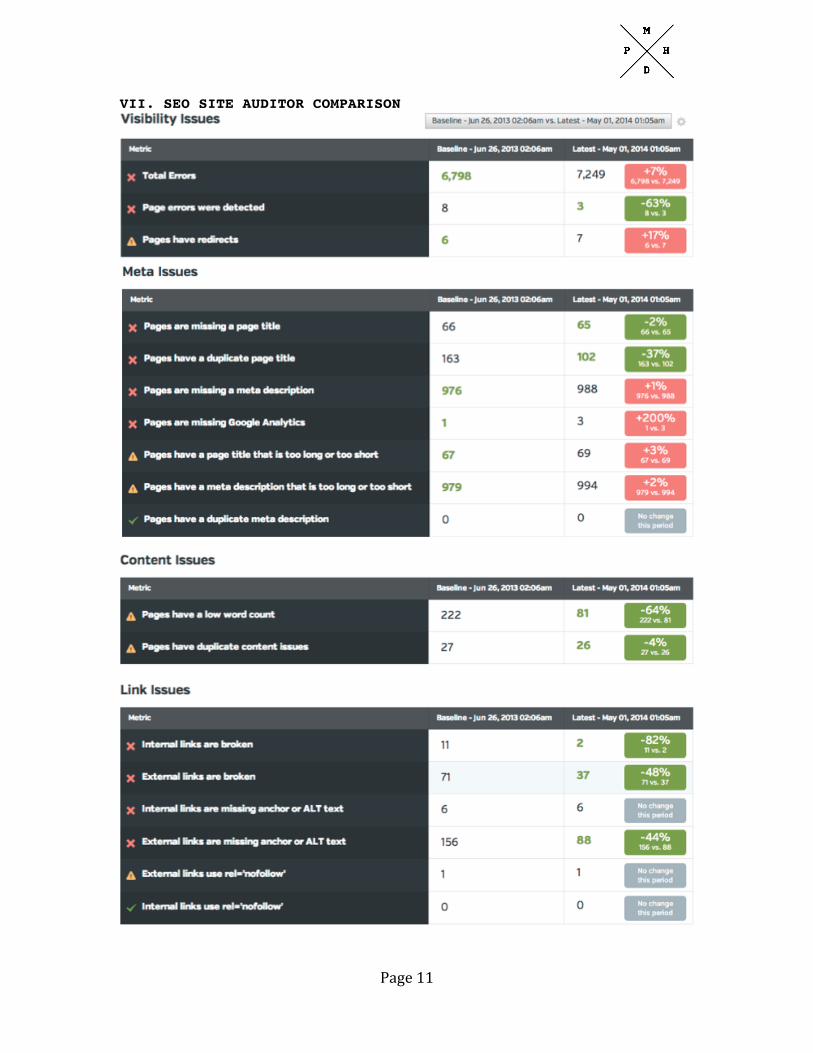
VII. SEO SITE AUDITOR COMPARISON
Page 12
VIII. READING THIS REPORT: (As always, if you have any questions about information in this report, please email us! We are always happy to provide additional information or context.)
Reporting Conventions:
• Positive changes are shown in green, negative changes in red.
• Most positive changes are an increase (traffic, pages/visit). Bounce rate is the exception--a good bounce rate is low.
• Please note that a certain degree of error is inherent in Google Analytics reporting. It is not 100% accurate
Definitions:
• Organic Traffic: These visitors did not click on an ad to get to your site.
• Paid traffic: Typically from Adwords, these visits are from ad clicks.
• Direct traffic: A user typed your URL into their address bar, or used a bookmark .
• Search traffic/search referrals: User accessed your site via a search engine. Most sites get 80%+ of their search traffic from Google.
• Referral traffic: User accessed your site via a link on another site like Yelp.com or Facebook.com
• Landing page: the first page of your site the user sees. • Bounce rate: a Bounce occurs when the visitor landing on
the page immediately leaves the site. You want a lower bounce rate, so a negative change is a positive trend and will be shown in green.
• "(not set)" and "(not provided)": These are not search terms; rather, they are indicators of the amount of traffic that resulted from users who are not tracked by Analytics due to privacy settings, etc. It is safe to assume that the distribution of key phrases from these untracked users is similar to the distribution of tractable users.