Embed Size (px)
Citation preview

WEB TABLES U.S. DEPARTMENT OF EDUCATION APRIL 2011 NCES 2011-226
Postsecondary Awards in Science, Technology,
Engineering, and Mathematics, by State: 2001 and 2009
These tables provide state-level
information on the conferring of
Science, Technology, Engineering, and
Mathematics (STEM) awards (degrees
and certificates) from academic years
2000–01 and 2008–09, both overall
and by field. Specifically, the tables
provide information on:
• the number of awards conferred in
STEM fields, overall (table 1) and by
STEM fields (the table 2 series);
• changes in the number of STEM
degrees, by degree level (table 3)
and STEM certificates, by certificate
level (table 4);
• the number of awards conferred in
STEM fields to women, overall (table
5), by STEM field (the table 6 series),
by level of degree (table 7 and the
table 9 series through the table 12
series), and by level of certificate
(table 8); and
• the number of awards conferred in
STEM fields by race/ethnicity,
overall (the table 13 series), by STEM
field (the table 14 series through the
table 21 series), by level of degree
(the table 22 series), and by level of
certificate (the table 23 series).
DEFINITION OF STEM FIELDS AND ENTRANCE STEM fields include a wide range of
disciplines, and there are different
ways to identify the disciplines in-
cluded in STEM. For example, the Na-
tional Science Foundation (NSF)
defines STEM fields broadly, including
not only mathematics, natural sciences,
engineering, and computer and infor-
mation sciences, but also such so-
cial/behavioral sciences as psychology,
economics, sociology, and political
science (Green 2007). There is no gen-
erally accepted list of STEM instruc-
tional programs used by the Federal
Government; however, Federal and
State policy initiatives are often aimed
at improving STEM education in ma-
thematics, natural sciences, engineer-
ing, and technologies (Kuenzi,
Matthews, and Mangan 2006; National
Governors Association 2007). These
tables adopt a definition of STEM
oriented towards these policy initia-
tives. They focus exclusively on ma-
thematics; natural sciences (including
physical sciences and biologi-
cal/agricultural sciences); engineer-
ing/engineering technologies; and
computer/information sciences.
Rather than creating a new list, this
analysis used a U.S. Immigration and
Customs Enforcement (ICE) list of des-
ignated STEM degree programs. ICE’s
list included the instructional programs
of interest to the analysis (mathemat-
ics; natural sciences; engineer-
ing/engineering technologies; and
computer/information sciences). These
tables group the ICE designated STEM
instructional programs into six STEM
fields: computer and information
sciences; engineering and engineering
technologies; biological and biomedi-
cal sciences; mathematics and statis-
tics; physical sciences; and science
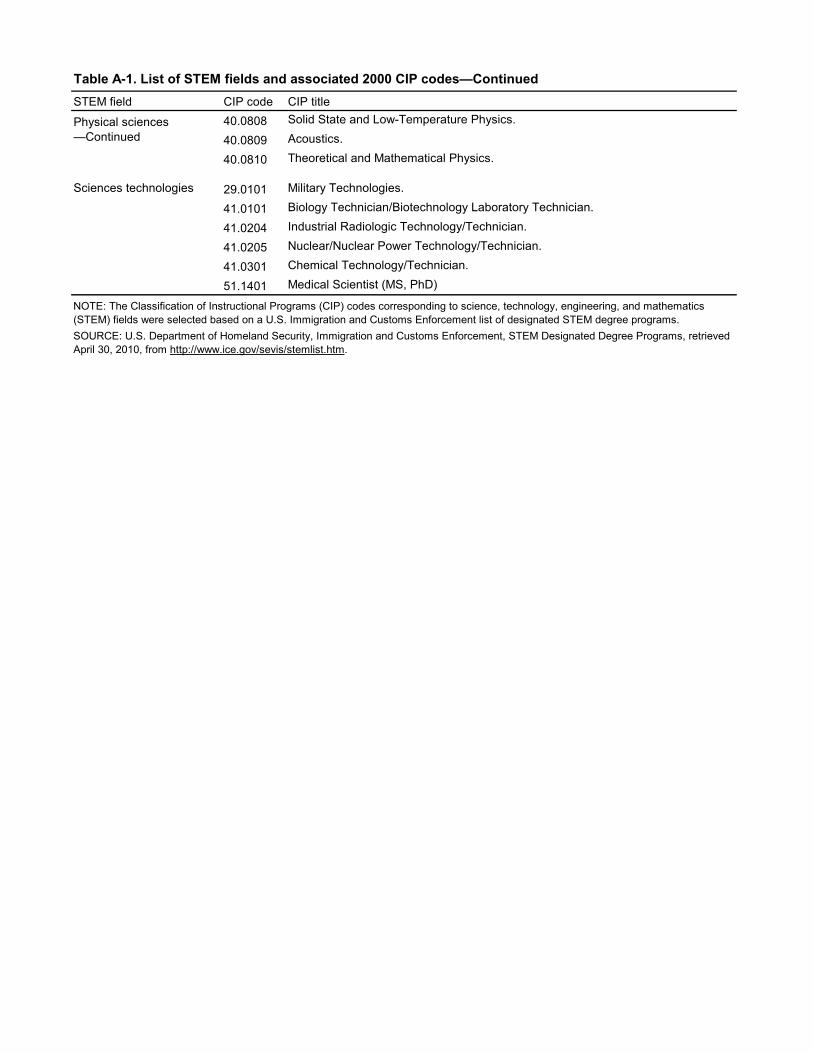
technologies. Table A-1 lists the Classi-
This report was prepared for the National Center for Education Statistics under Contract No. ED-IES-09-C-0006 with RTI International. Mention of trade names, commercial products, or organizations does not imply endorsement by the U.S. Government. These Web Tables were authored by Scott Ginder and Marcinda Mason of RTI International. The NCES Project Officer was Elise Miller. For questions about content or to view this report online, go to http://nces.ed.gov/pubsearch/pubsinfo.asp?pubid=2011226.

2
fication of Instructional Programs (CIP)
codes used in the six STEM fields.
Because the Integrated Postsecondary
Education Data System (IPEDS) data are
publicly available in the IPEDS Data
Center, users can produce custom
STEM tables that include different in-
structional programs and STEM fields.
RELATED NCES REPORTS Students Who Study Science, Technology,
Engineering, and Mathematics (STEM)
in Postsecondary Education, 2009. NCES
Stats in Brief. (NCES 2009-161)
(http://nces.ed.gov/pubs2009/2009161.
pdf).
Changes in Postsecondary Awards Below
the Bachelor's Degree: 1997 to 2007,
2009. NCES Stats in Brief (NCES 2010-
167) (http://nces.ed.gov/pubs2010/
2010167.pdf).
DATA Data in these Web Tables were col-
lected primarily through the IPEDS
Completions component. The Comple-
tions component collects the number
of awards conferred, by gender,
race/ethnicity, award level, and field of
study, for each academic year. The
analysis included Title IV institutions in
the United States that reported com-
pletion data for academic years 2000–
01 or 2008–09. Title IV institutions are
those eligible to participate in the Title
IV federal financial aid programs (e.g.,
Pell Grants and Stafford Loans).
The analysis in this report used (CIP)
codes adopted in 2000 to group in-
structional programs into STEM and
non-STEM fields. CIP is a taxonomic
coding scheme of instructional pro-
grams that supports the accurate track-
ing and reporting of fields of study and
program completions activity. CIP was
first developed in 1980 by the National
Center for Education Statistics (NCES),
with revisions occurring in 1985, 1990,
2000, and 2010. There are three levels
of detail within the CIP taxonomy. The
2-digit series represent the most gen-
eral groupings of related programs,
while the 4-digit series are interme-
diate groupings of programs. The 6-
digit codes represent specific instruc-
tional programs, which are used in the
Completions Component of IPEDS. The
2000 edition includes over 1,500 CIP
codes.
IPEDS is the core postsecondary educa-
tion data collection program for NCES.
Institution-level data are collected from
postsecondary institutions in the Unit-
ed States (50 states and the District of
Columbia) and other jurisdictions.1 For
IPEDS, a postsecondary institution is
defined as an organization open to the
public that has as its primary mission
the provision of postsecondary educa-
tion. IPEDS defines postsecondary edu-
cation as formal instructional programs
with a curriculum designed primarily
for students who are beyond the com-
pulsory age for high school. This in-
cludes institutions that offer academic,
vocational, and continuing profession-
Reporting data to IPEDS is mandatory
for institutions participating in Title IV
financial aid programs. Title IV partici-
pating institutions are accredited by an
agency or organization recognized by
the Secretary of the U.S. Department of
Education, have a program of more
than 300 clock hours or 8 credit hours,
have been in business for at least 2
years, and have a signed Program Par-
ticipation Agreement with the Office of
Postsecondary Education, U.S. Depart-
ment of Education. Institutions that do
not participate in Title IV programs
may participate in the IPEDS data col-
lection on a voluntary basis; however,
analysis in this report was restricted to
Title IV institutions located in the Unit-
ed States.
al education programs and excludes
institutions that offer only avocational
(leisure) and adult basic education
programs. Data collected via IPEDS
cover a variety of areas, including insti-
tutional prices, enrollments, gradua-
tion rates, program completions,
student financial aid, institutional
finance, and human resources.
IPEDS DATA CENTER The IPEDS Data Center
(http://nces.ed.gov/ipeds/datacenter/)
is the user interface for retrieving and
analyzing IPEDS data on the NCES
website. All IPEDS data are released
through the data center. More IPEDS
state tables produced by NCES can be
found at the IPEDS Table Library at
http://www.nces.ed.gov/ipeds/tables_
library/.

3
For more information, contact
Aurora D’Amico
Postsecondary, Adult, and Career Edu-
cation Division
National Center for Education Statistics
1990 K Street NW
Washington, DC 20006-5652
(202) 502-7334
TECHNICAL NOTES The data in these Web Tables come
from the Institutional Characteristics
and Completions components of IPEDS
from the 2001–02 collection through
the 2009–10 collection. Institutional
Characteristics data used in this report
are available for all institutions in each
collection. Response rates for the
Completions component for institu-
tions located in the United States vary
from year to year. The lowest response
rate (approximately 96 percent) oc-
curred during the 2001–02 collection,
and the highest response rate (approx-
imately 100 percent) occurred during
the 2006–07 collection. To mitigate the
impact of nonresponse on statistics
calculated from the Completions data,
imputations were conducted prior to
the public release of the data. The
analysis in this report was performed
using both the reported and imputed
Completions data.
Completions data are collected in the
fall on the prior academic year. For ex-
ample, completions data collected dur-
ing the fall of the 2001-02 IPEDS collec-
tion year were conferred during the
2000–01 academic year. The characte-
ristics of an institution can change be-
tween the conferring of an award and
the reporting of the same award and
lead to apparent inconsistencies in the
data. In academic year 2000–01, there
were 522 degrees awarded at five insti-
tutions in the United States that were
classified as non-degree granting dur-
ing the 2001–02 collection year, but
were degree-granting institutions dur-
ing the 2000–01 academic year. Like-
wise, 141 degrees were awarded in
academic year 2008–09 at five institu-
tions in the United States that were
classified as non-degree granting dur-
ing the 2009–10 collection year, but
were degree-granting institutions dur-
ing the 2008–09 academic year.
The awards conferred in academic
year 2000–01 were reported using the
1990 version of the Classification of In-
structional Programs. To determine if
an award was conferred in a STEM
field, these 1990 CIP codes were
mapped to the 2000 version of the CIP
codes using the crosswalk available at
http://nces.ed.gov/pubs2002/cip2000/
index.asp. The 2000 CIP codes were
used to classify awards into STEM
fields for both academic years 2000–
01 and 2008–09.
The use of the Two or more races cate-
gory was optional during the 2009–10
collection year, and approximately 750
institutions utilized the category for
reporting awards conferred in the
2008–09 academic year. These institu-
tions reported about 6,000 awards in
the Two or more races category, 0.1
percent of the just over 4 million total
awards reported. Of the 6,000 awards,
some 500 were from STEM fields,
representing 0.1 percent of the approx-
imately 434,000 STEM awards overall.
Given the small percentage of total
awards and STEM awards reported us-
ing the Two or more races category,
the impact of this change on any ob-
served changes in STEM awards by
race/ethnicity from academic year
2000–01 to 2008–09 is negligible.
The set of Title IV institutions reporting
to IPEDS is not static from year to
year—institutions are added to and
removed from the universe annually.
The number of institutions in the Unit-
ed States eligible to respond to the
Completions component increased
from approximately 6,400 for the
2001–02 collection to about 6,750 for
the 2009–10 collection. In addition to
the change in the number of institu-
tions, it is important to consider the
number of completions these institu-
tions represent. Table 24 displays the
number of institutions leaving the
IPEDS universe before the 2009–10 col-
lection year or entering the IPEDS un-
iverse after 2001–02 collection year, by
state.
4
The approximately 900 institutions in
the United States leaving the IPEDS un-
iverse between 2001–02 and 2009–10
conferred 100,000 awards in 2000–01,
of which 14 percent were in STEM
fields. The approximately 1,250 institu-
tions in the United States entering the
IPEDS universe between 2001–02 and
2009–10 conferred 185,000 awards in
2008–09, of which 6 percent were in
STEM fields. The impact of institutions
leaving and entering the IPEDS un-
iverse on the number and percentage
of awards in STEM fields varied by
state; however, only 11 states exhibited
a higher proportion of awards in STEM
fields from institutions entering the
IPEDS universe than from institutions
leaving the IPEDS universe. Given this
information, we can be confident that
observed increases in the production
of awards in STEM fields are true in-
creases, and not a product of the
changing IPEDS universe.
Definitions of IPEDS terminology can
be found in the IPEDS glossary at
http://nces.ed.gov/ipeds/glossary.
REFERENCES Green, M. (2007). Science and
Engineering Degrees: 1966−2004 (NSF
07-307). Arlington, VA: National
Science Foundation.
Kuenzi, J., Matthews, C., and Mangan, B.
(2006). Science, Technology,
Engineering, and Mathematics (STEM)
Education Issues and Legislative
Options. Congressional Research
Report. Washington, DC:
Congressional Research Service.
National Governors Association. (2007).
Innovation America: Building a science,
technology, engineering and math
agenda. Washington, D.C.: National
Governors Association Center for Best
Practices. Retrieved March 23, 2011,
from http://www.nga.org/Files/pdf/
0702INNOVATIONStem.pdf.
ENDNOTES 1 The other jurisdictions include American Sa-moa, the Federated States of Micronesia, Guam, the Marshall Islands, the Northern Ma-rianas, Palau, Puerto Rico, and the Virgin Isl-ands.

STEM field CIP code CIP title11.0101 Computer and Information Sciences, General.11.0102 Artificial Intelligence and Robotics.
11.0103 Information Technology.
11.0201 Computer Programming/Programmer, General.
11.0202 Computer Programming, Specific Applications.
11.0203 Computer Programming, Vendor/Product Certification.
11.0301 Data Processing and Data Processing Technology/Technician.
11.0401 Information Science/Studies.
11.0501 Computer Systems Analysis/Analyst.
11.0701 Computer Science.
11.0801 Web Page, Digital/Multimedia and Information Resources Design.
11.0802 Data Modeling/Warehousing and Database Administration.
11.0803 Computer Graphics.
11.0901 Computer Systems Networking and Telecommunications.
11.1001 System Administration/Administrator.
11.1002 System, Networking, and LAN/WAN Management/Manager.
11.1003 Computer and Information Systems Security.
11.1004 Web/Multimedia Management and Webmaster.
14.0101 Engineering, General.
14.0201 Aerospace, Aeronautical and Astronautical Engineering.
14.0301 Agricultural/Biological Engineering and Bioengineering.
14.0401 Architectural Engineering.
14.0501 Biomedical/Medical Engineering.
14.0601 Ceramic Sciences and Engineering.
14.0701 Chemical Engineering
14.0801 Civil Engineering, General.
14.0802 Geotechnical Engineering.
14.0803 Structural Engineering.
14.0804 Transportation and Highway Engineering.
14.0805 Water Resources Engineering.
14.0901 Computer Engineering, General.
14.0902 Computer Hardware Engineering.
14.0903 Computer Software Engineering.
14.1001 Electrical, Electronics and Communications Engineering.
14.1101 Engineering Mechanics.
14.1201 Engineering Physics.
14.1301 Engineering Science.
14.1401 Environmental/Environmental Health Engineering.
14.1801 Materials Engineering.
14.1901 Mechanical Engineering.
14.2001 Metallurgical Engineering.
14.2101 Mining and Mineral Engineering.See notes at end of table.
National Center for Education StatisticsTable A-1. List of STEM fields and associated 2000 CIP codes
Computer and information sciences
Engineering and engineering technologies

STEM field CIP code CIP title14.2201 Naval Architecture and Marine Engineering.
14.2301 Nuclear Engineering.
14.2401 Ocean Engineering.
14.2501 Petroleum Engineering.
14.2701 Systems Engineering.
14.2801 Textile Sciences and Engineering.
14.3101 Materials Science.
14.3201 Polymer/Plastics Engineering.
14.3301 Construction Engineering.
14.3401 Forest Engineering.
14.3501 Industrial Engineering.
14.3601 Manufacturing Engineering.
14.3701 Operations Research.
14.3801 Surveying Engineering.
14.3901 Geological/Geophysical Engineering.
15.0000 Engineering Technology, General.
15.0101 Architectural Engineering Technology/Technician.
15.0201 Civil Engineering Technology/Technician.
15.0303 Electrical, Electronic and Communications Engineering Technology/Technician.
15.0304 Laser and Optical Technology/Technician.
15.0305 Telecommunications Technology/Technician.
15.0401 Biomedical Technology/Technician.
15.0403 Electromechanical Technology/Electromechanical Engineering Technology.
15.0404 Instrumentation Technology/Technician.
15.0405 Robotics Technology/Technician.
15.0501Heating, Air Conditioning and Refrigeration Technology/Technician (ACH/ACR/ACHR/HRAC/HVAC/AC Technology).
15.0503 Energy Management and Systems Technology/Technician.
15.0505 Solar Energy Technology/Technician.
15.0506Water Quality and Wastewater Treatment Management and Recycling Technology/Technician.
15.0507 Environmental Engineering Technology/Environmental Technology.
15.0508 Hazardous Materials Management and Waste Technology/Technician.
15.0607 Plastics Engineering Technology/Technician.
15.0611 Metallurgical Technology/Technician.
15.0612 Industrial Technology/Technician.
15.0613 Manufacturing Technology/Technician.
15.0701 Occupational Safety and Health Technology/Technician.
15.0702 Quality Control Technology/Technician.
15.0703 Industrial Safety Technology/Technician.
15.0704 Hazardous Materials Information Systems Technology/Technician.
15.0801 Aeronautical/Aerospace Engineering Technology/Technician.
15.0803 Automotive Engineering Technology/Technician.
Engineering and engineering technologies —Continued
Table A-1. List of STEM fields and associated 2000 CIP codes—Continued
See notes at end of table.

STEM field CIP code CIP title15.0805 Mechanical Engineering/Mechanical Technology/Technician.
15.0901 Mining Technology/Technician.
15.0903 Petroleum Technology/Technician.
15.1001 Construction Engineering Technology/Technician.
15.1102 Surveying Technology/Surveying.
15.1103 Hydraulics and Fluid Power Technology/Technician.
15.1201 Computer Engineering Technology/Technician.
15.1202 Computer Technology/Computer Systems Technology.
15.1203 Computer Hardware Technology/Technician.
15.1204 Computer Software Technology/Technician.
15.1301 Drafting and Design Technology/Technician, General.
15.1302 CAD/CADD Drafting and/or Design Technology/Technician.
15.1303 Architectural Drafting and Architectural CAD/CADD.
15.1304 Civil Drafting and Civil Engineering CAD/CADD.
15.1305 Electrical/Electronics Drafting and Electrical/Electronics CAD/CADD.
15.1306 Mechanical Drafting and Mechanical Drafting CAD/CADD.
15.1401 Nuclear Engineering Technology/Technician.
15.1501 Engineering/Industrial Management.
26.0101 Biology/Biological Sciences, General.
26.0102 Biomedical Sciences, General.
26.0202 Biochemistry.
26.0203 Biophysics.
26.0204 Molecular Biology.
26.0205 Molecular Biochemistry.
26.0206 Molecular Biophysics.
26.0207 Structural Biology.
26.0208 Photobiology.
26.0209 Radiation Biology/Radiobiology.
26.0210 Biochemistry/Biophysics and Molecular Biology.
26.0301 Botany/Plant Biology.
26.0305 Plant Pathology/Phytopathology.
26.0307 Plant Physiology.
26.0308 Plant Molecular Biology.
26.0401 Cell/Cellular Biology and Histology.
26.0403 Anatomy.
26.0404 Developmental Biology and Embryology.
26.0405 Neuroanatomy.
26.0406 Cell/Cellular and Molecular Biology.
26.0407 Cell Biology and Anatomy.
26.0502 Microbiology, General.
26.0503 Medical Microbiology and Bacteriology.
26.0504 Virology.
Engineering and engineering technologies —Continued
Biological and biomedical sciences
Table A-1. List of STEM fields and associated 2000 CIP codes—Continued
See notes at end of table.

STEM field CIP code CIP title26.0505 Parasitology.
26.0506 Mycology.
26.0507 Immunology.
26.0701 Zoology/Animal Biology.
26.0702 Entomology.
26.0707 Animal Physiology.
26.0708 Animal Behavior and Ethology.
26.0709 Wildlife Biology.
26.0801 Genetics, General.
26.0802 Molecular Genetics.
26.0803 Microbial and Eukaryotic Genetics.
26.0804 Animal Genetics.
26.0805 Plant Genetics.
26.0806 Human/Medical Genetics.
26.0901 Physiology, General.
26.0902 Molecular Physiology.
26.0903 Cell Physiology.
26.0904 Endocrinology.
26.0905 Reproductive Biology.
26.0906 Neurobiology and Neurophysiology.
26.0907 Cardiovascular Science.
26.0908 Exercise Physiology.
26.0909 Vision Science/Physiological Optics.
26.0910 Pathology/Experimental Pathology.
26.0911 Oncology and Cancer Biology.
26.1001 Pharmacology.
26.1002 Molecular Pharmacology.
26.1003 Neuropharmacology.
26.1004 Toxicology.
26.1005 Molecular Toxicology.
26.1006 Environmental Toxicology.
26.1007 Pharmacology and Toxicology.
26.1101 Biometry/Biometrics.
26.1102 Biostatistics.
26.1103 Bioinformatics.
26.1201 Biotechnology.
26.1301 Ecology.
26.1302 Marine Biology and Biological Oceanography.
26.1303 Evolutionary Biology.
26.1304 Aquatic Biology/Limnology.
26.1305 Environmental Biology.
26.1306 Population Biology.
See notes at end of table.
Biological and biomedical sciences—Continued
Table A-1. List of STEM fields and associated 2000 CIP codes—Continued

STEM field CIP code CIP title26.1307 Conservation Biology.
26.1308 Systematic Biology/Biological Systematics.
26.1309 Epidemiology.
27.0101 Mathematics, General.
27.0102 Algebra and Number Theory.
27.0103 Analysis and Functional Analysis.
27.0104 Geometry/Geometric Analysis.
27.0105 Topology and Foundations.
27.0301 Applied Mathematics.
27.0303 Computational Mathematics.
27.0501 Statistics, General.
27.0502 Mathematical Statistics and Probability.
52.1304 Actuarial Science.
Physical sciences 40.0101 Physical Sciences.
40.0201 Astronomy.
40.0202 Astrophysics.
40.0203 Planetary Astronomy and Science.
40.0401 Atmospheric Sciences and Meteorology, General.
40.0402 Atmospheric Chemistry and Climatology.
40.0403 Atmospheric Physics and Dynamics.
40.0404 Meteorology.
40.0501 Chemistry, General.
40.0502 Analytical Chemistry.
40.0503 Inorganic Chemistry.
40.0504 Organic Chemistry.
40.0506 Physical and Theoretical Chemistry.
40.0507 Polymer Chemistry.
40.0508 Chemical Physics.
40.0601 Geology/Earth Science, General.
40.0602 Geochemistry.
40.0603 Geophysics and Seismology.
40.0604 Paleontology.
40.0605 Hydrology and Water Resources Science.
40.0606 Geochemistry and Petrology.
40.0607 Oceanography, Chemical and Physical.
40.0801 Physics, General.
40.0802 Atomic/Molecular Physics.
40.0804 Elementary Particle Physics.
40.0805 Plasma and High-Temperature Physics.
40.0806 Nuclear Physics.
40.0807 Optics/Optical Sciences.
See notes at end of table.
Table A-1. List of STEM fields and associated 2000 CIP codes—Continued
Biological and biomedical sciences—Continued
Mathematics and statistics
STEM field CIP code CIP title40.0808 Solid State and Low-Temperature Physics.
40.0809 Acoustics.
40.0810 Theoretical and Mathematical Physics.
Sciences technologies 29.0101 Military Technologies.
41.0101 Biology Technician/Biotechnology Laboratory Technician.
41.0204 Industrial Radiologic Technology/Technician.
41.0205 Nuclear/Nuclear Power Technology/Technician.
41.0301 Chemical Technology/Technician.
51.1401 Medical Scientist (MS, PhD)
SOURCE: U.S. Department of Homeland Security, Immigration and Customs Enforcement, STEM Designated Degree Programs, retrieved April 30, 2010, from http://www.ice.gov/sevis/stemlist.htm.
NOTE: The Classification of Instructional Programs (CIP) codes corresponding to science, technology, engineering, and mathematics (STEM) fields were selected based on a U.S. Immigration and Customs Enforcement list of designated STEM degree programs.
Table A-1. List of STEM fields and associated 2000 CIP codes—Continued
Physical sciences —Continued

Number % Number % All fields
United States 2,994,677 385,842 12.9 4,057,501 433,742 10.7 35.5 12.4
Alabama 44,612 5,709 12.8 53,266 6,069 11.4 19.4 6.3Alaska 4,465 653 14.6 4,462 525 11.8 -0.1 -19.6Arizona 69,912 6,658 9.5 146,301 12,993 8.9 109.3 95.1Arkansas 25,698 3,566 13.9 33,107 2,828 8.5 28.8 -20.7California 356,817 41,312 11.6 469,055 47,128 10.0 31.5 14.1
Colorado 51,152 8,098 15.8 75,734 8,881 11.7 48.1 9.7Connecticut 33,270 3,468 10.4 44,880 5,108 11.4 34.9 47.3Delaware 8,667 996 11.5 11,652 1,079 9.3 34.4 8.3District of Columbia 20,596 3,146 15.3 28,421 3,408 12.0 38.0 8.3Florida 174,058 16,036 9.2 261,772 20,036 7.7 50.4 24.9
Georgia 78,266 8,942 11.4 118,482 12,156 10.3 51.4 35.9Hawaii 11,648 1,173 10.1 12,350 1,259 10.2 6.0 7.3Idaho 12,850 1,670 13.0 16,886 1,990 11.8 31.4 19.2Illinois 140,898 18,439 13.1 195,990 18,504 9.4 39.1 0.4Indiana 58,395 8,412 14.4 79,819 9,517 11.9 36.7 13.1
Iowa 39,011 4,710 12.1 55,545 5,373 9.7 42.4 14.1Kansas 38,701 4,520 11.7 42,639 3,951 9.3 10.2 -12.6Kentucky 34,251 3,748 10.9 59,182 5,980 10.1 72.8 59.6Louisiana 48,795 6,561 13.4 62,210 5,863 9.4 27.5 -10.6Maine 9,861 1,194 12.1 12,862 1,337 10.4 30.4 12.0
Maryland 49,291 8,544 17.3 68,310 10,045 14.7 38.6 17.6Massachusetts 92,828 12,819 13.8 113,171 13,997 12.4 21.9 9.2Michigan 103,012 15,343 14.9 133,475 17,896 13.4 29.6 16.6Minnesota 57,545 7,654 13.3 87,847 8,029 9.1 52.7 4.9Mississippi 25,249 2,835 11.2 30,950 2,989 9.7 22.6 5.4
Missouri 65,525 8,471 12.9 88,541 8,620 9.7 35.1 1.8Montana 8,198 1,361 16.6 9,096 1,379 15.2 11.0 1.3Nebraska 21,565 2,737 12.7 26,752 3,079 11.5 24.1 12.5Nevada 10,155 903 8.9 17,917 1,572 8.8 76.4 74.1New Hampshire 14,403 1,834 12.7 17,604 1,627 9.2 22.2 -11.3
New Jersey 67,066 12,775 19.0 86,533 10,045 11.6 29.0 -21.4New Mexico 16,644 2,405 14.4 20,926 2,781 13.3 25.7 15.6New York 235,316 27,935 11.9 291,880 29,805 10.2 24.0 6.7North Carolina 74,512 11,262 15.1 104,412 12,559 12.0 40.1 11.5North Dakota 8,500 1,171 13.8 10,656 1,398 13.1 25.4 19.4See notes at end of table.
All STEM fields
National Center for Education Statistics
All STEM fieldsState All fields
All STEM fieldsAll fields
2000–01 2008–09% change between
2000–01 and 2008–09
Table 1. Number of awards conferred and number, percentage, and percentage change of awards Table 1. conferred in science, technology, engineering, and mathematics (STEM) fields at Title IV Table 1. institutions, by state: Academic years 2000–01 and 2008–09

Number % Number % All fields
Ohio 115,387 15,103 13.1 145,777 16,674 11.4 26.3 10.4Oklahoma 37,955 4,502 11.9 48,532 5,443 11.2 27.9 20.9Oregon 32,538 3,351 10.3 42,724 4,141 9.7 31.3 23.6Pennsylvania 148,281 22,386 15.1 181,505 22,874 12.6 22.4 2.2Rhode Island 16,139 2,005 12.4 19,936 2,098 10.5 23.5 4.6
South Carolina 35,141 4,947 14.1 44,759 4,944 11.0 27.4 -0.1South Dakota 8,177 1,313 16.1 9,638 1,379 14.3 17.9 5.0Tennessee 51,316 5,219 10.2 68,444 6,097 8.9 33.4 16.8Texas 177,352 26,019 14.7 260,853 31,399 12.0 47.1 20.7Utah 35,428 4,370 12.3 45,790 5,221 11.4 29.2 19.5
Vermont 8,120 781 9.6 9,969 1,011 10.1 22.8 29.4Virginia 68,861 10,262 14.9 96,816 12,350 12.8 40.6 20.3Washington 66,846 7,463 11.2 83,900 8,916 10.6 25.5 19.5West Virginia 17,298 2,368 13.7 22,879 2,092 9.1 32.3 -11.7Wisconsin 58,142 8,067 13.9 76,510 8,626 11.3 31.6 6.9Wyoming 5,964 626 10.5 6,784 671 9.9 13.7 7.2
% change between 2000–01 and 2008–09 2008–092000–01
Table 1. Number of awards conferred and number, percentage, and percentage change of awards Table 1. conferred in science, technology, engineering, and mathematics (STEM) fields at Title IV Table 1. institutions, by state: Academic years 2000–01 and 2008–09—Continued
State
SOURCE: U.S. Department of Education, National Center for Education Statistics, Integrated Postsecondary Education Data System (IPEDS), Fall 2001 and Fall 2009, Completions component.
All fieldsAll STEM fields
All fieldsAll STEM fields All STEM
fields
NOTE: Awards conferred include both degrees and certificates. Science, technology, engineering, and mathematics fields includes computer and information sciences, engineering and engineering technologies, biological and biomedical sciences, mathematics and statistics, physical sciences, and science technologies.

United States 385,842 115,552 158,504 67,700 15,935 26,715 1,436
Alabama 5,709 1,536 2,543 1,094 220 274 42Alaska 653 222 263 110 17 41 0Arizona 6,658 1,635 3,559 931 133 400 0Arkansas 3,566 1,583 1,201 490 106 186 0California 41,312 10,210 19,069 7,095 1,965 2,847 126
Colorado 8,098 2,791 2,914 1,464 321 580 28Connecticut 3,468 902 1,223 708 269 358 8Delaware 996 289 371 225 18 89 4District of Columbia 3,146 1,796 594 559 64 133 0Florida 16,036 6,035 6,872 2,057 332 734 6
Georgia 8,942 2,951 3,559 1,541 365 520 6Hawaii 1,173 486 326 238 46 68 9Idaho 1,670 440 701 348 54 127 0Illinois 18,439 6,823 6,577 3,115 799 1,103 22Indiana 8,412 1,606 4,348 1,324 400 699 35
Iowa 4,710 1,256 1,853 1,038 274 281 8Kansas 4,520 1,237 1,856 965 163 283 16Kentucky 3,748 796 1,665 780 197 281 29Louisiana 6,561 2,018 2,591 1,292 201 427 32Maine 1,194 178 472 335 60 144 5
Maryland 8,544 3,189 2,784 1,740 329 502 0Massachusetts 12,819 2,575 5,643 2,404 673 1,471 53Michigan 15,343 2,625 8,895 2,210 515 1,079 19Minnesota 7,654 2,906 2,603 1,230 320 587 8Mississippi 2,835 464 1,210 730 137 294 0
Missouri 8,471 3,124 3,254 1,306 271 502 14Montana 1,361 175 625 333 70 156 2Nebraska 2,737 1,094 898 427 109 196 13Nevada 903 237 376 186 34 70 0New Hampshire 1,834 794 426 406 82 120 6
New Jersey 12,775 6,251 3,613 1,885 410 604 12New Mexico 2,405 561 1,191 345 88 211 9New York 27,935 10,767 9,644 4,385 1,229 1,843 67North Carolina 11,262 3,640 3,755 2,448 543 876 0North Dakota 1,171 265 614 192 27 73 0
National Center for Education StatisticsTable 2a. Number of awards conferred in science, technology, engineering, and mathematics (STEM) Table 2a. fields at Title IV institutions, by field and state: Academic year 2000–01
StateAll STEM
fields
STEM field
See notes at end of table.
Computer and information
sciences
Engineering and engineering
technologies
Biological and biomedical
sciencesMathematics
and statisticsPhysical sciences
Science technologies

Ohio 15,103 3,925 6,922 2,451 629 1,116 60Oklahoma 4,502 1,099 1,971 896 182 341 13Oregon 3,351 609 1,478 725 171 360 8Pennsylvania 22,386 6,803 9,443 3,601 922 1,578 39Rhode Island 2,005 702 687 353 103 149 11
South Carolina 4,947 1,367 1,791 1,216 219 341 13South Dakota 1,313 308 668 230 41 66 0Tennessee 5,219 979 2,365 1,148 273 437 17Texas 26,019 7,157 11,251 4,471 1,081 1,428 631Utah 4,370 1,134 1,667 1,029 172 349 19
Vermont 781 185 223 237 41 93 2Virginia 10,262 2,988 3,885 1,954 449 985 1Washington 7,463 2,028 3,403 1,186 291 546 9West Virginia 2,368 689 1,053 370 76 176 4Wisconsin 8,067 2,020 3,330 1,765 401 521 30Wyoming 626 102 279 132 43 70 0
SOURCE: U.S. Department of Education, National Center for Education Statistics, Integrated Postsecondary Education Data System (IPEDS), Fall 2001, Completions component.
StateAll STEM
fields
STEM field
NOTE: Awards conferred include both degrees and certificates.
Table 2a. Number of awards conferred in science, technology, engineering, and mathematics (STEM) Table 2a. fields at Title IV institutions, by field and state: Academic year 2000–01—Continued
Science technologies
Computer and information
sciences
Engineering and engineering
technologies
Biological and biomedical
sciencesMathematics
and statisticsPhysical sciences

United States 100.0 29.9 41.1 17.5 4.1 6.9 0.4
Alabama 100.0 26.9 44.5 19.2 3.9 4.8 0.7Alaska 100.0 34.0 40.3 16.8 2.6 6.3 0.0Arizona 100.0 24.6 53.5 14.0 2.0 6.0 0.0Arkansas 100.0 44.4 33.7 13.7 3.0 5.2 0.0California 100.0 24.7 46.2 17.2 4.8 6.9 0.3
Colorado 100.0 34.5 36.0 18.1 4.0 7.2 0.3Connecticut 100.0 26.0 35.3 20.4 7.8 10.3 0.2Delaware 100.0 29.0 37.2 22.6 1.8 8.9 0.4District of Columbia 100.0 57.1 18.9 17.8 2.0 4.2 0.0Florida 100.0 37.6 42.9 12.8 2.1 4.6 #
Georgia 100.0 33.0 39.8 17.2 4.1 5.8 0.1Hawaii 100.0 41.4 27.8 20.3 3.9 5.8 0.8Idaho 100.0 26.3 42.0 20.8 3.2 7.6 0.0Illinois 100.0 37.0 35.7 16.9 4.3 6.0 0.1Indiana 100.0 19.1 51.7 15.7 4.8 8.3 0.4
Iowa 100.0 26.7 39.3 22.0 5.8 6.0 0.2Kansas 100.0 27.4 41.1 21.3 3.6 6.3 0.4Kentucky 100.0 21.2 44.4 20.8 5.3 7.5 0.8Louisiana 100.0 30.8 39.5 19.7 3.1 6.5 0.5Maine 100.0 14.9 39.5 28.1 5.0 12.1 0.4
Maryland 100.0 37.3 32.6 20.4 3.9 5.9 0.0Massachusetts 100.0 20.1 44.0 18.8 5.3 11.5 0.4Michigan 100.0 17.1 58.0 14.4 3.4 7.0 0.1Minnesota 100.0 38.0 34.0 16.1 4.2 7.7 0.1Mississippi 100.0 16.4 42.7 25.7 4.8 10.4 0.0
Missouri 100.0 36.9 38.4 15.4 3.2 5.9 0.2Montana 100.0 12.9 45.9 24.5 5.1 11.5 0.1Nebraska 100.0 40.0 32.8 15.6 4.0 7.2 0.5Nevada 100.0 26.2 41.6 20.6 3.8 7.8 0.0New Hampshire 100.0 43.3 23.2 22.1 4.5 6.5 0.3
New Jersey 100.0 48.9 28.3 14.8 3.2 4.7 0.1New Mexico 100.0 23.3 49.5 14.3 3.7 8.8 0.4New York 100.0 38.5 34.5 15.7 4.4 6.6 0.2North Carolina 100.0 32.3 33.3 21.7 4.8 7.8 0.0North Dakota 100.0 22.6 52.4 16.4 2.3 6.2 0.0
National Center for Education StatisticsTable 2b. Percentage distribution of awards conferred in science, technology, engineering, and Table 2b. mathematics (STEM) fields at Title IV institutions, by field and state: Academic year 2000–01
See notes at end of table.
StateAll STEM
fields
STEM field
Computer and information
sciences
Engineering and engineering
technologies
Biological and biomedical
sciencesMathematics
and statisticsPhysical sciences
Science technologies

Ohio 100.0 26.0 45.8 16.2 4.2 7.4 0.4Oklahoma 100.0 24.4 43.8 19.9 4.0 7.6 0.3Oregon 100.0 18.2 44.1 21.6 5.1 10.7 0.2Pennsylvania 100.0 30.4 42.2 16.1 4.1 7.0 0.2Rhode Island 100.0 35.0 34.3 17.6 5.1 7.4 0.5
South Carolina 100.0 27.6 36.2 24.6 4.4 6.9 0.3South Dakota 100.0 23.5 50.9 17.5 3.1 5.0 0.0Tennessee 100.0 18.8 45.3 22.0 5.2 8.4 0.3Texas 100.0 27.5 43.2 17.2 4.2 5.5 2.4Utah 100.0 25.9 38.1 23.5 3.9 8.0 0.4
Vermont 100.0 23.7 28.6 30.3 5.2 11.9 0.3Virginia 100.0 29.1 37.9 19.0 4.4 9.6 #Washington 100.0 27.2 45.6 15.9 3.9 7.3 0.1West Virginia 100.0 29.1 44.5 15.6 3.2 7.4 0.2Wisconsin 100.0 25.0 41.3 21.9 5.0 6.5 0.4Wyoming 100.0 16.3 44.6 21.1 6.9 11.2 0.0
SOURCE: U.S. Department of Education, National Center for Education Statistics, Integrated Postsecondary Education Data System (IPEDS), Fall 2001, Completions component.
StateAll STEM
fields
STEM field
Table 2b. Percentage distribution of awards conferred in science, technology, engineering, and Table 2b. mathematics (STEM) fields at Title IV institutions, by field and state: Academic year Table 2b. 2000–01—Continued
NOTE: Awards conferred include both degrees and certificates. Detail may not sum to totals because of rounding.# Rounds to zero.
Computer and information
sciences
Engineering and engineering
technologies
Biological and biomedical
sciencesMathematics
and statisticsPhysical sciences
Science technologies

United States 433,742 98,561 178,843 96,968 23,421 33,190 2,759
Alabama 6,069 1,033 2,841 1,536 300 351 8Alaska 525 58 259 120 26 62 0Arizona 12,993 6,236 3,359 1,639 234 900 625Arkansas 2,828 612 1,259 614 116 224 3California 47,128 8,794 18,860 12,728 2,929 3,743 74
Colorado 8,881 2,001 3,910 1,795 471 682 22Connecticut 5,108 490 2,356 1,276 486 463 37Delaware 1,079 224 485 233 50 81 6District of Columbia 3,408 1,171 1,199 748 135 155 0Florida 20,036 4,341 10,098 3,820 555 1,068 154
Georgia 12,156 3,766 4,530 2,499 517 784 60Hawaii 1,259 323 357 363 39 112 65Idaho 1,990 375 857 502 92 164 0Illinois 18,504 5,622 6,625 3,547 1,260 1,430 20Indiana 9,517 1,560 4,798 1,806 593 749 11
Iowa 5,373 1,419 2,026 1,229 371 315 13Kansas 3,951 670 1,974 809 152 325 21Kentucky 5,980 1,260 3,057 1,043 248 354 18Louisiana 5,863 1,290 2,518 1,443 227 364 21Maine 1,337 85 558 477 76 134 7
Maryland 10,045 3,241 3,348 2,282 489 622 63Massachusetts 13,997 2,603 5,664 3,315 920 1,425 70Michigan 17,896 3,351 9,460 3,134 765 1,104 82Minnesota 8,029 1,950 2,760 2,066 446 771 36Mississippi 2,989 416 1,172 846 136 419 0
Missouri 8,620 2,027 3,571 2,003 389 593 37Montana 1,379 146 603 358 96 176 0Nebraska 3,079 906 1,043 766 163 193 8Nevada 1,572 375 648 377 65 106 1New Hampshire 1,627 318 673 370 101 161 4
New Jersey 10,045 2,360 3,686 2,463 794 707 35New Mexico 2,781 697 1,221 454 116 271 22New York 29,805 7,074 11,489 6,503 2,352 2,295 92North Carolina 12,559 2,918 4,733 2,980 623 1,188 117North Dakota 1,398 225 759 285 54 75 0
National Center for Education StatisticsTable 2c. Number of awards conferred in science, technology, engineering, and mathematics (STEM) Table 2c. fields at Title IV institutions, by field and state: Academic year 2008–09
See notes at end of table.
StateAll STEM
fields
STEM field
Science technologies
Computer and information
sciences
Engineering and engineering
technologies
Biological and biomedical
sciencesMathematics
and statisticsPhysical sciences

Ohio 16,674 3,672 7,748 3,307 723 1,126 98Oklahoma 5,443 1,242 2,391 1,212 227 369 2Oregon 4,141 787 1,631 1,060 273 390 0Pennsylvania 22,874 5,310 9,343 4,630 1,513 1,993 85Rhode Island 2,098 528 751 466 164 183 6
South Carolina 4,944 976 1,674 1,573 272 427 22South Dakota 1,379 272 679 277 57 93 1Tennessee 6,097 1,108 2,707 1,328 320 607 27Texas 31,399 5,847 13,920 7,424 1,658 1,844 706Utah 5,221 1,313 1,957 1,253 238 434 26
Vermont 1,011 207 322 310 90 82 0Virginia 12,350 3,256 4,972 2,519 529 1,072 2Washington 8,916 2,147 3,458 1,825 397 1,070 19West Virginia 2,092 284 968 537 80 208 15Wisconsin 8,626 1,606 3,245 2,645 458 654 18Wyoming 671 69 321 173 36 72 0
Table 2c. Number of awards conferred in science, technology, engineering, and mathematics (STEM) Table 2c. fields at Title IV institutions, by field and state: Academic year 2008–09—Continued
SOURCE: U.S. Department of Education, National Center for Education Statistics, Integrated Postsecondary Education Data System (IPEDS), Fall 2009, Completions component.
StateAll STEM
fields
STEM field
NOTE: Awards conferred include both degrees and certificates.
Science technologies
Computer and information
sciences
Engineering and engineering
technologies
Biological and biomedical
sciencesMathematics
and statisticsPhysical sciences

United States 100.0 22.7 41.2 22.4 5.4 7.7 0.6
Alabama 100.0 17.0 46.8 25.3 4.9 5.8 0.1Alaska 100.0 11.0 49.3 22.9 5.0 11.8 0.0Arizona 100.0 48.0 25.9 12.6 1.8 6.9 4.8Arkansas 100.0 21.6 44.5 21.7 4.1 7.9 0.1California 100.0 18.7 40.0 27.0 6.2 7.9 0.2
Colorado 100.0 22.5 44.0 20.2 5.3 7.7 0.2Connecticut 100.0 9.6 46.1 25.0 9.5 9.1 0.7Delaware 100.0 20.8 44.9 21.6 4.6 7.5 0.6District of Columbia 100.0 34.4 35.2 21.9 4.0 4.5 0.0Florida 100.0 21.7 50.4 19.1 2.8 5.3 0.8
Georgia 100.0 31.0 37.3 20.6 4.3 6.4 0.5Hawaii 100.0 25.7 28.4 28.8 3.1 8.9 5.2Idaho 100.0 18.8 43.1 25.2 4.6 8.2 0.0Illinois 100.0 30.4 35.8 19.2 6.8 7.7 0.1Indiana 100.0 16.4 50.4 19.0 6.2 7.9 0.1
Iowa 100.0 26.4 37.7 22.9 6.9 5.9 0.2Kansas 100.0 17.0 50.0 20.5 3.8 8.2 0.5Kentucky 100.0 21.1 51.1 17.4 4.1 5.9 0.3Louisiana 100.0 22.0 42.9 24.6 3.9 6.2 0.4Maine 100.0 6.4 41.7 35.7 5.7 10.0 0.5
Maryland 100.0 32.3 33.3 22.7 4.9 6.2 0.6Massachusetts 100.0 18.6 40.5 23.7 6.6 10.2 0.5Michigan 100.0 18.7 52.9 17.5 4.3 6.2 0.5Minnesota 100.0 24.3 34.4 25.7 5.6 9.6 0.4Mississippi 100.0 13.9 39.2 28.3 4.6 14.0 0.0
Missouri 100.0 23.5 41.4 23.2 4.5 6.9 0.4Montana 100.0 10.6 43.7 26.0 7.0 12.8 0.0Nebraska 100.0 29.4 33.9 24.9 5.3 6.3 0.3Nevada 100.0 23.9 41.2 24.0 4.1 6.7 0.1New Hampshire 100.0 19.5 41.4 22.7 6.2 9.9 0.2
New Jersey 100.0 23.5 36.7 24.5 7.9 7.0 0.3New Mexico 100.0 25.1 43.9 16.3 4.2 9.7 0.8New York 100.0 23.7 38.5 21.8 7.9 7.7 0.3North Carolina 100.0 23.2 37.7 23.7 5.0 9.5 0.9North Dakota 100.0 16.1 54.3 20.4 3.9 5.4 0.0
National Center for Education StatisticsTable 2d. Percentage distribution of awards conferred in science, technology, engineering, and Table 2d. mathematics (STEM) fields at Title IV institutions, by field and state: Academic year 2008–09
See notes at end of table.
Mathematics and statistics
Physical sciences
Science technologiesState
All STEM fields
STEM field
Computer and information
sciences
Engineering and engineering
technologies
Biological and biomedical
sciences

Ohio 100.0 22.0 46.5 19.8 4.3 6.8 0.6Oklahoma 100.0 22.8 43.9 22.3 4.2 6.8 #Oregon 100.0 19.0 39.4 25.6 6.6 9.4 0.0Pennsylvania 100.0 23.2 40.8 20.2 6.6 8.7 0.4Rhode Island 100.0 25.2 35.8 22.2 7.8 8.7 0.3
South Carolina 100.0 19.7 33.9 31.8 5.5 8.6 0.4South Dakota 100.0 19.7 49.2 20.1 4.1 6.7 0.1Tennessee 100.0 18.2 44.4 21.8 5.2 10.0 0.4Texas 100.0 18.6 44.3 23.6 5.3 5.9 2.2Utah 100.0 25.1 37.5 24.0 4.6 8.3 0.5
Vermont 100.0 20.5 31.8 30.7 8.9 8.1 0.0Virginia 100.0 26.4 40.3 20.4 4.3 8.7 #Washington 100.0 24.1 38.8 20.5 4.5 12.0 0.2West Virginia 100.0 13.6 46.3 25.7 3.8 9.9 0.7Wisconsin 100.0 18.6 37.6 30.7 5.3 7.6 0.2Wyoming 100.0 10.3 47.8 25.8 5.4 10.7 0.0
Table 2d. Percentage distribution of awards conferred in science, technology, engineering, and Table 2d. mathematics (STEM) fields at Title IV institutions, by field and state: Academic year Table 2d. 2008–09—Continued
NOTE: Awards conferred include both degrees and certificates. Detail may not sum to totals because of rounding.# Rounds to zero.
SOURCE: U.S. Department of Education, National Center for Education Statistics, Integrated Postsecondary Education Data System (IPEDS), Fall 2009, Completions component.
StateAll STEM
fields
STEM field
Computer and information
sciences
Engineering and engineering
technologies
Biological and biomedical
sciencesMathematics
and statisticsPhysical sciences
Science technologies

United States 12.4 -14.7 12.8 43.2 47.0 24.2 92.1
Alabama 6.3 -32.7 11.7 40.4 36.4 28.1 -81.0Alaska -19.6 -73.9 -1.5 9.1 52.9 51.2 †Arizona 95.1 281.4 -5.6 76.0 75.9 125.0 †Arkansas -20.7 -61.3 4.8 25.3 9.4 20.4 †California 14.1 -13.9 -1.1 79.4 49.1 31.5 -41.3
Colorado 9.7 -28.3 34.2 22.6 46.7 17.6 -21.4Connecticut 47.3 -45.7 92.6 80.2 80.7 29.3 362.5Delaware 8.3 -22.5 30.7 3.6 177.8 -9.0 50.0District of Columbia 8.3 -34.8 101.9 33.8 110.9 16.5 †Florida 24.9 -28.1 46.9 85.7 67.2 45.5 2,467.0
Georgia 35.9 27.6 27.3 62.2 41.6 50.8 900.0Hawaii 7.3 -33.5 9.5 52.5 -15.2 64.7 622.2Idaho 19.2 -14.8 22.3 44.3 70.4 29.1 †Illinois 0.4 -17.6 0.7 13.9 57.7 29.6 -9.1Indiana 13.1 -2.9 10.3 36.4 48.3 7.2 -68.6
Iowa 14.1 13.0 9.3 18.4 35.4 12.1 62.5Kansas -12.6 -45.8 6.4 -16.2 -6.7 14.8 31.3Kentucky 59.6 58.3 83.6 33.7 25.9 26.0 -37.9Louisiana -10.6 -36.1 -2.8 11.7 12.9 -14.8 -34.4Maine 12.0 -52.2 18.2 42.4 26.7 -6.9 40.0
Maryland 17.6 1.6 20.3 31.1 48.6 23.9 †Massachusetts 9.2 1.1 0.4 37.9 36.7 -3.1 32.1Michigan 16.6 27.7 6.4 41.8 48.5 2.3 331.6Minnesota 4.9 -32.9 6.0 68.0 39.4 31.3 350.0Mississippi 5.4 -10.3 -3.1 15.9 -0.7 42.5 †
Missouri 1.8 -35.1 9.7 53.4 43.5 18.1 164.3Montana 1.3 -16.6 -3.5 7.5 37.1 12.8 -100.0Nebraska 12.5 -17.2 16.1 79.4 49.5 -1.5 -38.5Nevada 74.1 58.2 72.3 102.7 91.2 51.4 †New Hampshire -11.3 -59.9 58.0 -8.9 23.2 34.2 -33.3
New Jersey -21.4 -62.2 2.0 30.7 93.7 17.1 191.7New Mexico 15.6 24.2 2.5 31.6 31.8 28.4 144.4New York 6.7 -34.3 19.1 48.3 91.4 24.5 37.3North Carolina 11.5 -19.8 26.0 21.7 14.7 35.6 †North Dakota 19.4 -15.1 23.6 48.4 100.0 2.7 †
StateAll STEM
fields
STEM field
Science technologies
National Center for Education Statistics
See notes at end of table.
Table 2e. Percentage change in number of awards conferred in science, technology, engineering, and Table 2e. mathematics (STEM) fields at Title IV institutions, by field and state: Academic years 2000–01 Table 2e. and 2008–09
Computer and information
sciences
Engineering and engineering
technologies
Biological and biomedical
sciencesMathematics
and statisticsPhysical sciences
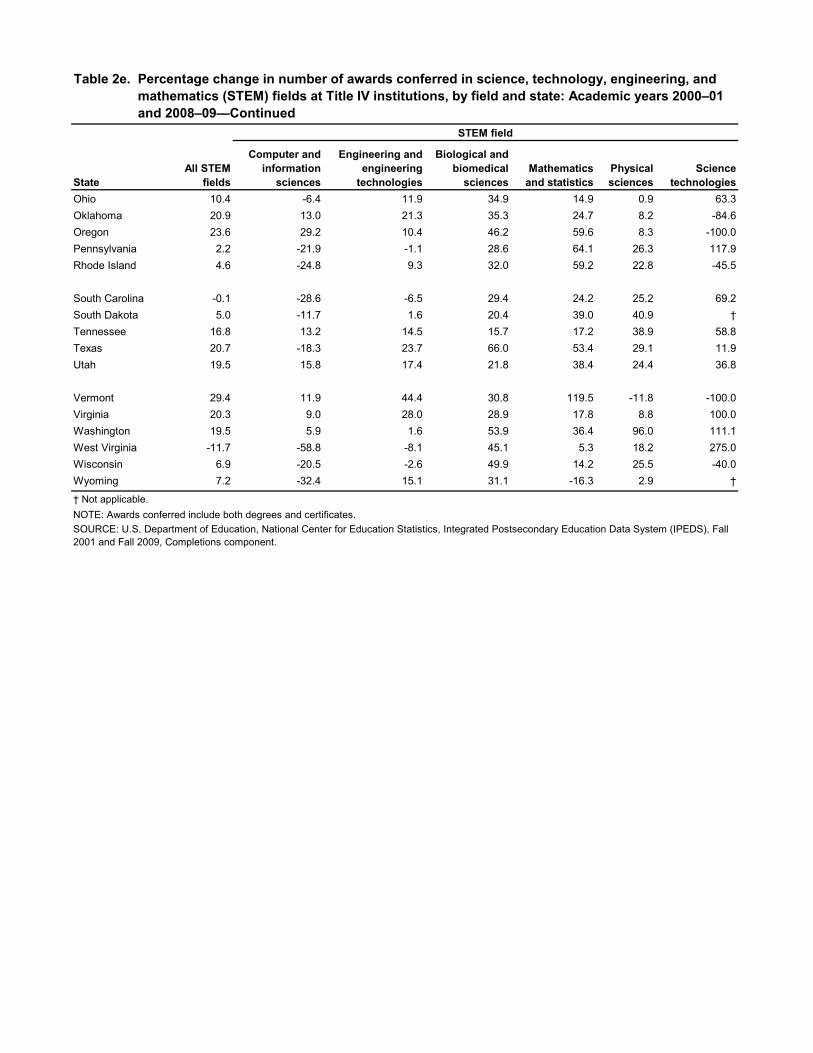
Ohio 10.4 -6.4 11.9 34.9 14.9 0.9 63.3Oklahoma 20.9 13.0 21.3 35.3 24.7 8.2 -84.6Oregon 23.6 29.2 10.4 46.2 59.6 8.3 -100.0Pennsylvania 2.2 -21.9 -1.1 28.6 64.1 26.3 117.9Rhode Island 4.6 -24.8 9.3 32.0 59.2 22.8 -45.5
South Carolina -0.1 -28.6 -6.5 29.4 24.2 25.2 69.2South Dakota 5.0 -11.7 1.6 20.4 39.0 40.9 †Tennessee 16.8 13.2 14.5 15.7 17.2 38.9 58.8Texas 20.7 -18.3 23.7 66.0 53.4 29.1 11.9Utah 19.5 15.8 17.4 21.8 38.4 24.4 36.8
Vermont 29.4 11.9 44.4 30.8 119.5 -11.8 -100.0Virginia 20.3 9.0 28.0 28.9 17.8 8.8 100.0Washington 19.5 5.9 1.6 53.9 36.4 96.0 111.1West Virginia -11.7 -58.8 -8.1 45.1 5.3 18.2 275.0Wisconsin 6.9 -20.5 -2.6 49.9 14.2 25.5 -40.0Wyoming 7.2 -32.4 15.1 31.1 -16.3 2.9 †
SOURCE: U.S. Department of Education, National Center for Education Statistics, Integrated Postsecondary Education Data System (IPEDS), Fall 2001 and Fall 2009, Completions component.
StateAll STEM
fields
STEM field
NOTE: Awards conferred include both degrees and certificates.† Not applicable.
Table 2e. Percentage change in number of awards conferred in science, technology, engineering, and Table 2e. mathematics (STEM) fields at Title IV institutions, by field and state: Academic years 2000–01 Table 2e. and 2008–09—Continued
Computer and information
sciences
Engineering and engineering
technologies
Biological and biomedical
sciencesMathematics
and statisticsPhysical sciences
Science technologies

United States 65,360 64,256 -1.7 194,597 233,299 19.9 55,300 73,155 32.3 15,133 22,082 45.9
Alabama 1,183 729 -38.4 3,242 3,655 12.7 652 1,079 65.5 181 293 61.9Alaska 130 71 -45.4 197 273 38.6 81 94 16.0 19 19 0.0Arizona 1,473 4,861 230.0 3,075 4,994 62.4 760 1,159 52.5 250 443 77.2Arkansas 372 416 11.8 1,372 1,501 9.4 194 255 31.4 38 77 102.6California 4,962 5,318 7.2 19,184 25,236 31.5 5,951 8,748 47.0 1,879 2,943 56.6
Colorado 874 825 -5.6 4,279 5,579 30.4 1,442 1,481 2.7 327 392 19.9Connecticut 286 289 1.0 1,637 2,509 53.3 784 1,584 102.0 187 273 46.0Delaware 170 157 -7.6 524 611 16.6 130 186 43.1 69 99 43.5District of Columbia 147 107 -27.2 1,305 1,347 3.2 1,285 1,358 5.7 148 164 10.8Florida 3,769 2,477 -34.3 6,819 10,318 51.3 2,071 3,027 46.2 423 763 80.4
Georgia 410 1,161 183.2 5,187 6,196 19.5 1,424 1,949 36.9 377 766 103.2Hawaii 272 283 4.0 586 709 21.0 248 159 -35.9 46 63 37.0Idaho 550 306 -44.4 745 1,228 64.8 165 218 32.1 32 47 46.9Illinois 2,282 1,689 -26.0 9,449 9,655 2.2 3,206 4,466 39.3 836 994 18.9Indiana 1,745 1,658 -5.0 4,934 5,710 15.7 943 1,103 17.0 401 630 57.1
Iowa 874 978 11.9 2,765 3,199 15.7 500 673 34.6 235 313 33.2Kansas 746 446 -40.2 2,289 2,250 -1.7 551 557 1.1 130 147 13.1Kentucky 734 830 13.1 2,063 2,438 18.2 506 714 41.1 72 182 152.8Louisiana 1,284 755 -41.2 3,477 3,111 -10.5 692 686 -0.9 197 214 8.6Maine 214 181 -15.4 845 1,024 21.2 77 77 0.0 17 24 41.2
Maryland 530 761 43.6 4,540 5,174 14.0 1,964 2,501 27.3 420 636 51.4Massachusetts 1,173 1,078 -8.1 6,981 7,771 11.3 2,879 3,083 7.1 951 1,357 42.7Michigan 2,632 2,995 13.8 8,190 9,472 15.7 2,742 2,999 9.4 573 852 48.7Minnesota 1,560 1,441 -7.6 3,679 4,770 29.7 499 1,080 116.4 237 233 -1.7Mississippi 678 691 1.9 1,730 1,696 -2.0 352 492 39.8 57 97 70.2
Missouri 1,723 1,371 -20.4 4,667 4,976 6.6 970 1,326 36.7 235 312 32.8Montana 163 104 -36.2 983 1,057 7.5 166 153 -7.8 25 43 72.0Nebraska 887 597 -32.7 1,264 1,676 32.6 253 393 55.3 49 110 124.5Nevada 198 336 69.7 480 860 79.2 146 220 50.7 29 90 210.3New Hampshire 282 216 -23.4 1,005 966 -3.9 260 317 21.9 65 95 46.2
New Jersey 1,236 963 -22.1 4,889 5,262 7.6 1,709 2,064 20.8 447 483 8.1New Mexico 653 494 -24.3 1,130 1,251 10.7 380 506 33.2 96 161 67.7New York 6,143 3,991 -35.0 13,695 16,259 18.7 4,701 6,871 46.2 1,144 1,618 41.4North Carolina 2,333 1,587 -32.0 5,778 6,896 19.3 1,308 1,839 40.6 506 750 48.2North Dakota 299 296 -1.0 748 867 15.9 92 140 52.2 17 46 170.6
National Center for Education Statistics
Associate's Bachelor's Master's
Table 3. Number and percentage change in degrees awarded in science, technology, engineering, and Table 3. mathematics (STEM) fields at Title IV institutions, by level of degree and state: Academic years Table 3. 2000–01 and 2008–09
2000–01
2008–09
% change
2000–01
2008–09
% change
2000–01
2008–09State
Level of degreeDoctor's
See notes at end of table.
% change
2000–01
2008–09
% change

Ohio 3,139 3,483 11.0 7,585 8,411 10.9 2,123 2,318 9.2 648 811 25.2Oklahoma 752 927 23.3 2,302 2,606 13.2 698 696 -0.3 128 177 38.3Oregon 623 570 -8.5 2,014 2,593 28.7 472 517 9.5 137 194 41.6Pennsylvania 3,514 3,296 -6.2 11,188 13,550 21.1 2,426 3,806 56.9 774 1,208 56.1Rhode Island 478 438 -8.4 1,069 1,211 13.3 222 267 20.3 101 131 29.7
South Carolina 763 662 -13.2 2,619 2,991 14.2 605 504 -16.7 135 217 60.7South Dakota 268 251 -6.3 789 893 13.2 198 194 -2.0 17 25 47.1Tennessee 738 1,071 45.1 3,056 3,567 16.7 694 723 4.2 233 322 38.2Texas 5,546 5,517 -0.5 11,875 14,755 24.3 3,763 5,423 44.1 1,017 1,567 54.1Utah 794 680 -14.4 2,678 3,509 31.0 487 620 27.3 155 246 58.7
Vermont 163 92 -43.6 493 693 40.6 92 191 107.6 31 30 -3.2Virginia 1,574 2,906 84.6 5,596 6,345 13.4 1,433 2,369 65.3 358 493 37.7Washington 1,615 1,820 12.7 3,276 4,474 36.6 785 840 7.0 289 368 27.3West Virginia 435 244 -43.9 1,244 1,383 11.2 276 273 -1.1 39 53 35.9Wisconsin 1,807 1,669 -7.6 4,790 5,472 14.2 833 780 -6.4 333 483 45.0Wyoming 184 172 -6.5 290 350 20.7 110 77 -30.0 23 28 21.7
SOURCE: U.S. Department of Education, National Center for Education Statistics, Integrated Postsecondary Education Data System (IPEDS), Fall 2001 and Fall 2009, Completions component.
State
Level of degreeAssociate's Bachelor's Master's Doctor's
NOTE: Science, technology, engineering, and mathematics fields includes computer and information sciences, engineering and engineering technologies, biological and biomedical sciences, mathematics and statistics, physical sciences, and science technologies.
Table 3. Number and percentage change in degrees awarded in science, technology, engineering, and Table 3. mathematics (STEM) fields at Title IV institutions, by level of degree and state: Academic years Table 3. 2000–01 and 2008–09—Continued
2000–01
2008–09
% change
2000–01
2008–09
% change
2000–01
2008–09
% change
2000–01
2008–09
% change

United States 28,497 21,692 -23.9 23,849 15,183 -36.3 1,821 1,657 -9.0 1,285 2,418 88.2
Alabama 294 195 -33.7 151 111 -26.5 6 0 -100.0 0 7 †Alaska 193 5 -97.4 33 63 90.9 0 0 † 0 0 †Arizona 696 1,050 50.9 402 483 20.1 2 3 50.0 0 0 †Arkansas 456 331 -27.4 1,133 248 -78.1 1 0 -100.0 0 0 †California 5,656 3,133 -44.6 3,430 1,401 -59.2 92 3 -96.7 158 346 119.0
Colorado 314 434 38.2 514 109 -78.8 0 0 † 348 61 -82.5Connecticut 138 176 27.5 384 142 -63.0 0 0 † 52 135 159.6Delaware 79 7 -91.1 24 19 -20.8 0 0 † 0 0 †District of Columbia 80 73 -8.8 163 6 -96.3 0 2 † 18 351 1,850.0Florida 1,305 2,144 64.3 1,488 860 -42.2 160 441 175.6 1 6 500.0
Georgia 1,077 1,377 27.9 418 411 -1.7 49 289 489.8 0 7 †Hawaii 6 25 316.7 15 12 -20.0 0 3 † 0 5 †Idaho 15 16 6.7 80 46 -42.5 83 127 53.0 0 2 †Illinois 1,454 1,043 -28.3 1,184 644 -45.6 0 0 † 28 13 -53.6Indiana 119 166 39.5 267 178 -33.3 0 0 † 3 72 2,300.0
Iowa 191 86 -55.0 139 101 -27.3 0 0 † 6 23 283.3Kansas 414 185 -55.3 330 354 7.3 60 0 -100.0 0 12 †Kentucky 74 1,647 2,125.7 220 151 -31.4 79 1 -98.7 0 17 †Louisiana 403 531 31.8 403 565 40.2 92 0 -100.0 13 1 -92.3Maine 1 0 -100.0 34 29 -14.7 6 0 -100.0 0 2 †
Maryland 279 74 -73.5 580 478 -17.6 129 181 40.3 102 240 135.3Massachusetts 527 351 -33.4 130 331 154.6 137 0 -100.0 41 26 -36.6Michigan 532 786 47.7 599 729 21.7 58 7 -87.9 17 56 229.4Minnesota 695 216 -68.9 859 125 -85.4 120 136 13.3 5 28 460.0Mississippi 0 0 † 14 13 -7.1 4 0 -100.0 0 0 †
Missouri 167 124 -25.7 660 278 -57.9 23 15 -34.8 26 218 738.5Montana 1 0 -100.0 23 22 -4.3 0 0 † 0 0 †Nebraska 169 228 34.9 115 74 -35.7 0 0 † 0 1 †Nevada 25 21 -16.0 25 33 32.0 0 12 † 0 0 †New Hampshire 201 25 -87.6 13 1 -92.3 0 0 † 8 7 -12.5
New Jersey 1,514 176 -88.4 2,711 1,013 -62.6 202 42 -79.2 67 42 -37.3New Mexico 35 68 94.3 95 235 147.4 16 58 262.5 0 8 †New York 1,378 140 -89.8 608 562 -7.6 14 0 -100.0 252 364 44.4North Carolina 1,146 1,287 12.3 185 200 8.1 0 0 † 6 0 -100.0North Dakota 8 12 50.0 7 37 428.6 0 0 † 0 0 †See notes at end of table.
Level of certificate
2000–01
2008–09
% change
National Center for Education Statistics
Less than 1 yearAt least 1 year but less
than 2 yearsAt least 2 years but less
than 4 years Advanced1
Table 4. Number and percentage change in certificates awarded in science, technology, engineering, Table 4. and mathematics (STEM) fields at Title IV institutions, by level of certificate and state: Academic Table 4. years 2000–01 and 2008–09
State2000–01
2008–09
% change
2000–01
2008–09
% change
2000–01
2008–09
% change

Ohio 1,029 799 -22.4 579 837 44.6 0 2 † 0 13 †Oklahoma 95 197 107.4 485 613 26.4 42 213 407.1 0 14 †Oregon 29 110 279.3 70 117 67.1 6 3 -50.0 0 37 †Pennsylvania 3,880 215 -94.5 574 709 23.5 22 6 -72.7 8 84 950.0Rhode Island 0 0 † 134 51 -61.9 0 0 † 1 0 -100.0
South Carolina 794 552 -30.5 31 14 -54.8 0 0 † 0 4 †South Dakota 0 16 † 13 0 -100.0 28 0 -100.0 0 0 †Tennessee 55 140 154.5 416 199 -52.2 27 49 81.5 0 26 †Texas 1,790 2,365 32.1 1,907 1,690 -11.4 120 16 -86.7 1 66 6,500.0Utah 118 51 -56.8 138 113 -18.1 0 0 † 0 2 †
Vermont 0 5 † 2 0 -100.0 0 0 † 0 0 †Virginia 236 10 -95.8 898 126 -86.0 52 0 -100.0 115 101 -12.2Washington 608 907 49.2 690 444 -35.7 191 48 -74.9 9 15 66.7West Virginia 121 45 -62.8 253 93 -63.2 0 0 † 0 1 †Wisconsin 91 127 39.6 213 90 -57.7 0 0 † 0 5 †Wyoming 9 21 133.3 10 23 130.0 0 0 † 0 0 †
1Advanced certificates include the post-baccalaureate, post-masters, and first-professional certificate levels.
Table 4. Number and percentage change in certificates awarded in science, technology, engineering, Table 4. and mathematics (STEM) fields at Title IV institutions, by level of certificate and state: Academic Table 4. years 2000–01 and 2008–09—Continued
2008–09
% change
2000–01
2008–09
% change
NOTE: Science, technology, engineering, and mathematics fields include computer and information sciences, engineering and engineering technologies, biological and biomedical sciences, mathematics and statistics, physical sciences, and science technologies.SOURCE: U.S. Department of Education, National Center for Education Statistics, Integrated Postsecondary Education Data System (IPEDS), Fall 2001 and Fall 2009, Completions component.
Level of certificate
Less than 1 yearAt least 1 year but less
than 2 yearsAt least 2 years but less
than 4 years Advanced1
† Not applicable.
State2000–01
2008–09
% change
2000–01
2008–09
% change
2000–01
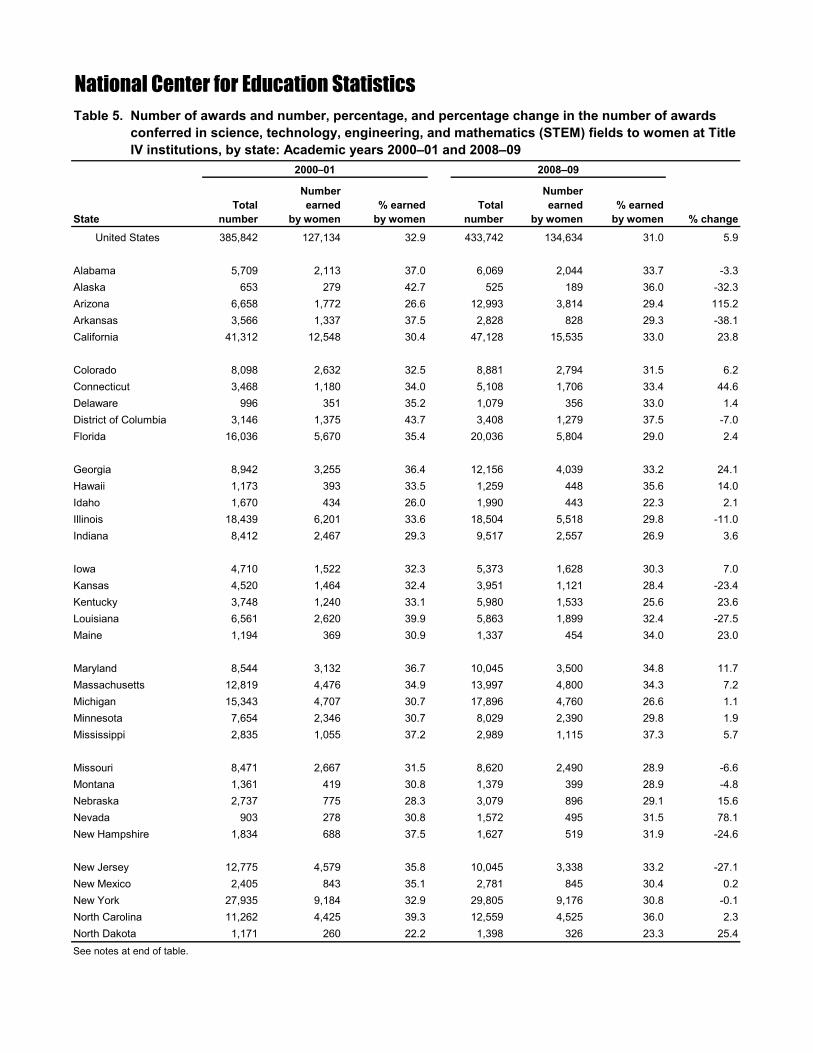
United States 385,842 127,134 32.9 433,742 134,634 31.0 5.9
Alabama 5,709 2,113 37.0 6,069 2,044 33.7 -3.3Alaska 653 279 42.7 525 189 36.0 -32.3Arizona 6,658 1,772 26.6 12,993 3,814 29.4 115.2Arkansas 3,566 1,337 37.5 2,828 828 29.3 -38.1California 41,312 12,548 30.4 47,128 15,535 33.0 23.8
Colorado 8,098 2,632 32.5 8,881 2,794 31.5 6.2Connecticut 3,468 1,180 34.0 5,108 1,706 33.4 44.6Delaware 996 351 35.2 1,079 356 33.0 1.4District of Columbia 3,146 1,375 43.7 3,408 1,279 37.5 -7.0Florida 16,036 5,670 35.4 20,036 5,804 29.0 2.4
Georgia 8,942 3,255 36.4 12,156 4,039 33.2 24.1Hawaii 1,173 393 33.5 1,259 448 35.6 14.0Idaho 1,670 434 26.0 1,990 443 22.3 2.1Illinois 18,439 6,201 33.6 18,504 5,518 29.8 -11.0Indiana 8,412 2,467 29.3 9,517 2,557 26.9 3.6
Iowa 4,710 1,522 32.3 5,373 1,628 30.3 7.0Kansas 4,520 1,464 32.4 3,951 1,121 28.4 -23.4Kentucky 3,748 1,240 33.1 5,980 1,533 25.6 23.6Louisiana 6,561 2,620 39.9 5,863 1,899 32.4 -27.5Maine 1,194 369 30.9 1,337 454 34.0 23.0
Maryland 8,544 3,132 36.7 10,045 3,500 34.8 11.7Massachusetts 12,819 4,476 34.9 13,997 4,800 34.3 7.2Michigan 15,343 4,707 30.7 17,896 4,760 26.6 1.1Minnesota 7,654 2,346 30.7 8,029 2,390 29.8 1.9Mississippi 2,835 1,055 37.2 2,989 1,115 37.3 5.7
Missouri 8,471 2,667 31.5 8,620 2,490 28.9 -6.6Montana 1,361 419 30.8 1,379 399 28.9 -4.8Nebraska 2,737 775 28.3 3,079 896 29.1 15.6Nevada 903 278 30.8 1,572 495 31.5 78.1New Hampshire 1,834 688 37.5 1,627 519 31.9 -24.6
New Jersey 12,775 4,579 35.8 10,045 3,338 33.2 -27.1New Mexico 2,405 843 35.1 2,781 845 30.4 0.2New York 27,935 9,184 32.9 29,805 9,176 30.8 -0.1North Carolina 11,262 4,425 39.3 12,559 4,525 36.0 2.3North Dakota 1,171 260 22.2 1,398 326 23.3 25.4
National Center for Education Statistics
2000–01 2008–09
Number earned
by women% earned
by women
Table 5. Number of awards and number, percentage, and percentage change in the number of awards Table 5. conferred in science, technology, engineering, and mathematics (STEM) fields to women at Title Table 5. IV institutions, by state: Academic years 2000–01 and 2008–09
See notes at end of table.
StateTotal
number
Number earned
by women% earned
by womenTotal
number % change

Ohio 15,103 4,819 31.9 16,674 4,701 28.2 -2.4Oklahoma 4,502 1,411 31.3 5,443 1,590 29.2 12.7Oregon 3,351 1,057 31.5 4,141 1,240 29.9 17.3Pennsylvania 22,386 6,790 30.3 22,874 7,128 31.2 5.0Rhode Island 2,005 629 31.4 2,098 647 30.8 2.9
South Carolina 4,947 1,931 39.0 4,944 1,897 38.4 -1.8South Dakota 1,313 394 30.0 1,379 385 27.9 -2.3Tennessee 5,219 1,816 34.8 6,097 1,846 30.3 1.7Texas 26,019 8,229 31.6 31,399 9,668 30.8 17.5Utah 4,370 958 21.9 5,221 1,090 20.9 13.8
Vermont 781 292 37.4 1,011 297 29.4 1.7Virginia 10,262 3,803 37.1 12,350 4,220 34.2 11.0Washington 7,463 2,457 32.9 8,916 2,780 31.2 13.1West Virginia 2,368 710 30.0 2,092 591 28.3 -16.8Wisconsin 8,067 2,581 32.0 8,626 2,787 32.3 8.0Wyoming 626 201 32.1 671 204 30.4 1.5
SOURCE: U.S. Department of Education, National Center for Education Statistics, Integrated Postsecondary Education Data System (IPEDS), Fall 2001 and Fall 2009, Completions component.
Table 5. Number of awards and number, percentage, and percentage change in the number of awards Table 5. conferred in science, technology, engineering, and mathematics (STEM) fields to women at Title Table 5. IV institutions, by state: Academic years 2000–01 and 2008–09—Continued
State
2000–01 2008–09
NOTE: Awards conferred include both degrees and certificates. Science, technology, engineering, and mathematics fields include computer and information sciences, engineering and engineering technologies, biological and biomedical sciences, mathematics and statistics, physical sciences, and science technologies.
Total number
Number earned
by women% earned
by womenTotal
number
Number earned
by women% earned
by women % change

United States 127,134 40,695 28,860 39,591 7,205 10,267 516
Alabama 2,113 648 578 667 117 100 3Alaska 279 116 69 74 4 16 0Arizona 1,772 463 549 559 52 149 0Arkansas 1,337 776 185 250 51 75 0California 12,548 2,996 3,497 4,165 795 1,039 56
Colorado 2,632 809 568 889 143 209 14Connecticut 1,180 250 239 415 145 128 3Delaware 351 105 72 126 9 36 3District of Columbia 1,375 804 138 340 31 62 0Florida 5,670 2,711 1,262 1,247 155 292 3
Georgia 3,255 1,093 837 936 167 218 4Hawaii 393 157 70 122 20 22 2Idaho 434 97 104 174 18 41 0Illinois 6,201 2,523 1,113 1,745 367 443 10Indiana 2,467 504 733 767 168 274 21
Iowa 1,522 391 325 592 112 96 6Kansas 1,464 457 281 549 67 106 4Kentucky 1,240 310 299 432 101 95 3Louisiana 2,620 1,080 480 774 96 189 1Maine 369 47 55 196 20 47 4
Maryland 3,132 1,140 621 1,043 151 177 0Massachusetts 4,476 748 1,235 1,499 315 645 34Michigan 4,707 994 1,713 1,313 252 427 8Minnesota 2,346 807 456 731 141 208 3Mississippi 1,055 179 215 451 78 132 0
Missouri 2,667 1,033 552 751 120 201 10Montana 419 51 102 174 28 62 2Nebraska 775 311 111 231 44 67 11Nevada 278 73 73 97 12 23 0New Hampshire 688 278 65 248 42 50 5
New Jersey 4,579 2,215 730 1,161 212 252 9New Mexico 843 248 257 216 40 76 6New York 9,184 3,689 1,774 2,494 536 646 45North Carolina 4,425 1,601 747 1,468 243 366 0North Dakota 260 69 69 91 9 22 0
National Center for Education Statistics
StateAll STEM
fields
STEM field
Table 6a. Number of awards conferred in science, technology, engineering, and mathematics (STEM) Table 6a. fields to women at Title IV institutions, by field and state: Academic year 2000–01
See notes at end of table.
Computer and information
sciences
Engineering and engineering
technologies
Biological and biomedical
sciencesMathematics
and statisticsPhysical sciences
Science technologies

Ohio 4,819 1,485 1,110 1,443 287 453 41Oklahoma 1,411 374 348 471 89 128 1Oregon 1,057 137 271 443 79 123 4Pennsylvania 6,790 2,166 1,500 2,078 429 601 16Rhode Island 629 204 105 216 46 53 5
South Carolina 1,931 589 318 772 107 139 6South Dakota 394 100 119 124 22 29 0Tennessee 1,816 347 470 659 128 198 14Texas 8,229 2,432 2,097 2,540 526 509 125Utah 958 215 192 387 62 99 3
Vermont 292 54 34 152 20 30 2Virginia 3,803 1,129 736 1,250 228 459 1Washington 2,457 743 656 738 126 191 3West Virginia 710 259 137 207 34 71 2Wisconsin 2,581 645 538 1,057 144 174 23Wyoming 201 43 55 67 17 19 0
SOURCE: U.S. Department of Education, National Center for Education Statistics, Integrated Postsecondary Education Data System (IPEDS), Fall 2001, Completions component.
Table 6a. Number of awards conferred in science, technology, engineering, and mathematics (STEM) Table 6a. fields to women at Title IV institutions, by field and state: Academic year 2000–01—Continued
StateAll STEM
fields
STEM field
NOTE: Awards conferred include both degrees and certificates.
Computer and information
sciences
Engineering and engineering
technologies
Biological and biomedical
sciencesMathematics
and statisticsPhysical sciences
Science technologies

United States 32.9 35.2 18.2 58.5 45.2 38.4 35.9
Alabama 37.0 42.2 22.7 61.0 53.2 36.5 7.1Alaska 42.7 52.3 26.2 67.3 23.5 39.0 †Arizona 26.6 28.3 15.4 60.0 39.1 37.3 †Arkansas 37.5 49.0 15.4 51.0 48.1 40.3 †California 30.4 29.3 18.3 58.7 40.5 36.5 44.4
Colorado 32.5 29.0 19.5 60.7 44.5 36.0 50.0Connecticut 34.0 27.7 19.5 58.6 53.9 35.8 37.5Delaware 35.2 36.3 19.4 56.0 50.0 40.4 75.0District of Columbia 43.7 44.8 23.2 60.8 48.4 46.6 †Florida 35.4 44.9 18.4 60.6 46.7 39.8 50.0
Georgia 36.4 37.0 23.5 60.7 45.8 41.9 66.7Hawaii 33.5 32.3 21.5 51.3 43.5 32.4 22.2Idaho 26.0 22.0 14.8 50.0 33.3 32.3 †Illinois 33.6 37.0 16.9 56.0 45.9 40.2 45.5Indiana 29.3 31.4 16.9 57.9 42.0 39.2 60.0
Iowa 32.3 31.1 17.5 57.0 40.9 34.2 75.0Kansas 32.4 36.9 15.1 56.9 41.1 37.5 25.0Kentucky 33.1 38.9 18.0 55.4 51.3 33.8 10.3Louisiana 39.9 53.5 18.5 59.9 47.8 44.3 3.1Maine 30.9 26.4 11.7 58.5 33.3 32.6 80.0
Maryland 36.7 35.7 22.3 59.9 45.9 35.3 †Massachusetts 34.9 29.0 21.9 62.4 46.8 43.8 64.2Michigan 30.7 37.9 19.3 59.4 48.9 39.6 42.1Minnesota 30.7 27.8 17.5 59.4 44.1 35.4 37.5Mississippi 37.2 38.6 17.8 61.8 56.9 44.9 †
Missouri 31.5 33.1 17.0 57.5 44.3 40.0 71.4Montana 30.8 29.1 16.3 52.3 40.0 39.7 100.0Nebraska 28.3 28.4 12.4 54.1 40.4 34.2 84.6Nevada 30.8 30.8 19.4 52.2 35.3 32.9 †New Hampshire 37.5 35.0 15.3 61.1 51.2 41.7 83.3
New Jersey 35.8 35.4 20.2 61.6 51.7 41.7 75.0New Mexico 35.1 44.2 21.6 62.6 45.5 36.0 66.7New York 32.9 34.3 18.4 56.9 43.6 35.1 67.2North Carolina 39.3 44.0 19.9 60.0 44.8 41.8 †North Dakota 22.2 26.0 11.2 47.4 33.3 30.1 †
National Center for Education Statistics
State
STEM field
All STEM fields
See notes at end of table.
Table 6b. Percentage of awards conferred in science, technology, engineering, and mathematics (STEM)Table 6b. fields to women at Title IV institutions, by field and state: Academic year 2000–01
Computer and information
sciences
Engineering and engineering
technologies
Biological and biomedical
sciencesMathematics
and statisticsPhysical sciences
Science technologies
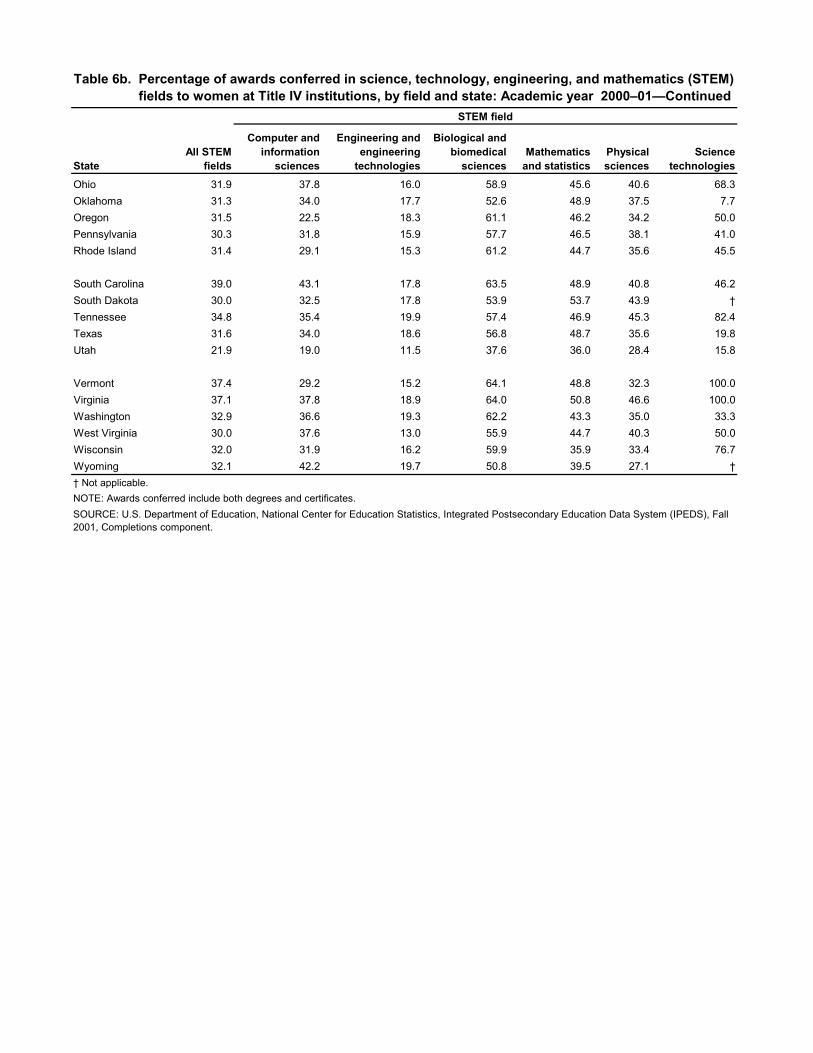
Ohio 31.9 37.8 16.0 58.9 45.6 40.6 68.3Oklahoma 31.3 34.0 17.7 52.6 48.9 37.5 7.7Oregon 31.5 22.5 18.3 61.1 46.2 34.2 50.0Pennsylvania 30.3 31.8 15.9 57.7 46.5 38.1 41.0Rhode Island 31.4 29.1 15.3 61.2 44.7 35.6 45.5
South Carolina 39.0 43.1 17.8 63.5 48.9 40.8 46.2South Dakota 30.0 32.5 17.8 53.9 53.7 43.9 †Tennessee 34.8 35.4 19.9 57.4 46.9 45.3 82.4Texas 31.6 34.0 18.6 56.8 48.7 35.6 19.8Utah 21.9 19.0 11.5 37.6 36.0 28.4 15.8
Vermont 37.4 29.2 15.2 64.1 48.8 32.3 100.0Virginia 37.1 37.8 18.9 64.0 50.8 46.6 100.0Washington 32.9 36.6 19.3 62.2 43.3 35.0 33.3West Virginia 30.0 37.6 13.0 55.9 44.7 40.3 50.0Wisconsin 32.0 31.9 16.2 59.9 35.9 33.4 76.7Wyoming 32.1 42.2 19.7 50.8 39.5 27.1 †
SOURCE: U.S. Department of Education, National Center for Education Statistics, Integrated Postsecondary Education Data System (IPEDS), Fall 2001, Completions component.
Table 6b. Percentage of awards conferred in science, technology, engineering, and mathematics (STEM) Table 6b. fields to women at Title IV institutions, by field and state: Academic year 2000–01—Continued
† Not applicable.
StateAll STEM
fields
STEM field
NOTE: Awards conferred include both degrees and certificates.
Computer and information
sciences
Engineering and engineering
technologies
Biological and biomedical
sciencesMathematics
and statisticsPhysical sciences
Science technologies

United States 134,634 22,924 30,913 57,152 9,735 12,939 971
Alabama 2,044 275 516 954 145 153 1Alaska 189 8 67 75 8 31 0Arizona 3,814 1,789 518 937 95 333 142Arkansas 828 135 193 348 62 89 1California 15,535 1,666 3,681 7,558 1,162 1,428 40
Colorado 2,794 479 745 1,133 179 258 0Connecticut 1,706 106 389 776 228 196 11Delaware 356 50 115 137 22 29 3District of Columbia 1,279 400 317 438 64 60 0Florida 5,804 1,013 1,703 2,345 213 444 86
Georgia 4,039 1,016 877 1,532 231 339 44Hawaii 448 75 70 218 18 51 16Idaho 443 47 135 197 21 43 0Illinois 5,518 1,307 1,125 2,029 522 522 13Indiana 2,557 292 760 1,032 205 260 8
Iowa 1,628 361 305 679 173 106 4Kansas 1,121 131 315 473 73 124 5Kentucky 1,533 263 404 608 97 155 6Louisiana 1,899 377 398 878 89 156 1Maine 454 16 52 297 28 57 4
Maryland 3,500 871 757 1,419 207 215 31Massachusetts 4,800 560 1,177 2,040 396 589 38Michigan 4,760 765 1,430 1,834 289 425 17Minnesota 2,390 358 376 1,198 159 280 19Mississippi 1,115 110 209 526 78 192 0
Missouri 2,490 412 610 1,060 154 238 16Montana 399 26 97 189 34 53 0Nebraska 896 216 128 404 67 78 3Nevada 495 88 132 211 22 41 1New Hampshire 519 63 118 228 52 55 3
New Jersey 3,338 464 701 1,496 371 302 4New Mexico 845 161 250 273 38 109 14New York 9,176 1,559 1,991 3,770 981 839 36North Carolina 4,525 810 922 1,900 287 529 77North Dakota 326 55 79 145 26 21 0See notes at end of table.
National Center for Education StatisticsTable 6c. Number of awards conferred in science, technology, engineering, and mathematics (STEM) Table 6c. fields to women at Title IV institutions, by field and state: Academic year 2008–09
All STEM fieldsState
STEM field
Computer and information
sciences
Engineering and engineering
technologies
Biological and biomedical
sciencesMathematics
and statisticsPhysical sciences
Science technologies

Ohio 4,701 917 1,125 1,869 284 453 53Oklahoma 1,590 314 354 702 75 144 1Oregon 1,240 123 251 615 95 156 0Pennsylvania 7,128 1,250 1,595 2,823 633 779 48Rhode Island 647 98 107 300 66 76 0
South Carolina 1,897 272 285 1,033 116 183 8South Dakota 385 72 95 154 24 39 1Tennessee 1,846 209 474 773 135 242 13Texas 9,668 1,277 2,409 4,369 747 700 166Utah 1,090 170 234 431 97 148 10
Vermont 297 30 41 160 44 22 0Virginia 4,220 927 969 1,567 255 501 1Washington 2,780 515 659 1,071 149 373 13West Virginia 591 75 103 287 45 80 1Wisconsin 2,787 338 488 1,562 165 222 12Wyoming 204 13 62 99 9 21 0
SOURCE: U.S. Department of Education, National Center for Education Statistics, Integrated Postsecondary Education Data System (IPEDS), Fall 2009, Completions component.
Table 6c. Number of awards conferred in science, technology, engineering, and mathematics (STEM) Table 6c. fields to women at Title IV institutions, by field and state: Academic year 2008–09—Continued
StateAll STEM
fields
STEM field
NOTE: Awards conferred include both degrees and certificates.
Computer and information
sciences
Engineering and engineering
technologies
Biological and biomedical
sciencesMathematics
and statisticsPhysical sciences
Science technologies

United States 31.0 23.3 17.3 58.9 41.6 39.0 35.2
Alabama 33.7 26.6 18.2 62.1 48.3 43.6 12.5Alaska 36.0 13.8 25.9 62.5 30.8 50.0 †Arizona 29.4 28.7 15.4 57.2 40.6 37.0 22.7Arkansas 29.3 22.1 15.3 56.7 53.4 39.7 33.3California 33.0 18.9 19.5 59.4 39.7 38.2 54.1
Colorado 31.5 23.9 19.1 63.1 38.0 37.8 0.0Connecticut 33.4 21.6 16.5 60.8 46.9 42.3 29.7Delaware 33.0 22.3 23.7 58.8 44.0 35.8 50.0District of Columbia 37.5 34.2 26.4 58.6 47.4 38.7 †Florida 29.0 23.3 16.9 61.4 38.4 41.6 55.8
Georgia 33.2 27.0 19.4 61.3 44.7 43.2 73.3Hawaii 35.6 23.2 19.6 60.1 46.2 45.5 24.6Idaho 22.3 12.5 15.8 39.2 22.8 26.2 †Illinois 29.8 23.2 17.0 57.2 41.4 36.5 65.0Indiana 26.9 18.7 15.8 57.1 34.6 34.7 72.7
Iowa 30.3 25.4 15.1 55.2 46.6 33.7 30.8Kansas 28.4 19.6 16.0 58.5 48.0 38.2 23.8Kentucky 25.6 20.9 13.2 58.3 39.1 43.8 33.3Louisiana 32.4 29.2 15.8 60.8 39.2 42.9 4.8Maine 34.0 18.8 9.3 62.3 36.8 42.5 57.1
Maryland 34.8 26.9 22.6 62.2 42.3 34.6 49.2Massachusetts 34.3 21.5 20.8 61.5 43.0 41.3 54.3Michigan 26.6 22.8 15.1 58.5 37.8 38.5 20.7Minnesota 29.8 18.4 13.6 58.0 35.7 36.3 52.8Mississippi 37.3 26.4 17.8 62.2 57.4 45.8 †
Missouri 28.9 20.3 17.1 52.9 39.6 40.1 43.2Montana 28.9 17.8 16.1 52.8 35.4 30.1 †Nebraska 29.1 23.8 12.3 52.7 41.1 40.4 37.5Nevada 31.5 23.5 20.4 56.0 33.8 38.7 100.0New Hampshire 31.9 19.8 17.5 61.6 51.5 34.2 75.0
New Jersey 33.2 19.7 19.0 60.7 46.7 42.7 11.4New Mexico 30.4 23.1 20.5 60.1 32.8 40.2 63.6New York 30.8 22.0 17.3 58.0 41.7 36.6 39.1North Carolina 36.0 27.8 19.5 63.8 46.1 44.5 65.8North Dakota 23.3 24.4 10.4 50.9 48.1 28.0 †
National Center for Education Statistics
StateAll STEM
fields
STEM field
Table 6d. Percentage of awards conferred in science, technology, engineering, and mathematics (STEM) Table 6d. fields to women at Title IV institutions, by field and state: Academic year 2008–09
Computer and information
sciences
Engineering and engineering
technologies
Biological and biomedical
sciencesMathematics
and statisticsPhysical sciences
Science technologies
See notes at end of table.

Ohio 28.2 25.0 14.5 56.5 39.3 40.2 54.1Oklahoma 29.2 25.3 14.8 57.9 33.0 39.0 50.0Oregon 29.9 15.6 15.4 58.0 34.8 40.0 †Pennsylvania 31.2 23.5 17.1 61.0 41.8 39.1 56.5Rhode Island 30.8 18.6 14.2 64.4 40.2 41.5 0.0
South Carolina 38.4 27.9 17.0 65.7 42.6 42.9 36.4South Dakota 27.9 26.5 14.0 55.6 42.1 41.9 100.0Tennessee 30.3 18.9 17.5 58.2 42.2 39.9 48.1Texas 30.8 21.8 17.3 58.8 45.1 38.0 23.5Utah 20.9 12.9 12.0 34.4 40.8 34.1 38.5
Vermont 29.4 14.5 12.7 51.6 48.9 26.8 †Virginia 34.2 28.5 19.5 62.2 48.2 46.7 50.0Washington 31.2 24.0 19.1 58.7 37.5 34.9 68.4West Virginia 28.3 26.4 10.6 53.4 56.3 38.5 6.7Wisconsin 32.3 21.0 15.0 59.1 36.0 33.9 66.7Wyoming 30.4 18.8 19.3 57.2 25.0 29.2 †† Not applicable.
SOURCE: U.S. Department of Education, National Center for Education Statistics, Integrated Postsecondary Education Data System (IPEDS), Fall 2009, Completions component.
StateAll STEM
fields
STEM field
Table 6d. Percentage of awards conferred in science, technology, engineering, and mathematics (STEM) Table 6d. fields to women at Title IV institutions, by field and state: Academic year 2008–09—Continued
NOTE: Awards conferred include both degrees and certificates.
Computer and information
sciences
Engineering and engineering
technologies
Biological and biomedical
sciencesMathematics
and statisticsPhysical sciences
Science technologies

United States 5.9 -43.7 7.1 44.4 35.1 26.0 88.2
Alabama -3.3 -57.6 -10.7 43.0 23.9 53.0 -66.7Alaska -32.3 -93.1 -2.9 1.4 100.0 93.8 †Arizona 115.2 286.4 -5.7 67.6 82.7 123.5 †Arkansas -38.1 -82.6 4.3 39.2 21.6 18.7 †California 23.8 -44.4 5.3 81.5 46.2 37.4 -28.6
Colorado 6.2 -40.8 31.2 27.5 25.2 23.4 -100.0Connecticut 44.6 -57.6 62.8 87.0 57.2 53.1 266.7Delaware 1.4 -52.4 59.7 8.7 144.4 -19.4 0.0District of Columbia -7.0 -50.3 129.7 28.8 106.5 -3.2 †Florida 2.4 -62.6 34.9 88.1 37.4 52.1 2,767.0
Georgia 24.1 -7.0 4.8 63.7 38.3 55.5 1,000.0Hawaii 14.0 -52.2 0.0 78.7 -10.0 131.8 700.0Idaho 2.1 -51.6 29.8 13.2 16.7 4.9 †Illinois -11.0 -48.2 1.1 16.3 42.2 17.8 30.0Indiana 3.7 -42.1 3.7 34.6 22.0 -5.1 -61.9
Iowa 7.0 -7.7 -6.2 14.7 54.5 10.4 -33.3Kansas -23.4 -71.3 12.1 -13.8 9.0 17.0 25.0Kentucky 23.6 -15.2 35.1 40.7 -4.0 63.2 100.0Louisiana -27.5 -65.1 -17.1 13.4 -7.3 -17.5 0.0Maine 23.0 -66.0 -5.5 51.5 40.0 21.3 0.0
Maryland 11.8 -23.6 21.9 36.1 37.1 21.5 †Massachusetts 7.2 -25.1 -4.7 36.1 25.7 -8.7 11.8Michigan 1.1 -23.0 -16.5 39.7 14.7 -0.5 112.5Minnesota 1.9 -55.6 -17.5 63.9 12.8 34.6 533.3Mississippi 5.7 -38.6 -2.8 16.6 0.0 45.5 †
Missouri -6.6 -60.1 10.5 41.2 28.3 18.4 60.0Montana -4.8 -49.0 -4.9 8.6 21.4 -14.5 -100.0Nebraska 15.6 -30.6 15.3 74.9 52.3 16.4 -72.7Nevada 78.1 20.6 80.8 117.5 83.3 78.3 †New Hampshire -24.6 -77.3 81.5 -8.1 23.8 10.0 -40.0
New Jersey -27.1 -79.1 -4.0 28.9 75.0 19.8 -55.6New Mexico 0.2 -35.1 -2.7 26.4 -5.0 43.4 133.3New York -0.1 -57.7 12.2 51.2 83.0 29.9 -20.0North Carolina 2.3 -49.4 23.4 29.4 18.1 44.5 †North Dakota 25.4 -20.3 14.5 59.3 188.9 -4.6 †
See notes at end of table.
National Center for Education Statistics
STEM field
Table 6e. Percentage change in number of awards conferred in science, technology, engineering, and Table 6e. mathematics (STEM) fields to women at Title IV institutions, by field and state: Academic years Table 6e. 2000–01 and 2008–09
All STEM fieldsState
Computer and information
sciences
Engineering and engineering
technologies
Biological and biomedical
sciencesMathematics
and statisticsPhysical sciences
Science technologies

Ohio -2.5 -38.3 1.4 29.5 -1.1 0.0 29.3Oklahoma 12.7 -16.0 1.7 49.0 -15.7 12.5 0.0Oregon 17.3 -10.2 -7.4 38.8 20.3 26.8 -100.0Pennsylvania 5.0 -42.3 6.3 35.9 47.6 29.6 200.0Rhode Island 2.9 -52.0 1.9 38.9 43.5 43.4 -100.0
South Carolina -1.8 -53.8 -10.4 33.8 8.4 31.7 33.3South Dakota -2.3 -28.0 -20.2 24.2 9.1 34.5 †Tennessee 1.7 -39.8 0.9 17.3 5.5 22.2 -7.1Texas 17.5 -47.5 14.9 72.0 42.0 37.5 32.8Utah 13.8 -20.9 21.9 11.4 56.5 49.5 233.3
Vermont 1.7 -44.4 20.6 5.3 120.0 -26.7 -100.0Virginia 11.0 -17.9 31.7 25.4 11.8 9.2 0.0Washington 13.2 -30.7 0.5 45.1 18.3 95.3 333.3West Virginia -16.8 -71.0 -24.8 38.7 32.4 12.7 -50.0Wisconsin 8.0 -47.6 -9.3 47.8 14.6 27.6 -47.8Wyoming 1.5 -69.8 12.7 47.8 -47.1 10.5 †
SOURCE: U.S. Department of Education, National Center for Education Statistics, Integrated Postsecondary Education Data System (IPEDS), Fall 2001 and Fall 2009, Completions component.
† Not applicable.
Table 6e. Percentage change in number of awards conferred in science, technology, engineering, and Table 6e. mathematics (STEM) fields to women at Title IV institutions, by field and state: Academic years Table 6e. 2000–01 and 2008–09—Continued
StateAll STEM
fields
STEM field
NOTE: Awards conferred include both degrees and certificates.
Computer and information
sciences
Engineering and engineering
technologies
Biological and biomedical
sciencesMathematics
and statisticsPhysical sciences
Science technologies

United States 19,027 14,131 -25.7 69,900 81,876 17.1 17,133 22,335 30.4 4,146 7,417 78.9
Alabama 443 169 -61.9 1,272 1,405 10.5 213 297 39.4 60 106 76.7Alaska 37 21 -43.2 93 105 12.9 28 32 14.3 12 8 -33.3Arizona 283 1,397 393.6 1,012 1,563 54.4 210 369 75.7 59 135 128.8Arkansas 127 93 -26.8 484 529 9.3 64 89 39.1 11 32 190.9California 1,280 1,539 20.2 6,859 9,252 34.9 1,822 2,626 44.1 500 935 87.0
Colorado 226 195 -13.7 1,548 1,809 16.9 446 452 1.3 97 131 35.1Connecticut 80 41 -48.8 617 1,018 65.0 263 433 64.6 63 118 87.3Delaware 58 42 -27.6 214 210 -1.9 37 67 81.1 15 30 100.0District of Columbia 86 47 -45.3 605 567 -6.3 517 491 -5.0 48 70 45.8Florida 1,374 545 -60.3 2,397 3,550 48.1 577 857 48.5 96 228 137.5
Georgia 128 308 140.6 2,024 2,315 14.4 480 551 14.8 101 272 169.3Hawaii 77 52 -32.5 207 287 38.6 89 65 -27.0 13 19 46.2Idaho 126 52 -58.7 241 289 19.9 39 58 48.7 3 13 333.3Illinois 699 339 -51.5 3,299 3,157 -4.3 953 1,364 43.1 236 324 37.3Indiana 457 293 -35.9 1,525 1,648 8.1 262 333 27.1 91 183 101.1
Iowa 262 190 -27.5 958 1,103 15.1 140 186 32.9 68 104 52.9Kansas 328 127 -61.3 739 689 -6.8 145 161 11.0 34 49 44.1Kentucky 230 149 -35.2 726 845 16.4 155 231 49.0 20 82 310.0Louisiana 480 159 -66.9 1,356 1,225 -9.7 243 202 -16.9 51 69 35.3Maine 45 32 -28.9 288 381 32.3 22 26 18.2 6 13 116.7
Maryland 180 236 31.1 1,827 1,855 1.5 684 893 30.6 126 225 78.6Massachusetts 326 194 -40.5 2,661 3,052 14.7 917 1,010 10.1 248 457 84.3Michigan 861 576 -33.1 2,680 2,817 5.1 747 901 20.6 156 259 66.0Minnesota 390 220 -43.6 1,296 1,715 32.3 157 284 80.9 68 75 10.3Mississippi 180 176 -2.2 698 717 2.7 153 195 27.5 14 21 50.0
Missouri 485 201 -58.6 1,605 1,652 2.9 238 381 60.1 74 119 60.8Montana 38 22 -42.1 315 309 -1.9 56 46 -17.9 5 15 200.0Nebraska 211 85 -59.7 391 531 35.8 78 142 82.1 12 38 216.7Nevada 35 74 111.4 163 295 81.0 55 85 54.5 6 27 350.0New Hampshire 74 30 -59.5 404 337 -16.6 105 110 4.8 21 34 61.9
New Jersey 343 199 -42.0 1,971 2,075 5.3 560 660 17.9 155 163 5.2New Mexico 259 146 -43.6 408 425 4.2 107 144 34.6 26 48 84.6New York 1,769 689 -61.1 4,892 5,598 14.4 1,458 2,113 44.9 299 569 90.3North Carolina 839 410 -51.1 2,439 2,840 16.4 458 619 35.2 181 308 70.2North Dakota 65 34 -47.7 166 240 44.6 20 36 80.0 5 9 80.0
Table 7. Number and percentage change in degrees awarded in science, technology, engineering, and Table 7. mathematics (STEM) fields to women at Title IV institutions, by level of degree and state: Table 7. Academic years 2000–01 and 2008–09
See notes at end of table.
2000–01
2008–09
% change
National Center for Education Statistics
State
Associate's Bachelor's Master's Doctor'sLevel of degree
2000–01
2008–09
% change
2000–01
2008–09
% change
2000–01
2008–09
% change

Ohio 851 569 -33.1 2,630 2,726 3.7 646 699 8.2 162 271 67.3Oklahoma 217 200 -7.8 748 885 18.3 213 183 -14.1 32 58 81.3Oregon 138 102 -26.1 706 848 20.1 133 146 9.8 46 58 26.1Pennsylvania 725 632 -12.8 3,884 4,650 19.7 782 1,199 53.3 205 393 91.7Rhode Island 108 51 -52.8 383 440 14.9 71 92 29.6 34 52 52.9
South Carolina 286 147 -48.6 1,155 1,363 18.0 164 179 9.1 30 70 133.3South Dakota 82 44 -46.3 239 263 10.0 62 60 -3.2 4 14 250.0Tennessee 207 174 -15.9 1,137 1,241 9.1 220 231 5.0 71 114 60.6Texas 1,577 1,358 -13.9 4,336 5,460 25.9 1,100 1,624 47.6 259 524 102.3Utah 188 101 -46.3 584 738 26.4 110 142 29.1 33 71 115.2
Vermont 35 14 -60.0 209 234 12.0 32 31 -3.1 14 15 7.1Virginia 602 882 46.5 2,198 2,488 13.2 477 615 28.9 98 163 66.3Washington 449 400 -10.9 1,194 1,565 31.1 261 282 8.0 79 151 91.1West Virginia 102 41 -59.8 376 410 9.0 84 91 8.3 11 12 9.1Wisconsin 506 290 -42.7 1,655 2,049 23.8 253 226 -10.7 84 149 77.4Wyoming 73 44 -39.7 86 111 29.1 27 26 -3.7 4 14 250.0
SOURCE: U.S. Department of Education, National Center for Education Statistics, Integrated Postsecondary Education Data System (IPEDS), Fall 2001 and Fall 2009, Completions component.
Table 7. Number and percentage change in degrees awarded in science, technology, engineering, and Table 7. mathematics (STEM) fields to women at Title IV institutions, by level of degree and state: Table 7. Academic years 2000–01 and 2008–09—Continued
Level of degree
State
Associate's Bachelor's Master's Doctor's
NOTE: Science, technology, engineering, and mathematics fields includes computer and information sciences, engineering and engineering technologies, biological and biomedical sciences, mathematics and statistics, physical sciences, and science technologies.
2000–01
2008–09
% change
2000–01
2008–09
% change
2000–01
2008–09
% change
2000–01
2008–09
% change
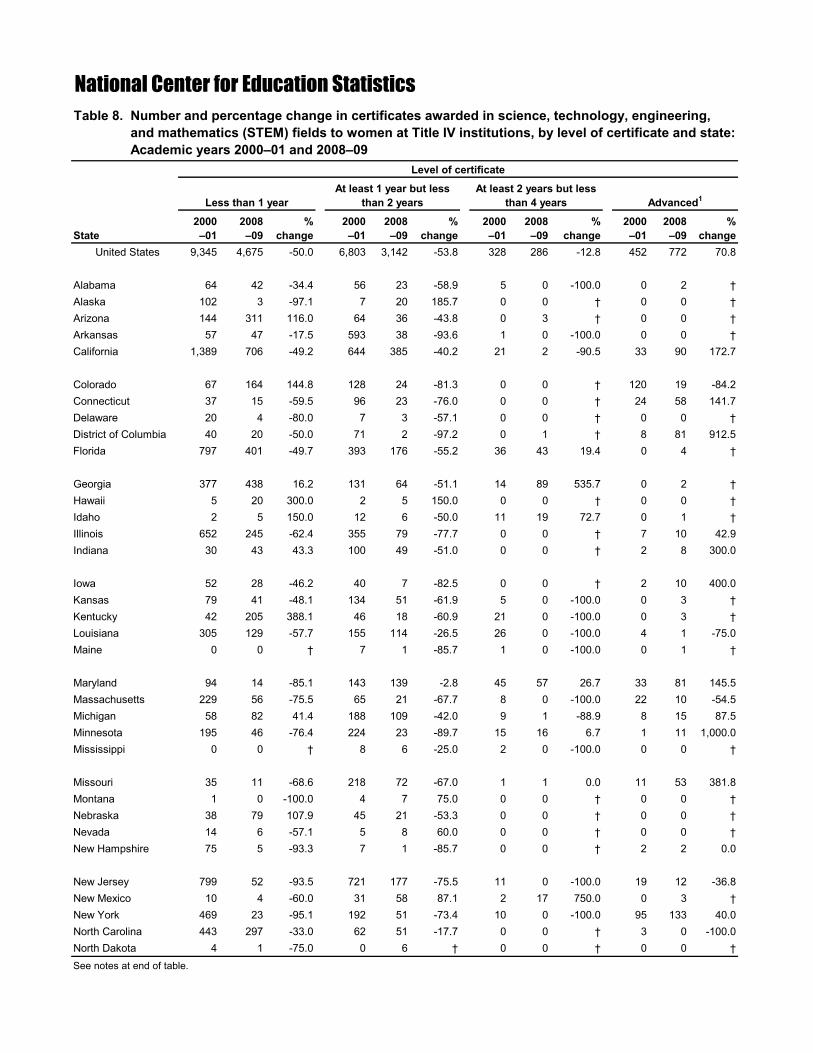
United States 9,345 4,675 -50.0 6,803 3,142 -53.8 328 286 -12.8 452 772 70.8
Alabama 64 42 -34.4 56 23 -58.9 5 0 -100.0 0 2 †Alaska 102 3 -97.1 7 20 185.7 0 0 † 0 0 †Arizona 144 311 116.0 64 36 -43.8 0 3 † 0 0 †Arkansas 57 47 -17.5 593 38 -93.6 1 0 -100.0 0 0 †California 1,389 706 -49.2 644 385 -40.2 21 2 -90.5 33 90 172.7
Colorado 67 164 144.8 128 24 -81.3 0 0 † 120 19 -84.2Connecticut 37 15 -59.5 96 23 -76.0 0 0 † 24 58 141.7Delaware 20 4 -80.0 7 3 -57.1 0 0 † 0 0 †District of Columbia 40 20 -50.0 71 2 -97.2 0 1 † 8 81 912.5Florida 797 401 -49.7 393 176 -55.2 36 43 19.4 0 4 †
Georgia 377 438 16.2 131 64 -51.1 14 89 535.7 0 2 †Hawaii 5 20 300.0 2 5 150.0 0 0 † 0 0 †Idaho 2 5 150.0 12 6 -50.0 11 19 72.7 0 1 †Illinois 652 245 -62.4 355 79 -77.7 0 0 † 7 10 42.9Indiana 30 43 43.3 100 49 -51.0 0 0 † 2 8 300.0
Iowa 52 28 -46.2 40 7 -82.5 0 0 † 2 10 400.0Kansas 79 41 -48.1 134 51 -61.9 5 0 -100.0 0 3 †Kentucky 42 205 388.1 46 18 -60.9 21 0 -100.0 0 3 †Louisiana 305 129 -57.7 155 114 -26.5 26 0 -100.0 4 1 -75.0Maine 0 0 † 7 1 -85.7 1 0 -100.0 0 1 †
Maryland 94 14 -85.1 143 139 -2.8 45 57 26.7 33 81 145.5Massachusetts 229 56 -75.5 65 21 -67.7 8 0 -100.0 22 10 -54.5Michigan 58 82 41.4 188 109 -42.0 9 1 -88.9 8 15 87.5Minnesota 195 46 -76.4 224 23 -89.7 15 16 6.7 1 11 1,000.0Mississippi 0 0 † 8 6 -25.0 2 0 -100.0 0 0 †
Missouri 35 11 -68.6 218 72 -67.0 1 1 0.0 11 53 381.8Montana 1 0 -100.0 4 7 75.0 0 0 † 0 0 †Nebraska 38 79 107.9 45 21 -53.3 0 0 † 0 0 †Nevada 14 6 -57.1 5 8 60.0 0 0 † 0 0 †New Hampshire 75 5 -93.3 7 1 -85.7 0 0 † 2 2 0.0
New Jersey 799 52 -93.5 721 177 -75.5 11 0 -100.0 19 12 -36.8New Mexico 10 4 -60.0 31 58 87.1 2 17 750.0 0 3 †New York 469 23 -95.1 192 51 -73.4 10 0 -100.0 95 133 40.0North Carolina 443 297 -33.0 62 51 -17.7 0 0 † 3 0 -100.0North Dakota 4 1 -75.0 0 6 † 0 0 † 0 0 †See notes at end of table.
State
Level of certificate
Less than 1 yearAt least 1 year but less
than 2 yearsAt least 2 years but less
than 4 years Advanced1
2000–01
2008–09
% change
2000–01
% change
2000–01
2008–09
% change
National Center for Education Statistics
2000–01
2008–09
% change
2008–09
Table 8. Number and percentage change in certificates awarded in science, technology, engineering, Table 8. and mathematics (STEM) fields to women at Title IV institutions, by level of certificate and state: Table 8. Academic years 2000–01 and 2008–09
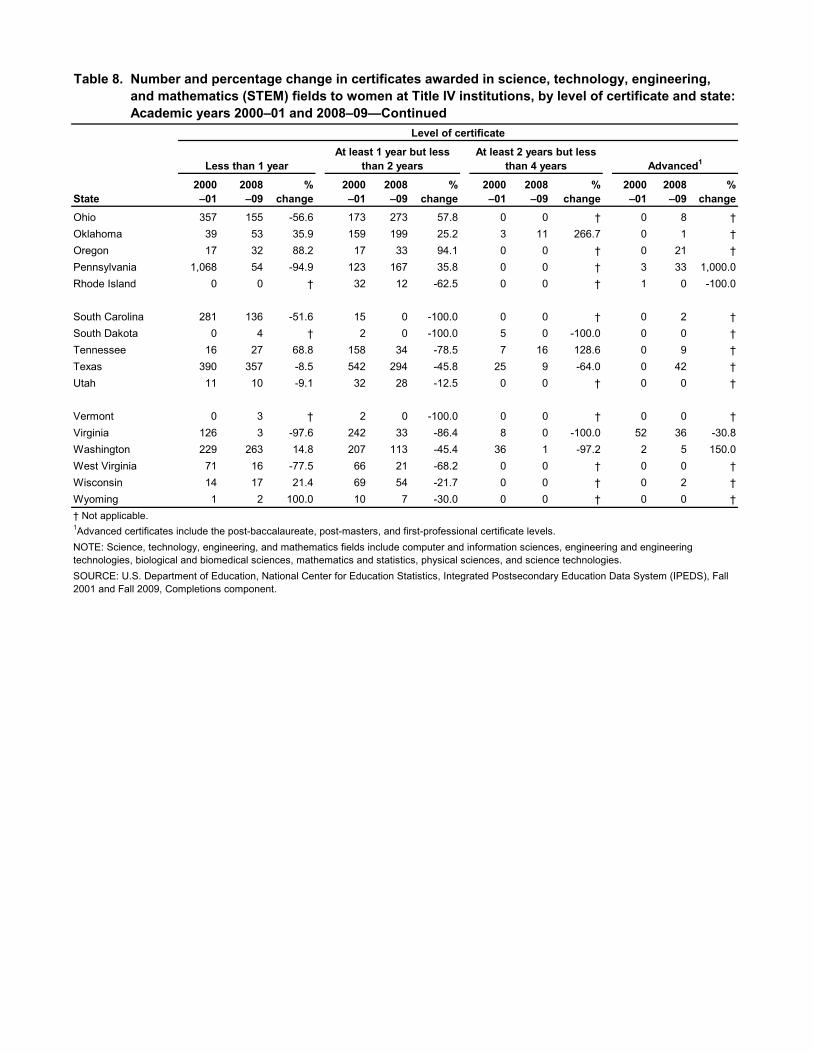
Ohio 357 155 -56.6 173 273 57.8 0 0 † 0 8 †Oklahoma 39 53 35.9 159 199 25.2 3 11 266.7 0 1 †Oregon 17 32 88.2 17 33 94.1 0 0 † 0 21 †Pennsylvania 1,068 54 -94.9 123 167 35.8 0 0 † 3 33 1,000.0Rhode Island 0 0 † 32 12 -62.5 0 0 † 1 0 -100.0
South Carolina 281 136 -51.6 15 0 -100.0 0 0 † 0 2 †South Dakota 0 4 † 2 0 -100.0 5 0 -100.0 0 0 †Tennessee 16 27 68.8 158 34 -78.5 7 16 128.6 0 9 †Texas 390 357 -8.5 542 294 -45.8 25 9 -64.0 0 42 †Utah 11 10 -9.1 32 28 -12.5 0 0 † 0 0 †
Vermont 0 3 † 2 0 -100.0 0 0 † 0 0 †Virginia 126 3 -97.6 242 33 -86.4 8 0 -100.0 52 36 -30.8Washington 229 263 14.8 207 113 -45.4 36 1 -97.2 2 5 150.0West Virginia 71 16 -77.5 66 21 -68.2 0 0 † 0 0 †Wisconsin 14 17 21.4 69 54 -21.7 0 0 † 0 2 †Wyoming 1 2 100.0 10 7 -30.0 0 0 † 0 0 †
NOTE: Science, technology, engineering, and mathematics fields include computer and information sciences, engineering and engineering technologies, biological and biomedical sciences, mathematics and statistics, physical sciences, and science technologies.SOURCE: U.S. Department of Education, National Center for Education Statistics, Integrated Postsecondary Education Data System (IPEDS), Fall 2001 and Fall 2009, Completions component.
Level of certificate
Less than 1 yearAt least 1 year but less
than 2 yearsAt least 2 years but less
than 4 years Advanced1
1Advanced certificates include the post-baccalaureate, post-masters, and first-professional certificate levels.† Not applicable.
2000–01
2008–09
% change
2000–01
2008–09
% change
2000–01State
Table 8. Number and percentage change in certificates awarded in science, technology, engineering, Table 8. and mathematics (STEM) fields to women at Title IV institutions, by level of certificate and state: Table 8. Academic years 2000–01 and 2008–09—Continued
2008–09
% change
2000–01
2008–09
% change

United States 19,027 11,560 5,448 932 244 508 335
Alabama 443 328 113 0 0 0 2Alaska 37 6 31 0 0 0 0Arizona 283 97 169 7 2 8 0Arkansas 127 67 60 0 0 0 0California 1,280 301 482 246 111 112 28
Colorado 226 164 62 0 0 0 0Connecticut 80 20 54 0 0 3 3Delaware 58 37 18 0 0 0 3District of Columbia 86 83 3 0 0 0 0Florida 1,374 1,079 292 0 0 0 3
Georgia 128 96 26 3 0 0 3Hawaii 77 35 38 0 4 0 0Idaho 126 46 42 22 9 7 0Illinois 699 546 150 0 0 0 3Indiana 457 263 163 2 2 6 21
Iowa 262 182 74 0 0 0 6Kansas 328 104 43 157 6 14 4Kentucky 230 172 55 0 0 0 3Louisiana 480 387 88 4 0 1 0Maine 45 22 15 0 0 4 4
Maryland 180 107 71 0 2 0 0Massachusetts 326 175 125 12 0 0 14Michigan 861 380 276 59 6 134 6Minnesota 390 242 148 0 0 0 0Mississippi 180 80 66 30 4 0 0
Missouri 485 359 118 1 1 0 6Montana 38 22 14 0 0 0 2Nebraska 211 158 42 3 0 0 8Nevada 35 18 13 2 2 0 0New Hampshire 74 58 12 0 0 0 4
New Jersey 343 258 38 19 3 16 9New Mexico 259 152 91 9 1 6 0New York 1,769 1,287 397 36 3 5 41North Carolina 839 706 122 1 1 9 0North Dakota 65 31 34 0 0 0 0
National Center for Education Statistics
StateAll STEM
fields
STEM field
Table 9a. Number of associate's degree awards conferred in science, technology, engineering, and Table 9a. mathematics (STEM) fields to women at Title IV institutions, by field and state: Academic year Table 9a. 2000–01
Computer and information
sciences
Engineering and engineering
technologies
Biological and biomedical
sciencesMathematics
and statisticsPhysical sciences
Science technologies
See notes at end of table.

Ohio 851 560 245 12 7 2 25Oklahoma 217 99 57 31 15 15 0Oregon 138 38 93 3 1 1 2Pennsylvania 725 420 242 35 12 7 9Rhode Island 108 77 27 0 0 0 4
South Carolina 286 224 59 0 0 0 3South Dakota 82 42 40 0 0 0 0Tennessee 207 114 72 7 0 0 14Texas 1,577 795 472 150 42 33 85Utah 188 56 58 55 5 12 2
Vermont 35 27 6 0 0 0 2Virginia 602 323 172 0 0 107 0Washington 449 267 179 0 0 0 3West Virginia 102 70 30 0 0 0 2Wisconsin 506 358 137 0 0 0 11Wyoming 73 22 14 26 5 6 0SOURCE: U.S. Department of Education, National Center for Education Statistics, Integrated Postsecondary Education Data System (IPEDS), Fall 2001, Completions component.
StateAll STEM
fields
STEM field
Table 9a. Number of associate's degree awards conferred in science, technology, engineering, and Table 9a. mathematics (STEM) fields to women at Title IV institutions, by field and state: Academic year Table 9a. 2000–01—Continued
Computer and information
sciences
Engineering and engineering
technologies
Biological and biomedical
sciencesMathematics
and statisticsPhysical sciences
Science technologies

United States 29.1 41.8 16.2 67.9 35.3 46.8 37.4
Alabama 37.4 53.8 21.2 † † † 5.0Alaska 28.5 50.0 26.3 † † † †Arizona 19.2 38.5 14.2 87.5 28.6 44.4 †Arkansas 34.1 43.8 27.5 † 0.0 † †California 25.8 29.6 16.8 70.7 32.0 35.8 45.2
Colorado 25.9 31.8 17.3 † † † †Connecticut 28.0 24.7 28.0 † † 75.0 37.5Delaware 34.1 50.0 19.6 † † † 75.0District of Columbia 58.5 59.7 37.5 † † † †Florida 36.5 44.6 21.7 † † 0.0 50.0
Georgia 31.2 41.4 15.4 50.0 † † 100.0Hawaii 28.3 35.0 23.2 † 50.0 † †Idaho 22.9 24.1 14.1 71.0 60.0 43.8 †Illinois 30.6 45.3 14.0 † † † 75.0Indiana 26.2 42.8 15.2 100.0 28.6 40.0 60.0
Iowa 30.0 43.0 16.7 † † † 85.7Kansas 44.0 43.5 17.4 72.4 75.0 73.7 25.0Kentucky 31.3 50.6 15.4 0.0 0.0 0.0 10.3Louisiana 37.4 55.1 15.3 80.0 † 100.0 †Maine 21.0 31.9 11.1 † † 80.0 80.0
Maryland 34.0 40.4 27.3 † 40.0 † †Massachusetts 27.8 40.8 17.8 85.7 0.0 0.0 60.9Michigan 32.7 53.9 17.8 69.4 50.0 49.8 42.9Minnesota 25.0 33.3 17.8 † † † 0.0Mississippi 26.5 47.6 14.2 75.0 100.0 0.0 †
Missouri 28.1 42.8 13.5 100.0 100.0 † 75.0Montana 23.3 51.2 11.9 † † † 100.0Nebraska 23.8 31.2 11.4 100.0 † 0.0 88.9Nevada 17.7 20.0 13.8 66.7 20.0 0.0 †New Hampshire 26.2 37.9 9.7 † † † 80.0
New Jersey 27.8 33.3 10.4 47.5 60.0 42.1 75.0New Mexico 39.7 57.6 24.7 100.0 50.0 66.7 †New York 28.8 39.8 14.3 72.0 42.9 50.0 66.1North Carolina 36.0 50.1 13.7 9.1 50.0 39.1 †North Dakota 21.7 39.7 15.4 † † † †See notes at end of table.
National Center for Education Statistics
StateAll STEM
fields
STEM field
Table 9b. Percentage of associate's degree awards conferred in science, technology, engineering, andTable 9b. mathematics (STEM) fields to women at Title IV institutions, by field and state: Academic year Table 9b. 2000–01
Computer and information
sciences
Engineering and engineering
technologies
Biological and biomedical
sciencesMathematics
and statisticsPhysical sciences
Science technologies

Ohio 27.1 46.4 13.2 75.0 50.0 33.3 75.8Oklahoma 28.9 36.3 16.9 48.4 34.9 44.1 †Oregon 22.2 25.2 20.2 60.0 100.0 50.0 50.0Pennsylvania 20.6 37.1 10.7 67.3 34.3 46.7 37.5Rhode Island 22.6 33.5 11.2 † † † 57.1
South Carolina 37.5 56.3 16.4 † † † 50.0South Dakota 30.6 34.7 27.2 † † † †Tennessee 28.0 44.2 15.9 70.0 † † 82.4Texas 28.4 41.5 16.7 71.4 32.6 52.4 20.7Utah 23.7 19.3 16.1 52.4 50.0 54.5 33.3
Vermont 21.5 31.8 7.9 † † † 100.0Virginia 38.2 44.7 25.3 † † 62.2 †Washington 27.8 40.0 19.1 † † † 33.3West Virginia 23.4 32.4 14.0 † † † 50.0Wisconsin 28.0 40.0 15.3 † 0.0 † 64.7Wyoming 39.7 47.8 20.3 72.2 41.7 28.6 †
SOURCE: U.S. Department of Education, National Center for Education Statistics, Integrated Postsecondary Education Data System (IPEDS), Fall 2001, Completions component.
Table 9b. Percentage of associate's degree awards conferred in science, technology, engineering, and Table 9b. mathematics (STEM) fields to women at Title IV institutions, by field and state: Academic year Table 9b. 2000–01—Continued
StateAll STEM
fields
STEM field
Biological and biomedical
sciencesMathematics
and statisticsPhysical sciences
Science technologies
† Not applicable.
Computer and information
sciences
Engineering and engineering
technologies
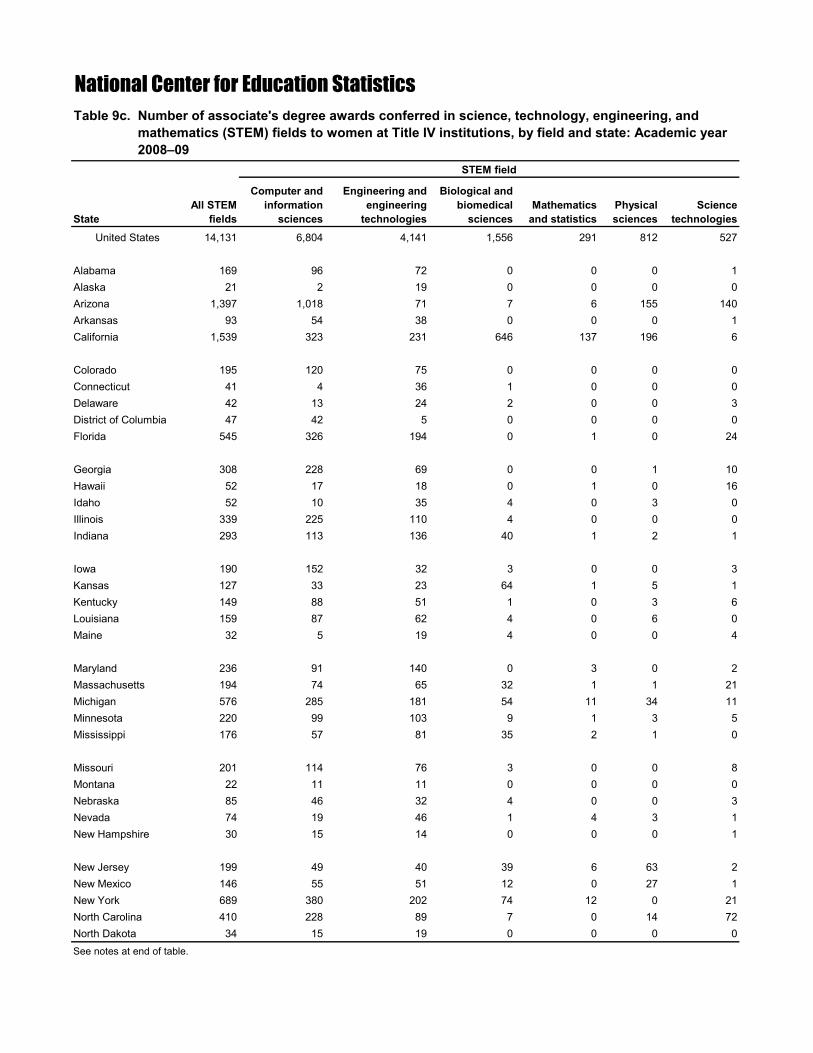
United States 14,131 6,804 4,141 1,556 291 812 527
Alabama 169 96 72 0 0 0 1Alaska 21 2 19 0 0 0 0Arizona 1,397 1,018 71 7 6 155 140Arkansas 93 54 38 0 0 0 1California 1,539 323 231 646 137 196 6
Colorado 195 120 75 0 0 0 0Connecticut 41 4 36 1 0 0 0Delaware 42 13 24 2 0 0 3District of Columbia 47 42 5 0 0 0 0Florida 545 326 194 0 1 0 24
Georgia 308 228 69 0 0 1 10Hawaii 52 17 18 0 1 0 16Idaho 52 10 35 4 0 3 0Illinois 339 225 110 4 0 0 0Indiana 293 113 136 40 1 2 1
Iowa 190 152 32 3 0 0 3Kansas 127 33 23 64 1 5 1Kentucky 149 88 51 1 0 3 6Louisiana 159 87 62 4 0 6 0Maine 32 5 19 4 0 0 4
Maryland 236 91 140 0 3 0 2Massachusetts 194 74 65 32 1 1 21Michigan 576 285 181 54 11 34 11Minnesota 220 99 103 9 1 3 5Mississippi 176 57 81 35 2 1 0
Missouri 201 114 76 3 0 0 8Montana 22 11 11 0 0 0 0Nebraska 85 46 32 4 0 0 3Nevada 74 19 46 1 4 3 1New Hampshire 30 15 14 0 0 0 1
New Jersey 199 49 40 39 6 63 2New Mexico 146 55 51 12 0 27 1New York 689 380 202 74 12 0 21North Carolina 410 228 89 7 0 14 72North Dakota 34 15 19 0 0 0 0See notes at end of table.
National Center for Education Statistics
StateAll STEM
fields
STEM field
Table 9c. Number of associate's degree awards conferred in science, technology, engineering, and Table 9c. mathematics (STEM) fields to women at Title IV institutions, by field and state: Academic year Table 9c. 2008–09
Computer and information
sciences
Engineering and engineering
technologies
Biological and biomedical
sciencesMathematics
and statisticsPhysical sciences
Science technologies

Ohio 569 333 194 13 2 4 23Oklahoma 200 56 56 64 8 16 0Oregon 102 37 58 5 2 0 0Pennsylvania 632 324 198 39 12 41 18Rhode Island 51 34 17 0 0 0 0
South Carolina 147 93 54 0 0 0 0South Dakota 44 17 24 0 0 3 0Tennessee 174 98 72 4 0 0 0Texas 1,358 339 444 349 74 61 91Utah 101 24 42 10 5 10 10
Vermont 14 4 10 0 0 0 0Virginia 882 608 180 0 0 93 1Washington 400 158 169 0 0 65 8West Virginia 41 26 14 1 0 0 0Wisconsin 290 149 124 5 0 0 12Wyoming 44 10 15 16 1 2 0
Table 9c. Number of associate's degree awards conferred in science, technology, engineering, and Table 9c. mathematics (STEM) fields to women at Title IV institutions, by field and state: Academic year Table 9c. 2008–09—Continued
SOURCE: U.S. Department of Education, National Center for Education Statistics, Integrated Postsecondary Education Data System (IPEDS), Fall 2009, Completions component.
StateAll STEM
fields
STEM field
Computer and information
sciences
Engineering and engineering
technologies
Biological and biomedical
sciencesMathematics
and statisticsPhysical sciences
Science technologies

United States 22.0 24.7 13.9 67.9 31.5 40.3 30.4
Alabama 23.2 27.7 19.2 † † † 12.5Alaska 29.6 18.2 31.7 † † † †Arizona 28.7 31.4 12.7 53.8 25.0 38.3 22.6Arkansas 22.4 30.5 16.2 † † 0.0 33.3California 28.9 17.7 14.1 71.9 29.2 41.4 50.0
Colorado 23.6 24.6 22.3 † † † †Connecticut 14.2 6.2 16.8 100.0 † † 0.0Delaware 26.8 24.5 25.5 50.0 † † 50.0District of Columbia 43.9 44.7 38.5 † † † †Florida 22.0 30.7 14.2 † 100.0 † 53.3
Georgia 26.5 27.1 22.9 † † 33.3 58.8Hawaii 18.4 15.9 15.9 † 50.0 † 26.2Idaho 17.0 10.8 19.2 30.8 0.0 25.0 †Illinois 20.1 27.6 12.6 100.0 † † †Indiana 17.7 19.8 13.4 62.5 50.0 50.0 100.0
Iowa 19.4 27.1 8.0 50.0 † † 30.0Kansas 28.5 20.2 13.7 73.6 33.3 50.0 6.7Kentucky 18.0 21.9 12.8 50.0 0.0 42.9 33.3Louisiana 21.1 32.6 13.0 100.0 † 100.0 †Maine 17.7 26.3 12.7 80.0 † † 57.1
Maryland 31.0 25.3 36.5 † 50.0 † 18.2Massachusetts 18.0 19.3 11.0 54.2 33.3 12.5 61.8Michigan 19.2 23.3 11.7 70.1 32.4 47.9 22.9Minnesota 15.3 18.4 11.9 60.0 33.3 75.0 35.7Mississippi 25.5 28.1 19.1 66.0 22.2 50.0 †
Missouri 14.7 17.3 11.1 75.0 0.0 † 33.3Montana 21.2 25.6 18.0 † † † †Nebraska 14.2 20.5 8.9 80.0 0.0 † 42.9Nevada 22.0 15.6 24.0 20.0 36.4 60.0 100.0New Hampshire 13.9 16.9 11.3 0.0 † † 50.0
New Jersey 20.7 13.9 10.6 52.7 75.0 51.2 6.7New Mexico 29.6 28.2 20.8 80.0 † 71.1 100.0New York 17.3 20.4 10.4 69.8 41.4 0.0 42.9North Carolina 25.8 30.8 12.8 50.0 † 43.8 70.6North Dakota 11.5 31.9 7.7 0.0 † † †
National Center for Education Statistics
StateAll STEM
fields
STEM field
Table 9d. Percentage of associate's degree awards conferred in science, technology, engineering, and Table 9d. mathematics (STEM) fields to women at Title IV institutions, by field and state: Academic year Table 9d. 2008–09
See notes at end of table.
Computer and information
sciences
Engineering and engineering
technologies
Biological and biomedical
sciencesMathematics
and statisticsPhysical sciences
Science technologies

Ohio 16.3 23.9 9.7 52.0 33.3 30.8 50.0Oklahoma 21.6 22.6 11.0 68.1 18.6 50.0 0.0Oregon 17.9 15.6 18.4 71.4 33.3 0.0 †Pennsylvania 19.2 27.0 10.6 62.9 34.3 43.2 52.9Rhode Island 11.6 15.1 8.0 † † † 0.0
South Carolina 22.2 27.8 16.5 0.0 † † †South Dakota 17.5 21.8 14.4 0.0 † 60.0 †Tennessee 16.2 19.7 12.7 57.1 † † †Texas 24.6 21.2 16.7 68.8 37.9 49.6 20.8Utah 14.9 12.6 10.7 37.0 45.5 29.4 38.5
Vermont 15.2 20.0 13.9 † † † †Virginia 30.4 35.0 17.7 † † 61.6 100.0Washington 22.0 23.4 21.0 † † 19.6 66.7West Virginia 16.8 31.3 8.8 100.0 † 0.0 †Wisconsin 17.4 20.3 13.6 100.0 † † 66.7Wyoming 25.6 21.7 21.4 64.0 7.7 11.1 †
SOURCE: U.S. Department of Education, National Center for Education Statistics, Integrated Postsecondary Education Data System (IPEDS), Fall 2009, Completions component.
† Not applicable.
Table 9d. Percentage of associate's degree awards conferred in science, technology, engineering, and Table 9d. mathematics (STEM) fields to women at Title IV institutions, by field and state: Academic year Table 9d. 2008–09—Continued
StateAll STEM
fields
STEM field
Computer and information
sciences
Engineering and engineering
technologies
Biological and biomedical
sciencesMathematics
and statisticsPhysical sciences
Science technologies

United States 69,900 11,480 12,880 33,229 5,362 6,913 36
Alabama 1,272 201 311 580 100 80 0Alaska 93 11 18 51 4 9 0Arizona 1,012 189 212 489 29 93 0Arkansas 484 107 46 231 36 64 0California 6,859 1,065 1,208 3,424 536 626 0
Colorado 1,548 219 305 768 120 136 0Connecticut 617 54 76 279 125 83 0Delaware 214 29 36 120 4 25 0District of Columbia 605 316 39 192 20 38 0Florida 2,397 485 480 1,138 96 198 0
Georgia 2,024 540 405 788 124 167 0Hawaii 207 68 16 95 15 11 2Idaho 241 31 35 140 6 29 0Illinois 3,299 674 566 1,492 257 310 0Indiana 1,525 118 407 662 131 207 0
Iowa 958 120 163 517 80 78 0Kansas 739 160 142 328 45 64 0Kentucky 726 49 138 388 74 77 0Louisiana 1,356 218 262 666 69 141 0Maine 288 24 24 185 17 38 0
Maryland 1,827 464 260 851 122 130 0Massachusetts 2,661 329 518 1,235 248 325 6Michigan 2,680 318 921 1,063 173 205 0Minnesota 1,296 175 152 668 116 185 0Mississippi 698 81 101 374 53 89 0
Missouri 1,605 406 279 664 100 156 0Montana 315 22 64 164 17 48 0Nebraska 391 58 38 202 36 57 0Nevada 163 24 34 86 5 14 0New Hampshire 404 81 35 229 32 27 0
New Jersey 1,971 403 278 969 173 148 0New Mexico 408 58 97 185 27 41 0New York 4,892 1,271 781 1,991 417 432 0North Carolina 2,439 343 396 1,232 184 284 0North Dakota 166 32 31 80 6 17 0
National Center for Education Statistics
StateAll STEM
fields
STEM field
See notes at end of table.
Table 10a. Number of bachelor’s degrees awards conferred in science, technology, engineering, and Table 10a. mathematics (STEM) fields to women at Title IV institutions, by field and state: Academic year Table 10a. 2000–01
Computer and information
sciences
Engineering and engineering
technologies
Biological and biomedical
sciencesMathematics
and statisticsPhysical sciences
Science technologies
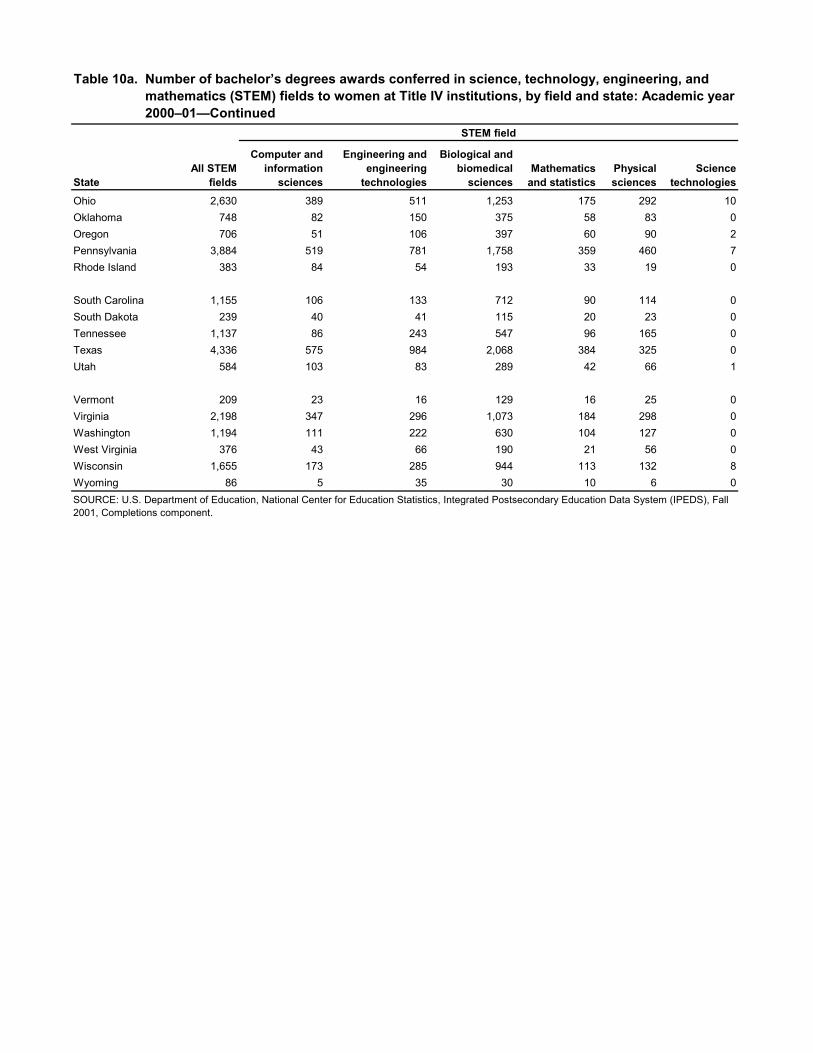
Ohio 2,630 389 511 1,253 175 292 10Oklahoma 748 82 150 375 58 83 0Oregon 706 51 106 397 60 90 2Pennsylvania 3,884 519 781 1,758 359 460 7Rhode Island 383 84 54 193 33 19 0
South Carolina 1,155 106 133 712 90 114 0South Dakota 239 40 41 115 20 23 0Tennessee 1,137 86 243 547 96 165 0Texas 4,336 575 984 2,068 384 325 0Utah 584 103 83 289 42 66 1
Vermont 209 23 16 129 16 25 0Virginia 2,198 347 296 1,073 184 298 0Washington 1,194 111 222 630 104 127 0West Virginia 376 43 66 190 21 56 0Wisconsin 1,655 173 285 944 113 132 8Wyoming 86 5 35 30 10 6 0
StateAll STEM
fields
STEM field
Table 10a. Number of bachelor’s degrees awards conferred in science, technology, engineering, and Table 10a. mathematics (STEM) fields to women at Title IV institutions, by field and state: Academic year Table 10a. 2000–01—Continued
SOURCE: U.S. Department of Education, National Center for Education Statistics, Integrated Postsecondary Education Data System (IPEDS), Fall 2001, Completions component.
Computer and information
sciences
Engineering and engineering
technologies
Biological and biomedical
sciencesMathematics
and statisticsPhysical sciences
Science technologies

United States 35.9 27.2 18.8 59.6 48.3 41.0 45.0
Alabama 39.2 31.7 24.0 61.2 58.1 41.2 †Alaska 47.2 39.3 32.7 66.2 23.5 45.0 †Arizona 32.9 27.6 16.0 61.4 38.7 47.4 †Arkansas 35.3 29.7 13.7 52.0 48.6 40.5 †California 35.8 25.2 18.7 59.0 45.3 41.8 †
Colorado 36.2 27.3 19.1 61.5 47.8 36.7 0.0Connecticut 37.7 21.4 15.1 58.4 60.7 41.7 †Delaware 40.8 24.8 26.3 56.6 50.0 50.0 †District of Columbia 46.4 42.5 24.4 65.1 58.8 52.8 †Florida 35.2 28.7 18.2 61.5 46.6 45.1 †
Georgia 39.0 34.6 23.9 61.4 45.6 44.4 †Hawaii 35.3 28.6 18.6 51.4 41.7 34.4 22.2Idaho 32.3 22.1 15.8 50.4 20.7 37.7 †Illinois 34.9 28.4 17.1 57.9 50.8 45.9 †Indiana 30.9 19.7 16.5 59.5 45.5 44.1 †
Iowa 34.6 23.1 16.8 58.7 43.2 37.5 †Kansas 32.3 30.0 17.0 52.8 42.5 33.3 †Kentucky 35.2 20.9 17.3 58.2 50.3 35.3 †Louisiana 39.0 38.2 18.8 60.8 54.8 48.5 †Maine 34.1 24.7 9.1 60.1 34.0 30.4 †
Maryland 40.2 32.6 22.4 62.8 49.8 36.7 †Massachusetts 38.1 23.3 21.2 64.9 50.3 45.3 75.0Michigan 32.7 26.7 21.2 59.8 52.3 37.1 †Minnesota 35.2 20.8 16.1 60.1 42.5 36.6 †Mississippi 40.3 33.5 17.1 62.5 52.5 44.9 †
Missouri 34.4 27.1 18.9 59.6 46.1 43.6 †Montana 32.0 21.4 15.3 53.4 38.6 42.9 †Nebraska 30.9 18.5 11.2 55.2 38.3 37.3 †Nevada 34.0 28.9 19.0 51.5 33.3 38.9 †New Hampshire 40.2 27.8 16.1 62.7 54.2 37.5 †
New Jersey 40.3 28.3 21.9 62.5 55.6 44.8 †New Mexico 36.1 29.1 20.3 63.4 45.8 40.6 †New York 35.7 28.7 20.3 58.4 46.6 38.7 †North Carolina 42.2 33.8 23.0 62.0 46.0 43.4 †North Dakota 22.2 20.5 8.8 47.6 33.3 32.1 †
National Center for Education Statistics
StateAll STEM
fields
STEM field
See notes at end of table.
Table 10b. Percentage of bachelor’s degrees awards conferred in science, technology, engineering, and Table 10b. mathematics (STEM) fields to women at Title IV institutions, by field and state: Academic year Table 10b. 2000–01
Computer and information
sciences
Engineering and engineering
technologies
Biological and biomedical
sciencesMathematics
and statisticsPhysical sciences
Science technologies

Ohio 34.7 25.3 17.7 60.4 45.1 42.9 66.7Oklahoma 32.5 23.8 16.0 53.2 57.4 38.2 †Oregon 35.1 15.8 15.5 62.1 47.2 38.1 50.0Pennsylvania 34.7 23.8 18.8 59.6 49.7 39.2 50.0Rhode Island 35.8 26.8 16.9 61.3 56.9 30.2 †
South Carolina 44.1 27.7 19.4 64.1 52.3 42.4 †South Dakota 30.3 29.0 11.2 56.7 60.6 46.0 †Tennessee 37.2 22.8 19.7 58.6 52.2 50.0 †Texas 36.5 26.8 21.7 56.7 53.0 39.9 †Utah 21.8 17.5 8.9 35.9 37.5 28.3 7.7
Vermont 42.4 25.6 16.7 63.9 55.2 32.9 †Virginia 39.3 27.6 17.5 64.7 54.6 46.1 †Washington 36.4 21.6 18.5 65.1 45.6 34.7 †West Virginia 30.2 20.9 13.1 56.4 36.8 39.7 †Wisconsin 34.6 21.9 16.0 61.0 37.9 36.2 88.9Wyoming 29.7 21.7 21.5 46.9 58.8 26.1 †
SOURCE: U.S. Department of Education, National Center for Education Statistics, Integrated Postsecondary Education Data System (IPEDS), Fall 2001, Completions component.
Table 10b. Percentage of bachelor’s degrees awards conferred in science, technology, engineering, and Table 10b. mathematics (STEM) fields to women at Title IV institutions, by field and state: Academic year Table 10b. 2000–01—Continued
StateAll STEM
fields
STEM field
Mathematics and statistics
Physical sciences
Science technologies
† Not applicable.
Computer and information
sciences
Engineering and engineering
technologies
Biological and biomedical
sciences
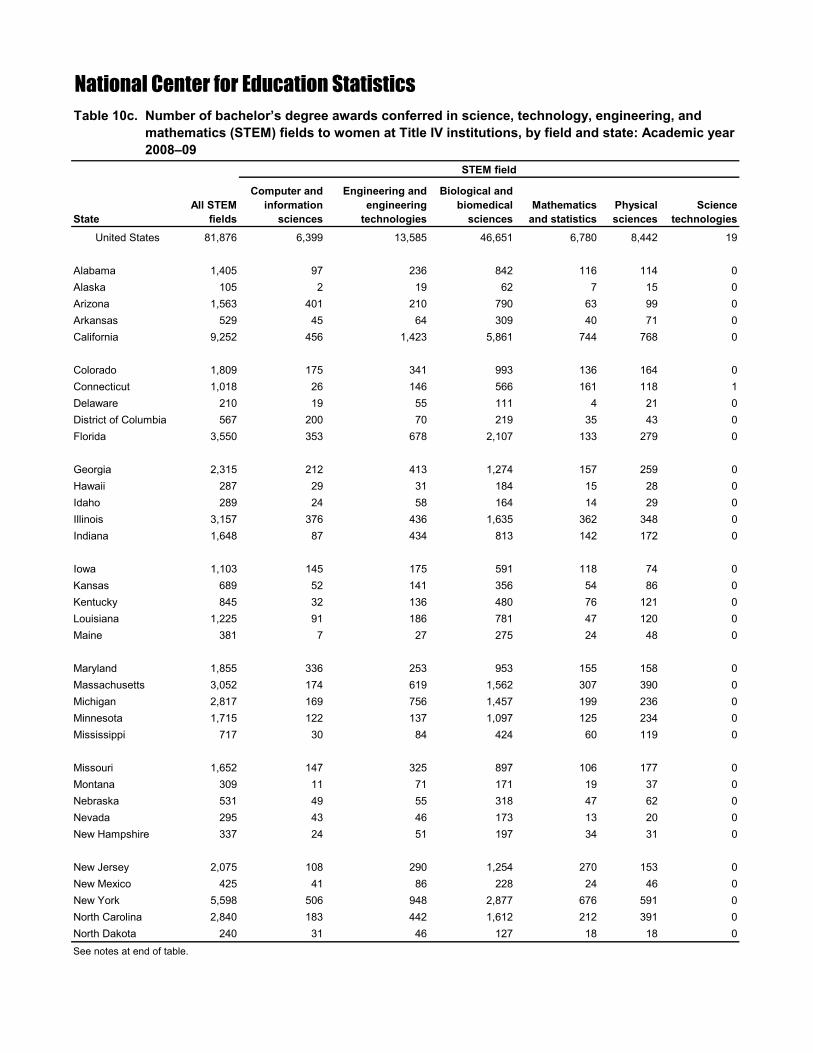
United States 81,876 6,399 13,585 46,651 6,780 8,442 19
Alabama 1,405 97 236 842 116 114 0Alaska 105 2 19 62 7 15 0Arizona 1,563 401 210 790 63 99 0Arkansas 529 45 64 309 40 71 0California 9,252 456 1,423 5,861 744 768 0
Colorado 1,809 175 341 993 136 164 0Connecticut 1,018 26 146 566 161 118 1Delaware 210 19 55 111 4 21 0District of Columbia 567 200 70 219 35 43 0Florida 3,550 353 678 2,107 133 279 0
Georgia 2,315 212 413 1,274 157 259 0Hawaii 287 29 31 184 15 28 0Idaho 289 24 58 164 14 29 0Illinois 3,157 376 436 1,635 362 348 0Indiana 1,648 87 434 813 142 172 0
Iowa 1,103 145 175 591 118 74 0Kansas 689 52 141 356 54 86 0Kentucky 845 32 136 480 76 121 0Louisiana 1,225 91 186 781 47 120 0Maine 381 7 27 275 24 48 0
Maryland 1,855 336 253 953 155 158 0Massachusetts 3,052 174 619 1,562 307 390 0Michigan 2,817 169 756 1,457 199 236 0Minnesota 1,715 122 137 1,097 125 234 0Mississippi 717 30 84 424 60 119 0
Missouri 1,652 147 325 897 106 177 0Montana 309 11 71 171 19 37 0Nebraska 531 49 55 318 47 62 0Nevada 295 43 46 173 13 20 0New Hampshire 337 24 51 197 34 31 0
New Jersey 2,075 108 290 1,254 270 153 0New Mexico 425 41 86 228 24 46 0New York 5,598 506 948 2,877 676 591 0North Carolina 2,840 183 442 1,612 212 391 0North Dakota 240 31 46 127 18 18 0
National Center for Education Statistics
StateAll STEM
fields
STEM field
See notes at end of table.
Table 10c. Number of bachelor’s degree awards conferred in science, technology, engineering, and Table 10c. mathematics (STEM) fields to women at Title IV institutions, by field and state: Academic year Table 10c. 2008–09
Computer and information
sciences
Engineering and engineering
technologies
Biological and biomedical
sciencesMathematics
and statisticsPhysical sciences
Science technologies

Ohio 2,726 185 498 1,579 161 292 11Oklahoma 885 30 157 566 52 80 0Oregon 848 39 106 525 70 108 0Pennsylvania 4,650 424 860 2,310 471 580 5Rhode Island 440 44 55 259 49 33 0
South Carolina 1,363 74 131 926 86 146 0South Dakota 263 42 45 126 20 29 1Tennessee 1,241 64 228 668 94 187 0Texas 5,460 200 967 3,380 492 421 0Utah 738 97 112 369 69 91 0
Vermont 234 8 26 141 41 18 0Virginia 2,488 175 403 1,368 195 347 0Washington 1,565 92 208 935 109 221 0West Virginia 410 14 40 262 24 69 1Wisconsin 2,049 108 236 1,405 131 169 0Wyoming 111 0 25 72 3 11 0
StateAll STEM
fields
STEM field
Table 10c. Number of bachelor’s degree awards conferred in science, technology, engineering, and Table 10c. mathematics (STEM) fields to women at Title IV institutions, by field and state: Academic year Table 10c. 2008–09—Continued
SOURCE: U.S. Department of Education, National Center for Education Statistics, Integrated Postsecondary Education Data System (IPEDS), Fall 2009, Completions component.
Computer and information
sciences
Engineering and engineering
technologies
Biological and biomedical
sciencesMathematics
and statisticsPhysical sciences
Science technologies

United States 35.1 17.8 16.6 59.2 43.1 40.4 22.4
Alabama 38.4 21.7 16.4 64.6 52.0 47.3 †Alaska 38.5 6.7 19.6 69.7 36.8 39.5 †Arizona 31.3 21.4 15.2 57.8 42.6 43.6 †Arkansas 35.2 18.3 13.7 58.2 52.6 39.4 †California 36.7 14.0 17.0 58.5 43.9 40.8 †
Colorado 32.4 18.7 14.9 63.9 40.1 36.5 0.0Connecticut 40.6 16.0 17.5 61.8 48.9 44.0 100.0Delaware 34.4 17.6 22.1 59.4 36.4 37.5 †District of Columbia 42.1 32.3 34.0 63.3 48.6 41.3 †Florida 34.4 17.6 17.4 61.8 38.4 41.9 †
Georgia 37.4 19.6 19.6 61.1 43.0 47.0 †Hawaii 40.5 19.3 18.2 62.0 46.9 46.7 †Idaho 23.5 12.1 13.6 38.3 22.6 25.7 †Illinois 32.7 19.2 14.3 56.6 43.1 38.4 †Indiana 28.9 13.6 15.6 58.0 36.0 34.7 †
Iowa 34.5 27.5 15.4 56.9 44.5 31.8 †Kansas 30.6 16.2 14.4 56.4 52.9 39.6 †Kentucky 34.7 13.3 15.1 57.6 41.1 43.8 †Louisiana 39.4 27.2 16.2 62.0 40.5 46.9 †Maine 37.2 12.3 7.8 62.4 39.3 40.7 †
Maryland 35.9 25.0 17.0 61.8 43.9 35.2 †Massachusetts 39.3 16.9 22.7 62.9 44.2 46.6 †Michigan 29.7 13.9 16.6 57.6 38.3 36.2 0.0Minnesota 36.0 15.7 12.5 58.0 34.7 36.3 †Mississippi 42.3 20.3 15.5 63.2 64.5 49.4 †
Missouri 33.2 17.6 18.3 54.1 36.8 41.9 †Montana 29.2 13.3 15.4 53.1 31.1 28.7 †Nebraska 31.7 13.6 12.2 53.7 39.5 40.3 †Nevada 34.3 25.3 15.8 56.2 35.1 37.7 †New Hampshire 34.9 16.9 14.9 62.7 50.7 30.7 †
New Jersey 39.4 15.2 18.3 61.8 47.5 41.9 †New Mexico 34.0 18.5 18.5 61.1 32.9 39.3 †New York 34.4 18.0 17.3 58.5 45.0 38.8 0.0North Carolina 41.2 21.8 19.7 64.5 48.3 44.7 †North Dakota 27.7 22.6 11.4 53.4 47.4 36.7 †
National Center for Education Statistics
StateAll STEM
fields
STEM field
See notes at end of table.
Table 10d. Percentage of bachelor’s degree awards conferred in science, technology, engineering, and Table 10d. mathematics (STEM) fields to women at Title IV institutions, by field and state: Academic year Table 10d. 2008–09
Computer and information
sciences
Engineering and engineering
technologies
Biological and biomedical
sciencesMathematics
and statisticsPhysical sciences
Science technologies
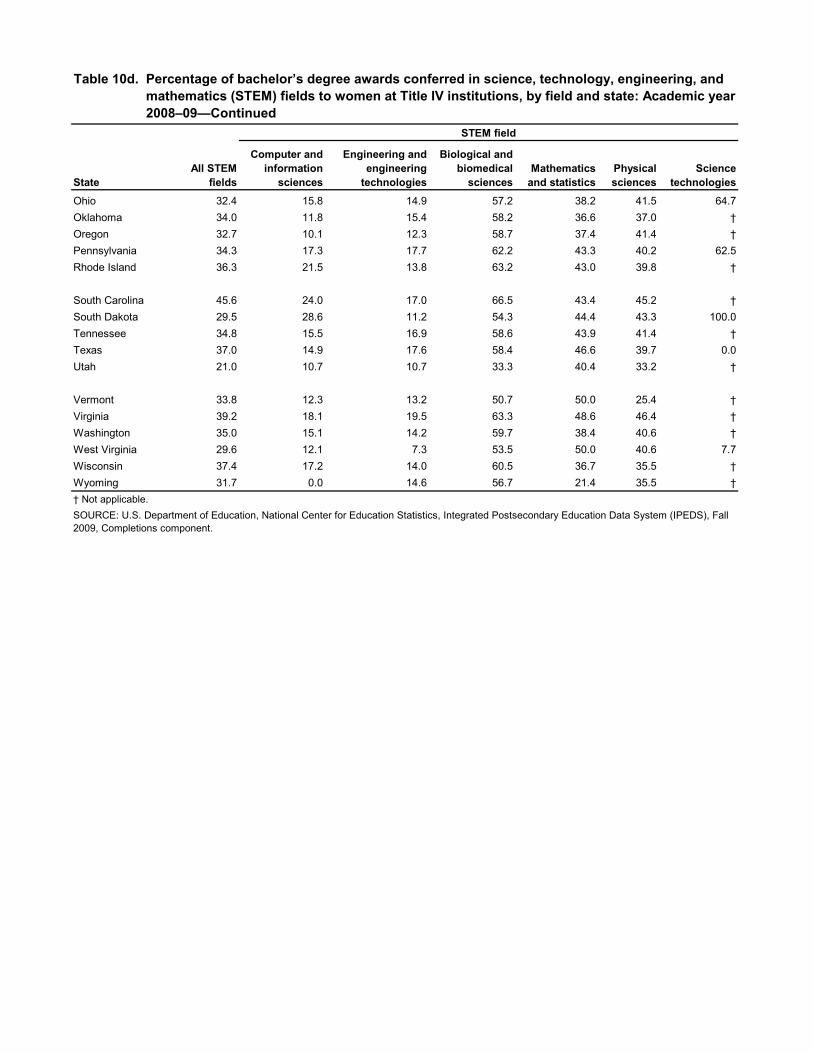
Ohio 32.4 15.8 14.9 57.2 38.2 41.5 64.7Oklahoma 34.0 11.8 15.4 58.2 36.6 37.0 †Oregon 32.7 10.1 12.3 58.7 37.4 41.4 †Pennsylvania 34.3 17.3 17.7 62.2 43.3 40.2 62.5Rhode Island 36.3 21.5 13.8 63.2 43.0 39.8 †
South Carolina 45.6 24.0 17.0 66.5 43.4 45.2 †South Dakota 29.5 28.6 11.2 54.3 44.4 43.3 100.0Tennessee 34.8 15.5 16.9 58.6 43.9 41.4 †Texas 37.0 14.9 17.6 58.4 46.6 39.7 0.0Utah 21.0 10.7 10.7 33.3 40.4 33.2 †
Vermont 33.8 12.3 13.2 50.7 50.0 25.4 †Virginia 39.2 18.1 19.5 63.3 48.6 46.4 †Washington 35.0 15.1 14.2 59.7 38.4 40.6 †West Virginia 29.6 12.1 7.3 53.5 50.0 40.6 7.7Wisconsin 37.4 17.2 14.0 60.5 36.7 35.5 †Wyoming 31.7 0.0 14.6 56.7 21.4 35.5 †
SOURCE: U.S. Department of Education, National Center for Education Statistics, Integrated Postsecondary Education Data System (IPEDS), Fall 2009, Completions component.
† Not applicable.
Table 10d. Percentage of bachelor’s degree awards conferred in science, technology, engineering, and Table 10d. mathematics (STEM) fields to women at Title IV institutions, by field and state: Academic year Table 10d. 2008–09—Continued
StateAll STEM
fields
STEM field
Computer and information
sciences
Engineering and engineering
technologies
Biological and biomedical
sciencesMathematics
and statisticsPhysical sciences
Science technologies

United States 17,133 5,164 5,538 3,451 1,319 1,637 24
Alabama 213 48 84 56 13 12 0Alaska 28 2 8 16 0 2 0Arizona 210 30 89 40 18 33 0Arkansas 64 13 16 11 15 9 0California 1,822 505 749 292 116 160 0
Colorado 446 153 138 81 17 49 8Connecticut 263 84 55 87 16 21 0Delaware 37 11 12 5 4 5 0District of Columbia 517 291 86 122 5 13 0Florida 577 135 245 83 54 60 0
Georgia 480 151 151 116 31 30 1Hawaii 89 49 13 19 1 7 0Idaho 39 6 15 11 2 5 0Illinois 953 408 217 153 92 82 1Indiana 262 29 107 69 26 31 0
Iowa 140 26 42 39 24 9 0Kansas 145 19 49 47 13 17 0Kentucky 155 24 60 35 22 14 0Louisiana 243 45 59 85 26 28 0Maine 22 0 5 10 3 4 0
Maryland 684 370 143 122 20 29 0Massachusetts 917 187 448 137 55 83 7Michigan 747 183 323 131 60 50 0Minnesota 157 16 77 36 15 11 2Mississippi 153 10 43 40 20 40 0
Missouri 238 74 78 41 17 28 0Montana 56 4 22 9 10 11 0Nebraska 78 30 13 19 8 8 0Nevada 55 13 21 8 5 8 0New Hampshire 105 58 15 9 9 14 0
New Jersey 560 220 143 109 33 55 0New Mexico 107 14 43 17 10 20 3New York 1,458 628 335 281 92 122 0North Carolina 458 112 129 131 46 40 0North Dakota 20 2 4 7 3 4 0
Table 11a. Number of master's degree awards conferred in science, technology, engineering, and Table 11a. mathematics (STEM) fields to women at Title IV institutions, by field and state: Academic year Table 11a. 2000–01
National Center for Education Statistics
StateAll STEM
fields
STEM field
See notes at end of table.
Computer and information
sciences
Engineering and engineering
technologies
Biological and biomedical
sciencesMathematics
and statisticsPhysical sciences
Science technologies

Ohio 646 103 218 124 98 102 1Oklahoma 213 65 61 48 13 26 0Oregon 133 20 60 19 14 20 0Pennsylvania 782 278 227 152 50 75 0Rhode Island 71 19 12 12 8 20 0
South Carolina 164 22 62 46 15 19 0South Dakota 62 16 33 6 2 5 0Tennessee 220 23 88 58 28 23 0Texas 1,100 373 351 207 78 91 0Utah 110 27 32 26 11 14 0
Vermont 32 2 10 11 4 5 0Virginia 477 157 136 111 41 32 0Washington 261 41 86 73 17 44 0West Virginia 84 21 24 12 13 14 0Wisconsin 253 41 96 64 24 27 1Wyoming 27 6 5 8 2 6 0
StateAll STEM
fields
STEM field
SOURCE: U.S. Department of Education, National Center for Education Statistics, Integrated Postsecondary Education Data System (IPEDS), Fall 2001, Completions component.
Computer and information
sciences
Engineering and engineering
technologies
Biological and biomedical
sciencesMathematics
and statisticsPhysical sciences
Science technologies
Table 11a. Number of master's degree awards conferred in science, technology, engineering, and Table 11a. mathematics (STEM) fields to women at Title IV institutions, by field and state: Academic year Table 11a. 2000–01—Continued

United States 31.0 33.4 21.3 57.1 42.6 35.5 51.1
Alabama 32.7 33.6 23.9 74.7 37.1 25.5 †Alaska 34.6 28.6 20.5 66.7 † 18.2 †Arizona 27.6 24.8 21.4 55.6 45.0 29.5 †Arkansas 33.0 38.2 18.6 45.8 51.7 42.9 †California 30.6 32.6 23.7 58.6 40.1 34.6 †
Colorado 30.9 31.6 21.7 60.9 34.7 38.6 61.5Connecticut 33.5 32.2 21.1 64.4 37.2 25.0 †Delaware 28.5 35.5 19.0 55.6 57.1 25.0 †District of Columbia 40.2 44.2 23.2 56.5 50.0 41.9 †Florida 27.9 30.3 20.3 57.2 56.3 33.9 †
Georgia 33.7 39.0 20.9 67.1 47.0 42.3 33.3Hawaii 35.9 34.5 24.1 63.3 100.0 33.3 †Idaho 23.6 31.6 18.3 44.0 25.0 16.1 †Illinois 29.7 32.0 18.8 47.8 39.8 37.3 25.0Indiana 27.8 18.7 22.0 56.6 32.1 31.3 †
Iowa 28.0 26.5 18.7 52.7 33.3 30.0 0.0Kansas 26.3 18.3 17.3 54.7 36.1 41.5 †Kentucky 30.6 28.9 22.8 43.8 61.1 31.8 †Louisiana 35.1 29.0 22.3 60.3 40.6 41.8 †Maine 28.6 0.0 17.9 40.0 30.0 66.7 †
Maryland 34.8 38.9 22.2 50.8 42.6 35.4 †Massachusetts 31.9 31.9 26.3 60.9 44.0 36.4 53.8Michigan 27.2 34.1 18.8 60.4 45.8 36.0 †Minnesota 31.5 20.8 26.6 61.0 50.0 27.5 50.0Mississippi 43.5 25.0 32.8 54.8 66.7 51.3 †
Missouri 24.5 28.2 16.0 46.6 39.5 31.5 †Montana 33.7 21.1 29.7 42.9 55.6 32.4 †Nebraska 30.8 27.5 19.7 47.5 53.3 34.8 †Nevada 37.7 43.3 28.4 66.7 55.6 38.1 †New Hampshire 40.4 41.4 24.6 69.2 47.4 51.9 †
New Jersey 32.8 30.4 23.1 63.0 51.6 42.3 †New Mexico 28.2 29.2 20.5 51.5 47.6 31.3 75.0New York 31.0 33.2 19.5 57.7 39.5 32.4 †North Carolina 35.0 34.7 24.0 56.5 44.7 35.7 †North Dakota 21.7 9.1 12.5 41.2 42.9 28.6 †
National Center for Education Statistics
StateAll STEM
fields
STEM field
See notes at end of table.
Table 11b. Percentage of master's degree awards conferred in science, technology, engineering, and Table 11b. mathematics (STEM) fields to women at Title IV institutions, by field and state: Academic year Table 11b. 2000–01
Computer and information
sciences
Engineering and engineering
technologies
Biological and biomedical
sciencesMathematics
and statisticsPhysical sciences
Science technologies
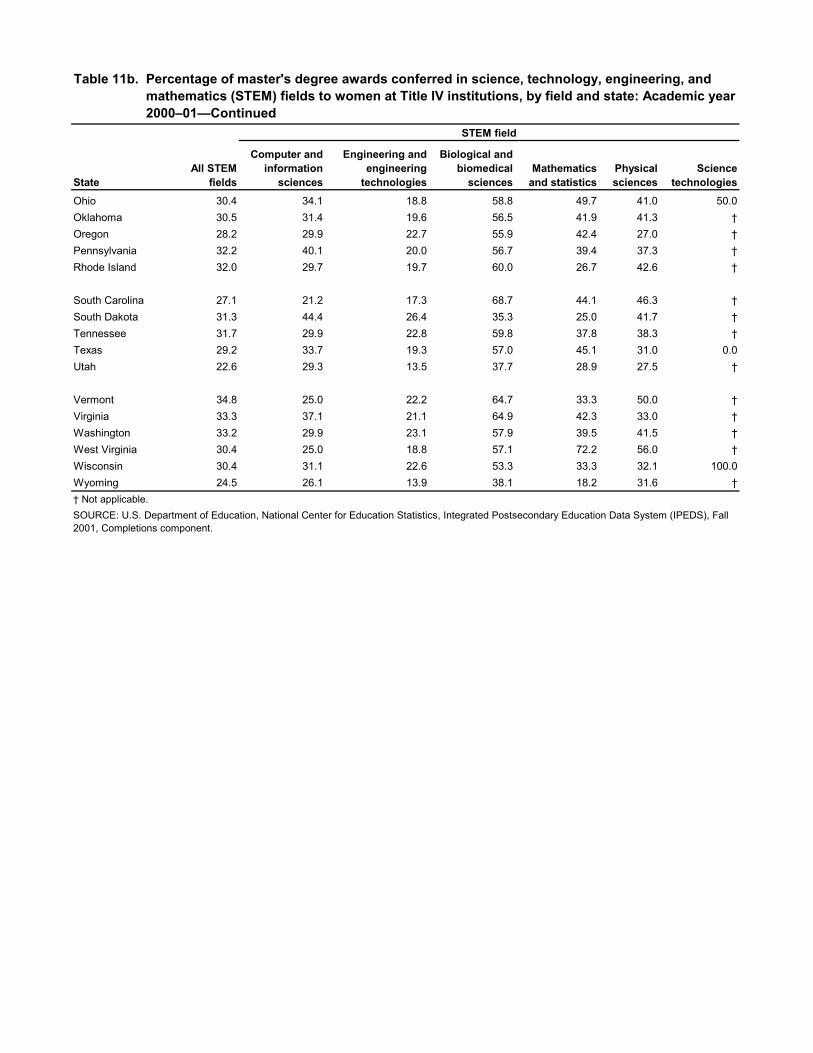
Ohio 30.4 34.1 18.8 58.8 49.7 41.0 50.0Oklahoma 30.5 31.4 19.6 56.5 41.9 41.3 †Oregon 28.2 29.9 22.7 55.9 42.4 27.0 †Pennsylvania 32.2 40.1 20.0 56.7 39.4 37.3 †Rhode Island 32.0 29.7 19.7 60.0 26.7 42.6 †
South Carolina 27.1 21.2 17.3 68.7 44.1 46.3 †South Dakota 31.3 44.4 26.4 35.3 25.0 41.7 †Tennessee 31.7 29.9 22.8 59.8 37.8 38.3 †Texas 29.2 33.7 19.3 57.0 45.1 31.0 0.0Utah 22.6 29.3 13.5 37.7 28.9 27.5 †
Vermont 34.8 25.0 22.2 64.7 33.3 50.0 †Virginia 33.3 37.1 21.1 64.9 42.3 33.0 †Washington 33.2 29.9 23.1 57.9 39.5 41.5 †West Virginia 30.4 25.0 18.8 57.1 72.2 56.0 †Wisconsin 30.4 31.1 22.6 53.3 33.3 32.1 100.0Wyoming 24.5 26.1 13.9 38.1 18.2 31.6 †
SOURCE: U.S. Department of Education, National Center for Education Statistics, Integrated Postsecondary Education Data System (IPEDS), Fall 2001, Completions component.
† Not applicable.
Table 11b. Percentage of master's degree awards conferred in science, technology, engineering, and Table 11b. mathematics (STEM) fields to women at Title IV institutions, by field and state: Academic year Table 11b. 2000–01—Continued
StateAll STEM
fields
STEM field
Computer and information
sciences
Engineering and engineering
technologies
Biological and biomedical
sciencesMathematics
and statisticsPhysical sciences
Science technologies

United States 22,335 4,591 8,281 5,110 2,128 2,053 172
Alabama 297 42 150 59 20 26 0Alaska 32 1 8 11 1 11 0Arizona 369 86 136 89 14 44 0Arkansas 89 20 14 21 22 12 0California 2,626 410 1,273 468 223 229 23
Colorado 452 92 176 86 35 63 0Connecticut 433 66 153 111 49 45 9Delaware 67 15 20 14 16 2 0District of Columbia 491 134 159 173 18 7 0Florida 857 105 423 175 68 86 0
Georgia 551 118 190 137 64 30 12Hawaii 65 8 16 23 2 16 0Idaho 58 3 22 18 7 8 0Illinois 1,364 485 382 253 136 95 13Indiana 333 17 112 104 50 46 4
Iowa 186 33 59 41 38 14 1Kansas 161 15 83 26 16 21 0Kentucky 231 33 87 72 18 21 0Louisiana 202 36 51 64 38 13 0Maine 26 2 4 11 4 5 0
Maryland 893 266 222 340 35 26 4Massachusetts 1,010 252 375 227 60 91 5Michigan 901 198 347 212 59 84 1Minnesota 284 88 79 57 25 27 8Mississippi 195 18 38 61 12 66 0
Missouri 381 74 131 101 35 33 7Montana 46 1 11 11 12 11 0Nebraska 142 34 23 58 17 10 0Nevada 85 14 33 18 5 15 0New Hampshire 110 22 45 12 16 15 0
New Jersey 660 140 277 105 85 52 1New Mexico 144 10 78 19 7 29 1New York 2,113 587 685 465 242 121 13North Carolina 619 137 230 129 41 81 1North Dakota 36 4 12 12 6 2 0
National Center for Education Statistics
StateAll STEM
fields
STEM field
See notes at end of table.
Table 11c. Number of master's degree awards conferred in science, technology, engineering, and Table 11c. mathematics (STEM) fields to women at Title IV institutions, by field and state: Academic year Table 11c. 2008–09
Computer and information
sciences
Engineering and engineering
technologies
Biological and biomedical
sciencesMathematics
and statisticsPhysical sciences
Science technologies

Ohio 699 85 260 140 107 92 15Oklahoma 183 29 83 34 11 26 0Oregon 146 14 56 33 18 25 0Pennsylvania 1,199 277 391 286 131 96 18Rhode Island 92 11 27 22 11 21 0
South Carolina 179 6 47 72 28 19 7South Dakota 60 10 25 17 3 5 0Tennessee 231 15 91 46 34 33 12Texas 1,624 356 596 385 142 128 17Utah 142 26 50 24 20 22 0
Vermont 31 15 3 6 3 4 0Virginia 615 114 315 110 45 31 0Washington 282 49 87 63 29 54 0West Virginia 91 5 40 20 20 6 0Wisconsin 226 13 94 63 27 29 0Wyoming 26 0 12 6 3 5 0
Table 11c. Number of master's degree awards conferred in science, technology, engineering, and Table 11c. mathematics (STEM) fields to women at Title IV institutions, by field and state: Academic year Table 11c. 2008–09—Continued
SOURCE: U.S. Department of Education, National Center for Education Statistics, Integrated Postsecondary Education Data System (IPEDS), Fall 2009, Completions component.
StateAll STEM
fields
STEM field
Computer and information
sciences
Engineering and engineering
technologies
Biological and biomedical
sciencesMathematics
and statisticsPhysical sciences
Science technologies

United States 30.5 27.0 22.6 58.3 41.7 38.9 55.8
Alabama 27.5 29.4 21.7 48.8 36.4 38.2 †Alaska 34.0 50.0 17.4 50.0 14.3 64.7 †Arizona 31.8 34.7 23.7 57.8 35.9 30.6 †Arkansas 34.9 25.0 22.2 43.8 56.4 48.0 †California 30.0 24.6 24.8 61.0 43.6 36.2 60.5
Colorado 30.5 26.8 22.9 62.3 34.7 47.7 †Connecticut 27.3 30.0 16.3 59.7 45.4 40.5 39.1Delaware 36.0 28.3 27.0 60.9 57.1 25.0 †District of Columbia 36.2 34.9 27.7 51.6 40.9 33.3 †Florida 28.3 24.8 21.6 63.6 39.5 43.2 †
Georgia 28.3 24.5 18.6 62.0 52.9 33.7 92.3Hawaii 40.9 23.5 30.8 65.7 40.0 48.5 †Idaho 26.6 33.3 17.3 56.3 31.8 28.6 †Illinois 30.5 26.0 24.6 59.7 40.7 34.9 65.0Indiana 30.2 18.7 19.9 49.5 39.7 42.6 66.7
Iowa 27.6 15.8 21.1 54.7 52.1 41.2 33.3Kansas 28.9 21.4 23.9 56.5 44.4 36.8 †Kentucky 32.4 30.3 22.4 59.5 40.9 40.4 †Louisiana 29.4 27.5 17.2 55.7 38.0 30.2 †Maine 33.8 33.3 15.4 55.0 26.7 50.0 †
Maryland 35.7 27.1 26.5 64.8 42.2 40.0 40.0Massachusetts 32.8 29.3 25.6 63.9 41.1 36.8 45.5Michigan 30.0 35.9 19.5 64.8 39.6 44.2 100.0Minnesota 26.3 20.1 19.8 60.0 40.3 36.5 66.7Mississippi 39.6 36.0 23.2 61.6 44.4 43.4 †
Missouri 28.7 25.7 20.6 46.5 47.3 33.3 63.6Montana 30.1 7.7 17.7 64.7 41.4 34.4 †Nebraska 36.1 27.9 22.3 53.7 47.2 41.7 †Nevada 38.6 38.9 29.2 62.1 33.3 55.6 †New Hampshire 34.7 32.8 26.8 63.2 59.3 41.7 †
New Jersey 32.0 29.8 25.3 53.0 48.9 42.3 33.3New Mexico 28.5 16.1 26.0 44.2 26.9 39.7 50.0New York 30.8 29.2 22.7 57.4 36.0 35.6 76.5North Carolina 33.7 28.9 25.9 62.0 41.4 47.9 100.0North Dakota 25.7 18.2 18.8 44.4 54.5 12.5 †
National Center for Education Statistics
StateAll STEM
fields
STEM field
See notes at end of table.
Table 11d. Percentage of master's degree awards conferred in science, technology, engineering, and Table 11d. mathematics (STEM) fields to women at Title IV institutions, by field and state: Academic year Table 11d. 2008–09
Computer and information
sciences
Engineering and engineering
technologies
Biological and biomedical
sciencesMathematics
and statisticsPhysical sciences
Science technologies

Ohio 30.2 25.8 21.5 51.1 44.0 39.5 53.6Oklahoma 26.3 19.6 21.5 53.1 34.4 39.4 †Oregon 28.2 20.6 20.4 68.8 30.0 37.9 †Pennsylvania 31.5 27.1 22.8 58.1 41.7 41.4 66.7Rhode Island 34.5 19.0 28.1 73.3 33.3 45.7 0.0
South Carolina 35.5 19.4 19.7 63.2 50.9 43.2 33.3South Dakota 30.9 25.6 25.3 58.6 27.3 31.3 †Tennessee 32.0 16.9 24.7 58.2 39.5 40.2 63.2Texas 29.9 29.6 20.7 59.0 46.0 37.2 45.9Utah 22.9 18.8 15.9 43.6 40.0 35.5 †
Vermont 16.2 12.8 6.1 50.0 42.9 66.7 †Virginia 26.0 25.1 20.4 62.1 45.0 33.0 0.0Washington 33.6 26.3 26.2 52.9 31.9 48.2 †West Virginia 33.3 18.5 25.5 54.1 64.5 28.6 †Wisconsin 29.0 26.5 20.8 48.1 44.3 33.0 †Wyoming 33.8 0.0 30.0 46.2 50.0 33.3 †
SOURCE: U.S. Department of Education, National Center for Education Statistics, Integrated Postsecondary Education Data System (IPEDS), Fall 2009, Completions component.
† Not applicable.
Table 11d. Percentage of master's degree awards conferred in science, technology, engineering, and Table 11d. mathematics (STEM) fields to women at Title IV institutions, by field and state: Academic year Table 11d. 2008–09—Continued
StateAll STEM
fields
STEM field
Computer and information
sciences
Engineering and engineering
technologies
Biological and biomedical
sciencesMathematics
and statisticsPhysical sciences
Science technologies

United States 4,146 119 911 1,831 268 998 19
Alabama 60 0 17 31 4 8 0Alaska 12 0 0 7 0 5 0Arizona 59 2 16 23 3 15 0Arkansas 11 0 1 8 0 2 0California 500 23 131 197 26 123 0
Colorado 97 4 22 40 6 24 1Connecticut 63 1 9 29 4 20 0Delaware 15 1 6 1 1 6 0District of Columbia 48 2 8 25 2 11 0Florida 96 6 25 26 5 34 0
Georgia 101 2 37 29 12 21 0Hawaii 13 0 1 8 0 4 0Idaho 3 0 1 1 1 0 0Illinois 236 4 62 100 18 51 1Indiana 91 0 19 34 9 29 0
Iowa 68 3 12 36 8 9 0Kansas 34 0 3 17 3 11 0Kentucky 20 0 2 9 5 4 0Louisiana 51 4 8 19 1 19 0Maine 6 0 4 1 0 1 0
Maryland 126 1 30 70 7 18 0Massachusetts 248 4 51 113 12 68 0Michigan 156 6 39 60 13 38 0Minnesota 68 1 18 27 10 12 0Mississippi 14 0 3 7 1 3 0
Missouri 74 3 8 41 2 17 3Montana 5 0 0 1 1 3 0Nebraska 12 0 0 7 0 2 3Nevada 6 0 4 1 0 1 0New Hampshire 21 1 0 10 1 9 0
New Jersey 155 4 52 63 3 33 0New Mexico 26 0 7 5 2 9 3New York 299 11 53 142 22 71 0North Carolina 181 3 32 101 12 33 0North Dakota 5 0 0 4 0 1 0
National Center for Education Statistics
StateAll STEM
fields
STEM field
See notes at end of table.
Table 12a. Number of doctor's degree awards conferred in science, technology, engineering, and Table 12a. mathematics (STEM) fields to women at Title IV institutions, by field and state: Academic year Table 12a. 2000–01
Computer and information
sciences
Engineering and engineering
technologies
Biological and biomedical
sciencesMathematics
and statisticsPhysical sciences
Science technologies

Ohio 162 0 39 54 7 57 5Oklahoma 32 0 8 17 3 4 0Oregon 46 0 6 24 4 12 0Pennsylvania 205 10 54 80 8 53 0Rhode Island 34 1 3 11 5 14 0
South Carolina 30 0 8 14 2 6 0South Dakota 4 0 0 3 0 1 0Tennessee 71 2 8 47 4 10 0Texas 259 12 50 115 22 60 0Utah 33 1 4 17 4 7 0
Vermont 14 0 2 12 0 0 0Virginia 98 3 18 52 3 22 0Washington 79 2 17 35 5 20 0West Virginia 11 1 4 5 0 1 0Wisconsin 84 1 9 49 7 15 3Wyoming 4 0 0 3 0 1 0SOURCE: U.S. Department of Education, National Center for Education Statistics, Integrated Postsecondary Education Data System (IPEDS), Fall 2001, Completions component.
StateAll STEM
fields
STEM field
Table 12a. Number of doctor's degree awards conferred in science, technology, engineering, and Table 12a. mathematics (STEM) fields to women at Title IV institutions, by field and state: Academic year Table 12a. 2000–01—Continued
Computer and information
sciences
Engineering and engineering
technologies
Biological and biomedical
sciencesMathematics
and statisticsPhysical sciences
Science technologies

United States 27.4 16.3 16.7 43.8 27.5 26.6 61.3
Alabama 33.1 0.0 28.8 43.1 30.8 24.2 †Alaska 63.2 † † 77.8 † 50.0 †Arizona 23.6 50.0 15.0 42.6 27.3 20.3 †Arkansas 28.9 † 14.3 36.4 0.0 28.6 †California 26.6 18.5 18.7 46.2 21.8 24.2 †
Colorado 29.7 25.0 17.7 48.2 28.6 29.3 100.0Connecticut 33.7 33.3 23.7 45.3 22.2 31.3 †Delaware 21.7 20.0 15.8 25.0 33.3 31.6 †District of Columbia 32.4 20.0 16.7 53.2 15.4 36.7 †Florida 22.7 21.4 13.5 41.3 16.7 29.1 †
Georgia 26.8 11.8 20.3 37.2 44.4 28.8 †Hawaii 28.3 † 14.3 34.8 0.0 26.7 †Idaho 9.4 0.0 8.3 7.1 50.0 0.0 †Illinois 28.2 10.0 20.1 46.1 29.0 24.8 50.0Indiana 22.7 0.0 11.6 39.1 37.5 25.2 †
Iowa 28.9 37.5 14.3 43.4 47.1 20.9 †Kansas 26.2 0.0 6.8 41.5 23.1 35.5 †Kentucky 27.8 † 15.4 28.1 41.7 26.7 †Louisiana 25.9 18.2 17.4 38.0 9.1 27.9 †Maine 35.3 0.0 66.7 50.0 † 12.5 †
Maryland 30.0 3.8 19.7 48.6 21.9 27.3 †Massachusetts 26.1 13.8 14.7 43.5 23.5 25.7 †Michigan 27.2 31.6 14.7 46.5 31.7 31.9 †Minnesota 28.7 9.1 16.8 45.8 58.8 29.3 0.0Mississippi 24.6 0.0 15.8 36.8 50.0 18.8 †
Missouri 31.5 42.9 12.1 44.1 20.0 30.9 75.0Montana 20.0 † 0.0 20.0 12.5 30.0 †Nebraska 24.5 0.0 † 38.9 † 11.1 75.0Nevada 20.7 † 30.8 25.0 † 8.3 †New Hampshire 32.3 50.0 0.0 35.7 25.0 42.9 †
New Jersey 34.7 25.0 29.7 52.5 10.0 31.1 †New Mexico 27.1 0.0 21.9 45.5 33.3 24.3 60.0New York 26.1 12.2 15.5 39.6 28.6 25.7 †North Carolina 35.8 15.8 21.3 47.6 31.6 37.9 †North Dakota 29.4 0.0 0.0 57.1 0.0 16.7 †
National Center for Education Statistics
StateAll STEM
fields
STEM field
See notes at end of table.
Table 12b. Percentage of doctor's degree awards conferred in science, technology, engineering, and Table 12b. mathematics (STEM) fields to women at Title IV institutions, by field and state: Academic year Table 12b. 2000–01
Computer and information
sciences
Engineering and engineering
technologies
Biological and biomedical
sciencesMathematics
and statisticsPhysical sciences
Science technologies

Ohio 25.0 0.0 14.6 36.5 23.3 31.5 50.0Oklahoma 25.0 0.0 16.3 42.5 42.9 14.8 †Oregon 33.6 0.0 19.4 51.1 40.0 25.0 †Pennsylvania 26.5 18.9 17.5 40.8 21.6 29.4 †Rhode Island 33.7 50.0 11.1 61.1 33.3 35.9 †
South Carolina 22.2 0.0 16.7 36.8 15.4 19.4 †South Dakota 23.5 † 0.0 30.0 † 25.0 †Tennessee 30.5 33.3 14.0 43.5 26.7 21.3 †Texas 25.5 19.0 12.8 45.8 40.0 23.3 †Utah 21.3 33.3 8.5 34.0 33.3 16.3 †
Vermont 45.2 † 33.3 66.7 † 0.0 †Virginia 27.4 13.6 11.7 51.0 30.0 31.4 †Washington 27.3 14.3 19.3 37.6 25.0 27.0 †West Virginia 28.2 100.0 26.7 41.7 0.0 10.0 †Wisconsin 25.2 9.1 7.6 50.0 23.3 20.8 100.0Wyoming 17.4 † 0.0 27.3 0.0 14.3 †
SOURCE: U.S. Department of Education, National Center for Education Statistics, Integrated Postsecondary Education Data System (IPEDS), Fall 2001, Completions component.
† Not applicable.
StateAll STEM
fields
STEM field
Table 12b. Percentage of doctor's degree awards conferred in science, technology, engineering, and Table 12b. mathematics (STEM) fields to women at Title IV institutions, by field and state: Academic year Table 12b. 2000–01—Continued
Computer and information
sciences
Engineering and engineering
technologies
Biological and biomedical
sciencesMathematics
and statisticsPhysical sciences
Science technologies
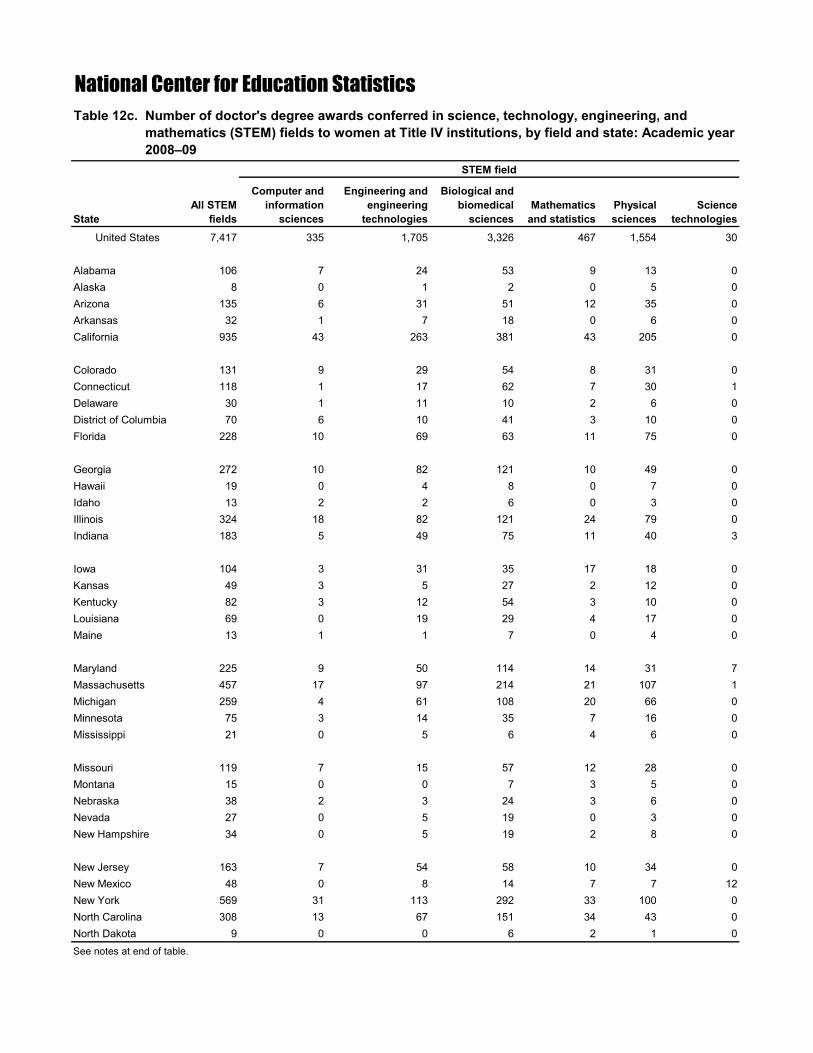
United States 7,417 335 1,705 3,326 467 1,554 30
Alabama 106 7 24 53 9 13 0Alaska 8 0 1 2 0 5 0Arizona 135 6 31 51 12 35 0Arkansas 32 1 7 18 0 6 0California 935 43 263 381 43 205 0
Colorado 131 9 29 54 8 31 0Connecticut 118 1 17 62 7 30 1Delaware 30 1 11 10 2 6 0District of Columbia 70 6 10 41 3 10 0Florida 228 10 69 63 11 75 0
Georgia 272 10 82 121 10 49 0Hawaii 19 0 4 8 0 7 0Idaho 13 2 2 6 0 3 0Illinois 324 18 82 121 24 79 0Indiana 183 5 49 75 11 40 3
Iowa 104 3 31 35 17 18 0Kansas 49 3 5 27 2 12 0Kentucky 82 3 12 54 3 10 0Louisiana 69 0 19 29 4 17 0Maine 13 1 1 7 0 4 0
Maryland 225 9 50 114 14 31 7Massachusetts 457 17 97 214 21 107 1Michigan 259 4 61 108 20 66 0Minnesota 75 3 14 35 7 16 0Mississippi 21 0 5 6 4 6 0
Missouri 119 7 15 57 12 28 0Montana 15 0 0 7 3 5 0Nebraska 38 2 3 24 3 6 0Nevada 27 0 5 19 0 3 0New Hampshire 34 0 5 19 2 8 0
New Jersey 163 7 54 58 10 34 0New Mexico 48 0 8 14 7 7 12New York 569 31 113 292 33 100 0North Carolina 308 13 67 151 34 43 0North Dakota 9 0 0 6 2 1 0
National Center for Education Statistics
See notes at end of table.
StateAll STEM
fields
STEM field
Table 12c. Number of doctor's degree awards conferred in science, technology, engineering, and Table 12c. mathematics (STEM) fields to women at Title IV institutions, by field and state: Academic year Table 12c. 2008–09
Computer and information
sciences
Engineering and engineering
technologies
Biological and biomedical
sciencesMathematics
and statisticsPhysical sciences
Science technologies
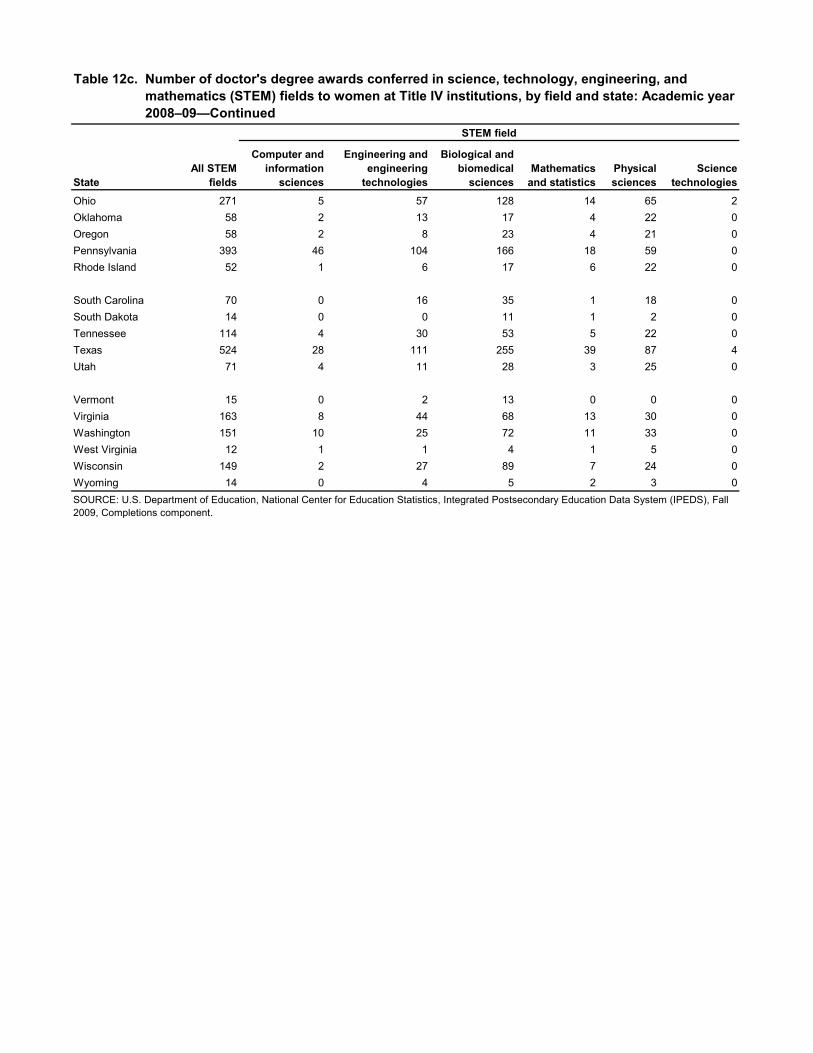
Ohio 271 5 57 128 14 65 2Oklahoma 58 2 13 17 4 22 0Oregon 58 2 8 23 4 21 0Pennsylvania 393 46 104 166 18 59 0Rhode Island 52 1 6 17 6 22 0
South Carolina 70 0 16 35 1 18 0South Dakota 14 0 0 11 1 2 0Tennessee 114 4 30 53 5 22 0Texas 524 28 111 255 39 87 4Utah 71 4 11 28 3 25 0
Vermont 15 0 2 13 0 0 0Virginia 163 8 44 68 13 30 0Washington 151 10 25 72 11 33 0West Virginia 12 1 1 4 1 5 0Wisconsin 149 2 27 89 7 24 0Wyoming 14 0 4 5 2 3 0SOURCE: U.S. Department of Education, National Center for Education Statistics, Integrated Postsecondary Education Data System (IPEDS), Fall 2009, Completions component.
StateAll STEM
fields
STEM field
Table 12c. Number of doctor's degree awards conferred in science, technology, engineering, and Table 12c. mathematics (STEM) fields to women at Title IV institutions, by field and state: Academic year Table 12c. 2008–09—Continued
Computer and information
sciences
Engineering and engineering
technologies
Biological and biomedical
sciencesMathematics
and statisticsPhysical sciences
Science technologies
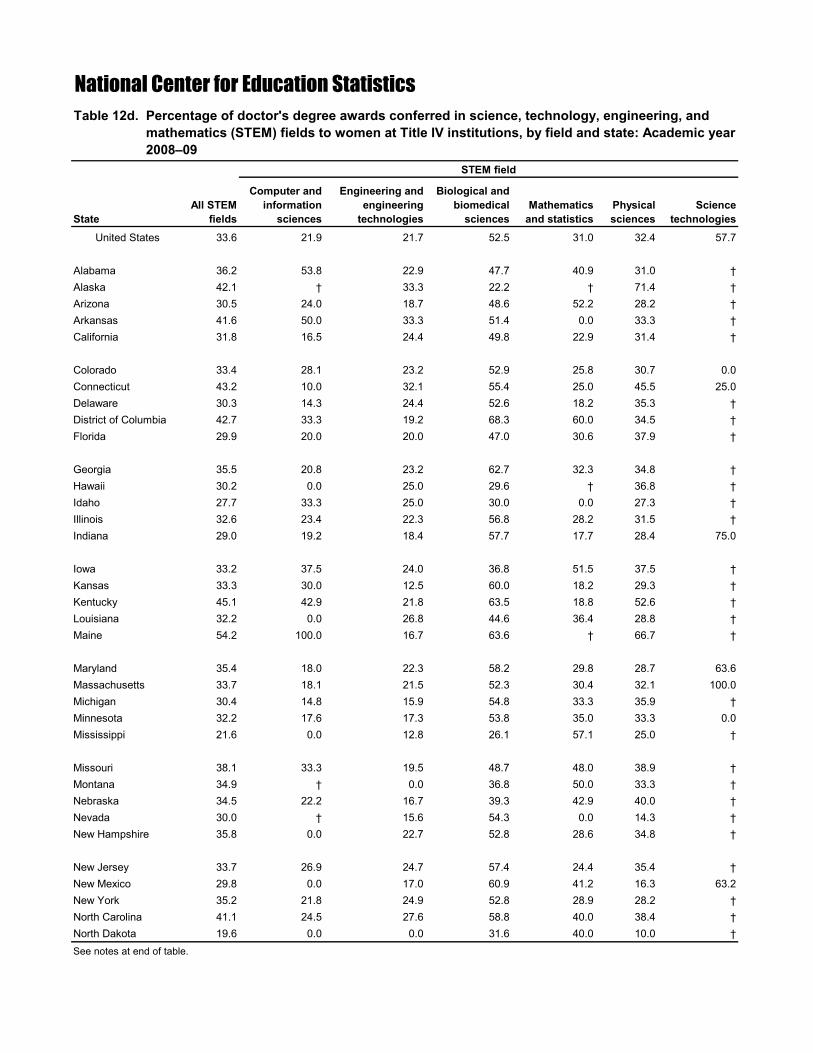
United States 33.6 21.9 21.7 52.5 31.0 32.4 57.7
Alabama 36.2 53.8 22.9 47.7 40.9 31.0 †Alaska 42.1 † 33.3 22.2 † 71.4 †Arizona 30.5 24.0 18.7 48.6 52.2 28.2 †Arkansas 41.6 50.0 33.3 51.4 0.0 33.3 †California 31.8 16.5 24.4 49.8 22.9 31.4 †
Colorado 33.4 28.1 23.2 52.9 25.8 30.7 0.0Connecticut 43.2 10.0 32.1 55.4 25.0 45.5 25.0Delaware 30.3 14.3 24.4 52.6 18.2 35.3 †District of Columbia 42.7 33.3 19.2 68.3 60.0 34.5 †Florida 29.9 20.0 20.0 47.0 30.6 37.9 †
Georgia 35.5 20.8 23.2 62.7 32.3 34.8 †Hawaii 30.2 0.0 25.0 29.6 † 36.8 †Idaho 27.7 33.3 25.0 30.0 0.0 27.3 †Illinois 32.6 23.4 22.3 56.8 28.2 31.5 †Indiana 29.0 19.2 18.4 57.7 17.7 28.4 75.0
Iowa 33.2 37.5 24.0 36.8 51.5 37.5 †Kansas 33.3 30.0 12.5 60.0 18.2 29.3 †Kentucky 45.1 42.9 21.8 63.5 18.8 52.6 †Louisiana 32.2 0.0 26.8 44.6 36.4 28.8 †Maine 54.2 100.0 16.7 63.6 † 66.7 †
Maryland 35.4 18.0 22.3 58.2 29.8 28.7 63.6Massachusetts 33.7 18.1 21.5 52.3 30.4 32.1 100.0Michigan 30.4 14.8 15.9 54.8 33.3 35.9 †Minnesota 32.2 17.6 17.3 53.8 35.0 33.3 0.0Mississippi 21.6 0.0 12.8 26.1 57.1 25.0 †
Missouri 38.1 33.3 19.5 48.7 48.0 38.9 †Montana 34.9 † 0.0 36.8 50.0 33.3 †Nebraska 34.5 22.2 16.7 39.3 42.9 40.0 †Nevada 30.0 † 15.6 54.3 0.0 14.3 †New Hampshire 35.8 0.0 22.7 52.8 28.6 34.8 †
New Jersey 33.7 26.9 24.7 57.4 24.4 35.4 †New Mexico 29.8 0.0 17.0 60.9 41.2 16.3 63.2New York 35.2 21.8 24.9 52.8 28.9 28.2 †North Carolina 41.1 24.5 27.6 58.8 40.0 38.4 †North Dakota 19.6 0.0 0.0 31.6 40.0 10.0 †
Table 12d. Percentage of doctor's degree awards conferred in science, technology, engineering, and Table 12d. mathematics (STEM) fields to women at Title IV institutions, by field and state: Academic year Table 12d. 2008–09
National Center for Education Statistics
See notes at end of table.
StateAll STEM
fields
STEM field
Computer and information
sciences
Engineering and engineering
technologies
Biological and biomedical
sciencesMathematics
and statisticsPhysical sciences
Science technologies

Ohio 33.4 13.2 18.8 54.5 26.9 36.7 40.0Oklahoma 32.8 33.3 23.2 34.0 40.0 40.0 †Oregon 29.9 15.4 14.8 43.4 21.1 38.2 †Pennsylvania 32.5 27.7 24.2 51.6 24.0 27.3 †Rhode Island 39.7 14.3 19.4 77.3 35.3 40.7 †
South Carolina 32.3 0.0 21.9 53.0 6.3 30.0 †South Dakota 56.0 0.0 0.0 73.3 100.0 40.0 †Tennessee 35.4 21.1 25.0 53.5 41.7 30.6 †Texas 33.4 27.5 19.4 53.2 39.4 28.2 80.0Utah 28.9 22.2 11.6 44.4 50.0 39.1 †
Vermont 50.0 † 50.0 65.0 0.0 0.0 †Virginia 33.1 22.9 19.4 53.1 54.2 38.0 †Washington 41.0 40.0 23.6 54.1 50.0 40.2 †West Virginia 22.6 25.0 4.3 44.4 100.0 31.3 †Wisconsin 30.8 10.0 18.2 48.1 17.5 26.7 †Wyoming 50.0 0.0 50.0 62.5 66.7 37.5 †
SOURCE: U.S. Department of Education, National Center for Education Statistics, Integrated Postsecondary Education Data System (IPEDS), Fall 2009, Completions component.
Table 12d. Percentage of doctor's degree awards conferred in science, technology, engineering, and Table 12d. mathematics (STEM) fields to women at Title IV institutions, by field and state: Academic year Table 12d. 2008–09—Continued
StateAll STEM
fields
STEM field
Physical sciences
Science technologies
† Not applicable.
Computer and information
sciences
Engineering and engineering
technologies
Biological and biomedical
sciencesMathematics
and statistics
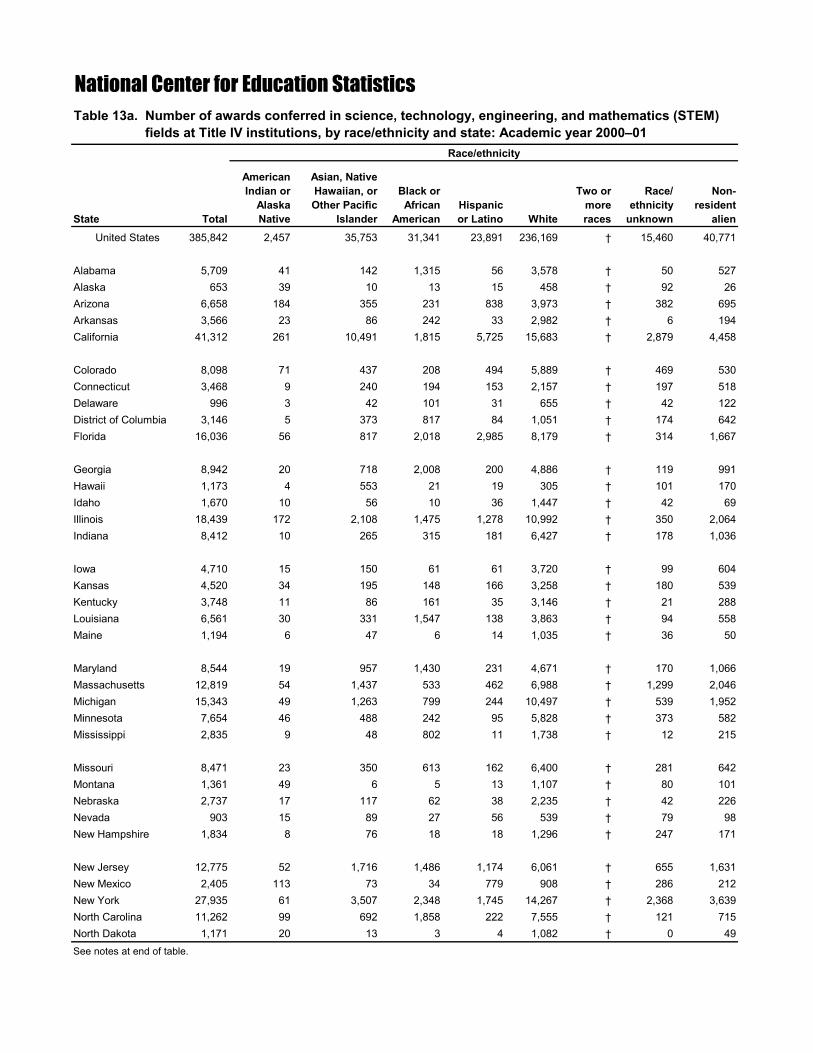
United States 385,842 2,457 35,753 31,341 23,891 236,169 † 15,460 40,771
Alabama 5,709 41 142 1,315 56 3,578 † 50 527Alaska 653 39 10 13 15 458 † 92 26Arizona 6,658 184 355 231 838 3,973 † 382 695Arkansas 3,566 23 86 242 33 2,982 † 6 194California 41,312 261 10,491 1,815 5,725 15,683 † 2,879 4,458
Colorado 8,098 71 437 208 494 5,889 † 469 530Connecticut 3,468 9 240 194 153 2,157 † 197 518Delaware 996 3 42 101 31 655 † 42 122District of Columbia 3,146 5 373 817 84 1,051 † 174 642Florida 16,036 56 817 2,018 2,985 8,179 † 314 1,667
Georgia 8,942 20 718 2,008 200 4,886 † 119 991Hawaii 1,173 4 553 21 19 305 † 101 170Idaho 1,670 10 56 10 36 1,447 † 42 69Illinois 18,439 172 2,108 1,475 1,278 10,992 † 350 2,064Indiana 8,412 10 265 315 181 6,427 † 178 1,036
Iowa 4,710 15 150 61 61 3,720 † 99 604Kansas 4,520 34 195 148 166 3,258 † 180 539Kentucky 3,748 11 86 161 35 3,146 † 21 288Louisiana 6,561 30 331 1,547 138 3,863 † 94 558Maine 1,194 6 47 6 14 1,035 † 36 50
Maryland 8,544 19 957 1,430 231 4,671 † 170 1,066Massachusetts 12,819 54 1,437 533 462 6,988 † 1,299 2,046Michigan 15,343 49 1,263 799 244 10,497 † 539 1,952Minnesota 7,654 46 488 242 95 5,828 † 373 582Mississippi 2,835 9 48 802 11 1,738 † 12 215
Missouri 8,471 23 350 613 162 6,400 † 281 642Montana 1,361 49 6 5 13 1,107 † 80 101Nebraska 2,737 17 117 62 38 2,235 † 42 226Nevada 903 15 89 27 56 539 † 79 98New Hampshire 1,834 8 76 18 18 1,296 † 247 171
New Jersey 12,775 52 1,716 1,486 1,174 6,061 † 655 1,631New Mexico 2,405 113 73 34 779 908 † 286 212New York 27,935 61 3,507 2,348 1,745 14,267 † 2,368 3,639North Carolina 11,262 99 692 1,858 222 7,555 † 121 715North Dakota 1,171 20 13 3 4 1,082 † 0 49
National Center for Education Statistics
TotalState
Race/ethnicity
Table 13a. Number of awards conferred in science, technology, engineering, and mathematics (STEM) Table 13a. fields at Title IV institutions, by race/ethnicity and state: Academic year 2000–01
See notes at end of table.
American Indian or
Alaska Native
Asian, Native Hawaiian, or Other Pacific
Islander
Non-resident
alien
Black or African
AmericanHispanic or Latino White
Two or more races
Race/ ethnicity
unknown

Ohio 15,103 30 536 793 175 11,340 † 305 1,924Oklahoma 4,502 339 222 215 127 2,852 † 10 737Oregon 3,351 30 284 36 75 2,345 † 233 348Pennsylvania 22,386 43 1,183 1,090 354 17,001 † 1,051 1,664Rhode Island 2,005 8 104 81 73 1,462 † 65 212
South Carolina 4,947 18 126 984 60 3,216 † 59 484South Dakota 1,313 18 27 9 12 1,117 † 17 113Tennessee 5,219 11 245 866 75 3,557 † 49 416Texas 26,019 92 2,401 2,250 4,484 13,445 † 230 3,117Utah 4,370 23 115 13 75 3,660 † 176 308
Vermont 781 8 28 14 9 626 † 58 38Virginia 10,262 35 855 1,639 212 6,552 † 181 788Washington 7,463 109 953 185 210 5,003 † 508 495West Virginia 2,368 11 36 54 19 2,025 † 5 218Wisconsin 8,067 43 288 146 118 6,600 † 107 765Wyoming 626 1 16 0 17 512 † 29 51
SOURCE: U.S. Department of Education, National Center for Education Statistics, Integrated Postsecondary Education Data System (IPEDS), Fall 2001, Completions component.
† Not applicable. The Two or more races category was not available for the 2000–01 academic year.
Table 13a. Number of awards conferred in science, technology, engineering, and mathematics (STEM) Table 13a. fields at Title IV institutions, by race/ethnicity and state: Academic year 2000–01—Continued
State Total
Race/ethnicity
NOTE: Awards conferred include both degrees and certificates. Science, technology, engineering, and mathematics fields includes computer and information sciences, engineering and engineering technologies, biological and biomedical sciences, mathematics and statistics, physical sciences, and science technologies. Awards to individuals of Hispanic or Latino ethnicity are included in the Hispanic or Latino category regardless of race.
American Indian or
Alaska Native
Asian, Native Hawaiian, or Other Pacific
Islander
Black or African
AmericanHispanic or Latino White
Two or more races
Race/ ethnicity
unknown
Non-resident
alien
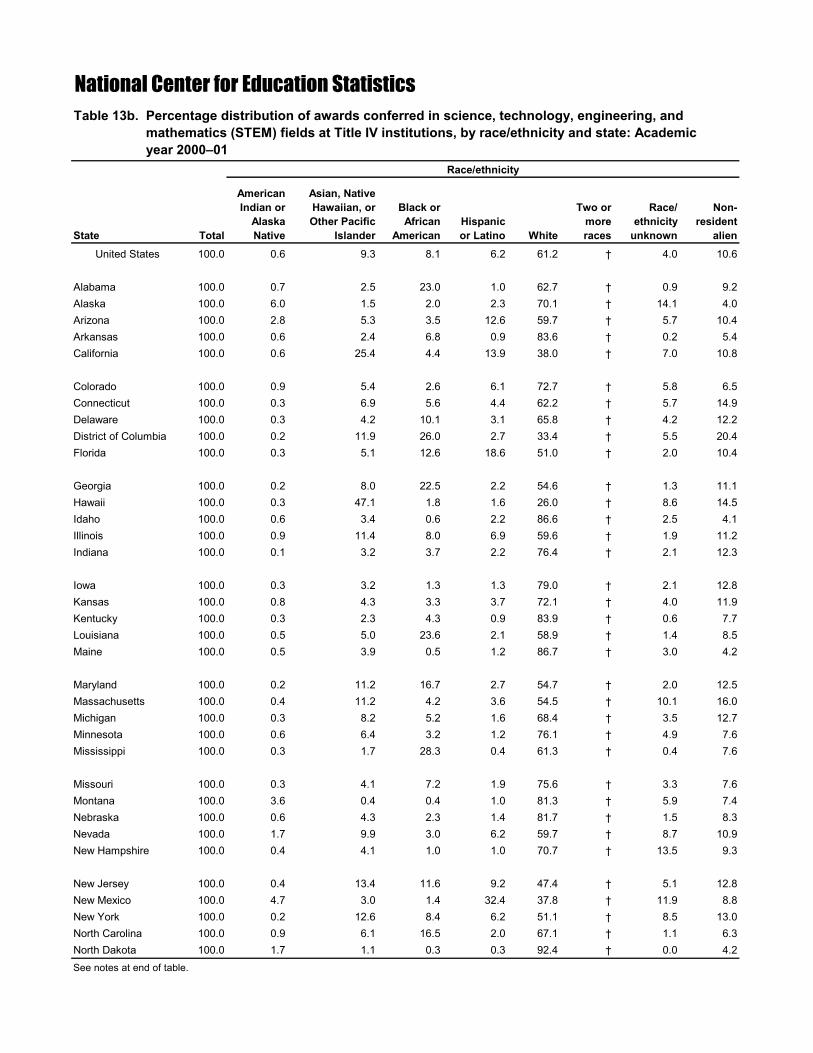
United States 100.0 0.6 9.3 8.1 6.2 61.2 † 4.0 10.6
Alabama 100.0 0.7 2.5 23.0 1.0 62.7 † 0.9 9.2Alaska 100.0 6.0 1.5 2.0 2.3 70.1 † 14.1 4.0Arizona 100.0 2.8 5.3 3.5 12.6 59.7 † 5.7 10.4Arkansas 100.0 0.6 2.4 6.8 0.9 83.6 † 0.2 5.4California 100.0 0.6 25.4 4.4 13.9 38.0 † 7.0 10.8
Colorado 100.0 0.9 5.4 2.6 6.1 72.7 † 5.8 6.5Connecticut 100.0 0.3 6.9 5.6 4.4 62.2 † 5.7 14.9Delaware 100.0 0.3 4.2 10.1 3.1 65.8 † 4.2 12.2District of Columbia 100.0 0.2 11.9 26.0 2.7 33.4 † 5.5 20.4Florida 100.0 0.3 5.1 12.6 18.6 51.0 † 2.0 10.4
Georgia 100.0 0.2 8.0 22.5 2.2 54.6 † 1.3 11.1Hawaii 100.0 0.3 47.1 1.8 1.6 26.0 † 8.6 14.5Idaho 100.0 0.6 3.4 0.6 2.2 86.6 † 2.5 4.1Illinois 100.0 0.9 11.4 8.0 6.9 59.6 † 1.9 11.2Indiana 100.0 0.1 3.2 3.7 2.2 76.4 † 2.1 12.3
Iowa 100.0 0.3 3.2 1.3 1.3 79.0 † 2.1 12.8Kansas 100.0 0.8 4.3 3.3 3.7 72.1 † 4.0 11.9Kentucky 100.0 0.3 2.3 4.3 0.9 83.9 † 0.6 7.7Louisiana 100.0 0.5 5.0 23.6 2.1 58.9 † 1.4 8.5Maine 100.0 0.5 3.9 0.5 1.2 86.7 † 3.0 4.2
Maryland 100.0 0.2 11.2 16.7 2.7 54.7 † 2.0 12.5Massachusetts 100.0 0.4 11.2 4.2 3.6 54.5 † 10.1 16.0Michigan 100.0 0.3 8.2 5.2 1.6 68.4 † 3.5 12.7Minnesota 100.0 0.6 6.4 3.2 1.2 76.1 † 4.9 7.6Mississippi 100.0 0.3 1.7 28.3 0.4 61.3 † 0.4 7.6
Missouri 100.0 0.3 4.1 7.2 1.9 75.6 † 3.3 7.6Montana 100.0 3.6 0.4 0.4 1.0 81.3 † 5.9 7.4Nebraska 100.0 0.6 4.3 2.3 1.4 81.7 † 1.5 8.3Nevada 100.0 1.7 9.9 3.0 6.2 59.7 † 8.7 10.9New Hampshire 100.0 0.4 4.1 1.0 1.0 70.7 † 13.5 9.3
New Jersey 100.0 0.4 13.4 11.6 9.2 47.4 † 5.1 12.8New Mexico 100.0 4.7 3.0 1.4 32.4 37.8 † 11.9 8.8New York 100.0 0.2 12.6 8.4 6.2 51.1 † 8.5 13.0North Carolina 100.0 0.9 6.1 16.5 2.0 67.1 † 1.1 6.3North Dakota 100.0 1.7 1.1 0.3 0.3 92.4 † 0.0 4.2
National Center for Education StatisticsTable 13b. Percentage distribution of awards conferred in science, technology, engineering, and Table 13b. mathematics (STEM) fields at Title IV institutions, by race/ethnicity and state: Academic Table 13b. year 2000–01
See notes at end of table.
State Total
Race/ethnicity
American Indian or
Alaska Native
Race/ ethnicity
unknown
Non-resident
alien
Asian, Native Hawaiian, or Other Pacific
Islander
Black or African
AmericanHispanic or Latino White
Two or more races

Ohio 100.0 0.2 3.5 5.3 1.2 75.1 † 2.0 12.7Oklahoma 100.0 7.5 4.9 4.8 2.8 63.3 † 0.2 16.4Oregon 100.0 0.9 8.5 1.1 2.2 70.0 † 7.0 10.4Pennsylvania 100.0 0.2 5.3 4.9 1.6 75.9 † 4.7 7.4Rhode Island 100.0 0.4 5.2 4.0 3.6 72.9 † 3.2 10.6
South Carolina 100.0 0.4 2.5 19.9 1.2 65.0 † 1.2 9.8South Dakota 100.0 1.4 2.1 0.7 0.9 85.1 † 1.3 8.6Tennessee 100.0 0.2 4.7 16.6 1.4 68.2 † 0.9 8.0Texas 100.0 0.4 9.2 8.6 17.2 51.7 † 0.9 12.0Utah 100.0 0.5 2.6 0.3 1.7 83.8 † 4.0 7.0
Vermont 100.0 1.0 3.6 1.8 1.2 80.2 † 7.4 4.9Virginia 100.0 0.3 8.3 16.0 2.1 63.8 † 1.8 7.7Washington 100.0 1.5 12.8 2.5 2.8 67.0 † 6.8 6.6West Virginia 100.0 0.5 1.5 2.3 0.8 85.5 † 0.2 9.2Wisconsin 100.0 0.5 3.6 1.8 1.5 81.8 † 1.3 9.5Wyoming 100.0 0.2 2.6 0.0 2.7 81.8 † 4.6 8.1
Table 13b. Percentage distribution of awards conferred in science, technology, engineering, and Table 13b. mathematics (STEM) fields at Title IV institutions, by race/ethnicity and state: Academic Table 13b. year 2000–01—Continued
SOURCE: U.S. Department of Education, National Center for Education Statistics, Integrated Postsecondary Education Data System (IPEDS), Fall 2001, Completions component.
† Not applicable. The Two or more races category was not available for the 2000–01 academic year.
State Total
Race/ethnicity
NOTE: Awards conferred include both degrees and certificates. Science, technology, engineering, and mathematics fields includes computer and information sciences, engineering and engineering technologies, biological and biomedical sciences, mathematics and statistics, physical sciences, and science technologies. Awards to individuals of Hispanic or Latino ethnicity are included in the Hispanic or Latino category regardless of race. Detail may not sum to totals because of rounding.
American Indian or
Alaska Native
Asian, Native Hawaiian, or Other Pacific
Islander
Black or African
AmericanHispanic or Latino White
Two or more races
Race/ ethnicity
unknown
Non-resident
alien

United States 433,742 2,795 41,317 32,488 30,516 248,595 495 26,228 51,308
Alabama 6,069 40 164 1,213 112 3,533 1 269 737Alaska 525 29 34 12 10 388 0 11 41Arizona 12,993 257 633 757 1,379 7,268 43 1,614 1,042Arkansas 2,828 43 106 310 68 2,054 0 29 218California 47,128 260 12,600 1,468 6,446 16,048 50 4,482 5,774
Colorado 8,881 99 499 273 609 6,209 23 667 502Connecticut 5,108 19 356 212 238 2,651 0 420 1,212Delaware 1,079 3 66 76 25 716 1 49 143District of Columbia 3,408 14 397 726 130 1,390 0 369 382Florida 20,036 71 1,206 2,502 3,952 9,427 11 784 2,083
Georgia 12,156 31 1,032 2,532 420 6,279 53 262 1,547Hawaii 1,259 3 673 31 35 341 0 17 159Idaho 1,990 9 48 12 67 1,634 0 68 152Illinois 18,504 40 1,889 1,256 1,121 9,968 34 889 3,307Indiana 9,517 22 372 363 230 6,965 1 382 1,182
Iowa 5,373 16 132 95 89 3,595 4 748 694Kansas 3,951 27 155 136 190 2,780 1 183 479Kentucky 5,980 26 132 263 76 4,839 2 221 421Louisiana 5,863 32 196 1,199 145 3,450 0 158 683Maine 1,337 4 32 9 20 1,187 0 36 49
Maryland 10,045 34 1,199 1,635 373 4,811 22 985 986Massachusetts 13,997 41 1,551 606 626 7,290 11 1,650 2,222Michigan 17,896 73 1,170 1,244 379 12,168 13 853 1,996Minnesota 8,029 39 517 274 127 6,044 15 351 662Mississippi 2,989 10 60 765 32 1,867 0 46 209
Missouri 8,620 29 362 568 174 6,146 5 391 945Montana 1,379 60 14 4 12 1,106 0 95 88Nebraska 3,079 10 183 94 87 2,408 8 153 136Nevada 1,572 12 218 62 156 849 30 113 132New Hampshire 1,627 11 83 28 33 1,162 0 147 163
New Jersey 10,045 35 1,467 786 992 4,378 23 766 1,598New Mexico 2,781 169 87 53 789 1,209 0 152 322New York 29,805 95 3,134 2,128 1,835 14,303 33 2,609 5,668North Carolina 12,559 92 911 1,802 331 8,091 0 373 959North Dakota 1,398 24 22 13 9 1,140 2 19 169
Table 13c. Number of awards conferred in science, technology, engineering, and mathematics (STEM) Table 13c. fields at Title IV institutions, by race/ethnicity and state: Academic year 2008–09
National Center for Education Statistics
See notes at end of table.
State Total
Race/ethnicity
American Indian or
Alaska Native
Asian, Native Hawaiian, or Other Pacific
Islander
Black or African
AmericanHispanic or Latino White
Two or more
races1
Race/ ethnicity
unknown
Non-resident
alien

Ohio 16,674 59 647 1,060 258 11,949 6 859 1,836Oklahoma 5,443 444 213 305 204 3,489 23 95 670Oregon 4,141 31 367 43 149 2,906 4 336 305Pennsylvania 22,874 41 1,508 1,051 492 15,697 18 1,304 2,763Rhode Island 2,098 8 123 77 65 1,328 5 273 219
South Carolina 4,944 23 129 850 86 3,320 5 215 316South Dakota 1,379 31 15 9 11 1,165 2 61 85Tennessee 6,097 15 232 837 134 4,166 0 202 511Texas 31,399 132 2,566 2,482 6,639 14,351 15 412 4,802Utah 5,221 30 209 42 139 4,065 0 391 345
Vermont 1,011 5 38 14 18 822 0 76 38Virginia 12,350 34 1,954 1,761 373 6,572 9 700 947Washington 8,916 79 1,202 197 381 5,715 12 746 584West Virginia 2,092 10 48 60 25 1,720 0 31 198Wisconsin 8,626 70 358 190 207 7,087 10 125 579Wyoming 671 4 8 3 18 549 0 41 48
SOURCE: U.S. Department of Education, National Center for Education Statistics, Integrated Postsecondary Education Data System (IPEDS), Fall 2009, Completions component.
1Two or more races was an optional reporting category for the IPEDS 2009-10 collection year, during which the 2008-09 Completions data were collected, and 771 institutions reported awarding degrees or certificates using this option. The figures reported here should not be considered representative of all completions awarded to individuals who could be classified into Two or more races.
Table 13c. Number of awards conferred in science, technology, engineering, and mathematics (STEM) Table 13c. fields at Title IV institutions, by race/ethnicity and state: Academic year 2008–09—Continued
State Total
Race/ethnicity
NOTE: Awards conferred include both degrees and certificates. Science, technology, engineering, and mathematics fields includes computer and information sciences, engineering and engineering technologies, biological and biomedical sciences, mathematics and statistics, physical sciences, and science technologies. Awards to individuals of Hispanic or Latino ethnicity are included in the Hispanic or Latino category regardless of race.
American Indian or
Alaska Native
Asian, Native Hawaiian, or Other Pacific
Islander
Black or African
AmericanHispanic or Latino White
Two or more
races1
Race/ ethnicity
unknown
Non-resident
alien

United States 100.0 0.6 9.5 7.5 7.0 57.3 0.1 6.0 11.8
Alabama 100.0 0.7 2.7 20.0 1.8 58.2 # 4.4 12.1Alaska 100.0 5.5 6.5 2.3 1.9 73.9 0.0 2.1 7.8Arizona 100.0 2.0 4.9 5.8 10.6 55.9 0.3 12.4 8.0Arkansas 100.0 1.5 3.7 11.0 2.4 72.6 0.0 1.0 7.7California 100.0 0.6 26.7 3.1 13.7 34.1 0.1 9.5 12.3
Colorado 100.0 1.1 5.6 3.1 6.9 69.9 0.3 7.5 5.7Connecticut 100.0 0.4 7.0 4.2 4.7 51.9 0.0 8.2 23.7Delaware 100.0 0.3 6.1 7.0 2.3 66.4 0.1 4.5 13.3District of Columbia 100.0 0.4 11.6 21.3 3.8 40.8 0.0 10.8 11.2Florida 100.0 0.4 6.0 12.5 19.7 47.1 0.1 3.9 10.4
Georgia 100.0 0.3 8.5 20.8 3.5 51.7 0.4 2.2 12.7Hawaii 100.0 0.2 53.5 2.5 2.8 27.1 0.0 1.4 12.6Idaho 100.0 0.5 2.4 0.6 3.4 82.1 0.0 3.4 7.6Illinois 100.0 0.2 10.2 6.8 6.1 53.9 0.2 4.8 17.9Indiana 100.0 0.2 3.9 3.8 2.4 73.2 # 4.0 12.4
Iowa 100.0 0.3 2.5 1.8 1.7 66.9 0.1 13.9 12.9Kansas 100.0 0.7 3.9 3.4 4.8 70.4 # 4.6 12.1Kentucky 100.0 0.4 2.2 4.4 1.3 80.9 # 3.7 7.0Louisiana 100.0 0.5 3.3 20.5 2.5 58.8 0.0 2.7 11.6Maine 100.0 0.3 2.4 0.7 1.5 88.8 0.0 2.7 3.7
Maryland 100.0 0.3 11.9 16.3 3.7 47.9 0.2 9.8 9.8Massachusetts 100.0 0.3 11.1 4.3 4.5 52.1 0.1 11.8 15.9Michigan 100.0 0.4 6.5 7.0 2.1 68.0 0.1 4.8 11.2Minnesota 100.0 0.5 6.4 3.4 1.6 75.3 0.2 4.4 8.2Mississippi 100.0 0.3 2.0 25.6 1.1 62.5 0.0 1.5 7.0
Missouri 100.0 0.3 4.2 6.6 2.0 71.3 0.1 4.5 11.0Montana 100.0 4.4 1.0 0.3 0.9 80.2 0.0 6.9 6.4Nebraska 100.0 0.3 5.9 3.1 2.8 78.2 0.3 5.0 4.4Nevada 100.0 0.8 13.9 3.9 9.9 54.0 1.9 7.2 8.4New Hampshire 100.0 0.7 5.1 1.7 2.0 71.4 0.0 9.0 10.0
New Jersey 100.0 0.3 14.6 7.8 9.9 43.6 0.2 7.6 15.9New Mexico 100.0 6.1 3.1 1.9 28.4 43.5 0.0 5.5 11.6New York 100.0 0.3 10.5 7.1 6.2 48.0 0.1 8.8 19.0North Carolina 100.0 0.7 7.3 14.3 2.6 64.4 0.0 3.0 7.6North Dakota 100.0 1.7 1.6 0.9 0.6 81.5 0.1 1.4 12.1
Table 13d. Percentage distribution of awards conferred in science, technology, engineering, and Table 13d. mathematics (STEM) fields at Title IV institutions, by race/ethnicity and state: Academic year Table 13d. 2008–09
National Center for Education Statistics
See notes at end of table.
State Total
Race/ethnicity
American Indian or
Alaska Native
Asian, Native Hawaiian, or Other Pacific
Islander
Black or African
AmericanHispanic or Latino White
Two or more
races1
Race/ ethnicity
unknown
Non-resident
alien

Ohio 100.0 0.4 3.9 6.4 1.5 71.7 # 5.2 11.0Oklahoma 100.0 8.2 3.9 5.6 3.7 64.1 0.4 1.7 12.3Oregon 100.0 0.7 8.9 1.0 3.6 70.2 0.1 8.1 7.4Pennsylvania 100.0 0.2 6.6 4.6 2.2 68.6 0.1 5.7 12.1Rhode Island 100.0 0.4 5.9 3.7 3.1 63.3 0.2 13.0 10.4
South Carolina 100.0 0.5 2.6 17.2 1.7 67.2 0.1 4.3 6.4South Dakota 100.0 2.2 1.1 0.7 0.8 84.5 0.1 4.4 6.2Tennessee 100.0 0.2 3.8 13.7 2.2 68.3 0.0 3.3 8.4Texas 100.0 0.4 8.2 7.9 21.1 45.7 # 1.3 15.3Utah 100.0 0.6 4.0 0.8 2.7 77.9 0.0 7.5 6.6
Vermont 100.0 0.5 3.8 1.4 1.8 81.3 0.0 7.5 3.8Virginia 100.0 0.3 15.8 14.3 3.0 53.2 0.1 5.7 7.7Washington 100.0 0.9 13.5 2.2 4.3 64.1 0.1 8.4 6.6West Virginia 100.0 0.5 2.3 2.9 1.2 82.2 0.0 1.5 9.5Wisconsin 100.0 0.8 4.2 2.2 2.4 82.2 0.1 1.4 6.7Wyoming 100.0 0.6 1.2 0.4 2.7 81.8 0.0 6.1 7.2
SOURCE: U.S. Department of Education, National Center for Education Statistics, Integrated Postsecondary Education Data System (IPEDS), Fall 2009, Completions component.
State Total
Race/ethnicity
# Rounds to zero.
NOTE: Awards conferred include both degrees and certificates. Science, technology, engineering, and mathematics fields includes computer and information sciences, engineering and engineering technologies, biological and biomedical sciences, mathematics and statistics, physical sciences, and science technologies. Awards to individuals of Hispanic or Latino ethnicity are included in the Hispanic or Latino category regardless of race. Detail may not sum to totals because of rounding.
American Indian or
Alaska Native
Asian, Native Hawaiian, or Other Pacific
Islander
Black or African
AmericanHispanic or Latino White
Two or more
races1
Race/ ethnicity
unknown
Non-resident
alien
Table 13d. Percentage distribution of awards conferred in science, technology, engineering, and Table 13d. mathematics (STEM) fields at Title IV institutions, by race/ethnicity and state: Academic year Table 13d. 2008–09—Continued
1Two or more races was an optional reporting category for the IPEDS 2009-10 collection year, during which the 2008-09 Completions data were collected, and 771 institutions reported awarding degrees or certificates using this option. The figures reported here should not be considered representative of all completions awarded to individuals who could be classified into Two or more races.

United States 12.4 13.8 15.6 3.7 27.7 5.3 † 69.7 25.8
Alabama 6.3 -2.4 15.5 -7.8 100.0 -1.3 † 438.0 39.8Alaska -19.6 -25.6 240.0 -7.7 -33.3 -15.3 † -88.0 57.7Arizona 95.1 39.7 78.3 227.7 64.6 82.9 † 322.5 49.9Arkansas -20.7 87.0 23.3 28.1 106.1 -31.1 † 383.3 12.4California 14.1 -0.4 20.1 -19.1 12.6 2.3 † 55.7 29.5
Colorado 9.7 39.4 14.2 31.3 23.3 5.4 † 42.2 -5.3Connecticut 47.3 111.1 48.3 9.3 55.6 22.9 † 113.2 134.0Delaware 8.3 0.0 57.1 -24.8 -19.4 9.3 † 16.7 17.2District of Columbia 8.3 180.0 6.4 -11.1 54.8 32.3 † 112.1 -40.5Florida 24.9 26.8 47.6 24.0 32.4 15.3 † 149.7 25.0
Georgia 35.9 55.0 43.7 26.1 110.0 28.5 † 120.2 56.1Hawaii 7.3 -25.0 21.7 47.6 84.2 11.8 † -83.2 -6.5Idaho 19.2 -10.0 -14.3 20.0 86.1 12.9 † 61.9 120.3Illinois 0.4 -76.7 -10.4 -14.8 -12.3 -9.3 † 154.0 60.2Indiana 13.1 120.0 40.4 15.2 27.1 8.4 † 114.6 14.1
Iowa 14.1 6.7 -12.0 55.7 45.9 -3.4 † 655.6 14.9Kansas -12.6 -20.6 -20.5 -8.1 14.5 -14.7 † 1.7 -11.1Kentucky 59.6 136.4 53.5 63.4 117.1 53.8 † 952.4 46.2Louisiana -10.6 6.7 -40.8 -22.5 5.1 -10.7 † 68.1 22.4Maine 12.0 -33.3 -31.9 50.0 42.9 14.7 † 0.0 -2.0
Maryland 17.6 78.9 25.3 14.3 61.5 3.0 † 479.4 -7.5Massachusetts 9.2 -24.1 7.9 13.7 35.5 4.3 † 27.0 8.6Michigan 16.6 49.0 -7.4 55.7 55.3 15.9 † 58.3 2.3Minnesota 4.9 -15.2 5.9 13.2 33.7 3.7 † -5.9 13.7Mississippi 5.4 11.1 25.0 -4.6 190.9 7.4 † 283.3 -2.8
Missouri 1.8 26.1 3.4 -7.3 7.4 -4.0 † 39.1 47.2Montana 1.3 22.4 133.3 -20.0 -7.7 -0.1 † 18.8 -12.9Nebraska 12.5 -41.2 56.4 51.6 128.9 7.7 † 264.3 -39.8Nevada 74.1 -20.0 144.9 129.6 178.6 57.5 † 43.0 34.7New Hampshire -11.3 37.5 9.2 55.6 83.3 -10.3 † -40.5 -4.7
New Jersey -21.4 -32.7 -14.5 -47.1 -15.5 -27.8 † 16.9 -2.0New Mexico 15.6 49.6 19.2 55.9 1.3 33.1 † -46.9 51.9New York 6.7 55.7 -10.6 -9.4 5.2 0.3 † 10.2 55.8North Carolina 11.5 -7.1 31.6 -3.0 49.1 7.1 † 208.3 34.1North Dakota 19.4 20.0 69.2 333.3 125.0 5.4 † † 244.9
Table 13e. Percentage change in number of awards conferred in science, technology, engineering, and Table 13e. mathematics (STEM) fields at Title IV institutions, by race/ethnicity and state: Academic years Table 13e. 2000–01 and 2008–09
See notes at end of table.
National Center for Education Statistics
American Indian or
Alaska Native
Asian, Native Hawaiian, or Other Pacific
Islander
Black or African
AmericanHispanic or Latino White
Two or more races
Race/ ethnicity
unknown
Non-resident
alienState Total
Race/ethnicity

Ohio 10.4 96.7 20.7 33.7 47.4 5.4 † 181.6 -4.6Oklahoma 20.9 31.0 -4.1 41.9 60.6 22.3 † 850.0 -9.1Oregon 23.6 3.3 29.2 19.4 98.7 23.9 † 44.2 -12.4Pennsylvania 2.2 -4.7 27.5 -3.6 39.0 -7.7 † 24.1 66.0Rhode Island 4.6 0.0 18.3 -4.9 -11.0 -9.2 † 320.0 3.3
South Carolina -0.1 27.8 2.4 -13.6 43.3 3.2 † 264.4 -34.7South Dakota 5.0 72.2 -44.4 0.0 -8.3 4.3 † 258.8 -24.8Tennessee 16.8 36.4 -5.3 -3.3 78.7 17.1 † 312.2 22.8Texas 20.7 43.5 6.9 10.3 48.1 6.7 † 79.1 54.1Utah 19.5 30.4 81.7 223.1 85.3 11.1 † 122.2 12.0
Vermont 29.4 -37.5 35.7 0.0 100.0 31.3 † 31.0 0.0Virginia 20.3 -2.9 128.5 7.4 75.9 0.3 † 286.7 20.2Washington 19.5 -27.5 26.1 6.5 81.4 14.2 † 46.9 18.0West Virginia -11.7 -9.1 33.3 11.1 31.6 -15.1 † 520.0 -9.2Wisconsin 6.9 62.8 24.3 30.1 75.4 7.4 † 16.8 -24.3Wyoming 7.2 300.0 -50.0 † 5.9 7.2 † 41.4 -5.9
SOURCE: U.S. Department of Education, National Center for Education Statistics, Integrated Postsecondary Education Data System (IPEDS), Fall 2001 and Fall 2009, Completions component.
Table 13e. Percentage change in number of awards conferred in science, technology, engineering, and Table 13e. mathematics (STEM) fields at Title IV institutions, by race/ethnicity and state: Academic years Table 13e. 2000–01 and 2008–09—Continued
State Total
Race/ethnicity
NOTE: Awards conferred include both degrees and certificates. The Two or more races category was not available for the 2000–01 academic year. Science, technology, engineering, and mathematics fields includes computer and information sciences, engineering and engineering technologies, biological and biomedical sciences, mathematics and statistics, physical sciences, and science technologies. Awards to individuals of Hispanic or Latino ethnicity are included in the Hispanic or Latino category regardless of race.
Asian, Native Hawaiian, or Other Pacific
Islander
Black or African
AmericanHispanic or Latino White
Two or more races
Race/ ethnicity
unknown
Non-resident
alien
† Not applicable.
American Indian or
Alaska Native

United States 2,457 846 928 457 71 146 9
Alabama 41 10 18 8 1 4 0Alaska 39 30 5 2 1 1 0Arizona 184 52 108 18 2 4 0Arkansas 23 8 7 7 0 1 0California 261 60 110 61 11 19 0
Colorado 71 24 19 16 3 9 0Connecticut 9 1 4 1 1 2 0Delaware 3 1 1 0 0 1 0District of Columbia 5 4 1 0 0 0 0Florida 56 22 24 7 0 3 0
Georgia 20 6 12 1 0 1 0Hawaii 4 4 0 0 0 0 0Idaho 10 6 2 1 1 0 0Illinois 172 134 14 14 5 5 0Indiana 10 2 4 4 0 0 0
Iowa 15 6 6 2 0 1 0Kansas 34 4 24 5 0 1 0Kentucky 11 2 1 6 2 0 0Louisiana 30 9 17 3 0 1 0Maine 6 2 2 2 0 0 0
Maryland 19 6 5 4 1 3 0Massachusetts 54 12 17 16 3 6 0Michigan 49 13 25 6 3 2 0Minnesota 46 22 15 5 2 2 0Mississippi 9 0 3 3 2 1 0
Missouri 23 8 7 7 1 0 0Montana 49 12 27 9 0 1 0Nebraska 17 10 1 5 0 1 0Nevada 15 4 5 4 1 1 0New Hampshire 8 3 1 3 1 0 0
New Jersey 52 28 19 1 2 2 0New Mexico 113 42 51 13 0 7 0New York 61 22 21 9 2 7 0North Carolina 99 36 23 30 3 7 0North Dakota 20 14 3 1 0 2 0
National Center for Education Statistics
StateAll STEM
fields
STEM field
Table 14a. Number of awards conferred in science, technology, engineering, and mathematics (STEM) Table 14a. fields to American Indian or Alaska Native students at Title IV institutions, by field and state: Table 14a. Academic year 2000–01
Computer and information
sciences
Engineering and engineering
technologies
Biological and biomedical
sciencesMathematics
and statisticsPhysical sciences
Science technologies
See notes at end of table.

Ohio 30 7 16 6 0 1 0Oklahoma 339 74 133 86 14 27 5Oregon 30 6 20 2 1 0 1Pennsylvania 43 14 16 8 3 2 0Rhode Island 8 4 2 1 0 1 0
South Carolina 18 3 8 5 0 2 0South Dakota 18 5 9 4 0 0 0Tennessee 11 2 6 2 0 1 0Texas 92 26 37 20 0 6 3Utah 23 4 11 4 1 3 0
Vermont 8 5 1 2 0 0 0Virginia 35 14 11 9 0 1 0Washington 109 33 46 21 3 6 0West Virginia 11 5 3 3 0 0 0Wisconsin 43 24 7 10 1 1 0Wyoming 1 1 0 0 0 0 0
SOURCE: U.S. Department of Education, National Center for Education Statistics, Integrated Postsecondary Education Data System (IPEDS), Fall 2001, Completions component.
Table 14a. Number of awards conferred in science, technology, engineering, and mathematics (STEM) Table 14a. fields to American Indian or Alaska Native students at Title IV institutions, by field and state: Table 14a. Academic year 2000–01—Continued
StateAll STEM
fields
STEM field
NOTE: Awards conferred include both degrees and certificates. Awards to individuals of Hispanic or Latino ethnicity are included in the Hispanic or Latino category regardless of race.
Computer and information
sciences
Engineering and engineering
technologies
Biological and biomedical
sciencesMathematics
and statisticsPhysical sciences
Science technologies

United States 100.0 34.4 37.8 18.6 2.9 5.9 0.4
Alabama 100.0 24.4 43.9 19.5 2.4 9.8 0.0Alaska 100.0 76.9 12.8 5.1 2.6 2.6 0.0Arizona 100.0 28.3 58.7 9.8 1.1 2.2 0.0Arkansas 100.0 34.8 30.4 30.4 0.0 4.3 0.0California 100.0 23.0 42.1 23.4 4.2 7.3 0.0
Colorado 100.0 33.8 26.8 22.5 4.2 12.7 0.0Connecticut 100.0 11.1 44.4 11.1 11.1 22.2 0.0Delaware 100.0 33.3 33.3 0.0 0.0 33.3 0.0District of Columbia 100.0 80.0 20.0 0.0 0.0 0.0 0.0Florida 100.0 39.3 42.9 12.5 0.0 5.4 0.0
Georgia 100.0 30.0 60.0 5.0 0.0 5.0 0.0Hawaii 100.0 100.0 0.0 0.0 0.0 0.0 0.0Idaho 100.0 60.0 20.0 10.0 10.0 0.0 0.0Illinois 100.0 77.9 8.1 8.1 2.9 2.9 0.0Indiana 100.0 20.0 40.0 40.0 0.0 0.0 0.0
Iowa 100.0 40.0 40.0 13.3 0.0 6.7 0.0Kansas 100.0 11.8 70.6 14.7 0.0 2.9 0.0Kentucky 100.0 18.2 9.1 54.5 18.2 0.0 0.0Louisiana 100.0 30.0 56.7 10.0 0.0 3.3 0.0Maine 100.0 33.3 33.3 33.3 0.0 0.0 0.0
Maryland 100.0 31.6 26.3 21.1 5.3 15.8 0.0Massachusetts 100.0 22.2 31.5 29.6 5.6 11.1 0.0Michigan 100.0 26.5 51.0 12.2 6.1 4.1 0.0Minnesota 100.0 47.8 32.6 10.9 4.3 4.3 0.0Mississippi 100.0 0.0 33.3 33.3 22.2 11.1 0.0
Missouri 100.0 34.8 30.4 30.4 4.3 0.0 0.0Montana 100.0 24.5 55.1 18.4 0.0 2.0 0.0Nebraska 100.0 58.8 5.9 29.4 0.0 5.9 0.0Nevada 100.0 26.7 33.3 26.7 6.7 6.7 0.0New Hampshire 100.0 37.5 12.5 37.5 12.5 0.0 0.0
New Jersey 100.0 53.8 36.5 1.9 3.8 3.8 0.0New Mexico 100.0 37.2 45.1 11.5 0.0 6.2 0.0New York 100.0 36.1 34.4 14.8 3.3 11.5 0.0North Carolina 100.0 36.4 23.2 30.3 3.0 7.1 0.0North Dakota 100.0 70.0 15.0 5.0 0.0 10.0 0.0
National Center for Education Statistics
StateAll STEM
fields
STEM field
Table 14b. Percentage distribution of awards conferred in science, technology, engineering, and Table 14b. mathematics (STEM) fields to American Indian or Alaska Native students at Title IV Table 14b. institutions, by field and state: Academic year 2000–01
See notes at end of table.
Computer and information
sciences
Engineering and engineering
technologies
Biological and biomedical
sciencesMathematics
and statisticsPhysical sciences
Science technologies

Ohio 100.0 23.3 53.3 20.0 0.0 3.3 0.0Oklahoma 100.0 21.8 39.2 25.4 4.1 8.0 1.5Oregon 100.0 20.0 66.7 6.7 3.3 0.0 3.3Pennsylvania 100.0 32.6 37.2 18.6 7.0 4.7 0.0Rhode Island 100.0 50.0 25.0 12.5 0.0 12.5 0.0
South Carolina 100.0 16.7 44.4 27.8 0.0 11.1 0.0South Dakota 100.0 27.8 50.0 22.2 0.0 0.0 0.0Tennessee 100.0 18.2 54.5 18.2 0.0 9.1 0.0Texas 100.0 28.3 40.2 21.7 0.0 6.5 3.3Utah 100.0 17.4 47.8 17.4 4.3 13.0 0.0
Vermont 100.0 62.5 12.5 25.0 0.0 0.0 0.0Virginia 100.0 40.0 31.4 25.7 0.0 2.9 0.0Washington 100.0 30.3 42.2 19.3 2.8 5.5 0.0West Virginia 100.0 45.5 27.3 27.3 0.0 0.0 0.0Wisconsin 100.0 55.8 16.3 23.3 2.3 2.3 0.0Wyoming 100.0 100.0 0.0 0.0 0.0 0.0 0.0
SOURCE: U.S. Department of Education, National Center for Education Statistics, Integrated Postsecondary Education Data System (IPEDS), Fall 2001, Completions component.
Table 14b. Percentage distribution of awards conferred in science, technology, engineering, and Table 14b. mathematics (STEM) fields to American Indian or Alaska Native students at Title IV Table 14b. institutions, by field and state: Academic year 2000–01—Continued
StateAll STEM
fields
NOTE: Awards conferred include both degrees and certificates. Awards to individuals of Hispanic or Latino ethnicity are included in the Hispanic or Latino category regardless of race. Detail may not sum to totals because of rounding.
Computer and information
sciences
Engineering and engineering
technologies
Biological and biomedical
sciencesMathematics
and statisticsPhysical sciences
Science technologies
STEM field
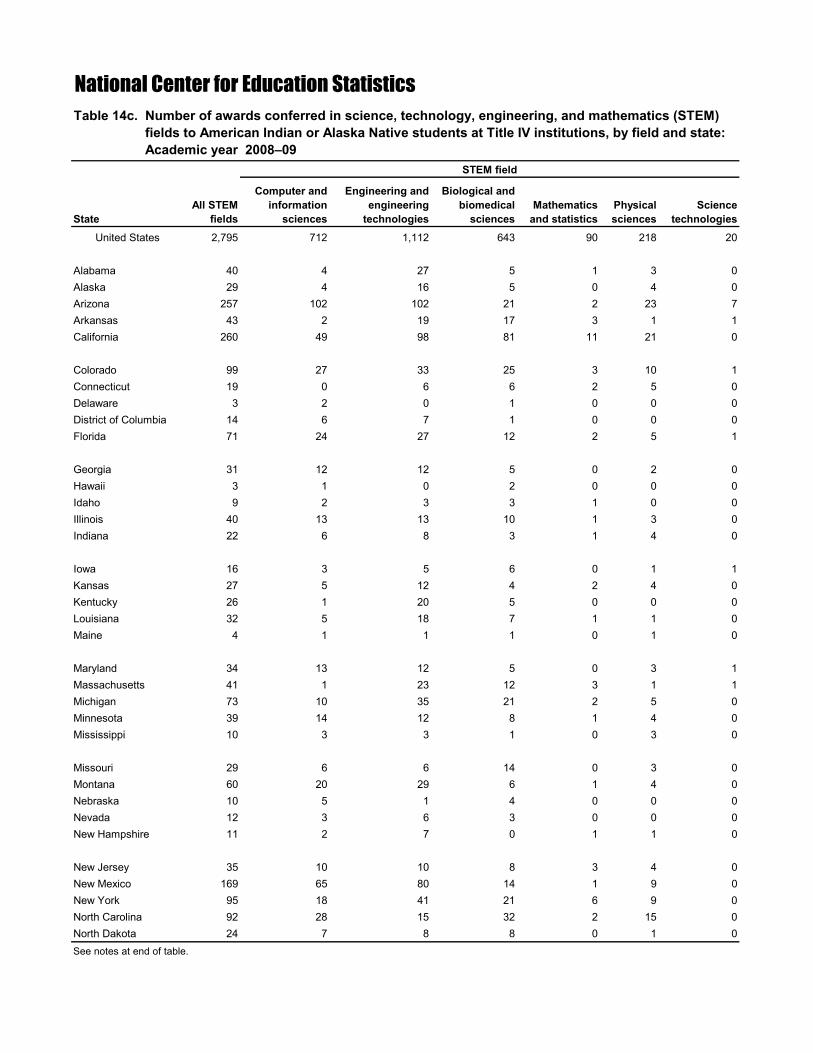
United States 2,795 712 1,112 643 90 218 20
Alabama 40 4 27 5 1 3 0Alaska 29 4 16 5 0 4 0Arizona 257 102 102 21 2 23 7Arkansas 43 2 19 17 3 1 1California 260 49 98 81 11 21 0
Colorado 99 27 33 25 3 10 1Connecticut 19 0 6 6 2 5 0Delaware 3 2 0 1 0 0 0District of Columbia 14 6 7 1 0 0 0Florida 71 24 27 12 2 5 1
Georgia 31 12 12 5 0 2 0Hawaii 3 1 0 2 0 0 0Idaho 9 2 3 3 1 0 0Illinois 40 13 13 10 1 3 0Indiana 22 6 8 3 1 4 0
Iowa 16 3 5 6 0 1 1Kansas 27 5 12 4 2 4 0Kentucky 26 1 20 5 0 0 0Louisiana 32 5 18 7 1 1 0Maine 4 1 1 1 0 1 0
Maryland 34 13 12 5 0 3 1Massachusetts 41 1 23 12 3 1 1Michigan 73 10 35 21 2 5 0Minnesota 39 14 12 8 1 4 0Mississippi 10 3 3 1 0 3 0
Missouri 29 6 6 14 0 3 0Montana 60 20 29 6 1 4 0Nebraska 10 5 1 4 0 0 0Nevada 12 3 6 3 0 0 0New Hampshire 11 2 7 0 1 1 0
New Jersey 35 10 10 8 3 4 0New Mexico 169 65 80 14 1 9 0New York 95 18 41 21 6 9 0North Carolina 92 28 15 32 2 15 0North Dakota 24 7 8 8 0 1 0See notes at end of table.
National Center for Education Statistics
StateAll STEM
fields
STEM field
Table 14c. Number of awards conferred in science, technology, engineering, and mathematics (STEM) Table 14c. fields to American Indian or Alaska Native students at Title IV institutions, by field and state: Table 14c. Academic year 2008–09
Computer and information
sciences
Engineering and engineering
technologies
Biological and biomedical
sciencesMathematics
and statisticsPhysical sciences
Science technologies

Ohio 59 18 15 19 0 7 0Oklahoma 444 112 181 113 18 20 0Oregon 31 7 9 10 1 4 0Pennsylvania 41 15 16 5 4 1 0Rhode Island 8 3 3 0 1 1 0
South Carolina 23 6 9 7 1 0 0South Dakota 31 13 12 3 0 3 0Tennessee 15 2 6 5 1 1 0Texas 132 16 57 40 3 10 6Utah 30 3 14 8 3 2 0
Vermont 5 1 2 1 0 1 0Virginia 34 9 11 11 2 1 0Washington 79 25 20 24 3 7 0West Virginia 10 1 4 2 1 1 1Wisconsin 70 7 37 17 2 7 0Wyoming 4 0 1 1 0 2 0
SOURCE: U.S. Department of Education, National Center for Education Statistics, Integrated Postsecondary Education Data System (IPEDS), Fall 2009, Completions component.
Table 14c. Number of awards conferred in science, technology, engineering, and mathematics (STEM) Table 14c. fields to American Indian or Alaska Native students at Title IV institutions, by field and state: Table 14c. Academic year 2008–09—Continued
StateAll STEM
fields
STEM field
NOTE: Awards conferred include both degrees and certificates. Awards to individuals of Hispanic or Latino ethnicity are included in the Hispanic or Latino category regardless of race.
Computer and information
sciences
Engineering and engineering
technologies
Biological and biomedical
sciencesMathematics
and statisticsPhysical sciences
Science technologies

United States 100.0 25.5 39.8 23.0 3.2 7.8 0.7
Alabama 100.0 10.0 67.5 12.5 2.5 7.5 0.0Alaska 100.0 13.8 55.2 17.2 0.0 13.8 0.0Arizona 100.0 39.7 39.7 8.2 0.8 8.9 2.7Arkansas 100.0 4.7 44.2 39.5 7.0 2.3 2.3California 100.0 18.8 37.7 31.2 4.2 8.1 0.0
Colorado 100.0 27.3 33.3 25.3 3.0 10.1 1.0Connecticut 100.0 0.0 31.6 31.6 10.5 26.3 0.0Delaware 100.0 66.7 0.0 33.3 0.0 0.0 0.0District of Columbia 100.0 42.9 50.0 7.1 0.0 0.0 0.0Florida 100.0 33.8 38.0 16.9 2.8 7.0 1.4
Georgia 100.0 38.7 38.7 16.1 0.0 6.5 0.0Hawaii 100.0 33.3 0.0 66.7 0.0 0.0 0.0Idaho 100.0 22.2 33.3 33.3 11.1 0.0 0.0Illinois 100.0 32.5 32.5 25.0 2.5 7.5 0.0Indiana 100.0 27.3 36.4 13.6 4.5 18.2 0.0
Iowa 100.0 18.8 31.3 37.5 0.0 6.3 6.3Kansas 100.0 18.5 44.4 14.8 7.4 14.8 0.0Kentucky 100.0 3.8 76.9 19.2 0.0 0.0 0.0Louisiana 100.0 15.6 56.3 21.9 3.1 3.1 0.0Maine 100.0 25.0 25.0 25.0 0.0 25.0 0.0
Maryland 100.0 38.2 35.3 14.7 0.0 8.8 2.9Massachusetts 100.0 2.4 56.1 29.3 7.3 2.4 2.4Michigan 100.0 13.7 47.9 28.8 2.7 6.8 0.0Minnesota 100.0 35.9 30.8 20.5 2.6 10.3 0.0Mississippi 100.0 30.0 30.0 10.0 0.0 30.0 0.0
Missouri 100.0 20.7 20.7 48.3 0.0 10.3 0.0Montana 100.0 33.3 48.3 10.0 1.7 6.7 0.0Nebraska 100.0 50.0 10.0 40.0 0.0 0.0 0.0Nevada 100.0 25.0 50.0 25.0 0.0 0.0 0.0New Hampshire 100.0 18.2 63.6 0.0 9.1 9.1 0.0
New Jersey 100.0 28.6 28.6 22.9 8.6 11.4 0.0New Mexico 100.0 38.5 47.3 8.3 0.6 5.3 0.0New York 100.0 18.9 43.2 22.1 6.3 9.5 0.0North Carolina 100.0 30.4 16.3 34.8 2.2 16.3 0.0North Dakota 100.0 29.2 33.3 33.3 0.0 4.2 0.0See notes at end of table.
National Center for Education Statistics
StateAll STEM
fields
STEM field
Table 14d. Percentage distribution of awards conferred in science, technology, engineering, and Table 14d. mathematics (STEM) fields to American Indian or Alaska Native students at Title IV Table 14d. institutions, by field and state: Academic year 2008–09
Computer and information
sciences
Engineering and engineering
technologies
Biological and biomedical
sciencesMathematics
and statisticsPhysical sciences
Science technologies

Ohio 100.0 30.5 25.4 32.2 0.0 11.9 0.0Oklahoma 100.0 25.2 40.8 25.5 4.1 4.5 0.0Oregon 100.0 22.6 29.0 32.3 3.2 12.9 0.0Pennsylvania 100.0 36.6 39.0 12.2 9.8 2.4 0.0Rhode Island 100.0 37.5 37.5 0.0 12.5 12.5 0.0
South Carolina 100.0 26.1 39.1 30.4 4.3 0.0 0.0South Dakota 100.0 41.9 38.7 9.7 0.0 9.7 0.0Tennessee 100.0 13.3 40.0 33.3 6.7 6.7 0.0Texas 100.0 12.1 43.2 30.3 2.3 7.6 4.5Utah 100.0 10.0 46.7 26.7 10.0 6.7 0.0
Vermont 100.0 20.0 40.0 20.0 0.0 20.0 0.0Virginia 100.0 26.5 32.4 32.4 5.9 2.9 0.0Washington 100.0 31.6 25.3 30.4 3.8 8.9 0.0West Virginia 100.0 10.0 40.0 20.0 10.0 10.0 10.0Wisconsin 100.0 10.0 52.9 24.3 2.9 10.0 0.0Wyoming 100.0 0.0 25.0 25.0 0.0 50.0 0.0
SOURCE: U.S. Department of Education, National Center for Education Statistics, Integrated Postsecondary Education Data System (IPEDS), Fall 2009, Completions component.
Table 14d. Percentage distribution of awards conferred in science, technology, engineering, and Table 14d. mathematics (STEM) fields to American Indian or Alaska Native students at Title IV Table 14d. institutions, by field and state: Academic year 2008–09—Continued
StateAll STEM
fields
STEM field
NOTE: Awards conferred include both degrees and certificates. Awards to individuals of Hispanic or Latino ethnicity are included in the Hispanic or Latino category regardless of race. Detail may not sum to totals because of rounding.
Computer and information
sciences
Engineering and engineering
technologies
Biological and biomedical
sciencesMathematics
and statisticsPhysical sciences
Science technologies
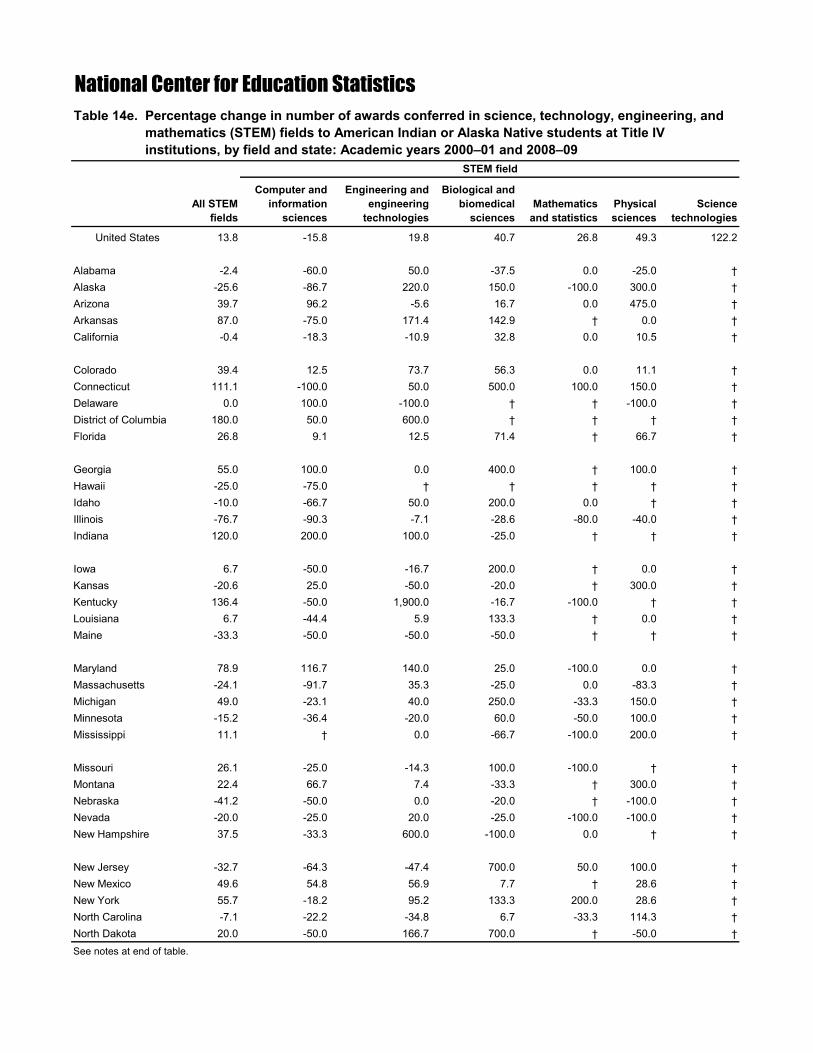
United States 13.8 -15.8 19.8 40.7 26.8 49.3 122.2
Alabama -2.4 -60.0 50.0 -37.5 0.0 -25.0 †Alaska -25.6 -86.7 220.0 150.0 -100.0 300.0 †Arizona 39.7 96.2 -5.6 16.7 0.0 475.0 †Arkansas 87.0 -75.0 171.4 142.9 † 0.0 †California -0.4 -18.3 -10.9 32.8 0.0 10.5 †
Colorado 39.4 12.5 73.7 56.3 0.0 11.1 †Connecticut 111.1 -100.0 50.0 500.0 100.0 150.0 †Delaware 0.0 100.0 -100.0 † † -100.0 †District of Columbia 180.0 50.0 600.0 † † † †Florida 26.8 9.1 12.5 71.4 † 66.7 †
Georgia 55.0 100.0 0.0 400.0 † 100.0 †Hawaii -25.0 -75.0 † † † † †Idaho -10.0 -66.7 50.0 200.0 0.0 † †Illinois -76.7 -90.3 -7.1 -28.6 -80.0 -40.0 †Indiana 120.0 200.0 100.0 -25.0 † † †
Iowa 6.7 -50.0 -16.7 200.0 † 0.0 †Kansas -20.6 25.0 -50.0 -20.0 † 300.0 †Kentucky 136.4 -50.0 1,900.0 -16.7 -100.0 † †Louisiana 6.7 -44.4 5.9 133.3 † 0.0 †Maine -33.3 -50.0 -50.0 -50.0 † † †
Maryland 78.9 116.7 140.0 25.0 -100.0 0.0 †Massachusetts -24.1 -91.7 35.3 -25.0 0.0 -83.3 †Michigan 49.0 -23.1 40.0 250.0 -33.3 150.0 †Minnesota -15.2 -36.4 -20.0 60.0 -50.0 100.0 †Mississippi 11.1 † 0.0 -66.7 -100.0 200.0 †
Missouri 26.1 -25.0 -14.3 100.0 -100.0 † †Montana 22.4 66.7 7.4 -33.3 † 300.0 †Nebraska -41.2 -50.0 0.0 -20.0 † -100.0 †Nevada -20.0 -25.0 20.0 -25.0 -100.0 -100.0 †New Hampshire 37.5 -33.3 600.0 -100.0 0.0 † †
New Jersey -32.7 -64.3 -47.4 700.0 50.0 100.0 †New Mexico 49.6 54.8 56.9 7.7 † 28.6 †New York 55.7 -18.2 95.2 133.3 200.0 28.6 †North Carolina -7.1 -22.2 -34.8 6.7 -33.3 114.3 †North Dakota 20.0 -50.0 166.7 700.0 † -50.0 †
National Center for Education Statistics
STEM field
Table 14e. Percentage change in number of awards conferred in science, technology, engineering, and Table 14e. mathematics (STEM) fields to American Indian or Alaska Native students at Title IV Table 14e. institutions, by field and state: Academic years 2000–01 and 2008–09
See notes at end of table.
Computer and information
sciences
Engineering and engineering
technologies
Biological and biomedical
sciencesMathematics
and statisticsPhysical sciences
Science technologies
All STEM fields

Ohio 96.7 157.1 -6.3 216.7 † 600.0 †Oklahoma 31.0 51.4 36.1 31.4 28.6 -25.9 -100.0Oregon 3.3 16.7 -55.0 400.0 0.0 † -100.0Pennsylvania -4.7 7.1 0.0 -37.5 33.3 -50.0 †Rhode Island 0.0 -25.0 50.0 -100.0 † 0.0 †
South Carolina 27.8 100.0 12.5 40.0 † -100.0 †South Dakota 72.2 160.0 33.3 -25.0 † † †Tennessee 36.4 0.0 0.0 150.0 † 0.0 †Texas 43.5 -38.5 54.1 100.0 † 66.7 100.0Utah 30.4 -25.0 27.3 100.0 200.0 -33.3 †
Vermont -37.5 -80.0 100.0 -50.0 † † †Virginia -2.9 -35.7 0.0 22.2 † 0.0 †Washington -27.5 -24.2 -56.5 14.3 0.0 16.7 †West Virginia -9.1 -80.0 33.3 -33.3 † † †Wisconsin 62.8 -70.8 428.6 70.0 100.0 600.0 †Wyoming 300.0 -100.0 † † † † †
NOTE: Awards conferred include both degrees and certificates. Awards to individuals of Hispanic or Latino ethnicity are included in the Hispanic or Latino category regardless of race.SOURCE: U.S. Department of Education, National Center for Education Statistics, Integrated Postsecondary Education Data System (IPEDS), Fall 2001 and Fall 2009, Completions component.
StateAll STEM
fields
† Not applicable.
Table 14e. Percentage change in number of awards conferred in science, technology, engineering, and Table 14e. mathematics (STEM) fields to American Indian or Alaska Native students at Title IV Table 14e. institutions, by field and state: Academic years 2000–01 and 2008–09—Continued
STEM field
Computer and information
sciences
Engineering and engineering
technologies
Biological and biomedical
sciencesMathematics
and statisticsPhysical sciences
Science technologies

United States 35,753 11,894 13,487 7,193 1,238 1,880 61
Alabama 142 51 43 34 2 12 0Alaska 10 2 4 3 0 1 0Arizona 355 73 185 73 7 17 0Arkansas 86 24 28 22 4 8 0California 10,491 2,643 4,636 2,213 446 538 15
Colorado 437 166 132 95 25 18 1Connecticut 240 72 67 72 8 21 0Delaware 42 17 8 8 2 7 0District of Columbia 373 244 45 73 3 8 0Florida 817 267 333 155 13 48 1
Georgia 718 267 269 111 16 54 1Hawaii 553 166 240 108 16 21 2Idaho 56 15 21 15 3 2 0Illinois 2,108 868 656 444 57 82 1Indiana 265 45 130 52 10 28 0
Iowa 150 50 59 31 6 4 0Kansas 195 61 79 37 6 12 0Kentucky 86 25 29 26 1 5 0Louisiana 331 118 113 74 13 13 0Maine 47 8 7 21 7 4 0
Maryland 957 434 261 214 21 27 0Massachusetts 1,437 328 598 327 71 105 8Michigan 1,263 241 773 166 32 49 2Minnesota 488 250 141 56 11 29 1Mississippi 48 12 13 15 2 6 0
Missouri 350 117 87 109 6 31 0Montana 6 0 3 3 0 0 0Nebraska 117 51 20 25 5 15 1Nevada 89 19 32 33 4 1 0New Hampshire 76 29 12 24 4 7 0
New Jersey 1,716 919 414 286 38 59 0New Mexico 73 21 35 10 4 2 1New York 3,507 1,743 929 563 114 154 4North Carolina 692 216 216 165 34 61 0North Dakota 13 5 3 3 1 1 0See notes at end of table.
National Center for Education Statistics
STEM field
Table 15a. Number of awards conferred in science, technology, engineering, and mathematics (STEM) Table 15a. fields to Asian, Native Hawaiian, or Other Pacific Islander students at Title IV institutions, by Table 15a. field and state: Academic year 2000–01
Computer and information
sciences
Engineering and engineering
technologies
Biological and biomedical
sciencesMathematics
and statisticsPhysical sciences
Science technologies
All STEM fields

Ohio 536 148 200 124 20 40 4Oklahoma 222 60 94 41 6 21 0Oregon 284 59 120 69 11 25 0Pennsylvania 1,183 378 431 244 47 82 1Rhode Island 104 35 28 33 2 5 1
South Carolina 126 37 45 33 3 8 0South Dakota 27 17 1 4 0 5 0Tennessee 245 39 121 58 8 19 0Texas 2,401 812 924 502 65 84 14Utah 115 33 42 24 5 10 1
Vermont 28 5 10 10 1 2 0Virginia 855 340 260 157 23 75 0Washington 953 258 476 137 39 43 0West Virginia 36 9 13 10 3 1 0Wisconsin 288 92 99 77 10 8 2Wyoming 16 5 2 4 3 2 0NOTE: Awards conferred include both degrees and certificates. Awards to individuals of Hispanic or Latino ethnicity are included in the Hispanic or Latino category regardless of race.SOURCE: U.S. Department of Education, National Center for Education Statistics, Integrated Postsecondary Education Data System (IPEDS), Fall 2001, Completions component.
StateAll STEM
fields
Computer and information
sciences
Engineering and engineering
technologies
Biological and biomedical
sciencesMathematics
and statisticsPhysical sciences
Science technologies
Table 15a. Number of awards conferred in science, technology, engineering, and mathematics (STEM) Table 15a. fields to Asian, Native Hawaiian, or Other Pacific Islander students at Title IV institutions, by Table 15a. field and state: Academic year 2000–01—Continued
STEM field

United States 100.0 33.3 37.7 20.1 3.5 5.3 0.2
Alabama 100.0 35.9 30.3 23.9 1.4 8.5 0.0Alaska 100.0 20.0 40.0 30.0 0.0 10.0 0.0Arizona 100.0 20.6 52.1 20.6 2.0 4.8 0.0Arkansas 100.0 27.9 32.6 25.6 4.7 9.3 0.0California 100.0 25.2 44.2 21.1 4.3 5.1 0.1
Colorado 100.0 38.0 30.2 21.7 5.7 4.1 0.2Connecticut 100.0 30.0 27.9 30.0 3.3 8.8 0.0Delaware 100.0 40.5 19.0 19.0 4.8 16.7 0.0District of Columbia 100.0 65.4 12.1 19.6 0.8 2.1 0.0Florida 100.0 32.7 40.8 19.0 1.6 5.9 0.1
Georgia 100.0 37.2 37.5 15.5 2.2 7.5 0.1Hawaii 100.0 30.0 43.4 19.5 2.9 3.8 0.4Idaho 100.0 26.8 37.5 26.8 5.4 3.6 0.0Illinois 100.0 41.2 31.1 21.1 2.7 3.9 #Indiana 100.0 17.0 49.1 19.6 3.8 10.6 0.0
Iowa 100.0 33.3 39.3 20.7 4.0 2.7 0.0Kansas 100.0 31.3 40.5 19.0 3.1 6.2 0.0Kentucky 100.0 29.1 33.7 30.2 1.2 5.8 0.0Louisiana 100.0 35.6 34.1 22.4 3.9 3.9 0.0Maine 100.0 17.0 14.9 44.7 14.9 8.5 0.0
Maryland 100.0 45.4 27.3 22.4 2.2 2.8 0.0Massachusetts 100.0 22.8 41.6 22.8 4.9 7.3 0.6Michigan 100.0 19.1 61.2 13.1 2.5 3.9 0.2Minnesota 100.0 51.2 28.9 11.5 2.3 5.9 0.2Mississippi 100.0 25.0 27.1 31.3 4.2 12.5 0.0
Missouri 100.0 33.4 24.9 31.1 1.7 8.9 0.0Montana 100.0 0.0 50.0 50.0 0.0 0.0 0.0Nebraska 100.0 43.6 17.1 21.4 4.3 12.8 0.9Nevada 100.0 21.3 36.0 37.1 4.5 1.1 0.0New Hampshire 100.0 38.2 15.8 31.6 5.3 9.2 0.0
New Jersey 100.0 53.6 24.1 16.7 2.2 3.4 0.0New Mexico 100.0 28.8 47.9 13.7 5.5 2.7 1.4New York 100.0 49.7 26.5 16.1 3.3 4.4 0.1North Carolina 100.0 31.2 31.2 23.8 4.9 8.8 0.0North Dakota 100.0 38.5 23.1 23.1 7.7 7.7 0.0
National Center for Education Statistics
STEM field
Table 15b. Percentange distribution of awards conferred in science, technology, engineering, and Table 15b. mathematics (STEM) fields to Asian, Native Hawaiian, or Other Pacific Islander students at Table 15b. Title IV institutions, by field and state: Academic year 2000–01
See notes at end of table.
Computer and information
sciences
Engineering and engineering
technologies
Biological and biomedical
sciencesMathematics
and statisticsPhysical sciences
Science technologies
All STEM fields

Ohio 100.0 27.6 37.3 23.1 3.7 7.5 0.7Oklahoma 100.0 27.0 42.3 18.5 2.7 9.5 0.0Oregon 100.0 20.8 42.3 24.3 3.9 8.8 0.0Pennsylvania 100.0 32.0 36.4 20.6 4.0 6.9 0.1Rhode Island 100.0 33.7 26.9 31.7 1.9 4.8 1.0
South Carolina 100.0 29.4 35.7 26.2 2.4 6.3 0.0South Dakota 100.0 63.0 3.7 14.8 0.0 18.5 0.0Tennessee 100.0 15.9 49.4 23.7 3.3 7.8 0.0Texas 100.0 33.8 38.5 20.9 2.7 3.5 0.6Utah 100.0 28.7 36.5 20.9 4.3 8.7 0.9
Vermont 100.0 17.9 35.7 35.7 3.6 7.1 0.0Virginia 100.0 39.8 30.4 18.4 2.7 8.8 0.0Washington 100.0 27.1 49.9 14.4 4.1 4.5 0.0West Virginia 100.0 25.0 36.1 27.8 8.3 2.8 0.0Wisconsin 100.0 31.9 34.4 26.7 3.5 2.8 0.7Wyoming 100.0 31.3 12.5 25.0 18.8 12.5 0.0
SOURCE: U.S. Department of Education, National Center for Education Statistics, Integrated Postsecondary Education Data System (IPEDS), Fall 2001, Completions component.
Table 15b. Percentange distribution of awards conferred in science, technology, engineering, and Table 15b. mathematics (STEM) fields to Asian, Native Hawaiian, or Other Pacific Islander students at Table 15b. Title IV institutions, by field and state: Academic year 2000–01—Continued
STEM field
StateAll STEM
fields
# Rounds to zero.NOTE: Awards conferred include both degrees and certificates. Awards to individuals of Hispanic or Latino ethnicity are included in the Hispanic or Latino category regardless of race. Detail may not sum to totals because of rounding.
Computer and information
sciences
Engineering and engineering
technologies
Biological and biomedical
sciencesMathematics
and statisticsPhysical sciences
Science technologies
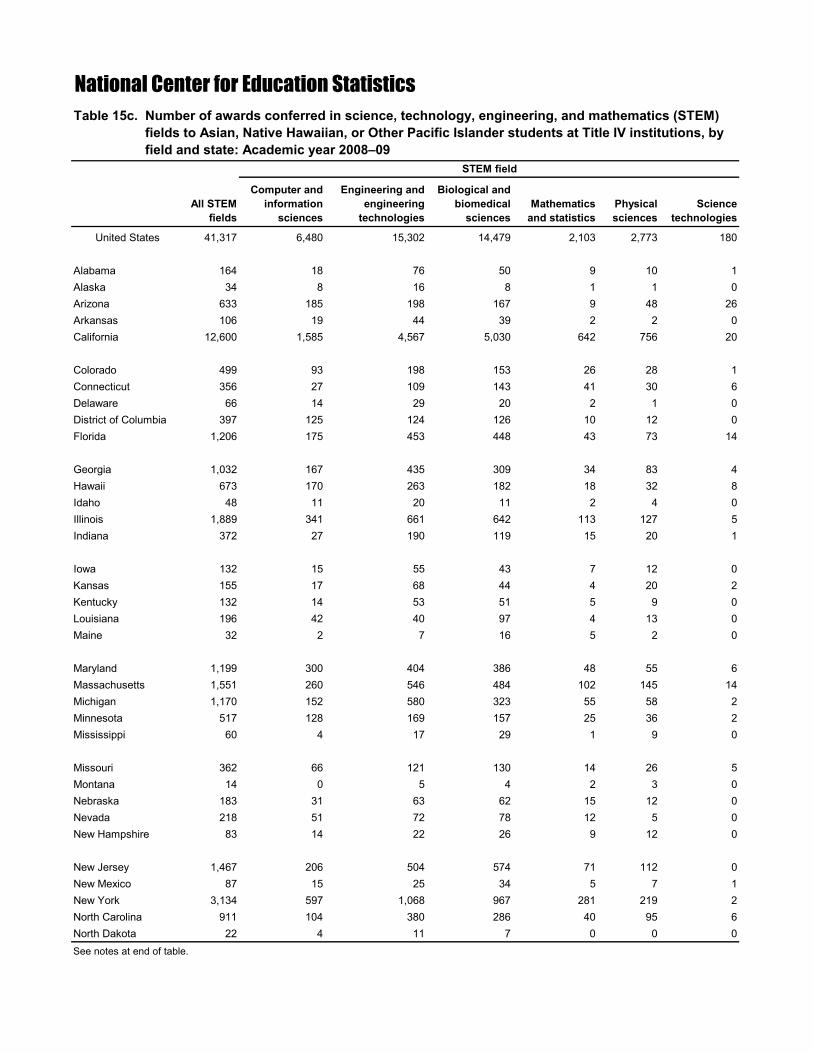
United States 41,317 6,480 15,302 14,479 2,103 2,773 180
Alabama 164 18 76 50 9 10 1Alaska 34 8 16 8 1 1 0Arizona 633 185 198 167 9 48 26Arkansas 106 19 44 39 2 2 0California 12,600 1,585 4,567 5,030 642 756 20
Colorado 499 93 198 153 26 28 1Connecticut 356 27 109 143 41 30 6Delaware 66 14 29 20 2 1 0District of Columbia 397 125 124 126 10 12 0Florida 1,206 175 453 448 43 73 14
Georgia 1,032 167 435 309 34 83 4Hawaii 673 170 263 182 18 32 8Idaho 48 11 20 11 2 4 0Illinois 1,889 341 661 642 113 127 5Indiana 372 27 190 119 15 20 1
Iowa 132 15 55 43 7 12 0Kansas 155 17 68 44 4 20 2Kentucky 132 14 53 51 5 9 0Louisiana 196 42 40 97 4 13 0Maine 32 2 7 16 5 2 0
Maryland 1,199 300 404 386 48 55 6Massachusetts 1,551 260 546 484 102 145 14Michigan 1,170 152 580 323 55 58 2Minnesota 517 128 169 157 25 36 2Mississippi 60 4 17 29 1 9 0
Missouri 362 66 121 130 14 26 5Montana 14 0 5 4 2 3 0Nebraska 183 31 63 62 15 12 0Nevada 218 51 72 78 12 5 0New Hampshire 83 14 22 26 9 12 0
New Jersey 1,467 206 504 574 71 112 0New Mexico 87 15 25 34 5 7 1New York 3,134 597 1,068 967 281 219 2North Carolina 911 104 380 286 40 95 6North Dakota 22 4 11 7 0 0 0
National Center for Education Statistics
STEM field
Table 15c. Number of awards conferred in science, technology, engineering, and mathematics (STEM) Table 15c. fields to Asian, Native Hawaiian, or Other Pacific Islander students at Title IV institutions, by Table 15c. field and state: Academic year 2008–09
See notes at end of table.
Computer and information
sciences
Engineering and engineering
technologies
Biological and biomedical
sciencesMathematics
and statisticsPhysical sciences
Science technologies
All STEM fields
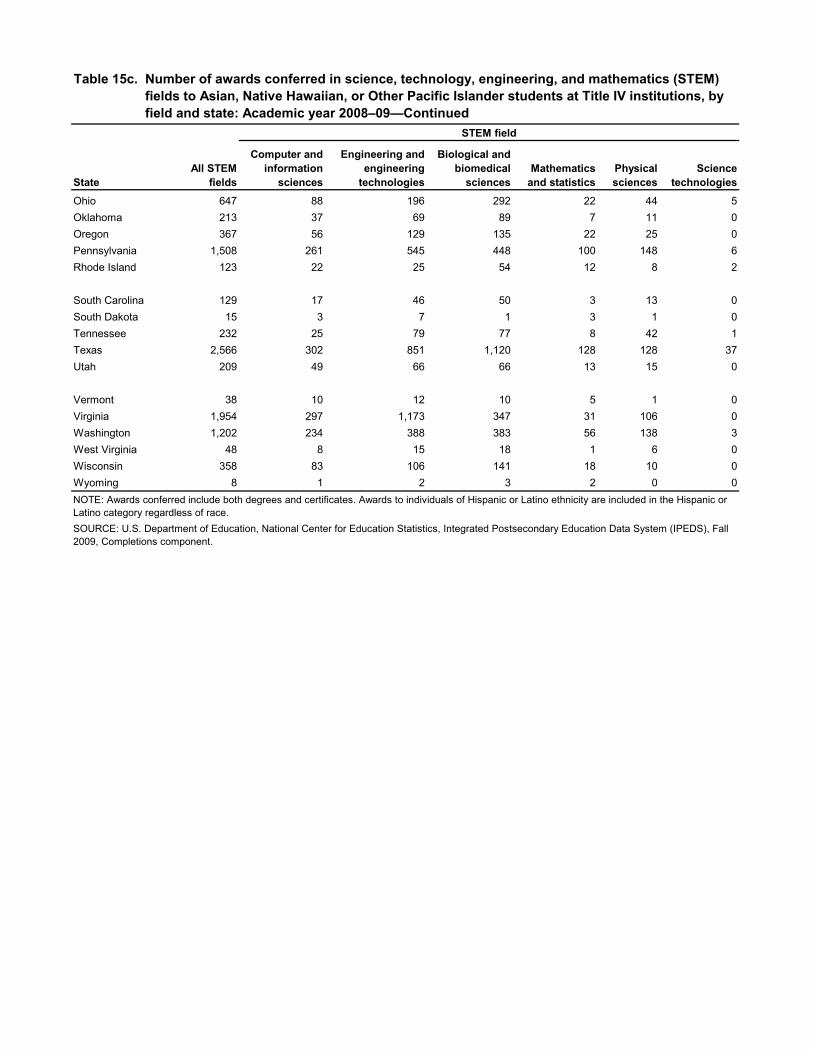
Ohio 647 88 196 292 22 44 5Oklahoma 213 37 69 89 7 11 0Oregon 367 56 129 135 22 25 0Pennsylvania 1,508 261 545 448 100 148 6Rhode Island 123 22 25 54 12 8 2
South Carolina 129 17 46 50 3 13 0South Dakota 15 3 7 1 3 1 0Tennessee 232 25 79 77 8 42 1Texas 2,566 302 851 1,120 128 128 37Utah 209 49 66 66 13 15 0
Vermont 38 10 12 10 5 1 0Virginia 1,954 297 1,173 347 31 106 0Washington 1,202 234 388 383 56 138 3West Virginia 48 8 15 18 1 6 0Wisconsin 358 83 106 141 18 10 0Wyoming 8 1 2 3 2 0 0NOTE: Awards conferred include both degrees and certificates. Awards to individuals of Hispanic or Latino ethnicity are included in the Hispanic or Latino category regardless of race.SOURCE: U.S. Department of Education, National Center for Education Statistics, Integrated Postsecondary Education Data System (IPEDS), Fall 2009, Completions component.
Table 15c. Number of awards conferred in science, technology, engineering, and mathematics (STEM) Table 15c. fields to Asian, Native Hawaiian, or Other Pacific Islander students at Title IV institutions, by Table 15c. field and state: Academic year 2008–09—Continued
STEM field
StateAll STEM
fieldsPhysical sciences
Science technologies
Computer and information
sciences
Engineering and engineering
technologies
Biological and biomedical
sciencesMathematics
and statistics

United States 100.0 15.7 37.0 35.0 5.1 6.7 0.4
Alabama 100.0 11.0 46.3 30.5 5.5 6.1 0.6Alaska 100.0 23.5 47.1 23.5 2.9 2.9 0.0Arizona 100.0 29.2 31.3 26.4 1.4 7.6 4.1Arkansas 100.0 17.9 41.5 36.8 1.9 1.9 0.0California 100.0 12.6 36.2 39.9 5.1 6.0 0.2
Colorado 100.0 18.6 39.7 30.7 5.2 5.6 0.2Connecticut 100.0 7.6 30.6 40.2 11.5 8.4 1.7Delaware 100.0 21.2 43.9 30.3 3.0 1.5 0.0District of Columbia 100.0 31.5 31.2 31.7 2.5 3.0 0.0Florida 100.0 14.5 37.6 37.1 3.6 6.1 1.2
Georgia 100.0 16.2 42.2 29.9 3.3 8.0 0.4Hawaii 100.0 25.3 39.1 27.0 2.7 4.8 1.2Idaho 100.0 22.9 41.7 22.9 4.2 8.3 0.0Illinois 100.0 18.1 35.0 34.0 6.0 6.7 0.3Indiana 100.0 7.3 51.1 32.0 4.0 5.4 0.3
Iowa 100.0 11.4 41.7 32.6 5.3 9.1 0.0Kansas 100.0 11.0 43.9 28.4 2.6 12.9 1.3Kentucky 100.0 10.6 40.2 38.6 3.8 6.8 0.0Louisiana 100.0 21.4 20.4 49.5 2.0 6.6 0.0Maine 100.0 6.3 21.9 50.0 15.6 6.3 0.0
Maryland 100.0 25.0 33.7 32.2 4.0 4.6 0.5Massachusetts 100.0 16.8 35.2 31.2 6.6 9.3 0.9Michigan 100.0 13.0 49.6 27.6 4.7 5.0 0.2Minnesota 100.0 24.8 32.7 30.4 4.8 7.0 0.4Mississippi 100.0 6.7 28.3 48.3 1.7 15.0 0.0
Missouri 100.0 18.2 33.4 35.9 3.9 7.2 1.4Montana 100.0 0.0 35.7 28.6 14.3 21.4 0.0Nebraska 100.0 16.9 34.4 33.9 8.2 6.6 0.0Nevada 100.0 23.4 33.0 35.8 5.5 2.3 0.0New Hampshire 100.0 16.9 26.5 31.3 10.8 14.5 0.0
New Jersey 100.0 14.0 34.4 39.1 4.8 7.6 0.0New Mexico 100.0 17.2 28.7 39.1 5.7 8.0 1.1New York 100.0 19.0 34.1 30.9 9.0 7.0 0.1North Carolina 100.0 11.4 41.7 31.4 4.4 10.4 0.7North Dakota 100.0 18.2 50.0 31.8 0.0 0.0 0.0
National Center for Education Statistics
STEM field
Table 15d. Percentage distribution of awards conferred in science, technology, engineering, and Table 15d. mathematics (STEM) fields to Asian, Native Hawaiian, or Other Pacific Islander students at Table 15d. Title IV institutions, by field and state: Academic year 2008–09
See notes at end of table.
Computer and information
sciences
Engineering and engineering
technologies
Biological and biomedical
sciencesMathematics
and statisticsPhysical sciences
Science technologies
All STEM fields

Ohio 100.0 13.6 30.3 45.1 3.4 6.8 0.8Oklahoma 100.0 17.4 32.4 41.8 3.3 5.2 0.0Oregon 100.0 15.3 35.1 36.8 6.0 6.8 0.0Pennsylvania 100.0 17.3 36.1 29.7 6.6 9.8 0.4Rhode Island 100.0 17.9 20.3 43.9 9.8 6.5 1.6
South Carolina 100.0 13.2 35.7 38.8 2.3 10.1 0.0South Dakota 100.0 20.0 46.7 6.7 20.0 6.7 0.0Tennessee 100.0 10.8 34.1 33.2 3.4 18.1 0.4Texas 100.0 11.8 33.2 43.6 5.0 5.0 1.4Utah 100.0 23.4 31.6 31.6 6.2 7.2 0.0
Vermont 100.0 26.3 31.6 26.3 13.2 2.6 0.0Virginia 100.0 15.2 60.0 17.8 1.6 5.4 0.0Washington 100.0 19.5 32.3 31.9 4.7 11.5 0.2West Virginia 100.0 16.7 31.3 37.5 2.1 12.5 0.0Wisconsin 100.0 23.2 29.6 39.4 5.0 2.8 0.0Wyoming 100.0 12.5 25.0 37.5 25.0 0.0 0.0
SOURCE: U.S. Department of Education, National Center for Education Statistics, Integrated Postsecondary Education Data System (IPEDS), Fall 2009, Completions component.
Table 15d. Percentage distribution of awards conferred in science, technology, engineering, and Table 15d. mathematics (STEM) fields to Asian, Native Hawaiian, or Other Pacific Islander students at Table 15d. Title IV institutions, by field and state: Academic year 2008–09—Continued
STEM field
StateAll STEM
fields
NOTE: Awards conferred include both degrees and certificates. Awards to individuals of Hispanic or Latino ethnicity are included in the Hispanic or Latino category regardless of race. Detail may not sum to totals because of rounding.
Physical sciences
Science technologies
Computer and information
sciences
Engineering and engineering
technologies
Biological and biomedical
sciencesMathematics
and statistics

United States 15.6 -45.5 13.5 101.3 69.9 47.5 195.1
Alabama 15.5 -64.7 76.7 47.1 350.0 -16.7 †Alaska 240.0 300.0 300.0 166.7 † 0.0 †Arizona 78.3 153.4 7.0 128.8 28.6 182.4 †Arkansas 23.3 -20.8 57.1 77.3 -50.0 -75.0 †California 20.1 -40.0 -1.5 127.3 43.9 40.5 33.3
Colorado 14.2 -44.0 50.0 61.1 4.0 55.6 0.0Connecticut 48.3 -62.5 62.7 98.6 412.5 42.9 †Delaware 57.1 -17.6 262.5 150.0 0.0 -85.7 †District of Columbia 6.4 -48.8 175.6 72.6 233.3 50.0 †Florida 47.6 -34.5 36.0 189.0 230.8 52.1 1,300.0
Georgia 43.7 -37.5 61.7 178.4 112.5 53.7 300.0Hawaii 21.7 2.4 9.6 68.5 12.5 52.4 300.0Idaho -14.3 -26.7 -4.8 -26.7 -33.3 100.0 †Illinois -10.4 -60.7 0.8 44.6 98.2 54.9 400.0Indiana 40.4 -40.0 46.2 128.8 50.0 -28.6 †
Iowa -12.0 -70.0 -6.8 38.7 16.7 200.0 †Kansas -20.5 -72.1 -13.9 18.9 -33.3 66.7 †Kentucky 53.5 -44.0 82.8 96.2 400.0 80.0 †Louisiana -40.8 -64.4 -64.6 31.1 -69.2 0.0 †Maine -31.9 -75.0 0.0 -23.8 -28.6 -50.0 †
Maryland 25.3 -30.9 54.8 80.4 128.6 103.7 †Massachusetts 7.9 -20.7 -8.7 48.0 43.7 38.1 75.0Michigan -7.4 -36.9 -25.0 94.6 71.9 18.4 0.0Minnesota 5.9 -48.8 19.9 180.4 127.3 24.1 100.0Mississippi 25.0 -66.7 30.8 93.3 -50.0 50.0 †
Missouri 3.4 -43.6 39.1 19.3 133.3 -16.1 †Montana 133.3 † 66.7 33.3 † † †Nebraska 56.4 -39.2 215.0 148.0 200.0 -20.0 -100.0Nevada 144.9 168.4 125.0 136.4 200.0 400.0 †New Hampshire 9.2 -51.7 83.3 8.3 125.0 71.4 †
New Jersey -14.5 -77.6 21.7 100.7 86.8 89.8 †New Mexico 19.2 -28.6 -28.6 240.0 25.0 250.0 0.0New York -10.6 -65.7 15.0 71.8 146.5 42.2 -50.0North Carolina 31.6 -51.9 75.9 73.3 17.6 55.7 †North Dakota 69.2 -20.0 266.7 133.3 -100.0 -100.0 †
National Center for Education Statistics
STEM field
Table 15e. Percentage change in number of awards conferred in science, technology, engineering, and Table 15e. mathematics (STEM) fields to Asian, Native Hawaiian, or Other Pacific Islander students at Table 15e. Title IV institutions, by field and state: Academic years 2000–01 and 2008–09
State
Computer and information
sciences
Engineering and engineering
technologies
Biological and biomedical
sciencesMathematics
and statisticsPhysical sciences
Science technologies
All STEM fields
See notes at end of table.

Ohio 20.7 -40.5 -2.0 135.5 10.0 10.0 25.0Oklahoma -4.1 -38.3 -26.6 117.1 16.7 -47.6 †Oregon 29.2 -5.1 7.5 95.7 100.0 0.0 †Pennsylvania 27.5 -31.0 26.5 83.6 112.8 80.5 500.0Rhode Island 18.3 -37.1 -10.7 63.6 500.0 60.0 100.0
South Carolina 2.4 -54.1 2.2 51.5 0.0 62.5 †South Dakota -44.4 -82.4 600.0 -75.0 † -80.0 †Tennessee -5.3 -35.9 -34.7 32.8 0.0 121.1 †Texas 6.9 -62.8 -7.9 123.1 96.9 52.4 164.3Utah 81.7 48.5 57.1 175.0 160.0 50.0 -100.0
Vermont 35.7 100.0 20.0 0.0 400.0 -50.0 †Virginia 128.5 -12.6 351.2 121.0 34.8 41.3 †Washington 26.1 -9.3 -18.5 179.6 43.6 220.9 †West Virginia 33.3 -11.1 15.4 80.0 -66.7 500.0 †Wisconsin 24.3 -9.8 7.1 83.1 80.0 25.0 -100.0Wyoming -50.0 -80.0 0.0 -25.0 -33.3 -100.0 †† Not applicable.
Table 15e. Percentage change in number of awards conferred in science, technology, engineering, and Table 15e. mathematics (STEM) fields to Asian, Native Hawaiian, or Other Pacific Islander students at Table 15e. Title IV institutions, by field and state: Academic years 2000–01 and 2008–09—Continued
STEM field
SOURCE: U.S. Department of Education, National Center for Education Statistics, Integrated Postsecondary Education Data System (IPEDS), Fall 2001 and Fall 2009, Completions component.
NOTE: Awards conferred include both degrees and certificates. Awards to individuals of Hispanic or Latino ethnicity are included in the Hispanic or Latino category regardless of race.
StateAll STEM
fields
Computer and information
sciences
Engineering and engineering
technologies
Biological and biomedical
sciencesMathematics
and statisticsPhysical sciences
Science technologies

United States 31,341 12,542 11,242 5,052 961 1,290 254
Alabama 1,315 412 460 324 62 39 18Alaska 13 1 10 1 0 1 0Arizona 231 72 137 15 4 3 0Arkansas 242 106 67 49 11 9 0California 1,815 489 992 190 64 55 25
Colorado 208 134 45 21 4 3 1Connecticut 194 90 62 27 8 7 0Delaware 101 42 26 22 2 9 0District of Columbia 817 546 92 133 18 28 0Florida 2,018 889 835 208 36 50 0
Georgia 2,008 797 633 342 117 118 1Hawaii 21 15 2 3 1 0 0Idaho 10 4 3 3 0 0 0Illinois 1,475 822 450 132 35 33 3Indiana 315 101 147 37 6 22 2
Iowa 61 27 19 13 1 1 0Kansas 148 71 38 31 4 4 0Kentucky 161 33 71 41 10 4 2Louisiana 1,547 557 392 415 33 149 1Maine 6 1 2 2 1 0 0
Maryland 1,430 645 466 247 26 46 0Massachusetts 533 108 287 95 13 26 4Michigan 799 202 406 100 28 60 3Minnesota 242 144 55 28 3 11 1Mississippi 802 154 262 305 26 55 0
Missouri 613 321 206 51 10 22 3Montana 5 2 0 2 0 1 0Nebraska 62 46 9 5 2 0 0Nevada 27 8 17 1 0 1 0New Hampshire 18 9 1 7 0 1 0
New Jersey 1,486 731 525 178 25 24 3New Mexico 34 11 16 5 1 1 0New York 2,348 945 896 328 90 71 18North Carolina 1,858 830 524 346 68 90 0North Dakota 3 1 2 0 0 0 0See notes at end of table.
National Center for Education Statistics
STEM field
State
Table 16a. Number of awards conferred in science, technology, engineering, and mathematics (STEM) Table 16a. fields to Black or African American students at Title IV institutions, by field and state: Table 16a. Academic year 2000–01
Computer and information
sciences
Engineering and engineering
technologies
Biological and biomedical
sciencesMathematics
and statisticsPhysical sciences
Science technologies
All STEM fields

Ohio 793 331 311 106 15 22 8Oklahoma 215 55 106 43 3 8 0Oregon 36 11 13 9 0 3 0Pennsylvania 1,090 453 413 137 28 49 10Rhode Island 81 41 26 11 2 1 0
South Carolina 984 350 285 261 50 35 3South Dakota 9 7 1 0 1 0 0Tennessee 866 333 291 150 27 61 4Texas 2,250 869 844 294 61 42 140Utah 13 6 1 4 0 2 0
Vermont 14 1 5 6 0 2 0Virginia 1,639 568 615 292 55 109 0Washington 185 56 107 12 4 5 1West Virginia 54 19 24 3 2 4 2Wisconsin 146 76 45 17 4 3 1Wyoming 0 0 0 0 0 0 0
SOURCE: U.S. Department of Education, National Center for Education Statistics, Integrated Postsecondary Education Data System (IPEDS), Fall 2001, Completions component.
StateAll STEM
fields
STEM field
Table 16a. Number of awards conferred in science, technology, engineering, and mathematics (STEM) Table 16a. fields to Black or African American students at Title IV institutions, by field and state: Table 16a. Academic year 2000–01—Continued
NOTE: Awards conferred include both degrees and certificates. Awards to individuals of Hispanic or Latino ethnicity are included in the Hispanic or Latino category regardless of race.
Computer and information
sciences
Engineering and engineering
technologies
Biological and biomedical
sciencesMathematics
and statisticsPhysical sciences
Science technologies

United States 100.0 40.0 35.9 16.1 3.1 4.1 0.8
Alabama 100.0 31.3 35.0 24.6 4.7 3.0 1.4Alaska 100.0 7.7 76.9 7.7 0.0 7.7 0.0Arizona 100.0 31.2 59.3 6.5 1.7 1.3 0.0Arkansas 100.0 43.8 27.7 20.2 4.5 3.7 0.0California 100.0 26.9 54.7 10.5 3.5 3.0 1.4
Colorado 100.0 64.4 21.6 10.1 1.9 1.4 0.5Connecticut 100.0 46.4 32.0 13.9 4.1 3.6 0.0Delaware 100.0 41.6 25.7 21.8 2.0 8.9 0.0District of Columbia 100.0 66.8 11.3 16.3 2.2 3.4 0.0Florida 100.0 44.1 41.4 10.3 1.8 2.5 0.0
Georgia 100.0 39.7 31.5 17.0 5.8 5.9 #Hawaii 100.0 71.4 9.5 14.3 4.8 0.0 0.0Idaho 100.0 40.0 30.0 30.0 0.0 0.0 0.0Illinois 100.0 55.7 30.5 8.9 2.4 2.2 0.2Indiana 100.0 32.1 46.7 11.7 1.9 7.0 0.6
Iowa 100.0 44.3 31.1 21.3 1.6 1.6 0.0Kansas 100.0 48.0 25.7 20.9 2.7 2.7 0.0Kentucky 100.0 20.5 44.1 25.5 6.2 2.5 1.2Louisiana 100.0 36.0 25.3 26.8 2.1 9.6 0.1Maine 100.0 16.7 33.3 33.3 16.7 0.0 0.0
Maryland 100.0 45.1 32.6 17.3 1.8 3.2 0.0Massachusetts 100.0 20.3 53.8 17.8 2.4 4.9 0.8Michigan 100.0 25.3 50.8 12.5 3.5 7.5 0.4Minnesota 100.0 59.5 22.7 11.6 1.2 4.5 0.4Mississippi 100.0 19.2 32.7 38.0 3.2 6.9 0.0
Missouri 100.0 52.4 33.6 8.3 1.6 3.6 0.5Montana 100.0 40.0 0.0 40.0 0.0 20.0 0.0Nebraska 100.0 74.2 14.5 8.1 3.2 0.0 0.0Nevada 100.0 29.6 63.0 3.7 0.0 3.7 0.0New Hampshire 100.0 50.0 5.6 38.9 0.0 5.6 0.0
New Jersey 100.0 49.2 35.3 12.0 1.7 1.6 0.2New Mexico 100.0 32.4 47.1 14.7 2.9 2.9 0.0New York 100.0 40.2 38.2 14.0 3.8 3.0 0.8North Carolina 100.0 44.7 28.2 18.6 3.7 4.8 0.0North Dakota 100.0 33.3 66.7 0.0 0.0 0.0 0.0
National Center for Education Statistics
STEM field
Table 16b. Percentage distribution of awards conferred in science, technology, engineering, and Table 16b. mathematics (STEM) fields to Black or African American students at Title IV institutions, by Table 16b. field and state: Academic year 2000–01
State
Computer and information
sciences
Engineering and engineering
technologies
Biological and biomedical
sciencesMathematics
and statisticsPhysical sciences
Science technologies
All STEM fields
See notes at end of table.

Ohio 100.0 41.7 39.2 13.4 1.9 2.8 1.0Oklahoma 100.0 25.6 49.3 20.0 1.4 3.7 0.0Oregon 100.0 30.6 36.1 25.0 0.0 8.3 0.0Pennsylvania 100.0 41.6 37.9 12.6 2.6 4.5 0.9Rhode Island 100.0 50.6 32.1 13.6 2.5 1.2 0.0
South Carolina 100.0 35.6 29.0 26.5 5.1 3.6 0.3South Dakota 100.0 77.8 11.1 0.0 11.1 0.0 0.0Tennessee 100.0 38.5 33.6 17.3 3.1 7.0 0.5Texas 100.0 38.6 37.5 13.1 2.7 1.9 6.2Utah 100.0 46.2 7.7 30.8 0.0 15.4 0.0
Vermont 100.0 7.1 35.7 42.9 0.0 14.3 0.0Virginia 100.0 34.7 37.5 17.8 3.4 6.7 0.0Washington 100.0 30.3 57.8 6.5 2.2 2.7 0.5West Virginia 100.0 35.2 44.4 5.6 3.7 7.4 3.7Wisconsin 100.0 52.1 30.8 11.6 2.7 2.1 0.7Wyoming † † † † † † †† Not applicable.
Table 16b. Percentage distribution of awards conferred in science, technology, engineering, and Table 16b. mathematics (STEM) fields to Black or African American students at Title IV institutions, by Table 16b. field and state: Academic year 2000–01—Continued
STEM field
SOURCE: U.S. Department of Education, National Center for Education Statistics, Integrated Postsecondary Education Data System (IPEDS), Fall 2001, Completions component.
StateAll STEM
fields
# Rounds to zero.NOTE: Awards conferred include both degrees and certificates. Awards to individuals of Hispanic or Latino ethnicity are included in the Hispanic or Latino category regardless of race. Detail may not sum to totals because of rounding.
Computer and information
sciences
Engineering and engineering
technologies
Biological and biomedical
sciencesMathematics
and statisticsPhysical sciences
Science technologies

United States 32,488 11,223 11,520 6,861 1,025 1,509 350
Alabama 1,213 298 410 405 51 45 4Alaska 12 5 3 3 1 0 0Arizona 757 502 124 38 5 28 60Arkansas 310 89 131 67 5 17 1California 1,468 376 551 408 70 57 6
Colorado 273 149 89 25 6 4 0Connecticut 212 22 83 73 19 14 1Delaware 76 24 18 21 3 10 0District of Columbia 726 339 171 159 19 38 0Florida 2,502 791 1,157 408 47 75 24
Georgia 2,532 1,143 636 496 101 133 23Hawaii 31 10 3 4 0 2 12Idaho 12 3 6 1 2 0 0Illinois 1,256 675 342 169 33 36 1Indiana 363 116 162 56 12 17 0
Iowa 95 20 39 21 10 5 0Kansas 136 30 76 19 6 5 0Kentucky 263 63 128 53 8 10 1Louisiana 1,199 377 349 339 29 99 6Maine 9 0 7 1 1 0 0
Maryland 1,635 675 531 325 35 50 19Massachusetts 606 135 251 165 23 28 4Michigan 1,244 312 756 116 25 29 6Minnesota 274 99 89 62 8 13 3Mississippi 765 139 201 328 31 66 0
Missouri 568 167 269 109 3 19 1Montana 4 1 2 1 0 0 0Nebraska 94 51 14 23 4 2 0Nevada 62 28 21 11 0 2 0New Hampshire 28 4 13 7 0 4 0
New Jersey 786 254 219 246 32 31 4New Mexico 53 18 13 16 1 4 1New York 2,128 724 745 456 94 104 5North Carolina 1,802 598 611 384 75 110 24North Dakota 13 1 9 1 1 1 0See notes at end of table.
National Center for Education Statistics
STEM field
State
Table 16c. Number of awards conferred in science, technology, engineering, and mathematics (STEM) Table 16c. fields to Black or African American students at Title IV institutions, by field and state: Table 16c. Academic year 2008–09
Computer and information
sciences
Engineering and engineering
technologies
Biological and biomedical
sciencesMathematics
and statisticsPhysical sciences
Science technologies
All STEM fields

Ohio 1,060 429 430 144 21 30 6Oklahoma 305 82 134 70 8 11 0Oregon 43 11 13 14 3 2 0Pennsylvania 1,051 354 394 189 25 72 17Rhode Island 77 30 25 16 2 3 1
South Carolina 850 260 221 282 47 37 3South Dakota 9 3 5 0 0 1 0Tennessee 837 210 353 177 25 71 1Texas 2,482 675 987 551 77 82 110Utah 42 13 13 10 3 2 1
Vermont 14 6 4 4 0 0 0Virginia 1,761 778 538 290 43 112 0Washington 197 67 75 31 4 18 2West Virginia 60 10 23 21 0 4 2Wisconsin 190 56 75 45 7 6 1Wyoming 3 1 1 1 0 0 0
SOURCE: U.S. Department of Education, National Center for Education Statistics, Integrated Postsecondary Education Data System (IPEDS), Fall 2009, Completions component.
StateAll STEM
fields
STEM field
Table 16c. Number of awards conferred in science, technology, engineering, and mathematics (STEM) Table 16c. fields to Black or African American students at Title IV institutions, by field and state: Table 16c. Academic year 2008–09—Continued
NOTE: Awards conferred include both degrees and certificates. Awards to individuals of Hispanic or Latino ethnicity are included in the Hispanic or Latino category regardless of race.
Computer and information
sciences
Engineering and engineering
technologies
Biological and biomedical
sciencesMathematics
and statisticsPhysical sciences
Science technologies
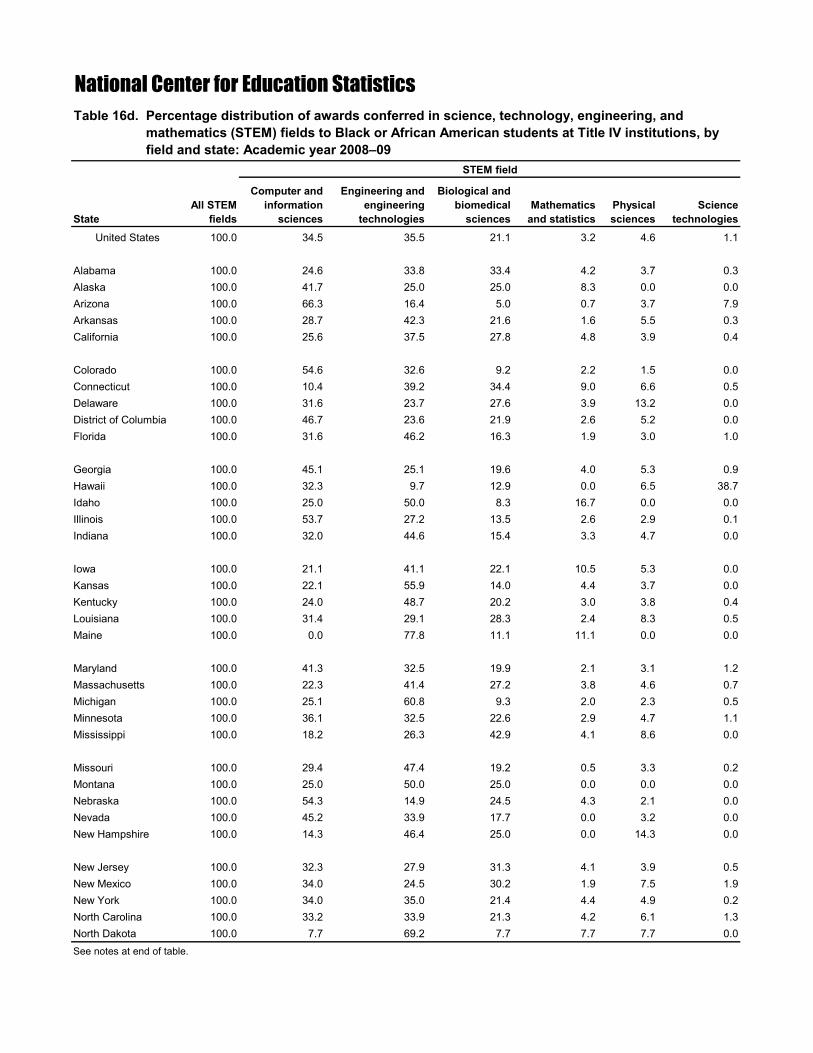
United States 100.0 34.5 35.5 21.1 3.2 4.6 1.1
Alabama 100.0 24.6 33.8 33.4 4.2 3.7 0.3Alaska 100.0 41.7 25.0 25.0 8.3 0.0 0.0Arizona 100.0 66.3 16.4 5.0 0.7 3.7 7.9Arkansas 100.0 28.7 42.3 21.6 1.6 5.5 0.3California 100.0 25.6 37.5 27.8 4.8 3.9 0.4
Colorado 100.0 54.6 32.6 9.2 2.2 1.5 0.0Connecticut 100.0 10.4 39.2 34.4 9.0 6.6 0.5Delaware 100.0 31.6 23.7 27.6 3.9 13.2 0.0District of Columbia 100.0 46.7 23.6 21.9 2.6 5.2 0.0Florida 100.0 31.6 46.2 16.3 1.9 3.0 1.0
Georgia 100.0 45.1 25.1 19.6 4.0 5.3 0.9Hawaii 100.0 32.3 9.7 12.9 0.0 6.5 38.7Idaho 100.0 25.0 50.0 8.3 16.7 0.0 0.0Illinois 100.0 53.7 27.2 13.5 2.6 2.9 0.1Indiana 100.0 32.0 44.6 15.4 3.3 4.7 0.0
Iowa 100.0 21.1 41.1 22.1 10.5 5.3 0.0Kansas 100.0 22.1 55.9 14.0 4.4 3.7 0.0Kentucky 100.0 24.0 48.7 20.2 3.0 3.8 0.4Louisiana 100.0 31.4 29.1 28.3 2.4 8.3 0.5Maine 100.0 0.0 77.8 11.1 11.1 0.0 0.0
Maryland 100.0 41.3 32.5 19.9 2.1 3.1 1.2Massachusetts 100.0 22.3 41.4 27.2 3.8 4.6 0.7Michigan 100.0 25.1 60.8 9.3 2.0 2.3 0.5Minnesota 100.0 36.1 32.5 22.6 2.9 4.7 1.1Mississippi 100.0 18.2 26.3 42.9 4.1 8.6 0.0
Missouri 100.0 29.4 47.4 19.2 0.5 3.3 0.2Montana 100.0 25.0 50.0 25.0 0.0 0.0 0.0Nebraska 100.0 54.3 14.9 24.5 4.3 2.1 0.0Nevada 100.0 45.2 33.9 17.7 0.0 3.2 0.0New Hampshire 100.0 14.3 46.4 25.0 0.0 14.3 0.0
New Jersey 100.0 32.3 27.9 31.3 4.1 3.9 0.5New Mexico 100.0 34.0 24.5 30.2 1.9 7.5 1.9New York 100.0 34.0 35.0 21.4 4.4 4.9 0.2North Carolina 100.0 33.2 33.9 21.3 4.2 6.1 1.3North Dakota 100.0 7.7 69.2 7.7 7.7 7.7 0.0See notes at end of table.
National Center for Education Statistics
STEM field
Table 16d. Percentage distribution of awards conferred in science, technology, engineering, and Table 16d. mathematics (STEM) fields to Black or African American students at Title IV institutions, by Table 16d. field and state: Academic year 2008–09
State
Computer and information
sciences
Engineering and engineering
technologies
Biological and biomedical
sciencesMathematics
and statisticsPhysical sciences
Science technologies
All STEM fields

Ohio 100.0 40.5 40.6 13.6 2.0 2.8 0.6Oklahoma 100.0 26.9 43.9 23.0 2.6 3.6 0.0Oregon 100.0 25.6 30.2 32.6 7.0 4.7 0.0Pennsylvania 100.0 33.7 37.5 18.0 2.4 6.9 1.6Rhode Island 100.0 39.0 32.5 20.8 2.6 3.9 1.3
South Carolina 100.0 30.6 26.0 33.2 5.5 4.4 0.4South Dakota 100.0 33.3 55.6 0.0 0.0 11.1 0.0Tennessee 100.0 25.1 42.2 21.1 3.0 8.5 0.1Texas 100.0 27.2 39.8 22.2 3.1 3.3 4.4Utah 100.0 31.0 31.0 23.8 7.1 4.8 2.4
Vermont 100.0 42.9 28.6 28.6 0.0 0.0 0.0Virginia 100.0 44.2 30.6 16.5 2.4 6.4 0.0Washington 100.0 34.0 38.1 15.7 2.0 9.1 1.0West Virginia 100.0 16.7 38.3 35.0 0.0 6.7 3.3Wisconsin 100.0 29.5 39.5 23.7 3.7 3.2 0.5Wyoming 100.0 33.3 33.3 33.3 0.0 0.0 0.0
SOURCE: U.S. Department of Education, National Center for Education Statistics, Integrated Postsecondary Education Data System (IPEDS), Fall 2009, Completions component.
StateAll STEM
fields
NOTE: Awards conferred include both degrees and certificates. Awards to individuals of Hispanic or Latino ethnicity are included in the Hispanic or Latino category regardless of race. Detail may not sum to totals because of rounding.
Computer and information
sciences
Engineering and engineering
technologies
Biological and biomedical
sciencesMathematics
and statisticsPhysical sciences
Science technologies
Table 16d. Percentage distribution of awards conferred in science, technology, engineering, and Table 16d. mathematics (STEM) fields to Black or African American students at Title IV institutions, by Table 16d. field and state: Academic year 2008–09—Continued
STEM field
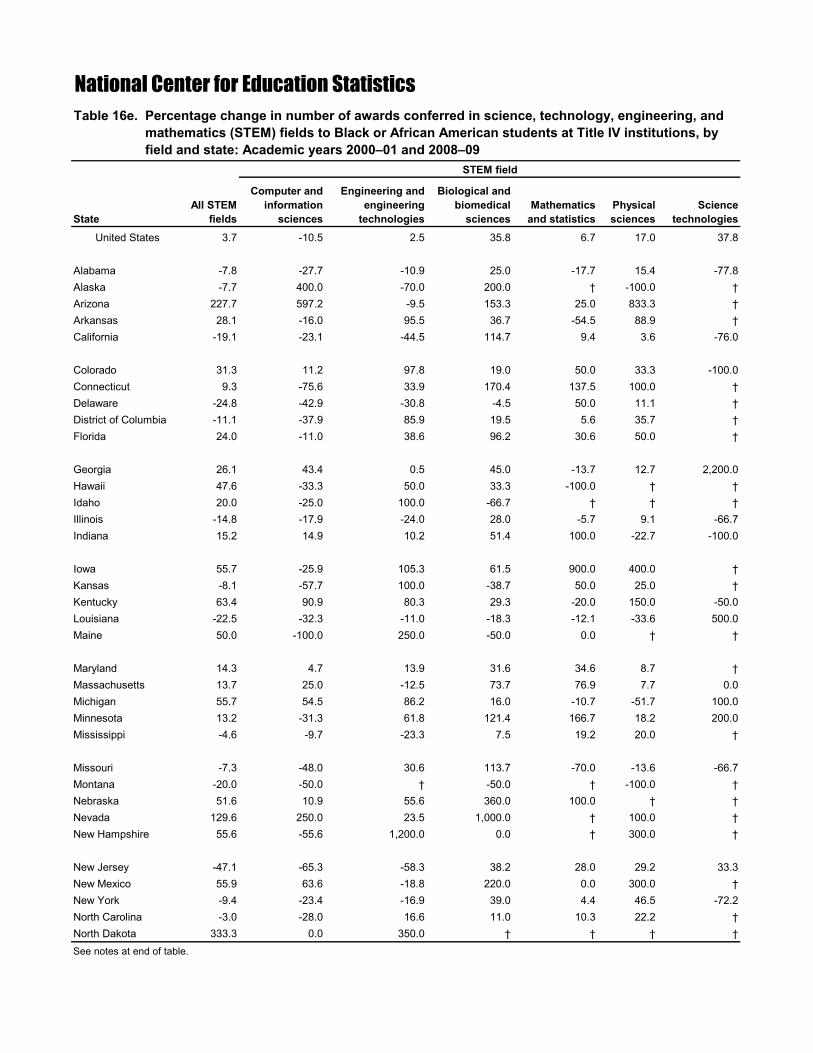
United States 3.7 -10.5 2.5 35.8 6.7 17.0 37.8
Alabama -7.8 -27.7 -10.9 25.0 -17.7 15.4 -77.8Alaska -7.7 400.0 -70.0 200.0 † -100.0 †Arizona 227.7 597.2 -9.5 153.3 25.0 833.3 †Arkansas 28.1 -16.0 95.5 36.7 -54.5 88.9 †California -19.1 -23.1 -44.5 114.7 9.4 3.6 -76.0
Colorado 31.3 11.2 97.8 19.0 50.0 33.3 -100.0Connecticut 9.3 -75.6 33.9 170.4 137.5 100.0 †Delaware -24.8 -42.9 -30.8 -4.5 50.0 11.1 †District of Columbia -11.1 -37.9 85.9 19.5 5.6 35.7 †Florida 24.0 -11.0 38.6 96.2 30.6 50.0 †
Georgia 26.1 43.4 0.5 45.0 -13.7 12.7 2,200.0Hawaii 47.6 -33.3 50.0 33.3 -100.0 † †Idaho 20.0 -25.0 100.0 -66.7 † † †Illinois -14.8 -17.9 -24.0 28.0 -5.7 9.1 -66.7Indiana 15.2 14.9 10.2 51.4 100.0 -22.7 -100.0
Iowa 55.7 -25.9 105.3 61.5 900.0 400.0 †Kansas -8.1 -57.7 100.0 -38.7 50.0 25.0 †Kentucky 63.4 90.9 80.3 29.3 -20.0 150.0 -50.0Louisiana -22.5 -32.3 -11.0 -18.3 -12.1 -33.6 500.0Maine 50.0 -100.0 250.0 -50.0 0.0 † †
Maryland 14.3 4.7 13.9 31.6 34.6 8.7 †Massachusetts 13.7 25.0 -12.5 73.7 76.9 7.7 0.0Michigan 55.7 54.5 86.2 16.0 -10.7 -51.7 100.0Minnesota 13.2 -31.3 61.8 121.4 166.7 18.2 200.0Mississippi -4.6 -9.7 -23.3 7.5 19.2 20.0 †
Missouri -7.3 -48.0 30.6 113.7 -70.0 -13.6 -66.7Montana -20.0 -50.0 † -50.0 † -100.0 †Nebraska 51.6 10.9 55.6 360.0 100.0 † †Nevada 129.6 250.0 23.5 1,000.0 † 100.0 †New Hampshire 55.6 -55.6 1,200.0 0.0 † 300.0 †
New Jersey -47.1 -65.3 -58.3 38.2 28.0 29.2 33.3New Mexico 55.9 63.6 -18.8 220.0 0.0 300.0 †New York -9.4 -23.4 -16.9 39.0 4.4 46.5 -72.2North Carolina -3.0 -28.0 16.6 11.0 10.3 22.2 †North Dakota 333.3 0.0 350.0 † † † †
National Center for Education Statistics
STEM field
Table 16e. Percentage change in number of awards conferred in science, technology, engineering, and Table 16e. mathematics (STEM) fields to Black or African American students at Title IV institutions, by Table 16e. field and state: Academic years 2000–01 and 2008–09
State
Computer and information
sciences
Engineering and engineering
technologies
Biological and biomedical
sciencesMathematics
and statisticsPhysical sciences
Science technologies
See notes at end of table.
All STEM fields

fields
Ohio 33.7 29.6 38.3 35.8 40.0 36.4 -25.0Oklahoma 41.9 49.1 26.4 62.8 166.7 37.5 †Oregon 19.4 0.0 0.0 55.6 † -33.3 †Pennsylvania -3.6 -21.9 -4.6 38.0 -10.7 46.9 70.0Rhode Island -4.9 -26.8 -3.8 45.5 0.0 200.0 †
South Carolina -13.6 -25.7 -22.5 8.0 -6.0 5.7 0.0South Dakota 0.0 -57.1 400.0 † -100.0 † †Tennessee -3.3 -36.9 21.3 18.0 -7.4 16.4 -75.0Texas 10.3 -22.3 16.9 87.4 26.2 95.2 -21.4Utah 223.1 116.7 1,200.0 150.0 † 0.0 †
Vermont 0.0 500.0 -20.0 -33.3 † -100.0 †Virginia 7.4 37.0 -12.5 -0.7 -21.8 2.8 †Washington 6.5 19.6 -29.9 158.3 0.0 260.0 100.0West Virginia 11.1 -47.4 -4.2 600.0 -100.0 0.0 0.0Wisconsin 30.1 -26.3 66.7 164.7 75.0 100.0 0.0Wyoming † † † † † † †
SOURCE: U.S. Department of Education, National Center for Education Statistics, Integrated Postsecondary Education Data System (IPEDS), Fall 2001 and Fall 2009, Completions component.
NOTE: Awards conferred include both degrees and certificates. Awards to individuals of Hispanic or Latino ethnicity are included in the Hispanic or Latino category regardless of race.
† Not applicable.
Table 16e. Percentage change in number of awards conferred in science, technology, engineering, and Table 16e. mathematics (STEM) fields to Black or African American students at Title IV institutions, by Table 16e. field and state: Academic years 2000–01 and 2008–09—Continued
STEM field
StatePhysical sciences
Science technologies
Computer and information
sciences
Engineering and engineering
technologies
Biological and biomedical
sciencesMathematics
and statistics

United States 23,891 7,542 11,016 3,429 789 929 186
Alabama 56 18 21 11 1 0 5Alaska 15 0 12 2 1 0 0Arizona 838 163 548 91 14 22 0Arkansas 33 9 13 7 2 2 0California 5,725 1,158 3,316 703 273 241 34
Colorado 494 153 213 92 15 17 4Connecticut 153 47 55 24 10 17 0Delaware 31 10 8 9 0 4 0District of Columbia 84 57 15 9 1 2 0Florida 2,985 1,564 1,022 302 27 70 0
Georgia 200 65 95 30 5 5 0Hawaii 19 11 3 3 0 2 0Idaho 36 10 18 7 0 1 0Illinois 1,278 692 424 120 17 25 0Indiana 181 31 96 30 5 16 3
Iowa 61 15 22 16 5 3 0Kansas 166 34 100 19 3 10 0Kentucky 35 8 21 6 0 0 0Louisiana 138 34 57 33 6 8 0Maine 14 2 3 7 2 0 0
Maryland 231 80 84 37 9 21 0Massachusetts 462 89 223 93 23 32 2Michigan 244 29 140 50 3 22 0Minnesota 95 46 24 14 6 5 0Mississippi 11 0 8 2 0 1 0
Missouri 162 69 51 35 1 6 0Montana 13 2 7 3 0 1 0Nebraska 38 14 9 9 2 4 0Nevada 56 12 18 17 5 4 0New Hampshire 18 7 2 7 2 0 0
New Jersey 1,174 559 398 163 29 23 2New Mexico 779 200 424 108 21 24 2New York 1,745 749 686 208 52 49 1North Carolina 222 62 94 48 13 5 0North Dakota 4 1 1 2 0 0 0
National Center for Education Statistics
STEM field
See notes at end of table.
State
Table 17a. Number of awards conferred in science, technology, engineering, and mathematics (STEM) Table 18a. fields to Hispanic or Latino students at Title IV institutions, by field and state: Academic year Table 18a. 2000–01
Computer and information
sciences
Engineering and engineering
technologies
Biological and biomedical
sciencesMathematics
and statisticsPhysical sciences
Science technologies
All STEM fields

Ohio 175 43 67 43 7 15 0Oklahoma 127 14 71 27 2 13 0Oregon 75 19 23 21 4 8 0Pennsylvania 354 91 180 58 9 16 0Rhode Island 73 25 31 15 2 0 0
South Carolina 60 15 23 18 0 4 0South Dakota 12 6 5 1 0 0 0Tennessee 75 24 26 19 3 3 0Texas 4,484 1,130 2,077 774 192 178 133Utah 75 25 25 15 4 6 0
Vermont 9 2 0 6 0 1 0Virginia 212 62 91 39 4 16 0Washington 210 60 99 35 5 11 0West Virginia 19 2 9 5 0 3 0Wisconsin 118 24 44 33 4 13 0Wyoming 17 0 14 3 0 0 0
StateAll STEM
fields
NOTE: Awards conferred include both degrees and certificates. Awards to individuals of Hispanic or Latino ethnicity are included in the Hispanic or Latino category regardless of race.SOURCE: U.S. Department of Education, National Center for Education Statistics, Integrated Postsecondary Education Data System (IPEDS), Fall 2001, Completions component.
STEM field
Table 17a. Number of awards conferred in science, technology, engineering, and mathematics (STEM) Table 18a. fields to Hispanic or Latino students at Title IV institutions, by field and state: Academic year Table 18a. 2000–01—Continued
Computer and information
sciences
Engineering and engineering
technologies
Biological and biomedical
sciencesMathematics
and statisticsPhysical sciences
Science technologies

United States 100.0 31.6 46.1 14.4 3.3 3.9 0.8
Alabama 100.0 32.1 37.5 19.6 1.8 0.0 8.9Alaska 100.0 0.0 80.0 13.3 6.7 0.0 0.0Arizona 100.0 19.5 65.4 10.9 1.7 2.6 0.0Arkansas 100.0 27.3 39.4 21.2 6.1 6.1 0.0California 100.0 20.2 57.9 12.3 4.8 4.2 0.6
Colorado 100.0 31.0 43.1 18.6 3.0 3.4 0.8Connecticut 100.0 30.7 35.9 15.7 6.5 11.1 0.0Delaware 100.0 32.3 25.8 29.0 0.0 12.9 0.0District of Columbia 100.0 67.9 17.9 10.7 1.2 2.4 0.0Florida 100.0 52.4 34.2 10.1 0.9 2.3 0.0
Georgia 100.0 32.5 47.5 15.0 2.5 2.5 0.0Hawaii 100.0 57.9 15.8 15.8 0.0 10.5 0.0Idaho 100.0 27.8 50.0 19.4 0.0 2.8 0.0Illinois 100.0 54.1 33.2 9.4 1.3 2.0 0.0Indiana 100.0 17.1 53.0 16.6 2.8 8.8 1.7
Iowa 100.0 24.6 36.1 26.2 8.2 4.9 0.0Kansas 100.0 20.5 60.2 11.4 1.8 6.0 0.0Kentucky 100.0 22.9 60.0 17.1 0.0 0.0 0.0Louisiana 100.0 24.6 41.3 23.9 4.3 5.8 0.0Maine 100.0 14.3 21.4 50.0 14.3 0.0 0.0
Maryland 100.0 34.6 36.4 16.0 3.9 9.1 0.0Massachusetts 100.0 19.3 48.3 20.1 5.0 6.9 0.4Michigan 100.0 11.9 57.4 20.5 1.2 9.0 0.0Minnesota 100.0 48.4 25.3 14.7 6.3 5.3 0.0Mississippi 100.0 0.0 72.7 18.2 0.0 9.1 0.0
Missouri 100.0 42.6 31.5 21.6 0.6 3.7 0.0Montana 100.0 15.4 53.8 23.1 0.0 7.7 0.0Nebraska 100.0 36.8 23.7 23.7 5.3 10.5 0.0Nevada 100.0 21.4 32.1 30.4 8.9 7.1 0.0New Hampshire 100.0 38.9 11.1 38.9 11.1 0.0 0.0
New Jersey 100.0 47.6 33.9 13.9 2.5 2.0 0.2New Mexico 100.0 25.7 54.4 13.9 2.7 3.1 0.3New York 100.0 42.9 39.3 11.9 3.0 2.8 0.1North Carolina 100.0 27.9 42.3 21.6 5.9 2.3 0.0North Dakota 100.0 25.0 25.0 50.0 0.0 0.0 0.0
National Center for Education Statistics
STEM field
Table 17b. Percentage distribution of awards conferred in science, technology, engineering, and Table 18b. mathematics (STEM) fields to Hispanic or Latino students at Title IV institutions, by field and Table 18b. state: Academic year 2000–01
See notes at end of table.
State
Computer and information
sciences
Engineering and engineering
technologies
Biological and biomedical
sciencesMathematics
and statisticsPhysical sciences
Science technologies
All STEM fields

Ohio 100.0 24.6 38.3 24.6 4.0 8.6 0.0Oklahoma 100.0 11.0 55.9 21.3 1.6 10.2 0.0Oregon 100.0 25.3 30.7 28.0 5.3 10.7 0.0Pennsylvania 100.0 25.7 50.8 16.4 2.5 4.5 0.0Rhode Island 100.0 34.2 42.5 20.5 2.7 0.0 0.0
South Carolina 100.0 25.0 38.3 30.0 0.0 6.7 0.0South Dakota 100.0 50.0 41.7 8.3 0.0 0.0 0.0Tennessee 100.0 32.0 34.7 25.3 4.0 4.0 0.0Texas 100.0 25.2 46.3 17.3 4.3 4.0 3.0Utah 100.0 33.3 33.3 20.0 5.3 8.0 0.0
Vermont 100.0 22.2 0.0 66.7 0.0 11.1 0.0Virginia 100.0 29.2 42.9 18.4 1.9 7.5 0.0Washington 100.0 28.6 47.1 16.7 2.4 5.2 0.0West Virginia 100.0 10.5 47.4 26.3 0.0 15.8 0.0Wisconsin 100.0 20.3 37.3 28.0 3.4 11.0 0.0Wyoming 100.0 0.0 82.4 17.6 0.0 0.0 0.0
SOURCE: U.S. Department of Education, National Center for Education Statistics, Integrated Postsecondary Education Data System (IPEDS), Fall 2001, Completions component.
Table 17b. Percentage distribution of awards conferred in science, technology, engineering, and Table 18b. mathematics (STEM) fields to Hispanic or Latino students at Title IV institutions, by field and Table 18b. state: Academic year 2000–01—Continued
STEM field
State
NOTE: Awards conferred include both degrees and certificates. Awards to individuals of Hispanic or Latino ethnicity are included in the Hispanic or Latino category regardless of race. Detail may not sum to totals because of rounding.
Physical sciences
Science technologies
All STEM fields
Computer and information
sciences
Engineering and engineering
technologies
Biological and biomedical
sciencesMathematics
and statistics

United States 30,516 7,492 13,721 6,150 1,289 1,554 310
Alabama 112 23 49 28 2 10 0Alaska 10 0 6 2 2 0 0Arizona 1,379 528 456 184 31 115 65Arkansas 68 14 32 17 2 3 0California 6,446 1,346 3,051 1,271 407 361 10
Colorado 609 149 271 131 25 32 1Connecticut 238 18 108 74 14 23 1Delaware 25 1 17 4 1 2 0District of Columbia 130 39 59 22 6 4 0Florida 3,952 869 2,255 646 55 117 10
Georgia 420 115 203 76 7 17 2Hawaii 35 12 4 7 0 2 10Idaho 67 13 33 20 0 1 0Illinois 1,121 468 384 168 44 56 1Indiana 230 32 113 59 12 13 1
Iowa 89 14 38 24 5 8 0Kansas 190 30 122 30 1 6 1Kentucky 76 28 31 10 2 5 0Louisiana 145 36 53 43 4 8 1Maine 20 0 2 13 2 3 0
Maryland 373 110 147 73 14 26 3Massachusetts 626 125 294 132 21 46 8Michigan 379 99 183 56 20 21 0Minnesota 127 45 31 35 5 10 1Mississippi 32 5 10 8 1 8 0
Missouri 174 58 68 34 3 9 2Montana 12 1 0 3 3 5 0Nebraska 87 33 29 17 5 2 1Nevada 156 43 67 37 3 6 0New Hampshire 33 4 16 10 1 2 0
New Jersey 992 349 313 224 55 43 8New Mexico 789 225 351 144 19 46 4New York 1,835 663 706 294 85 82 5North Carolina 331 85 124 83 14 23 2North Dakota 9 0 5 3 0 1 0
National Center for Education Statistics
STEM field
See notes at end of table.
State
Table 17c. Number of awards conferred in science, technology, engineering, and mathematics (STEM) Table 17c. fields to Hispanic or Latino students at Title IV institutions, by field and state: Academic year Table 18c. 2008–09
Computer and information
sciences
Engineering and engineering
technologies
Biological and biomedical
sciencesMathematics
and statisticsPhysical sciences
Science technologies
All STEM fields
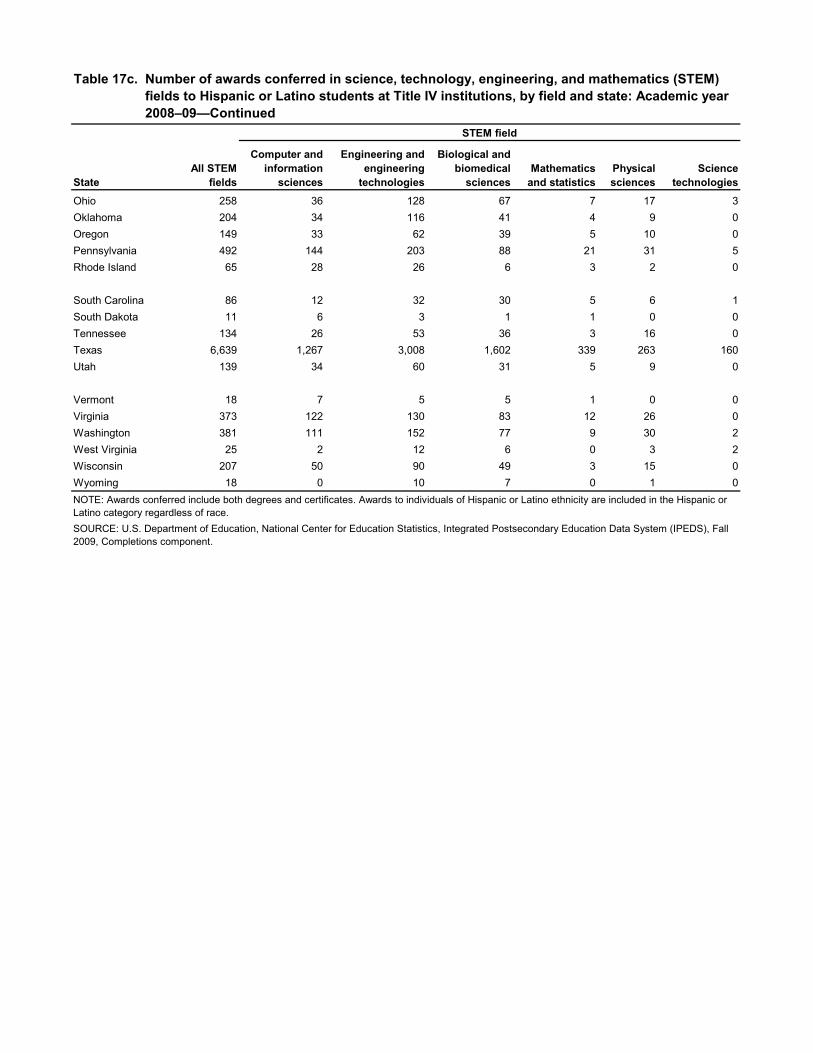
Ohio 258 36 128 67 7 17 3Oklahoma 204 34 116 41 4 9 0Oregon 149 33 62 39 5 10 0Pennsylvania 492 144 203 88 21 31 5Rhode Island 65 28 26 6 3 2 0
South Carolina 86 12 32 30 5 6 1South Dakota 11 6 3 1 1 0 0Tennessee 134 26 53 36 3 16 0Texas 6,639 1,267 3,008 1,602 339 263 160Utah 139 34 60 31 5 9 0
Vermont 18 7 5 5 1 0 0Virginia 373 122 130 83 12 26 0Washington 381 111 152 77 9 30 2West Virginia 25 2 12 6 0 3 2Wisconsin 207 50 90 49 3 15 0Wyoming 18 0 10 7 0 1 0
StateAll STEM
fields
NOTE: Awards conferred include both degrees and certificates. Awards to individuals of Hispanic or Latino ethnicity are included in the Hispanic or Latino category regardless of race.SOURCE: U.S. Department of Education, National Center for Education Statistics, Integrated Postsecondary Education Data System (IPEDS), Fall 2009, Completions component.
STEM field
Table 17c. Number of awards conferred in science, technology, engineering, and mathematics (STEM) Table 17c. fields to Hispanic or Latino students at Title IV institutions, by field and state: Academic year Table 17c. 2008–09—Continued
Computer and information
sciences
Engineering and engineering
technologies
Biological and biomedical
sciencesMathematics
and statisticsPhysical sciences
Science technologies
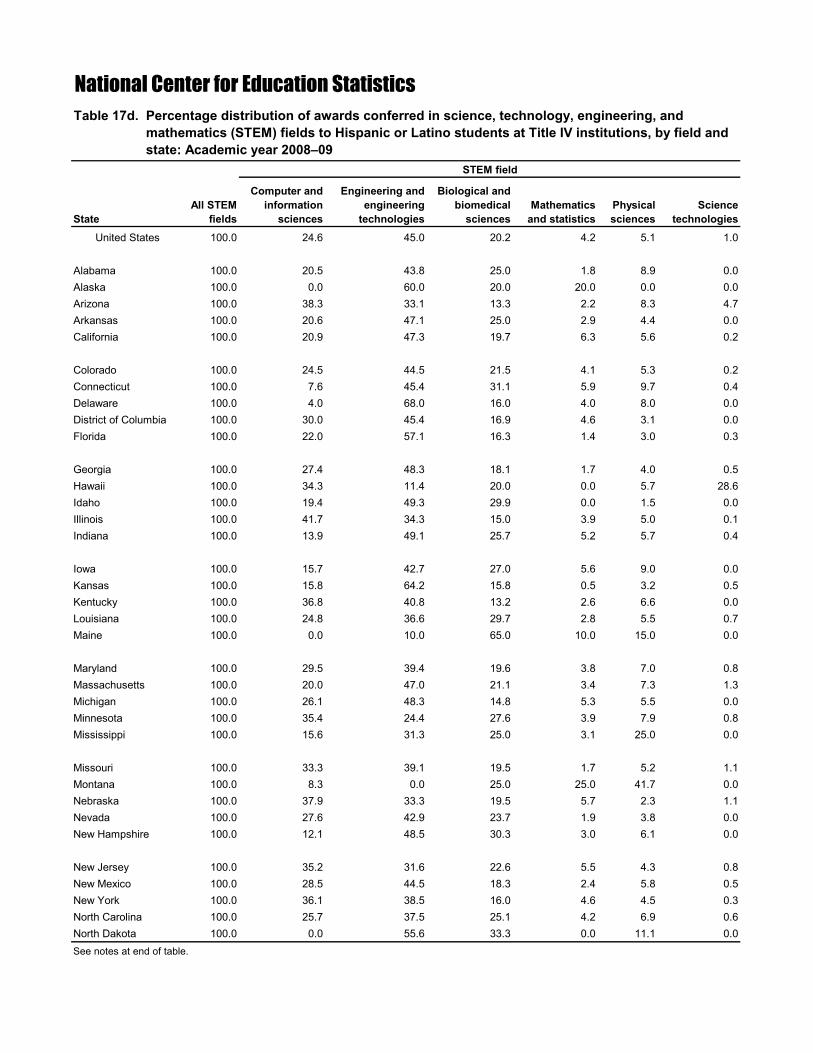
United States 100.0 24.6 45.0 20.2 4.2 5.1 1.0
Alabama 100.0 20.5 43.8 25.0 1.8 8.9 0.0Alaska 100.0 0.0 60.0 20.0 20.0 0.0 0.0Arizona 100.0 38.3 33.1 13.3 2.2 8.3 4.7Arkansas 100.0 20.6 47.1 25.0 2.9 4.4 0.0California 100.0 20.9 47.3 19.7 6.3 5.6 0.2
Colorado 100.0 24.5 44.5 21.5 4.1 5.3 0.2Connecticut 100.0 7.6 45.4 31.1 5.9 9.7 0.4Delaware 100.0 4.0 68.0 16.0 4.0 8.0 0.0District of Columbia 100.0 30.0 45.4 16.9 4.6 3.1 0.0Florida 100.0 22.0 57.1 16.3 1.4 3.0 0.3
Georgia 100.0 27.4 48.3 18.1 1.7 4.0 0.5Hawaii 100.0 34.3 11.4 20.0 0.0 5.7 28.6Idaho 100.0 19.4 49.3 29.9 0.0 1.5 0.0Illinois 100.0 41.7 34.3 15.0 3.9 5.0 0.1Indiana 100.0 13.9 49.1 25.7 5.2 5.7 0.4
Iowa 100.0 15.7 42.7 27.0 5.6 9.0 0.0Kansas 100.0 15.8 64.2 15.8 0.5 3.2 0.5Kentucky 100.0 36.8 40.8 13.2 2.6 6.6 0.0Louisiana 100.0 24.8 36.6 29.7 2.8 5.5 0.7Maine 100.0 0.0 10.0 65.0 10.0 15.0 0.0
Maryland 100.0 29.5 39.4 19.6 3.8 7.0 0.8Massachusetts 100.0 20.0 47.0 21.1 3.4 7.3 1.3Michigan 100.0 26.1 48.3 14.8 5.3 5.5 0.0Minnesota 100.0 35.4 24.4 27.6 3.9 7.9 0.8Mississippi 100.0 15.6 31.3 25.0 3.1 25.0 0.0
Missouri 100.0 33.3 39.1 19.5 1.7 5.2 1.1Montana 100.0 8.3 0.0 25.0 25.0 41.7 0.0Nebraska 100.0 37.9 33.3 19.5 5.7 2.3 1.1Nevada 100.0 27.6 42.9 23.7 1.9 3.8 0.0New Hampshire 100.0 12.1 48.5 30.3 3.0 6.1 0.0
New Jersey 100.0 35.2 31.6 22.6 5.5 4.3 0.8New Mexico 100.0 28.5 44.5 18.3 2.4 5.8 0.5New York 100.0 36.1 38.5 16.0 4.6 4.5 0.3North Carolina 100.0 25.7 37.5 25.1 4.2 6.9 0.6North Dakota 100.0 0.0 55.6 33.3 0.0 11.1 0.0See notes at end of table.
National Center for Education Statistics
STEM field
Table 17d. Percentage distribution of awards conferred in science, technology, engineering, and Table 18d. mathematics (STEM) fields to Hispanic or Latino students at Title IV institutions, by field and Table 18d. state: Academic year 2008–09
State
Computer and information
sciences
Engineering and engineering
technologies
Biological and biomedical
sciencesMathematics
and statisticsPhysical sciences
Science technologies
All STEM fields

Ohio 100.0 14.0 49.6 26.0 2.7 6.6 1.2Oklahoma 100.0 16.7 56.9 20.1 2.0 4.4 0.0Oregon 100.0 22.1 41.6 26.2 3.4 6.7 0.0Pennsylvania 100.0 29.3 41.3 17.9 4.3 6.3 1.0Rhode Island 100.0 43.1 40.0 9.2 4.6 3.1 0.0
South Carolina 100.0 14.0 37.2 34.9 5.8 7.0 1.2South Dakota 100.0 54.5 27.3 9.1 9.1 0.0 0.0Tennessee 100.0 19.4 39.6 26.9 2.2 11.9 0.0Texas 100.0 19.1 45.3 24.1 5.1 4.0 2.4Utah 100.0 24.5 43.2 22.3 3.6 6.5 0.0
Vermont 100.0 38.9 27.8 27.8 5.6 0.0 0.0Virginia 100.0 32.7 34.9 22.3 3.2 7.0 0.0Washington 100.0 29.1 39.9 20.2 2.4 7.9 0.5West Virginia 100.0 8.0 48.0 24.0 0.0 12.0 8.0Wisconsin 100.0 24.2 43.5 23.7 1.4 7.2 0.0Wyoming 100.0 0.0 55.6 38.9 0.0 5.6 0.0
SOURCE: U.S. Department of Education, National Center for Education Statistics, Integrated Postsecondary Education Data System (IPEDS), Fall 2009, Completions component.
StateAll STEM
fields
NOTE: Awards conferred include both degrees and certificates. Awards to individuals of Hispanic or Latino ethnicity are included in the Hispanic or Latino category regardless of race. Detail may not sum to totals because of rounding.
Computer and information
sciences
Engineering and engineering
technologies
Biological and biomedical
sciencesMathematics
and statisticsPhysical sciences
Science technologies
Table 17d. Percentage distribution of awards conferred in science, technology, engineering, and Table 18d. mathematics (STEM) fields to Hispanic or Latino students at Title IV institutions, by field and Table 18d. state: Academic year 2008–09—Continued
STEM field

United States 27.7 -0.7 24.6 79.4 63.4 67.3 66.7
Alabama 100.0 27.8 133.3 154.5 100.0 † -100.0Alaska -33.3 † -50.0 0.0 100.0 † †Arizona 64.6 223.9 -16.8 102.2 121.4 422.7 †Arkansas 106.1 55.6 146.2 142.9 0.0 50.0 †California 12.6 16.2 -8.0 80.8 49.1 49.8 -70.6
Colorado 23.3 -2.6 27.2 42.4 66.7 88.2 -75.0Connecticut 55.6 -61.7 96.4 208.3 40.0 35.3 †Delaware -19.4 -90.0 112.5 -55.6 † -50.0 †District of Columbia 54.8 -31.6 293.3 144.4 500.0 100.0 †Florida 32.4 -44.4 120.6 113.9 103.7 67.1 †
Georgia 110.0 76.9 113.7 153.3 40.0 240.0 †Hawaii 84.2 9.1 33.3 133.3 † 0.0 †Idaho 86.1 30.0 83.3 185.7 † 0.0 †Illinois -12.3 -32.4 -9.4 40.0 158.8 124.0 †Indiana 27.1 3.2 17.7 96.7 140.0 -18.8 -66.7
Iowa 45.9 -6.7 72.7 50.0 0.0 166.7 †Kansas 14.5 -11.8 22.0 57.9 -66.7 -40.0 †Kentucky 117.1 250.0 47.6 66.7 † † †Louisiana 5.1 5.9 -7.0 30.3 -33.3 0.0 †Maine 42.9 -100.0 -33.3 85.7 0.0 † †
Maryland 61.5 37.5 75.0 97.3 55.6 23.8 †Massachusetts 35.5 40.4 31.8 41.9 -8.7 43.8 300.0Michigan 55.3 241.4 30.7 12.0 566.7 -4.5 †Minnesota 33.7 -2.2 29.2 150.0 -16.7 100.0 †Mississippi 190.9 † 25.0 300.0 † 700.0 †
Missouri 7.4 -15.9 33.3 -2.9 200.0 50.0 †Montana -7.7 -50.0 -100.0 0.0 † 400.0 †Nebraska 128.9 135.7 222.2 88.9 150.0 -50.0 †Nevada 178.6 258.3 272.2 117.6 -40.0 50.0 †New Hampshire 83.3 -42.9 700.0 42.9 -50.0 † †
New Jersey -15.5 -37.6 -21.4 37.4 89.7 87.0 300.0New Mexico 1.3 12.5 -17.2 33.3 -9.5 91.7 100.0New York 5.2 -11.5 2.9 41.3 63.5 67.3 400.0North Carolina 49.1 37.1 31.9 72.9 7.7 360.0 †North Dakota 125.0 -100.0 400.0 50.0 † † †
National Center for Education Statistics
STEM field
Table 17e. Percentage change in number of awards conferred in science, technology, engineering, and Table 18e. mathematics (STEM) fields to Hispanic or Latino students at Title IV institutions, by field and Table 18e. state: Academic years 2000–01 and 2008–09
See notes at end of table.
State
Computer and information
sciences
Engineering and engineering
technologies
Biological and biomedical
sciencesMathematics
and statisticsPhysical sciences
Science technologies
All STEM fields

Ohio 47.4 -16.3 91.0 55.8 0.0 13.3 †Oklahoma 60.6 142.9 63.4 51.9 100.0 -30.8 †Oregon 98.7 73.7 169.6 85.7 25.0 25.0 †Pennsylvania 39.0 58.2 12.8 51.7 133.3 93.8 †Rhode Island -11.0 12.0 -16.1 -60.0 50.0 † †
South Carolina 43.3 -20.0 39.1 66.7 † 50.0 †South Dakota -8.3 0.0 -40.0 0.0 † † †Tennessee 78.7 8.3 103.8 89.5 0.0 433.3 †Texas 48.1 12.1 44.8 107.0 76.6 47.8 20.3Utah 85.3 36.0 140.0 106.7 25.0 50.0 †
Vermont 100.0 250.0 † -16.7 † -100.0 †Virginia 75.9 96.8 42.9 112.8 200.0 62.5 †Washington 81.4 85.0 53.5 120.0 80.0 172.7 †West Virginia 31.6 0.0 33.3 20.0 † 0.0 †Wisconsin 75.4 108.3 104.5 48.5 -25.0 15.4 †Wyoming 5.9 † -28.6 133.3 † † †
NOTE: Awards conferred include both degrees and certificates. Awards to individuals of Hispanic or Latino ethnicity are included in the Hispanic or Latino category regardless of race.SOURCE: U.S. Department of Education, National Center for Education Statistics, Integrated Postsecondary Education Data System (IPEDS), Fall 2001 and Fall 2009, Completions component.
† Not applicable.
Table 17e. Percentage change in number of awards conferred in science, technology, engineering, and Table 18e. mathematics (STEM) fields to Hispanic or Latino students at Title IV institutions, by field and Table 18e. state: Academic years 2000–01 and 2008–09—Continued
STEM field
StateAll STEM
fields
Computer and information
sciences
Engineering and engineering
technologies
Biological and biomedical
sciencesMathematics
and statisticsPhysical sciences
Science technologies

United States 236,169 64,918 96,421 45,927 10,156 17,888 859
Alabama 3,578 876 1,711 667 126 179 19Alaska 458 102 216 95 15 30 0Arizona 3,973 942 1,969 680 82 300 0Arkansas 2,982 1,360 1,006 384 84 148 0California 15,683 3,727 6,659 3,010 791 1,461 35
Colorado 5,889 1,954 2,034 1,170 240 470 21Connecticut 2,157 450 793 502 185 219 8Delaware 655 152 265 172 8 56 2District of Columbia 1,051 492 241 236 29 53 0Florida 8,179 2,668 3,596 1,249 209 452 5
Georgia 4,886 1,451 2,007 973 172 280 3Hawaii 305 124 54 80 16 26 5Idaho 1,447 372 608 310 48 109 0Illinois 10,992 3,479 4,047 2,171 499 781 15Indiana 6,427 1,161 3,295 1,108 297 536 30
Iowa 3,720 1,015 1,427 857 188 225 8Kansas 3,258 816 1,286 807 125 208 16Kentucky 3,146 639 1,415 663 166 236 27Louisiana 3,863 1,165 1,666 710 101 190 31Maine 1,035 154 418 288 43 127 5
Maryland 4,671 1,558 1,515 1,059 222 317 0Massachusetts 6,988 1,346 3,018 1,480 379 740 25Michigan 10,497 1,537 6,100 1,707 352 788 13Minnesota 5,828 2,059 1,973 1,049 252 489 6Mississippi 1,738 257 782 387 97 215 0
Missouri 6,400 2,306 2,480 1,014 223 368 9Montana 1,107 130 487 283 65 140 2Nebraska 2,235 834 800 356 87 146 12Nevada 539 135 230 110 22 42 0New Hampshire 1,296 519 303 321 59 88 6
New Jersey 6,061 2,984 1,524 991 234 323 5New Mexico 908 196 378 163 44 123 4New York 14,267 4,873 4,864 2,641 736 1,114 39North Carolina 7,555 2,216 2,572 1,739 372 656 0North Dakota 1,082 219 588 182 26 67 0See notes at end of table.
National Center for Education Statistics
STEM field
Table 18a. Number of awards conferred in science, technology, engineering, and mathematics (STEM) Table 17a. fields to White students at Title IV institutions, by field and state: Academic year 2000–01
State
Computer and information
sciences
Engineering and engineering
technologies
Biological and biomedical
sciencesMathematics
and statisticsPhysical sciences
Science technologies
All STEM fields

Ohio 11,340 2,899 5,137 2,010 437 814 43Oklahoma 2,852 655 1,189 633 131 236 8Oregon 2,345 399 1,005 550 131 253 7Pennsylvania 17,001 5,023 7,055 2,957 725 1,213 28Rhode Island 1,462 532 501 264 65 91 9
South Carolina 3,216 829 1,116 850 151 260 10South Dakota 1,117 242 563 213 39 60 0Tennessee 3,557 498 1,702 861 177 306 13Texas 13,445 3,246 5,726 2,637 632 868 336Utah 3,660 923 1,393 919 142 268 15
Vermont 626 148 191 196 31 58 2Virginia 6,552 1,663 2,487 1,369 323 709 1Washington 5,003 1,331 2,230 853 185 396 8West Virginia 2,025 593 892 331 57 150 2Wisconsin 6,600 1,592 2,684 1,552 300 446 26Wyoming 512 77 223 118 36 58 0NOTE: Awards conferred include both degrees and certificates. Awards to individuals of Hispanic or Latino ethnicity are included in the Hispanic or Latino category regardless of race.SOURCE: U.S. Department of Education, National Center for Education Statistics, Integrated Postsecondary Education Data System (IPEDS), Fall 2001, Completions component.
StateAll STEM
fields
Table 18a. Number of awards conferred in science, technology, engineering, and mathematics (STEM) Table 17a. fields to White students at Title IV institutions, by field and state: Academic year Table 17a. 2000–01—Continued
Computer and information
sciences
Engineering and engineering
technologies
Biological and biomedical
sciencesMathematics
and statisticsPhysical sciences
Science technologies
STEM field

United States 100.0 27.5 40.8 19.4 4.3 7.6 0.4
Alabama 100.0 24.5 47.8 18.6 3.5 5.0 0.5Alaska 100.0 22.3 47.2 20.7 3.3 6.6 0.0Arizona 100.0 23.7 49.6 17.1 2.1 7.6 0.0Arkansas 100.0 45.6 33.7 12.9 2.8 5.0 0.0California 100.0 23.8 42.5 19.2 5.0 9.3 0.2
Colorado 100.0 33.2 34.5 19.9 4.1 8.0 0.4Connecticut 100.0 20.9 36.8 23.3 8.6 10.2 0.4Delaware 100.0 23.2 40.5 26.3 1.2 8.5 0.3District of Columbia 100.0 46.8 22.9 22.5 2.8 5.0 0.0Florida 100.0 32.6 44.0 15.3 2.6 5.5 0.1
Georgia 100.0 29.7 41.1 19.9 3.5 5.7 0.1Hawaii 100.0 40.7 17.7 26.2 5.2 8.5 1.6Idaho 100.0 25.7 42.0 21.4 3.3 7.5 0.0Illinois 100.0 31.7 36.8 19.8 4.5 7.1 0.1Indiana 100.0 18.1 51.3 17.2 4.6 8.3 0.5
Iowa 100.0 27.3 38.4 23.0 5.1 6.0 0.2Kansas 100.0 25.0 39.5 24.8 3.8 6.4 0.5Kentucky 100.0 20.3 45.0 21.1 5.3 7.5 0.9Louisiana 100.0 30.2 43.1 18.4 2.6 4.9 0.8Maine 100.0 14.9 40.4 27.8 4.2 12.3 0.5
Maryland 100.0 33.4 32.4 22.7 4.8 6.8 0.0Massachusetts 100.0 19.3 43.2 21.2 5.4 10.6 0.4Michigan 100.0 14.6 58.1 16.3 3.4 7.5 0.1Minnesota 100.0 35.3 33.9 18.0 4.3 8.4 0.1Mississippi 100.0 14.8 45.0 22.3 5.6 12.4 0.0
Missouri 100.0 36.0 38.8 15.8 3.5 5.8 0.1Montana 100.0 11.7 44.0 25.6 5.9 12.6 0.2Nebraska 100.0 37.3 35.8 15.9 3.9 6.5 0.5Nevada 100.0 25.0 42.7 20.4 4.1 7.8 0.0New Hampshire 100.0 40.0 23.4 24.8 4.6 6.8 0.5
New Jersey 100.0 49.2 25.1 16.4 3.9 5.3 0.1New Mexico 100.0 21.6 41.6 18.0 4.8 13.5 0.4New York 100.0 34.2 34.1 18.5 5.2 7.8 0.3North Carolina 100.0 29.3 34.0 23.0 4.9 8.7 0.0North Dakota 100.0 20.2 54.3 16.8 2.4 6.2 0.0See notes at end of table.
National Center for Education Statistics
STEM field
Table 18b. Percentage distribution of awards conferred in science, technology, engineering, and Table 17b. mathematics (STEM) fields to White students at Title IV institutions, by field and state: Table 17b. Academic year 2000–01
State
Computer and information
sciences
Engineering and engineering
technologies
Biological and biomedical
sciencesMathematics
and statisticsPhysical sciences
Science technologies
All STEM fields

Ohio 100.0 25.6 45.3 17.7 3.9 7.2 0.4Oklahoma 100.0 23.0 41.7 22.2 4.6 8.3 0.3Oregon 100.0 17.0 42.9 23.5 5.6 10.8 0.3Pennsylvania 100.0 29.5 41.5 17.4 4.3 7.1 0.2Rhode Island 100.0 36.4 34.3 18.1 4.4 6.2 0.6
South Carolina 100.0 25.8 34.7 26.4 4.7 8.1 0.3South Dakota 100.0 21.7 50.4 19.1 3.5 5.4 0.0Tennessee 100.0 14.0 47.8 24.2 5.0 8.6 0.4Texas 100.0 24.1 42.6 19.6 4.7 6.5 2.5Utah 100.0 25.2 38.1 25.1 3.9 7.3 0.4
Vermont 100.0 23.6 30.5 31.3 5.0 9.3 0.3Virginia 100.0 25.4 38.0 20.9 4.9 10.8 #Washington 100.0 26.6 44.6 17.0 3.7 7.9 0.2West Virginia 100.0 29.3 44.0 16.3 2.8 7.4 0.1Wisconsin 100.0 24.1 40.7 23.5 4.5 6.8 0.4Wyoming 100.0 15.0 43.6 23.0 7.0 11.3 0.0
SOURCE: U.S. Department of Education, National Center for Education Statistics, Integrated Postsecondary Education Data System (IPEDS), Fall 2001, Completions component.
StateAll STEM
fields
# Rounds to zero.NOTE: Awards conferred include both degrees and certificates. Awards to individuals of Hispanic or Latino ethnicity are included in the Hispanic or Latino category regardless of race. Detail may not sum to totals because of rounding.
Computer and information
sciences
Engineering and engineering
technologies
Biological and biomedical
sciencesMathematics
and statisticsPhysical sciences
Science technologies
Table 18b. Percentage distribution of awards conferred in science, technology, engineering, and Table 17b. mathematics (STEM) fields to White students at Title IV institutions, by field and state: Table 17b. Academic year 2000–01—Continued
STEM field

United States 248,595 52,747 102,133 57,502 13,846 20,696 1,671
Alabama 3,533 534 1,687 912 190 207 3Alaska 388 40 184 97 16 51 0Arizona 7,268 3,421 1,684 1,051 150 534 428Arkansas 2,054 416 947 430 91 169 1California 16,048 3,188 5,763 4,167 1,157 1,749 24
Colorado 6,209 1,266 2,756 1,319 332 517 19Connecticut 2,651 217 1,065 777 295 278 19Delaware 716 128 342 172 20 50 4District of Columbia 1,390 431 567 254 71 67 0Florida 9,427 2,024 4,496 1,934 292 579 102
Georgia 6,279 1,817 2,407 1,365 258 407 25Hawaii 341 65 50 134 12 51 29Idaho 1,634 309 696 428 68 133 0Illinois 9,968 2,603 3,592 2,118 784 863 8Indiana 6,965 1,141 3,480 1,381 403 552 8
Iowa 3,595 584 1,575 976 217 234 9Kansas 2,780 448 1,352 637 114 213 16Kentucky 4,839 988 2,524 833 203 276 15Louisiana 3,450 690 1,647 819 101 179 14Maine 1,187 73 508 426 60 113 7
Maryland 4,811 1,520 1,497 1,127 277 366 24Massachusetts 7,290 1,237 2,931 1,837 511 743 31Michigan 12,168 2,250 6,268 2,301 492 787 70Minnesota 6,044 1,313 2,133 1,639 325 611 23Mississippi 1,867 231 816 439 88 293 0
Missouri 6,146 1,378 2,553 1,496 282 413 24Montana 1,106 111 486 307 72 130 0Nebraska 2,408 677 868 583 117 156 7Nevada 849 183 355 205 37 68 1New Hampshire 1,162 204 495 265 72 123 3
New Jersey 4,378 974 1,507 1,087 445 346 19New Mexico 1,209 266 526 198 61 143 15New York 14,303 2,864 5,482 3,441 1,138 1,305 73North Carolina 8,091 1,716 3,067 1,978 410 837 83North Dakota 1,140 164 651 219 48 58 0See notes at end of table.
National Center for Education Statistics
STEM field
Table 18c. Number of awards conferred in science, technology, engineering, and mathematics (STEM) Table 17c. fields to White students at Title IV institutions, by field and state: Academic year 2008–09
StateAll STEM
fields
Computer and information
sciences
Engineering and engineering
technologies
Biological and biomedical
sciencesMathematics
and statisticsPhysical sciences
Science technologies

Ohio 11,949 2,636 5,604 2,402 473 766 68Oklahoma 3,489 764 1,541 802 152 228 2Oregon 2,906 550 1,122 738 206 290 0Pennsylvania 15,697 3,297 6,501 3,368 1,076 1,424 31Rhode Island 1,328 352 479 310 86 98 3
South Carolina 3,320 642 1,122 1,055 177 310 14South Dakota 1,165 206 593 248 46 71 1Tennessee 4,166 721 1,869 936 222 396 22Texas 14,351 2,435 6,187 3,500 895 965 369Utah 4,065 946 1,518 1,044 192 341 24
Vermont 822 132 283 261 76 70 0Virginia 6,572 1,638 2,368 1,519 348 698 1Washington 5,715 1,344 2,340 1,106 254 660 11West Virginia 1,720 234 797 453 54 177 5Wisconsin 7,087 1,316 2,593 2,265 351 546 16Wyoming 549 63 259 143 29 55 0NOTE: Awards conferred include both degrees and certificates. Awards to individuals of Hispanic or Latino ethnicity are included in the Hispanic or Latino category regardless of race.SOURCE: U.S. Department of Education, National Center for Education Statistics, Integrated Postsecondary Education Data System (IPEDS), Fall 2009, Completions component.
StateAll STEM
fields
Table 18c. Number of awards conferred in science, technology, engineering, and mathematics (STEM) Table 17c. fields to White students at Title IV institutions, by field and state: Academic year Table 17c. 2008–09—Continued
Computer and information
sciences
Engineering and engineering
technologies
Biological and biomedical
sciencesMathematics
and statisticsPhysical sciences
Science technologies
STEM field

United States 100.0 21.2 41.1 23.1 5.6 8.3 0.7
Alabama 100.0 15.1 47.7 25.8 5.4 5.9 0.1Alaska 100.0 10.3 47.4 25.0 4.1 13.1 0.0Arizona 100.0 47.1 23.2 14.5 2.1 7.3 5.9Arkansas 100.0 20.3 46.1 20.9 4.4 8.2 #California 100.0 19.9 35.9 26.0 7.2 10.9 0.1
Colorado 100.0 20.4 44.4 21.2 5.3 8.3 0.3Connecticut 100.0 8.2 40.2 29.3 11.1 10.5 0.7Delaware 100.0 17.9 47.8 24.0 2.8 7.0 0.6District of Columbia 100.0 31.0 40.8 18.3 5.1 4.8 0.0Florida 100.0 21.5 47.7 20.5 3.1 6.1 1.1
Georgia 100.0 28.9 38.3 21.7 4.1 6.5 0.4Hawaii 100.0 19.1 14.7 39.3 3.5 15.0 8.5Idaho 100.0 18.9 42.6 26.2 4.2 8.1 0.0Illinois 100.0 26.1 36.0 21.2 7.9 8.7 0.1Indiana 100.0 16.4 50.0 19.8 5.8 7.9 0.1
Iowa 100.0 16.2 43.8 27.1 6.0 6.5 0.3Kansas 100.0 16.1 48.6 22.9 4.1 7.7 0.6Kentucky 100.0 20.4 52.2 17.2 4.2 5.7 0.3Louisiana 100.0 20.0 47.7 23.7 2.9 5.2 0.4Maine 100.0 6.1 42.8 35.9 5.1 9.5 0.6
Maryland 100.0 31.6 31.1 23.4 5.8 7.6 0.5Massachusetts 100.0 17.0 40.2 25.2 7.0 10.2 0.4Michigan 100.0 18.5 51.5 18.9 4.0 6.5 0.6Minnesota 100.0 21.7 35.3 27.1 5.4 10.1 0.4Mississippi 100.0 12.4 43.7 23.5 4.7 15.7 0.0
Missouri 100.0 22.4 41.5 24.3 4.6 6.7 0.4Montana 100.0 10.0 43.9 27.8 6.5 11.8 0.0Nebraska 100.0 28.1 36.0 24.2 4.9 6.5 0.3Nevada 100.0 21.6 41.8 24.1 4.4 8.0 0.1New Hampshire 100.0 17.6 42.6 22.8 6.2 10.6 0.3
New Jersey 100.0 22.2 34.4 24.8 10.2 7.9 0.4New Mexico 100.0 22.0 43.5 16.4 5.0 11.8 1.2New York 100.0 20.0 38.3 24.1 8.0 9.1 0.5North Carolina 100.0 21.2 37.9 24.4 5.1 10.3 1.0North Dakota 100.0 14.4 57.1 19.2 4.2 5.1 0.0
Mathematics and statistics
Physical sciences
Science technologies
National Center for Education Statistics
STEM field
Table 18d. Percentage distribution of awards conferred in science, technology, engineering, and Table 17d. mathematics (STEM) fields to White students at Title IV institutions, by field and state: Table 17d. Academic year 2008–09
See notes at end of table.
StateAll STEM
fields
Computer and information
sciences
Engineering and engineering
technologies
Biological and biomedical
sciences

Ohio 100.0 22.1 46.9 20.1 4.0 6.4 0.6Oklahoma 100.0 21.9 44.2 23.0 4.4 6.5 0.1Oregon 100.0 18.9 38.6 25.4 7.1 10.0 0.0Pennsylvania 100.0 21.0 41.4 21.5 6.9 9.1 0.2Rhode Island 100.0 26.5 36.1 23.3 6.5 7.4 0.2
South Carolina 100.0 19.3 33.8 31.8 5.3 9.3 0.4South Dakota 100.0 17.7 50.9 21.3 3.9 6.1 0.1Tennessee 100.0 17.3 44.9 22.5 5.3 9.5 0.5Texas 100.0 17.0 43.1 24.4 6.2 6.7 2.6Utah 100.0 23.3 37.3 25.7 4.7 8.4 0.6
Vermont 100.0 16.1 34.4 31.8 9.2 8.5 0.0Virginia 100.0 24.9 36.0 23.1 5.3 10.6 #Washington 100.0 23.5 40.9 19.4 4.4 11.5 0.2West Virginia 100.0 13.6 46.3 26.3 3.1 10.3 0.3Wisconsin 100.0 18.6 36.6 32.0 5.0 7.7 0.2Wyoming 100.0 11.5 47.2 26.0 5.3 10.0 0.0
Computer and information
sciences
Engineering and engineering
technologies
Biological and biomedical
sciencesMathematics
and statisticsPhysical sciences
Science technologies
All STEM fields
SOURCE: U.S. Department of Education, National Center for Education Statistics, Integrated Postsecondary Education Data System (IPEDS), Fall 2009, Completions component.
Table 18d. Percentage distribution of awards conferred in science, technology, engineering, and Table 17d. mathematics (STEM) fields to White students at Title IV institutions, by field and state: Table 17d. Academic year 2008–09—Continued
STEM field
State
# Rounds to zero.NOTE: Awards conferred include both degrees and certificates. Awards to individuals of Hispanic or Latino ethnicity are included in the Hispanic or Latino category regardless of race. Detail may not sum to totals because of rounding.

United States 5.3 -18.7 5.9 25.2 36.3 15.7 94.5
Alabama -1.3 -39.0 -1.4 36.7 50.8 15.6 -84.2Alaska -15.3 -60.8 -14.8 2.1 6.7 70.0 †Arizona 82.9 263.2 -14.5 54.6 82.9 78.0 †Arkansas -31.1 -69.4 -5.9 12.0 8.3 14.2 †California 2.3 -14.5 -13.5 38.4 46.3 19.7 -31.4
Colorado 5.4 -35.2 35.5 12.7 38.3 10.0 -9.5Connecticut 22.9 -51.8 34.3 54.8 59.5 26.9 137.5Delaware 9.3 -15.8 29.1 0.0 150.0 -10.7 100.0District of Columbia 32.3 -12.4 135.3 7.6 144.8 26.4 †Florida 15.3 -24.1 25.0 54.8 39.7 28.1 1,940.0
Georgia 28.5 25.2 19.9 40.3 50.0 45.4 733.3Hawaii 11.8 -47.6 -7.4 67.5 -25.0 96.2 480.0Idaho 12.9 -16.9 14.5 38.1 41.7 22.0 †Illinois -9.3 -25.2 -11.2 -2.4 57.1 10.5 -46.7Indiana 8.4 -1.7 5.6 24.6 35.7 3.0 -73.3
Iowa -3.4 -42.5 10.4 13.9 15.4 4.0 12.5Kansas -14.7 -45.1 5.1 -21.1 -8.8 2.4 0.0Kentucky 53.8 54.6 78.4 25.6 22.3 16.9 -44.4Louisiana -10.7 -40.8 -1.1 15.4 0.0 -5.8 -54.8Maine 14.7 -52.6 21.5 47.9 39.5 -11.0 40.0
Maryland 3.0 -2.4 -1.2 6.4 24.8 15.5 †Massachusetts 4.3 -8.1 -2.9 24.1 34.8 0.4 24.0Michigan 15.9 46.4 2.8 34.8 39.8 -0.1 438.5Minnesota 3.7 -36.2 8.1 56.2 29.0 24.9 283.3Mississippi 7.4 -10.1 4.3 13.4 -9.3 36.3 †
Missouri -4.0 -40.2 2.9 47.5 26.5 12.2 166.7Montana -0.1 -14.6 -0.2 8.5 10.8 -7.1 -100.0Nebraska 7.7 -18.8 8.5 63.8 34.5 6.8 -41.7Nevada 57.5 35.6 54.3 86.4 68.2 61.9 †New Hampshire -10.3 -60.7 63.4 -17.4 22.0 39.8 -50.0
New Jersey -27.8 -67.4 -1.1 9.7 90.2 7.1 280.0New Mexico 33.1 35.7 39.2 21.5 38.6 16.3 275.0New York 0.3 -41.2 12.7 30.3 54.6 17.1 87.2North Carolina 7.1 -22.6 19.2 13.7 10.2 27.6 †North Dakota 5.4 -25.1 10.7 20.3 84.6 -13.4 †
Science technologies
See notes at end of table.
National Center for Education Statistics
STEM field
Table 18e. Percentage change in number of awards conferred in science, technology, engineering, and Table 17e. mathematics (STEM) fields to White students at Title IV institutions, by field and state: Table 17e. Academic years 2000–01 and 2008–09
StateAll STEM
fields
Computer and information
sciences
Engineering and engineering
technologies
Biological and biomedical
sciencesMathematics
and statisticsPhysical sciences

Ohio 5.4 -9.1 9.1 19.5 8.2 -5.9 58.1Oklahoma 22.3 16.6 29.6 26.7 16.0 -3.4 -75.0Oregon 23.9 37.8 11.6 34.2 57.3 14.6 -100.0Pennsylvania -7.7 -34.4 -7.9 13.9 48.4 17.4 10.7Rhode Island -9.2 -33.8 -4.4 17.4 32.3 7.7 -66.7
South Carolina 3.2 -22.6 0.5 24.1 17.2 19.2 40.0South Dakota 4.3 -14.9 5.3 16.4 17.9 18.3 †Tennessee 17.1 44.8 9.8 8.7 25.4 29.4 69.2Texas 6.7 -25.0 8.1 32.7 41.6 11.2 9.8Utah 11.1 2.5 9.0 13.6 35.2 27.2 60.0
Vermont 31.3 -10.8 48.2 33.2 145.2 20.7 -100.0Virginia 0.3 -1.5 -4.8 11.0 7.7 -1.6 0.0Washington 14.2 1.0 4.9 29.7 37.3 66.7 37.5West Virginia -15.1 -60.5 -10.7 36.9 -5.3 18.0 150.0Wisconsin 7.4 -17.3 -3.4 45.9 17.0 22.4 -38.5Wyoming 7.2 -18.2 16.1 21.2 -19.4 -5.2 †
All STEM fields
Computer and information
sciences
Engineering and engineering
technologies
Biological and biomedical
sciencesMathematics
and statisticsPhysical sciences
Science technologies
NOTE: Awards conferred include both degrees and certificates. Awards to individuals of Hispanic or Latino ethnicity are included in the Hispanic or Latino category regardless of race.SOURCE: U.S. Department of Education, National Center for Education Statistics, Integrated Postsecondary Education Data System (IPEDS), Fall 2001 and Fall 2009, Completions component.
† Not applicable.
Table 18e. Percentage change in number of awards conferred in science, technology, engineering, and Table 17e. mathematics (STEM) fields to White students at Title IV institutions, by field and state: Table 17e. Academic years 2000–01 and 2008–09—Continued
STEM field
State
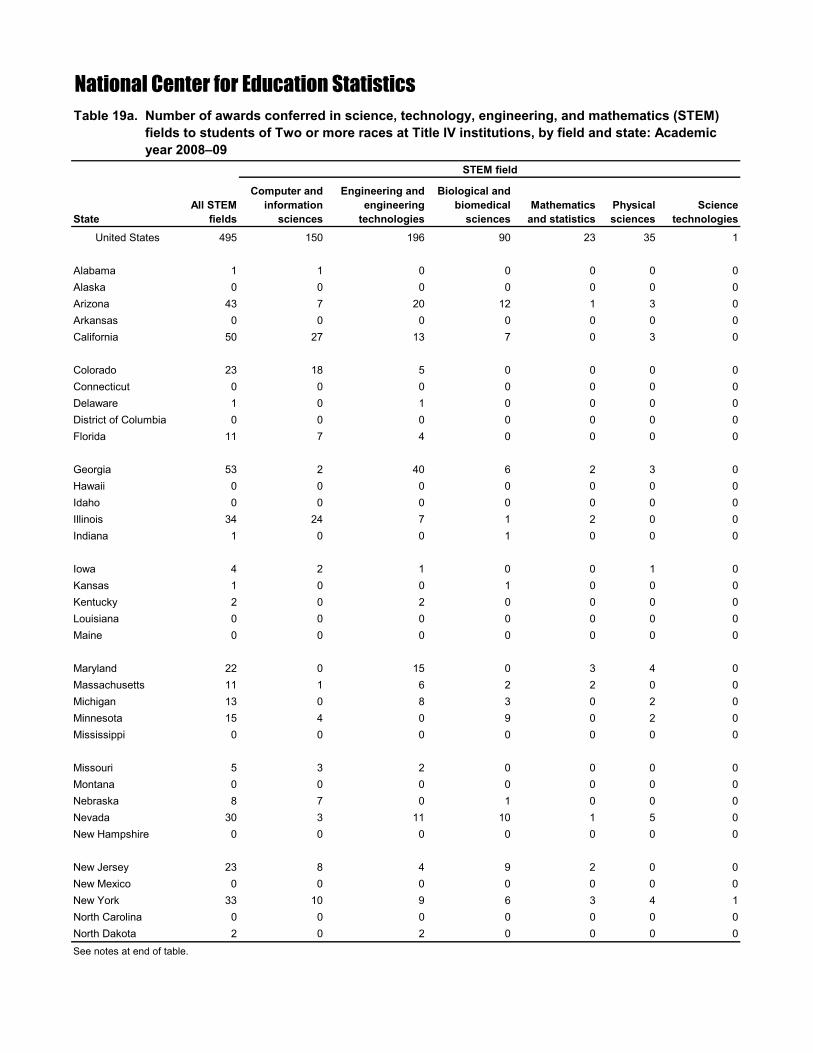
United States 495 150 196 90 23 35 1
Alabama 1 1 0 0 0 0 0Alaska 0 0 0 0 0 0 0Arizona 43 7 20 12 1 3 0Arkansas 0 0 0 0 0 0 0California 50 27 13 7 0 3 0
Colorado 23 18 5 0 0 0 0Connecticut 0 0 0 0 0 0 0Delaware 1 0 1 0 0 0 0District of Columbia 0 0 0 0 0 0 0Florida 11 7 4 0 0 0 0
Georgia 53 2 40 6 2 3 0Hawaii 0 0 0 0 0 0 0Idaho 0 0 0 0 0 0 0Illinois 34 24 7 1 2 0 0Indiana 1 0 0 1 0 0 0
Iowa 4 2 1 0 0 1 0Kansas 1 0 0 1 0 0 0Kentucky 2 0 2 0 0 0 0Louisiana 0 0 0 0 0 0 0Maine 0 0 0 0 0 0 0
Maryland 22 0 15 0 3 4 0Massachusetts 11 1 6 2 2 0 0Michigan 13 0 8 3 0 2 0Minnesota 15 4 0 9 0 2 0Mississippi 0 0 0 0 0 0 0
Missouri 5 3 2 0 0 0 0Montana 0 0 0 0 0 0 0Nebraska 8 7 0 1 0 0 0Nevada 30 3 11 10 1 5 0New Hampshire 0 0 0 0 0 0 0
New Jersey 23 8 4 9 2 0 0New Mexico 0 0 0 0 0 0 0New York 33 10 9 6 3 4 1North Carolina 0 0 0 0 0 0 0North Dakota 2 0 2 0 0 0 0
Physical sciences
Science technologies
See notes at end of table.
National Center for Education Statistics
STEM field
State
Table 19a. Number of awards conferred in science, technology, engineering, and mathematics (STEM) Table 21a. fields to students of Two or more races at Title IV institutions, by field and state: Academic Table 21a. year 2008–09
All STEM fields
Computer and information
sciences
Engineering and engineering
technologies
Biological and biomedical
sciencesMathematics
and statistics

Ohio 6 3 1 1 0 1 0Oklahoma 23 2 11 8 1 1 0Oregon 4 0 4 0 0 0 0Pennsylvania 18 4 7 3 2 2 0Rhode Island 5 1 0 2 2 0 0
South Carolina 5 1 1 2 1 0 0South Dakota 2 2 0 0 0 0 0Tennessee 0 0 0 0 0 0 0Texas 15 4 11 0 0 0 0Utah 0 0 0 0 0 0 0
Vermont 0 0 0 0 0 0 0Virginia 9 6 1 0 1 1 0Washington 12 1 5 5 0 1 0West Virginia 0 0 0 0 0 0 0Wisconsin 10 2 5 1 0 2 0Wyoming 0 0 0 0 0 0 0
Computer and information
sciences
Engineering and engineering
technologies
Biological and biomedical
sciencesMathematics
and statisticsPhysical sciences
Science technologies
SOURCE: U.S. Department of Education, National Center for Education Statistics, Integrated Postsecondary Education Data System (IPEDS), Fall 2009, Completions component.
StateAll STEM
fields
STEM field
Table 19a. Number of awards conferred in science, technology, engineering, and mathematics (STEM) Table 21a. fields to students of Two or more races at Title IV institutions, by field and state: Academic Table 21a. year 2008–09—Continued
NOTE: Awards conferred include both degrees and certificates. Two or more races was an optional reporting category for the IPEDS 2009-10 collection year, during which the 2008-09 Completions data were collected, and 771 institutions reported awarding degrees or certificates using this option. The figures reported here should not be considered representative of all completions awarded to individuals who could be classified into Two or more races. Awards to individuals of Hispanic or Latino ethnicity are included in the Hispanic or Latino category regardless of race.

United States 100.0 30.3 39.6 18.2 4.6 7.1 0.2
Alabama 100.0 100.0 0.0 0.0 0.0 0.0 0.0Alaska † † † † † † †Arizona 100.0 16.3 46.5 27.9 2.3 7.0 0.0Arkansas † † † † † † †California 100.0 54.0 26.0 14.0 0.0 6.0 0.0
Colorado 100.0 78.3 21.7 0.0 0.0 0.0 0.0Connecticut † † † † † † †Delaware 100.0 0.0 100.0 0.0 0.0 0.0 0.0District of Columbia † † † † † † †Florida 100.0 63.6 36.4 0.0 0.0 0.0 0.0
Georgia 100.0 3.8 75.5 11.3 3.8 5.7 0.0Hawaii † † † † † † †Idaho † † † † † † †Illinois 100.0 70.6 20.6 2.9 5.9 0.0 0.0Indiana 100.0 0.0 0.0 100.0 0.0 0.0 0.0
Iowa 100.0 50.0 25.0 0.0 0.0 25.0 0.0Kansas 100.0 0.0 0.0 100.0 0.0 0.0 0.0Kentucky 100.0 0.0 100.0 0.0 0.0 0.0 0.0Louisiana † † † † † † †Maine † † † † † † †
Maryland 100.0 0.0 68.2 0.0 13.6 18.2 0.0Massachusetts 100.0 9.1 54.5 18.2 18.2 0.0 0.0Michigan 100.0 0.0 61.5 23.1 0.0 15.4 0.0Minnesota 100.0 26.7 0.0 60.0 0.0 13.3 0.0Mississippi † † † † † † †
Missouri 100.0 60.0 40.0 0.0 0.0 0.0 0.0Montana † † † † † † †Nebraska 100.0 87.5 0.0 12.5 0.0 0.0 0.0Nevada 100.0 10.0 36.7 33.3 3.3 16.7 0.0New Hampshire † † † † † † †
New Jersey 100.0 34.8 17.4 39.1 8.7 0.0 0.0New Mexico † † † † † † †New York 100.0 30.3 27.3 18.2 9.1 12.1 3.0North Carolina † † † † † † †North Dakota 100.0 0.0 100.0 0.0 0.0 0.0 0.0See notes at end of table.
National Center for Education Statistics
STEM field
Table 19b. Percentage distribution of awards conferred in science, technology, engineering, and Table 21b. mathematics (STEM) fields to students of Two or more races at Title IV institutions, by fieldTable 21b. and state: Academic year 2008–09
StateAll STEM
fields
Computer and information
sciences
Engineering and engineering
technologies
Biological and biomedical
sciencesMathematics
and statisticsPhysical sciences
Science technologies

Ohio 100.0 50.0 16.7 16.7 0.0 16.7 0.0Oklahoma 100.0 8.7 47.8 34.8 4.3 4.3 0.0Oregon 100.0 0.0 100.0 0.0 0.0 0.0 0.0Pennsylvania 100.0 22.2 38.9 16.7 11.1 11.1 0.0Rhode Island 100.0 20.0 0.0 40.0 40.0 0.0 0.0
South Carolina 100.0 20.0 20.0 40.0 20.0 0.0 0.0South Dakota 100.0 100.0 0.0 0.0 0.0 0.0 0.0Tennessee † † † † † † †Texas 100.0 26.7 73.3 0.0 0.0 0.0 0.0Utah † † † † † † †
Vermont † † † † † † †Virginia 100.0 66.7 11.1 0.0 11.1 11.1 0.0Washington 100.0 8.3 41.7 41.7 0.0 8.3 0.0West Virginia † † † † † † †Wisconsin 100.0 20.0 50.0 10.0 0.0 20.0 0.0Wyoming † † † † † † †
SOURCE: U.S. Department of Education, National Center for Education Statistics, Integrated Postsecondary Education Data System (IPEDS), Fall 2009, Completions component.
StateAll STEM
fields
Computer and information
sciences
Engineering and engineering
technologies
Biological and biomedical
sciencesMathematics
and statisticsPhysical sciences
Science technologies
NOTE: Awards conferred include both degrees and certificates. Two or more races was an optional reporting category for the IPEDS 2009-10 collection year, during which the 2008-09 Completions data were collected, and 771 institutions reported awarding degrees or certificates using this option. The figures reported here should not be considered representative of all completions awarded to individuals who could be classified into Two or more races. Awards to individuals of Hispanic or Latino ethnicity are included in the Hispanic or Latino category regardless of race. Detail may not sum to totals because of rounding.
† Not applicable.
Table 19b. Percentage distribution of awards conferred in science, technology, engineering, and Table 21b. mathematics (STEM) fields to students of Two or more races at Title IV institutions, by field Table 21b. and state: Academic year 2008–09—Continued
STEM field

United States 15,460 5,384 5,807 2,380 620 1,243 26
Alabama 50 20 15 10 3 2 0Alaska 92 83 8 1 0 0 0Arizona 382 208 163 9 0 2 0Arkansas 6 0 0 3 0 3 0California 2,879 904 935 625 173 239 3
Colorado 469 214 180 44 12 19 0Connecticut 197 70 54 39 15 19 0Delaware 42 32 3 7 0 0 0District of Columbia 174 119 19 28 2 6 0Florida 314 196 88 23 1 6 0
Georgia 119 44 55 13 5 2 0Hawaii 101 18 25 35 5 17 1Idaho 42 13 16 6 1 6 0Illinois 350 124 110 79 16 21 0Indiana 178 58 76 18 12 14 0
Iowa 99 14 36 35 5 9 0Kansas 180 113 30 19 5 13 0Kentucky 21 4 8 5 1 3 0Louisiana 94 17 42 21 4 10 0Maine 36 6 24 3 0 3 0
Maryland 170 50 51 53 8 8 0Massachusetts 1,299 278 452 205 63 295 6Michigan 539 105 306 74 6 47 1Minnesota 373 189 141 23 4 16 0Mississippi 12 4 7 0 1 0 0
Missouri 281 108 106 38 11 17 1Montana 80 16 35 21 2 6 0Nebraska 42 14 11 7 2 8 0Nevada 79 29 26 12 2 10 0New Hampshire 247 124 74 29 10 10 0
New Jersey 655 257 207 114 28 48 1New Mexico 286 45 167 40 10 22 2New York 2,368 979 935 288 79 82 5North Carolina 121 42 36 32 5 6 0North Dakota 0 0 0 0 0 0 0
Physical sciences
Science technologies
See notes at end of table.
National Center for Education Statistics
STEM field
State
Table 20a. Number of awards conferred in science, technology, engineering, and mathematics (STEM) Table 19a. fields to students of unknown race/ethnicity at Title IV institutions, by field and state: Table 19a. Academic year 2000–01
All STEM fields
Computer and information
sciences
Engineering and engineering
technologies
Biological and biomedical
sciencesMathematics
and statistics

Ohio 305 87 127 43 14 32 2Oklahoma 10 0 7 2 0 1 0Oregon 233 31 113 46 14 29 0Pennsylvania 1,051 366 528 78 20 59 0Rhode Island 65 18 24 16 4 2 1
South Carolina 59 15 30 11 2 1 0South Dakota 17 8 4 5 0 0 0Tennessee 49 10 21 11 4 3 0Texas 230 60 83 41 20 25 1Utah 176 42 69 34 5 24 2
Vermont 58 13 8 9 4 24 0Virginia 181 40 77 28 12 24 0Washington 508 137 212 84 29 46 0West Virginia 5 1 1 3 0 0 0Wisconsin 107 53 48 6 0 0 0Wyoming 29 6 14 4 1 4 0
Computer and information
sciences
Engineering and engineering
technologies
Biological and biomedical
sciencesMathematics
and statisticsPhysical sciences
Science technologies
SOURCE: U.S. Department of Education, National Center for Education Statistics, Integrated Postsecondary Education Data System (IPEDS), Fall 2001, Completions component.
StateAll STEM
fields
STEM field
Table 20a. Number of awards conferred in science, technology, engineering, and mathematics (STEM) Table 19a. fields to students of unknown race/ethnicity at Title IV institutions, by field and state: Table 19a. Academic year 2000–01—Continued
NOTE: Awards conferred include both degrees and certificates. Awards to individuals of Hispanic or Latino ethnicity are included in the Hispanic or Latino category regardless of race.

United States 100.0 34.8 37.6 15.4 4.0 8.0 0.2
Alabama 100.0 40.0 30.0 20.0 6.0 4.0 0.0Alaska 100.0 90.2 8.7 1.1 0.0 0.0 0.0Arizona 100.0 54.5 42.7 2.4 0.0 0.5 0.0Arkansas 100.0 0.0 0.0 50.0 0.0 50.0 0.0California 100.0 31.4 32.5 21.7 6.0 8.3 0.1
Colorado 100.0 45.6 38.4 9.4 2.6 4.1 0.0Connecticut 100.0 35.5 27.4 19.8 7.6 9.6 0.0Delaware 100.0 76.2 7.1 16.7 0.0 0.0 0.0District of Columbia 100.0 68.4 10.9 16.1 1.1 3.4 0.0Florida 100.0 62.4 28.0 7.3 0.3 1.9 0.0
Georgia 100.0 37.0 46.2 10.9 4.2 1.7 0.0Hawaii 100.0 17.8 24.8 34.7 5.0 16.8 1.0Idaho 100.0 31.0 38.1 14.3 2.4 14.3 0.0Illinois 100.0 35.4 31.4 22.6 4.6 6.0 0.0Indiana 100.0 32.6 42.7 10.1 6.7 7.9 0.0
Iowa 100.0 14.1 36.4 35.4 5.1 9.1 0.0Kansas 100.0 62.8 16.7 10.6 2.8 7.2 0.0Kentucky 100.0 19.0 38.1 23.8 4.8 14.3 0.0Louisiana 100.0 18.1 44.7 22.3 4.3 10.6 0.0Maine 100.0 16.7 66.7 8.3 0.0 8.3 0.0
Maryland 100.0 29.4 30.0 31.2 4.7 4.7 0.0Massachusetts 100.0 21.4 34.8 15.8 4.8 22.7 0.5Michigan 100.0 19.5 56.8 13.7 1.1 8.7 0.2Minnesota 100.0 50.7 37.8 6.2 1.1 4.3 0.0Mississippi 100.0 33.3 58.3 0.0 8.3 0.0 0.0
Missouri 100.0 38.4 37.7 13.5 3.9 6.0 0.4Montana 100.0 20.0 43.8 26.3 2.5 7.5 0.0Nebraska 100.0 33.3 26.2 16.7 4.8 19.0 0.0Nevada 100.0 36.7 32.9 15.2 2.5 12.7 0.0New Hampshire 100.0 50.2 30.0 11.7 4.0 4.0 0.0
New Jersey 100.0 39.2 31.6 17.4 4.3 7.3 0.2New Mexico 100.0 15.7 58.4 14.0 3.5 7.7 0.7New York 100.0 41.3 39.5 12.2 3.3 3.5 0.2North Carolina 100.0 34.7 29.8 26.4 4.1 5.0 0.0North Dakota † † † † † † †
Mathematics and statistics
Physical sciences
Science technologies
National Center for Education Statistics
STEM field
Table 20b. Percentage distribution of awards conferred in science, technology, engineering, and Table 19b. mathematics (STEM) fields to students of unknown race/ethnicity at Title IV institutions, by Table 19b. field and state: Academic year 2000–01
State
See notes at end of table.
All STEM fields
Computer and information
sciences
Engineering and engineering
technologies
Biological and biomedical
sciences
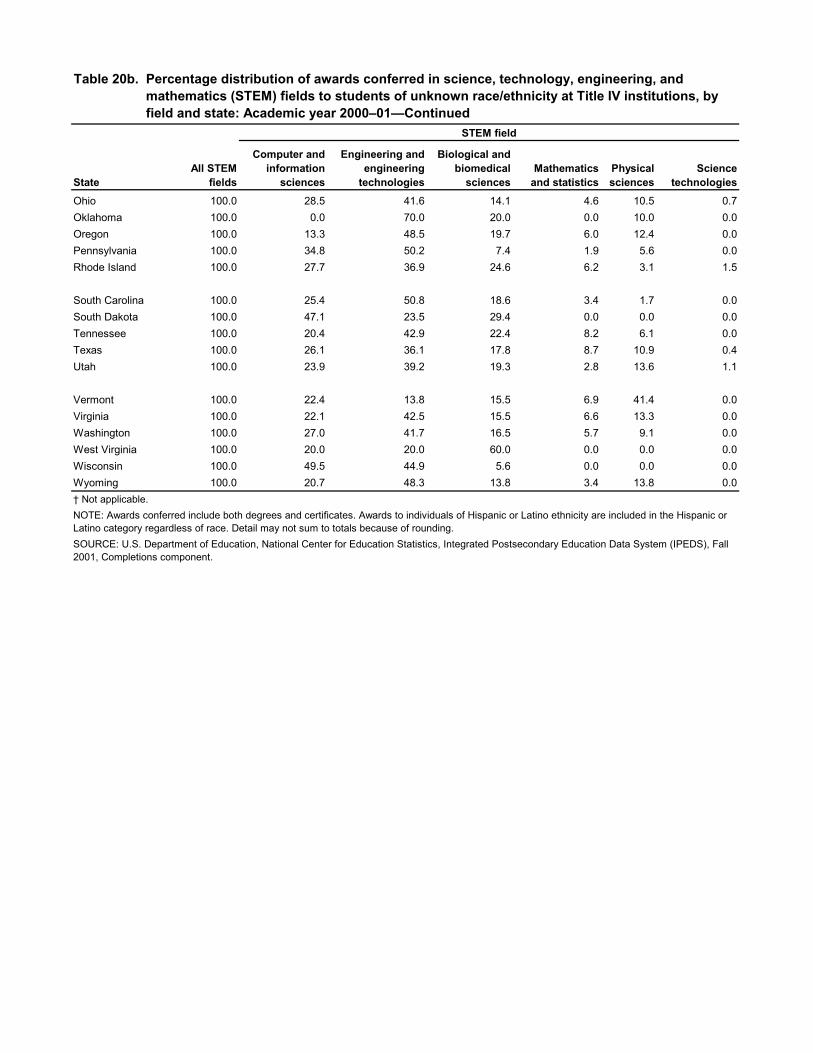
Ohio 100.0 28.5 41.6 14.1 4.6 10.5 0.7Oklahoma 100.0 0.0 70.0 20.0 0.0 10.0 0.0Oregon 100.0 13.3 48.5 19.7 6.0 12.4 0.0Pennsylvania 100.0 34.8 50.2 7.4 1.9 5.6 0.0Rhode Island 100.0 27.7 36.9 24.6 6.2 3.1 1.5
South Carolina 100.0 25.4 50.8 18.6 3.4 1.7 0.0South Dakota 100.0 47.1 23.5 29.4 0.0 0.0 0.0Tennessee 100.0 20.4 42.9 22.4 8.2 6.1 0.0Texas 100.0 26.1 36.1 17.8 8.7 10.9 0.4Utah 100.0 23.9 39.2 19.3 2.8 13.6 1.1
Vermont 100.0 22.4 13.8 15.5 6.9 41.4 0.0Virginia 100.0 22.1 42.5 15.5 6.6 13.3 0.0Washington 100.0 27.0 41.7 16.5 5.7 9.1 0.0West Virginia 100.0 20.0 20.0 60.0 0.0 0.0 0.0Wisconsin 100.0 49.5 44.9 5.6 0.0 0.0 0.0Wyoming 100.0 20.7 48.3 13.8 3.4 13.8 0.0
Computer and information
sciences
Engineering and engineering
technologies
Biological and biomedical
sciencesMathematics
and statisticsPhysical sciences
Science technologies
SOURCE: U.S. Department of Education, National Center for Education Statistics, Integrated Postsecondary Education Data System (IPEDS), Fall 2001, Completions component.
NOTE: Awards conferred include both degrees and certificates. Awards to individuals of Hispanic or Latino ethnicity are included in the Hispanic or Latino category regardless of race. Detail may not sum to totals because of rounding.
† Not applicable.
Table 20b. Percentage distribution of awards conferred in science, technology, engineering, and Table 19b. mathematics (STEM) fields to students of unknown race/ethnicity at Title IV institutions, by Table 19b. field and state: Academic year 2000–01—Continued
STEM field
StateAll STEM
fields
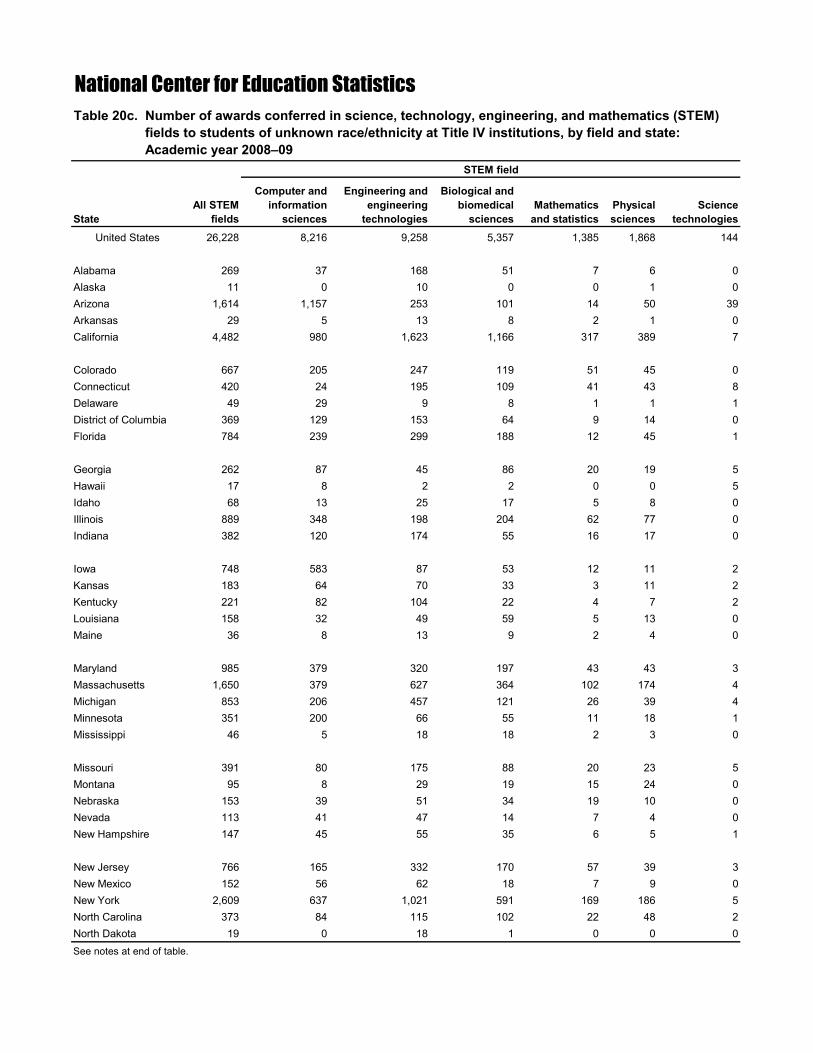
United States 26,228 8,216 9,258 5,357 1,385 1,868 144
Alabama 269 37 168 51 7 6 0Alaska 11 0 10 0 0 1 0Arizona 1,614 1,157 253 101 14 50 39Arkansas 29 5 13 8 2 1 0California 4,482 980 1,623 1,166 317 389 7
Colorado 667 205 247 119 51 45 0Connecticut 420 24 195 109 41 43 8Delaware 49 29 9 8 1 1 1District of Columbia 369 129 153 64 9 14 0Florida 784 239 299 188 12 45 1
Georgia 262 87 45 86 20 19 5Hawaii 17 8 2 2 0 0 5Idaho 68 13 25 17 5 8 0Illinois 889 348 198 204 62 77 0Indiana 382 120 174 55 16 17 0
Iowa 748 583 87 53 12 11 2Kansas 183 64 70 33 3 11 2Kentucky 221 82 104 22 4 7 2Louisiana 158 32 49 59 5 13 0Maine 36 8 13 9 2 4 0
Maryland 985 379 320 197 43 43 3Massachusetts 1,650 379 627 364 102 174 4Michigan 853 206 457 121 26 39 4Minnesota 351 200 66 55 11 18 1Mississippi 46 5 18 18 2 3 0
Missouri 391 80 175 88 20 23 5Montana 95 8 29 19 15 24 0Nebraska 153 39 51 34 19 10 0Nevada 113 41 47 14 7 4 0New Hampshire 147 45 55 35 6 5 1
New Jersey 766 165 332 170 57 39 3New Mexico 152 56 62 18 7 9 0New York 2,609 637 1,021 591 169 186 5North Carolina 373 84 115 102 22 48 2North Dakota 19 0 18 1 0 0 0
Physical sciences
Science technologies
See notes at end of table.
National Center for Education Statistics
STEM field
State
Table 20c. Number of awards conferred in science, technology, engineering, and mathematics (STEM) Table 19c. fields to students of unknown race/ethnicity at Title IV institutions, by field and state: Table 19c. Academic year 2008–09
All STEM fields
Computer and information
sciences
Engineering and engineering
technologies
Biological and biomedical
sciencesMathematics
and statistics
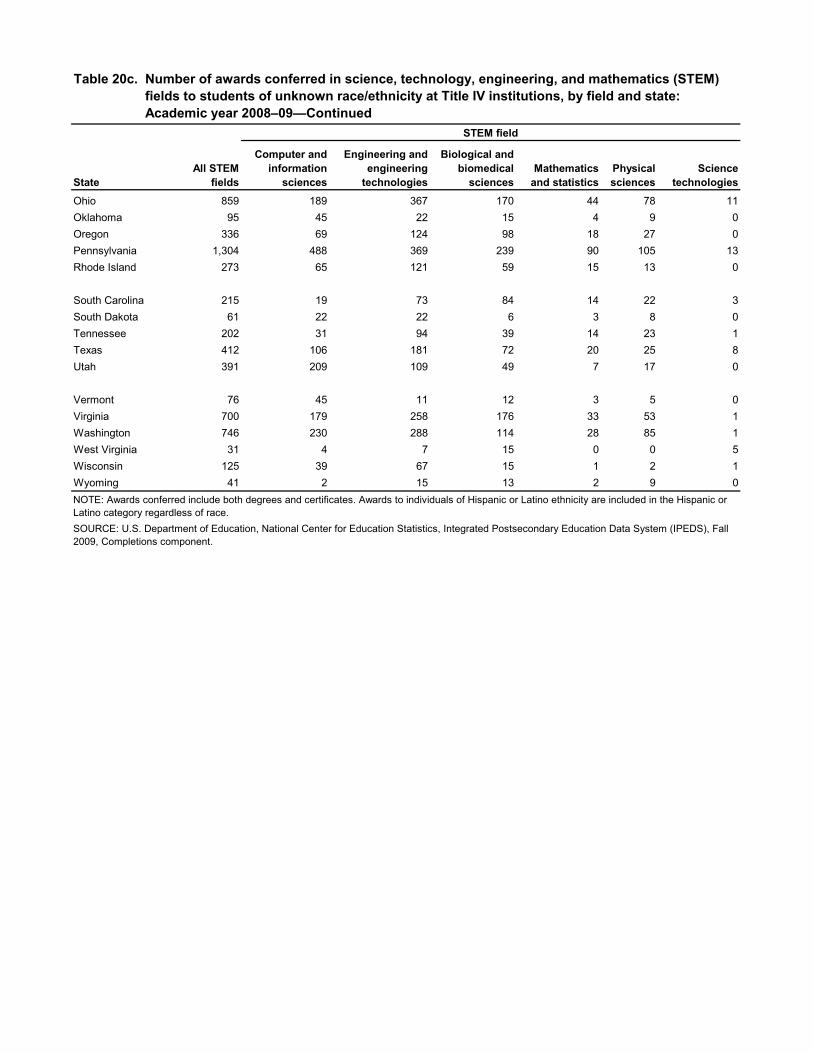
Ohio 859 189 367 170 44 78 11Oklahoma 95 45 22 15 4 9 0Oregon 336 69 124 98 18 27 0Pennsylvania 1,304 488 369 239 90 105 13Rhode Island 273 65 121 59 15 13 0
South Carolina 215 19 73 84 14 22 3South Dakota 61 22 22 6 3 8 0Tennessee 202 31 94 39 14 23 1Texas 412 106 181 72 20 25 8Utah 391 209 109 49 7 17 0
Vermont 76 45 11 12 3 5 0Virginia 700 179 258 176 33 53 1Washington 746 230 288 114 28 85 1West Virginia 31 4 7 15 0 0 5Wisconsin 125 39 67 15 1 2 1Wyoming 41 2 15 13 2 9 0
Computer and information
sciences
Engineering and engineering
technologies
Biological and biomedical
sciencesMathematics
and statisticsPhysical sciences
Science technologies
SOURCE: U.S. Department of Education, National Center for Education Statistics, Integrated Postsecondary Education Data System (IPEDS), Fall 2009, Completions component.
StateAll STEM
fields
STEM field
Table 20c. Number of awards conferred in science, technology, engineering, and mathematics (STEM) Table 19c. fields to students of unknown race/ethnicity at Title IV institutions, by field and state: Table 19c. Academic year 2008–09—Continued
NOTE: Awards conferred include both degrees and certificates. Awards to individuals of Hispanic or Latino ethnicity are included in the Hispanic or Latino category regardless of race.

United States 100.0 31.3 35.3 20.4 5.3 7.1 0.5
Alabama 100.0 13.8 62.5 19.0 2.6 2.2 0.0Alaska 100.0 0.0 90.9 0.0 0.0 9.1 0.0Arizona 100.0 71.7 15.7 6.3 0.9 3.1 2.4Arkansas 100.0 17.2 44.8 27.6 6.9 3.4 0.0California 100.0 21.9 36.2 26.0 7.1 8.7 0.2
Colorado 100.0 30.7 37.0 17.8 7.6 6.7 0.0Connecticut 100.0 5.7 46.4 26.0 9.8 10.2 1.9Delaware 100.0 59.2 18.4 16.3 2.0 2.0 2.0District of Columbia 100.0 35.0 41.5 17.3 2.4 3.8 0.0Florida 100.0 30.5 38.1 24.0 1.5 5.7 0.1
Georgia 100.0 33.2 17.2 32.8 7.6 7.3 1.9Hawaii 100.0 47.1 11.8 11.8 0.0 0.0 29.4Idaho 100.0 19.1 36.8 25.0 7.4 11.8 0.0Illinois 100.0 39.1 22.3 22.9 7.0 8.7 0.0Indiana 100.0 31.4 45.5 14.4 4.2 4.5 0.0
Iowa 100.0 77.9 11.6 7.1 1.6 1.5 0.3Kansas 100.0 35.0 38.3 18.0 1.6 6.0 1.1Kentucky 100.0 37.1 47.1 10.0 1.8 3.2 0.9Louisiana 100.0 20.3 31.0 37.3 3.2 8.2 0.0Maine 100.0 22.2 36.1 25.0 5.6 11.1 0.0
Maryland 100.0 38.5 32.5 20.0 4.4 4.4 0.3Massachusetts 100.0 23.0 38.0 22.1 6.2 10.5 0.2Michigan 100.0 24.2 53.6 14.2 3.0 4.6 0.5Minnesota 100.0 57.0 18.8 15.7 3.1 5.1 0.3Mississippi 100.0 10.9 39.1 39.1 4.3 6.5 0.0
Missouri 100.0 20.5 44.8 22.5 5.1 5.9 1.3Montana 100.0 8.4 30.5 20.0 15.8 25.3 0.0Nebraska 100.0 25.5 33.3 22.2 12.4 6.5 0.0Nevada 100.0 36.3 41.6 12.4 6.2 3.5 0.0New Hampshire 100.0 30.6 37.4 23.8 4.1 3.4 0.7
New Jersey 100.0 21.5 43.3 22.2 7.4 5.1 0.4New Mexico 100.0 36.8 40.8 11.8 4.6 5.9 0.0New York 100.0 24.4 39.1 22.7 6.5 7.1 0.2North Carolina 100.0 22.5 30.8 27.3 5.9 12.9 0.5North Dakota 100.0 0.0 94.7 5.3 0.0 0.0 0.0
Physical sciences
Science technologies
National Center for Education Statistics
STEM field
Table 20d. Percentage distribution of awards conferred in science, technology, engineering, and Table 20b. mathematics (STEM) fields to students of unknown race/ethnicity at Title IV institutions, Table 20b. by field and state: Academic year 2008–09
See notes at end of table.
StateAll STEM
fields
Computer and information
sciences
Engineering and engineering
technologies
Biological and biomedical
sciencesMathematics
and statistics

Ohio 100.0 22.0 42.7 19.8 5.1 9.1 1.3Oklahoma 100.0 47.4 23.2 15.8 4.2 9.5 0.0Oregon 100.0 20.5 36.9 29.2 5.4 8.0 0.0Pennsylvania 100.0 37.4 28.3 18.3 6.9 8.1 1.0Rhode Island 100.0 23.8 44.3 21.6 5.5 4.8 0.0
South Carolina 100.0 8.8 34.0 39.1 6.5 10.2 1.4South Dakota 100.0 36.1 36.1 9.8 4.9 13.1 0.0Tennessee 100.0 15.3 46.5 19.3 6.9 11.4 0.5Texas 100.0 25.7 43.9 17.5 4.9 6.1 1.9Utah 100.0 53.5 27.9 12.5 1.8 4.3 0.0
Vermont 100.0 59.2 14.5 15.8 3.9 6.6 0.0Virginia 100.0 25.6 36.9 25.1 4.7 7.6 0.1Washington 100.0 30.8 38.6 15.3 3.8 11.4 0.1West Virginia 100.0 12.9 22.6 48.4 0.0 0.0 16.1Wisconsin 100.0 31.2 53.6 12.0 0.8 1.6 0.8Wyoming 100.0 4.9 36.6 31.7 4.9 22.0 0.0
Computer and information
sciences
Engineering and engineering
technologies
Biological and biomedical
sciencesMathematics
and statisticsPhysical sciences
Science technologies
All STEM fields
SOURCE: U.S. Department of Education, National Center for Education Statistics, Integrated Postsecondary Education Data System (IPEDS), Fall 2009, Completions component.
Table 20d. Percentage distribution of awards conferred in science, technology, engineering, and Table 20d. mathematics (STEM) fields to students of unknown race/ethnicit at Title IV institutions, Table 20d. by field and state: Academic year 2008–09—Continued
STEM field
State
NOTE: Awards conferred include both degrees and certificates. Awards to individuals of Hispanic or Latino ethnicity are included in the Hispanic or Latino category regardless of race. Detail may not sum to totals because of rounding.
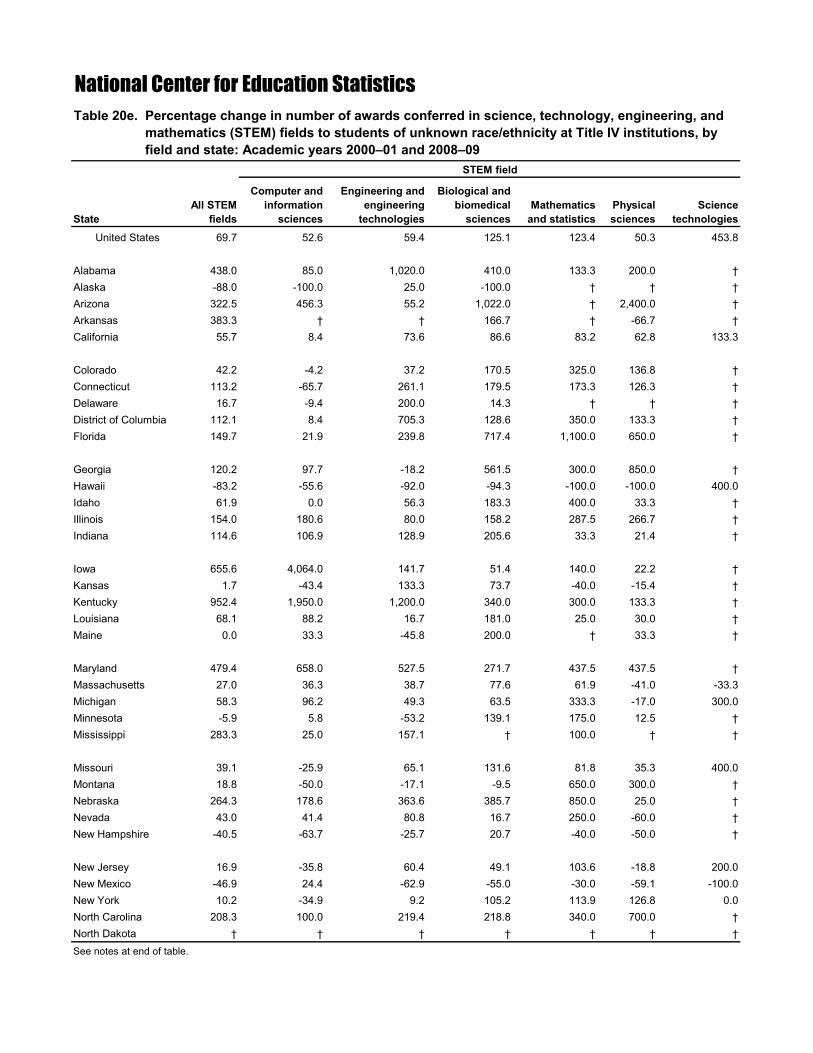
United States 69.7 52.6 59.4 125.1 123.4 50.3 453.8
Alabama 438.0 85.0 1,020.0 410.0 133.3 200.0 †Alaska -88.0 -100.0 25.0 -100.0 † † †Arizona 322.5 456.3 55.2 1,022.0 † 2,400.0 †Arkansas 383.3 † † 166.7 † -66.7 †California 55.7 8.4 73.6 86.6 83.2 62.8 133.3
Colorado 42.2 -4.2 37.2 170.5 325.0 136.8 †Connecticut 113.2 -65.7 261.1 179.5 173.3 126.3 †Delaware 16.7 -9.4 200.0 14.3 † † †District of Columbia 112.1 8.4 705.3 128.6 350.0 133.3 †Florida 149.7 21.9 239.8 717.4 1,100.0 650.0 †
Georgia 120.2 97.7 -18.2 561.5 300.0 850.0 †Hawaii -83.2 -55.6 -92.0 -94.3 -100.0 -100.0 400.0Idaho 61.9 0.0 56.3 183.3 400.0 33.3 †Illinois 154.0 180.6 80.0 158.2 287.5 266.7 †Indiana 114.6 106.9 128.9 205.6 33.3 21.4 †
Iowa 655.6 4,064.0 141.7 51.4 140.0 22.2 †Kansas 1.7 -43.4 133.3 73.7 -40.0 -15.4 †Kentucky 952.4 1,950.0 1,200.0 340.0 300.0 133.3 †Louisiana 68.1 88.2 16.7 181.0 25.0 30.0 †Maine 0.0 33.3 -45.8 200.0 † 33.3 †
Maryland 479.4 658.0 527.5 271.7 437.5 437.5 †Massachusetts 27.0 36.3 38.7 77.6 61.9 -41.0 -33.3Michigan 58.3 96.2 49.3 63.5 333.3 -17.0 300.0Minnesota -5.9 5.8 -53.2 139.1 175.0 12.5 †Mississippi 283.3 25.0 157.1 † 100.0 † †
Missouri 39.1 -25.9 65.1 131.6 81.8 35.3 400.0Montana 18.8 -50.0 -17.1 -9.5 650.0 300.0 †Nebraska 264.3 178.6 363.6 385.7 850.0 25.0 †Nevada 43.0 41.4 80.8 16.7 250.0 -60.0 †New Hampshire -40.5 -63.7 -25.7 20.7 -40.0 -50.0 †
New Jersey 16.9 -35.8 60.4 49.1 103.6 -18.8 200.0New Mexico -46.9 24.4 -62.9 -55.0 -30.0 -59.1 -100.0New York 10.2 -34.9 9.2 105.2 113.9 126.8 0.0North Carolina 208.3 100.0 219.4 218.8 340.0 700.0 †North Dakota † † † † † † †
National Center for Education Statistics
STEM field
Table 20e. Percentage change in number of awards conferred in science, technology, engineering, and Table 19e. mathematics (STEM) fields to students of unknown race/ethnicity at Title IV institutions, by Table 19e. field and state: Academic years 2000–01 and 2008–09
StateAll STEM
fields
Computer and information
sciences
Engineering and engineering
technologies
Biological and biomedical
sciencesMathematics
and statisticsPhysical sciences
Science technologies
See notes at end of table.

Ohio 181.6 117.2 189.0 295.3 214.3 143.8 450.0Oklahoma 850.0 † 214.3 650.0 † 800.0 †Oregon 44.2 122.6 9.7 113.0 28.6 -6.9 †Pennsylvania 24.1 33.3 -30.1 206.4 350.0 78.0 †Rhode Island 320.0 261.1 404.2 268.8 275.0 550.0 -100.0
South Carolina 264.4 26.7 143.3 663.6 600.0 2,100.0 †South Dakota 258.8 175.0 450.0 20.0 † † †Tennessee 312.2 210.0 347.6 254.5 250.0 666.7 †Texas 79.1 76.7 118.1 75.6 0.0 0.0 700.0Utah 122.2 397.6 58.0 44.1 40.0 -29.2 -100.0
Vermont 31.0 246.2 37.5 33.3 -25.0 -79.2 †Virginia 286.7 347.5 235.1 528.6 175.0 120.8 †Washington 46.9 67.9 35.8 35.7 -3.4 84.8 †West Virginia 520.0 300.0 600.0 400.0 † † †Wisconsin 16.8 -26.4 39.6 150.0 † † †Wyoming 41.4 -66.7 7.1 225.0 100.0 125.0 †† Not applicable.
Table 20e. Percentage change in number of awards conferred in science, technology, engineering, and Table 19e. mathematics (STEM) fields to students of unknown race/ethnicity at Title IV institutions, by Table 19e. field and state: Academic years 2000–01 and 2008–09—Continued
STEM field
Computer and information
sciences
Engineering and engineering
technologies
SOURCE: U.S. Department of Education, National Center for Education Statistics, Integrated Postsecondary Education Data System (IPEDS), Fall 2001 and Fall 2009, Completions component.
NOTE: Awards conferred include both degrees and certificates. Awards to individuals of Hispanic or Latino ethnicity are included in the Hispanic or Latino category regardless of race.
StateAll STEM
fields
Biological and biomedical
sciencesMathematics
and statisticsPhysical sciences
Science technologies

United States 40,771 12,426 19,603 3,262 2,100 3,339 41
Alabama 527 149 275 40 25 38 0Alaska 26 4 8 6 0 8 0Arizona 695 125 449 45 24 52 0Arkansas 194 76 80 18 5 15 0California 4,458 1,229 2,421 293 207 294 14
Colorado 530 146 291 26 22 44 1Connecticut 518 172 188 43 42 73 0Delaware 122 35 60 7 6 12 2District of Columbia 642 334 181 80 11 36 0Florida 1,667 429 974 113 46 105 0
Georgia 991 321 488 71 50 60 1Hawaii 170 148 2 9 8 2 1Idaho 69 20 33 6 1 9 0Illinois 2,064 704 876 155 170 156 3Indiana 1,036 208 600 75 70 83 0
Iowa 604 129 284 84 69 38 0Kansas 539 138 299 47 20 35 0Kentucky 288 85 120 33 17 33 0Louisiana 558 118 304 36 44 56 0Maine 50 5 16 12 7 10 0
Maryland 1,066 416 402 126 42 80 0Massachusetts 2,046 414 1,048 188 121 267 8Michigan 1,952 498 1,145 107 91 111 0Minnesota 582 196 254 55 42 35 0Mississippi 215 37 135 18 9 16 0
Missouri 642 195 317 52 19 58 1Montana 101 13 66 12 3 7 0Nebraska 226 125 48 20 11 22 0Nevada 98 30 48 9 0 11 0New Hampshire 171 103 33 15 6 14 0
New Jersey 1,631 773 526 152 54 125 1New Mexico 212 46 120 6 8 32 0New York 3,639 1,456 1,313 348 156 366 0North Carolina 715 238 290 88 48 51 0North Dakota 49 25 17 4 0 3 0
Physical sciences
Science technologies
See notes at end of table.
National Center for Education Statistics
STEM field
State
Table 21a. Number of awards conferred in science, technology, engineering, and mathematics (STEM) Table 20a. fields to nonresident alien students at Title IV institutions, by field and state: Academic year Table 20a. 2000–01
All STEM fields
Computer and information
sciences
Engineering and engineering
technologies
Biological and biomedical
sciencesMathematics
and statistics

Ohio 1,924 410 1,064 119 136 192 3Oklahoma 737 241 371 64 26 35 0Oregon 348 84 184 28 10 42 0Pennsylvania 1,664 478 820 119 90 157 0Rhode Island 212 47 75 13 28 49 0
South Carolina 484 118 284 38 13 31 0South Dakota 113 23 85 3 1 1 0Tennessee 416 73 198 47 54 44 0Texas 3,117 1,014 1,560 203 111 225 4Utah 308 101 126 29 15 36 1
Vermont 38 11 8 8 5 6 0Virginia 788 301 344 60 32 51 0Washington 495 153 233 44 26 39 0West Virginia 218 60 111 15 14 18 0Wisconsin 765 159 403 70 82 50 1Wyoming 51 13 26 3 3 6 0
Computer and information
sciences
Engineering and engineering
technologies
Biological and biomedical
sciencesMathematics
and statisticsPhysical sciences
Science technologies
SOURCE: U.S. Department of Education, National Center for Education Statistics, Integrated Postsecondary Education Data System (IPEDS), Fall 2001, Completions component.
StateAll STEM
fields
STEM field
Table 21a. Number of awards conferred in science, technology, engineering, and mathematics (STEM) Table 20a. fields to nonresident alien students at Title IV institutions, by field and state: Academic year Table 20a. 2000–01—Continued
NOTE: Awards conferred include both degrees and certificates. Awards to individuals of Hispanic or Latino ethnicity are included in the Hispanic or Latino category regardless of race.
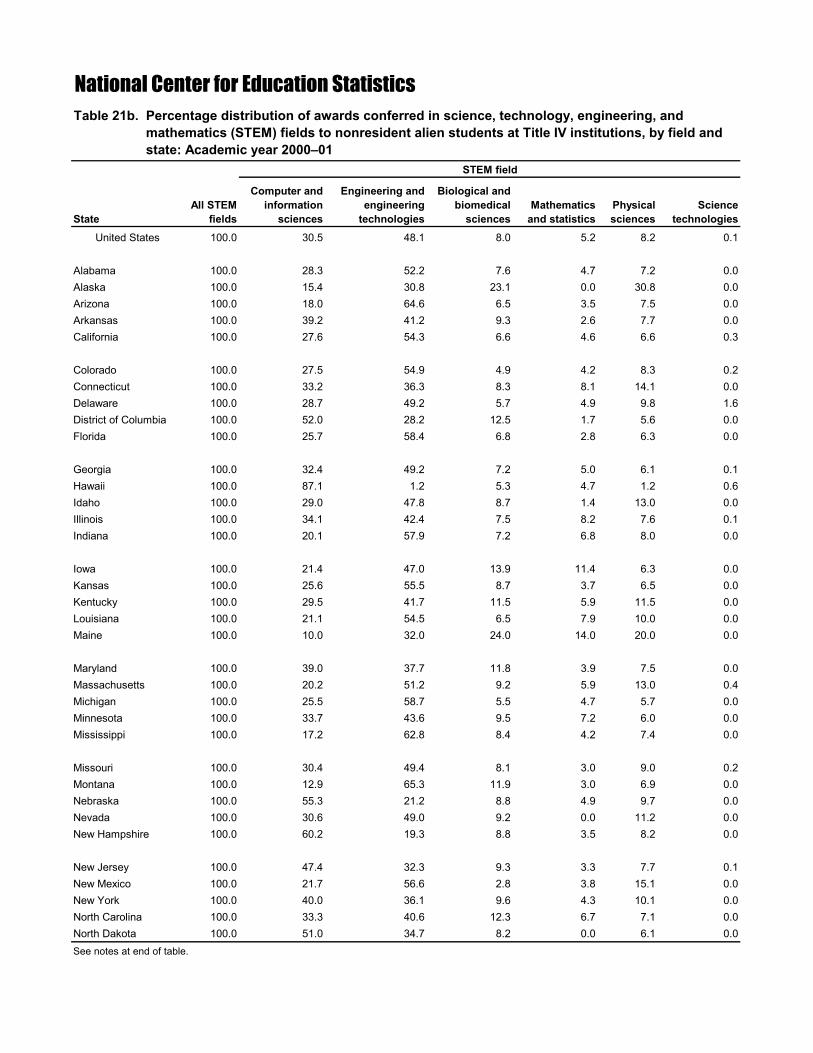
United States 100.0 30.5 48.1 8.0 5.2 8.2 0.1
Alabama 100.0 28.3 52.2 7.6 4.7 7.2 0.0Alaska 100.0 15.4 30.8 23.1 0.0 30.8 0.0Arizona 100.0 18.0 64.6 6.5 3.5 7.5 0.0Arkansas 100.0 39.2 41.2 9.3 2.6 7.7 0.0California 100.0 27.6 54.3 6.6 4.6 6.6 0.3
Colorado 100.0 27.5 54.9 4.9 4.2 8.3 0.2Connecticut 100.0 33.2 36.3 8.3 8.1 14.1 0.0Delaware 100.0 28.7 49.2 5.7 4.9 9.8 1.6District of Columbia 100.0 52.0 28.2 12.5 1.7 5.6 0.0Florida 100.0 25.7 58.4 6.8 2.8 6.3 0.0
Georgia 100.0 32.4 49.2 7.2 5.0 6.1 0.1Hawaii 100.0 87.1 1.2 5.3 4.7 1.2 0.6Idaho 100.0 29.0 47.8 8.7 1.4 13.0 0.0Illinois 100.0 34.1 42.4 7.5 8.2 7.6 0.1Indiana 100.0 20.1 57.9 7.2 6.8 8.0 0.0
Iowa 100.0 21.4 47.0 13.9 11.4 6.3 0.0Kansas 100.0 25.6 55.5 8.7 3.7 6.5 0.0Kentucky 100.0 29.5 41.7 11.5 5.9 11.5 0.0Louisiana 100.0 21.1 54.5 6.5 7.9 10.0 0.0Maine 100.0 10.0 32.0 24.0 14.0 20.0 0.0
Maryland 100.0 39.0 37.7 11.8 3.9 7.5 0.0Massachusetts 100.0 20.2 51.2 9.2 5.9 13.0 0.4Michigan 100.0 25.5 58.7 5.5 4.7 5.7 0.0Minnesota 100.0 33.7 43.6 9.5 7.2 6.0 0.0Mississippi 100.0 17.2 62.8 8.4 4.2 7.4 0.0
Missouri 100.0 30.4 49.4 8.1 3.0 9.0 0.2Montana 100.0 12.9 65.3 11.9 3.0 6.9 0.0Nebraska 100.0 55.3 21.2 8.8 4.9 9.7 0.0Nevada 100.0 30.6 49.0 9.2 0.0 11.2 0.0New Hampshire 100.0 60.2 19.3 8.8 3.5 8.2 0.0
New Jersey 100.0 47.4 32.3 9.3 3.3 7.7 0.1New Mexico 100.0 21.7 56.6 2.8 3.8 15.1 0.0New York 100.0 40.0 36.1 9.6 4.3 10.1 0.0North Carolina 100.0 33.3 40.6 12.3 6.7 7.1 0.0North Dakota 100.0 51.0 34.7 8.2 0.0 6.1 0.0
National Center for Education Statistics
STEM field
Table 21b. Percentage distribution of awards conferred in science, technology, engineering, and Table 20b. mathematics (STEM) fields to nonresident alien students at Title IV institutions, by field and Table 20b. state: Academic year 2000–01
StateAll STEM
fields
Computer and information
sciences
Engineering and engineering
technologies
Biological and biomedical
sciencesMathematics
and statisticsPhysical sciences
Science technologies
See notes at end of table.

Ohio 100.0 21.3 55.3 6.2 7.1 10.0 0.2Oklahoma 100.0 32.7 50.3 8.7 3.5 4.7 0.0Oregon 100.0 24.1 52.9 8.0 2.9 12.1 0.0Pennsylvania 100.0 28.7 49.3 7.2 5.4 9.4 0.0Rhode Island 100.0 22.2 35.4 6.1 13.2 23.1 0.0
South Carolina 100.0 24.4 58.7 7.9 2.7 6.4 0.0South Dakota 100.0 20.4 75.2 2.7 0.9 0.9 0.0Tennessee 100.0 17.5 47.6 11.3 13.0 10.6 0.0Texas 100.0 32.5 50.0 6.5 3.6 7.2 0.1Utah 100.0 32.8 40.9 9.4 4.9 11.7 0.3
Vermont 100.0 28.9 21.1 21.1 13.2 15.8 0.0Virginia 100.0 38.2 43.7 7.6 4.1 6.5 0.0Washington 100.0 30.9 47.1 8.9 5.3 7.9 0.0West Virginia 100.0 27.5 50.9 6.9 6.4 8.3 0.0Wisconsin 100.0 20.8 52.7 9.2 10.7 6.5 0.1Wyoming 100.0 25.5 51.0 5.9 5.9 11.8 0.0
Table 21b. Percentage distribution of awards conferred in science, technology, engineering, and Table 20b. mathematics (STEM) fields to nonresident alien students at Title IV institutions, by field and Table 20b. state: Academic year 2000–01—Continued
STEM field
SOURCE: U.S. Department of Education, National Center for Education Statistics, Integrated Postsecondary Education Data System (IPEDS), Fall 2001, Completions component.
StateAll STEM
fields
NOTE: Awards conferred include both degrees and certificates. Awards to individuals of Hispanic or Latino ethnicity are included in the Hispanic or Latino category regardless of race. Detail may not sum to totals because of rounding.
Computer and information
sciences
Engineering and engineering
technologies
Biological and biomedical
sciencesMathematics
and statisticsPhysical sciences
Science technologies

United States 51,308 11,541 25,601 5,886 3,660 4,537 83
Alabama 737 118 424 85 40 70 0Alaska 41 1 24 5 6 5 0Arizona 1,042 334 522 65 22 99 0Arkansas 218 67 73 36 11 31 0California 5,774 1,243 3,194 598 325 407 7
Colorado 502 94 311 23 28 46 0Connecticut 1,212 182 790 94 74 70 2Delaware 143 26 69 7 23 17 1District of Columbia 382 102 118 122 20 20 0Florida 2,083 212 1,407 184 104 174 2
Georgia 1,547 423 752 156 95 120 1Hawaii 159 57 35 32 9 25 1Idaho 152 24 74 22 14 18 0Illinois 3,307 1,150 1,428 235 221 268 5Indiana 1,182 118 671 132 134 126 1
Iowa 694 198 226 106 120 43 1Kansas 479 76 274 41 22 66 0Kentucky 421 84 195 69 26 47 0Louisiana 683 108 362 79 83 51 0Maine 49 1 20 11 6 11 0
Maryland 986 244 422 169 69 75 7Massachusetts 2,222 465 986 319 156 288 8Michigan 1,996 322 1,173 193 145 163 0Minnesota 662 147 260 101 71 77 6Mississippi 209 29 107 23 13 37 0
Missouri 945 269 377 132 67 100 0Montana 88 5 52 18 3 10 0Nebraska 136 63 17 42 3 11 0Nevada 132 23 69 19 5 16 0New Hampshire 163 45 65 27 12 14 0
New Jersey 1,598 394 797 145 129 132 1New Mexico 322 52 164 30 22 53 1New York 5,668 1,561 2,417 727 576 386 1North Carolina 959 303 421 115 60 60 0North Dakota 169 49 55 46 5 14 0
Physical sciences
Science technologies
See notes at end of table.
National Center for Education Statistics
STEM field
State
Table 21c. Number of awards conferred in science, technology, engineering, and mathematics (STEM) Table 20c. fields to nonresident alien students at Title IV institutions, by field and state: Academic year Table 20c. 2008–09
All STEM fields
Computer and information
sciences
Engineering and engineering
technologies
Biological and biomedical
sciencesMathematics
and statistics

Ohio 1,836 273 1,007 212 156 183 5Oklahoma 670 166 317 74 33 80 0Oregon 305 61 168 26 18 32 0Pennsylvania 2,763 747 1,308 290 195 210 13Rhode Island 219 27 72 19 43 58 0
South Carolina 316 19 170 63 24 39 1South Dakota 85 17 37 18 4 9 0Tennessee 511 93 253 58 47 58 2Texas 4,802 1,042 2,638 539 196 371 16Utah 345 59 177 45 15 48 1
Vermont 38 6 5 17 5 5 0Virginia 947 227 493 93 59 75 0Washington 584 135 190 85 43 131 0West Virginia 198 25 110 22 24 17 0Wisconsin 579 53 272 112 76 66 0Wyoming 48 2 33 5 3 5 0
Computer and information
sciences
Engineering and engineering
technologies
Biological and biomedical
sciencesMathematics
and statisticsPhysical sciences
Science technologies
SOURCE: U.S. Department of Education, National Center for Education Statistics, Integrated Postsecondary Education Data System (IPEDS), Fall 2009, Completions component.
StateAll STEM
fields
STEM field
Table 21c. Number of awards conferred in science, technology, engineering, and mathematics (STEM) Table 20c. fields to nonresident alien students at Title IV institutions, by field and state: Academic year Table 20c. 2008–09—Continued
NOTE: Awards conferred include both degrees and certificates. Awards to individuals of Hispanic or Latino ethnicity are included in the Hispanic or Latino category regardless of race.

United States 100.0 22.5 49.9 11.5 7.1 8.8 0.2
Alabama 100.0 16.0 57.5 11.5 5.4 9.5 0.0Alaska 100.0 2.4 58.5 12.2 14.6 12.2 0.0Arizona 100.0 32.1 50.1 6.2 2.1 9.5 0.0Arkansas 100.0 30.7 33.5 16.5 5.0 14.2 0.0California 100.0 21.5 55.3 10.4 5.6 7.0 0.1
Colorado 100.0 18.7 62.0 4.6 5.6 9.2 0.0Connecticut 100.0 15.0 65.2 7.8 6.1 5.8 0.2Delaware 100.0 18.2 48.3 4.9 16.1 11.9 0.7District of Columbia 100.0 26.7 30.9 31.9 5.2 5.2 0.0Florida 100.0 10.2 67.5 8.8 5.0 8.4 0.1
Georgia 100.0 27.3 48.6 10.1 6.1 7.8 0.1Hawaii 100.0 35.8 22.0 20.1 5.7 15.7 0.6Idaho 100.0 15.8 48.7 14.5 9.2 11.8 0.0Illinois 100.0 34.8 43.2 7.1 6.7 8.1 0.2Indiana 100.0 10.0 56.8 11.2 11.3 10.7 0.1
Iowa 100.0 28.5 32.6 15.3 17.3 6.2 0.1Kansas 100.0 15.9 57.2 8.6 4.6 13.8 0.0Kentucky 100.0 20.0 46.3 16.4 6.2 11.2 0.0Louisiana 100.0 15.8 53.0 11.6 12.2 7.5 0.0Maine 100.0 2.0 40.8 22.4 12.2 22.4 0.0
Maryland 100.0 24.7 42.8 17.1 7.0 7.6 0.7Massachusetts 100.0 20.9 44.4 14.4 7.0 13.0 0.4Michigan 100.0 16.1 58.8 9.7 7.3 8.2 0.0Minnesota 100.0 22.2 39.3 15.3 10.7 11.6 0.9Mississippi 100.0 13.9 51.2 11.0 6.2 17.7 0.0
Missouri 100.0 28.5 39.9 14.0 7.1 10.6 0.0Montana 100.0 5.7 59.1 20.5 3.4 11.4 0.0Nebraska 100.0 46.3 12.5 30.9 2.2 8.1 0.0Nevada 100.0 17.4 52.3 14.4 3.8 12.1 0.0New Hampshire 100.0 27.6 39.9 16.6 7.4 8.6 0.0
New Jersey 100.0 24.7 49.9 9.1 8.1 8.3 0.1New Mexico 100.0 16.1 50.9 9.3 6.8 16.5 0.3New York 100.0 27.5 42.6 12.8 10.2 6.8 #North Carolina 100.0 31.6 43.9 12.0 6.3 6.3 0.0North Dakota 100.0 29.0 32.5 27.2 3.0 8.3 0.0See notes at end of table.
National Center for Education Statistics
STEM field
Table 21d. Percentage distribution of awards conferred in science, technology, engineering, and Table 20d. mathematics (STEM) fields to nonresident alien students at Title IV institutions, by field and Table 20d. state: Academic year 2008–09
StateAll STEM
fields
Computer and information
sciences
Engineering and engineering
technologies
Biological and biomedical
sciencesMathematics
and statisticsPhysical sciences
Science technologies
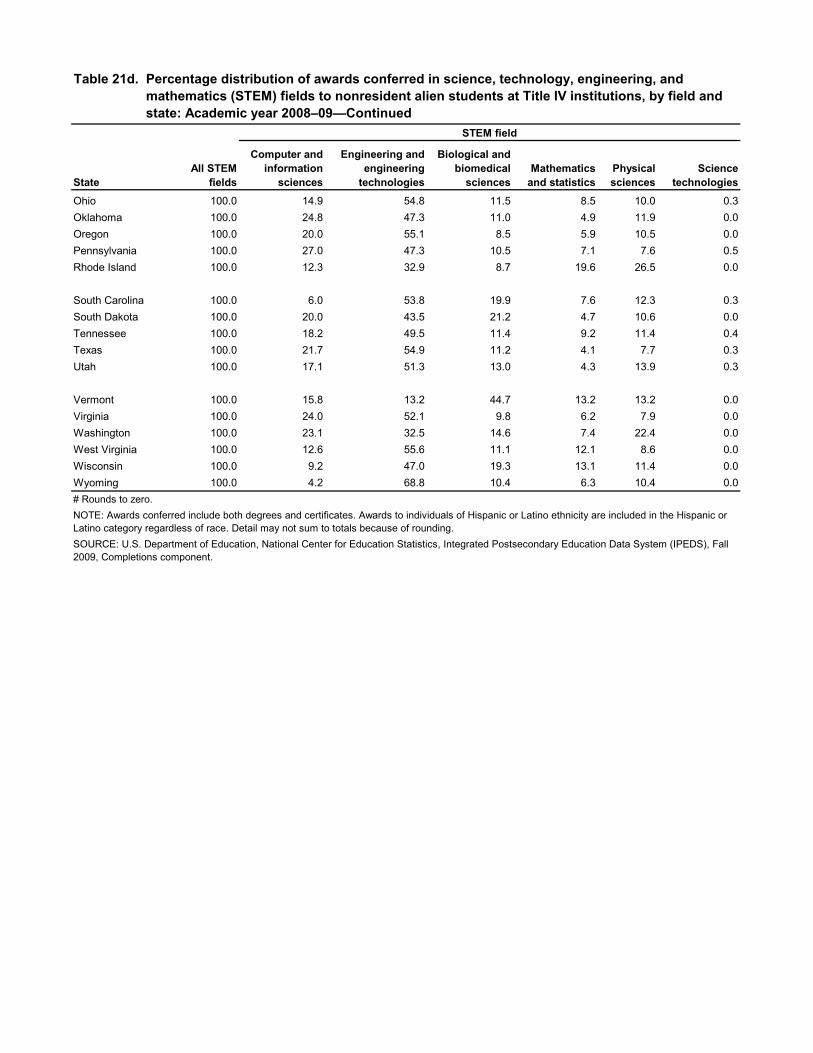
Ohio 100.0 14.9 54.8 11.5 8.5 10.0 0.3Oklahoma 100.0 24.8 47.3 11.0 4.9 11.9 0.0Oregon 100.0 20.0 55.1 8.5 5.9 10.5 0.0Pennsylvania 100.0 27.0 47.3 10.5 7.1 7.6 0.5Rhode Island 100.0 12.3 32.9 8.7 19.6 26.5 0.0
South Carolina 100.0 6.0 53.8 19.9 7.6 12.3 0.3South Dakota 100.0 20.0 43.5 21.2 4.7 10.6 0.0Tennessee 100.0 18.2 49.5 11.4 9.2 11.4 0.4Texas 100.0 21.7 54.9 11.2 4.1 7.7 0.3Utah 100.0 17.1 51.3 13.0 4.3 13.9 0.3
Vermont 100.0 15.8 13.2 44.7 13.2 13.2 0.0Virginia 100.0 24.0 52.1 9.8 6.2 7.9 0.0Washington 100.0 23.1 32.5 14.6 7.4 22.4 0.0West Virginia 100.0 12.6 55.6 11.1 12.1 8.6 0.0Wisconsin 100.0 9.2 47.0 19.3 13.1 11.4 0.0Wyoming 100.0 4.2 68.8 10.4 6.3 10.4 0.0
SOURCE: U.S. Department of Education, National Center for Education Statistics, Integrated Postsecondary Education Data System (IPEDS), Fall 2009, Completions component.
StateAll STEM
fields
# Rounds to zero.NOTE: Awards conferred include both degrees and certificates. Awards to individuals of Hispanic or Latino ethnicity are included in the Hispanic or Latino category regardless of race. Detail may not sum to totals because of rounding.
Computer and information
sciences
Engineering and engineering
technologies
Biological and biomedical
sciencesMathematics
and statisticsPhysical sciences
Science technologies
Table 21d. Percentage distribution of awards conferred in science, technology, engineering, and Table 20d. mathematics (STEM) fields to nonresident alien students at Title IV institutions, by field and Table 20d. state: Academic year 2008–09—Continued
STEM field

United States 25.8 -7.1 30.6 80.4 74.3 35.9 102.4
Alabama 39.8 -20.8 54.2 112.5 60.0 84.2 †Alaska 57.7 -75.0 200.0 -16.7 † -37.5 †Arizona 49.9 167.2 16.3 44.4 -8.3 90.4 †Arkansas 12.4 -11.8 -8.8 100.0 120.0 106.7 †California 29.5 1.1 31.9 104.1 57.0 38.4 -50.0
Colorado -5.3 -35.6 6.9 -11.5 27.3 4.5 -100.0Connecticut 134.0 5.8 320.2 118.6 76.2 -4.1 †Delaware 17.2 -25.7 15.0 0.0 283.3 41.7 -50.0District of Columbia -40.5 -69.5 -34.8 52.5 81.8 -44.4 †Florida 25.0 -50.6 44.5 62.8 126.1 65.7 †
Georgia 56.1 31.8 54.1 119.7 90.0 100.0 0.0Hawaii -6.5 -61.5 1,650.0 255.6 12.5 1,150.0 0.0Idaho 120.3 20.0 124.2 266.7 1,300.0 100.0 †Illinois 60.2 63.4 63.0 51.6 30.0 71.8 66.7Indiana 14.1 -43.3 11.8 76.0 91.4 51.8 †
Iowa 14.9 53.5 -20.4 26.2 73.9 13.2 †Kansas -11.1 -44.9 -8.4 -12.8 10.0 88.6 †Kentucky 46.2 -1.2 62.5 109.1 52.9 42.4 †Louisiana 22.4 -8.5 19.1 119.4 88.6 -8.9 †Maine -2.0 -80.0 25.0 -8.3 -14.3 10.0 †
Maryland -7.5 -41.3 5.0 34.1 64.3 -6.3 †Massachusetts 8.6 12.3 -5.9 69.7 28.9 7.9 0.0Michigan 2.3 -35.3 2.4 80.4 59.3 46.8 †Minnesota 13.7 -25.0 2.4 83.6 69.0 120.0 †Mississippi -2.8 -21.6 -20.7 27.8 44.4 131.3 †
Missouri 47.2 37.9 18.9 153.8 252.6 72.4 -100.0Montana -12.9 -61.5 -21.2 50.0 0.0 42.9 †Nebraska -39.8 -49.6 -64.6 110.0 -72.7 -50.0 †Nevada 34.7 -23.3 43.8 111.1 † 45.5 †New Hampshire -4.7 -56.3 97.0 80.0 100.0 0.0 †
New Jersey -2.0 -49.0 51.5 -4.6 138.9 5.6 0.0New Mexico 51.9 13.0 36.7 400.0 175.0 65.6 †New York 55.8 7.2 84.1 108.9 269.2 5.5 †North Carolina 34.1 27.3 45.2 30.7 25.0 17.6 †North Dakota 244.9 96.0 223.5 1,050.0 † 366.7 †
Mathematics and statistics
Physical sciences
Science technologies
National Center for Education Statistics
STEM field
Table 21e. Percentage change in number of awards conferred in science, technology, engineering, and Table 20e. mathematics (STEM) fields to nonresident alien students at Title IV institutions, by field and Table 20e. state: Academic years 2000–01 and 2008–09
See notes at end of table.
StateAll STEM
fields
Computer and information
sciences
Engineering and engineering
technologies
Biological and biomedical
sciences
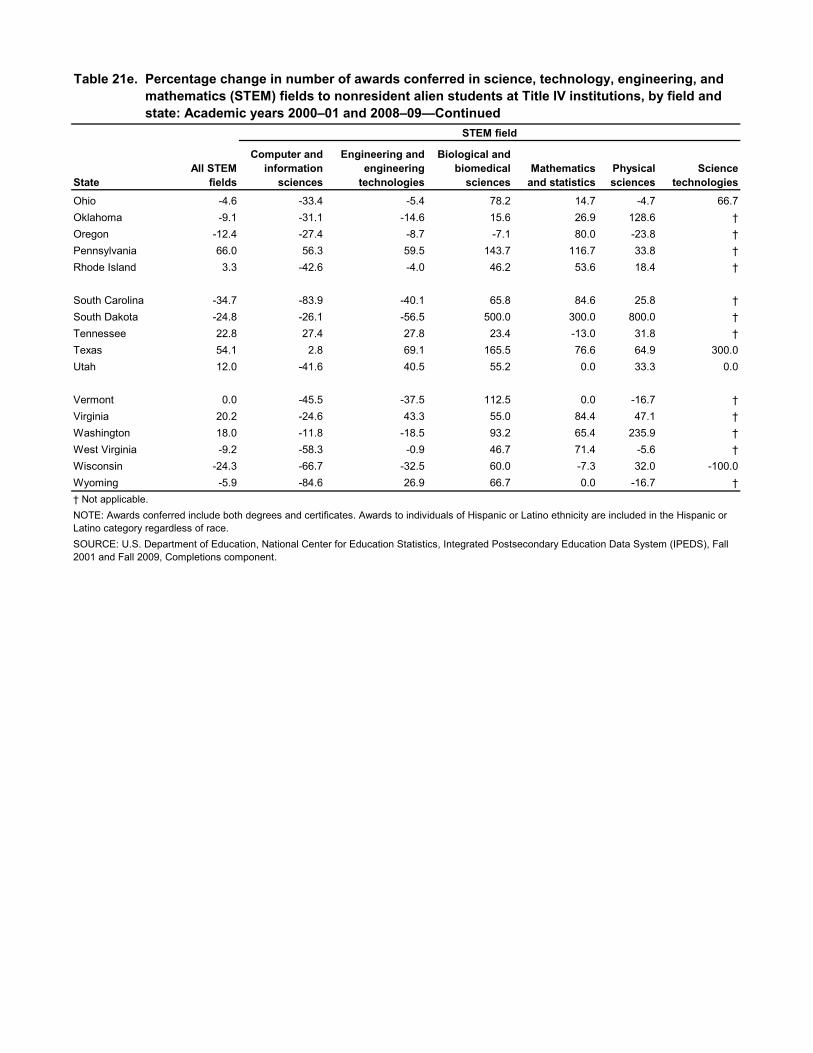
Ohio -4.6 -33.4 -5.4 78.2 14.7 -4.7 66.7Oklahoma -9.1 -31.1 -14.6 15.6 26.9 128.6 †Oregon -12.4 -27.4 -8.7 -7.1 80.0 -23.8 †Pennsylvania 66.0 56.3 59.5 143.7 116.7 33.8 †Rhode Island 3.3 -42.6 -4.0 46.2 53.6 18.4 †
South Carolina -34.7 -83.9 -40.1 65.8 84.6 25.8 †South Dakota -24.8 -26.1 -56.5 500.0 300.0 800.0 †Tennessee 22.8 27.4 27.8 23.4 -13.0 31.8 †Texas 54.1 2.8 69.1 165.5 76.6 64.9 300.0Utah 12.0 -41.6 40.5 55.2 0.0 33.3 0.0
Vermont 0.0 -45.5 -37.5 112.5 0.0 -16.7 †Virginia 20.2 -24.6 43.3 55.0 84.4 47.1 †Washington 18.0 -11.8 -18.5 93.2 65.4 235.9 †West Virginia -9.2 -58.3 -0.9 46.7 71.4 -5.6 †Wisconsin -24.3 -66.7 -32.5 60.0 -7.3 32.0 -100.0Wyoming -5.9 -84.6 26.9 66.7 0.0 -16.7 †
Computer and information
sciences
Engineering and engineering
technologies
Biological and biomedical
sciencesMathematics
and statisticsPhysical sciences
Science technologies
NOTE: Awards conferred include both degrees and certificates. Awards to individuals of Hispanic or Latino ethnicity are included in the Hispanic or Latino category regardless of race.SOURCE: U.S. Department of Education, National Center for Education Statistics, Integrated Postsecondary Education Data System (IPEDS), Fall 2001 and Fall 2009, Completions component.
† Not applicable.
Table 21e. Percentage change in number of awards conferred in science, technology, engineering, and Table 20e. mathematics (STEM) fields to nonresident alien students at Title IV institutions, by field and Table 20e. state: Academic years 2000–01 and 2008–09—Continued
STEM field
StateAll STEM
fields

United States 578 645 11.6 1,167 1,418 21.5 191 190 -0.5 29 61 110.3
Alabama 5 6 20.0 30 26 -13.3 2 3 50.0 0 1 †Alaska 4 5 25.0 2 15 650.0 2 1 -50.0 0 0 †Arizona 78 107 37.2 60 66 10.0 3 6 100.0 0 3 †Arkansas 3 7 133.3 17 27 58.8 0 2 † 0 1 †California 40 42 5.0 128 140 9.4 14 24 71.4 4 12 200.0
Colorado 5 10 100.0 45 66 46.7 6 8 33.3 0 2 †Connecticut 0 0 † 5 14 180.0 0 3 † 3 2 -33.3Delaware 1 0 -100.0 1 1 0.0 0 2 † 0 0 †District of Columbia 0 0 † 4 5 25.0 1 8 700.0 0 0 †Florida 17 10 -41.2 28 43 53.6 4 7 75.0 1 1 0.0
Georgia 3 6 100.0 9 17 88.9 1 1 0.0 1 0 -100.0Hawaii 0 1 † 1 2 100.0 3 0 -100.0 0 0 †Idaho 3 2 -33.3 6 4 -33.3 0 0 † 0 0 †Illinois 3 1 -66.7 102 22 -78.4 59 7 -88.1 0 1 †Indiana 2 7 250.0 7 12 71.4 0 1 † 0 0 †
Iowa 7 3 -57.1 5 10 100.0 1 0 -100.0 0 0 †Kansas 6 4 -33.3 16 13 -18.8 3 1 -66.7 0 1 †Kentucky 1 1 0.0 6 5 -16.7 2 2 0.0 1 1 0.0Louisiana 9 6 -33.3 14 23 64.3 2 0 -100.0 0 0 †Maine 2 0 -100.0 4 4 0.0 0 0 † 0 0 †
Maryland 1 2 100.0 14 16 14.3 2 6 200.0 1 3 200.0Massachusetts 4 0 -100.0 39 33 -15.4 6 3 -50.0 2 2 0.0Michigan 18 7 -61.1 24 54 125.0 2 5 150.0 0 0 †Minnesota 11 11 0.0 16 16 0.0 4 2 -50.0 0 3 †Mississippi 0 3 † 9 4 -55.6 0 3 † 0 0 †
Missouri 7 3 -57.1 13 20 53.8 0 4 † 1 1 0.0Montana 22 25 13.6 19 21 10.5 0 2 † 0 0 †Nebraska 6 3 -50.0 8 5 -37.5 0 1 † 1 1 0.0Nevada 6 4 -33.3 8 6 -25.0 0 1 † 0 0 †New Hampshire 0 3 † 7 7 0.0 1 1 0.0 0 0 †
New Jersey 4 6 50.0 11 25 127.3 3 2 -33.3 0 0 †New Mexico 64 76 18.8 39 44 12.8 3 3 0.0 0 1 †New York 15 17 13.3 27 56 107.4 7 8 14.3 1 3 200.0North Carolina 39 17 -56.4 47 56 19.1 4 4 0.0 1 4 300.0North Dakota 4 10 150.0 8 12 50.0 0 2 † 0 0 †
% change
2000–01
2008–09
% change
2000–01
2008–09
2008–09
% change
2000–01
2008–09
% change
Master's Doctor's
National Center for Education StatisticsTable 22a. Number and percentage change in degrees awarded in science, technology, engineering, and Table 22a. mathematics (STEM) fields to American Indian or Alaska Native students at Title IV Table 22a. institutions, by level of degree and state: Academic years 2000–01 and 2008–09
See notes at end of table.
State
Level of degreeAssociate's Bachelor's
2000–01
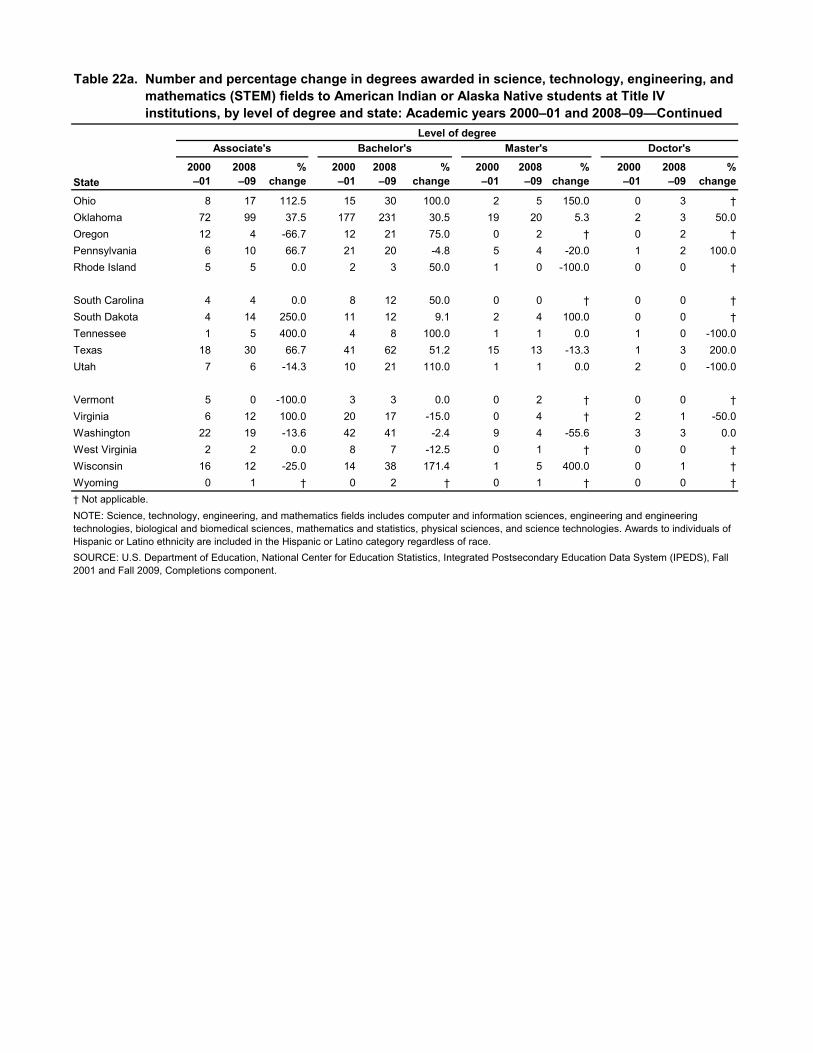
Ohio 8 17 112.5 15 30 100.0 2 5 150.0 0 3 †Oklahoma 72 99 37.5 177 231 30.5 19 20 5.3 2 3 50.0Oregon 12 4 -66.7 12 21 75.0 0 2 † 0 2 †Pennsylvania 6 10 66.7 21 20 -4.8 5 4 -20.0 1 2 100.0Rhode Island 5 5 0.0 2 3 50.0 1 0 -100.0 0 0 †
South Carolina 4 4 0.0 8 12 50.0 0 0 † 0 0 †South Dakota 4 14 250.0 11 12 9.1 2 4 100.0 0 0 †Tennessee 1 5 400.0 4 8 100.0 1 1 0.0 1 0 -100.0Texas 18 30 66.7 41 62 51.2 15 13 -13.3 1 3 200.0Utah 7 6 -14.3 10 21 110.0 1 1 0.0 2 0 -100.0
Vermont 5 0 -100.0 3 3 0.0 0 2 † 0 0 †Virginia 6 12 100.0 20 17 -15.0 0 4 † 2 1 -50.0Washington 22 19 -13.6 42 41 -2.4 9 4 -55.6 3 3 0.0West Virginia 2 2 0.0 8 7 -12.5 0 1 † 0 0 †Wisconsin 16 12 -25.0 14 38 171.4 1 5 400.0 0 1 †Wyoming 0 1 † 0 2 † 0 1 † 0 0 †
2000–01
2008–09
% change
2000–01
2008–09
% change
2000–01
2008–09
% change
2000–01
2008–09
% change
† Not applicable.
Doctor's
Table 22a. Number and percentage change in degrees awarded in science, technology, engineering, and Table 22a. mathematics (STEM) fields to American Indian or Alaska Native students at Title IV Table 22a. institutions, by level of degree and state: Academic years 2000–01 and 2008–09—Continued
SOURCE: U.S. Department of Education, National Center for Education Statistics, Integrated Postsecondary Education Data System (IPEDS), Fall 2001 and Fall 2009, Completions component.
State
Level of degreeAssociate's Bachelor's Master's
NOTE: Science, technology, engineering, and mathematics fields includes computer and information sciences, engineering and engineering technologies, biological and biomedical sciences, mathematics and statistics, physical sciences, and science technologies. Awards to individuals of Hispanic or Latino ethnicity are included in the Hispanic or Latino category regardless of race.

United States 3,752 3,276 -12.7 22,257 27,620 24.1 5,188 6,945 33.9 1,075 1,381 28.5
Alabama 10 10 0.0 95 108 13.7 25 38 52.0 4 5 25.0Alaska 1 7 600.0 7 22 214.3 1 2 100.0 0 0 †Arizona 57 153 168.4 223 340 52.5 27 63 133.3 14 23 64.3Arkansas 4 10 150.0 62 70 12.9 16 7 -56.3 2 2 0.0California 1,000 1,034 3.4 6,680 8,778 31.4 1,064 1,722 61.8 229 314 37.1
Colorado 35 35 0.0 254 350 37.8 79 76 -3.8 15 14 -6.7Connecticut 15 10 -33.3 127 240 89.0 62 68 9.7 11 16 45.5Delaware 7 6 -14.3 30 43 43.3 4 10 150.0 1 4 300.0District of Columbia 11 5 -54.5 163 143 -12.3 171 197 15.2 7 14 100.0Florida 94 68 -27.7 533 848 59.1 122 155 27.0 14 39 178.6
Georgia 17 48 182.4 512 714 39.5 131 147 12.2 22 47 113.6Hawaii 173 172 -0.6 258 411 59.3 86 49 -43.0 21 7 -66.7Idaho 11 2 -81.8 30 34 13.3 6 7 16.7 4 1 -75.0Illinois 156 58 -62.8 1,354 1,375 1.6 307 280 -8.8 58 69 19.0Indiana 31 24 -22.6 194 277 42.8 22 52 136.4 13 15 15.4
Iowa 12 6 -50.0 103 99 -3.9 25 19 -24.0 4 6 50.0Kansas 22 4 -81.8 127 97 -23.6 19 27 42.1 3 6 100.0Kentucky 11 11 0.0 51 73 43.1 22 19 -13.6 0 7 †Louisiana 50 14 -72.0 154 122 -20.8 102 38 -62.7 15 2 -86.7Maine 4 2 -50.0 41 25 -39.0 1 2 100.0 1 3 200.0
Maryland 43 55 27.9 601 776 29.1 210 263 25.2 32 34 6.3Massachusetts 101 77 -23.8 972 1,044 7.4 268 294 9.7 67 99 47.8Michigan 87 47 -46.0 531 710 33.7 509 315 -38.1 86 77 -10.5Minnesota 80 70 -12.5 256 319 24.6 23 90 291.3 9 13 44.4Mississippi 4 8 100.0 33 29 -12.1 8 12 50.0 3 11 266.7
Missouri 29 26 -10.3 250 242 -3.2 37 68 83.8 15 5 -66.7Montana 0 0 † 6 11 83.3 0 3 † 0 0 †Nebraska 23 6 -73.9 76 97 27.6 13 65 400.0 2 10 400.0Nevada 11 49 345.5 60 129 115.0 17 21 23.5 1 7 600.0New Hampshire 2 3 50.0 58 62 6.9 9 13 44.4 4 4 0.0
New Jersey 107 77 -28.0 991 1,091 10.1 209 185 -11.5 40 47 17.5New Mexico 12 7 -41.7 44 58 31.8 15 10 -33.3 0 5 †New York 570 289 -49.3 2,230 2,124 -4.8 544 555 2.0 100 110 10.0North Carolina 74 43 -41.9 409 564 37.9 110 208 89.1 53 71 34.0North Dakota 0 3 † 8 13 62.5 4 4 0.0 1 2 100.0
% change
2000–01
2008–09
% change
2000–01
2008–09
2008–09
% change
2000–01
2008–09
% change
National Center for Education StatisticsTable 22b. Number and percentage change in degrees awarded in science, technology, engineering, and Table 22b. mathematics (STEM) fields to Asian, Native Hawaiian, or Other Pacific Islander students at Table 22b. Title IV institutions, by level of degree and state: Academic years 2000–01 and 2008–09
State
Level of degreeAssociate's Bachelor's Master's Doctor's
2000–01
See notes at end of table.

Ohio 52 40 -23.1 380 465 22.4 68 79 16.2 21 40 90.5Oklahoma 41 26 -36.6 139 146 5.0 20 10 -50.0 3 2 -33.3Oregon 50 31 -38.0 194 260 34.0 27 41 51.9 5 13 160.0Pennsylvania 69 84 21.7 804 1,088 35.3 184 251 36.4 52 57 9.6Rhode Island 16 8 -50.0 73 100 37.0 10 7 -30.0 1 4 300.0
South Carolina 16 8 -50.0 74 96 29.7 7 11 57.1 3 6 100.0South Dakota 3 3 0.0 11 8 -27.3 11 4 -63.6 2 0 -100.0Tennessee 20 13 -35.0 142 188 32.4 66 16 -75.8 10 11 10.0Texas 299 193 -35.5 1,516 1,797 18.5 293 341 16.4 70 96 37.1Utah 20 22 10.0 76 149 96.1 9 21 133.3 5 8 60.0
Vermont 3 2 -33.3 19 28 47.4 5 7 40.0 1 1 0.0Virginia 94 202 114.9 570 710 24.6 108 987 813.9 14 26 85.7Washington 145 152 4.8 517 835 61.5 76 56 -26.3 23 20 -13.0West Virginia 2 2 0.0 27 36 33.3 3 4 33.3 3 2 -33.3Wisconsin 53 50 -5.7 185 271 46.5 29 24 -17.2 11 6 -45.5Wyoming 5 1 -80.0 7 5 -28.6 4 2 -50.0 0 0 †
2000–01
2008–09
% change
2000–01
2008–09
% change
2000–01
2008–09
% change
2000–01
2008–09
% changeState
Level of degreeAssociate's
Table 22b. Number and percentage change in degrees awarded in science, technology, engineering, and Table 22b. mathematics (STEM) fields to Asian, Native Hawaiian, or Other Pacific Islander students at Table 22b. Title IV institutions, by level of degree and state: Academic years 2000–01 and 2008–09Table 22b. —Continued
SOURCE: U.S. Department of Education, National Center for Education Statistics, Integrated Postsecondary Education Data System (IPEDS), Fall 2001 and Fall 2009, Completions component.
Bachelor's Master's Doctor's
† Not applicable.NOTE: Science, technology, engineering, and mathematics fields includes computer and information sciences, engineering and engineering technologies, biological and biomedical sciences, mathematics and statistics, physical sciences, and science technologies. Awards to individuals of Hispanic or Latino ethnicity are included in the Hispanic or Latino category regardless of race.

United States 7,429 7,731 4.1 14,268 15,723 10.2 1,909 2,602 36.3 280 500 78.6
Alabama 322 215 -33.2 779 791 1.5 67 89 32.8 13 18 38.5Alaska 7 2 -71.4 3 7 133.3 1 1 0.0 0 1 †Arizona 85 385 352.9 64 207 223.4 10 13 30.0 1 5 400.0Arkansas 80 67 -16.3 118 152 28.8 12 8 -33.3 1 2 100.0California 279 221 -20.8 515 745 44.7 129 153 18.6 25 34 36.0
Colorado 52 74 42.3 79 139 75.9 17 30 76.5 2 2 0.0Connecticut 26 26 0.0 80 133 66.3 10 20 100.0 3 7 133.3Delaware 14 11 -21.4 56 50 -10.7 5 13 160.0 0 1 †District of Columbia 83 53 -36.1 414 395 -4.6 165 155 -6.1 19 30 57.9Florida 705 607 -13.9 790 1,101 39.4 100 173 73.0 10 30 200.0
Georgia 155 421 171.6 1,201 1,201 0.0 123 102 -17.1 19 38 100.0Hawaii 9 22 144.4 6 6 0.0 6 1 -83.3 0 2 †Idaho 2 1 -50.0 8 6 -25.0 0 4 † 0 0 †Illinois 334 248 -25.7 539 560 3.9 84 186 121.4 9 13 44.4Indiana 112 107 -4.5 139 170 22.3 21 23 9.5 6 15 150.0
Iowa 18 15 -16.7 28 47 67.9 4 22 450.0 0 5 †Kansas 62 16 -74.2 54 60 11.1 1 7 600.0 1 1 0.0Kentucky 44 67 52.3 92 104 13.0 16 18 12.5 1 6 500.0Louisiana 289 190 -34.3 1,006 696 -30.8 48 45 -6.3 14 11 -21.4Maine 2 1 -50.0 4 7 75.0 0 0 † 0 0 †
Maryland 108 231 113.9 722 792 9.7 200 247 23.5 10 23 130.0Massachusetts 111 116 4.5 280 306 9.3 57 62 8.8 11 18 63.6Michigan 183 289 57.9 439 421 -4.1 67 112 67.2 9 25 177.8Minnesota 65 58 -10.8 74 133 79.7 4 51 1,175.0 1 12 1,100.0Mississippi 175 189 8.0 565 509 -9.9 53 54 1.9 5 9 80.0
Missouri 205 173 -15.6 263 277 5.3 40 36 -10.0 7 3 -57.1Montana 0 0 † 4 4 0.0 1 0 -100.0 0 0 †Nebraska 38 15 -60.5 14 45 221.4 4 15 275.0 0 1 †Nevada 11 20 81.8 14 29 107.1 0 5 † 0 1 †New Hampshire 1 8 700.0 15 17 13.3 0 3 † 1 0 -100.0
New Jersey 228 123 -46.1 395 394 -0.3 34 58 70.6 5 9 80.0New Mexico 9 9 0.0 19 25 31.6 3 5 66.7 0 1 †New York 1,021 670 -34.4 1,026 1,080 5.3 150 190 26.7 11 36 227.3North Carolina 421 269 -36.1 999 1,054 5.5 128 180 40.6 20 24 20.0North Dakota 0 4 † 2 5 150.0 1 1 0.0 0 1 †
% change
2000–01
2008–09
% change
2000–01
2008–09
2008–09
% change
2000–01
2008–09
% change
National Center for Education StatisticsTable 22c. Number and percentage change in degrees awarded in science, technology, engineering, and Table 22c. mathematics (STEM) fields to Black or African American students at Title IV institutions, by Table 22c. level of degree and state: Academic years 2000–01 and 2008–09
State
Level of degreeAssociate's Bachelor's Master's Doctor's
2000–01
See notes at end of table.

Ohio 256 355 38.7 325 376 15.7 38 59 55.3 9 10 11.1Oklahoma 46 82 78.3 108 129 19.4 12 12 0.0 3 3 0.0Oregon 16 11 -31.3 16 24 50.0 0 3 † 1 4 300.0Pennsylvania 208 298 43.3 452 522 15.5 59 73 23.7 18 22 22.2Rhode Island 33 23 -30.3 40 42 5.0 1 6 500.0 1 2 100.0
South Carolina 181 144 -20.4 543 529 -2.6 10 28 180.0 1 6 500.0South Dakota 4 2 -50.0 3 6 100.0 1 1 0.0 0 0 †Tennessee 231 264 14.3 401 428 6.7 39 58 48.7 13 9 -30.8Texas 711 609 -14.3 796 1,007 26.5 88 161 83.0 8 31 287.5Utah 2 9 350.0 6 23 283.3 1 7 600.0 2 2 0.0
Vermont 2 0 -100.0 6 7 16.7 3 7 133.3 3 0 -100.0Virginia 388 875 125.5 660 750 13.6 75 74 -1.3 12 14 16.7Washington 49 51 4.1 38 87 128.9 10 16 60.0 2 4 100.0West Virginia 14 11 -21.4 23 34 47.8 2 5 150.0 0 0 †Wisconsin 32 74 131.3 45 89 97.8 9 10 11.1 3 9 200.0Wyoming 0 0 † 0 2 † 0 0 † 0 0 †
2000–01
2008–09
% change
2000–01
2008–09
% change
2000–01
2008–09
% change
2000–01
2008–09
% change
Table 22c. Number and percentage change in degrees awarded in science, technology, engineering, and Table 22c. mathematics (STEM) fields to Black or African American students at Title IV institutions, by Table 22c. level of degree and state: Academic years 2000–01 and 2008–09—Continued
State
Level of degreeAssociate's
SOURCE: U.S. Department of Education, National Center for Education Statistics, Integrated Postsecondary Education Data System (IPEDS), Fall 2001 and Fall 2009, Completions component.
Bachelor's Master's Doctor's
† Not applicable.NOTE: Science, technology, engineering, and mathematics fields includes computer and information sciences, engineering and engineering technologies, biological and biomedical sciences, mathematics and statistics, physical sciences, and science technologies. Awards to individuals of Hispanic or Latino ethnicity are included in the Hispanic or Latino category regardless of race.
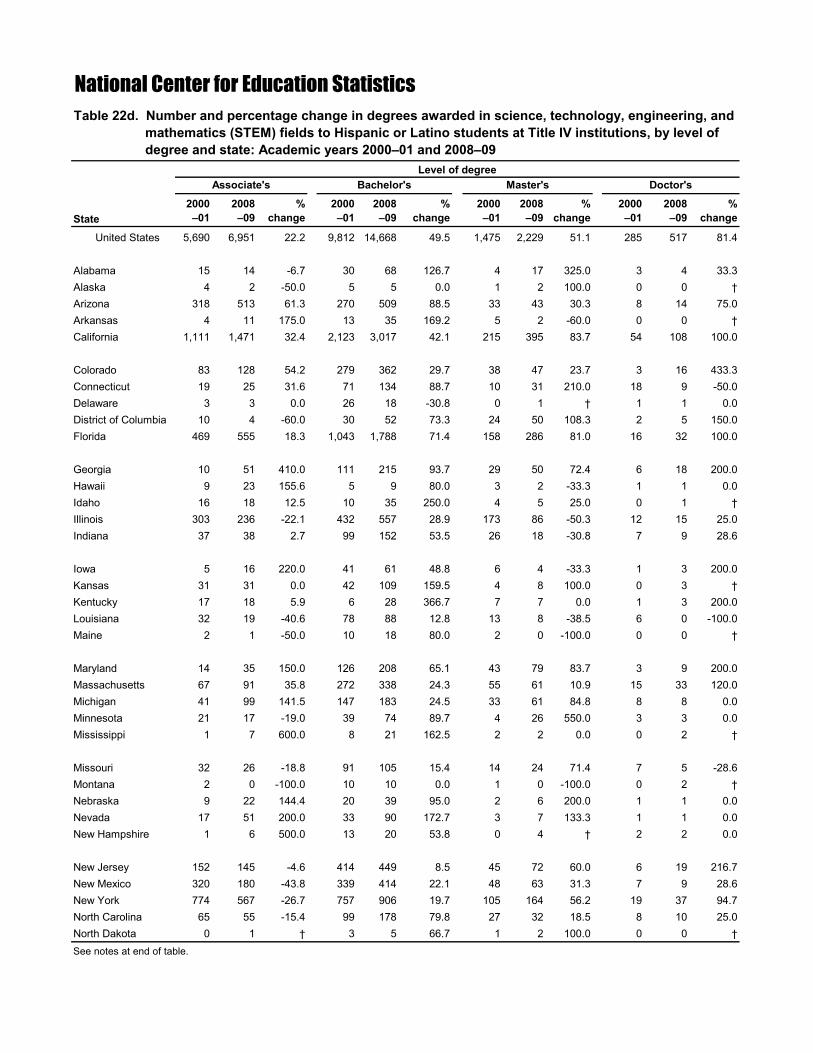
United States 5,690 6,951 22.2 9,812 14,668 49.5 1,475 2,229 51.1 285 517 81.4
Alabama 15 14 -6.7 30 68 126.7 4 17 325.0 3 4 33.3Alaska 4 2 -50.0 5 5 0.0 1 2 100.0 0 0 †Arizona 318 513 61.3 270 509 88.5 33 43 30.3 8 14 75.0Arkansas 4 11 175.0 13 35 169.2 5 2 -60.0 0 0 †California 1,111 1,471 32.4 2,123 3,017 42.1 215 395 83.7 54 108 100.0
Colorado 83 128 54.2 279 362 29.7 38 47 23.7 3 16 433.3Connecticut 19 25 31.6 71 134 88.7 10 31 210.0 18 9 -50.0Delaware 3 3 0.0 26 18 -30.8 0 1 † 1 1 0.0District of Columbia 10 4 -60.0 30 52 73.3 24 50 108.3 2 5 150.0Florida 469 555 18.3 1,043 1,788 71.4 158 286 81.0 16 32 100.0
Georgia 10 51 410.0 111 215 93.7 29 50 72.4 6 18 200.0Hawaii 9 23 155.6 5 9 80.0 3 2 -33.3 1 1 0.0Idaho 16 18 12.5 10 35 250.0 4 5 25.0 0 1 †Illinois 303 236 -22.1 432 557 28.9 173 86 -50.3 12 15 25.0Indiana 37 38 2.7 99 152 53.5 26 18 -30.8 7 9 28.6
Iowa 5 16 220.0 41 61 48.8 6 4 -33.3 1 3 200.0Kansas 31 31 0.0 42 109 159.5 4 8 100.0 0 3 †Kentucky 17 18 5.9 6 28 366.7 7 7 0.0 1 3 200.0Louisiana 32 19 -40.6 78 88 12.8 13 8 -38.5 6 0 -100.0Maine 2 1 -50.0 10 18 80.0 2 0 -100.0 0 0 †
Maryland 14 35 150.0 126 208 65.1 43 79 83.7 3 9 200.0Massachusetts 67 91 35.8 272 338 24.3 55 61 10.9 15 33 120.0Michigan 41 99 141.5 147 183 24.5 33 61 84.8 8 8 0.0Minnesota 21 17 -19.0 39 74 89.7 4 26 550.0 3 3 0.0Mississippi 1 7 600.0 8 21 162.5 2 2 0.0 0 2 †
Missouri 32 26 -18.8 91 105 15.4 14 24 71.4 7 5 -28.6Montana 2 0 -100.0 10 10 0.0 1 0 -100.0 0 2 †Nebraska 9 22 144.4 20 39 95.0 2 6 200.0 1 1 0.0Nevada 17 51 200.0 33 90 172.7 3 7 133.3 1 1 0.0New Hampshire 1 6 500.0 13 20 53.8 0 4 † 2 2 0.0
New Jersey 152 145 -4.6 414 449 8.5 45 72 60.0 6 19 216.7New Mexico 320 180 -43.8 339 414 22.1 48 63 31.3 7 9 28.6New York 774 567 -26.7 757 906 19.7 105 164 56.2 19 37 94.7North Carolina 65 55 -15.4 99 178 79.8 27 32 18.5 8 10 25.0North Dakota 0 1 † 3 5 66.7 1 2 100.0 0 0 †
2008–09
% change
2000–01
2008–09
% change
National Center for Education Statistics
State
Associate's Bachelor's Master's Doctor's
2000–01
2008–09
See notes at end of table.
Table 22d. Number and percentage change in degrees awarded in science, technology, engineering, and Table 22e. mathematics (STEM) fields to Hispanic or Latino students at Title IV institutions, by level of Table 22e. degree and state: Academic years 2000–01 and 2008–09
Level of degree
% change
2000–01
2008–09
% change
2000–01
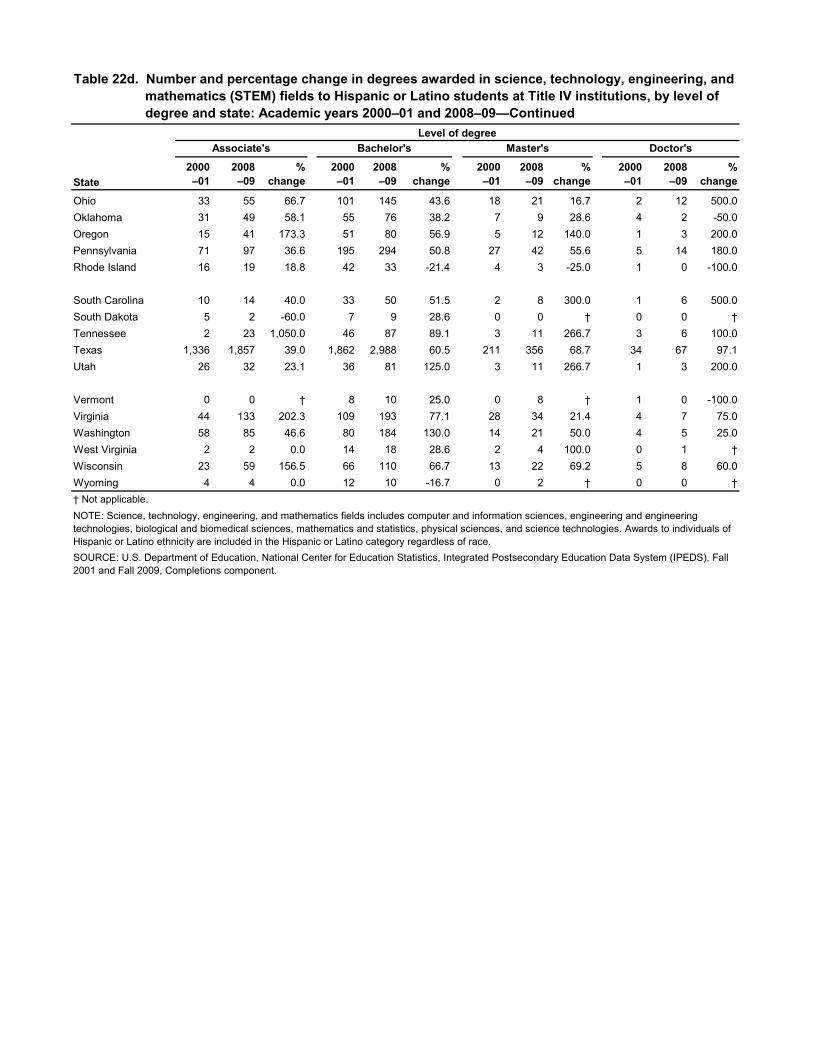
Ohio 33 55 66.7 101 145 43.6 18 21 16.7 2 12 500.0Oklahoma 31 49 58.1 55 76 38.2 7 9 28.6 4 2 -50.0Oregon 15 41 173.3 51 80 56.9 5 12 140.0 1 3 200.0Pennsylvania 71 97 36.6 195 294 50.8 27 42 55.6 5 14 180.0Rhode Island 16 19 18.8 42 33 -21.4 4 3 -25.0 1 0 -100.0
South Carolina 10 14 40.0 33 50 51.5 2 8 300.0 1 6 500.0South Dakota 5 2 -60.0 7 9 28.6 0 0 † 0 0 †Tennessee 2 23 1,050.0 46 87 89.1 3 11 266.7 3 6 100.0Texas 1,336 1,857 39.0 1,862 2,988 60.5 211 356 68.7 34 67 97.1Utah 26 32 23.1 36 81 125.0 3 11 266.7 1 3 200.0
Vermont 0 0 † 8 10 25.0 0 8 † 1 0 -100.0Virginia 44 133 202.3 109 193 77.1 28 34 21.4 4 7 75.0Washington 58 85 46.6 80 184 130.0 14 21 50.0 4 5 25.0West Virginia 2 2 0.0 14 18 28.6 2 4 100.0 0 1 †Wisconsin 23 59 156.5 66 110 66.7 13 22 69.2 5 8 60.0Wyoming 4 4 0.0 12 10 -16.7 0 2 † 0 0 †
2008–09
% change
% change
2000–01
2008–09
% change
2000–01
2000–01
2008–09
% change
2000–01
2008–09
Bachelor's Master's Doctor's
SOURCE: U.S. Department of Education, National Center for Education Statistics, Integrated Postsecondary Education Data System (IPEDS), Fall 2001 and Fall 2009, Completions component.
Table 22d. Number and percentage change in degrees awarded in science, technology, engineering, and Table 22e. mathematics (STEM) fields to Hispanic or Latino students at Title IV institutions, by level of Table 22e. degree and state: Academic years 2000–01 and 2008–09—Continued
State
Level of degreeAssociate's
† Not applicable.NOTE: Science, technology, engineering, and mathematics fields includes computer and information sciences, engineering and engineering technologies, biological and biomedical sciences, mathematics and statistics, physical sciences, and science technologies. Awards to individuals of Hispanic or Latino ethnicity are included in the Hispanic or Latino category regardless of race.

United States 44,538 40,723 -8.6 129,581 149,768 15.6 22,588 26,811 18.7 6,687 8,572 28.2
Alabama 806 463 -42.6 2,126 2,368 11.4 270 395 46.3 85 118 38.8Alaska 109 53 -51.4 172 210 22.1 63 61 -3.2 14 13 -7.1Arizona 878 2,781 216.7 1,962 3,102 58.1 319 364 14.1 130 171 31.5Arkansas 280 320 14.3 1,042 1,123 7.8 100 129 29.0 18 29 61.1California 2,039 1,974 -3.2 7,091 8,903 25.6 1,789 2,333 30.4 842 1,144 35.9
Colorado 612 545 -10.9 3,335 4,180 25.3 873 831 -4.8 208 241 15.9Connecticut 211 205 -2.8 1,187 1,707 43.8 339 418 23.3 52 104 100.0Delaware 132 122 -7.6 372 471 26.6 56 68 21.4 35 37 5.7District of Columbia 36 36 0.0 462 552 19.5 438 517 18.0 49 62 26.5Florida 2,192 1,093 -50.1 3,854 5,651 46.6 899 1,109 23.4 208 243 16.8
Georgia 203 589 190.1 3,040 3,613 18.8 582 710 22.0 171 296 73.1Hawaii 78 55 -29.5 164 189 15.2 52 62 19.2 8 26 225.0Idaho 492 268 -45.5 656 1,049 59.9 119 128 7.6 19 25 31.6Illinois 1,450 1,106 -23.7 6,443 6,176 -4.1 1,210 1,318 8.9 407 396 -2.7Indiana 1,474 1,392 -5.6 4,080 4,529 11.0 384 528 37.5 172 207 20.3
Iowa 824 665 -19.3 2,325 2,396 3.1 178 297 66.9 93 109 17.2Kansas 602 365 -39.4 1,847 1,766 -4.4 213 227 6.6 50 53 6.0Kentucky 646 701 8.5 1,801 2,125 18.0 306 376 22.9 37 70 89.2Louisiana 892 508 -43.0 1,963 1,915 -2.4 230 180 -21.7 82 72 -12.2Maine 176 163 -7.4 751 929 23.7 57 59 3.5 12 11 -8.3
Maryland 318 349 9.7 2,625 2,834 8.0 1,005 1,026 2.1 173 206 19.1Massachusetts 758 668 -11.9 4,340 4,767 9.8 1,089 1,001 -8.1 363 481 32.5Michigan 2,147 2,330 8.5 6,286 7,218 14.8 1,119 1,306 16.7 231 322 39.4Minnesota 1,215 1,217 0.2 2,983 3,763 26.1 230 548 138.3 112 84 -25.0Mississippi 489 468 -4.3 1,041 1,094 5.1 163 274 68.1 32 22 -31.3
Missouri 1,393 1,078 -22.6 3,646 3,895 6.8 544 599 10.1 104 130 25.0Montana 126 74 -41.3 821 922 12.3 124 82 -33.9 20 19 -5.0Nebraska 805 525 -34.8 1,018 1,356 33.2 121 227 87.6 26 49 88.5Nevada 139 178 28.1 310 505 62.9 58 97 67.2 10 35 250.0New Hampshire 198 181 -8.6 786 742 -5.6 103 172 67.0 38 46 21.1
New Jersey 609 465 -23.6 2,440 2,680 9.8 462 512 10.8 152 147 -3.3New Mexico 211 184 -12.8 484 611 26.2 121 189 56.2 38 70 84.2New York 3,265 1,965 -39.8 8,163 9,451 15.8 1,549 1,974 27.4 407 553 35.9North Carolina 1,671 1,143 -31.6 4,011 4,680 16.7 672 811 20.7 295 391 32.5North Dakota 295 262 -11.2 714 742 3.9 52 73 40.4 14 20 42.9
% change
2000–01
2008–09
% change
National Center for Education Statistics
State
Level of degreeAssociate's Master's
Table 22e. Number and percentage change in degrees awarded in science, technology, engineering, and Table 22d. mathematics (STEM) fields to White students at Title IV institutions, by level of degree and Table 22d. state: Academic years 2000–01 and 2008–09
2000–01
2008–09
% change
2000–01
Doctor's
See notes at end of table.
Bachelor's
2008–09
% change
2000–01
2008–09

Ohio 2,717 2,862 5.3 6,192 6,706 8.3 793 944 19.0 255 239 -6.3Oklahoma 548 618 12.8 1,550 1,780 14.8 248 295 19.0 56 68 21.4Oregon 495 436 -11.9 1,499 1,925 28.4 197 250 26.9 78 109 39.7Pennsylvania 3,064 2,629 -14.2 8,985 10,435 16.1 1,170 1,529 30.7 290 511 76.2Rhode Island 376 313 -16.8 823 825 0.2 107 128 19.6 43 43 0.0
South Carolina 539 482 -10.6 1,869 2,073 10.9 237 275 16.0 68 94 38.2South Dakota 240 223 -7.1 722 806 11.6 107 111 3.7 12 10 -16.7Tennessee 478 710 48.5 2,296 2,604 13.4 370 386 4.3 133 153 15.0Texas 3,050 2,665 -12.6 6,945 7,888 13.6 1,241 1,564 26.0 406 510 25.6Utah 702 553 -21.2 2,320 2,858 23.2 330 418 26.7 77 114 48.1
Vermont 142 85 -40.1 396 595 50.3 68 121 77.9 18 21 16.7Virginia 1,015 1,576 55.3 3,953 3,991 1.0 746 677 -9.2 181 204 12.7Washington 1,231 1,282 4.1 2,164 2,816 30.1 440 444 0.9 147 201 36.7West Virginia 409 221 -46.0 1,100 1,223 11.2 142 139 -2.1 18 14 -22.2Wisconsin 1,592 1,418 -10.9 4,182 4,732 13.2 435 483 11.0 183 270 47.5Wyoming 169 159 -5.9 244 297 21.7 68 46 -32.4 15 9 -40.0
2000–01
2008–09
% change
2000–01
2008–09
% change
2000–01
2008–09
% change
2000–01
2008–09
% change
Bachelor's Master's Doctor's
SOURCE: U.S. Department of Education, National Center for Education Statistics, Integrated Postsecondary Education Data System (IPEDS), Fall 2001 and Fall 2009, Completions component.
Table 22e. Number and percentage change in degrees awarded in science, technology, engineering, and Table 22d. mathematics (STEM) fields to White students at Title IV institutions, by level of degree and Table 22d. state: Academic years 2000–01 and 2008–09—Continued
State
Level of degreeAssociate's
NOTE: Science, technology, engineering, and mathematics fields includes computer and information sciences, engineering and engineering technologies, biological and biomedical sciences, mathematics and statistics, physical sciences, and science technologies. Awards to individuals of Hispanic or Latino ethnicity are included in the Hispanic or Latino category regardless of race.

United States 2,036 3,754 84.4 7,147 13,667 91.2 2,353 5,095 116.5 564 1,072 90.1
Alabama 6 14 133.3 26 169 550.0 13 74 469.2 0 6 †Alaska 3 2 -33.3 2 5 150.0 0 0 † 0 0 †Arizona 46 857 1,763.0 280 540 92.9 3 109 3,533.3 4 21 425.0Arkansas 0 0 † 6 22 266.7 0 3 † 0 2 †California 205 423 106.3 1,616 2,552 57.9 357 793 122.1 82 252 207.3
Colorado 77 28 -63.6 154 361 134.4 143 176 23.1 13 33 153.8Connecticut 7 14 100.0 49 194 295.9 76 84 10.5 13 22 69.2Delaware 6 8 33.3 21 24 14.3 2 14 600.0 0 1 †District of Columbia 6 9 50.0 85 111 30.6 69 192 178.3 2 10 400.0Florida 189 99 -47.6 67 453 576.1 17 130 664.7 2 14 600.0
Georgia 9 31 244.4 51 119 133.3 5 35 600.0 1 13 1,200.0Hawaii 2 5 150.0 43 11 -74.4 39 1 -97.4 16 0 -100.0Idaho 13 13 0.0 23 30 30.4 1 12 1,100.0 1 3 200.0Illinois 13 22 69.2 247 520 110.5 61 252 313.1 8 22 175.0Indiana 56 83 48.2 84 205 144.0 14 32 128.6 13 30 130.8
Iowa 4 269 6,625.0 64 394 515.6 12 24 100.0 11 10 -9.1Kansas 11 21 90.9 43 92 114.0 15 14 -6.7 8 4 -50.0Kentucky 4 29 625.0 15 51 240.0 2 14 600.0 0 6 †Louisiana 11 16 45.5 62 113 82.3 16 13 -18.8 4 4 0.0Maine 27 12 -55.6 9 21 133.3 0 0 † 0 0 †
Maryland 22 47 113.6 106 360 239.6 24 419 1,645.8 5 76 1,420.0Massachusetts 95 93 -2.1 551 846 53.5 327 496 51.7 110 155 40.9Michigan 118 147 24.6 295 445 50.8 94 146 55.3 12 12 0.0Minnesota 155 64 -58.7 101 195 93.1 7 76 985.7 3 9 200.0Mississippi 8 16 100.0 2 13 550.0 1 16 1,500.0 0 1 †
Missouri 49 56 14.3 174 230 32.2 41 59 43.9 2 9 350.0Montana 11 5 -54.5 62 50 -19.4 7 36 414.3 0 3 †Nebraska 4 23 475.0 32 90 181.3 4 30 650.0 0 8 †Nevada 11 27 145.5 29 56 93.1 13 23 76.9 4 5 25.0New Hampshire 80 13 -83.8 90 91 1.1 33 33 0.0 2 6 200.0
New Jersey 86 89 3.5 314 343 9.2 104 205 97.1 11 21 90.9New Mexico 37 37 0.0 165 61 -63.0 57 23 -59.6 12 6 -50.0New York 254 312 22.8 753 1,485 97.2 401 589 46.9 56 78 39.3North Carolina 22 49 122.7 76 223 193.4 3 42 1,300.0 0 13 †North Dakota 0 16 † 0 2 † 0 0 † 0 0 †
2008–09
% change
2000–01
2008–09
% change
National Center for Education Statistics
State
Associate's Bachelor's Master's Doctor's
2000–01
2008–09
See notes at end of table.
Table 22f. Number and percentage change in degrees awarded in science, technology, engineering, and Table 22f. mathematics (STEM) fields to students of unknown race/ethnicity at Title IV institutions, by Table 22f. level of degree and state: Academic years 2000–01 and 2008–09
Level of degree
% change
2000–01
2008–09
% change
2000–01

Ohio 40 127 217.5 191 395 106.8 43 157 265.1 23 45 95.7Oklahoma 1 22 2,100.0 3 38 1,166.7 2 6 200.0 0 1 †Oregon 28 42 50.0 146 221 51.4 49 34 -30.6 4 4 0.0Pennsylvania 76 128 68.4 297 624 110.1 131 320 144.3 54 39 -27.8Rhode Island 9 69 666.7 44 160 263.6 8 22 175.0 2 8 300.0
South Carolina 6 8 33.3 31 167 438.7 6 23 283.3 2 11 450.0South Dakota 0 7 † 12 42 250.0 3 9 200.0 0 3 †Tennessee 2 21 950.0 39 147 276.9 3 18 500.0 1 11 1,000.0Texas 29 47 62.1 100 145 45.0 34 64 88.2 34 33 -2.9Utah 21 47 123.8 132 279 111.4 13 33 153.8 6 12 100.0
Vermont 11 5 -54.5 42 31 -26.2 5 35 600.0 0 0 †Virginia 14 102 628.6 98 473 382.7 17 89 423.5 22 13 -40.9Washington 61 121 98.4 287 356 24.0 66 107 62.1 17 30 76.5West Virginia 2 3 50.0 3 26 766.7 0 0 † 0 0 †Wisconsin 89 56 -37.1 7 66 842.9 5 2 -60.0 0 0 †Wyoming 0 0 † 18 20 11.1 7 11 57.1 4 7 75.0
2008–09
% change
% change
2000–01
2008–09
% change
2000–01
2000–01
2008–09
% change
2000–01
2008–09
Bachelor's Master's Doctor's
SOURCE: U.S. Department of Education, National Center for Education Statistics, Integrated Postsecondary Education Data System (IPEDS), Fall 2001 and Fall 2009, Completions component.
Table 22f. Number and percentage change in degrees awarded in science, technology, engineering, and Table 22f. mathematics (STEM) fields to students of unknown race/ethnicity at Title IV institutions, by Table 22f. level of degree and state: Academic years 2000–01 and 2008–09—Continued
State
Level of degreeAssociate's
† Not applicable.NOTE: Science, technology, engineering, and mathematics fields includes computer and information sciences, engineering and engineering technologies, biological and biomedical sciences, mathematics and statistics, physical sciences, and science technologies. Awards to individuals of Hispanic or Latino ethnicity are included in the Hispanic or Latino category regardless of race.
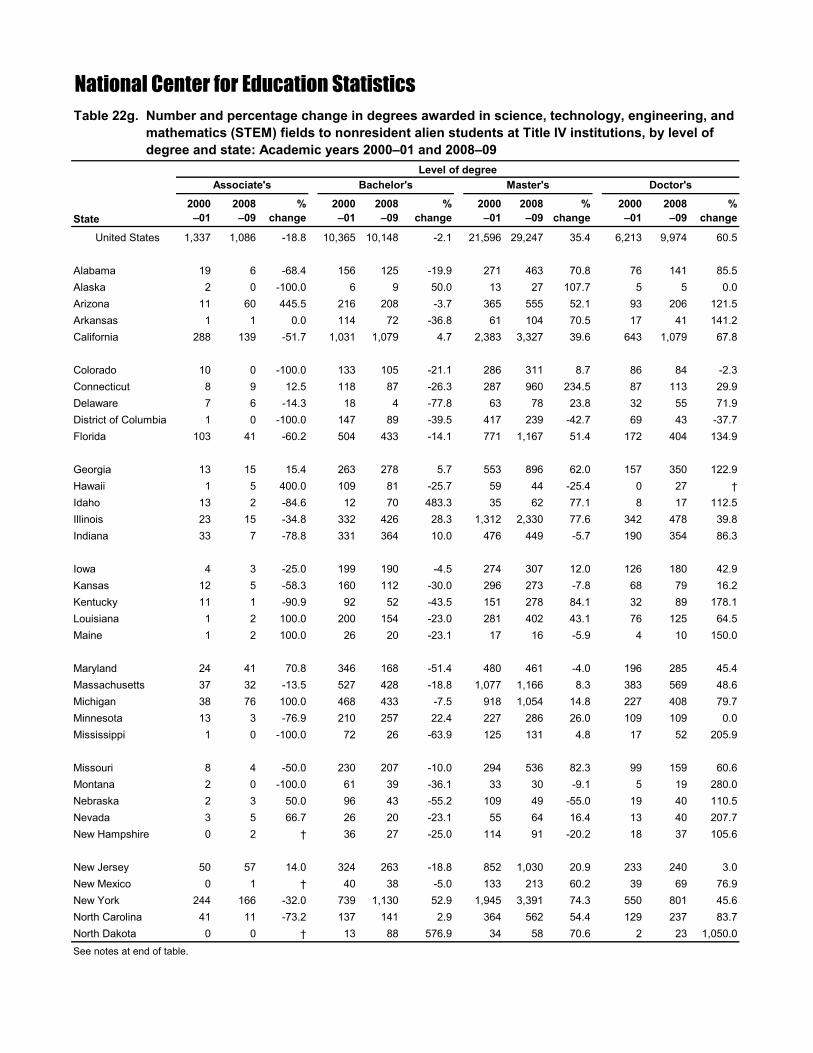
United States 1,337 1,086 -18.8 10,365 10,148 -2.1 21,596 29,247 35.4 6,213 9,974 60.5
Alabama 19 6 -68.4 156 125 -19.9 271 463 70.8 76 141 85.5Alaska 2 0 -100.0 6 9 50.0 13 27 107.7 5 5 0.0Arizona 11 60 445.5 216 208 -3.7 365 555 52.1 93 206 121.5Arkansas 1 1 0.0 114 72 -36.8 61 104 70.5 17 41 141.2California 288 139 -51.7 1,031 1,079 4.7 2,383 3,327 39.6 643 1,079 67.8
Colorado 10 0 -100.0 133 105 -21.1 286 311 8.7 86 84 -2.3Connecticut 8 9 12.5 118 87 -26.3 287 960 234.5 87 113 29.9Delaware 7 6 -14.3 18 4 -77.8 63 78 23.8 32 55 71.9District of Columbia 1 0 -100.0 147 89 -39.5 417 239 -42.7 69 43 -37.7Florida 103 41 -60.2 504 433 -14.1 771 1,167 51.4 172 404 134.9
Georgia 13 15 15.4 263 278 5.7 553 896 62.0 157 350 122.9Hawaii 1 5 400.0 109 81 -25.7 59 44 -25.4 0 27 †Idaho 13 2 -84.6 12 70 483.3 35 62 77.1 8 17 112.5Illinois 23 15 -34.8 332 426 28.3 1,312 2,330 77.6 342 478 39.8Indiana 33 7 -78.8 331 364 10.0 476 449 -5.7 190 354 86.3
Iowa 4 3 -25.0 199 190 -4.5 274 307 12.0 126 180 42.9Kansas 12 5 -58.3 160 112 -30.0 296 273 -7.8 68 79 16.2Kentucky 11 1 -90.9 92 52 -43.5 151 278 84.1 32 89 178.1Louisiana 1 2 100.0 200 154 -23.0 281 402 43.1 76 125 64.5Maine 1 2 100.0 26 20 -23.1 17 16 -5.9 4 10 150.0
Maryland 24 41 70.8 346 168 -51.4 480 461 -4.0 196 285 45.4Massachusetts 37 32 -13.5 527 428 -18.8 1,077 1,166 8.3 383 569 48.6Michigan 38 76 100.0 468 433 -7.5 918 1,054 14.8 227 408 79.7Minnesota 13 3 -76.9 210 257 22.4 227 286 26.0 109 109 0.0Mississippi 1 0 -100.0 72 26 -63.9 125 131 4.8 17 52 205.9
Missouri 8 4 -50.0 230 207 -10.0 294 536 82.3 99 159 60.6Montana 2 0 -100.0 61 39 -36.1 33 30 -9.1 5 19 280.0Nebraska 2 3 50.0 96 43 -55.2 109 49 -55.0 19 40 110.5Nevada 3 5 66.7 26 20 -23.1 55 64 16.4 13 40 207.7New Hampshire 0 2 † 36 27 -25.0 114 91 -20.2 18 37 105.6
New Jersey 50 57 14.0 324 263 -18.8 852 1,030 20.9 233 240 3.0New Mexico 0 1 † 40 38 -5.0 133 213 60.2 39 69 76.9New York 244 166 -32.0 739 1,130 52.9 1,945 3,391 74.3 550 801 45.6North Carolina 41 11 -73.2 137 141 2.9 364 562 54.4 129 237 83.7North Dakota 0 0 † 13 88 576.9 34 58 70.6 2 23 1,050.0
2008–09
% change
2000–01
2008–09
% change
National Center for Education Statistics
State
Associate's Bachelor's Master's Doctor's
2000–01
2008–09
See notes at end of table.
Table 22g. Number and percentage change in degrees awarded in science, technology, engineering, and Table 22g. mathematics (STEM) fields to nonresident alien students at Title IV institutions, by level of Table 22g. degree and state: Academic years 2000–01 and 2008–09
Level of degree
% change
2000–01
2008–09
% change
2000–01
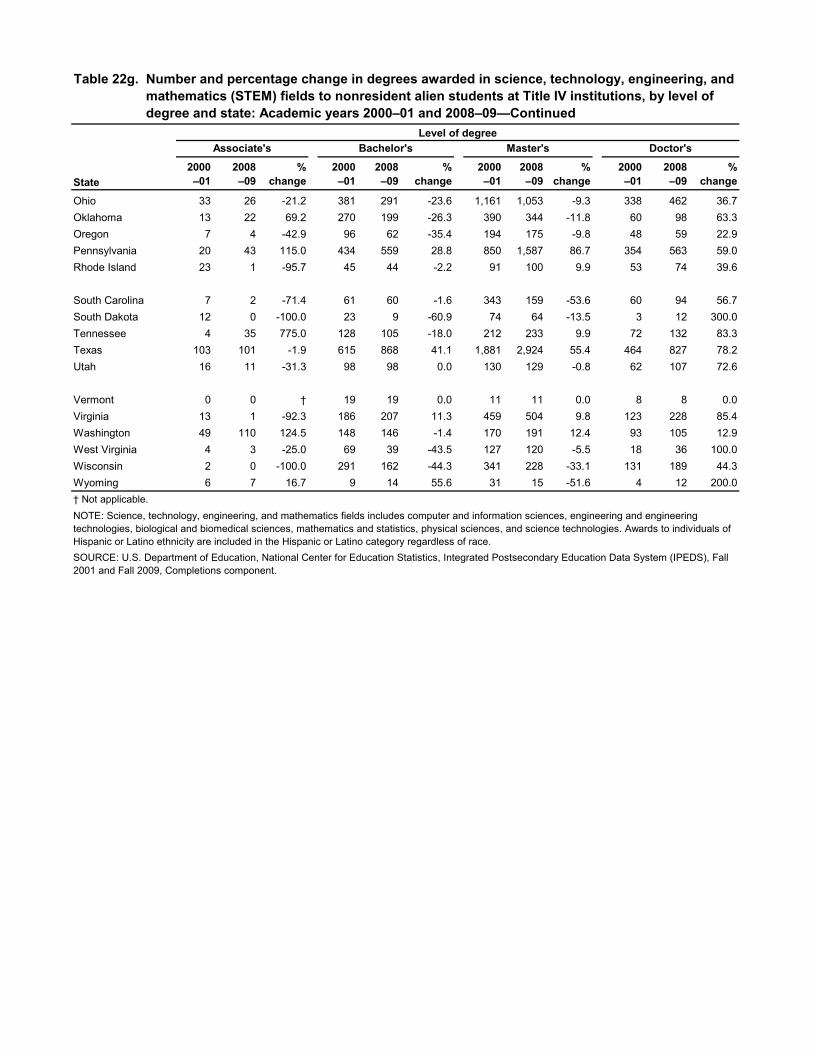
Ohio 33 26 -21.2 381 291 -23.6 1,161 1,053 -9.3 338 462 36.7Oklahoma 13 22 69.2 270 199 -26.3 390 344 -11.8 60 98 63.3Oregon 7 4 -42.9 96 62 -35.4 194 175 -9.8 48 59 22.9Pennsylvania 20 43 115.0 434 559 28.8 850 1,587 86.7 354 563 59.0Rhode Island 23 1 -95.7 45 44 -2.2 91 100 9.9 53 74 39.6
South Carolina 7 2 -71.4 61 60 -1.6 343 159 -53.6 60 94 56.7South Dakota 12 0 -100.0 23 9 -60.9 74 64 -13.5 3 12 300.0Tennessee 4 35 775.0 128 105 -18.0 212 233 9.9 72 132 83.3Texas 103 101 -1.9 615 868 41.1 1,881 2,924 55.4 464 827 78.2Utah 16 11 -31.3 98 98 0.0 130 129 -0.8 62 107 72.6
Vermont 0 0 † 19 19 0.0 11 11 0.0 8 8 0.0Virginia 13 1 -92.3 186 207 11.3 459 504 9.8 123 228 85.4Washington 49 110 124.5 148 146 -1.4 170 191 12.4 93 105 12.9West Virginia 4 3 -25.0 69 39 -43.5 127 120 -5.5 18 36 100.0Wisconsin 2 0 -100.0 291 162 -44.3 341 228 -33.1 131 189 44.3Wyoming 6 7 16.7 9 14 55.6 31 15 -51.6 4 12 200.0
2008–09
% change
% change
2000–01
2008–09
% change
2000–01
2000–01
2008–09
% change
2000–01
2008–09
Bachelor's Master's Doctor's
SOURCE: U.S. Department of Education, National Center for Education Statistics, Integrated Postsecondary Education Data System (IPEDS), Fall 2001 and Fall 2009, Completions component.
Table 22g. Number and percentage change in degrees awarded in science, technology, engineering, and Table 22g. mathematics (STEM) fields to nonresident alien students at Title IV institutions, by level of Table 22g. degree and state: Academic years 2000–01 and 2008–09—Continued
State
Level of degreeAssociate's
† Not applicable.NOTE: Science, technology, engineering, and mathematics fields includes computer and information sciences, engineering and engineering technologies, biological and biomedical sciences, mathematics and statistics, physical sciences, and science technologies. Awards to individuals of Hispanic or Latino ethnicity are included in the Hispanic or Latino category regardless of race.

United States 204 208 2.0 266 255 -4.1 19 14 -26.3 3 4 33.3
Alabama 3 4 33.3 1 0 -100.0 0 0 † 0 0 †Alaska 28 0 -100.0 3 8 166.7 0 0 † 0 0 †Arizona 14 54 285.7 29 21 -27.6 0 0 † 0 0 †Arkansas 1 3 200.0 2 3 50.0 0 0 † 0 0 †California 32 33 3.1 42 9 -78.6 1 0 -100.0 0 0 †
Colorado 4 8 100.0 10 5 -50.0 0 0 † 1 0 -100.0Connecticut 0 0 † 1 0 -100.0 0 0 † 0 0 †Delaware 0 0 † 1 0 -100.0 0 0 † 0 0 †District of Columbia 0 0 † 0 0 † 0 0 † 0 1 †Florida 3 7 133.3 2 3 50.0 1 0 -100.0 0 0 †
Georgia 4 6 50.0 2 1 -50.0 0 0 † 0 0 †Hawaii 0 0 † 0 0 † 0 0 † 0 0 †Idaho 0 0 † 0 0 † 1 3 200.0 0 0 †Illinois 2 2 0.0 6 7 16.7 0 0 † 0 0 †Indiana 0 1 † 1 0 -100.0 0 0 † 0 1 †
Iowa 2 0 -100.0 0 3 † 0 0 † 0 0 †Kansas 2 0 -100.0 7 8 14.3 0 0 † 0 0 †Kentucky 0 13 † 1 4 300.0 0 0 † 0 0 †Louisiana 1 1 0.0 4 2 -50.0 0 0 † 0 0 †Maine 0 0 † 0 0 † 0 0 † 0 0 †
Maryland 0 0 † 0 6 † 1 1 0.0 0 0 †Massachusetts 3 2 -33.3 0 1 † 0 0 † 0 0 †Michigan 0 2 † 5 5 0.0 0 0 † 0 0 †Minnesota 8 6 -25.0 6 1 -83.3 1 0 -100.0 0 0 †Mississippi 0 0 † 0 0 † 0 0 † 0 0 †
Missouri 0 0 † 2 1 -50.0 0 0 † 0 0 †Montana 0 0 † 8 12 50.0 0 0 † 0 0 †Nebraska 0 0 † 2 0 -100.0 0 0 † 0 0 †Nevada 0 1 † 1 0 -100.0 0 0 † 0 0 †New Hampshire 0 0 † 0 0 † 0 0 † 0 0 †
New Jersey 21 0 -100.0 13 2 -84.6 0 0 † 0 0 †New Mexico 0 1 † 7 43 514.3 0 1 † 0 0 †New York 6 4 -33.3 4 6 50.0 0 0 † 1 1 0.0North Carolina 6 8 33.3 2 3 50.0 0 0 † 0 0 †North Dakota 8 0 -100.0 0 0 † 0 0 † 0 0 †
% change
2000–01
2008–09
% change
2000–01
2008–09
% change
2000–01
2008–09
Table 23a. Number and percentage change in certificates awarded in science, technology, engineering, Table 23a. and mathematics (STEM) fields to American Indian or Alaska Native students at Title IV Table 23a. institutions, by level of degree and state: Academic years 2000–01 and 2008–09
2000–01
National Center for Education Statistics
State
Level of certificate
Less than 1 yearAt least 1 year but less
than 2 yearsAt least 2 years but less
than 4 years Advanced1
See notes at end of table.
2008–09
% change

Ohio 4 4 0.0 1 0 -100.0 0 0 † 0 0 †Oklahoma 9 13 44.4 52 70 34.6 8 7 -12.5 0 1 †Oregon 1 2 100.0 4 0 -100.0 1 0 -100.0 0 0 †Pennsylvania 9 0 -100.0 1 5 400.0 0 0 † 0 0 †Rhode Island 0 0 † 0 0 † 0 0 † 0 0 †
South Carolina 5 7 40.0 1 0 -100.0 0 0 † 0 0 †South Dakota 0 1 † 1 0 -100.0 0 0 † 0 0 †Tennessee 1 0 -100.0 3 0 -100.0 0 1 † 0 0 †Texas 11 16 45.5 6 8 33.3 0 0 † 0 0 †Utah 2 1 -50.0 1 1 0.0 0 0 † 0 0 †
Vermont 0 0 † 0 0 † 0 0 † 0 0 †Virginia 1 0 -100.0 5 0 -100.0 0 0 † 1 0 -100.0Washington 10 8 -20.0 18 3 -83.3 5 1 -80.0 0 0 †West Virginia 0 0 † 1 0 -100.0 0 0 † 0 0 †Wisconsin 3 0 -100.0 9 14 55.6 0 0 † 0 0 †Wyoming 0 0 † 1 0 -100.0 0 0 † 0 0 †
2000–01
2008–09
% change
† Not applicable.
SOURCE: U.S. Department of Education, National Center for Education Statistics, Integrated Postsecondary Education Data System (IPEDS), Fall 2001 and Fall 2009, Completions component.
Table 23a. Number and percentage change in certificates awarded in science, technology, engineering, Table 23a. and mathematics (STEM) fields to American Indian or Alaska Native students at Title IV Table 23a. institutions, by level of degree and state: Academic years 2000–01 and 2008–09—Continued
State
Level of certificate
Less than 1 yearAt least 1 year but less
than 2 years
1Advanced certificates include the post-baccalaureate, post-masters, and first-professional certificate levels.NOTE: Science, technology, engineering, and mathematics fields includes computer and information sciences, engineering and engineering technologies, biological and biomedical sciences, mathematics and statistics, physical sciences, and science technologies. Awards to individuals of Hispanic or Latino ethnicity are included in the Hispanic or Latino category regardless of race.
2000–01
2008–09
% change
2000–01
% change
2008–09
% change
At least 2 years but less than 4 years Advanced1
2000–01
2008–09

United States 1,579 1,121 -29.0 1,674 681 -59.3 118 63 -46.6 110 230 109.1
Alabama 5 2 -60.0 3 1 -66.7 0 0 † 0 0 †Alaska 1 0 -100.0 0 3 † 0 0 † 0 0 †Arizona 13 25 92.3 21 29 38.1 0 0 † 0 0 †Arkansas 1 10 900.0 1 7 600.0 0 0 † 0 0 †California 824 514 -37.6 658 179 -72.8 17 1 -94.1 19 58 205.3
Colorado 9 15 66.7 25 2 -92.0 0 0 † 20 7 -65.0Connecticut 8 9 12.5 12 2 -83.3 0 0 † 5 11 120.0Delaware 0 1 † 0 2 † 0 0 † 0 0 †District of Columbia 0 1 † 20 0 -100.0 0 0 † 1 37 3,600.0Florida 8 66 725.0 44 16 -63.6 2 14 600.0 0 0 †
Georgia 26 45 73.1 10 27 170.0 0 4 † 0 0 †Hawaii 5 23 360.0 10 9 -10.0 0 2 † 0 0 †Idaho 0 0 † 2 0 -100.0 3 4 33.3 0 0 †Illinois 149 59 -60.4 80 48 -40.0 0 0 † 4 0 -100.0Indiana 0 2 † 5 0 -100.0 0 0 † 0 2 †
Iowa 1 0 -100.0 5 1 -80.0 0 0 † 0 1 †Kansas 16 14 -12.5 7 7 0.0 1 0 -100.0 0 0 †Kentucky 1 19 1,800.0 1 2 100.0 0 0 † 0 1 †Louisiana 1 7 600.0 5 13 160.0 4 0 -100.0 0 0 †Maine 0 0 † 0 0 † 0 0 † 0 0 †
Maryland 10 4 -60.0 31 22 -29.0 22 20 -9.1 8 25 212.5Massachusetts 15 18 20.0 9 16 77.8 0 0 † 5 3 -40.0Michigan 5 11 120.0 37 9 -75.7 7 0 -100.0 1 1 0.0Minnesota 53 9 -83.0 65 10 -84.6 2 4 100.0 0 2 †Mississippi 0 0 † 0 0 † 0 0 † 0 0 †
Missouri 4 2 -50.0 14 5 -64.3 0 0 † 1 14 1,300.0Montana 0 0 † 0 0 † 0 0 † 0 0 †Nebraska 2 3 50.0 1 2 100.0 0 0 † 0 0 †Nevada 0 5 † 0 5 † 0 2 † 0 0 †New Hampshire 3 1 -66.7 0 0 † 0 0 † 0 0 †
New Jersey 91 10 -89.0 260 50 -80.8 7 2 -71.4 11 5 -54.5New Mexico 0 1 † 2 4 100.0 0 2 † 0 0 †New York 14 2 -85.7 29 35 20.7 0 0 † 20 19 -5.0North Carolina 43 22 -48.8 3 3 0.0 0 0 † 0 0 †North Dakota 0 0 † 0 0 † 0 0 † 0 0 †See notes at end of table.
At least 2 years but less than 4 years Advanced1
2000–01
2008–09
% change
2000–01
2008–09
National Center for Education StatisticsTable 23b. Number and percentage change in certificates awarded in science, technology, engineering, Table 23b. and mathematics (STEM) fields to Asian, Native Hawaiian, or Other Pacific Islander students Table 23b. at Title IV institutions, by level of degree and state: Academic years 2000–01 and 2008-09
State
Level of certificate
Less than 1 yearAt least 1 year but less
than 2 years
% change
2000–01
2008–09
% change
2000–01
2008–09
% change

Ohio 4 12 200.0 11 9 -18.2 0 1 † 0 1 †Oklahoma 10 14 40.0 9 10 11.1 0 4 † 0 1 †Oregon 5 9 80.0 3 6 100.0 0 0 † 0 7 †Pennsylvania 57 9 -84.2 17 15 -11.8 0 0 † 0 4 †Rhode Island 0 0 † 4 4 0.0 0 0 † 0 0 †
South Carolina 25 8 -68.0 1 0 -100.0 0 0 † 0 0 †South Dakota 0 0 † 0 0 † 0 0 † 0 0 †Tennessee 0 2 † 7 2 -71.4 0 0 † 0 0 †Texas 100 72 -28.0 117 56 -52.1 6 1 -83.3 0 10 †Utah 1 4 300.0 4 5 25.0 0 0 † 0 0 †
Vermont 0 0 † 0 0 † 0 0 † 0 0 †Virginia 9 0 -100.0 42 8 -81.0 3 0 -100.0 15 21 40.0Washington 58 82 41.4 90 55 -38.9 44 2 -95.5 0 0 †West Virginia 0 2 † 1 2 100.0 0 0 † 0 0 †Wisconsin 2 7 250.0 8 0 -100.0 0 0 † 0 0 †Wyoming 0 0 † 0 0 † 0 0 † 0 0 †
2008–09
% change
% change
2000–01
2008–09
% change
2000–01
2000–01
2008–09
% change
2000–01
2008–09
SOURCE: U.S. Department of Education, National Center for Education Statistics, Integrated Postsecondary Education Data System (IPEDS), Fall 2001 and Fall 2009, Completions component.
† Not applicable.
At least 1 year but less than 2 years
At least 2 years but less than 4 years Advanced1
Table 23b. Number and percentage change in certificates awarded in science, technology, engineering, Table 23b. and mathematics (STEM) fields to Asian, Native Hawaiian, or Other Pacific Islander students Table 23b. at Title IV institutions, by level of degree and state: Academic years 2000–01 and 2008-09Table 23b. —Continued
1Advanced certificates include the post-baccalaureate, post-masters, and first-professional certificate levels.NOTE: Science, technology, engineering, and mathematics fields includes computer and information sciences, engineering and engineering technologies, biological and biomedical sciences, mathematics and statistics, physical sciences, and science technologies. Awards to individuals of Hispanic or Latino ethnicity are included in the Hispanic or Latino category regardless of race.
State
Level of certificate
Less than 1 year

United States 4,043 3,089 -23.6 3,134 2,354 -24.9 215 307 42.8 63 182 188.9
Alabama 71 50 -29.6 57 50 -12.3 6 0 -100.0 0 0 †Alaska 2 0 -100.0 0 1 † 0 0 † 0 0 †Arizona 40 115 187.5 31 32 3.2 0 0 † 0 0 †Arkansas 6 43 616.7 25 38 52.0 0 0 † 0 0 †California 674 173 -74.3 190 136 -28.4 2 0 -100.0 1 6 500.0
Colorado 10 16 60.0 33 3 -90.9 0 0 † 15 9 -40.0Connecticut 4 14 250.0 69 8 -88.4 0 0 † 2 4 100.0Delaware 23 0 -100.0 3 1 -66.7 0 0 † 0 0 †District of Columbia 65 60 -7.7 69 2 -97.1 0 0 † 2 31 1,450.0Florida 68 248 264.7 323 225 -30.3 22 118 436.4 0 0 †
Georgia 386 484 25.4 114 175 53.5 10 109 990.0 0 2 †Hawaii 0 0 † 0 0 † 0 0 † 0 0 †Idaho 0 0 † 0 0 † 0 1 † 0 0 †Illinois 236 105 -55.5 272 144 -47.1 0 0 † 1 0 -100.0Indiana 12 31 158.3 25 17 -32.0 0 0 † 0 0 †
Iowa 10 2 -80.0 1 4 300.0 0 0 † 0 0 †Kansas 13 18 38.5 14 34 142.9 3 0 -100.0 0 0 †Kentucky 2 62 3,000.0 5 6 20.0 1 0 -100.0 0 0 †Louisiana 44 132 200.0 137 125 -8.8 9 0 -100.0 0 0 †Maine 0 0 † 0 1 † 0 0 † 0 0 †
Maryland 160 41 -74.4 185 197 6.5 36 45 25.0 9 59 555.6Massachusetts 26 38 46.2 20 66 230.0 25 0 -100.0 3 0 -100.0Michigan 66 312 372.7 33 84 154.5 2 0 -100.0 0 1 †Minnesota 45 8 -82.2 53 6 -88.7 0 1 † 0 5 †Mississippi 0 0 † 2 4 100.0 2 0 -100.0 0 0 †
Missouri 18 17 -5.6 76 39 -48.7 2 1 -50.0 2 22 1,000.0Montana 0 0 † 0 0 † 0 0 † 0 0 †Nebraska 5 17 240.0 1 1 0.0 0 0 † 0 0 †Nevada 1 7 600.0 1 0 -100.0 0 0 † 0 0 †New Hampshire 1 0 -100.0 0 0 † 0 0 † 0 0 †
New Jersey 473 21 -95.6 304 174 -42.8 41 3 -92.7 6 4 -33.3New Mexico 0 4 † 3 3 0.0 0 5 † 0 1 †New York 96 21 -78.1 37 115 210.8 0 0 † 7 16 128.6North Carolina 253 247 -2.4 37 28 -24.3 0 0 † 0 0 †North Dakota 0 0 † 0 2 † 0 0 † 0 0 †See notes at end of table.
At least 2 years but less than 4 years Advanced1
2000–01
2008–09
% change
2000–01
2008–09
% change
National Center for Education StatisticsTable 23c. Number and percentage change in certificates awarded in science, technology, engineering, Table 23c. and mathematics (STEM) fields to Black or African American students at Title IV institutions, Table 23c. by level of degree and state: Academic years 2000–01 and 2008–09
State
Level of certificate
Less than 1 yearAt least 1 year but less
than 2 years
2000–01
2008–09
% change
2000–01
2008–09
% change

Ohio 47 79 68.1 118 180 52.5 0 0 † 0 1 †Oklahoma 4 19 375.0 40 37 -7.5 2 21 950.0 0 2 †Oregon 3 0 -100.0 0 0 † 0 0 † 0 1 †Pennsylvania 312 18 -94.2 41 112 173.2 0 0 † 0 6 †Rhode Island 0 0 † 6 4 -33.3 0 0 † 0 0 †
South Carolina 242 142 -41.3 7 1 -85.7 0 0 † 0 0 †South Dakota 0 0 † 1 0 -100.0 0 0 † 0 0 †Tennessee 12 54 350.0 169 21 -87.6 1 1 0.0 0 2 †Texas 392 454 15.8 245 215 -12.2 9 2 -77.8 1 3 200.0Utah 1 0 -100.0 1 1 0.0 0 0 † 0 0 †
Vermont 0 0 † 0 0 † 0 0 † 0 0 †Virginia 148 4 -97.3 308 38 -87.7 35 0 -100.0 13 6 -53.8Washington 43 23 -46.5 35 15 -57.1 7 0 -100.0 1 1 0.0West Virginia 5 2 -60.0 10 8 -20.0 0 0 † 0 0 †Wisconsin 24 7 -70.8 33 1 -97.0 0 0 † 0 0 †Wyoming 0 1 † 0 0 † 0 0 † 0 0 †
2008–09
% change
% change
2000–01
2008–09
% change
2000–01
2000–01
2008–09
% change
2000–01
2008–09
SOURCE: U.S. Department of Education, National Center for Education Statistics, Integrated Postsecondary Education Data System (IPEDS), Fall 2001 and Fall 2009, Completions component.
† Not applicable.
At least 1 year but less than 2 years
At least 2 years but less than 4 years Advanced1
1Advanced certificates include the post-baccalaureate, post-masters, and first-professional certificate levels.NOTE: Science, technology, engineering, and mathematics fields includes computer and information sciences, engineering and engineering technologies, biological and biomedical sciences, mathematics and statistics, physical sciences, and science technologies. Awards to individuals of Hispanic or Latino ethnicity are included in the Hispanic or Latino category regardless of race.
Table 23c. Number and percentage change in certificates awarded in science, technology, engineering, Table 23c. and mathematics (STEM) fields to Black or African American students at Title IV institutions, Table 23c. by level of degree and state: Academic years 2000–01 and 2008–09—Continued
State
Level of certificate
Less than 1 year

United States 3,776 3,282 -13.1 2,593 2,531 -2.4 223 248 11.2 37 90 143.2
Alabama 3 6 100.0 1 3 200.0 0 0 † 0 0 †Alaska 2 0 -100.0 3 1 -66.7 0 0 † 0 0 †Arizona 123 193 56.9 86 107 24.4 0 0 † 0 0 †Arkansas 5 11 120.0 6 9 50.0 0 0 † 0 0 †California 1,352 899 -33.5 843 547 -35.1 20 0 -100.0 7 9 28.6
Colorado 31 38 22.6 54 16 -70.4 0 0 † 6 2 -66.7Connecticut 4 11 175.0 30 24 -20.0 0 0 † 1 4 300.0Delaware 1 0 -100.0 0 2 † 0 0 † 0 0 †District of Columbia 9 2 -77.8 6 0 -100.0 0 0 † 3 17 466.7Florida 999 871 -12.8 278 250 -10.1 22 167 659.1 0 3 †
Georgia 31 48 54.8 10 31 210.0 3 7 133.3 0 0 †Hawaii 1 0 -100.0 0 0 † 0 0 † 0 0 †Idaho 1 0 -100.0 3 3 0.0 2 5 150.0 0 0 †Illinois 169 117 -30.8 189 110 -41.8 0 0 † 0 0 †Indiana 1 6 500.0 11 6 -45.5 0 0 † 0 1 †
Iowa 7 1 -85.7 1 3 200.0 0 0 † 0 1 †Kansas 74 13 -82.4 13 26 100.0 2 0 -100.0 0 0 †Kentucky 1 15 1,400.0 3 5 66.7 0 0 † 0 0 †Louisiana 2 15 650.0 6 15 150.0 1 0 -100.0 0 0 †Maine 0 0 † 0 1 † 0 0 † 0 0 †
Maryland 17 6 -64.7 17 19 11.8 9 9 0.0 2 8 300.0Massachusetts 16 35 118.8 9 66 633.3 23 0 -100.0 5 2 -60.0Michigan 3 15 400.0 10 11 10.0 2 0 -100.0 0 2 †Minnesota 11 4 -63.6 15 1 -93.3 2 1 -50.0 0 1 †Mississippi 0 0 † 0 0 † 0 0 † 0 0 †
Missouri 3 0 -100.0 12 6 -50.0 1 0 -100.0 2 8 300.0Montana 0 0 † 0 0 † 0 0 † 0 0 †Nebraska 3 15 400.0 3 4 33.3 0 0 † 0 0 †Nevada 1 4 300.0 1 3 200.0 0 0 † 0 0 †New Hampshire 2 1 -50.0 0 0 † 0 0 † 0 0 †
New Jersey 268 33 -87.7 255 266 4.3 32 7 -78.1 2 1 -50.0New Mexico 19 34 78.9 38 66 73.7 8 21 162.5 0 2 †New York 51 2 -96.1 32 142 343.8 0 0 † 7 17 142.9North Carolina 21 54 157.1 2 2 0.0 0 0 † 0 0 †North Dakota 0 0 † 0 1 † 0 0 † 0 0 †See notes at end of table.
At least 2 years but less than 4 years Advanced1
2000–01
2008–09
% change
2000–01
2008–09
% change
National Center for Education StatisticsTable 23d. Number and percentage change in certificates awarded in science, technology, engineering, Table 23e. and mathematics (STEM) fields to Hispanic or Latino students at Title IV institutions, by level Table 23e. of degree and state: Academic years 2000–01 and 2008–09
State
Level of certificate
Less than 1 yearAt least 1 year but less
than 2 years
2000–01
2008–09
% change
2000–01
2008–09
% change

Ohio 13 10 -23.1 8 15 87.5 0 0 † 0 0 †Oklahoma 2 4 100.0 20 38 90.0 8 25 212.5 0 1 †Oregon 1 6 500.0 2 6 200.0 0 1 † 0 0 †Pennsylvania 42 7 -83.3 14 35 150.0 0 0 † 0 3 †Rhode Island 0 0 † 10 10 0.0 0 0 † 0 0 †
South Carolina 14 8 -42.9 0 0 † 0 0 † 0 0 †South Dakota 0 0 † 0 0 † 0 0 † 0 0 †Tennessee 0 4 † 19 3 -84.2 2 0 -100.0 0 0 †Texas 433 734 69.5 528 630 19.3 80 1 -98.8 0 6 †Utah 2 3 50.0 7 9 28.6 0 0 † 0 0 †
Vermont 0 0 † 0 0 † 0 0 † 0 0 †Virginia 8 0 -100.0 15 5 -66.7 2 0 -100.0 2 1 -50.0Washington 24 54 125.0 26 27 3.8 4 4 0.0 0 1 †West Virginia 0 0 † 1 0 -100.0 0 0 † 0 0 †Wisconsin 5 3 -40.0 6 5 -16.7 0 0 † 0 0 †Wyoming 1 0 -100.0 0 2 † 0 0 † 0 0 †
2008–09
% change
% change
2000–01
2008–09
% change
2000–01
2000–01
2008–09
% change
2000–01
2008–09
SOURCE: U.S. Department of Education, National Center for Education Statistics, Integrated Postsecondary Education Data System (IPEDS), Fall 2001 and Fall 2009, Completions component.
† Not applicable.
At least 1 year but less than 2 years
At least 2 years but less than 4 years Advanced1
1Advanced certificates include the post-baccalaureate, post-masters, and first-professional certificate levels.NOTE: Science, technology, engineering, and mathematics fields includes computer and information sciences, engineering and engineering technologies, biological and biomedical sciences, mathematics and statistics, physical sciences, and science technologies. Awards to individuals of Hispanic or Latino ethnicity are included in the Hispanic or Latino category regardless of race.
Table 23d. Number and percentage change in certificates awarded in science, technology, engineering, Table 23e. and mathematics (STEM) fields to Hispanic or Latino students at Title IV institutions, by level Table 23e. of degree and state: Academic years 2000–01 and 2008–09—Continued
State
Level of certificate
Less than 1 year

United States 15,885 12,365 -22.2 15,009 8,211 -45.3 1,173 957 -18.4 708 1,188 67.8
Alabama 203 132 -35.0 88 56 -36.4 0 0 † 0 1 †Alaska 78 5 -93.6 22 46 109.1 0 0 † 0 0 †Arizona 465 589 26.7 217 258 18.9 2 3 50.0 0 0 †Arkansas 443 264 -40.4 1,098 189 -82.8 1 0 -100.0 0 0 †California 2,366 1,122 -52.6 1,456 424 -70.9 41 2 -95.1 59 146 147.5
Colorado 240 306 27.5 369 76 -79.4 0 0 † 252 30 -88.1Connecticut 109 92 -15.6 236 61 -74.2 0 0 † 23 64 178.3Delaware 42 4 -90.5 18 14 -22.2 0 0 † 0 0 †District of Columbia 0 4 † 56 4 -92.9 0 1 † 10 214 2,040.0Florida 122 844 591.8 790 347 -56.1 113 138 22.1 1 2 100.0
Georgia 578 749 29.6 276 163 -40.9 36 156 333.3 0 3 †Hawaii 0 2 † 3 2 -33.3 0 1 † 0 4 †Idaho 14 13 -7.1 73 37 -49.3 74 112 51.4 0 2 †Illinois 858 638 -25.6 617 321 -48.0 0 0 † 7 13 85.7Indiana 105 112 6.7 210 137 -34.8 0 0 † 2 60 2,900.0
Iowa 165 34 -79.4 129 89 -31.0 0 0 † 6 5 -16.7Kansas 289 118 -59.2 203 249 22.7 54 0 -100.0 0 2 †Kentucky 70 1,420 1,928.6 208 131 -37.0 78 1 -98.7 0 15 †Louisiana 355 370 4.2 250 404 61.6 78 0 -100.0 13 1 -92.3Maine 1 0 -100.0 32 24 -25.0 6 0 -100.0 0 1 †
Maryland 83 13 -84.3 334 192 -42.5 51 85 66.7 82 106 29.3Massachusetts 260 239 -8.1 82 120 46.3 79 0 -100.0 17 14 -17.6Michigan 171 397 132.2 486 556 14.4 43 6 -86.0 14 33 135.7Minnesota 506 185 -63.4 671 103 -84.6 106 127 19.8 5 17 240.0Mississippi 0 0 † 11 9 -18.2 2 0 -100.0 0 0 †
Missouri 135 89 -34.1 545 219 -59.8 20 14 -30.0 13 122 838.5Montana 1 0 -100.0 15 9 -40.0 0 0 † 0 0 †Nebraska 157 183 16.6 108 67 -38.0 0 0 † 0 1 †Nevada 2 4 100.0 20 21 5.0 0 9 † 0 0 †New Hampshire 157 19 -87.9 12 1 -91.7 0 0 † 2 1 -50.0
New Jersey 483 83 -82.8 1,774 447 -74.8 108 25 -76.9 33 19 -42.4New Mexico 16 18 12.5 31 108 248.4 7 24 242.9 0 5 †New York 460 96 -79.1 335 159 -52.5 14 0 -100.0 74 105 41.9North Carolina 763 909 19.1 137 157 14.6 0 0 † 6 0 -100.0North Dakota 0 10 † 7 33 371.4 0 0 † 0 0 †See notes at end of table.
At least 2 years but less than 4 years Advanced1
2000–01
2008–09
% change
2000–01
2008–09
% change
National Center for Education StatisticsTable 23e. Number and percentage change in certificates awarded in science, technology, engineering, Table 23d. and mathematics (STEM) fields to White students at Title IV institutions, by level of degree Table 23d. and state: Academic years 2000–01 and 2008–09
State
Level of certificate
Less than 1 yearAt least 1 year but less
than 2 years
2000–01
2008–09
% change
2000–01
2008–09
% change

Ohio 954 633 -33.6 429 558 30.1 0 0 † 0 7 †Oklahoma 70 141 101.4 357 433 21.3 23 148 543.5 0 6 †Oregon 18 78 333.3 53 90 69.8 5 2 -60.0 0 16 †Pennsylvania 3,016 169 -94.4 448 369 -17.6 22 6 -72.7 6 49 716.7Rhode Island 0 0 † 112 19 -83.0 0 0 † 1 0 -100.0
South Carolina 481 380 -21.0 22 13 -40.9 0 0 † 0 3 †South Dakota 0 15 † 8 0 -100.0 28 0 -100.0 0 0 †Tennessee 42 79 88.1 214 169 -21.0 24 47 95.8 0 18 †Texas 825 967 17.2 953 707 -25.8 25 12 -52.0 0 38 †Utah 111 36 -67.6 120 85 -29.2 0 0 † 0 1 †
Vermont 0 0 † 2 0 -100.0 0 0 † 0 0 †Virginia 64 5 -92.2 503 72 -85.7 12 0 -100.0 78 47 -39.7Washington 430 632 47.0 466 290 -37.8 121 38 -68.6 4 12 200.0West Virginia 116 40 -65.5 240 83 -65.4 0 0 † 0 0 †Wisconsin 53 110 107.5 155 69 -55.5 0 0 † 0 5 †Wyoming 8 17 112.5 8 21 162.5 0 0 † 0 0 †
2008–09
% change
% change
2000–01
2008–09
% change
2000–01
2000–01
2008–09
% change
2000–01
2008–09
SOURCE: U.S. Department of Education, National Center for Education Statistics, Integrated Postsecondary Education Data System (IPEDS), Fall 2001 and Fall 2009, Completions component.
† Not applicable.
At least 1 year but less than 2 years
At least 2 years but less than 4 years Advanced1
1Advanced certificates include the post-baccalaureate, post-masters, and first-professional certificate levels.NOTE: Science, technology, engineering, and mathematics fields includes computer and information sciences, engineering and engineering technologies, biological and biomedical sciences, mathematics and statistics, physical sciences, and science technologies. Awards to individuals of Hispanic or Latino ethnicity are included in the Hispanic or Latino category regardless of race.
Table 23e. Number and percentage change in certificates awarded in science, technology, engineering, Table 23d. and mathematics (STEM) fields to White students at Title IV institutions, by level of degree Table 23d. and state: Academic years 2000–01 and 2008–09—Continued
State
Level of certificate
Less than 1 year

United States 2,281 1,392 -39.0 924 960 3.9 49 52 6.1 106 236 122.6
Alabama 5 1 -80.0 0 1 † 0 0 † 0 4 †Alaska 82 0 -100.0 5 4 -20.0 0 0 † 0 0 †Arizona 33 61 84.8 16 26 62.5 0 0 † 0 0 †Arkansas 0 0 † 0 2 † 0 0 † 0 0 †California 382 357 -6.5 223 78 -65.0 9 0 -100.0 5 27 440.0
Colorado 15 51 240.0 18 7 -61.1 0 0 † 49 11 -77.6Connecticut 8 49 512.5 36 44 22.2 0 0 † 8 13 62.5Delaware 13 2 -84.6 0 0 † 0 0 † 0 0 †District of Columbia 0 6 † 12 0 -100.0 0 1 † 0 40 †Florida 7 72 928.6 32 13 -59.4 0 3 † 0 0 †
Georgia 52 40 -23.1 1 11 1,000.0 0 13 † 0 0 †Hawaii 0 0 † 1 0 -100.0 0 0 † 0 0 †Idaho 0 3 † 1 5 400.0 3 2 -33.3 0 0 †Illinois 4 67 1,575.0 17 6 -64.7 0 0 † 0 0 †Indiana 1 14 1,300.0 10 17 70.0 0 0 † 0 1 †
Iowa 5 48 860.0 3 1 -66.7 0 0 † 0 2 †Kansas 18 22 22.2 85 30 -64.7 0 0 † 0 0 †Kentucky 0 118 † 0 3 † 0 0 † 0 0 †Louisiana 0 6 † 1 6 500.0 0 0 † 0 0 †Maine 0 0 † 0 2 † 0 0 † 0 1 †
Maryland 0 7 † 9 30 233.3 4 17 325.0 0 29 †Massachusetts 207 16 -92.3 8 37 362.5 0 0 † 1 7 600.0Michigan 2 42 2,000.0 16 56 250.0 1 1 0.0 1 4 300.0Minnesota 50 4 -92.0 48 2 -95.8 9 1 -88.9 0 0 †Mississippi 0 0 † 1 0 -100.0 0 0 † 0 0 †
Missouri 3 15 400.0 7 8 14.3 0 0 † 5 14 180.0Montana 0 0 † 0 1 † 0 0 † 0 0 †Nebraska 2 2 0.0 0 0 † 0 0 † 0 0 †Nevada 21 0 -100.0 1 1 0.0 0 1 † 0 0 †New Hampshire 36 4 -88.9 1 0 -100.0 0 0 † 5 0 -100.0
New Jersey 52 28 -46.2 64 67 4.7 14 5 -64.3 10 8 -20.0New Mexico 0 10 † 14 10 -28.6 1 5 400.0 0 0 †New York 745 13 -98.3 143 103 -28.0 0 0 † 16 29 81.3North Carolina 16 39 143.8 4 7 75.0 0 0 † 0 0 †North Dakota 0 0 † 0 1 † 0 0 † 0 0 †See notes at end of table.
At least 2 years but less than 4 years Advanced1
2000–01
2008–09
% change
2000–01
2008–09
% change
National Center for Education StatisticsTable 23f. Number and percentage change in certificates awarded in science, technology, engineering, Table 23f. and mathematics (STEM) fields to students of unknown race/ethnicity at Title IV institutions, Table 23f. by level of degree and state: Academic years 2000–01 and 2008–09
State
Level of certificate
Less than 1 yearAt least 1 year but less
than 2 years
2000–01
2008–09
% change
2000–01
2008–09
% change
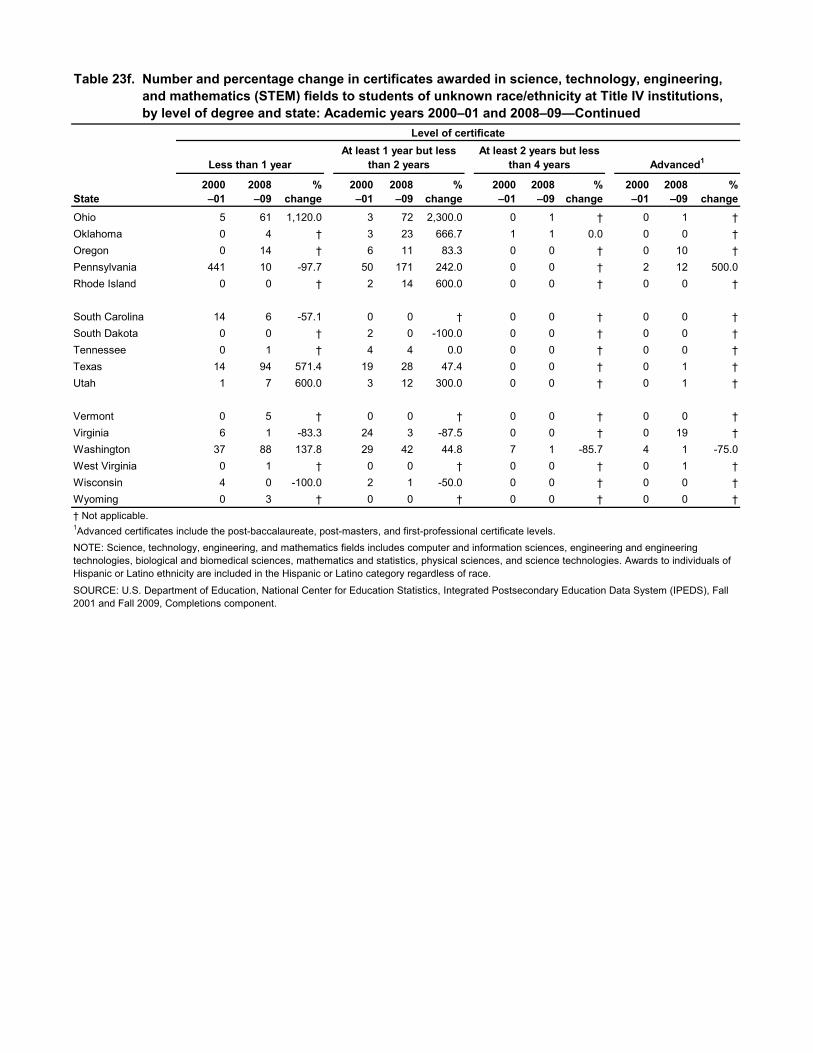
Ohio 5 61 1,120.0 3 72 2,300.0 0 1 † 0 1 †Oklahoma 0 4 † 3 23 666.7 1 1 0.0 0 0 †Oregon 0 14 † 6 11 83.3 0 0 † 0 10 †Pennsylvania 441 10 -97.7 50 171 242.0 0 0 † 2 12 500.0Rhode Island 0 0 † 2 14 600.0 0 0 † 0 0 †
South Carolina 14 6 -57.1 0 0 † 0 0 † 0 0 †South Dakota 0 0 † 2 0 -100.0 0 0 † 0 0 †Tennessee 0 1 † 4 4 0.0 0 0 † 0 0 †Texas 14 94 571.4 19 28 47.4 0 0 † 0 1 †Utah 1 7 600.0 3 12 300.0 0 0 † 0 1 †
Vermont 0 5 † 0 0 † 0 0 † 0 0 †Virginia 6 1 -83.3 24 3 -87.5 0 0 † 0 19 †Washington 37 88 137.8 29 42 44.8 7 1 -85.7 4 1 -75.0West Virginia 0 1 † 0 0 † 0 0 † 0 1 †Wisconsin 4 0 -100.0 2 1 -50.0 0 0 † 0 0 †Wyoming 0 3 † 0 0 † 0 0 † 0 0 †
2008–09
% change
% change
2000–01
2008–09
% change
2000–01
2000–01
2008–09
% change
2000–01
2008–09
SOURCE: U.S. Department of Education, National Center for Education Statistics, Integrated Postsecondary Education Data System (IPEDS), Fall 2001 and Fall 2009, Completions component.
† Not applicable.
At least 1 year but less than 2 years
At least 2 years but less than 4 years Advanced1
1Advanced certificates include the post-baccalaureate, post-masters, and first-professional certificate levels.NOTE: Science, technology, engineering, and mathematics fields includes computer and information sciences, engineering and engineering technologies, biological and biomedical sciences, mathematics and statistics, physical sciences, and science technologies. Awards to individuals of Hispanic or Latino ethnicity are included in the Hispanic or Latino category regardless of race.
Table 23f. Number and percentage change in certificates awarded in science, technology, engineering, Table 23f. and mathematics (STEM) fields to students of unknown race/ethnicity at Title IV institutions, Table 23f. by level of degree and state: Academic years 2000–01 and 2008–09—Continued
State
Level of certificate
Less than 1 year
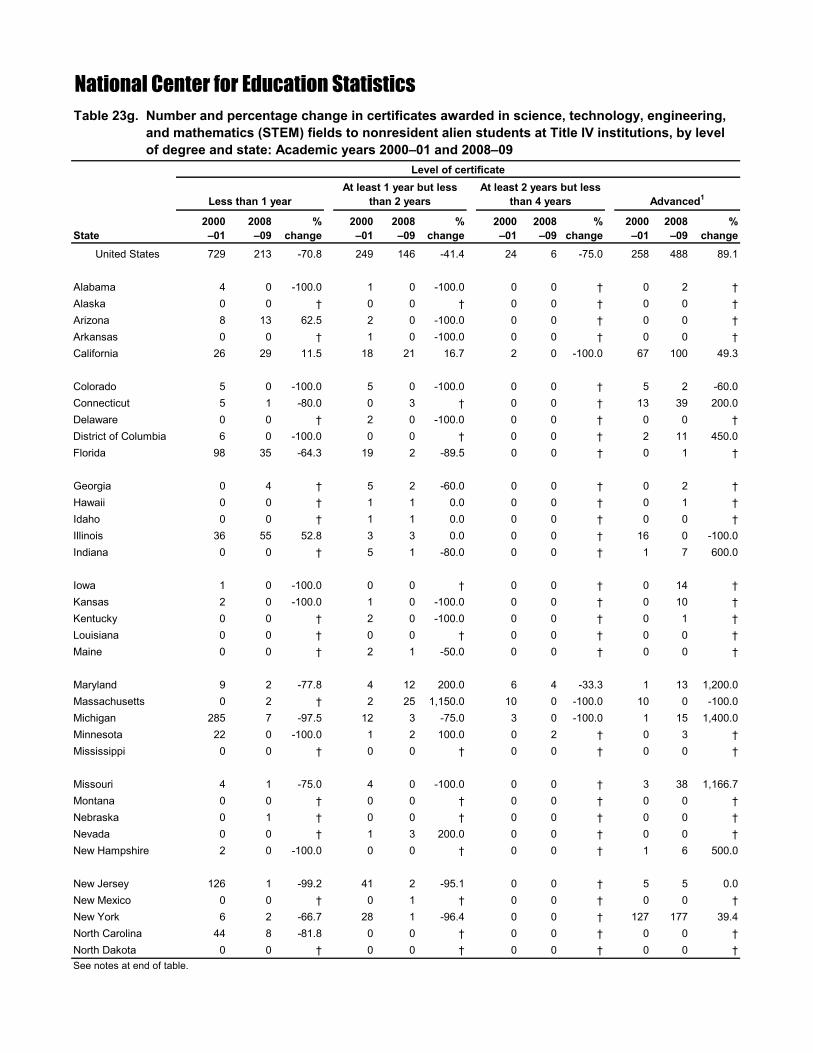
United States 729 213 -70.8 249 146 -41.4 24 6 -75.0 258 488 89.1
Alabama 4 0 -100.0 1 0 -100.0 0 0 † 0 2 †Alaska 0 0 † 0 0 † 0 0 † 0 0 †Arizona 8 13 62.5 2 0 -100.0 0 0 † 0 0 †Arkansas 0 0 † 1 0 -100.0 0 0 † 0 0 †California 26 29 11.5 18 21 16.7 2 0 -100.0 67 100 49.3
Colorado 5 0 -100.0 5 0 -100.0 0 0 † 5 2 -60.0Connecticut 5 1 -80.0 0 3 † 0 0 † 13 39 200.0Delaware 0 0 † 2 0 -100.0 0 0 † 0 0 †District of Columbia 6 0 -100.0 0 0 † 0 0 † 2 11 450.0Florida 98 35 -64.3 19 2 -89.5 0 0 † 0 1 †
Georgia 0 4 † 5 2 -60.0 0 0 † 0 2 †Hawaii 0 0 † 1 1 0.0 0 0 † 0 1 †Idaho 0 0 † 1 1 0.0 0 0 † 0 0 †Illinois 36 55 52.8 3 3 0.0 0 0 † 16 0 -100.0Indiana 0 0 † 5 1 -80.0 0 0 † 1 7 600.0
Iowa 1 0 -100.0 0 0 † 0 0 † 0 14 †Kansas 2 0 -100.0 1 0 -100.0 0 0 † 0 10 †Kentucky 0 0 † 2 0 -100.0 0 0 † 0 1 †Louisiana 0 0 † 0 0 † 0 0 † 0 0 †Maine 0 0 † 2 1 -50.0 0 0 † 0 0 †
Maryland 9 2 -77.8 4 12 200.0 6 4 -33.3 1 13 1,200.0Massachusetts 0 2 † 2 25 1,150.0 10 0 -100.0 10 0 -100.0Michigan 285 7 -97.5 12 3 -75.0 3 0 -100.0 1 15 1,400.0Minnesota 22 0 -100.0 1 2 100.0 0 2 † 0 3 †Mississippi 0 0 † 0 0 † 0 0 † 0 0 †
Missouri 4 1 -75.0 4 0 -100.0 0 0 † 3 38 1,166.7Montana 0 0 † 0 0 † 0 0 † 0 0 †Nebraska 0 1 † 0 0 † 0 0 † 0 0 †Nevada 0 0 † 1 3 200.0 0 0 † 0 0 †New Hampshire 2 0 -100.0 0 0 † 0 0 † 1 6 500.0
New Jersey 126 1 -99.2 41 2 -95.1 0 0 † 5 5 0.0New Mexico 0 0 † 0 1 † 0 0 † 0 0 †New York 6 2 -66.7 28 1 -96.4 0 0 † 127 177 39.4North Carolina 44 8 -81.8 0 0 † 0 0 † 0 0 †North Dakota 0 0 † 0 0 † 0 0 † 0 0 †See notes at end of table.
At least 2 years but less than 4 years Advanced1
2000–01
2008–09
% change
2000–01
2008–09
% change
National Center for Education StatisticsTable 23g. Number and percentage change in certificates awarded in science, technology, engineering, Table 23g. and mathematics (STEM) fields to nonresident alien students at Title IV institutions, by level Table 23g. of degree and state: Academic years 2000–01 and 2008–09
State
Level of certificate
Less than 1 yearAt least 1 year but less
than 2 years
2000–01
2008–09
% change
2000–01
2008–09
% change

Ohio 2 0 -100.0 9 1 -88.9 0 0 † 0 3 †Oklahoma 0 2 † 4 2 -50.0 0 0 † 0 3 †Oregon 1 1 0.0 2 1 -50.0 0 0 † 0 3 †Pennsylvania 3 1 -66.7 3 0 -100.0 0 0 † 0 10 †Rhode Island 0 0 † 0 0 † 0 0 † 0 0 †
South Carolina 13 0 -100.0 0 0 † 0 0 † 0 1 †South Dakota 0 0 † 1 0 -100.0 0 0 † 0 0 †Tennessee 0 0 † 0 0 † 0 0 † 0 6 †Texas 15 28 86.7 39 46 17.9 0 0 † 0 8 †Utah 0 0 † 2 0 -100.0 0 0 † 0 0 †
Vermont 0 0 † 0 0 † 0 0 † 0 0 †Virginia 0 0 † 1 0 -100.0 0 0 † 6 7 16.7Washington 6 20 233.3 26 12 -53.8 3 0 -100.0 0 0 †West Virginia 0 0 † 0 0 † 0 0 † 0 0 †Wisconsin 0 0 † 0 0 † 0 0 † 0 0 †Wyoming 0 0 † 1 0 -100.0 0 0 † 0 0 †
2008–09
% change
% change
2000–01
2008–09
% change
2000–01
2000–01
2008–09
% change
2000–01
2008–09
SOURCE: U.S. Department of Education, National Center for Education Statistics, Integrated Postsecondary Education Data System (IPEDS), Fall 2001 and Fall 2009, Completions component.
† Not applicable.
At least 1 year but less than 2 years
At least 2 years but less than 4 years Advanced1
1Advanced certificates include the post-baccalaureate, post-masters, and first-professional certificate levels.NOTE: Science, technology, engineering, and mathematics fields includes computer and information sciences, engineering and engineering technologies, biological and biomedical sciences, mathematics and statistics, physical sciences, and science technologies. Awards to individuals of Hispanic or Latino ethnicity are included in the Hispanic or Latino category regardless of race.
Table 23g. Number and percentage change in certificates awarded in science, technology, engineering, Table 23g. and mathematics (STEM) fields to nonresident alien students at Title IV institutions, by level Table 23g. of degree and state: Academic years 2000–01 and 2008–09—Continued
State
Level of certificate
Less than 1 year

United States 918 99,748 13,620 13.7 1,237 185,444 10,333 5.6
Alabama 18 2,519 395 15.7 15 2,730 223 8.2Alaska 1 21 0 0.0 1 12 0 0.0Arizona 18 2,603 162 6.2 28 1,580 12 0.8Arkansas 11 911 88 9.7 11 421 8 1.9California 133 23,340 4,058 17.4 154 28,662 1,388 4.8
Colorado 9 1,619 560 34.6 27 11,891 875 7.4Connecticut 8 329 36 10.9 15 998 1 0.1Delaware 1 110 39 35.5 4 527 0 0.0District of Columbia 4 536 161 30.0 6 378 62 16.4Florida 48 4,776 1,015 21.3 114 16,031 757 4.7
Georgia 23 3,900 324 8.3 30 5,234 358 6.8Hawaii 6 481 24 5.0 3 37 18 48.6Idaho 3 51 0 0.0 7 378 13 3.4Illinois 38 2,054 820 39.9 48 14,838 584 3.9Indiana 10 374 37 9.9 22 1,571 157 10.0
Iowa 7 171 17 9.9 8 381 1 0.3Kansas 10 3,726 212 5.7 11 518 11 2.1Kentucky 22 4,044 323 8.0 14 664 78 11.7Louisiana 19 1,886 259 13.7 22 2,830 60 2.1Maine 7 111 0 0.0 3 219 0 0.0
Maryland 12 407 73 17.9 14 1,748 166 9.5Massachusetts 14 910 272 29.9 22 3,384 168 5.0Michigan 25 2,973 162 5.4 39 4,009 402 10.0Minnesota 24 1,811 134 7.4 26 2,604 165 6.3Mississippi 7 146 1 0.7 9 902 20 2.2
Missouri 37 744 40 5.4 36 4,115 203 4.9Montana 5 229 0 0.0 2 133 0 0.0Nebraska 2 149 90 60.4 4 689 0 0.0Nevada 5 369 0 0.0 18 2,857 17 0.6New Hampshire 5 1,148 138 12.0 10 1,096 35 3.2
New Jersey 21 2,620 626 23.9 29 4,083 443 10.8New Mexico 9 332 35 10.5 4 241 0 0.0New York 51 7,015 834 11.9 43 11,395 684 6.0North Carolina 12 501 4 0.8 31 3,836 149 3.9North Dakota 0 0 0 † 4 211 0 0.0
% all STEM fields
See notes at end of table.
National Center for Education Statistics
Entering IPEDS universe after 2001–022
Institutions
Awards
State
Leaving IPEDS universe before 2009–101
Institutions
Awards
Table 24. Number of institutions, awards conferred, and awards conferred in science, technology, Table 24. engineering, and mathematics (STEM) fields at Title IV institutions leaving or entering the Table 24. IPEDS universe, by state: Collection years 2001–02 and 2009–10
TotalAll STEM
fields3% all
STEM fields TotalAll STEM
fields3

Ohio 31 5,255 155 2.9 64 6,502 518 8.0Oklahoma 12 903 53 5.9 20 972 110 11.3Oregon 9 705 96 13.6 9 923 2 0.2Pennsylvania 77 6,607 946 14.3 35 6,950 576 8.3Rhode Island 5 236 0 0.0 4 924 0 0.0
South Carolina 4 643 0 0.0 23 1,953 80 4.1South Dakota 2 156 1 0.6 2 83 0 0.0Tennessee 13 1,109 31 2.8 33 3,233 77 2.4Texas 53 6,283 736 11.7 93 17,505 964 5.5Utah 7 679 88 13.0 27 2,406 143 5.9
Vermont 4 62 0 0.0 3 36 0 0.0Virginia 34 1,117 172 15.4 31 3,122 320 10.2Washington 22 2,012 118 5.9 21 2,249 97 4.3West Virginia 13 424 164 38.7 13 4,341 139 3.2Wisconsin 5 522 121 23.2 23 2,918 249 8.5Wyoming 2 119 0 0.0 2 124 0 0.0† Not applicable.
TotalAll STEM
fields3% all
STEM fields TotalAll STEM
fields3% all
STEM fields
SOURCE: U.S. Department of Education, National Center for Education Statistics, Integrated Postsecondary Education Data System (IPEDS), Fall 2001 and Fall 2009, Completions component.
Institutions
Awards
2Institutions included in the IPEDS universe in 2009-10 that are new, became newly accredited, became newly eligible for Title IV funding, or were restored to Title IV eligibility since 2001-02.3Science, technology, engineering, and mathematics fields include computer and information sciences, engineering and engineering technologies, biological and biomedical sciences, mathematics and statistics, physical sciences, and science technologies.
Table 24. Number of institutions, awards conferred, and awards conferred in science, technology, Table 24. engineering, and mathematics (STEM) fields at Title IV institutions leaving or entering the Table 24. IPEDS universe, by state: Academic years 2001–02 and 2009–10—Continued
State
Leaving IPEDS universe before 2009–101 Entering IPEDS universe after 2001–022
Institutions
Awards
NOTE: Awards conferred include both degrees and certificates.
1Institutions included in the IPEDS universe in 2001-02 that closed, lost Title IV eligibility, or lost accreditation as of 2009-10.

GLOSSARY G1
Glossary All of the variables that were used in these tables are described in this glossary. The variables were taken directly from IPEDS data collected dur-ing the 2009-10 data collection and during the 2001-02 data collection. These data are available for download via the IPEDS Data Center at http://nces.ed.gov/IPEDS/DataCenter. In the glossary, the items are listed in alphabetical order by the variable label. The name of each variable appears to the right of the variable label.
Glossary All of the variables that were used in these tables are described in this glossary. The variables were taken directly from IPEDS data collected during the 2009-10 data collection. These data are available for download via the IPEDS Data Center (http://nces.ed.gov/IPEDS/DataCenter). In the glossary, the items are listed in alphabetical order by the variable label. The name of each variable ap-pears to the right of the variable label.
LABEL VARIABLE NAME
American Indian or Alaska Native award count DVCAIT (2009–10) CRACE19 (2001–02) The count of degrees or certificates awarded to students that self identify as having origins in any of the original peoples of North and South America (including Cen-tral America) who maintain cultural identification through tribal affiliation or com-munity attachment.
Asian, Native Hawaiian, or Other Pacific Islander DVCAPT (2009–10) award count CRACE20 (2001–02)
The count of degrees or certificates awarded to students that self identify as having origins in any of the original peoples of the Far East, Southeast Asia, or the Indian Subcontinent, including, for example, Cambodia, China, India, Japan, Korea, Malay-sia, Pakistan, the Philippine Islands, Thailand, and Vietnam, or in any of the original peoples of Hawaii, Guam, Samoa, or other Pacific Islands.
Award count for men CTOTLM (2009–10) CRACE15 (2001–02) The count of degrees or certificates awarded to students that are men.
Award count for women CTOTLW (2009–10) CRACE16 (2001–02) The count of degrees or certificates awarded to students that are women.
Black or African American award count DVCBKT (2009–10) CRACE18 (2001–02) The count of degrees or certificates awarded to students that self identify as having origins in any of the black racial groups of Africa.
Classification of Instructional Programs Code CIPCODE The 2000 version of the Classification of Instructional Programs (CIP) Code is a nu-meric code indicating the major program of study for each degree or certificate re-ported in the Completions component. For this set of Web Tables, the CIP code was used to classify awards as science, technology, engineering, and mathematics (STEM) field awards. The full list of CIP codes can be viewed at http://nces.ed.gov/pubs2002/cip2000/ciplist.asp.
Hispanic or Latino award count DVCHST (2009–10) CRACE21 (2001–02) The count of degrees or certificates awarded to students that self identify as being of Cuban, Mexican, Puerto Rican, South or Central American, or other Spanish cul-ture or origin, regardless of race.
Level of award AWLEVEL This variable indicates the level of the degree or certificate awarded to a student in a particular field of study. The values are as follows:
Less-than-1-year certificate At-least-1-but-less-than-2-year certificate Associate’s degree At-least-2-but-less-than-4-year certificate Bachelor’s degree Post-baccalaureate certificate

LABEL VARIABLE NAME
Level of award—continued AWLEVEL Master’s degree Post-master’s certificate Doctor’s degree First-professional degree First-professional certificate Doctor’s degree—research/scholarship Doctor’s degree—professional practice Doctor’s degree—other
Nonresident alien award count CNRALT (2009–10) CRACE17 (2001–02) The count of degrees or certificates awarded to students who are not citizens or nationals of the United States and who are in this country on a visa or temporary basis and do not have the right to remain indefinitely.
Race/ethnicity unknown award count CUNKNT (2009–10) CRACE23 (2001–02) The count of degrees or certificates awarded to students that did not select a ra-cial/ethnic designation, and who the postsecondary institution finds it impossible to place into one of the racial/ethnic categories during established enrollment pro-cedures or in any post-enrollment identification or verification process.
Science, technology, engineering, and mathematics (STEM) fields CIPCODE
The list of programs included in STEM was selected from the Immigration and Cus-toms Enforcement (ICE) list of programs approved for the STEM extension of op-tional practical training. The ICE list can be viewed at http://www.ice.gov/sevis/stemlist.htm.
Title IV postsecondary institution indicator PSET4FLG The purpose of this indicator is to make it easy to select institutions in the IPEDS universe. The categories in use with this indicator are as follows:
Title IV postsecondary institution Non-Title IV postsecondary institution Title IV not primarily postsecondary institution Non-Title IV not primarily postsecondary institution Non-Title IV postsecondary institution that is not open to the public Institution is not active in the current universe
Two or More Races award count C2MORT (2009-10) The count of degrees or certificates awarded to students that selected more than one race during self identification.
White award count DVCWHT (2009–10) CRACE22 (2001–02) The count of degrees or certificates awarded to students that self identify as having origins in any of the original peoples of Europe, the Middle East, or North Africa.
GLOSSARY G2
Glossary All of the variables that were used in these tables are described in this glossary. The variables were taken directly from IPEDS data collected during the 2009-10 data collection. These data are available for download via the IPEDS Data Center (http://nces.ed.gov/IPEDS/DataCenter). In the glossary, the items are listed in alphabetical order by the variable label. The name of each variable ap-pears to the right of the variable label.

GLOSSARY G2 www.ed.gov ies.ed.gov