Embed Size (px)
Citation preview

WEB TABLES
Advanced Placement, International Baccalaureate,
and Dual-Enrollment Courses: Availability, Participation, and
Related Outcomes for 2009 Ninth-Graders: 2013
U.S. DEPARTMENT OF EDUCATION AUGUST 2019 NCES 2019-430
This report was prepared for the National Center for Education Statistics under Contract No. ED-IES-12-C-0095 with RTI International. Mention of trade names, commercial products, or organizations does not imply endorsement by the U.S. Government. These Web Tables were authored by Laura Burns and Katherine Leu of RTI International. The NCES Project Officer was Elise Christopher. For questions about content or to view this report online, go to https://nces.ed.gov/pubsearch/pubsinfo.asp?pubid=2019430.
Advanced Placement (AP), International
Baccalaureate (IB), and dual-enrollment
courses are generally regarded as
academically rigorous courses for high
school students. These courses have
seen a surge in enrollment between
2003 and 2013 (College Board 2014;
International Baccalaureate Organization
2008, 2013; Kleiner and Lewis 2005;
Marken, Gray, and Lewis 2013). AP
offers college-level courses developed
by the College Board and taught by
high school teachers at participating
secondary schools in the United States.
High school students who perform well
on an AP subject exam may earn college
credits or skip lower level courses at
U.S. postsecondary institutions where
they later enroll (College Board 2016).
Students who take IB courses,
developed by the International
Baccalaureate Organization, often get
these same benefits, but those who
complete all courses and components
of the IB diploma curriculum are also
granted an internationally recognized
diploma (International Baccalaureate
Organization 2012).
Whereas AP and IB courses are high
school courses that cover college-level
material, dual-enrollment courses (also
referred to as dual credit) are college
courses. Upon successful completion of
dual-enrollment courses, high school
students may earn high school credits
as well as college credits that appear on
a postsecondary transcript (An and
Taylor 2019). Some high schools have
formal dual-enrollment programs that
provide guidelines for participation and
may offer courses on site. Other high
schools do not have formal programs
but may grant high school credit for
college credits earned by students who
enroll in college courses on their own.
These Web Tables provide the most
recent national statistics on the
availability of these academically
rigorous courses and programs, the
percentage of graduates who earn high
school credits in them, and the
postsecondary outcomes of students
who earned varying numbers of such
credits. They use nationally representative
survey and transcript data collected
through the High School Longitudinal
Study of 2009 (HSLS:09), conducted by
the U.S. Department of Education’s
National Center for Education Statistics
(NCES).
The total number of credits earned in
AP, IB, and dual-enrollment courses can
only be determined with confidence
for HSLS:09 students with complete
transcript data; therefore, the estimates
in these tables are based on the
79 percent of students who both had
received a high school diploma before
September 2013, when the high school
transcript data collection began, and
had complete transcript data. Also, AP
and IB courses are combined in these

2
estimates because IB courses have
relatively small enrollment and many
colleges and universities treat entering
students who have successfully
completed AP and IB courses similarly;
that is, they may award college credit
to these students, place them in higher
level courses, or both.
The first four tables show the availability
of AP courses, IB courses, and dual-
enrollment programs (as opposed to
dual-enrollment courses) to students
with different demographic and social
characteristics and in different school
settings. Estimates in these tables
reflect the offerings of the 9th-graders’
base-year schools as reported by their
counselors at the time of the first
follow-up data collection in the spring
term of 2012 when most sample
members were 11th-graders. First
follow-up data are the most useful
HSLS:09 data on AP, IB, and dual-
enrollment offerings because most
students take these courses after the
ninth grade, and the first follow-up
counselor survey has more contextual
data on offerings than the base-year
counselor survey does. These four
tables include only students with
complete transcripts who received
their high school diplomas before
September 2013 from the schools they
attended in the fall term of 2009 as
ninth-grade students (68 percent of
2009 ninth-graders). This is because
only counselors at those schools were
administered the counselor survey; the
first follow-up did not administer
counselor surveys in schools to which
students moved after the fall term of
ninth grade. Tables 5–14, however,
include students who transferred to
other schools after the fall term of
ninth grade. Table 15 shows the
characteristics of the following
inference populations: (1) all fall-term
2009 ninth-grade students, (2) fall-term
2009 ninth-grade students who
received a diploma before September
2013, (3) fall-term 2009 ninth-grade
students who received a diploma
before September 2013 and had a
complete transcript (tables 5–14), and
(4) fall-term 2009 ninth-grade students
who received a diploma from their
ninth-grade school before September
2013 and had a complete transcript
(tables 1–4).
Tables 5–7 present the percentage of
high school graduates who earned
credits in AP, IB, and dual-enrollment
courses, both overall and disaggregated
by selected student and parent
characteristics, including race/ethnicity
and socioeconomic status. Tables 8–11
show standardized assessment scores
of students with selected characteristics.
Table 8 presents the percentage of
AP test takers who scored 3 points or
above on a 5-point scale (usually
considered a passing score by
postsecondary institutions) on
selected AP exams. Tables 9–11
present college admissions test scores
by the number and type of credits
(i.e., AP, IB, or dual-enrollment)
students earned and whether they
took a dual-enrollment course on a
college campus.
Tables 12–14 show the percentage of
high school graduates who reported
enrolling in an associate’s or bachelor’s
degree program in the fall of 2013,
disaggregated by the number and type
of credits (i.e., AP, IB, or dual-enrollment)
students earned, whether they took a
dual-enrollment course on a college
campus, and selected student and
parent characteristics.
RELATED NCES REPORTS Dual Enrollment: Participation and
Characteristics (NCES 2019-176).
https://nces.ed.gov/pubsearch/
pubsinfo.asp?pubid=2019176.
High School Longitudinal Study of 2009
(HSLS:09) 2013 Update and High School
Transcript Study: A First Look at Fall 2009
Ninth-Graders in 2013 (NCES 2015-037rev).
https://nces.ed.gov/pubsearch/
pubsinfo.asp?pubid=2015037rev.
High School Longitudinal Study of 2009
(HSLS:09) 2013 Update and High School
Transcript Data File Documentation
(NCES 2015-036).
https://nces.ed.gov/pubsearch/
pubsinfo.asp?pubid=2015036.
Dual Enrollment Programs and
Courses for High School Students at
Postsecondary Institutions: 2010–11
(NCES 2013-002).
https://nces.ed.gov/pubsearch/
pubsinfo.asp?pubid=2013002.
Dual Credit and Exam-Based Courses in
U.S. Public High Schools: 2010–11
(NCES 2013-001).
https://nces.ed.gov/pubsearch/
pubsinfo.asp?pubid=2013001.

3
Dual Credit and Exam-Based Courses in
U.S. Public High Schools: 2002–03
(NCES 2005-009).
https://nces.ed.gov/pubsearch/
pubsinfo.asp?pubid=2005009.
Dual Enrollment of High School Students
at Postsecondary Institutions: 2002–03
(NCES 2005-008).
https://nces.ed.gov/pubsearch/
pubsinfo.asp?pubid=2005008.
DATA The estimates presented in these
Web Tables are based on nationally
representative data from HSLS:09, a
study that is conducted by NCES and
follows more than 23,000 students who
were ninth-graders in 944 public and
private high schools in 2009. HSLS:09
is primarily focused on students’
trajectories from the beginning of
high school into postsecondary
education, the workforce, and beyond,
including data on the courses, majors,
and careers that students pursue. The
study pays particular attention to
students’ experience in science,
technology, engineering, and
mathematics fields.
Data were collected via surveys of
students, their parents, math and
science teachers, school administrators,
and school counselors in the ninth-
grade year (2009) and first follow-up
year (2012). In both years, student
assessments in algebraic skills,
reasoning, and problem solving were
administered, providing information
on students’ math performance.
In 2013, when most sample members
had recently graduated from high
school, an update survey (referred to as
the 2013 Update) was administered to
sample members or their parents.
Also in 2013, the HSLS:09 High School
Transcript Collection collected
transcripts from all high schools the
students had attended, including
schools to which they had transferred
since they were sampled in 2009. For an
overview of the survey methodology
used for the HSLS:09 High School
Transcript Collection, see the High
School Longitudinal Study of 2009
(HSLS:09) 2013 Update and High School
Transcripts Data File Documentation
(Ingels et al. 2015).
ANALYSIS The estimates in all tables were
calculated using data contained in the
High School Longitudinal Study of 2009
(HSLS:09) 2013 Update and High School
Transcripts Restricted-use Data File
(U.S. Department of Education 2015).
The estimates and standard errors in
these Web Tables were generated
using Stata. Variance estimates were
computed using the balanced repeated
replication method to account for
HSLS:09’s complex sampling design.
All estimates were generated using the
sample weight W3W1W2STUTR and
replicate weights W3W1W2STUTR001–
W3W1W2STUTR200. The Stata
programs that generate the estimates
in these tables are available from
https://nces.ed.gov/pubsearch/
pubsinfo.asp?pubid=2019430.
The analysis sample included all 2009
ninth-graders who had graduated
from high school by September 2013
and, to ensure accurate estimates of
graduates’ coursetaking, had
complete transcript data. The variable
X3TOUTCOME identified students who
had earned high school diplomas by
September 2013. Graduates with
complete transcript data met two
criteria: they had earned at least
16 Carnegie credits (indicated by the
variable X3TCREDTOT) and had
transcript records for each grade or
academic year of high school. For
students who received their diplomas
between the fall of 2012 and the
summer of 2013, the variable
X3TCOVERAGE was used to indicate
transcript coverage in all four grades
or academic years. Graduates who
received their diplomas before the
2012–13 academic year did not have
four years of high school attendance.
Therefore, for these early graduates,
transcripts covering each of the first
three academic years (X3TSTATYR09,
X3TSTATYR10, and X3TSTATYR11) or
each of the first three high school
grades (X3TSTATGR09, X3TSTATGR10,
and X3TSTATGR11) were required to
be included in the analysis sample.
For more information, contact
(800) 677-6987
For readers with disabilities, a
Section 508-compliant version of
these Web Tables is available at
https://nces.ed.gov/pubsearch/
pubsinfo.asp?pubid=2019430.

4
REFERENCES An, B.P., and Taylor, J.L. (2019).
A Review of Empirical Studies on
Dual Enrollment: Assessing
Educational Outcomes. In M.B.
Paulsen and L.W. Perna (Eds.), Higher
Education: Handbook of Theory and
Research, vol. 34 (pp. 99–151).
Switzerland: Springer Nature.
College Board. (2014). The 10th
Annual AP Report to the Nation.
Retrieved June 5, 2019, from
https://secure-media.collegeboard.org/
digitalServices/pdf/ap/rtn/10th-
annual/10th-annual-ap-report-to-the-
nation-single-page.pdf.
College Board. (2016). AP Program Guide
2016-17. Retrieved June 5, 2019, from
https://secure-media.collegeboard.org/
digitalServices/pdf/ap/ap-program-
guide-2016-17.pdf.
Ingels, S.J., Pratt, D.J., Herget, D., Bryan, M.,
Fritch, L.B., Ottem, R., Rogers, J.E., and
Wilson, D. (2015). High School
Longitudinal Study of 2009 (HSLS:09)
2013 Update and High School
Transcript Data File Documentation
(NCES 2015-036). U.S. Department of
Education. Washington, DC: National
Center for Education Statistics.
Retrieved June 5, 2019, from
https://nces.ed.gov/pubs2015/
2015036.pdf.
International Baccalaureate Organization.
(2008). Examination Review & Data
Summary 2008: Profile of Diploma
Programme Test Takers.
Retrieved June 5, 2019, from
https://www.ibo.org/contentassets/
8711842fb1bf4aa88684c8f7769a508d/
2008datasum.pdf.
VARIABLES USED
The variables used in these Web Tables are listed below.
Label Name
Student’s sex (2009) X1SEX
Student’s race/ethnicity (2009) X1RACE
Student’s native language (2009) X1DUALLANG
Parents’ socioeconomic status (2009) X1SESQ5
Parents’ highest level of education (2009) X1PAREDU
Student’s educational expectations (2009) X1STUEDEXPCT
Student’s mathematics achievement (2009) X1TXMQUINT
Student’s school sector (2012) Derived from A2SCHTYPE and X2CONTROL
Student’s school region (2012) X2REGION
Student’s school locale (2012) X2LOCALE
Student’s school size (2012) A2HSSIZE
Student’s school percentage of students who received free or reduced-price lunch (2012) A2FREELUNCH
Student’s school percentage of students who were non-Hispanic Black or African American, non-Hispanic American Indian or Alaska Native, and Hispanic or Latino students of any race (2009)
Derived from A1ASIANPISTU,
A1BLACKSTU, A1HISPSTU, A1WHITESTU, and A1AMINDIANSTU
Student’s school percentage of English language learners (2012) A2ELL
High school from which student received diploma (2013) Derived from T3SNCESID, X1NCESID, and T3SSCHTYPE
Student’s school offered AP courses (2012) C2HAAPCRS
Student’s school offered IB courses (2012) C2HAIBPRGM
Student’s school offered dual-enrollment program (2012) C2DUALPROG
Number of AP or higher level IB math courses offered (2012)
Derived from C2NUMAPMATH and
C2NUMIBMATH
Number of AP or higher level IB science courses offered (2012)
Derived from C2NUMAPSCI and C2NUMIBSCI
Dual-enrollment program has option to complete certificate program (2012) C2DUALCERT
Dual-enrollment program has option to complete associate’s degree (2012) C2DUALAA
Students accepted to partner college through dual-enrollment program (2012) C2DUALCLGACC
Dual-enrollment courses may be taken for credit at community colleges (2012) C2COMCOL
Dual-enrollment courses may be taken for credit at 4-year colleges and universities (2012) C24YRCOL
(continued)

5
International Baccalaureate Organization.
(2012). The IB Diploma Programme.
Retrieved June 5, 2019, from
https://ibo.org/globalassets/
publications/become-an-ib-
school/ibdp_en.pdf.
International Baccalaureate Organization.
(2013). The IB Diploma Statistical
Bulletin: May 2013 Examination Session.
Retrieved June 5, 2019, from
https://www.ibo.org/contentassets/
bc850970f4e54b87828f83c7976a4db6/
2013-maydpstatisticalbulletin.pdf.
Kleiner, B., and Lewis, L. (2005). Dual
Enrollment of High School Students at
Postsecondary Institutions: 2002–03
(NCES 2005–008). U.S. Department of
Education. Washington, DC: National
Center for Education Statistics.
Retrieved June 5, 2019, from
https://nces.ed.gov/pubs2005/
2005008.pdf.
Marken, S., Gray, L., and Lewis, L. (2013).
Dual Enrollment Programs and Courses
for High School Students at
Postsecondary Institutions: 2010–11
(NCES 2013-002). U.S. Department of
Education. Washington, DC: National
Center for Education Statistics.
Retrieved June 5, 2019, from
https://nces.ed.gov/pubs2013/
2013002.pdf.
U.S. Department of Education, National
Center for Education Statistics. (2015).
High School Longitudinal Study of 2009
(HSLS:09) 2013 Update and High School
Transcripts Restricted-use Data File
(NCES 2015038). Retrieved May 24, 2019, from
https://nces.ed.gov/pubsearch/
pubsinfo.asp?pubid=2015038.
VARIABLES—Continued
Label Name
Student earned any credits in AP or IB courses (2013) X3TCREDAPIB
Student earned any credits in dual-enrollment courses (2013) X3TCREDPPSE
Number of credits student earned in AP or IB courses (continuous) (2013) X3TCREDAPIB
Number of credits student earned in dual-enrollment courses (continuous) (2013) X3TCREDPPSE
Student’s score on AP Calculus AB exam (2013) X3TXAPCALCAB
Student’s score on AP Biology exam (2013) X3TXAPBIO
Student’s score on AP English literature and composition exam (2013) X3TXAPENGLIT
Student’s score on AP U.S. History exam (2013) X3TXAPUSHIST
Student’s college entrance exam score on the SAT scale (2013) X3TXSATCOMP
Student earned any dual-enrollment credits on college campus or off college campus only (2013)
Derived from T3SLOC and T3SCRDTYP
Student’s enrollment in associate’s or bachelor’s degree program in fall of 2013 (2013)
Derived from X3CLASSES and X3PROGLEVEL

National Center for Education Statistics
Selected student and parent characteristics
School offered AP courses,
IB courses, or a dual-enrollment
program1AP or IB courses
Dual-enrollment
program2
AP or IB courses and
dual-enrollment program3
Total 99.7 91.8 88.8 80.8
Student’s sex (2009)Female 99.7 91.4 89.2 80.9Male 99.7 92.1 88.4 80.7
Student’s race/ethnicity (2009)4
Asian 100.0 5 95.8 78.4 74.2Black/African American 100.0 5 92.3 88.1 80.3Hispanic/Latino 99.9 94.9 88.1 83.1Other 99.1 93.4 91.4 85.7White 99.7 90.0 89.6 79.8
Student’s native language (2009)English 99.7 90.8 88.7 79.8English and a non-English language 99.8 95.3 86.0 81.6Non-English 100.0 5 97.2 90.8 88.1
Parents’ socioeconomic status (2009)6
Lowest fifth 99.6 90.3 91.1 81.8Middle three-fifths 99.8 91.1 90.6 81.9Highest fifth 99.8 94.3 83.0 77.4
Parents’ highest level of education (2009)High school credential or less 99.6 90.6 91.3 82.2Undergraduate degree 99.8 91.5 88.4 80.0Graduate degree 99.8 94.8 82.6 77.5
Student’s educational expectations (2009) High school credential 99.6 90.0 90.5 80.8Undergraduate degree 99.7 92.3 91.3 83.9Graduate degree 99.8 92.7 86.7 79.5Don’t know 99.8 90.1 89.7 80.0
Student’s mathematics achievement (2009)7
Lowest fifth 99.4 89.2 92.7 82.5Middle three-fifths 99.7 91.5 89.8 81.6Highest fifth 100.0 5 93.8 84.1 77.9
Offered by student’s school
Table 1. Among fall 2009 ninth-graders who received a high school diploma from their ninth-grade school by the fall of 2013, percentage whose school offered Advanced Placement (AP) courses, International Baccalaureate (IB) courses, and/or a dual-enrollment program, by selected student and parent characteristics: 2013
See notes at end of table.
– 6 –

National Center for Education Statistics
Selected student and parent characteristics
School offered AP courses,
IB courses, or a dual-enrollment
program1AP or IB courses
Dual-enrollment
program2
AP or IB courses and
dual-enrollment program3
Student’s school sector (2012) Public 99.9 92.0 91.7 83.9
Regular 99.9 92.1 91.9 84.2Charter or special-program school 100.0 5 94.0 86.1 79.7Career/technical/vocational or alternative school 99.5 81.0 ! 99.5 81.0 !
Private 99.1 90.0 54.3 44.8
Student’s school region (2012)Northeast 100.0 5 94.9 84.9 79.8Midwest 99.3 84.8 91.1 76.7South 99.9 92.6 93.7 86.3West 100.0 5 95.7 81.4 77.1
Student’s school locale (2012)City 100.0 5 97.4 83.3 80.6Suburb 99.7 96.8 89.1 86.2Town 100.0 5 84.9 97.8 82.8Rural 99.7 84.8 90.3 75.4
Student’s school size (2012) Fewer than 500 students 98.4 64.9 87.1 53.6500 to 1,199 students 100.0 5 92.8 88.6 81.31,200 or more students 100.0 5 99.0 89.6 88.6
Student’s school percentage of students who received free or reduced-price lunch (2012)8
Lowest fifth (0–18 percent of students) 99.7 93.7 73.1 66.9Middle three-fifths (19–67 percent of students) 99.9 90.9 94.4 85.3Highest fifth (68–100 percent of students) 99.1 90.8 89.1 80.8
Student’s school percentage of students who were non-Hispanic Black or African American, non-Hispanic American Indian or Alaska Native, and Hispanic or Latino students of any race (2009)9
Lowest fifth (0–7 percent of students) 99.8 85.1 91.4 76.6Middle three-fifths (8–64 percent of students) 99.7 93.2 87.7 81.1Highest fifth (65–100 percent of students) 99.6 96.9 92.6 89.8
See notes at end of table.
Table 1. Among fall 2009 ninth-graders who received a high school diploma from their ninth-grade school by the fall of 2013, percentage whose school offered Advanced Placement (AP) courses, International Baccalaureate (IB) courses, and/or a dual-enrollment program, by selected student and parent characteristics: 2013—Continued
Offered by student’s school
– 7 –

National Center for Education Statistics
Selected student and parent characteristics
School offered AP courses,
IB courses, or a dual-enrollment
program1AP or IB courses
Dual-enrollment
program2
AP or IB courses and
dual-enrollment program3
Student’s school percentage of English language learners (2012)
0 percent 99.5 77.6 82.7 60.81 to 5 percent 99.7 93.5 90.7 84.4More than 5 percent 100.0 5 96.2 88.7 84.8
Table 1. Among fall 2009 ninth-graders who received a high school diploma from their ninth-grade school by the fall of 2013, percentage whose school offered Advanced Placement (AP) courses, International Baccalaureate (IB) courses, and/or a dual-enrollment program, by selected student and parent characteristics: 2013—Continued
Offered by student’s school
5 Rounds to 100.6 Parents’ socioeconomic status was calculated using parents’ education, occupation, and family income.7 Student’s mathematics achievement was measured by a two-stage adaptive assessment in algebraic reasoning developed for HSLS:09.
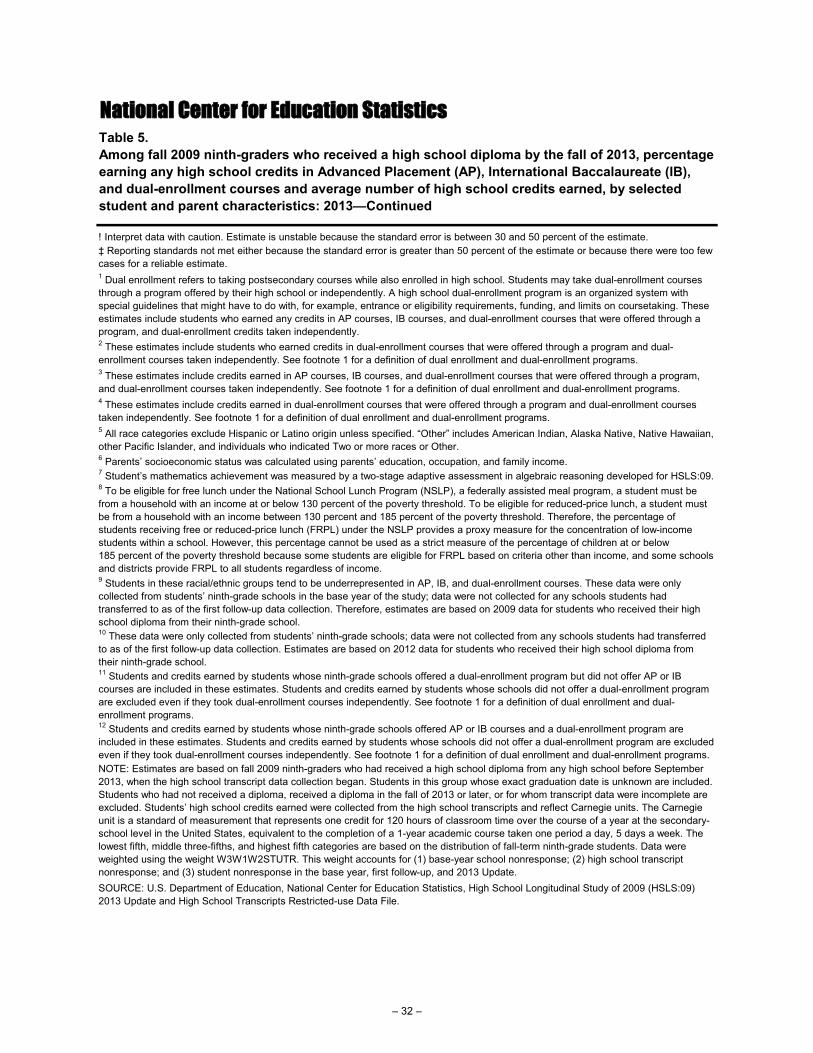
NOTE: Estimates are based on fall 2009 ninth-graders who had received a high school diploma from their ninth-grade school before September 2013, when the high school transcript data collection began. Students in this group whose exact graduation date is unknown are included. Students who had not received a diploma, received a diploma in the fall of 2013 or later, or for whom transcript data were incomplete are excluded. Students’ schools’ offerings were collected in the first follow-up data collection in 2012, when most students were in the 11th grade. The lowest fifth, middle three-fifths, and highest fifth categories are based on the distribution of fall-term ninth-grade students. Data were weighted using the weight W3W1W2STUTR. This weight accounts for (1) base-year school nonresponse; (2) high school transcript nonresponse; and (3) student nonresponse in the base year, first follow-up, and 2013 Update.SOURCE: U.S. Department of Education, National Center for Education Statistics, High School Longitudinal Study of 2009 (HSLS:09) 2013 Update and High School Transcripts Restricted-use Data File.
9 Students in these racial/ethnic groups tend to be underrepresented in AP, IB, and dual-enrollment courses. These data were only collected from students’ ninth-grade schools in 2009, the base year of the study.
1 Dual enrollment refers to taking postsecondary courses while also enrolled in high school. Students may take dual-enrollment courses through a program offered by their high school or independently. A high school dual-enrollment program is an organized system with special guidelines that might have to do with, for example, entrance or eligibility requirements, funding, and limits on coursetaking. Students whose ninth-grade schools offered AP courses, IB courses, or a dual-enrollment program are included in these estimates. Students whose ninth-grade schools did not offer AP courses, IB courses, or a dual-enrollment program are excluded even if they took dual-enrollment courses independently.
8 To be eligible for free lunch under the National School Lunch Program (NSLP), a federally assisted meal program, a student must be from a household with an income at or below 130 percent of the poverty threshold; to be eligible for reduced-price lunch, a student must be from a household with an income between 130 percent and 185 percent of the poverty threshold. Therefore, the percentage of students receiving free or reduced-price lunch (FRPL) under the NSLP provides a proxy measure for the concentration of low-income students within a school. However, this percentage cannot be used as a strict measure of the percentage of children at or below 185 percent of the poverty threshold because some students are eligible for FRPL based on criteria other than income, and some schools and districts provide FRPL to all students regardless of income.
4 All race categories exclude Hispanic or Latino origin unless specified. “Other” includes American Indian, Alaska Native, Native Hawaiian, other Pacific Islander, and individuals who indicated Two or more races or Other.
! Interpret data with caution. Estimate is unstable because the standard error is between 30 and 50 percent of the estimate.
2 Students whose ninth-grade schools offered a dual-enrollment program are included in these estimates. Students whose schools did not offer a dual-enrollment program are excluded even if they took dual-enrollment courses independently. See footnote 1 for a definition of dual enrollment and dual-enrollment programs.3 Students whose ninth-grade schools offered AP or IB courses and a dual-enrollment program are included in these estimates. Students whose schools did not offer a dual-enrollment program are excluded even if they took dual-enrollment courses independently. See footnote 1 for a definition of dual enrollment and dual-enrollment programs.
– 8 –

National Center for Education Statistics
Selected student and parent characteristics
School offered AP courses,
IB courses, or a dual-enrollment
programAP or IB courses
Dual-enrollment
program
AP or IB courses and
dual-enrollment program
Total 0.13 1.27 1.59 2.04
Student’s sex (2009) Female 0.12 1.52 1.70 2.27Male 0.14 1.18 1.72 2.07
Student’s race/ethnicity (2009)Asian # 2.11 9.12 8.89Black/African American # 3.58 3.20 4.31Hispanic/Latino 0.08 1.45 2.63 2.95Other 0.68 1.66 1.96 2.62White 0.18 1.63 1.60 2.32
Student’s native language (2009)English 0.15 1.42 1.57 2.10English and a non-English language 0.21 1.83 3.75 4.11Non-English 0.02 1.02 2.79 3.05
Parents’ socioeconomic status (2009) Lowest fifth 0.27 1.72 1.94 2.53Middle three-fifths 0.12 1.44 1.64 2.19Highest fifth 0.16 1.20 2.43 2.69
Parents’ highest level of education (2009)High school credential or less 0.20 1.53 1.58 2.19Undergraduate degree 0.12 1.58 1.83 2.37Graduate degree 0.18 1.17 2.51 2.80
Student’s educational expectations (2009) High school credential 0.19 1.98 2.27 2.93Undergraduate degree 0.16 1.51 1.43 2.07Graduate degree 0.11 1.28 1.99 2.32Don’t know 0.13 1.92 1.98 2.72
Student’s mathematics achievement (2009) Lowest fifth 0.38 1.90 1.62 2.41Middle three-fifths 0.17 1.36 1.49 2.06Highest fifth 0.04 1.43 2.69 2.92
Table S1. Standard errors for table 1: Among fall 2009 ninth-graders who received a high school diploma from their ninth-grade school by the fall of 2013, percentage whose school offered Advanced Placement (AP) courses, International Baccalaureate (IB) courses, and/or a dual-enrollment program, by selected student and parent characteristics: 2013
Offered by student’s school
See notes at end of table.
– 9 –

National Center for Education Statistics
Selected student and parent characteristics
School offered AP courses,
IB courses, or a dual-enrollment
programAP or IB courses
Dual-enrollment
program
AP or IB courses and
dual-enrollment program
Student’s school sector (2012) Public 0.12 1.35 1.67 2.15
Regular 0.13 1.41 1.72 2.23Charter or special-program school † 4.91 9.80 12.23Career/technical/vocational or alternative school 15.82 31.02 12.30 31.02
Private 0.92 3.86 6.40 6.14
Student’s school region (2012) Northeast # 2.73 4.27 4.93Midwest 0.53 3.20 2.20 3.67South 0.09 1.95 1.39 2.38West # 2.39 5.67 6.06
Student’s school locale (2012) City # 1.52 3.98 4.10Suburb 0.35 1.49 2.44 2.76Town # 5.46 2.18 6.01Rural 0.25 3.46 3.10 4.18
Student’s school size (2012) Fewer than 500 students 0.83 6.15 3.23 6.11500 to 1,199 students # 2.29 2.49 3.541,200 or more students # 0.66 2.42 2.51
Student’s school percentage of students who received free or reduced-price lunch (2012)
Lowest fifth (0–18 percent of students) 0.32 2.54 4.62 4.67Middle three-fifths (19–67 percent of students) 0.06 1.81 1.76 2.51Highest fifth (68–100 percent of students) 0.67 3.28 3.50 4.52
Student’s school percentage of students who were non-Hispanic Black or African American, non-Hispanic American Indian or Alaska Native, and Hispanic or Latino students of any race (2009)
Lowest fifth (0–7 percent of students) 0.15 3.58 2.49 4.15Middle three-fifths (8–64 percent of students) 0.22 1.63 2.54 2.94Highest fifth (65–100 percent of students) 0.37 2.38 2.71 3.52
See notes at end of table.
Table S1. Standard errors for table 1: Among fall 2009 ninth-graders who received a high school diploma from their ninth-grade school by the fall of 2013, percentage whose school offered Advanced Placement (AP) courses, International Baccalaureate (IB) courses, and/or a dual-enrollment program, by selected student and parent characteristics: 2013—Continued
Offered by student’s school
– 10 –

National Center for Education Statistics
Selected student and parent characteristics
School offered AP courses,
IB courses, or a dual-enrollment
programAP or IB courses
Dual-enrollment
program
AP or IB courses and
dual-enrollment program
Student’s school percentage of English language learners (2012)
0 percent 0.40 4.81 3.24 5.111 to 5 percent 0.24 2.00 2.02 2.92More than 5 percent # 1.41 3.80 4.01
SOURCE: U.S. Department of Education, National Center for Education Statistics, High School Longitudinal Study of 2009 (HSLS:09) 2013 Update and High School Transcripts Restricted-use Data File.
† Not applicable.
Table S1. Standard errors for table 1: Among fall 2009 ninth-graders who received a high school diploma from their ninth-grade school by the fall of 2013, percentage whose school offered Advanced Placement (AP) courses, International Baccalaureate (IB) courses, and/or a dual-enrollment program, by selected student and parent characteristics: 2013—Continued
Offered by student’s school
# Rounds to zero.
– 11 –

National Center for Education Statistics
Selected student and parent characteristics All subjects Math Science
Total 12.1 1.9 2.6
Student’s sex (2009)Female 12.1 1.9 2.5Male 12.0 1.9 2.6
Student’s race/ethnicity (2009)2
Asian 15.6 2.5 3.2Black/African American 11.8 1.8 2.4Hispanic/Latino 13.7 2.2 2.9Other 11.8 1.9 2.4White 11.3 1.8 2.4
Student’s native language (2009) English 11.7 1.9 2.5English and a non-English language 14.4 2.3 3.0Non-English 13.6 2.2 2.9
Parents’ socioeconomic status (2009)3
Lowest fifth 10.8 1.8 2.3Middle three-fifths 11.7 1.9 2.5Highest fifth 13.9 2.2 2.9
Parents’ highest level of education (2009)High school credential or less 11.0 1.8 2.4Undergraduate degree 12.6 2.0 2.6Graduate degree 14.0 2.1 2.9
Student’s educational expectations (2009)High school credential 10.4 1.7 2.3Undergraduate degree 12.3 2.0 2.6Graduate degree 12.5 2.0 2.6Don’t know 11.7 1.9 2.5
Student’s mathematics achievement (2009)4
Lowest fifth 10.1 1.6 2.1Middle three-fifths 11.7 1.9 2.5Highest fifth 14.1 2.2 2.9
Average number of AP and higher level IB1 courses offered at student’s school
See notes at end of table.
Table 2. Among fall 2009 ninth-graders who received a high school diploma from their ninth-grade school by the fall of 2013 and whose school offered Advanced Placement (AP) and/or International Baccalaureate (IB) courses, average number of AP and higher level IB courses offered in all subjects, in math, and in science at their schools, by selected student and parent characteristics: 2013
– 12 –

National Center for Education Statistics
Selected student and parent characteristics All subjects Math Science
Student’s school sector (2012) Public 12.1 1.9 2.6
Regular 12.0 2.0 2.6Charter or special-program school 16.5 2.2 3.0Career/technical/vocational or alternative school ‡ ‡ ‡
Private 11.4 1.8 2.5
Student’s school region (2012) Northeast 10.1 1.7 2.4Midwest 10.8 1.7 2.2South 14.1 2.1 2.9West 11.6 2.2 2.5
Student’s school locale (2012) City 13.4 2.1 2.7Suburb 14.7 2.3 3.2Town 7.2 1.4 1.7Rural 9.8 1.6 2.1
Student’s school size (2012) Fewer than 500 students 5.8 1.1 1.3500 to 1,199 students 8.6 1.4 1.81,200 or more students 15.3 2.4 3.2
Student’s school percentage of students who received free or reduced-price lunch (2012)5
Lowest fifth (0–18 percent of students) 14.7 2.3 3.1Middle three-fifths (19–67 percent of students) 11.8 1.9 2.5Highest fifth (68–100 percent of students) 9.8 1.7 2.2
Student’s school percentage of students who were non-Hispanic Black or African American, non-Hispanic American Indian or Alaska Native, and Hispanic or Latino students of any race (2009)6
Lowest fifth (0–7 percent of students) 8.4 1.5 1.8Middle three-fifths (8–64 percent of students) 13.2 2.1 2.8Highest fifth (65–100 percent of students) 12.6 1.9 2.6
Table 2. Among fall 2009 ninth-graders who received a high school diploma from their ninth-grade school by the fall of 2013 and whose school offered Advanced Placement (AP) and/or International Baccalaureate (IB) courses, average number of AP and higher level IB courses offered in all subjects, in math, and in science at their schools, by selected student and parent characteristics: 2013—Continued
Average number of AP and higher level IB1 courses offered at student’s school
See notes at end of table.
– 13 –

National Center for Education Statistics
Selected student and parent characteristics All subjects Math Science
Student’s school percentage of English language learners (2012)
0 percent 10.6 1.6 2.31 to 5 percent 11.9 1.9 2.5More than 5 percent 13.3 2.2 2.9
Student’s school offered dual-enrollment program (2012)7
School did not offer dual-enrollment program 13.2 2.1 3.0School offered dual-enrollment program 11.9 1.9 2.5
5 To be eligible for free lunch under the National School Lunch Program (NSLP), a federally assisted meal program, a student must be from a household with an income at or below 130 percent of the poverty threshold. To be eligible for reduced-price lunch, a student must be from a household with an income between 130 percent and 185 percent of the poverty threshold. Therefore, the percentage of students receiving free or reduced-price lunch (FRPL) under the NSLP provides a proxy measure for the concentration of low-income students within a school. However, this percentage cannot be used as a strict measure of the percentage of children at or below 185 percent of the poverty threshold because some students are eligible for FRPL based on criteria other than income, and some schools and districts provide FRPL to all students regardless of income.
2 All race categories exclude Hispanic or Latino origin unless specified. “Other” includes American Indian, Alaska Native, Native Hawaiian, other Pacific Islander, and individuals who indicated Two or more races or Other.3 Parents’ socioeconomic status was calculated using parents’ education, occupation, and family income.4 Student’s mathematics achievement was measured by a two-stage adaptive assessment in algebraic reasoning developed for HSLS:09.
NOTE: Estimates are based on fall 2009 ninth-graders who had received a high school diploma from their ninth-grade school before September 2013, when the high school transcript data collection began. Students in this group whose exact graduation date is unknown are included. Students who had not received a diploma, received a diploma in the fall of 2013 or later, or for whom transcript data were incomplete are excluded. Students’ schools’ offerings were collected in the first follow-up data collection in 2012, when most students were in the 11th grade. The lowest fifth, middle three-fifths, and highest fifth categories are based on the distribution of fall-term ninth-grade students. Data were weighted using the weight W3W1W2STUTR. This weight accounts for (1) base-year school nonresponse; (2) high school transcript nonresponse; and (3) student nonresponse in the base year, first follow-up, and 2013 Update.SOURCE: U.S. Department of Education, National Center for Education Statistics, High School Longitudinal Study of 2009 (HSLS:09) 2013 Update and High School Transcripts Restricted-use Data File.
7 Dual enrollment refers to taking postsecondary courses while also enrolled in high school. Students may take dual-enrollment courses through a program offered by their high school or independently. A high school dual-enrollment program is an organized system with special guidelines that might have to do with, for example, entrance or eligibility requirements, funding, and limits on coursetaking.
6 Students in these racial/ethnic groups tend to be underrepresented in AP, IB, and dual-enrollment courses. These data were only collected from students’ ninth-grade schools in 2009, the base year of the study.
1 Most IB courses may be taken at the standard level or higher level. Higher level courses include additional elements and require more instructional hours than standard-level courses. This table presents the number of higher level IB courses offered. Data on the number of standard-level IB courses are not available.
‡ Reporting standards not met either because the standard error is greater than 50 percent of the estimate or because there were too few cases for a reliable estimate.
Table 2. Among fall 2009 ninth-graders who received a high school diploma from their ninth-grade school by the fall of 2013 and whose school offered Advanced Placement (AP) and/or International Baccalaureate (IB) courses, average number of AP and higher level IB courses offered in all subjects, in math, and in science at their schools, by selected student and parent characteristics: 2013—Continued
Average number of AP and higher level IB1 courses offered at student’s school
– 14 –

National Center for Education Statistics
Selected student and parent characteristics All subjects Math Science
Total 0.37 0.06 0.09
Student’s sex (2009)Female 0.41 0.06 0.10Male 0.38 0.06 0.10
Student’s race/ethnicity (2009)Asian 0.66 0.10 0.17Black/African American 0.89 0.13 0.22Hispanic/Latino 0.59 0.09 0.18Other 0.65 0.10 0.15White 0.40 0.06 0.09
Student’s native language (2009) English 0.37 0.06 0.09English and a non-English language 0.76 0.13 0.17Non-English 0.65 0.10 0.26
Parents’ socioeconomic status (2009) Lowest fifth 0.48 0.08 0.15Middle three-fifths 0.40 0.07 0.10Highest fifth 0.46 0.06 0.09
Parents’ highest level of education (2009)High school credential or less 0.39 0.06 0.11Undergraduate degree 0.41 0.07 0.09Graduate degree 0.52 0.07 0.11
Student’s educational expectations (2009) High school credential 0.56 0.10 0.15Undergraduate degree 0.45 0.06 0.11Graduate degree 0.37 0.06 0.09Don’t know 0.50 0.08 0.13
Student’s mathematics achievement (2009) Lowest fifth 0.77 0.15 0.20Middle three-fifths 0.37 0.06 0.09Highest fifth 0.44 0.07 0.09
Average number of AP and higher level IB courses offered by student’s school
Table S2. Standard errors for table 2: Among fall 2009 ninth-graders who received a high school diploma from their ninth-grade school by the fall of 2013 and whose school offered Advanced Placement (AP) and/or International Baccalaureate (IB) courses, average number of AP and higher level IB courses offered in all subjects, in math, and in science at their schools, by selected student and parent characteristics: 2013
See notes at end of table.
– 15 –

National Center for Education Statistics
Selected student and parent characteristics All subjects Math Science
Student’s school sector (2012) Public 0.40 0.06 0.10
Regular 0.43 0.06 0.10Charter or special-program school 2.28 0.28 0.53Career/technical/vocational or alternative school † † †
Private 1.07 0.14 0.21
Student’s school region (2012) Northeast 0.85 0.19 0.25Midwest 0.70 0.09 0.15South 0.59 0.08 0.13West 0.88 0.11 0.23
Student’s school locale (2012) City 0.65 0.12 0.19Suburb 0.72 0.11 0.17Town 0.74 0.14 0.22Rural 0.59 0.09 0.15
Student’s school size (2012) Fewer than 500 students 0.68 0.10 0.17500 to 1,199 students 0.47 0.08 0.121,200 or more students 0.51 0.07 0.12
Student’s school percentage of students who received free or reduced-price lunch (2012)
Lowest fifth (0–18 percent of students) 0.63 0.09 0.13Middle three-fifths (19–67 percent of students) 0.50 0.07 0.12Highest fifth (68–100 percent of students) 0.86 0.15 0.30
Student’s school percentage of students who were non-Hispanic Black or African American, non-Hispanic American Indian or Alaska Native, and Hispanic or Latino students of any race (2009)
Lowest fifth (0–7 percent of students) 0.66 0.12 0.16Middle three-fifths (8–64 percent of students) 0.47 0.07 0.11Highest fifth (65–100 percent of students) 1.27 0.21 0.37
Average number of AP and higher level IB courses offered by student’s school
See notes at end of table.
Table S2. Standard errors for table 2: Among fall 2009 ninth-graders who received a high school diploma from their ninth-grade school by the fall of 2013 and whose school offered Advanced Placement (AP) and/or International Baccalaureate (IB) courses, average number of AP and higher level IB courses offered in all subjects, in math, and in science at their schools, by selected student and parent characteristics: 2013—Continued
– 16 –

National Center for Education Statistics
Selected student and parent characteristics All subjects Math Science
Student’s school percentage of English language learners (2012)
0 percent 0.85 0.14 0.181 to 5 percent 0.45 0.08 0.11More than 5 percent 0.75 0.09 0.19
Student’s school offers dual-enrollment program (2012)School does not offer dual-enrollment program 0.93 0.18 0.22School offers dual-enrollment program 0.41 0.06 0.10
SOURCE: U.S. Department of Education, National Center for Education Statistics, High School Longitudinal Study of 2009 (HSLS:09) 2013 Update and High School Transcripts Restricted-use Data File.
Table S2. Standard errors for table 2: Among fall 2009 ninth-graders who received a high school diploma from their ninth-grade school by the fall of 2013 and whose school offered Advanced Placement (AP) and/or International Baccalaureate (IB) courses, average number of AP and higher level IB courses offered in all subjects, in math, and in science at their schools, by selected student and parent characteristics: 2013—Continued
† Not applicable.
Average number of AP and higher level IB courses offered by student’s school
– 17 –

National Center for Education Statistics
Selected student and parent characteristicsOption to complete certificate program
Option to complete associate’s degree
Automatic acceptance to partner college
Total 53.9 21.4 17.4
Student’s sex (2009)Female 55.7 21.8 17.0Male 52.0 21.0 17.8
Student’s race/ethnicity (2009)2
Asian 49.2 10.6 14.3Black/African American 59.1 27.1 27.3Hispanic/Latino 54.3 25.2 19.2Other 58.6 24.9 21.6White 52.3 19.1 14.4
Student’s native language (2009) English 54.2 21.1 17.7English and a non-English language 54.4 26.0 14.3 !Non-English 50.0 21.5 15.2
Parents’ socioeconomic status (2009)3
Lowest fifth 56.7 25.9 16.4Middle three-fifths 54.3 21.8 19.5Highest fifth 50.6 17.2 12.3
Parents’ highest level of education (2009)High school credential or less 55.7 24.3 18.0Undergraduate degree 52.0 20.2 17.7Graduate degree 51.9 17.9 11.5
Student’s educational expectations (2009)High school credential 57.6 24.0 20.7Undergraduate degree 53.4 22.4 16.3Graduate degree 53.9 20.4 17.4Don’t know 52.5 21.0 17.3
Student’s mathematics achievement (2009)4
Lowest fifth 56.4 23.0 26.1Middle three-fifths 53.4 21.9 16.4Highest fifth 53.5 19.1 14.6
Table 3. Among fall 2009 ninth-graders who received a high school diploma from their ninth-grade school by the fall of 2013 and whose school offered a dual-enrollment program, percentage whose school’s dual-enrollment program had various characteristics, by selected student and parent characteristics: 2013
Dual-enrollment program1 characteristics
See notes at end of table.
– 18 –

National Center for Education Statistics
Selected student and parent characteristicsOption to complete certificate program
Option to complete associate’s degree
Automatic acceptance to partner college
Student’s school sector (2012) Public 55.4 22.1 18.1
Regular 55.2 21.9 17.0Charter or special-program school 65.2 30.7 ! ‡Career/technical/vocational or alternative school ‡ ‡ 91.2 !
Private 16.4 ! ‡ ‡
Student’s school region (2012) Northeast 37.5 ‡ ‡Midwest 50.4 14.7 14.9South 64.1 28.8 21.9West 52.8 29.7 14.7
Student’s school locale (2012) City 52.3 14.8 14.2 !Suburb 51.2 25.4 15.0Town 54.0 26.8 13.5 !Rural 57.7 20.7 24.7
Student’s school size (2012) Fewer than 500 students 42.2 19.7 20.0 !500 to 1,199 students 56.3 19.7 14.91,200 or more students 55.6 22.8 18.4
Student’s school percentage of students who received free or reduced-price lunch (2012)5
Lowest fifth (0–18 percent of students) 38.4 7.4 ! 7.9 !Middle three-fifths (19–67 percent of students) 57.1 22.6 16.7Highest fifth (68–100 percent of students) 61.3 35.3 25.3
Student’s school percentage of students who were non-Hispanic Black or African American, non-Hispanic American Indian or Alaska Native, and Hispanic or Latino students of any race (2009)6
Lowest fifth (0–7 percent of students) 48.5 14.6 14.2Middle three-fifths (8–64 percent of students) 54.8 22.5 16.2Highest fifth (65–100 percent of students) 62.4 25.0 27.8 !
Table 3. Among fall 2009 ninth-graders who received a high school diploma from their ninth-grade school by the fall of 2013 and whose school offered a dual-enrollment program, percentage whose school’s dual-enrollment program had various characteristics, by selected student and parent characteristics: 2013—Continued
Dual-enrollment program1 characteristics
See notes at end of table.
– 19 –

National Center for Education Statistics
Selected student and parent characteristicsOption to complete certificate program
Option to complete associate’s degree
Automatic acceptance to partner college
Student’s school percentage of English language learners (2012)
0 percent 46.1 10.8 ! 20.01 to 5 percent 56.9 22.1 16.3More than 5 percent 55.6 27.7 15.2
2 All race categories exclude Hispanic or Latino origin unless specified. “Other” includes American Indian, Alaska Native, Native Hawaiian, other Pacific Islander, and individuals who indicated Two or more races or Other.
5 To be eligible for free lunch under the National School Lunch Program (NSLP), a federally assisted meal program, a student must be from a household with an income at or below 130 percent of the poverty threshold. To be eligible for reduced-price lunch, a student must be from a household with an income between 130 percent and 185 percent of the poverty threshold. Therefore, the percentage of students receiving free or reduced-price lunch (FRPL) under the NSLP provides a proxy measure for the concentration of low-income students within a school. However, this percentage cannot be used as a strict measure of the percentage of children at or below 185 percent of the poverty threshold because some students are eligible for FRPL based on criteria other than income, and some schools and districts provide FRPL to all students regardless of income.6 Students in these racial/ethnic groups tend to be underrepresented in AP, IB, and dual-enrollment courses. These data were only collected from students’ ninth-grade schools in 2009, the base year of the study.NOTE: Estimates are based on fall 2009 ninth-graders who had received a high school diploma from their ninth-grade school before September 2013, when the high school transcript data collection began. Students in this group whose exact graduation date is unknown are included. Students who had not received a diploma, received a diploma in the fall of 2013 or later, or for whom transcript data were incomplete are excluded. Students’ schools’ offerings were collected in the first follow-up data collection in 2012, when most students were in the 11th grade. The lowest fifth, middle three-fifths, and highest fifth categories are based on the distribution of fall-term ninth-grade students. Data were weighted using the weight W3W1W2STUTR. This weight accounts for (1) base-year school nonresponse; (2) high school transcript nonresponse; and (3) student nonresponse in the base year, first follow-up, and 2013 Update.SOURCE: U.S. Department of Education, National Center for Education Statistics, High School Longitudinal Study of 2009 (HSLS:09) 2013 Update and High School Transcripts Restricted-use Data File.
! Interpret data with caution. Estimate is unstable because the standard error is between 30 and 50 percent of the estimate.‡ Reporting standards not met either because the standard error is greater than 50 percent of the estimate or because there were too few cases for a reliable estimate.
3 Parents’ socioeconomic status was calculated using parents’ education, occupation, and family income.
1 Dual enrollment refers to taking postsecondary courses while also enrolled in high school. Students may take dual-enrollment courses through a program offered by their high school or independently. A high school dual-enrollment program is an organized system with special guidelines that might have to do with, for example, entrance or eligibility requirements, funding, and limits on coursetaking. Students who received their high school diploma from ninth-grade schools that offered a dual-enrollment program are included in these estimates. Students whose schools did not offer a dual-enrollment program are excluded even if they took dual-enrollment courses independently.
Table 3. Among fall 2009 ninth-graders who received a high school diploma from their ninth-grade school by the fall of 2013 and whose school offered a dual-enrollment program, percentage whose school’s dual-enrollment program had various characteristics, by selected student and parent characteristics: 2013—Continued
Dual-enrollment program1 characteristics
4 Student’s mathematics achievement was measured by a two-stage adaptive assessment in algebraic reasoning developed for HSLS:09.
– 20 –

National Center for Education Statistics
Selected student and parent characteristicsOption to complete certificate program
Option to complete associate’s degree
Automatic acceptance to partner college
Total 2.87 1.88 2.39
Student’s sex (2009)Female 3.13 1.99 2.32Male 2.86 1.98 2.63
Student’s race/ethnicity (2009)Asian 5.78 2.34 4.04Black/African American 5.21 4.16 5.65Hispanic/Latino 5.55 4.25 4.40Other 4.73 4.05 3.98White 2.82 2.01 2.06
Student’s native language (2009) English 2.71 1.86 2.33English and a non-English language 5.74 5.35 4.33Non-English 6.76 4.49 3.97
Parents’ socioeconomic status (2009) Lowest fifth 4.26 3.18 2.91Middle three-fifths 3.03 1.97 2.76Highest fifth 3.02 2.15 2.00
Parents’ highest level of education (2009)High school credential or less 3.31 2.50 2.65Undergraduate degree 3.05 1.96 2.89Graduate degree 3.22 2.52 2.02
Student’s educational expectations (2009)High school credential 4.18 3.03 4.02Undergraduate degree 3.06 2.14 2.01Graduate degree 2.94 1.98 2.53Don’t know 3.52 2.42 3.03
Student’s mathematics achievement (2009) Lowest fifth 5.03 3.09 6.51Middle three-fifths 2.94 2.09 2.28Highest fifth 3.33 2.35 1.97
Table S3. Standard errors for table 3: Among fall 2009 ninth-graders who received a high school diploma from their ninth-grade school by the fall of 2013 and whose school offered a dual-enrollment program, percentage whose school’s dual-enrollment program had various characteristics, by selected student and parent characteristics: 2013
Dual-enrollment program characteristics
See notes at end of table.
– 21 –

National Center for Education Statistics
Selected student and parent characteristicsOption to complete certificate program
Option to complete associate’s degree
Automatic acceptance to partner college
Student’s school sector (2012) Public 3.00 1.99 2.50
Regular 2.92 2.06 2.14Charter or special-program school 18.22 15.31 †Career/technical/vocational or alternative school † † 27.69
Private 6.91 † †
Student’s school region (2012) Northeast 7.83 † †Midwest 5.16 3.32 2.90South 3.66 3.05 3.35West 7.78 5.44 5.18
Student’s school locale (2012) City 6.06 3.59 5.01Suburb 4.45 3.49 2.75Town 7.94 5.50 4.69Rural 4.97 3.80 4.99
Student’s school size (2012) Fewer than 500 students 6.66 4.53 6.17500 to 1,199 students 5.05 3.38 3.171,200 or more students 3.81 2.59 3.57
Student’s school percentage of students who received free or reduced-price lunch (2012)
Lowest fifth (0–18 percent of students) 5.63 3.00 3.00Middle three-fifths (19–67 percent of students) 3.63 2.58 2.82Highest fifth (68–100 percent of students) 7.46 6.19 5.47
Student’s school percentage of students who were non-Hispanic Black or African American, non-Hispanic American Indian or Alaska Native, and Hispanic or Latino students of any race (2009)
Lowest fifth (0–7 percent of students) 5.75 3.90 3.96Middle three-fifths (8–64 percent of students) 3.84 2.74 2.61Highest fifth (65–100 percent of students) 9.60 6.82 8.96
Student’s school percentage of English language learners (2012)
0 percent 6.37 4.20 5.771 to 5 percent 3.54 2.90 2.83More than 5 percent 6.34 3.98 3.89
SOURCE: U.S. Department of Education, National Center for Education Statistics, High School Longitudinal Study of 2009 (HSLS:09) 2013 Update and High School Transcripts Restricted-use Data File.
† Not applicable.
Table S3. Standard errors for table 3: Among fall 2009 ninth-graders who received a high school diploma from their ninth-grade school by the fall of 2013 and whose school offered a dual-enrollment program, percentage whose school’s dual-enrollment program had various characteristics, by selected student and parent characteristics: 2013—Continued
Dual-enrollment program characteristics
– 22 –

National Center for Education Statistics
Selected student and parent characteristics
Courses may be taken for
credit at community
colleges
Courses may be taken for credit
at 4-year colleges and universities
Courses may be taken for credit
at community colleges
Courses may be taken for credit
at 4-year colleges and universities
Total 92.3 63.6 81.0 55.7
Student’s sex (2009)Female 92.8 63.3 81.0 51.5Male 91.8 64.0 81.1 59.7
Student’s race/ethnicity (2009)3
Asian 96.3 64.0 93.9 ‡Black/African American 91.2 67.9 55.9 ! ‡Hispanic/Latino 95.3 54.9 96.4 47.2 !Other 93.6 61.2 65.3 41.6 !White 91.1 66.2 80.2 75.3
Student’s native language (2009) English 91.5 64.6 77.7 59.8English and a non-English language 95.9 61.2 94.3 ‡Non-English 96.4 57.8 95.1 37.4 !
Parents’ socioeconomic status (2009)4
Lowest fifth 92.2 57.0 86.2 48.6 !Middle three-fifths 91.7 62.9 81.9 53.5Highest fifth 94.0 69.9 77.1 62.9
Parents’ highest level of education (2009)High school credential or less 91.3 58.1 83.5 51.0Undergraduate degree 92.4 65.4 81.2 59.6Graduate degree 93.1 71.1 73.5 61.6
Student’s educational expectations (2009)High school credential 91.6 61.7 80.9 41.2 !Undergraduate degree 92.4 62.0 85.1 57.8Graduate degree 92.6 65.4 77.9 58.9Don’t know 92.2 63.0 84.4 51.7
Student’s mathematics achievement (2009)5
Lowest fifth 91.4 61.2 90.7 55.6Middle three-fifths 91.5 62.8 79.4 54.4Highest fifth 95.1 67.3 80.6 57.2
Table 4. Among fall 2009 ninth-graders who received a high school diploma from their ninth-grade school by the fall of 2013, percentage who had the option to take courses for high school credit at community colleges and 4-year colleges and universities, by dual-enrollment program offering and selected student and parent characteristics: 2013
Student’s school did not offer dual-enrollment program2
Student’s school offered dual-enrollment program1
See notes at end of table.
– 23 –

National Center for Education Statistics
Selected student and parent characteristics
Courses may be taken for
credit at community
colleges
Courses may be taken for credit
at 4-year colleges and universities
Courses may be taken for credit
at community colleges
Courses may be taken for credit
at 4-year colleges and universities
Student’s school sector (2012) Public 92.9 63.7 87.9 56.9
Regular 92.3 62.0 88.6 59.1Charter or special-program school 100.0 6 85.1 83.4 ! ‡Career/technical/vocational or alternative school 92.4 ! ‡ ‡ ‡
Private 79.2 66.6 63.1 58.2
Student’s school region (2012) Northeast 91.3 79.8 97.4 76.8Midwest 88.6 76.1 71.8 68.0South 92.5 58.9 ‡ ‡West 97.6 43.8 96.1 45.3 !
Student’s school locale (2012) City 93.3 66.8 81.3 36.7 !Suburb 98.1 74.5 88.7 71.7Town 84.9 58.3 ‡ ‡Rural 89.0 53.1 76.0 75.6
Student’s school size (2012) Fewer than 500 students 84.8 38.3 51.5 ! 50.1 !500 to 1,199 students 89.7 70.1 67.3 48.7 !1,200 or more students 95.8 67.4 95.6 61.7
Student’s school percentage of students who received free or reduced-price lunch (2012)7
Lowest fifth (0–18 percent of students) 90.9 71.2 79.7 58.5Middle three-fifths (19–67 percent of students) 92.8 65.2 94.6 77.8Highest fifth (68–100 percent of students) 92.6 46.7 73.2 ‡
Student’s school percentage of students who were non-Hispanic Black or African American, non-Hispanic American Indian or Alaska Native, and Hispanic or Latino students of any race (2009)8
Lowest fifth (0–7 percent of students) 88.7 63.8 77.8 79.8Middle three-fifths (8–64 percent of students) 92.6 66.1 88.5 58.9Highest fifth (65–100 percent of students) 95.5 51.1 77.1 ‡
Table 4. Among fall 2009 ninth-graders who received a high school diploma from their ninth-grade school by the fall of 2013, percentage who had the option to take courses for high school credit at community colleges and 4-year colleges and universities, by dual-enrollment program offering and selected student and parent characteristics: 2013—Continued
Student’s school offered dual-enrollment program1
Student’s school did not offer dual-enrollment program2
See notes at end of table.
– 24 –

National Center for Education Statistics
Selected student and parent characteristics
Courses may be taken for
credit at community
colleges
Courses may be taken for credit
at 4-year colleges and universities
Courses may be taken for credit
at community colleges
Courses may be taken for credit
at 4-year colleges and universities
Student’s school percentage of English language learners (2012)
0 percent 81.1 58.9 67.0 59.61 to 5 percent 94.6 68.6 77.4 68.6More than 5 percent 94.0 55.7 96.1 ‡
8 Students in these racial/ethnic groups tend to be underrepresented in AP, IB, and dual-enrollment courses. These data were only collected from students’ ninth-grade schools in 2009, the base year of the study.NOTE: Estimates are based on fall 2009 ninth-graders who had received a high school diploma from their ninth-grade school before September 2013, when the high school transcript data collection began. Students in this group whose exact graduation date is unknown are included. Students who had not received a diploma, received a diploma in the fall of 2013 or later, or for whom transcript data were incomplete are excluded. Students’ schools’ offerings were collected in the first follow-up data collection in 2012, when most students were in the 11th grade. The lowest fifth, middle three-fifths, and highest fifth categories are based on the distribution of fall-term ninth-grade students. Data were weighted using the weight W3W1W2STUTR. This weight accounts for (1) base-year school nonresponse; (2) high school transcript nonresponse; and (3) student nonresponse in the base year, first follow-up, and 2013 Update.
Table 4. Among fall 2009 ninth-graders who received a high school diploma from their ninth-grade school by the fall of 2013, percentage who had the option to take courses for high school credit at community colleges and 4-year colleges and universities, by dual-enrollment program offering and selected student and parent characteristics: 2013—Continued
‡ Reporting standards not met either because the standard error is greater than 50 percent of the estimate or because there were too few cases for a reliable estimate.
6 Rounds to 100.
Student’s school offered dual-enrollment program1
Student’s school did not offer dual-enrollment program2
! Interpret data with caution. Estimate is unstable because the standard error is between 30 and 50 percent of the estimate.
SOURCE: U.S. Department of Education, National Center for Education Statistics, High School Longitudinal Study of 2009 (HSLS:09) 2013 Update and High School Transcripts Restricted-use Data File.
1 Dual enrollment refers to taking postsecondary courses while also enrolled in high school. Students may take dual-enrollment courses through a program offered by their high school or independently. A high school dual-enrollment program is an organized system with special guidelines that might have to do with, for example, entrance or eligibility requirements, funding, and limits on coursetaking. Students who received their high school diploma from ninth-grade schools that offered a dual-enrollment program are included in these estimates. Students whose schools did not offer a dual-enrollment program are excluded even if they took dual-enrollment courses independently.
3 All race categories exclude Hispanic or Latino origin unless specified. “Other” includes American Indian, Alaska Native, Native Hawaiian, other Pacific Islander, and individuals who indicated Two or more races or Other.
7 To be eligible for free lunch under the National School Lunch Program (NSLP), a federally assisted meal program, a student must be from a household with an income at or below 130 percent of the poverty threshold. To be eligible for reduced-price lunch, a student must be from a household with an income between 130 percent and 185 percent of the poverty threshold. Therefore, the percentage of students receiving free or reduced-price lunch (FRPL) under the NSLP provides a proxy measure for the concentration of low-income students within a school. However, this percentage cannot be used as a strict measure of the percentage of children at or below 185 percent of the poverty threshold because some students are eligible for FRPL based on criteria other than income, and some schools and districts provide FRPL to all students regardless of income.
4 Parents’ socioeconomic status was calculated using parents’ education, occupation, and family income.5 Student’s mathematics achievement was measured by a two-stage adaptive assessment in algebraic reasoning developed for HSLS:09.
2 Students whose ninth-grade schools did not offer a dual-enrollment program are included in these estimates even if they took dual-enrollment courses independently. See footnote 1 for a definition of dual enrollment and dual-enrollment programs.
– 25 –

National Center for Education Statistics
Selected student and parent characteristics
Courses may be taken for
credit at community
colleges
Courses may be taken for credit
at 4-year colleges and universities
Courses may be taken for credit
at community colleges
Courses may be taken for credit
at 4-year colleges and universities
Total 1.38 3.11 5.96 10.69
Student’s sex (2009)Female 1.35 3.26 6.66 11.56Male 1.58 3.19 6.38 10.70
Student’s race/ethnicity (2009)Asian 1.17 6.41 8.94 †Black/African American 4.04 5.66 18.70 †Hispanic/Latino 1.53 6.31 3.00 16.63Other 2.25 4.98 11.49 14.34White 1.66 3.14 6.88 7.51
Student’s native language (2009) English 1.51 3.00 6.71 10.04English and a non-English language 1.42 5.82 5.83 †Non-English 1.35 7.20 4.03 18.60
Parents’ socioeconomic status (2009) Lowest fifth 2.44 4.46 7.84 14.92Middle three-fifths 1.56 3.29 6.52 12.10Highest fifth 1.27 3.31 8.29 11.69
Parents’ highest level of education (2009)High school credential or less 1.78 3.68 6.68 12.69Undergraduate degree 1.53 3.31 6.02 11.32Graduate degree 1.65 3.49 10.02 11.86
Student’s educational expectations (2009)High school credential 2.43 4.65 11.14 15.78Undergraduate degree 1.50 3.43 5.87 11.02Graduate degree 1.45 3.24 7.37 11.29Don’t know 1.75 3.75 5.92 13.41
Student’s mathematics achievement (2009) Lowest fifth 2.83 5.60 6.01 15.88Middle three-fifths 1.53 3.30 6.63 10.44Highest fifth 1.07 3.31 7.36 13.85
Table S4. Standard errors for table 4: Among fall 2009 ninth-graders who received a high school diploma from their ninth-grade school by the fall of 2013, percentage who had the option to take courses for high school credit at community colleges and 4-year colleges and universities, by dual-enrollment program offering and selected student and parent characteristics: 2013
Student’s school offered dual-enrollment program
Student’s school did not offer dual-enrollment program
See notes at end of table.
– 26 –

National Center for Education Statistics
Selected student and parent characteristics
Courses may be taken for
credit at community
colleges
Courses may be taken for credit
at 4-year colleges and universities
Courses may be taken for credit
at community colleges
Courses may be taken for credit
at 4-year colleges and universities
Student’s school sector (2012) Public 1.45 3.27 5.93 13.05
Regular 1.56 3.42 6.53 14.22Charter or special-program school † 12.80 32.83 †Career/technical/vocational or alternative school 35.57 † † †
Private 6.63 8.40 12.40 12.33
Student’s school region (2012) Northeast 4.78 7.45 3.36 17.76Midwest 3.43 5.44 13.53 12.99South 2.03 4.18 † †West 2.04 8.13 5.43 22.28
Student’s school locale (2012) City 3.05 6.46 9.16 16.48Suburb 0.98 4.23 10.26 15.81Town 5.18 8.78 † †Rural 2.97 6.03 14.64 16.07
Student’s school size (2012) Fewer than 500 students 4.86 7.58 17.98 18.84500 to 1,199 students 3.05 4.89 13.55 15.551,200 or more students 1.46 4.16 3.28 15.22
Student’s school percentage of students who received free or reduced-price lunch (2012)
Lowest fifth (0–18 percent of students) 3.00 5.16 8.80 16.29Middle three-fifths (19–67 percent of students) 1.74 3.99 4.61 16.73Highest fifth (68–100 percent of students) 3.95 9.27 18.86 †
Student’s school percentage of students who were non-Hispanic Black or African American, non-Hispanic American Indian or Alaska Native, and Hispanic or Latino students of any race (2009)
Lowest fifth (0–7 percent of students) 3.86 6.36 13.23 13.51Middle three-fifths (8–64 percent of students) 1.72 3.43 6.07 15.84Highest fifth (65–100 percent of students) 3.63 11.04 19.09 †
See notes at end of table.
Table S4. Standard errors for table 4: Among fall 2009 ninth-graders who received a high school diploma from their ninth-grade school by the fall of 2013, percentage who had the option to take courses for high school credit at community colleges and 4-year colleges and universities, by dual-enrollment program offering and selected student and parent characteristics: 2013—Continued
Student’s school offered dual-enrollment program
Student’s school did not offer dual-enrollment program
– 27 –

National Center for Education Statistics
Selected student and parent characteristics
Courses may be taken for
credit at community
colleges
Courses may be taken for credit
at 4-year colleges and universities
Courses may be taken for credit
at community colleges
Courses may be taken for credit
at 4-year colleges and universities
Student’s school percentage of English language learners (2012)
0 percent 5.73 7.91 13.87 14.681 to 5 percent 1.47 3.82 10.47 12.99More than 5 percent 2.69 6.31 4.23 †
SOURCE: U.S. Department of Education, National Center for Education Statistics, High School Longitudinal Study of 2009 (HSLS:09) 2013 Update and High School Transcripts Restricted-use Data File.
† Not applicable.
Student’s school offered dual-enrollment program
Student’s school did not offer dual-enrollment program
Table S4. Standard errors for table 4: Among fall 2009 ninth-graders who received a high school diploma from their ninth-grade school by the fall of 2013, percentage who had the option to take courses for high school credit at community colleges and 4-year colleges and universities, by dual-enrollment program offering and selected student and parent characteristics: 2013—Continued
– 28 –

National Center for Education Statistics
Selected student and parent characteristics
Any AP, IB, or dual-
enrollment courses1
Any AP or IB
courses
Any dual-enrollment
courses2
AP, IB, or dual-
enrollment courses3
AP or IB courses
Dual-enrollment
courses4
Total 46.3 42.2 10.9 3.6 3.3 2.5
Student’s sex (2009)Female 50.6 46.4 12.0 3.5 3.2 2.5Male 41.9 37.8 9.7 3.7 3.4 2.6
Student’s race/ethnicity (2009)5
Asian 76.8 75.8 10.1 5.2 4.8 3.2Black/African American 34.2 30.2 6.5 ! 3.0 2.9 2.3Hispanic/Latino 42.0 39.5 8.7 3.5 3.2 2.4Other 43.6 40.0 9.3 3.4 3.2 2.2White 49.0 44.0 13.0 3.6 3.2 2.6
Student’s native language (2009) English 45.5 41.0 11.8 3.5 3.2 2.5English and a non-English language 47.5 46.0 7.2 4.3 4.0 2.8Non-English 53.8 51.0 7.2 3.7 3.5 2.5
Parents’ socioeconomic status (2009)6
Lowest fifth 30.9 28.0 5.8 2.8 2.6 2.1Middle three-fifths 41.9 37.5 10.4 3.3 3.0 2.5Highest fifth 69.3 65.4 15.9 4.3 3.9 2.7
Parents’ highest level of education (2009)High school credential or less 35.6 32.1 7.8 3.0 2.8 2.3Undergraduate degree 52.5 47.8 13.1 3.7 3.3 2.6Graduate degree 70.1 66.2 15.4 4.5 4.2 2.7
Student’s educational expectations (2009)High school credential 21.2 17.6 4.4 2.2 2.3 1.4Undergraduate degree 42.9 39.1 10.3 3.2 2.9 2.4Graduate degree 59.4 55.3 13.6 4.0 3.7 2.7Don’t know 36.8 32.2 9.5 3.0 2.8 2.3
Table 5. Among fall 2009 ninth-graders who received a high school diploma by the fall of 2013, percentage earning any high school credits in Advanced Placement (AP), International Baccalaureate (IB), and dual-enrollment courses and average number of high school credits earned, by selected student and parent characteristics: 2013
Average high school credits earned in specified courses by students earning
any credit in specified courses
See notes at end of table.
Percent earning any high school credit
in specified courses
– 29 –

National Center for Education Statistics
Selected student and parent characteristics
Any AP, IB, or dual-
enrollment courses1
Any AP or IB
courses
Any dual-enrollment
courses2
AP, IB, or dual-
enrollment courses3
AP or IB courses
Dual-enrollment
courses4
Student’s mathematics achievement (2009)7
Lowest fifth 14.4 11.4 3.9 1.8 1.6 2.1Middle three-fifths 41.9 37.4 10.2 3.0 2.7 2.2Highest fifth 77.9 74.2 17.2 4.7 4.2 3.1
Student’s school sector (2012) Public 45.5 41.4 10.9 3.7 3.3 2.6
Regular 45.3 41.0 11.6 3.6 3.2 2.6Charter or special-program school 59.2 58.0 4.6 ! 4.5 4.4 3.2 !Career/technical/vocational or alternative school ‡ ‡ ‡ 2.2 ! 2.2 ! 1.6 !
Private 59.8 56.1 10.1 3.1 3.0 1.8
Student’s school region (2012) Northeast 42.4 40.1 8.1 ! 3.7 3.3 3.0Midwest 46.4 40.2 12.3 2.9 2.7 2.0South 48.5 44.4 13.2 4.1 3.6 2.6West 46.5 43.3 7.7 3.4 3.2 2.5
Student’s school locale (2012) City 52.0 49.5 9.6 4.0 3.7 2.3Suburb 51.3 48.3 9.8 3.7 3.4 2.7Town 37.2 30.2 9.9 2.5 2.3 2.3Rural 39.9 34.4 13.7 3.4 2.9 2.7
Student’s school size (2012) Fewer than 500 students 35.8 28.4 12.2 2.8 2.5 2.4500 to 1,199 students 43.7 38.4 11.9 3.4 3.1 2.71,200 or more students 51.5 49.2 9.8 3.9 3.6 2.5
Table 5. Among fall 2009 ninth-graders who received a high school diploma by the fall of 2013, percentage earning any high school credits in Advanced Placement (AP), International Baccalaureate (IB), and dual-enrollment courses and average number of high school credits earned, by selected student and parent characteristics: 2013—Continued
See notes at end of table.
Percent earning any high school credit
in specified courses
Average high school credits earned in specified courses by students earning
any credit in specified courses
– 30 –

National Center for Education Statistics
Selected student and parent characteristics
Any AP, IB, or dual-
enrollment courses1
Any AP or IB
courses
Any dual-enrollment
courses2
AP, IB, or dual-
enrollment courses3
AP or IB courses
Dual-enrollment
courses4
Student’s school percentage of students who received free or reduced-price lunch (2012)8
Lowest fifth (0–18 percent of students) 59.7 56.0 11.7 3.6 3.3 2.5Middle three-fifths (19–67 percent of students) 44.8 40.2 11.9 3.7 3.4 2.6Highest fifth (68–100 percent of students) 37.2 33.7 7.4 3.3 3.1 2.3
Student’s school percentage of students who were non-Hispanic Black or African American, non-Hispanic American Indian or Alaska Native, and Hispanic or Latino students of any race (2009)9
Lowest fifth (0–7 percent of students) 43.4 36.3 15.6 3.0 2.6 2.3Middle three-fifths (8–64 percent of students) 50.0 46.1 10.9 3.8 3.5 2.7Highest fifth (65–100 percent of students) 46.7 45.2 8.1 4.1 3.8 2.6
Student’s school percentage of English language learners (2012)
0 percent 43.6 37.7 11.3 3.3 3.1 2.31 to 5 percent 47.2 43.6 11.8 3.7 3.3 2.7More than 5 percent 48.0 43.8 9.7 3.7 3.5 2.4
Student’s school offerings (2012)10
Offered AP and/or IB course only 56.4 56.0 2.0 ! 3.4 3.4 3.1 !Offered dual-enrollment program only11 21.1 7.7 ! 14.3 ! 2.5 1.5 ! 2.9Offered AP or IB courses and dual-enrollment program12 49.8 45.7 12.6 3.7 3.4 2.5
High school from which student received diploma (2013)
Ninth-grade school 48.0 43.6 11.5 3.7 3.4 2.5Another high school 35.7 33.3 6.9 3.0 2.7 2.5
Table 5. Among fall 2009 ninth-graders who received a high school diploma by the fall of 2013, percentage earning any high school credits in Advanced Placement (AP), International Baccalaureate (IB), and dual-enrollment courses and average number of high school credits earned, by selected student and parent characteristics: 2013—Continued
See notes at end of table.
Percent earning any high school credit
in specified courses
Average high school credits earned in specified courses by students earning
any credit in specified courses
– 31 –
National Center for Education Statistics
9 Students in these racial/ethnic groups tend to be underrepresented in AP, IB, and dual-enrollment courses. These data were only collected from students’ ninth-grade schools in the base year of the study; data were not collected for any schools students had transferred to as of the first follow-up data collection. Therefore, estimates are based on 2009 data for students who received their high school diploma from their ninth-grade school.
8 To be eligible for free lunch under the National School Lunch Program (NSLP), a federally assisted meal program, a student must be from a household with an income at or below 130 percent of the poverty threshold. To be eligible for reduced-price lunch, a student must be from a household with an income between 130 percent and 185 percent of the poverty threshold. Therefore, the percentage of students receiving free or reduced-price lunch (FRPL) under the NSLP provides a proxy measure for the concentration of low-income students within a school. However, this percentage cannot be used as a strict measure of the percentage of children at or below 185 percent of the poverty threshold because some students are eligible for FRPL based on criteria other than income, and some schools and districts provide FRPL to all students regardless of income.
5 All race categories exclude Hispanic or Latino origin unless specified. “Other” includes American Indian, Alaska Native, Native Hawaiian, other Pacific Islander, and individuals who indicated Two or more races or Other.
1 Dual enrollment refers to taking postsecondary courses while also enrolled in high school. Students may take dual-enrollment courses through a program offered by their high school or independently. A high school dual-enrollment program is an organized system with special guidelines that might have to do with, for example, entrance or eligibility requirements, funding, and limits on coursetaking. These estimates include students who earned any credits in AP courses, IB courses, and dual-enrollment courses that were offered through a program, and dual-enrollment credits taken independently.
‡ Reporting standards not met either because the standard error is greater than 50 percent of the estimate or because there were too few cases for a reliable estimate.
6 Parents’ socioeconomic status was calculated using parents’ education, occupation, and family income.7 Student’s mathematics achievement was measured by a two-stage adaptive assessment in algebraic reasoning developed for HSLS:09.
2 These estimates include students who earned credits in dual-enrollment courses that were offered through a program and dual-enrollment courses taken independently. See footnote 1 for a definition of dual enrollment and dual-enrollment programs.3 These estimates include credits earned in AP courses, IB courses, and dual-enrollment courses that were offered through a program, and dual-enrollment courses taken independently. See footnote 1 for a definition of dual enrollment and dual-enrollment programs.4 These estimates include credits earned in dual-enrollment courses that were offered through a program and dual-enrollment courses taken independently. See footnote 1 for a definition of dual enrollment and dual-enrollment programs.
NOTE: Estimates are based on fall 2009 ninth-graders who had received a high school diploma from any high school before September 2013, when the high school transcript data collection began. Students in this group whose exact graduation date is unknown are included. Students who had not received a diploma, received a diploma in the fall of 2013 or later, or for whom transcript data were incomplete are excluded. Students’ high school credits earned were collected from the high school transcripts and reflect Carnegie units. The Carnegie unit is a standard of measurement that represents one credit for 120 hours of classroom time over the course of a year at the secondary-school level in the United States, equivalent to the completion of a 1-year academic course taken one period a day, 5 days a week. The lowest fifth, middle three-fifths, and highest fifth categories are based on the distribution of fall-term ninth-grade students. Data were weighted using the weight W3W1W2STUTR. This weight accounts for (1) base-year school nonresponse; (2) high school transcript nonresponse; and (3) student nonresponse in the base year, first follow-up, and 2013 Update.
11 Students and credits earned by students whose ninth-grade schools offered a dual-enrollment program but did not offer AP or IB courses are included in these estimates. Students and credits earned by students whose schools did not offer a dual-enrollment program are excluded even if they took dual-enrollment courses independently. See footnote 1 for a definition of dual enrollment and dual-enrollment programs.
10 These data were only collected from students’ ninth-grade schools; data were not collected from any schools students had transferred to as of the first follow-up data collection. Estimates are based on 2012 data for students who received their high school diploma from their ninth-grade school.
12 Students and credits earned by students whose ninth-grade schools offered AP or IB courses and a dual-enrollment program are included in these estimates. Students and credits earned by students whose schools did not offer a dual-enrollment program are excluded even if they took dual-enrollment courses independently. See footnote 1 for a definition of dual enrollment and dual-enrollment programs.
SOURCE: U.S. Department of Education, National Center for Education Statistics, High School Longitudinal Study of 2009 (HSLS:09) 2013 Update and High School Transcripts Restricted-use Data File.
! Interpret data with caution. Estimate is unstable because the standard error is between 30 and 50 percent of the estimate.
Table 5. Among fall 2009 ninth-graders who received a high school diploma by the fall of 2013, percentage earning any high school credits in Advanced Placement (AP), International Baccalaureate (IB), and dual-enrollment courses and average number of high school credits earned, by selected student and parent characteristics: 2013—Continued
– 32 –

National Center for Education Statistics
Selected student and parent characteristics
Any AP, IB, or dual-
enrollment courses
Any AP or IB
courses
Any dual-enrollment
courses
AP, IB, or dual-
enrollment courses
AP or IB courses
Dual-enrollment
courses
Total 1.32 1.39 1.01 0.08 0.08 0.12
Student’s sex (2009)Female 1.59 1.67 1.19 0.09 0.09 0.14Male 1.45 1.46 0.95 0.13 0.10 0.17
Student’s race/ethnicity (2009)Asian 3.89 3.94 1.49 0.25 0.26 0.53Black/African American 2.79 2.58 2.02 0.21 0.23 0.36Hispanic/Latino 2.54 2.63 1.34 0.23 0.19 0.31Other 3.24 3.45 1.66 0.21 0.22 0.23White 1.48 1.51 1.44 0.09 0.08 0.17
Student’s native language (2009) English 1.31 1.38 1.13 0.09 0.08 0.14English and a non-English language 4.41 4.41 1.63 0.30 0.26 0.49Non-English 3.70 3.76 1.51 0.22 0.22 0.38
Parents’ socioeconomic status (2009) Lowest fifth 2.42 2.36 1.21 0.19 0.22 0.22Middle three-fifths 1.45 1.50 1.10 0.10 0.09 0.15Highest fifth 1.52 1.66 1.55 0.14 0.12 0.20
Parents’ highest level of education (2009)High school credential or less 1.48 1.54 1.05 0.13 0.13 0.18Undergraduate degree 1.80 1.84 1.31 0.11 0.10 0.14Graduate degree 1.69 1.83 1.59 0.16 0.14 0.25
Student’s educational expectations (2009)High school credential 2.81 2.80 1.01 0.26 0.31 0.15Undergraduate degree 1.74 1.69 1.14 0.11 0.11 0.17Graduate degree 1.64 1.73 1.38 0.10 0.09 0.15Don’t know 1.93 2.00 1.25 0.14 0.13 0.23
See notes at end of table.
Table S5. Standard errors for table 5: Among fall 2009 ninth-graders who received a high school diploma by the fall of 2013, percentage earning any high school credits in Advanced Placement (AP), International Baccalaureate (IB), and dual-enrollment courses and average number of high school credits earned, by selected student and parent characteristics: 2013
Percent earning any high school credit
in specified courses
Average high school credits earned in specified courses by students earning
any credit in specified courses
– 33 –

National Center for Education Statistics
Selected student and parent characteristics
Any AP, IB, or dual-
enrollment courses
Any AP or IB
courses
Any dual-enrollment
courses
AP, IB, or dual-
enrollment courses
AP or IB courses
Dual-enrollment
courses
Student’s mathematics achievement (2009)Lowest fifth 1.70 1.62 0.88 0.20 0.20 0.43Middle three-fifths 1.39 1.45 1.06 0.10 0.09 0.14Highest fifth 1.58 1.71 1.69 0.14 0.11 0.22
Student’s school sector (2012) Public 1.43 1.52 1.09 0.09 0.08 0.13
Regular 1.44 1.54 1.17 0.10 0.09 0.13Charter or special-program school 6.73 6.90 2.12 0.48 0.49 1.01Career/technical/vocational or alternative school † † † 0.85 0.91 0.52
Private 3.43 3.53 2.24 0.14 0.15 0.18
Student’s school region (2012) Northeast 3.93 3.94 2.68 0.22 0.18 0.55Midwest 2.60 2.82 2.35 0.16 0.14 0.20South 1.74 1.80 1.51 0.15 0.14 0.13West 3.53 3.60 1.66 0.17 0.18 0.37
Student’s school locale (2012) City 2.80 2.82 1.80 0.15 0.14 0.20Suburb 1.94 2.06 1.65 0.18 0.16 0.31Town 2.50 3.56 2.67 0.17 0.17 0.24Rural 2.82 2.68 2.14 0.15 0.16 0.23
Student’s school size (2012) Fewer than 500 students 3.52 3.20 2.53 0.16 0.17 0.29500 to 1,199 students 2.49 2.57 2.09 0.19 0.18 0.281,200 or more students 1.81 1.77 1.28 0.11 0.11 0.16
See notes at end of table.
Table S5. Standard errors for table 5: Among fall 2009 ninth-graders who received a high school diploma by the fall of 2013, percentage earning any high school credits in Advanced Placement (AP), International Baccalaureate (IB), and dual-enrollment courses and average number of high school credits earned, by selected student and parent characteristics: 2013—Continued
Percent earning any high school credit
in specified courses
Average high school credits earned in specified courses by students earning
any credit in specified courses
– 34 –

National Center for Education Statistics
Selected student and parent characteristics
Any AP, IB, or dual-
enrollment courses
Any AP or IB
courses
Any dual-enrollment
courses
AP, IB, or dual-
enrollment courses
AP or IB courses
Dual-enrollment
courses
Student’s school percentage of students who received free or reduced-price lunch (2012)
Lowest fifth (0–18 percent of students) 2.20 2.24 1.96 0.14 0.13 0.19Middle three-fifths (19–67 percent of students) 1.78 1.87 1.44 0.12 0.10 0.18Highest fifth (68–100 percent of students) 3.08 3.04 2.00 0.32 0.35 0.27
Student’s school percentage of students who were non-Hispanic Black or African American, non-Hispanic American Indian or Alaska Native, and Hispanic or Latino students of any race (2009)
Lowest fifth (0–7 percent of students) 2.93 2.95 3.02 0.17 0.12 0.26Middle three-fifths (8–64 percent of students) 1.82 1.87 1.30 0.11 0.11 0.21Highest fifth (65–100 percent of students) 5.06 5.12 2.30 0.38 0.38 0.43
Student’s school percentage of English language learners (2012)
0 percent 3.48 3.19 2.65 0.22 0.24 0.201 to 5 percent 1.77 1.80 1.36 0.13 0.12 0.19More than 5 percent 2.34 2.49 1.58 0.17 0.18 0.26
Student’s school offerings (2012)Offers AP and/or IB course only 3.84 3.80 1.02 0.19 0.20 1.19Offers dual-enrollment program only 6.05 3.43 5.57 0.47 0.64 0.53Offers AP or IB courses and dual-enrollment program 1.49 1.52 1.29 0.11 0.10 0.14
High school from which student received diploma (2013)
Ninth-grade school 1.41 1.51 1.10 0.09 0.08 0.13Another high school 2.44 2.36 1.40 0.18 0.13 0.32
Percent earning any high school credit
in specified courses
Average high school credits earned in specified courses by students earning
any credit in specified courses
Table S5. Standard errors for table 5: Among fall 2009 ninth-graders who received a high school diploma by the fall of 2013, percentage earning any high school credits in Advanced Placement (AP), International Baccalaureate (IB), and dual-enrollment courses and average number of high school credits earned, by selected student and parent characteristics: 2013—Continued
SOURCE: U.S. Department of Education, National Center for Education Statistics, High School Longitudinal Study of 2009 (HSLS:09) 2013 Update and High School Transcripts Restricted-use Data File.
† Not applicable.
– 35 –

National Center for Education Statistics
Selected student and parent characteristics AsianBlack/African
AmericanHispanic/
Latino Other3 White AsianBlack/African
AmericanHispanic/
Latino Other3 White
Total 76.8 34.2 42.0 43.6 49.0 5.2 3.0 3.5 3.4 3.6
Student’s sex (2009)Female 80.3 39.7 47.3 45.3 53.5 5.1 3.2 3.3 3.2 3.6Male 73.3 26.9 36.4 41.7 44.6 5.3 2.6 3.7 3.7 3.6
Student’s native language (2009) English 75.5 33.9 39.5 42.4 48.8 4.8 3.1 3.7 3.4 3.6English and a non-English language 79.8 ‡ 37.4 64.0 57.2 5.5 ‡ 3.5 4.7 4.5Non-English 77.2 36.9 ! 49.1 52.9 63.3 5.4 1.7 ! 3.3 2.8 3.6
Parents’ socioeconomic status (2009)4
Lowest fifth 57.1 23.7 36.1 25.3 25.0 4.4 2.0 2.9 2.1 2.5Middle three-fifths 72.7 34.2 41.5 40.6 42.3 4.7 2.9 3.4 3.0 3.3Highest fifth 89.7 55.9 71.8 64.3 69.0 5.9 4.2 5.0 4.6 4.1
Parents’ highest level of education (2009)High school credential or less 73.9 25.0 37.9 35.2 35.6 4.9 2.3 3.0 2.4 3.1Undergraduate degree 77.5 45.1 47.3 53.4 53.4 4.6 3.4 4.1 3.9 3.5Graduate degree 94.6 49.1 71.2 59.1 71.2 6.8 4.5 4.4 4.6 4.3
Student’s educational expectations (2009)High school credential 60.5 26.7 ! 26.2 17.2 ! 15.7 ‡ ‡ 2.3 ‡ 1.9Undergraduate degree 64.8 32.8 39.7 40.2 45.3 3.7 3.6 3.3 2.9 3.2Graduate degree 87.2 45.0 57.0 54.5 62.3 6.4 2.9 4.2 3.8 4.0Don’t know 70.6 10.4 ! 33.6 41.9 39.4 3.9 2.1 2.5 3.5 3.1
Student’s mathematics achievement (2009)5
Lowest fifth ‡ 13.9 12.9 17.2 ! 14.8 ‡ 1.4 1.3 ‡ 2.1Middle three-fifths 69.6 35.7 42.4 40.4 42.0 3.8 2.9 3.2 2.9 2.8Highest fifth 90.3 75.4 76.6 74.8 77.3 6.3 3.9 4.6 4.5 4.6
Average high school credits earned by students earning any high school credits in AP, IB, and
dual-enrollment courses2
Table 6. Among fall 2009 ninth-graders who received a high school diploma by the fall of 2013, percentage of students in various racial/ethnic groups earning any high school credits in Advanced Placement (AP), International Baccalaureate (IB), and dual-enrollment courses and average number of high school credits earned, by selected student and parent characteristics: 2013
See notes at end of table.
Percent earning any high school credits in AP, IB, and dual-enrollment courses1
– 36 –

National Center for Education Statistics
Selected student and parent characteristics AsianBlack/African
AmericanHispanic/
Latino Other3 White AsianBlack/African
AmericanHispanic/
Latino Other3 White
Student’s school sector (2012) Public 77.3 33.6 41.2 42.8 47.9 5.2 3.1 3.5 3.4 3.7
Regular 75.7 32.9 39.1 43.7 48.3 5.1 2.8 3.3 3.5 3.7Charter or special-program school 96.1 45.9 74.8 39.5 54.5 6.3 5.0 4.6 3.4 4.0Career/technical/vocational or alternative school ‡ ‡ ‡ ‡ ‡ 1.9 ! ‡ ‡ ‡ ‡
Private 70.0 47.9 67.5 60.3 58.9 4.6 2.1 3.4 3.2 3.1
Student’s school region (2012) Northeast 71.0 23.4 ! 30.6 ! 33.9 47.7 4.3 3.9 3.8 3.5 3.7Midwest 72.3 40.3 40.2 48.1 46.9 5.2 2.3 3.5 2.3 2.9South 79.8 35.4 52.9 45.5 50.6 6.5 3.0 4.2 3.7 4.1West 79.2 33.0 37.0 44.9 51.8 4.7 3.4 2.4 3.7 3.6
Student’s school locale (2012) City 83.7 38.1 43.8 46.9 61.1 5.3 3.2 3.6 3.6 4.2Suburb 72.4 38.7 46.5 52.9 53.8 5.3 3.1 3.9 3.5 3.6Town 46.6 ! 24.7 ! 34.2 30.4 ! 39.8 3.6 ! 1.7 ! 1.8 2.6 2.6Rural 72.8 26.9 35.2 39.2 42.4 4.7 2.6 3.1 3.5 3.5
Student’s school size (2012) Fewer than 500 students 50.6 43.7 ! 26.8 28.2 36.9 3.7 2.9 3.2 2.6 2.7500 to 1,199 students 72.7 27.5 48.6 34.4 46.4 4.9 2.9 3.7 3.4 3.41,200 or more students 80.3 36.3 42.8 52.9 57.0 5.4 3.3 3.4 3.6 4.0
Table 6. Among fall 2009 ninth-graders who received a high school diploma by the fall of 2013, percentage of students in various racial/ethnic groups earning any high school credits in Advanced Placement (AP), International Baccalaureate (IB), and dual-enrollment courses and average number of high school credits earned, by selected student and parent characteristics: 2013—Continued
See notes at end of table.
Percent earning any high school credits in AP, IB, and dual-enrollment courses1
Average high school credits earned by students earning any high school credits in AP, IB, and
dual-enrollment courses2
– 37 –

National Center for Education Statistics
Selected student and parent characteristics AsianBlack/African
AmericanHispanic/
Latino Other3 White AsianBlack/African
AmericanHispanic/
Latino Other3 White
Student’s school percentage of students who received free or reduced-price lunch (2012)6
Lowest fifth (0–18 percent of students) 82.2 47.6 53.6 52.1 60.5 5.4 3.7 3.3 3.9 3.4Middle three-fifths (19–67 percent of students) 76.4 33.0 41.3 45.3 45.7 5.4 3.0 3.5 3.3 3.8Highest fifth (68–100 percent of students) 60.7 34.4 41.6 25.1 33.9 4.2 3.0 3.4 3.1 3.2
Student’s school percentage of students who were non-Hispanic Black or African American, non-Hispanic American Indian or Alaska Native, and Hispanic or Latino students of any race (2009)7
Lowest fifth (0–7 percent of students) 72.3 38.1 22.2 44.1 43.7 5.2 ‡ 2.5 2.7 3.0Middle three-fifths (8–64 percent of students) 72.7 31.7 44.9 47.5 53.5 5.4 2.8 3.2 3.4 3.9Highest fifth (65–100 percent of students) 87.3 32.1 47.9 43.6 59.4 4.5 3.7 4.1 4.2 4.6
Student’s school percentage of English language learners (2012)
0 percent 85.5 45.2 57.9 40.6 40.8 6.1 3.0 ! 3.4 3.3 3.11 to 5 percent 73.0 30.6 45.0 41.8 50.5 5.7 3.1 4.2 3.1 3.6More than 5 percent 76.8 37.0 40.3 46.9 55.2 4.8 3.1 3.0 3.8 4.1
Student’s school offerings (2012)8
Offered AP and/or IB course only 80.5 27.4 ! 41.4 57.3 65.7 4.7 2.7 2.2 3.9 3.6Offered dual-enrollment program only9 ‡ 44.1 ! ‡ 23.3 ! 18.7 ! ‡ 2.0 ! 2.0 ! 2.0 ! 2.7Offered AP or IB courses and dual-enrollment program10 79.2 32.7 47.3 47.6 52.5 5.4 3.4 3.7 3.4 3.7
High school from which student received diploma (2013)
Ninth-grade school 76.6 33.1 44.6 46.3 50.3 5.3 3.2 3.5 3.4 3.6Another high school 79.2 38.4 30.6 26.4 37.2 4.2 2.3 3.3 3.2 3.0
Table 6. Among fall 2009 ninth-graders who received a high school diploma by the fall of 2013, percentage of students in various racial/ethnic groups earning any high school credits in Advanced Placement (AP), International Baccalaureate (IB), and dual-enrollment courses and average number of high school credits earned, by selected student and parent characteristics: 2013—Continued
See notes at end of table.
Average high school credits earned by students earning any high school credits in AP, IB, and
dual-enrollment courses2Percent earning any high school credits in AP, IB, and
dual-enrollment courses1
– 38 –

National Center for Education Statistics
4 Parents’ socioeconomic status was calculated using parents’ education, occupation, and family income.5 Student’s mathematics achievement was measured by a two-stage adaptive assessment in algebraic reasoning developed for HSLS:09.
8 These data were only collected from students’ ninth-grade schools; data were not collected from any schools students had transferred to as of the first follow-up data collection. Estimates are based on 2012 data for students who received their high school diploma from their ninth-grade school.
SOURCE: U.S. Department of Education, National Center for Education Statistics, High School Longitudinal Study of 2009 (HSLS:09) 2013 Update and High School Transcripts Restricted-use Data File.
9 Students and credits earned by students whose ninth-grade schools offered a dual-enrollment program but did not offer AP or IB courses are included in these estimates. Students and credits earned by students whose schools did not offer a dual-enrollment program are excluded even if they took dual-enrollment courses independently. See footnote 1 for a definition of dual enrollment and dual-enrollment programs.10 Students and credits earned by students whose ninth-grade schools offered AP or IB courses and a dual-enrollment program are included in these estimates. Students and credits earned by students whose schools did not offer a dual-enrollment program are excluded even if they took dual-enrollment courses independently. See footnote 1 for a definition of dual enrollment and dual-enrollment programs.NOTE: Estimates are based on fall 2009 ninth-graders who had received a high school diploma from any high school before September 2013, when the high school transcript data collection began. Students in this group whose exact graduation date is unknown are included. Students who had not received a diploma, received a diploma in the fall of 2013 or later, or for whom transcript data were incomplete are excluded. Students’ high school credits earned were collected from the high school transcripts and reflect Carnegie units. The Carnegie unit is a standard of measurement that represents one credit for 120 hours of classroom time over the course of a year at the secondary-school level in the United States, equivalent to the completion of a 1-year academic course taken one period a day, 5 days a week. All race categories exclude Hispanic or Latino origin unless specified. The lowest fifth, middle three-fifths, and highest fifth categories are based on the distribution of fall-term ninth-grade students. Data were weighted using the weight W3W1W2STUTR. This weight accounts for (1) base-year school nonresponse; (2) high school transcript nonresponse; and (3) student nonresponse in the base year, first follow-up, and 2013 Update.
3 “Other” includes American Indian, Alaska Native, Native Hawaiian, other Pacific Islander, and individuals who indicated Two or more races or Other. It excludes students of Hispanic or Latino origin.
! Interpret data with caution. Estimate is unstable because the standard error is between 30 and 50 percent of the estimate.‡ Reporting standards not met either because the standard error is greater than 50 percent of the estimate or because there were too few cases for a reliable estimate.
6 To be eligible for free lunch under the National School Lunch Program (NSLP), a federally assisted meal program, a student must be from a household with an income at or below 130 percent of the poverty threshold. To be eligible for reduced-price lunch, a student must be from a household with an income between 130 percent and 185 percent of the poverty threshold. Therefore, the percentage of students receiving free or reduced-price lunch (FRPL) under the NSLP provides a proxy measure for the concentration of low-income students within a school. However, this percentage cannot be used as a strict measure of the percentage of children at or below 185 percent of the poverty threshold because some students are eligible for FRPL based on criteria other than income, and some schools and districts provide FRPL to all students regardless of income.7 Students in these racial/ethnic groups tend to be underrepresented in AP, IB, and dual-enrollment courses. These data were only collected from students’ ninth-grade schools in the base year of the study; data were not collected for any schools students had transferred to as of the first follow-up data collection. Therefore, estimates are based on 2009 data for students who received their high school diploma from their ninth-grade school.
Table 6. Among fall 2009 ninth-graders who received a high school diploma by the fall of 2013, percentage of students in various racial/ethnic groups earning any high school credits in Advanced Placement (AP), International Baccalaureate (IB), and dual-enrollment courses and average number of high school credits earned, by selected student and parent characteristics: 2013—Continued
2 These estimates include credits earned in AP courses, IB courses, and dual-enrollment courses that were offered through a program, and dual-enrollment courses taken independently. See footnote 1 for a definition of dual enrollment and dual-enrollment programs.
1 Dual enrollment refers to taking postsecondary courses while also enrolled in high school. Students may take dual-enrollment courses through a program offered by their high school or independently. A high school dual-enrollment program is an organized system with special guidelines that might have to do with, for example, entrance or eligibility requirements, funding, and limits on coursetaking. These estimates include students who earned any credits in AP courses, IB courses, and dual-enrollment courses that were offered through a program, and dual-enrollment credits taken independently.
– 39 –

National Center for Education Statistics
Selected student and parent characteristics AsianBlack/African
AmericanHispanic/
Latino Other White AsianBlack/African
AmericanHispanic/
Latino Other White
Total 3.89 2.79 2.54 3.24 1.48 0.25 0.21 0.23 0.21 0.09
Student’s sex (2009)Female 4.27 3.99 3.33 4.83 1.76 0.28 0.28 0.24 0.24 0.11Male 4.61 3.62 2.95 3.46 1.60 0.38 0.38 0.44 0.32 0.12
Student’s native language (2009) English 5.41 2.90 3.31 3.24 1.52 0.40 0.22 0.42 0.23 0.10English and a non-English language 5.46 † 5.43 13.86 8.59 0.46 † 0.52 0.76 0.67Non-English 5.38 16.87 4.35 13.81 8.66 0.38 0.66 0.29 0.72 0.46
Parents’ socioeconomic status (2009) Lowest fifth 10.72 4.50 3.98 6.55 2.63 0.76 0.31 0.32 0.47 0.23Middle three-fifths 5.25 3.50 2.95 3.83 1.64 0.34 0.26 0.34 0.21 0.10Highest fifth 3.10 5.10 5.56 5.24 1.58 0.40 0.65 0.48 0.38 0.14
Parents’ highest level of education (2009)High school credential or less 5.67 3.82 3.01 4.31 1.91 0.43 0.26 0.33 0.23 0.16Undergraduate degree 5.50 5.18 5.45 5.20 1.89 0.36 0.37 0.37 0.29 0.13Graduate degree 1.86 6.48 6.36 6.63 1.79 0.56 0.56 0.56 0.49 0.17
Student’s educational expectations (2009)High school credential 12.22 10.10 6.31 7.16 1.88 † † 0.41 † 0.21Undergraduate degree 9.03 5.66 4.49 5.10 2.00 0.37 0.58 0.38 0.38 0.11Graduate degree 2.89 4.22 3.13 4.07 1.75 0.40 0.20 0.33 0.23 0.12Don’t know 7.65 3.15 4.23 5.89 2.37 0.48 0.35 0.32 0.51 0.17
Student’s mathematics achievement (2009) Lowest fifth † 4.09 3.52 6.02 1.99 † 0.20 0.17 † 0.28Middle three-fifths 6.28 3.89 2.72 3.26 1.61 0.26 0.25 0.25 0.22 0.10Highest fifth 2.86 5.77 4.87 4.85 1.72 0.37 0.53 0.49 0.34 0.14
See notes at end of table.
Average high school credits earned by students earning any high school credits in AP, IB, and
dual-enrollment coursesPercent earning any high school credits in AP, IB, and
dual-enrollment courses
Table S6. Standard errors for table 6: Among fall 2009 ninth-graders who received a high school diploma by the fall of 2013, percentage of students in various racial/ethnic groups earning any high school credits in Advanced Placement (AP), International Baccalaureate (IB), and dual-enrollment courses and average number of high school credits earned, by selected student and parent characteristics: 2013
– 40 –

National Center for Education Statistics
Selected student and parent characteristics AsianBlack/African
AmericanHispanic/
Latino Other White AsianBlack/African
AmericanHispanic/
Latino Other White
Student’s school sector (2012) Public 4.09 3.00 2.60 3.45 1.61 0.27 0.23 0.25 0.23 0.11
Regular 4.13 3.13 2.39 3.67 1.66 0.29 0.21 0.26 0.24 0.11Charter or special-program school 4.88 12.60 12.07 8.95 6.47 1.24 1.10 0.76 0.82 0.53Career/technical/vocational or alternative school † † † † † 0.81 † † † †
Private 9.04 9.01 8.73 6.21 4.26 0.87 0.32 0.35 0.42 0.15
Student’s school region (2012) Northeast 13.66 7.82 9.70 6.16 3.46 0.39 0.67 0.71 0.66 0.25Midwest 4.87 5.34 4.46 4.95 3.08 0.52 0.36 0.51 0.27 0.16South 4.92 3.95 3.36 4.28 1.90 0.40 0.33 0.40 0.30 0.15West 6.06 6.45 4.48 7.12 4.51 0.48 0.53 0.22 0.49 0.24
Student’s school locale (2012) City 3.65 5.44 4.19 4.72 2.62 0.42 0.41 0.34 0.32 0.20Suburb 7.54 4.53 4.04 4.20 1.93 0.40 0.41 0.41 0.35 0.19Town 17.84 7.91 8.94 9.18 2.57 1.30 0.84 0.53 0.45 0.16Rural 8.73 5.57 6.08 6.18 3.33 0.49 0.36 0.30 0.59 0.18
Student’s school size (2012) Fewer than 500 students 12.69 13.54 6.78 5.66 3.83 0.46 0.47 0.76 0.44 0.17500 to 1,199 students 9.58 4.22 8.46 6.99 2.48 0.81 0.43 0.60 0.40 0.201,200 or more students 4.20 4.24 2.93 4.10 1.80 0.30 0.36 0.27 0.28 0.12
Table S6. Standard errors for table 6: Among fall 2009 ninth-graders who received a high school diploma by the fall of 2013, percentage of students in various racial/ethnic groups earning any high school credits in Advanced Placement (AP), International Baccalaureate (IB), and dual-enrollment courses and average number of high school credits earned, by selected student and parent characteristics: 2013 —Continued
See notes at end of table.
Percent earning any high school credits in AP, IB, and dual-enrollment courses
Average high school credits earned by students earning any high school credits in AP, IB, and
dual-enrollment courses
– 41 –

National Center for Education Statistics
Selected student and parent characteristics AsianBlack/African
AmericanHispanic/
Latino Other White AsianBlack/African
AmericanHispanic/
Latino Other White
Student’s school percentage of students who received free or reduced-price lunch (2012)
Lowest fifth (0–18 percent of students) 4.51 6.28 6.96 5.14 2.43 0.43 0.34 0.45 0.43 0.14Middle three-fifths (19–67 percent of students) 4.80 4.19 3.64 3.95 2.04 0.45 0.38 0.34 0.29 0.14Highest fifth (68–100 percent of students) 14.79 5.51 4.50 7.28 3.73 0.43 0.45 0.44 0.77 0.32
Student’s school percentage of students who were non-Hispanic Black or African American, non-Hispanic American Indian or Alaska Native, and Hispanic or Latino students of any race (2009)
Lowest fifth (0–7 percent of students) 7.88 11.08 5.23 5.57 3.05 0.83 † 0.40 0.34 0.18Middle three-fifths (8–64 percent of students) 5.14 4.00 3.17 4.13 1.91 0.39 0.21 0.25 0.27 0.14Highest fifth (65–100 percent of students) 9.58 5.76 6.08 12.98 7.60 0.77 0.65 0.47 0.82 0.66
Student’s school percentage of English language learners (2012)
0 percent 8.25 9.11 10.40 5.77 3.71 0.79 1.00 0.36 0.42 0.171 to 5 percent 5.97 3.43 4.12 3.86 1.91 0.60 0.30 0.40 0.25 0.14More than 5 percent 5.04 6.01 3.64 6.34 3.19 0.31 0.45 0.25 0.49 0.23
Student’s school offerings (2012)Offers AP and/or IB course only 5.45 9.20 6.36 8.59 3.87 0.30 0.47 0.31 0.58 0.25Offers dual-enrollment program only † 20.46 † 11.40 6.32 † 0.81 0.89 0.75 0.74Offers AP or IB courses and dual-enrollment program 4.74 3.20 3.07 4.44 1.51 0.37 0.33 0.28 0.25 0.12
High school from which student received diploma (2013)
Ninth-grade school 4.23 2.93 2.74 3.74 1.58 0.27 0.27 0.24 0.23 0.10Another high school 6.31 6.89 5.01 5.68 2.37 0.57 0.46 0.65 0.63 0.18
† Not applicable.
Average high school credits earned by students earning any high school credits in AP, IB, and
dual-enrollment courses
SOURCE: U.S. Department of Education, National Center for Education Statistics, High School Longitudinal Study of 2009 (HSLS:09) 2013 Update and High School Transcripts Restricted-use Data File.
Table S6. Standard errors for table 6: Among fall 2009 ninth-graders who received a high school diploma by the fall of 2013, percentage of students in various racial/ethnic groups earning any high school credits in Advanced Placement (AP), International Baccalaureate (IB), and dual-enrollment courses and average number of high school credits earned, by selected student and parent characteristics: 2013 —Continued
Percent earning any high school credits in AP, IB, and dual-enrollment courses
– 42 –

National Center for Education Statistics
Selected student and parent characteristics
Lowest fifth
SES3
Middle three-fifths
SES3
Highest fifth
SES3
Lowest fifth
SES3
Middle three-fifths
SES3
Highest fifth
SES3
Total 30.9 41.9 69.3 2.8 3.3 4.3
Student’s sex (2009)Female 35.8 46.1 74.5 2.7 3.2 4.4Male 25.6 37.6 64.2 2.9 3.5 4.3
Student’s race/ethnicity (2009)4
Asian 57.1 72.7 89.7 4.4 4.7 5.9Black/African American 23.7 34.2 55.9 2.0 2.9 4.2Hispanic/Latino 36.1 41.5 71.8 2.9 3.4 5.0Other 25.3 40.6 64.3 2.1 3.0 4.6White 25.0 42.3 69.0 2.5 3.3 4.1
Student’s native language (2009) English 22.6 40.9 67.9 2.4 3.3 4.2English and a non-English language 33.1 45.5 81.3 2.9 4.2 5.5Non-English 49.6 51.0 86.3 3.1 3.5 5.8
Parents’ highest level of education (2009)High school credential or less 32.4 37.4 ‡ 2.7 3.2 ‡Undergraduate degree 27.4 47.1 67.5 2.1 3.5 4.0Graduate degree ‡ 59.9 71.9 ‡ 3.6 4.7
Student’s educational expectations (2009)High school credential 20.2 19.7 39.9 2.1 2.3 2.2Undergraduate degree 29.3 40.5 62.3 2.4 3.0 4.0Graduate degree 43.6 54.1 75.4 3.4 3.7 4.7Don’t know 26.7 32.8 62.2 2.3 2.9 3.5
Student’s mathematics achievement (2009)5
Lowest fifth 12.0 13.6 31.5 1.5 1.9 1.8Middle three-fifths 32.7 39.5 58.7 2.7 2.8 3.5Highest fifth 72.5 72.7 84.9 3.6 4.5 5.1
Student’s school sector (2012) Public 29.9 42.0 69.2 2.8 3.4 4.5
Regular 27.5 42.3 68.6 2.5 3.3 4.5Charter or special-program school 65.8 50.8 80.4 4.2 4.1 5.8Career/technical/vocational or alternative school ‡ ‡ ‡ ‡ 2.0 ! ‡
Private 69.9 ! 44.4 68.8 2.7 2.7 3.3
Student’s school region (2012) Northeast 34.4 ! 36.0 63.2 3.6 3.5 4.0Midwest 29.5 41.8 67.2 2.3 2.5 3.7South 29.8 44.7 74.3 2.8 3.8 4.9West 32.1 43.2 69.5 2.4 3.1 4.3
Table 7. Among fall 2009 ninth-graders who received a high school diploma by the fall of 2013, percentage of students in different socioeconomic status (SES) groups earning any high school credits in Advanced Placement (AP), International Baccalaureate (IB), and dual-enrollment courses and average number of high school credits earned, by selected student and parent characteristics: 2013
Average high school credits earned by students earning any
high school credits in AP, IB, and dual-enrollment courses2
Percent earning any high school credits in AP, IB, and
dual-enrollment courses1
See notes at end of table.
– 43 –

National Center for Education Statistics
Selected student and parent characteristics
Lowest fifth
SES3
Middle three-fifths
SES3
Highest fifth
SES3
Lowest fifth
SES3
Middle three-fifths
SES3
Highest fifth
SES3
Student’s school locale (2012) City 40.0 46.8 76.0 3.2 3.5 5.0Suburb 34.1 46.0 72.1 2.6 3.6 4.2Town 21.5 35.0 61.4 1.7 2.3 3.1Rural 18.9 37.4 61.6 2.3 3.2 4.0
Student’s school size (2012) Fewer than 500 students 17.7 31.5 56.2 2.2 2.7 3.0500 to 1,199 students 32.9 38.9 68.0 3.4 3.1 4.11,200 or more students 33.3 47.5 73.8 2.5 3.6 4.8
Student’s school percentage of students who received free or reduced-price lunch (2012)6
Lowest fifth (0–18 percent of students) 50.1 50.3 70.2 2.9 3.3 3.9Middle three-fifths (19–67 percent of students) 28.2 41.8 68.2 2.8 3.4 4.7Highest fifth (68–100 percent of students) 32.4 37.7 59.3 2.7 3.3 5.0
Student’s school percentage of students who were non-Hispanic Black or African American, non-Hispanic American Indian or Alaska Native, and Hispanic or Latino students of any race (2009)7
Lowest fifth (0–7 percent of students) 20.1 38.4 62.0 2.9 2.7 3.4Middle three-fifths (8–64 percent of students) 29.3 45.5 72.3 2.5 3.4 4.6Highest fifth (65–100 percent of students) 43.6 43.2 79.4 3.4 4.2 5.2
Student’s school percentage of English language learners (2012)
0 percent 30.4 35.4 64.6 2.4 2.9 3.91 to 5 percent 28.4 42.9 69.2 3.3 3.4 4.3More than 5 percent 34.0 46.1 72.1 2.4 3.5 4.9
Student’s school offerings (2012)8
Offered AP and/or IB course only 32.2 47.3 77.1 2.1 2.9 4.1Offered dual-enrollment program only9 15.7 ! 20.7 29.0 ! 1.6 2.4 3.3 !Offered AP or IB courses and dual-enrollment program10 35.2 45.6 71.1 2.9 3.5 4.5
High school from which student received diploma (2013)
Ninth-grade school 32.4 43.4 69.8 2.8 3.4 4.4Another high school 24.2 32.6 64.5 2.4 2.7 3.9
Table 7. Among fall 2009 ninth-graders who received a high school diploma by the fall of 2013, percentage of students in different socioeconomic status (SES) groups earning any high school credits in Advanced Placement (AP), International Baccalaureate (IB), and dual-enrollment courses and average number of high school credits earned, by selected student and parent characteristics: 2013—Continued
Percent earning any high school credits in AP, IB, and
dual-enrollment courses1
Average high school credits earned by students earning any
high school credits in AP, IB, and dual-enrollment courses2
See notes at end of table.
– 44 –

National Center for Education StatisticsTable 7. Among fall 2009 ninth-graders who received a high school diploma by the fall of 2013, percentage of students in different socioeconomic status (SES) groups earning any high school credits in Advanced Placement (AP), International Baccalaureate (IB), and dual-enrollment courses and average number of high school credits earned, by selected student and parent characteristics: 2013—Continued
NOTE: Estimates are based on fall 2009 ninth-graders who had received a high school diploma from any high school before September 2013, when the high school transcript data collection began. Students in this group whose exact graduation date is unknown are included. Students who had not received a diploma, received a diploma in the fall of 2013 or later, or for whom transcript data were incomplete are excluded. Students’ high school credits earned were collected from the high school transcripts and reflect Carnegie units. The Carnegie unit is a standard of measurement that represents one credit for 120 hours of classroom time over the course of a year at the secondary-school level in the United States, equivalent to the completion of a 1-year academic course taken one period a day, 5 days a week. The lowest fifth, middle three-fifths, and highest fifth categories are based on the distribution of fall-term ninth-grade students. Data were weighted using the weight W3W1W2STUTR. This weight accounts for (1) base-year school nonresponse; (2) high school transcript nonresponse; and (3) student nonresponse in the base year, first follow-up, and 2013 Update.
9 Students and credits earned by students whose ninth-grade schools offered a dual-enrollment program but did not offer AP or IB courses are included in these estimates. Students and credits earned by students whose schools did not offer a dual-enrollment program are excluded even if they took dual-enrollment courses independently. See footnote 1 for a definition of dual enrollment and dual-enrollment programs.
8 These data were only collected from students’ ninth-grade schools; data were not collected from any schools students had transferred to as of the first follow-up data collection. Estimates are based on 2012 data for students who received their high school diploma from their ninth-grade school.
7 Students in these racial/ethnic groups tend to be underrepresented in AP, IB, and dual-enrollment courses. These data were only collected from students’ ninth-grade schools in the base year of the study; data were not collected for any schools students had transferred to as of the first follow-up data collection. Therefore, estimates are based on 2009 data for students who received their high school diploma from their ninth-grade school.
6 To be eligible for free lunch under the National School Lunch Program (NSLP), a federally assisted meal program, a student must be from a household with an income at or below 130 percent of the poverty threshold. To be eligible for reduced-price lunch, a student must be from a household with an income between 130 percent and 185 percent of the poverty threshold. Therefore, the percentage of students receiving free or reduced-price lunch (FRPL) under the NSLP provides a proxy measure for the concentration of low-income students within a school. However, this percentage cannot be used as a strict measure of the percentage of children at or below 185 percent of the poverty threshold because some students are eligible for FRPL based on criteria other than income, and some schools and districts provide FRPL to all students regardless of income.
4 All race categories exclude Hispanic or Latino origin unless specified. “Other” includes American Indian, Alaska Native, Native Hawaiian, other Pacific Islander, and individuals who indicated Two or more races or Other.
1 Dual enrollment refers to taking postsecondary courses while also enrolled in high school. Students may take dual-enrollment courses through a program offered by their high school or independently. A high school dual-enrollment program is an organized system with special guidelines that might have to do with, for example, entrance or eligibility requirements, funding, and limits on coursetaking. These estimates include students who earned any credits in AP courses, IB courses, and dual-enrollment courses that were offered through a program, and dual-enrollment credits taken independently.
‡ Reporting standards not met either because the standard error is greater than 50 percent of the estimate or because there were too few cases for a reliable estimate.
! Interpret data with caution. Estimate is unstable because the standard error is between 30 and 50 percent of the estimate.
SOURCE: U.S. Department of Education, National Center for Education Statistics, High School Longitudinal Study of 2009 (HSLS:09) 2013 Update and High School Transcripts Restricted-use Data File.
10 Students and credits earned by students whose ninth-grade schools offered AP or IB courses and a dual-enrollment program are included in these estimates. Students and credits earned by students whose schools did not offer a dual-enrollment program are excluded even if they took dual-enrollment courses independently. See footnote 1 for a definition of dual enrollment and dual-enrollment programs.
3 Parents’ socioeconomic status was calculated using parents’ education, occupation, and family income.
5 Student’s mathematics achievement was measured by a two-stage adaptive assessment in algebraic reasoning developed for HSLS:09.
2 These estimates include credits earned in AP courses, IB courses, and dual-enrollment courses that were offered through a program, and dual-enrollment courses taken independently. See footnote 1 for a definition of dual enrollment and dual-enrollment programs.
– 45 –

National Center for Education Statistics
Selected student and parent characteristics
Lowest fifth SES
Middle three-fifths
SES
Highest fifth SES
Lowest fifth SES
Middle three-fifths
SES
Highest fifth SES
Total 2.42 1.45 1.52 0.19 0.10 0.14
Student’s sex (2009)Female 3.07 1.81 1.87 0.21 0.11 0.16Male 2.79 1.73 1.96 0.27 0.19 0.17
Student’s race/ethnicity (2009)Asian 10.72 5.25 3.10 0.76 0.34 0.40Black/African American 4.50 3.50 5.10 0.31 0.26 0.65Hispanic/Latino 3.98 2.95 5.56 0.32 0.34 0.48Other 6.55 3.83 5.24 0.47 0.21 0.38White 2.63 1.64 1.58 0.23 0.10 0.14
Student’s native language (2009) English 1.98 1.47 1.56 0.16 0.10 0.15English and a non-English language 7.45 4.74 5.81 0.48 0.49 0.46Non-English 5.58 4.24 3.51 0.32 0.29 0.44
Parents’ highest level of education (2009) High school credential or less 2.39 1.81 † 0.19 0.16 †Undergraduate degree 6.53 2.09 2.02 0.29 0.13 0.17Graduate degree † 4.67 1.59 † 0.31 0.17
Student’s educational expectations (2009) High school credential 5.44 2.69 7.48 0.49 0.29 0.33Undergraduate degree 4.33 2.01 2.67 0.27 0.14 0.23Graduate degree 4.10 2.11 1.71 0.29 0.13 0.16Don’t know 4.60 2.13 3.23 0.31 0.19 0.22
Student’s mathematics achievement (2009) Lowest fifth 2.74 1.94 4.99 0.36 0.28 0.22Middle three-fifths 2.57 1.61 2.00 0.21 0.10 0.20Highest fifth 7.38 2.17 1.62 0.31 0.20 0.17
Student’s school sector (2012) Public 2.26 1.56 1.75 0.20 0.11 0.16
Regular 2.13 1.59 1.86 0.14 0.12 0.16Charter or special-program school 14.87 6.44 6.25 0.82 0.53 0.89Career/technical/vocational or alternative school † † † † 0.93 †
Private 24.02 4.08 3.30 0.67 0.15 0.19
Student’s school region (2012) Northeast 10.98 4.04 3.63 0.44 0.27 0.31Midwest 3.29 2.76 3.07 0.28 0.15 0.24South 3.07 2.11 2.22 0.34 0.21 0.21West 5.65 3.88 3.67 0.28 0.19 0.30
Table S7. Standard errors for table 7: Among fall 2009 ninth-graders who received a high school diploma by the fall of 2013, percentage of students in different socioeconomic status (SES) groups earning any high school credits in Advanced Placement (AP), International Baccalaureate (IB), and dual-enrollment courses and average number of high school credits earned, by selected student and parent characteristics: 2013
Percent earning any high school credits in AP, IB, and
dual-enrollment courses
Average high school credits earned by students earning any
high school credits in AP, IB, and dual-enrollment courses
See notes at end of table.
– 46 –

National Center for Education Statistics
Selected student and parent characteristics
Lowest fifth SES
Middle three-fifths
SES
Highest fifth SES
Lowest fifth SES
Middle three-fifths
SES
Highest fifth SES
Student’s school locale (2012) City 4.88 3.34 2.85 0.34 0.16 0.27Suburb 3.97 2.16 2.27 0.27 0.26 0.19Town 4.95 2.41 4.39 0.21 0.15 0.39Rural 3.16 2.97 3.58 0.28 0.17 0.23
Student’s school size (2012) Fewer than 500 students 4.34 3.73 4.53 0.23 0.20 0.24500 to 1,199 students 6.24 2.45 2.98 0.47 0.22 0.271,200 or more students 3.08 2.15 1.93 0.19 0.15 0.17
Student’s school percentage of students who received free or reduced-price lunch (2012)
Lowest fifth (0–18 percent of students) 13.05 2.65 2.35 0.55 0.19 0.17Middle three-fifths (19–67 percent of students) 2.87 2.01 2.11 0.25 0.13 0.21Highest fifth (68–100 percent of students) 3.88 3.49 7.76 0.37 0.39 0.68
Student’s school percentage of students who were non-Hispanic Black or African American, non-Hispanic American Indian or Alaska Native, and Hispanic or Latino students of any race (2009)
Lowest fifth (0–7 percent of students) 4.26 3.21 3.36 0.57 0.18 0.24Middle three-fifths (8–64 percent of students) 2.94 2.16 1.96 0.16 0.12 0.17Highest fifth (65–100 percent of students) 6.91 5.65 6.52 0.48 0.51 0.62
Student’s school percentage of English language learners (2012)
0 percent 8.21 3.47 3.76 0.36 0.20 0.321 to 5 percent 3.60 1.98 2.03 0.37 0.16 0.19More than 5 percent 3.76 2.73 3.12 0.19 0.21 0.29
Student’s school offerings (2012)Offers AP and/or IB course only 8.08 5.61 3.04 0.38 0.30 0.30Offers dual-enrollment program only 6.33 5.78 10.77 0.28 0.41 1.27Offers AP or IB courses and dual-enrollment program 2.83 1.70 1.69 0.24 0.13 0.17
High school from which student received diploma (2013)
Ninth-grade school 2.45 1.65 1.60 0.20 0.11 0.14Another high school 5.04 2.93 4.10 0.33 0.21 0.41
Table S7. Standard errors for table 7: Among fall 2009 ninth-graders who received a high school diploma by the fall of 2013, percentage of students in different socioeconomic status (SES) groups earning any high school credits in Advanced Placement (AP), International Baccalaureate (IB), and dual-enrollment courses and average number of high school credits earned, by selected student and parent characteristics: 2013—Continued
SOURCE: U.S. Department of Education, National Center for Education Statistics, High School Longitudinal Study of 2009 (HSLS:09) 2013 Update and High School Transcripts Restricted-use Data File.
Percent earning any high school credits in AP, IB, and
dual-enrollment courses
Average high school credits earned by students earning any
high school credits in AP, IB, and dual-enrollment courses
† Not applicable.
– 47 –

National Center for Education Statistics
Selected student and parent characteristicsAP Calculus
AB exam AP Biology
exam
AP English literature and
composition exam
AP U.S. History
exam
Total 53.4 50.3 52.8 49.6
Student’s sex (2009)Female 50.3 45.1 53.9 45.6Male 56.3 57.9 51.1 54.4
Student’s race/ethnicity (2009)1
Asian 63.8 62.3 53.4 53.3Black/African American ‡ ‡ 31.9 ! 38.2 !Hispanic/Latino 40.6 29.0 ! 31.3 ! 21.4 !Other 70.0 56.3 69.5 46.6White 55.4 57.1 60.7 61.3
Student’s native language (2009) English 55.5 51.1 56.9 53.8English and a non-English language 48.9 47.1 62.4 46.3Non-English 46.0 46.2 25.4 ! 26.3 !
Parents’ socioeconomic status (2009)2
Lowest fifth 17.9 ! ‡ ‡ ‡Middle three-fifths 50.3 48.3 50.1 42.7Highest fifth 65.9 59.6 70.2 68.5
Parents’ highest level of education (2009)High school credential or less 39.7 35.3 41.1 39.2Undergraduate degree 49.5 50.3 58.0 47.6Graduate degree 75.6 63.0 67.7 71.2
Student’s educational expectations (2009)High school credential ‡ ‡ ‡ ‡Undergraduate degree 46.2 48.6 50.2 43.6Graduate degree 55.3 50.6 56.2 52.3Don’t know 53.1 47.4 36.9 46.6
Student’s mathematics achievement (2009)3
Lowest fifth ‡ ‡ ‡ ‡Middle three-fifths 30.0 29.0 33.8 32.0Highest fifth 67.3 67.5 71.5 65.7
Table 8. Among fall 2009 ninth-graders who took selected Advanced Placement (AP) exams and received a high school diploma by the fall of 2013, percentage of test takers scoring 3 or above, by selected student and parent characteristics: 2013
Percent of test takers scoring 3 or above on the AP exam
See notes at end of table.
– 48 –

National Center for Education Statistics
Selected student and parent characteristicsAP Calculus
AB exam AP Biology
exam
AP English literature and
composition exam
AP U.S. History
exam
Student’s school sector (2012) Public 51.6 49.3 50.9 48.0
Regular 51.6 49.5 55.5 53.0Charter or special-program school 56.4 47.5 ! ‡ ‡Career/technical/vocational or alternative school ‡ ‡ ‡ ‡
Private 69.3 69.8 79.1 68.7
Student’s school region (2012) Northeast 59.1 53.8 49.5 57.6Midwest 49.5 50.0 57.2 57.5South 55.5 46.7 50.5 44.3West 48.3 53.1 60.6 48.2
Student’s school locale (2012) City 48.1 43.8 45.4 37.9Suburb 60.3 48.5 58.2 60.1Town 42.9 53.7 54.5 42.9Rural 56.7 68.2 57.2 54.1
Student’s school size (2012) Fewer than 500 students 50.1 66.8 69.7 59.9500 to 1,199 students 47.4 50.6 43.2 44.91,200 or more students 58.0 49.8 58.7 51.2
Student’s school percentage of students who received free or reduced-price lunch (2012)4
Lowest fifth (0–18 percent of students) 63.4 66.3 79.8 68.4Middle three-fifths (19–67 percent of students) 58.6 49.7 51.8 49.8Highest fifth (68–100 percent of students) 18.0 ! ‡ 25.2 15.1 !
Student’s school percentage of students who were non-Hispanic Black or African American, non-Hispanic American Indian or Alaska Native, and Hispanic or Latino students of any race (2009)5
Lowest fifth (0–7 percent of students) 63.9 59.5 59.8 63.5Middle three-fifths (8–64 percent of students) 53.8 57.4 64.1 60.6Highest fifth (65–100 percent of students) 40.0 ! ‡ 30.2 ! 13.0 !
Table 8. Among fall 2009 ninth-graders who took selected Advanced Placement (AP) exams and received a high school diploma by the fall of 2013, percentage of test takers scoring 3 or above, by selected student and parent characteristics: 2013—Continued
See notes at end of table.
Percent of test takers scoring 3 or above on the AP exam
– 49 –

National Center for Education Statistics
Selected student and parent characteristicsAP Calculus
AB exam AP Biology
exam
AP English literature and
composition exam
AP U.S. History
exam
Student’s school percentage of English language learners (2012)
0 percent 70.7 73.5 72.2 67.31 to 5 percent 52.3 46.4 52.8 49.8More than 5 percent 47.0 46.4 48.0 41.6
High school from which student received diploma (2013)
Ninth-grade school 53.2 50.9 53.9 50.4Another high school 56.9 39.7 39.1 39.1
Table 8. Among fall 2009 ninth-graders who took selected Advanced Placement (AP) exams and received a high school diploma by the fall of 2013, percentage of test takers scoring 3 or above, by selected student and parent characteristics: 2013—Continued
SOURCE: U.S. Department of Education, National Center for Education Statistics, High School Longitudinal Study of 2009 (HSLS:09) 2013 Update and High School Transcripts Restricted-use Data File.
NOTE: Estimates are based on fall 2009 ninth-graders who had taken selected Advanced Placement exams and received a high school diploma from any high school before September 2013, when the high school transcript data collection began. Students in this group whose exact graduation date is unknown are included. Students who had not received a diploma, received a diploma in the fall of 2013 or later, or for whom transcript data were incomplete are excluded. Students’ AP exam scores were collected from the College Board and high school transcripts. The lowest fifth, middle three-fifths, and highest fifth categories are based on the distribution of fall-term ninth-grade students. Data were weighted using the weight W3W1W2STUTR. This weight accounts for (1) base-year school nonresponse; (2) high school transcript nonresponse; and (3) student nonresponse in the base year, first follow-up, and 2013 Update.
5 Students in these racial/ethnic groups tend to be underrepresented in AP, IB, and dual-enrollment courses. These data were only collected from students’ ninth-grade schools in the base year of the study; data were not collected for any schools students had transferred to as of the first follow-up data collection. Therefore, estimates are based on 2009 data for students who received their high school diploma from their ninth-grade school.
4 To be eligible for free lunch under the National School Lunch Program (NSLP), a federally assisted meal program, a student must be from a household with an income at or below 130 percent of the poverty threshold. To be eligible for reduced-price lunch, a student must be from a household with an income between 130 percent and 185 percent of the poverty threshold. Therefore, the percentage of students receiving free or reduced-price lunch (FRPL) under the NSLP provides a proxy measure for the concentration of low-income students within a school. However, this percentage cannot be used as a strict measure of the percentage of children at or below 185 percent of the poverty threshold because some students are eligible for FRPL based on criteria other than income, and some schools and districts provide FRPL to all students regardless of income.
1 All race categories exclude Hispanic or Latino origin unless specified. “Other” includes American Indian, Alaska Native, Native Hawaiian, other Pacific Islander, and individuals who indicated Two or more races or Other.2 Parents’ socioeconomic status was calculated using parents’ education, occupation, and family income.3 Student’s mathematics achievement was measured by a two-stage adaptive assessment in algebraic reasoning developed for HSLS:09.
! Interpret data with caution. Estimate is unstable because the standard error is between 30 and 50 percent of the estimate.‡ Reporting standards not met either because the standard error is greater than 50 percent of the estimate or because there were too few cases for a reliable estimate.
Percent of test takers scoring 3 or above on the AP exam
– 50 –
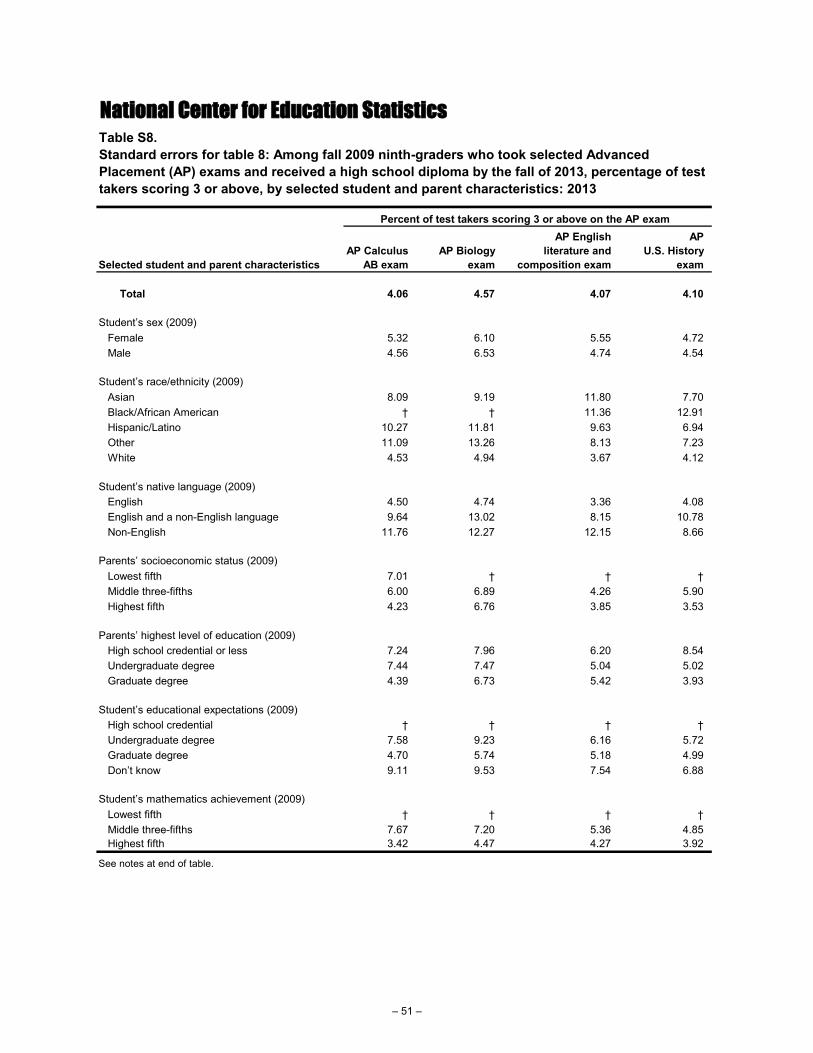
National Center for Education Statistics
Selected student and parent characteristicsAP Calculus
AB exam AP Biology
exam
AP English literature and
composition exam
AP U.S. History
exam
Total 4.06 4.57 4.07 4.10
Student’s sex (2009)Female 5.32 6.10 5.55 4.72Male 4.56 6.53 4.74 4.54
Student’s race/ethnicity (2009)Asian 8.09 9.19 11.80 7.70Black/African American † † 11.36 12.91Hispanic/Latino 10.27 11.81 9.63 6.94Other 11.09 13.26 8.13 7.23White 4.53 4.94 3.67 4.12
Student’s native language (2009) English 4.50 4.74 3.36 4.08English and a non-English language 9.64 13.02 8.15 10.78Non-English 11.76 12.27 12.15 8.66
Parents’ socioeconomic status (2009) Lowest fifth 7.01 † † †Middle three-fifths 6.00 6.89 4.26 5.90Highest fifth 4.23 6.76 3.85 3.53
Parents’ highest level of education (2009)High school credential or less 7.24 7.96 6.20 8.54Undergraduate degree 7.44 7.47 5.04 5.02Graduate degree 4.39 6.73 5.42 3.93
Student’s educational expectations (2009) High school credential † † † †Undergraduate degree 7.58 9.23 6.16 5.72Graduate degree 4.70 5.74 5.18 4.99Don’t know 9.11 9.53 7.54 6.88
Student’s mathematics achievement (2009) Lowest fifth † † † †Middle three-fifths 7.67 7.20 5.36 4.85Highest fifth 3.42 4.47 4.27 3.92
Table S8. Standard errors for table 8: Among fall 2009 ninth-graders who took selected Advanced Placement (AP) exams and received a high school diploma by the fall of 2013, percentage of test takers scoring 3 or above, by selected student and parent characteristics: 2013
See notes at end of table.
Percent of test takers scoring 3 or above on the AP exam
– 51 –

National Center for Education Statistics
Selected student and parent characteristicsAP Calculus
AB exam AP Biology
exam
AP English literature and
composition exam
AP U.S. History
exam
Student’s school sector (2012) Public 4.55 5.13 4.21 4.52
Regular 4.96 4.75 3.67 4.43Charter or special-program school 14.67 23.08 † †Career/technical/vocational or alternative school † † † †
Private 5.41 6.06 6.05 6.09
Student’s school region (2012) Northeast 9.15 7.83 12.73 12.17Midwest 9.24 8.82 9.79 7.27South 4.91 7.65 4.85 3.90West 11.68 11.90 8.96 12.39
Student’s school locale (2012) City 6.48 8.51 7.14 6.24Suburb 6.71 5.93 5.38 5.49Town 11.90 14.78 13.03 9.41Rural 10.88 9.73 5.83 9.18
Student’s school size (2012) Fewer than 500 students 9.44 9.39 6.62 8.46500 to 1,199 students 6.54 8.82 7.30 8.941,200 or more students 5.75 5.81 4.58 5.35
Student’s school percentage of students who received free or reduced-price lunch (2012)
Lowest fifth (0–18 percent of students) 5.07 6.30 3.97 5.01Middle three-fifths (19–67 percent of students) 5.94 7.38 5.43 6.12Highest fifth (68–100 percent of students) 7.66 † 6.80 6.11
Student’s school percentage of students who were non-Hispanic Black or African American, non-Hispanic American Indian or Alaska Native, and Hispanic or Latino students of any race (2009)
Lowest fifth (0–7 percent of students) 7.50 10.39 6.30 6.84Middle three-fifths (8–64 percent of students) 4.79 4.92 3.73 4.06Highest fifth (65–100 percent of students) 14.84 † 9.43 5.74
Table S8. Standard errors for table 8: Among fall 2009 ninth-graders who took selected Advanced Placement (AP) exams and received a high school diploma by the fall of 2013, percentage of test takers scoring 3 or above, by selected student and parent characteristics: 2013—Continued
Percent of test takers scoring 3 or above on the AP exam
See notes at end of table.
– 52 –

National Center for Education Statistics
Selected student and parent characteristicsAP Calculus
AB exam AP Biology
exam
AP English literature and
composition exam
AP U.S. History
exam
Student’s school percentage of English language learners (2012)
0 percent 6.60 7.59 6.66 8.021 to 5 percent 4.94 6.22 5.38 5.10More than 5 percent 9.37 8.52 6.76 9.15
High school from which student received diploma (2013)
Ninth-grade school 4.23 4.70 4.33 4.33Another high school 11.84 11.64 9.28 7.42
Percent of test takers scoring 3 or above on the AP exam
Table S8. Standard errors for table 8: Among fall 2009 ninth-graders who took selected Advanced Placement (AP) exams and received a high school diploma by the fall of 2013, percentage of test takers scoring 3 or above, by selected student and parent characteristics: 2013—Continued
SOURCE: U.S. Department of Education, National Center for Education Statistics, High School Longitudinal Study of 2009 (HSLS:09) 2013 Update and High School Transcripts Restricted-use Data File.
† Not applicable.
– 53 –

National Center for Education Statistics
Selected student and parent characteristics
Earned no AP, IB, or dual-
enrollment credits2
Earned up to 3 AP, IB, and dual-
enrollment credits3
Earned more than 3 AP, IB, and dual-
enrollment credits4
Total 881 1006 1145
Student’s sex (2009)Female 870 983 1109Male 894 1038 1186
Student’s race/ethnicity (2009)5
Asian 860 1004 1202Black/African American 790 866 1055Hispanic/Latino 831 928 1049Other 841 993 1141White 928 1052 1180
Student’s native language (2009) English 894 1021 1156English and a non-English language 814 987 1143Non-English 778 905 1077
Parents’ socioeconomic status (2009)6
Lowest fifth 800 888 994Middle three-fifths 878 985 1120Highest fifth 971 1080 1210
Parents’ highest level of education (2009)High school credential or less 843 955 1079Undergraduate degree 914 1026 1151Graduate degree 955 1087 1227
Student’s educational expectations (2009)High school credential 809 869 ‡Undergraduate degree 898 1007 1113Graduate degree 922 1025 1157Don’t know 831 981 1144
Student’s mathematics achievement (2009)7
Lowest fifth 731 808 ‡Middle three-fifths 884 963 1049Highest fifth 1057 1123 1228
Student’s school sector (2012) Public 877 1001 1140
Regular 889 1007 1147Charter or special-program school 759 941 1108Career/technical/vocational or alternative school 688 ‡ 981 !
Private 970 1085 1249
Average SAT or ACT exam score on the SAT scale1
Table 9. Among fall 2009 ninth-graders who took either the SAT or ACT college entrance exam and received a high school diploma by the fall of 2013, average SAT or ACT exam score on the SAT scale, by number of high school credits earned in Advanced Placement (AP), International Baccalaureate (IB), and dual-enrollment courses and selected student and parent characteristics: 2013
See notes at end of table.
– 54 –

National Center for Education Statistics
Selected student and parent characteristics
Earned no AP, IB, or dual-
enrollment credits2
Earned up to 3 AP, IB, and dual-
enrollment credits3
Earned more than 3 AP, IB, and dual-
enrollment credits4
Student’s school region (2012) Northeast 885 1045 1145Midwest 909 1022 1212South 859 975 1121West 875 1001 1149
Student’s school locale (2012) City 835 976 1134Suburb 897 1012 1160Town 877 1035 1167Rural 901 1016 1135
Student’s school size (2012) Fewer than 500 students 952 1057 1180500 to 1,199 students 856 1007 11281,200 or more students 871 1000 1152
Student’s school percentage of students who received free or reduced-price lunch (2012)8
Lowest fifth (0–18 percent of students) 968 1083 1228Middle three-fifths (19–67 percent of students) 882 1000 1132Highest fifth (68–100 percent of students) 800 892 1060
Student’s school percentage of students who were non-Hispanic Black or African American, non-Hispanic American Indian or Alaska Native, and Hispanic or Latino students of any race (2009)9
Lowest fifth (0–7 percent of students) 934 1052 1185Middle three-fifths (8–64 percent of students) 891 1023 1162Highest fifth (65–100 percent of students) 741 887 1059
Student’s school percentage of English language learners (2012)
0 percent 937 1058 12121 to 5 percent 883 1016 1135More than 5 percent 845 971 1138
High school from which student received diploma (2013)
Ninth-grade school 881 1011 1145Another high school 880 962 1144
Table 9. Among fall 2009 ninth-graders who took either the SAT or ACT college entrance exam and received a high school diploma by the fall of 2013, average SAT or ACT exam score on the SAT scale, by number of high school credits earned in Advanced Placement (AP), International Baccalaureate (IB), and dual-enrollment courses and selected student and parent characteristics: 2013—Continued
See notes at end of table.
Average SAT or ACT exam score on the SAT scale1
– 55 –

National Center for Education Statistics
‡ Reporting standards not met either because the standard error is greater than 50 percent of the estimate or because there were too few cases for a reliable estimate.
6 Parents’ socioeconomic status was calculated using parents’ education, occupation, and family income.7 Student’s mathematics achievement was measured by a two-stage adaptive assessment in algebraic reasoning developed for HSLS:09.
2 Dual enrollment refers to taking postsecondary courses while also enrolled in high school. Students may take dual-enrollment courses through a program offered by their high school or independently. A high school dual-enrollment program is an organized system with special guidelines that might have to do with, for example, entrance or eligibility requirements, funding, and limits on coursetaking. These estimates include college-entrance exam scores of students who did not earn any credits in AP courses, IB courses, and dual-enrollment courses that were offered through a program, or dual-enrollment courses taken independently.3 These estimates include college-entrance exam scores of students who earned up to a total of 3 credits in AP courses, IB courses, and dual-enrollment courses that were offered through a program, and dual-enrollment courses taken independently. See footnote 2 for a definition of dual enrollment and dual-enrollment programs.4 These estimates include college-entrance exam scores of students who earned a total of more than 3 credits in AP courses, IB courses, and dual-enrollment courses that were offered through a program, and dual-enrollment courses taken independently. See footnote 2 for a definition of dual enrollment and dual-enrollment programs.
SOURCE: U.S. Department of Education, National Center for Education Statistics, High School Longitudinal Study of 2009 (HSLS:09) 2013 Update and High School Transcripts Restricted-use Data File.
NOTE: Estimates are based on fall 2009 ninth-graders who had taken either the SAT or ACT and received a high school diploma from any high school before September 2013, when the high school transcript data collection began. Students in this group whose exact graduation date is unknown are included. Students who had not received a diploma, received a diploma in the fall of 2013 or later, or for whom transcript data were incomplete are excluded. Students’ high school credits earned were collected from the high school transcripts and reflect Carnegie units. The Carnegie unit is a standard of measurement that represents one credit for 120 hours of classroom time over the course of a year at the secondary-school level in the United States, equivalent to the completion of a 1-year academic course taken one period a day, 5 days a week. Among fall 2009 ninth-graders who received a high school diploma by the fall of 2013, those who earned any high school credits in AP, IB, or dual-enrollment courses earned on average 3.6 credits in these courses combined. College-entrance exam scores were collected from the College Board, ACT, and high school transcripts. The lowest fifth, middle three-fifths, and highest fifth categories are based on the distribution of fall-term ninth-grade students. Data were weighted using the weight W3W1W2STUTR. This weight accounts for (1) base-year school nonresponse; (2) high school transcript nonresponse; and (3) student nonresponse in the base year, first follow-up, and 2013 Update.
1 These estimates represent a composite of math and reading college-entrance exam scores. ACT scores were standardized to the SAT scale using the ACT-to-SAT concordance scale.
9 Students in these racial/ethnic groups tend to be underrepresented in AP, IB, and dual-enrollment courses. These data were only collected from students’ ninth-grade schools in the base year of the study; data were not collected for any schools students had transferred to as of the first follow-up data collection. Therefore, estimates are based on 2009 data for students who received their high school diploma from their ninth-grade school.
8 To be eligible for free lunch under the National School Lunch Program (NSLP), a federally assisted meal program, a student must be from a household with an income at or below 130 percent of the poverty threshold. To be eligible for reduced-price lunch, a student must be from a household with an income between 130 percent and 185 percent of the poverty threshold. Therefore, the percentage of students receiving free or reduced-price lunch (FRPL) under the NSLP provides a proxy measure for the concentration of low-income students within a school. However, this percentage cannot be used as a strict measure of the percentage of children at or below 185 percent of the poverty threshold because some students are eligible for FRPL based on criteria other than income, and some schools and districts provide FRPL to all students regardless of income.
5 All race categories exclude Hispanic or Latino origin unless specified. “Other” includes American Indian, Alaska Native, Native Hawaiian, other Pacific Islander, and individuals who indicated Two or more races or Other.
! Interpret data with caution. Estimate is unstable because the standard error is between 30 and 50 percent of the estimate.
Table 9. Among fall 2009 ninth-graders who took either the SAT or ACT college entrance exam and received a high school diploma by the fall of 2013, average SAT or ACT exam score on the SAT scale, by number of high school credits earned in Advanced Placement (AP), International Baccalaureate (IB), and dual-enrollment courses and selected student and parent characteristics: 2013—Continued
– 56 –

National Center for Education Statistics
Selected student and parent characteristics
Earned no AP, IB, or dual-
enrollment credits
Earned up to 3 AP, IB, and dual-
enrollment credits
Earned more than 3 AP, IB, and dual-
enrollment credits
Total 8.5 7.7 9.3
Student’s sex (2009)Female 11.8 8.7 11.3Male 9.1 10.5 10.3
Student’s race/ethnicity (2009)Asian 24.5 24.1 26.0Black/African American 15.8 22.3 35.7Hispanic/Latino 17.9 17.7 17.7Other 27.8 19.2 26.4White 6.6 6.8 10.0
Student’s native language (2009) English 9.3 7.1 9.6English and a non-English language 24.8 28.9 31.1Non-English 21.0 22.5 28.7
Parents’ socioeconomic status (2009) Lowest fifth 11.9 20.1 21.0Middle three-fifths 10.8 8.7 10.4Highest fifth 12.1 10.1 12.0
Parents’ highest level of education (2009)High school credential or less 11.0 13.8 13.9Undergraduate degree 13.1 8.9 11.6Graduate degree 15.4 12.4 13.7
Student’s educational expectations (2009)High school credential 18.7 47.4 †Undergraduate degree 10.2 13.2 15.6Graduate degree 10.8 8.5 11.9Don’t know 13.8 17.4 15.5
Student’s mathematics achievement (2009) Lowest fifth 12.4 22.5 †Middle three-fifths 7.5 7.7 10.5Highest fifth 11.6 8.2 8.5
Student’s school sector (2012) Public 9.0 7.9 9.8
Regular 7.2 7.5 10.2Charter or special-program school 55.9 43.2 34.2Career/technical/vocational or alternative school 64.5 † 488.6
Private 14.9 23.4 14.9
Average SAT or ACT exam score on the SAT scale
See notes at end of table.
Table S9. Standard errors for table 9: Among fall 2009 ninth-graders who took either the SAT or ACT college entrance exam and received a high school diploma by the fall of 2013, average SAT or ACT exam score on the SAT scale, by number of high school credits earned in Advanced Placement (AP), International Baccalaureate (IB), and dual-enrollment courses and selected student and parent characteristics: 2013
– 57 –

National Center for Education Statistics
Selected student and parent characteristics
Earned no AP, IB, or dual-
enrollment credits
Earned up to 3 AP, IB, and dual-
enrollment credits
Earned more than 3 AP, IB, and dual-
enrollment credits
Student’s school region (2012) Northeast 21.6 21.4 20.5Midwest 14.5 14.2 21.5South 12.0 11.7 11.7West 18.1 20.7 26.7
Student’s school locale (2012) City 27.4 17.4 16.3Suburb 8.0 12.0 13.0Town 18.0 18.8 33.2Rural 10.4 10.6 16.9
Student’s school size (2012) Fewer than 500 students 13.8 14.2 29.0500 to 1,199 students 16.4 14.8 21.31,200 or more students 11.0 9.6 11.9
Student’s school percentage of students who received free or reduced-price lunch (2012)
Lowest fifth (0–18 percent of students) 12.2 9.9 11.0Middle three-fifths (19–67 percent of students) 11.6 9.2 11.4Highest fifth (68–100 percent of students) 16.8 22.2 29.1
Student’s school percentage of students who were non-Hispanic Black or African American, non-Hispanic American Indian or Alaska Native, and Hispanic or Latino students of any race (2009)
Lowest fifth (0–7 percent of students) 11.2 11.0 26.5Middle three-fifths (8–64 percent of students) 10.7 9.7 10.3Highest fifth (65–100 percent of students) 21.4 22.4 19.7
Student’s school percentage of English language learners (2012)
0 percent 12.4 20.9 20.31 to 5 percent 11.3 9.2 11.8More than 5 percent 15.5 16.9 20.1
High school from which student received diploma (2013)
Ninth-grade school 9.0 8.0 9.9Another high school 18.3 23.9 33.2
SOURCE: U.S. Department of Education, National Center for Education Statistics, High School Longitudinal Study of 2009 (HSLS:09) 2013 Update and High School Transcripts Restricted-use Data File.
† Not applicable.
Average SAT or ACT exam score on the SAT scale
Table S9. Standard errors for table 9: Among fall 2009 ninth-graders who took either the SAT or ACT college entrance exam and received a high school diploma by the fall of 2013, average SAT or ACT exam score on the SAT scale, by number of high school credits earned in Advanced Placement (AP), International Baccalaureate (IB), and dual-enrollment courses and selected student and parent characteristics: 2013—Continued
– 58 –

National Center for Education Statistics
Selected student and parent characteristics
Earned no AP, IB, or dual-
enrollment credits2
Earned AP or IB credits only
Earned dual-enrollment
credits only3
Earned both AP or IB and dual-
enrollment credits4
Total 881 1075 973 1093
Student’s sex (2009)Female 870 1044 960 1051Male 894 1114 988 1151
Student’s race/ethnicity (2009)5
Asian 860 1135 ‡ 1159Black/African American 790 968 793 964Hispanic/Latino 831 983 906 1006Other 841 1058 1013 1086White 928 1117 1003 1125
Student’s native language (2009) English 894 1090 981 1093English and a non-English language 814 1069 926 1131Non-English 778 996 806 1067
Parents’ socioeconomic status (2009)6
Lowest fifth 800 937 ‡ 995Middle three-fifths 878 1045 966 1068Highest fifth 971 1156 1040 1144
Parents’ highest level of education (2009)High school credential or less 843 1012 937 1034Undergraduate degree 914 1095 985 1082Graduate degree 955 1167 1046 1177
Student’s educational expectations (2009) High school credential 809 977 ‡ ‡Undergraduate degree 898 1056 997 1057Graduate degree 922 1094 999 1113Don’t know 831 1050 943 1077
Student’s mathematics achievement (2009)7
Lowest fifth 731 809 ‡ ‡Middle three-fifths 884 1000 937 1015Highest fifth 1057 1190 1106 1185
Student’s school sector (2012) Public 877 1069 980 1097
Regular 889 1072 981 1095Charter or special-program school 759 1063 928 ! 1144Career/technical/vocational or alternative school 688 740 ! ‡ ‡
Private 970 1154 1016 1166
Table 10. Among fall 2009 ninth-graders who took either the SAT or ACT college entrance exam and received a high school diploma by the fall of 2013, average SAT or ACT exam score on the SAT scale, by type of high school credits earned and selected student and parent characteristics: 2013
See notes at end of table.
Average SAT or ACT exam score on the SAT scale1
– 59 –
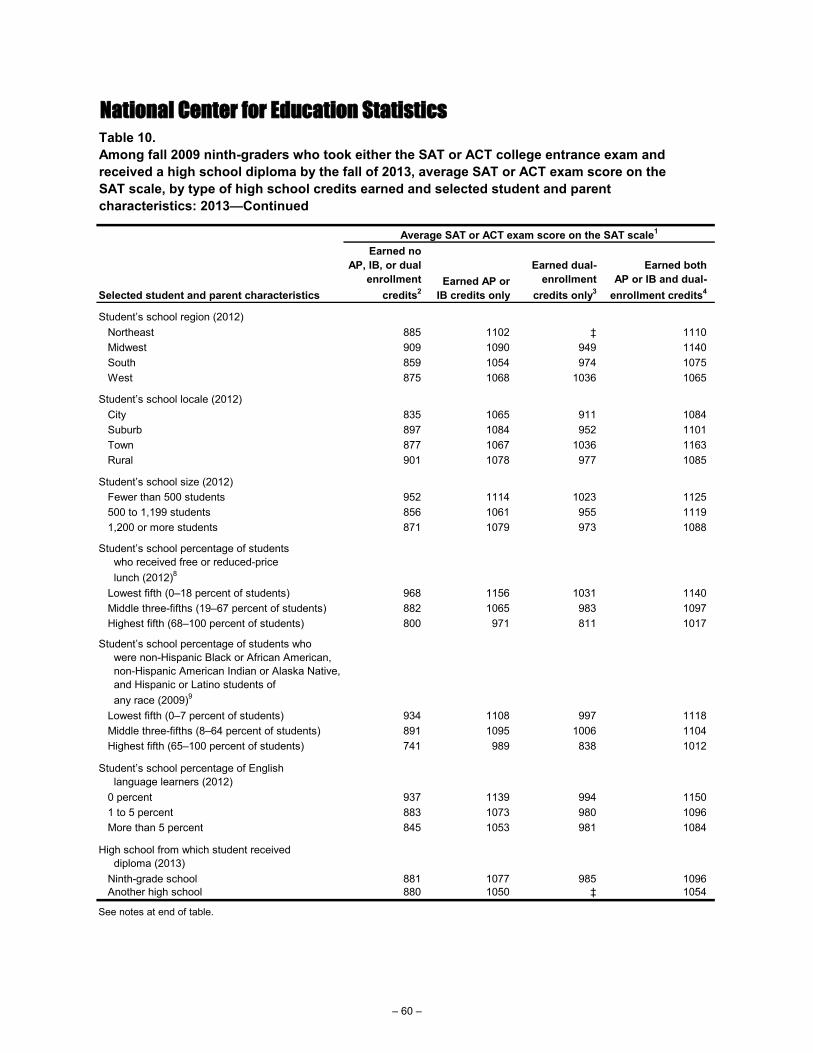
National Center for Education Statistics
Selected student and parent characteristics
Earned no AP, IB, or dual-
enrollment credits2
Earned AP or IB credits only
Earned dual-enrollment
credits only3
Earned both AP or IB and dual-
enrollment credits4
Student’s school region (2012) Northeast 885 1102 ‡ 1110Midwest 909 1090 949 1140South 859 1054 974 1075West 875 1068 1036 1065
Student’s school locale (2012) City 835 1065 911 1084Suburb 897 1084 952 1101Town 877 1067 1036 1163Rural 901 1078 977 1085
Student’s school size (2012) Fewer than 500 students 952 1114 1023 1125500 to 1,199 students 856 1061 955 11191,200 or more students 871 1079 973 1088
Student’s school percentage of students who received free or reduced-price lunch (2012)8
Lowest fifth (0–18 percent of students) 968 1156 1031 1140Middle three-fifths (19–67 percent of students) 882 1065 983 1097Highest fifth (68–100 percent of students) 800 971 811 1017
Student’s school percentage of students who were non-Hispanic Black or African American, non-Hispanic American Indian or Alaska Native, and Hispanic or Latino students of any race (2009)9
Lowest fifth (0–7 percent of students) 934 1108 997 1118Middle three-fifths (8–64 percent of students) 891 1095 1006 1104Highest fifth (65–100 percent of students) 741 989 838 1012
Student’s school percentage of English language learners (2012)
0 percent 937 1139 994 11501 to 5 percent 883 1073 980 1096More than 5 percent 845 1053 981 1084
High school from which student received diploma (2013)
Ninth-grade school 881 1077 985 1096Another high school 880 1050 ‡ 1054
Average SAT or ACT exam score on the SAT scale1
See notes at end of table.
Table 10. Among fall 2009 ninth-graders who took either the SAT or ACT college entrance exam and received a high school diploma by the fall of 2013, average SAT or ACT exam score on the SAT scale, by type of high school credits earned and selected student and parent characteristics: 2013—Continued
– 60 –

National Center for Education Statistics
SOURCE: U.S. Department of Education, National Center for Education Statistics, High School Longitudinal Study of 2009 (HSLS:09) 2013 Update and High School Transcripts Restricted-use Data File.
Table 10. Among fall 2009 ninth-graders who took either the SAT or ACT college entrance exam and received a high school diploma by the fall of 2013, average SAT or ACT exam score on the SAT scale, by type of high school credits earned and selected student and parent characteristics: 2013—Continued
8 To be eligible for free lunch under the National School Lunch Program (NSLP), a federally assisted meal program, a student must be from a household with an income at or below 130 percent of the poverty threshold. To be eligible for reduced-price lunch, a student must be from a household with an income between 130 percent and 185 percent of the poverty threshold. Therefore, the percentage of students receiving free or reduced-price lunch (FRPL) under the NSLP provides a proxy measure for the concentration of low-income students within a school. However, this percentage cannot be used as a strict measure of the percentage of children at or below 185 percent of the poverty threshold because some students are eligible for FRPL based on criteria other than income, and some schools and districts provide FRPL to all students regardless of income.
2 Dual enrollment refers to taking postsecondary courses while also enrolled in high school. Students may take dual-enrollment courses through a program offered by their high school or independently. A high school dual-enrollment program is an organized system with special guidelines that might have to do with, for example, entrance or eligibility requirements, funding, and limits on coursetaking. These estimates include college-entrance exam scores of students who did not earn any credits in AP courses, IB courses, and dual-enrollment courses that were offered through a program, or dual-enrollment courses taken independently.
4 These estimates include college-entrance exam scores of students who earned credits in AP or IB courses and credits in dual-enrollment courses that were offered through a program or taken independently. See footnote 2 for a definition of dual enrollment and dual-enrollment programs.
3 These estimates include college-entrance exam scores of students who earned credits in dual-enrollment courses that were offered through a program or taken independently but who did not earn any credits in AP or IB courses. See footnote 2 for a definition of dual enrollment and dual-enrollment programs.
7 Student’s mathematics achievement was measured by a two-stage adaptive assessment in algebraic reasoning developed for HSLS:09.
! Interpret data with caution. Estimate is unstable because the standard error is between 30 and 50 percent of the estimate.‡ Reporting standards not met either because the standard error is greater than 50 percent of the estimate or because there were too few cases for a reliable estimate.
NOTE: AP = Advanced Placement; IB = International Baccalaureate. Estimates are based on fall 2009 ninth-graders who had taken either the SAT or ACT and received a high school diploma from any high school before September 2013, when the high school transcript data collection began. Students in this group whose exact graduation date is unknown are included. Students who had not received a diploma, received a diploma in the fall of 2013 or later, or for whom transcript data were incomplete are excluded. Students’ high school credits earned were collected from the high school transcripts and reflect Carnegie units. The Carnegie unit is a standard of measurement that represents one credit for 120 hours of classroom time over the course of a year at the secondary-school level in the United States, equivalent to the completion of a 1-year academic course taken one period a day, 5 days a week. College-entrance exam scores were collected from the College Board, ACT, and high school transcripts. The lowest fifth, middle three-fifths, and highest fifth categories are based on the distribution of fall-term ninth-grade students. Data were weighted using the weight W3W1W2STUTR. This weight accounts for (1) base-year school nonresponse; (2) high school transcript nonresponse; and (3) student nonresponse in the base year, first follow-up, and 2013 Update.
9 Students in these racial/ethnic groups tend to be underrepresented in AP, IB, and dual-enrollment courses. These data were only collected from students’ ninth-grade schools in the base year of the study; data were not collected for any schools students had transferred to as of the first follow-up data collection. Therefore, estimates are based on 2009 data for students who received their high school diploma from their ninth-grade school.
5 All race categories exclude Hispanic or Latino origin unless specified. “Other” includes American Indian, Alaska Native, Native Hawaiian, other Pacific Islander, and individuals who indicated Two or more races or Other.
1 These estimates represent a composite of math and reading college-entrance exam scores. ACT scores were standardized to the SAT scale using the ACT-to-SAT concordance scale.
6 Parents’ socioeconomic status was calculated using parents’ education, occupation, and family income.
– 61 –

National Center for Education Statistics
Selected student and parent characteristics
Earned no AP, IB, or dual-
enrollment credits
Earned AP or IB credits only
Earned dual-enrollment
credits only
Earned both AP or IB and dual-enrollment credits
Total 8.5 7.9 19.8 11.4
Student’s sex (2009)Female 11.8 8.4 27.9 14.9Male 9.1 10.6 22.0 13.6
Student’s race/ethnicity (2009)Asian 24.5 28.2 † 32.1Black/African American 15.8 27.0 53.0 51.1Hispanic/Latino 17.9 16.0 49.4 28.4Other 27.8 19.7 47.0 32.2White 6.6 7.4 16.1 10.7
Student’s native language (2009) English 9.3 7.4 17.3 13.0English and a non-English language 24.8 20.7 21.1 31.6Non-English 21.0 26.6 90.0 35.2
Parents’ socioeconomic status (2009) Lowest fifth 11.9 21.4 † 35.3Middle three-fifths 10.8 8.5 20.8 14.5Highest fifth 12.1 10.8 21.6 19.5
Parents’ highest level of education (2009)High school credential or less 11.0 13.4 27.6 21.8Undergraduate degree 13.1 8.6 21.5 16.2Graduate degree 15.4 12.4 22.1 22.2
Student’s educational expectations (2009) High school credential 18.7 69.0 † †Undergraduate degree 10.2 12.2 25.1 24.4Graduate degree 10.8 9.7 17.6 15.1Don’t know 13.8 15.6 30.2 40.2
Student’s mathematics achievement (2009) Lowest fifth 12.4 26.4 † †Middle three-fifths 7.5 7.5 18.8 12.7Highest fifth 11.6 6.7 22.5 13.9
Student’s school sector (2012) Public 9.0 7.9 18.2 11.3
Regular 7.2 8.2 18.5 11.5Charter or special-program school 55.9 24.4 309.2 88.5Career/technical/vocational or alternative school 64.5 298.0 † †
Private 14.9 23.0 44.9 25.0
See notes at end of table.
Table S10. Standard errors for table 10: Among fall 2009 ninth-graders who took either the SAT or ACT college entrance exam and received a high school diploma by the fall of 2013, average SAT or ACT exam score on the SAT scale, by type of high school credits earned and selected student and parent characteristics: 2013
Average SAT or ACT exam score on the SAT scale
– 62 –

National Center for Education Statistics
Selected student and parent characteristics
Earned no AP, IB, or dual-
enrollment credits
Earned AP or IB credits only
Earned dual-enrollment
credits only
Earned both AP or IB and dual-enrollment credits
Student’s school region (2012) Northeast 21.6 17.0 † 32.5Midwest 14.5 13.9 45.3 28.4South 12.0 11.3 23.4 13.9West 18.1 23.5 27.8 34.7
Student’s school locale (2012) City 27.4 15.3 68.3 28.4Suburb 8.0 10.4 45.7 21.1Town 18.0 22.3 25.9 46.5Rural 10.4 15.7 24.6 12.5
Student’s school size (2012) Fewer than 500 students 13.8 16.6 20.7 37.2500 to 1,199 students 16.4 15.2 38.2 17.91,200 or more students 11.0 10.3 24.9 15.7
Student’s school percentage of students who received free or reduced-price lunch (2012)
Lowest fifth (0–18 percent of students) 12.2 10.7 21.5 16.7Middle three-fifths (19–67 percent of students) 11.6 9.7 17.5 14.1Highest fifth (68–100 percent of students) 16.8 23.6 116.6 30.0
Student’s school percentage of students who were non-Hispanic Black or African American, non-Hispanic American Indian or Alaska Native, and Hispanic or Latino students of any race (2009)
Lowest fifth (0–7 percent of students) 11.2 12.7 23.9 20.2Middle three-fifths (8–64 percent of students) 10.7 9.8 22.3 17.7Highest fifth (65–100 percent of students) 21.4 21.7 106.0 16.6
Student’s school percentage of English language learners (2012)
0 percent 12.4 21.1 39.5 27.61 to 5 percent 11.3 8.5 21.5 11.5More than 5 percent 15.5 18.7 46.9 29.1
High school from which student received diploma (2013)
Ninth-grade school 9.0 8.4 15.9 11.1Another high school 18.3 23.0 † 57.9
SOURCE: U.S. Department of Education, National Center for Education Statistics, High School Longitudinal Study of 2009 (HSLS:09) 2013 Update and High School Transcripts Restricted-use Data File.
† Not applicable.
Average SAT or ACT exam score on the SAT scale
Table S10. Standard errors for table 10: Among fall 2009 ninth-graders who took either the SAT or ACT college entrance exam and received a high school diploma by the fall of 2013, average SAT or ACT exam score on the SAT scale, by type of high school credits earned and selected student and parent characteristics: 2013—Continued
– 63 –
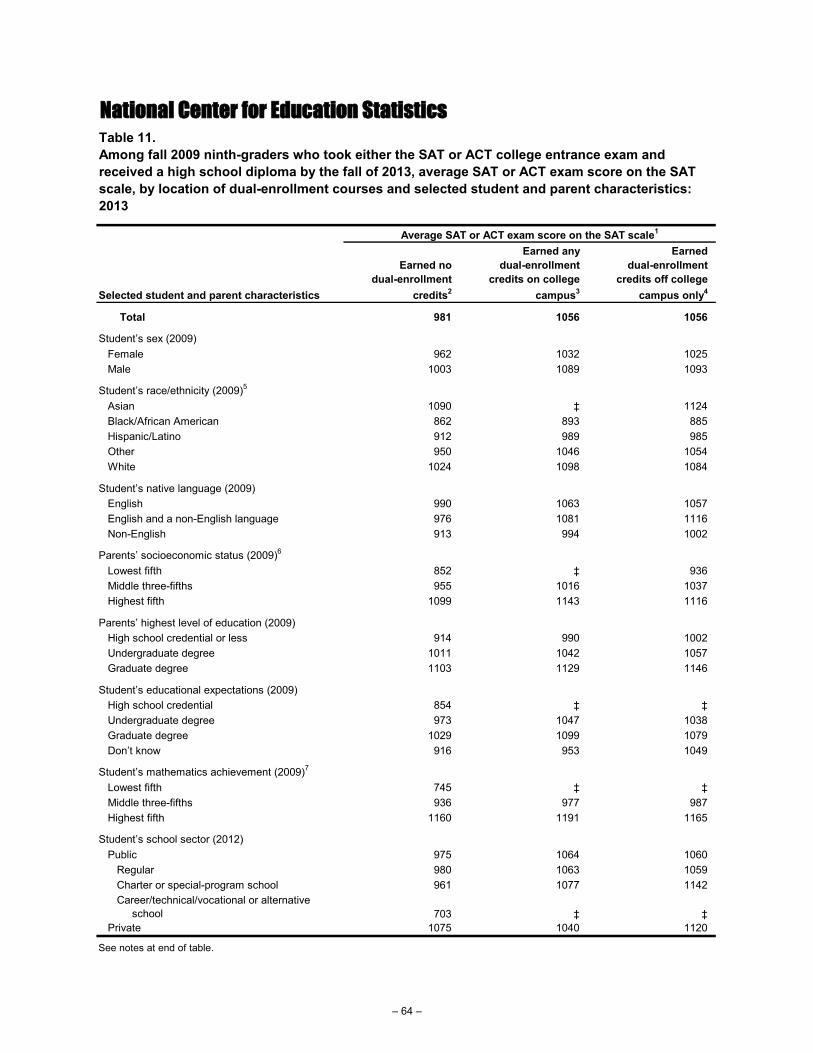
National Center for Education Statistics
Selected student and parent characteristics
Earned no dual-enrollment
credits2
Earned any dual-enrollment
credits on college campus3
Earned dual-enrollment
credits off college campus only4
Total 981 1056 1056
Student’s sex (2009)Female 962 1032 1025Male 1003 1089 1093
Student’s race/ethnicity (2009)5
Asian 1090 ‡ 1124Black/African American 862 893 885Hispanic/Latino 912 989 985Other 950 1046 1054White 1024 1098 1084
Student’s native language (2009) English 990 1063 1057English and a non-English language 976 1081 1116Non-English 913 994 1002
Parents’ socioeconomic status (2009)6
Lowest fifth 852 ‡ 936Middle three-fifths 955 1016 1037Highest fifth 1099 1143 1116
Parents’ highest level of education (2009)High school credential or less 914 990 1002Undergraduate degree 1011 1042 1057Graduate degree 1103 1129 1146
Student’s educational expectations (2009) High school credential 854 ‡ ‡Undergraduate degree 973 1047 1038Graduate degree 1029 1099 1079Don’t know 916 953 1049
Student’s mathematics achievement (2009)7
Lowest fifth 745 ‡ ‡Middle three-fifths 936 977 987Highest fifth 1160 1191 1165
Student’s school sector (2012) Public 975 1064 1060
Regular 980 1063 1059Charter or special-program school 961 1077 1142Career/technical/vocational or alternative school 703 ‡ ‡
Private 1075 1040 1120
Table 11. Among fall 2009 ninth-graders who took either the SAT or ACT college entrance exam and received a high school diploma by the fall of 2013, average SAT or ACT exam score on the SAT scale, by location of dual-enrollment courses and selected student and parent characteristics: 2013
Average SAT or ACT exam score on the SAT scale1
See notes at end of table.
– 64 –
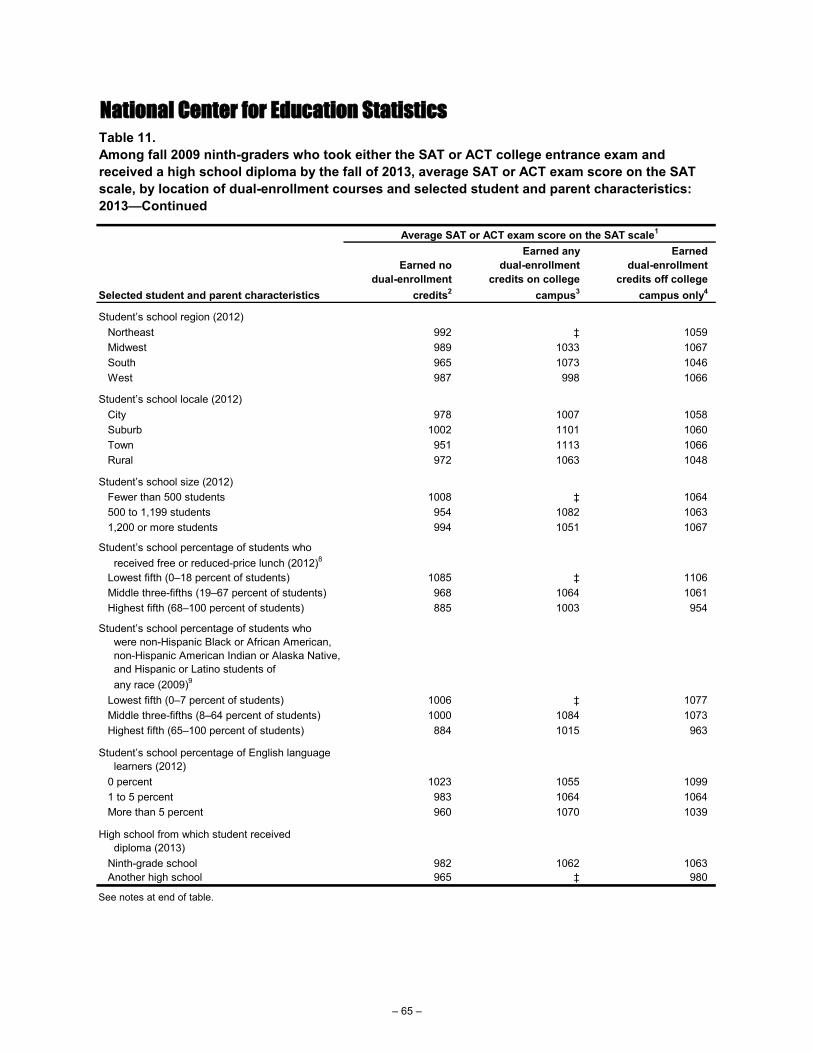
National Center for Education Statistics
Selected student and parent characteristics
Earned no dual-enrollment
credits2
Earned any dual-enrollment
credits on college campus3
Earned dual-enrollment
credits off college campus only4
Student’s school region (2012) Northeast 992 ‡ 1059Midwest 989 1033 1067South 965 1073 1046West 987 998 1066
Student’s school locale (2012) City 978 1007 1058Suburb 1002 1101 1060Town 951 1113 1066Rural 972 1063 1048
Student’s school size (2012) Fewer than 500 students 1008 ‡ 1064500 to 1,199 students 954 1082 10631,200 or more students 994 1051 1067
Student’s school percentage of students who received free or reduced-price lunch (2012)8
Lowest fifth (0–18 percent of students) 1085 ‡ 1106Middle three-fifths (19–67 percent of students) 968 1064 1061Highest fifth (68–100 percent of students) 885 1003 954
Student’s school percentage of students who were non-Hispanic Black or African American, non-Hispanic American Indian or Alaska Native, and Hispanic or Latino students of any race (2009)9
Lowest fifth (0–7 percent of students) 1006 ‡ 1077Middle three-fifths (8–64 percent of students) 1000 1084 1073Highest fifth (65–100 percent of students) 884 1015 963
Student’s school percentage of English language learners (2012)
0 percent 1023 1055 10991 to 5 percent 983 1064 1064More than 5 percent 960 1070 1039
High school from which student received diploma (2013)
Ninth-grade school 982 1062 1063Another high school 965 ‡ 980
Table 11. Among fall 2009 ninth-graders who took either the SAT or ACT college entrance exam and received a high school diploma by the fall of 2013, average SAT or ACT exam score on the SAT scale, by location of dual-enrollment courses and selected student and parent characteristics: 2013—Continued
See notes at end of table.
Average SAT or ACT exam score on the SAT scale1
– 65 –

National Center for Education Statistics
NOTE: Estimates are based on fall 2009 ninth-graders who had taken either the SAT or ACT and received a high school diploma from any high school before September 2013, when the high school transcript data collection began. Students in this group whose exact graduation date is unknown are included. Students who had not received a diploma, received a diploma in the fall of 2013 or later, or for whom transcript data were incomplete are excluded. Students’ high school credits earned were collected from the high school transcripts and reflect Carnegie units. The Carnegie unit is a standard of measurement that represents one credit for 120 hours of classroom time over the course of a year at the secondary-school level in the United States, equivalent to the completion of a 1-year academic course taken one period a day, 5 days a week. College entrance exam scores were collected from the College Board, ACT, and high school transcripts. The lowest fifth, middle three-fifths, and highest fifth categories are based on the distribution of fall-term ninth-grade students. Data were weighted using the weight W3W1W2STUTR. This weight accounts for (1) base-year school nonresponse; (2) high school transcript nonresponse; and (3) student nonresponse in the base year, first follow-up, and 2013 Update.
9 Students in these racial/ethnic groups tend to be underrepresented in Advanced Placement, International Baccalaureate, and dual-enrollment courses. These data were only collected from students’ ninth-grade schools in the base year of the study; data were not collected for any schools students had transferred to as of the first follow-up data collection. Therefore, estimates are based on 2009 data for students who received their high school diploma from their ninth-grade school.
8 To be eligible for free lunch under the National School Lunch Program (NSLP), a federally assisted meal program, a student must be from a household with an income at or below 130 percent of the poverty threshold. To be eligible for reduced-price lunch, a student must be from a household with an income between 130 percent and 185 percent of the poverty threshold. Therefore, the percentage of students receiving free or reduced-price lunch (FRPL) under the NSLP provides a proxy measure for the concentration of low-income students within a school. However, this percentage cannot be used as a strict measure of the percentage of children at or below 185 percent of the poverty threshold because some students are eligible for FRPL based on criteria other than income, and some schools and districts provide FRPL to all students regardless of income.
4 These estimates include college-entrance exam scores of students who only earned dual-enrollment credits in a course taken off of a college campus. This includes dual-enrollment courses that were offered through a program and dual-enrollment courses taken independently. See footnote 2 for a definition of dual enrollment and dual-enrollment programs. Courses taken at high schools, career or vocational centers, and online are included. Courses taken at community colleges and 4-year colleges and universities are excluded.
6 Parents’ socioeconomic status was calculated using parents’ education, occupation, and family income.7 Student’s mathematics achievement was measured by a two-stage adaptive assessment in algebraic reasoning developed for HSLS:09.
3 These estimates include college-entrance exam scores of students who earned dual-enrollment credits in a course taken on a college campus. This includes dual-enrollment courses that were offered through a program and dual-enrollment courses taken independently. See footnote 2 for a definition of dual enrollment and dual-enrollment programs. Courses taken at community colleges and 4-year colleges and universities are included. Courses taken at high schools, career or vocational centers, and online are excluded.
1 These estimates represent a composite of math and reading college-entrance exam scores. ACT scores were standardized to the SAT scale using the ACT-to-SAT concordance scale. 2 Dual enrollment refers to taking postsecondary courses while also enrolled in high school. Students may take dual-enrollment courses through a program offered by their high school or independently. A high school dual-enrollment program is an organized system with special guidelines that might have to do with, for example, entrance or eligibility requirements, funding, and limits on coursetaking. These estimates include college-entrance exam scores of students who did not earn any credits in dual-enrollment courses that were offered through a program or taken independently.
5 All race categories exclude Hispanic or Latino origin unless specified. “Other” includes American Indian, Alaska Native, Native Hawaiian, other Pacific Islander, and individuals who indicated Two or more races or Other.
‡ Reporting standards not met either because the standard error is greater than 50 percent of the estimate or because there were too few cases for a reliable estimate.
Table 11. Among fall 2009 ninth-graders who took either the SAT or ACT college entrance exam and received a high school diploma by the fall of 2013, average SAT or ACT exam score on the SAT scale, by location of dual-enrollment courses and selected student and parent characteristics: 2013—Continued
SOURCE: U.S. Department of Education, National Center for Education Statistics, High School Longitudinal Study of 2009 (HSLS:09) 2013 Update and High School Transcripts Restricted-use Data File.
– 66 –

National Center for Education Statistics
Selected student and parent characteristics
Earned no dual-enrollment
credits
Earned any dual-enrollment
credits on college campus
Earned dual-enrollment
credits off college campus only
Total 6.9 23.8 11.1
Student’s sex (2009)Female 8.1 26.4 14.7Male 8.7 39.9 15.3
Student’s race/ethnicity (2009)Asian 26.1 † 46.4Black/African American 12.8 204.4 37.4Hispanic/Latino 13.5 73.2 26.2Other 23.8 53.7 26.9White 6.1 22.2 12.0
Student’s native language (2009) English 6.7 29.6 10.5English and a non-English language 21.0 55.7 31.0Non-English 20.8 40.8 56.9
Parents’ socioeconomic status (2009) Lowest fifth 13.1 † 33.9Middle three-fifths 7.3 35.9 12.3Highest fifth 9.4 29.5 17.3
Parents’ highest level of education (2009)High school credential or less 10.4 27.8 18.4Undergraduate degree 8.0 44.8 12.4Graduate degree 11.1 44.8 20.1
Student’s educational expectations (2009)High school credential 15.6 † †Undergraduate degree 8.2 42.2 18.9Graduate degree 8.0 29.7 12.9Don’t know 13.6 67.0 24.1
Student’s mathematics achievement (2009) Lowest fifth 12.1 † †Middle three-fifths 5.6 28.2 12.0Highest fifth 5.9 26.4 12.6
Student’s school sector (2012) Public 7.0 25.3 10.2
Regular 6.5 26.8 10.2Charter or special-program school 34.1 319.4 110.7Career/technical/vocational or alternative school 80.8 † †
Private 17.8 59.2 24.0
Table S11. Standard errors for table 11: Among fall 2009 ninth-graders who took either the SAT or ACT college entrance exam and received a high school diploma by the fall of 2013, average SAT or ACT exam score on the SAT scale, by location of dual-enrollment courses and selected student and parent characteristics: 2013
Average SAT or ACT exam score on the SAT scale
See notes at end of table.
– 67 –

National Center for Education Statistics
Selected student and parent characteristics
Earned no dual-enrollment
credits
Earned any dual-enrollment
credits on college campus
Earned dual-enrollment
credits off college campus only
Student’s school region (2012) Northeast 14.9 † 28.3Midwest 13.0 59.1 38.5South 10.3 25.2 12.4West 20.2 46.5 20.2
Student’s school locale (2012) City 18.5 61.5 33.4Suburb 9.0 28.8 20.3Town 16.3 143.9 30.6Rural 10.4 32.4 12.9
Student’s school size (2012) Fewer than 500 students 12.3 † 23.4500 to 1,199 students 14.1 53.9 20.91,200 or more students 10.1 35.7 13.1
Student’s school percentage of students who received free or reduced-price lunch (2012)
Lowest fifth (0–18 percent of students) 10.4 † 17.0Middle three-fifths (19–67 percent of students) 9.4 32.8 11.0Highest fifth (68–100 percent of students) 17.9 46.6 50.8
Student’s school percentage of students who were non-Hispanic Black or African American, non-Hispanic American Indian or Alaska Native, and Hispanic or Latino students of any race (2009)
Lowest fifth (0–7 percent of students) 10.8 † 16.8Middle three-fifths (8–64 percent of students) 9.5 42.7 13.0Highest fifth (65–100 percent of students) 24.1 34.2 41.8
Student’s school percentage of English language learners (2012)
0 percent 15.9 84.0 36.01 to 5 percent 8.5 38.8 11.0More than 5 percent 14.1 52.1 27.2
High school from which student received diploma (2013)
Ninth-grade school 7.7 24.7 9.4Another high school 15.9 † 50.1
SOURCE: U.S. Department of Education, National Center for Education Statistics, High School Longitudinal Study of 2009 (HSLS:09) 2013 Update and High School Transcripts Restricted-use Data File.
† Not applicable.
Table S11. Standard errors for table 11: Among fall 2009 ninth-graders who took either the SAT or ACT college entrance exam and received a high school diploma by the fall of 2013, average SAT or ACT exam score on the SAT scale, by location of dual-enrollment courses and selected student and parent characteristics: 2013—Continued
Average SAT or ACT exam score on the SAT scale
– 68 –

National Center for Education Statistics
Selected student and parent characteristics
Earned no AP, IB, or dual-
enrollment credits1
Earned up to 3 AP, IB, and dual-
enrollment credits2
Earned more than 3 AP, IB, and dual-
enrollment credits3
Total 45.0 71.8 87.1
Student’s sex (2009)Female 47.9 72.1 86.2Male 42.4 71.3 88.3
Student’s race/ethnicity (2009)4
Asian 55.6 72.2 89.7Black/African American 44.6 64.7 79.1Hispanic/Latino 37.4 60.9 86.9Other 39.9 69.3 84.5White 49.0 77.2 88.3
Student’s native language (2009) English 46.9 74.9 87.4English and a non-English language 38.2 55.1 93.4Non-English 36.6 58.6 82.0
Parents’ socioeconomic status (2009)5
Lowest fifth 29.1 56.9 72.9Middle three-fifths 44.7 68.3 84.4Highest fifth 72.5 86.0 93.1
Parents’ highest level of education (2009)High school credential or less 34.4 61.9 76.2Undergraduate degree 58.1 78.7 89.3Graduate degree 73.1 85.4 93.3
Student’s educational expectations (2009) High school credential 27.4 62.5 88.1Undergraduate degree 45.7 75.3 84.9Graduate degree 57.1 76.5 89.3Don’t know 40.7 58.3 79.2
Student’s mathematics achievement (2009)6
Lowest fifth 34.7 54.6 81.0Middle three-fifths 46.3 69.3 84.8Highest fifth 64.1 81.3 89.1
Student’s school sector (2012) Public 43.9 70.0 87.3
Regular 44.2 70.7 87.3Charter or special-program school 44.8 60.8 88.4Career/technical/vocational or alternative school 35.5 ! ‡ ‡
Private 76.6 88.8 92.8
Percent enrolled in associate’s or bachelor’s degree program
See notes at end of table.
Table 12. Among fall 2009 ninth-graders who received a high school diploma by the fall of 2013, percentage of students who enrolled in an associate’s or bachelor’s degree program in fall of 2013, by number of high school credits earned in Advanced Placement (AP), International Baccalaureate (IB), and dual-enrollment courses and selected student and parent characteristics: 2013
– 69 –

National Center for Education Statistics
Selected student and parent characteristics
Earned no AP, IB, or dual-
enrollment credits1
Earned up to 3 AP, IB, and dual-
enrollment credits2
Earned more than 3 AP, IB, and dual-
enrollment credits3
Student’s school region (2012) Northeast 52.6 84.6 90.8Midwest 49.3 76.4 87.8South 40.5 65.7 85.7West 41.9 67.6 86.2
Student’s school locale (2012) City 42.9 68.0 86.1Suburb 50.0 73.8 88.9Town 41.3 74.7 85.7Rural 44.8 72.0 86.8
Student’s school size (2012) Fewer than 500 students 50.8 76.6 90.5500 to 1,199 students 43.5 77.3 87.11,200 or more students 45.1 68.3 87.5
Student’s school percentage of students who received free or reduced-price lunch (2012)7
Lowest fifth (0–18 percent of students) 67.5 85.1 93.1Middle three-fifths (19–67 percent of students) 42.7 69.5 86.3Highest fifth (68–100 percent of students) 36.5 60.1 81.9
Student’s school percentage of students who were non-Hispanic Black or African American, non-Hispanic American Indian or Alaska Native, and Hispanic or Latino students of any race (2009)8
Lowest fifth (0–7 percent of students) 52.8 81.4 88.4Middle three-fifths (8–64 percent of students) 48.3 72.2 87.6Highest fifth (65–100 percent of students) 36.2 64.1 87.8
Student’s school percentage of English language learners (2012)
0 percent 53.2 82.0 91.41 to 5 percent 44.3 73.5 88.6More than 5 percent 42.8 65.4 84.2
High school from which student received diploma (2013)
Ninth-grade school 47.7 73.1 87.6Another high school 31.0 61.3 81.8
See notes at end of table.
Table 12. Among fall 2009 ninth-graders who received a high school diploma by the fall of 2013, percentage of students who enrolled in an associate’s or bachelor’s degree program in fall of 2013, by number of high school credits earned in Advanced Placement (AP), International Baccalaureate (IB), and dual-enrollment courses and selected student and parent characteristics: 2013—Continued
Percent enrolled in associate’s or bachelor’s degree program
– 70 –

National Center for Education Statistics
4 All race categories exclude Hispanic or Latino origin unless specified. “Other” includes American Indian, Alaska Native, Native Hawaiian, other Pacific Islander, and individuals who indicated Two or more races or Other.
SOURCE: U.S. Department of Education, National Center for Education Statistics, High School Longitudinal Study of 2009 (HSLS:09) 2013 Update and High School Transcripts Restricted-use Data File.
NOTE: Estimates are based on fall 2009 ninth-graders who had received a high school diploma from any high school before September 2013, when the high school transcript data collection began. Students in this group whose exact graduation date is unknown are included. Students who had not received a diploma, received a diploma in the fall of 2013 or later, or for whom transcript data were incomplete are excluded. Students’ high school credits earned were collected from the high school transcripts and reflect Carnegie units. The Carnegie unit is a standard of measurement that represents one credit for 120 hours of classroom time over the course of a year at the secondary-school level in the United States, equivalent to the completion of a 1-year academic course taken one period a day, 5 days a week. Among fall 2009 ninth-graders who received a high school diploma by the fall of 2013, those who earned any high school credits in AP, IB, or dual-enrollment courses earned on average 3.6 credits in these courses combined. Students’ associate’s and bachelor’s degree program enrollment status was collected in the 2013 Update. The lowest fifth, middle three-fifths, and highest fifth categories are based on the distribution of fall-term ninth-grade students. Data were weighted using the weight W3W1W2STUTR. This weight accounts for (1) base-year school nonresponse; (2) high school transcript nonresponse; and (3) student nonresponse in the base year, first follow-up, and 2013 Update.
8 Students in these racial/ethnic groups tend to be underrepresented in AP, IB, and dual-enrollment courses. These data were only collected from students’ ninth-grade schools in the base year of the study; data were not collected for any schools students had transferred to as of the first follow-up data collection. Therefore, estimates are based on 2009 data for students who received their high school diploma from their ninth-grade school.
7 To be eligible for free lunch under the National School Lunch Program (NSLP), a federally assisted meal program, a student must be from a household with an income at or below 130 percent of the poverty threshold. To be eligible for reduced-price lunch, a student must be from a household with an income between 130 percent and 185 percent of the poverty threshold. Therefore, the percentage of students receiving free or reduced-price lunch (FRPL) under the NSLP provides a proxy measure for the concentration of low-income students within a school. However, this percentage cannot be used as a strict measure of the percentage of children at or below 185 percent of the poverty threshold because some students are eligible for FRPL based on criteria other than income, and some schools and districts provide FRPL to all students regardless of income.
1 Dual enrollment refers to taking postsecondary courses while also enrolled in high school. Students may take dual-enrollment courses through a program offered by their high school or independently. A high school dual-enrollment program is an organized system with special guidelines that might have to do with, for example, entrance or eligibility requirements, funding, and limits on coursetaking. These estimates include college-entrance exam scores of students who did not earn any credits in AP courses, IB courses, and dual-enrollment courses that were offered through a program, or dual-enrollment courses taken independently.
5 Parents’ socioeconomic status was calculated using parents’ education, occupation, and family income.6 Student’s mathematics achievement was measured by a two-stage adaptive assessment in algebraic reasoning developed for HSLS:09.
2 These estimates include enrollment of students who earned up to a total of 3 credits in AP courses, IB courses, and dual-enrollment courses that were offered through a program, and dual-enrollment courses taken independently. See footnote 1 for a definition of dual enrollment and dual-enrollment programs.3 These estimates include enrollment of students who earned a total of more than 3 credits in AP courses, IB courses, and dual-enrollment courses that were offered through a program, and dual-enrollment courses taken independently. See footnote 1 for a definition of dual enrollment and dual-enrollment programs.
! Interpret data with caution. Estimate is unstable because the standard error is between 30 and 50 percent of the estimate.
Table 12. Among fall 2009 ninth-graders who received a high school diploma by the fall of 2013, percentage of students who enrolled in an associate’s or bachelor’s degree program in fall of 2013, by number of high school credits earned in Advanced Placement (AP), International Baccalaureate (IB), and dual-enrollment courses and selected student and parent characteristics: 2013—Continued
‡ Reporting standards not met either because the standard error is greater than 50 percent of the estimate or because there were too few cases for a reliable estimate.
– 71 –

National Center for Education Statistics
Selected student and parent characteristics
Earned no AP, IB, or dual-
enrollment credits
Earned up to 3 AP, IB, and dual-
enrollment credits
Earned more than 3 AP, IB, and dual-
enrollment credits
Total 1.16 1.36 1.26
Student’s sex (2009)Female 1.45 1.82 1.73Male 1.62 1.92 1.51
Student’s race/ethnicity (2009)Asian 4.63 5.01 2.33Black/African American 3.27 5.36 7.71Hispanic/Latino 2.69 3.65 3.48Other 2.75 3.91 4.18White 1.38 1.44 1.24
Student’s native language (2009) English 1.08 1.43 1.55English and a non-English language 5.34 5.98 2.36Non-English 4.43 4.88 5.15
Parents’ socioeconomic status (2009) Lowest fifth 2.51 5.58 7.63Middle three-fifths 1.33 1.70 1.98Highest fifth 1.90 1.46 1.25
Parents’ highest level of education (2009)High school credential or less 1.65 2.98 3.63Undergraduate degree 1.85 1.63 2.04Graduate degree 2.42 1.93 1.34
Student’s educational expectations (2009)High school credential 2.32 8.13 11.49Undergraduate degree 2.32 2.65 3.30Graduate degree 1.82 2.02 1.15Don’t know 2.36 3.34 3.56
Student’s mathematics achievement (2009) Lowest fifth 2.81 5.60 9.28Middle three-fifths 1.50 1.57 2.07Highest fifth 3.10 2.21 1.22
Student’s school sector (2012) Public 1.18 1.36 1.25
Regular 1.25 1.45 1.34Charter or special-program school 4.43 6.22 4.76Career/technical/vocational or alternative school 11.65 † †
Private 3.34 2.77 4.25
See notes at end of table.
Percent enrolled in associate’s or bachelor’s degree program
Table S12. Standard errors for table 12: Among fall 2009 ninth-graders who received a high school diploma by the fall of 2013, percentage of students who enrolled in an associate’s or bachelor’s degree program in fall of 2013, by number of high school credits earned in Advanced Placement (AP), International Baccalaureate (IB), and dual-enrollment courses and selected student and parent characteristics: 2013
– 72 –

National Center for Education Statistics
Selected student and parent characteristics
Earned no AP, IB, or dual-
enrollment credits
Earned up to 3 AP, IB, and dual-
enrollment credits
Earned more than 3 AP, IB, and dual-
enrollment credits
Student’s school region (2012) Northeast 2.88 2.89 3.19Midwest 1.74 2.07 2.53South 1.73 2.44 1.79West 3.11 2.90 3.29
Student’s school locale (2012) City 2.83 3.15 2.39Suburb 2.01 2.06 1.73Town 3.53 4.51 3.21Rural 1.51 2.28 3.04
Student’s school size (2012) Fewer than 500 students 2.56 3.18 2.51500 to 1,199 students 1.85 2.74 2.481,200 or more students 1.64 1.75 1.57
Student’s school percentage of students who received free or reduced-price lunch (2012)
Lowest fifth (0–18 percent of students) 2.44 1.72 1.45Middle three-fifths (19–67 percent of students) 1.43 1.54 1.61Highest fifth (68–100 percent of students) 2.54 4.27 4.55
Student’s school percentage of students who were non-Hispanic Black or African American, non-Hispanic American Indian or Alaska Native, and Hispanic or Latino students of any race (2009)
Lowest fifth (0–7 percent of students) 2.07 2.08 2.19Middle three-fifths (8–64 percent of students) 1.81 1.88 1.75Highest fifth (65–100 percent of students) 3.72 4.76 3.40
Student’s school percentage of English language learners (2012)
0 percent 2.34 2.95 2.161 to 5 percent 1.56 1.74 1.54More than 5 percent 2.12 2.73 2.66
High school from which student received diploma (2013)
Ninth-grade school 1.24 1.35 1.23Another high school 2.96 4.83 4.78
SOURCE: U.S. Department of Education, National Center for Education Statistics, High School Longitudinal Study of 2009 (HSLS:09) 2013 Update and High School Transcripts Restricted-use Data File.
† Not applicable.
Percent enrolled in associate’s or bachelor’s degree program
Table S12. Standard errors for table 12: Among fall 2009 ninth-graders who received a high school diploma by the fall of 2013, percentage of students who enrolled in an associate’s or bachelor’s degree program in fall of 2013, by number of high school credits earned in Advanced Placement (AP), International Baccalaureate (IB), and dual-enrollment courses and selected student and parent characteristics: 2013—Continued
– 73 –

National Center for Education Statistics
Selected student and parent characteristics
Earned no AP, IB, or dual-
enrollment credits1
Earned AP or IB
credits only
Earned dual-enrollment
credits only2
Earned both AP or IB and
dual-enrollment credits3
Total 45.0 78.1 67.3 84.6
Student’s sex (2009)Female 47.9 78.3 67.0 81.7Male 42.4 77.8 67.5 88.8
Student’s race/ethnicity (2009)4
Asian 55.6 82.6 ‡ 94.6Black/African American 44.6 73.0 59.4 52.7 !Hispanic/Latino 37.4 68.9 50.8 86.4Other 39.9 77.1 58.5 76.7White 49.0 81.8 73.5 86.5
Student’s native language (2009) English 46.9 80.3 71.0 83.7English and a non-English language 38.2 72.2 ‡ 93.3Non-English 36.6 68.5 28.5 88.9
Parents’ socioeconomic status (2009)5
Lowest fifth 29.1 64.2 34.5 68.1Middle three-fifths 44.7 73.9 67.6 81.0Highest fifth 72.5 89.4 83.9 92.3
Parents’ highest level of education (2009)High school credential or less 34.4 67.2 58.6 71.6Undergraduate degree 58.1 84.0 74.3 84.2Graduate degree 73.1 88.2 86.8 96.7
Student’s educational expectations (2009) High school credential 27.4 72.2 49.2 ‡Undergraduate degree 45.7 77.8 77.0 84.7Graduate degree 57.1 82.3 74.4 87.5Don’t know 40.7 65.4 53.2 72.2
Student’s mathematics achievement (2009)6
Lowest fifth 34.7 64.5 30.3 ‡Middle three-fifths 46.3 74.3 67.9 79.0Highest fifth 64.1 84.6 83.6 91.5
Student’s school sector (2012) Public 43.9 77.1 66.5 84.4
Regular 44.2 77.0 67.2 84.4Charter or special-program school 44.8 79.1 ‡ ‡Career/technical/vocational or alternative school 35.5 ! ‡ ‡ ‡
Private 76.6 90.9 80.4 90.4
Percent enrolled in associate’s or bachelor’s degree program
See notes at end of table.
Table 13. Among fall 2009 ninth-graders who received a high school diploma by the fall of 2013, percentage of students who enrolled in an associate’s or bachelor’s degree program in fall of 2013, by type of high school credits earned and selected student and parent characteristics: 2013
– 74 –

National Center for Education Statistics
Selected student and parent characteristics
Earned no AP, IB, or dual-
enrollment credits1
Earned AP or IB
credits only
Earned dual-enrollment
credits only2
Earned both AP or IB and
dual-enrollment credits3
Student’s school region (2012) Northeast 52.6 87.0 81.4 93.0Midwest 49.3 80.5 65.5 90.9South 40.5 73.8 66.3 82.4West 41.9 75.8 63.7 74.4
Student’s school locale (2012) City 42.9 77.7 45.6 81.3Suburb 50.0 79.3 74.1 87.9Town 41.3 76.8 73.2 90.9Rural 44.8 77.4 70.1 83.7
Student’s school size (2012) Fewer than 500 students 50.8 81.9 72.0 90.6500 to 1,199 students 43.5 81.6 68.9 89.41,200 or more students 45.1 76.7 61.8 81.4
Student’s school percentage of students who received free or reduced-price lunch (2012)7
Lowest fifth (0–18 percent of students) 67.5 88.8 78.1 91.2Middle three-fifths (19–67 percent of students) 42.7 76.3 70.5 81.9Highest fifth (68–100 percent of students) 36.5 68.3 44.0 86.5
Student’s school percentage of students who were non-Hispanic Black or African American, non-Hispanic American Indian or Alaska Native, and Hispanic or Latino students of any race (2009)8
Lowest fifth (0–7 percent of students) 52.8 83.2 78.7 89.0Middle three-fifths (8–64 percent of students) 48.3 79.9 63.3 81.9Highest fifth (65–100 percent of students) 36.2 74.2 69.1 87.5
Student’s school percentage of English language learners (2012)
0 percent 53.2 88.6 65.8 89.41 to 5 percent 44.3 79.1 75.5 85.6More than 5 percent 42.8 73.4 59.4 80.2
High school from which student received diploma (2013)
Ninth-grade school 47.7 79.2 69.2 85.4Another high school 31.0 68.8 44.0 77.1
Percent enrolled in associate’s or bachelor’s degree program
See notes at end of table.
Table 13. Among fall 2009 ninth-graders who received a high school diploma by the fall of 2013, percentage of students who enrolled in an associate’s or bachelor’s degree program in fall of 2013, by type of high school credits earned and selected student and parent characteristics: 2013—Continued
– 75 –

National Center for Education Statistics
7 To be eligible for free lunch under the National School Lunch Program (NSLP), a federally assisted meal program, a student must be from a household with an income at or below 130 percent of the poverty threshold. To be eligible for reduced-price lunch, a student must be from a household with an income between 130 percent and 185 percent of the poverty threshold. Therefore, the percentage of students receiving free or reduced-price lunch (FRPL) under the NSLP provides a proxy measure for the concentration of low-income students within a school. However, this percentage cannot be used as a strict measure of the percentage of children at or below 185 percent of the poverty threshold because some students are eligible for FRPL based on criteria other than income, and some schools and districts provide FRPL to all students regardless of income.
4 All race categories exclude Hispanic or Latino origin unless specified. “Other” includes American Indian, Alaska Native, Native Hawaiian, other Pacific Islander, and individuals who indicated Two or more races or Other.
1 Dual enrollment refers to taking postsecondary courses while also enrolled in high school. Students may take dual-enrollment courses through a program offered by their high school or independently. A high school dual-enrollment program is an organized system with special guidelines that might have to do with, for example, entrance or eligibility requirements, funding, and limits on coursetaking. These estimates include college-entrance exam scores of students who did not earn any credits in AP courses, IB courses, and dual-enrollment courses that were offered through a program, or dual-enrollment courses taken independently.
‡ Reporting standards not met either because the standard error is greater than 50 percent of the estimate or because there were too few cases for a reliable estimate.
! Interpret data with caution. Estimate is unstable because the standard error is between 30 and 50 percent of the estimate.
5 Parents’ socioeconomic status was calculated using parents’ education, occupation, and family income.6 Student’s mathematics achievement was measured by a two-stage adaptive assessment in algebraic reasoning developed for HSLS:09.
2 These estimates include enrollment of students who earned credits in dual-enrollment courses that were offered through a program or taken independently but who did not earn any credits in AP or IB courses. See footnote 1 for a definition of dual enrollment and dual-enrollment programs.
Table 13. Among fall 2009 ninth-graders who received a high school diploma by the fall of 2013, percentage of students who enrolled in an associate’s or bachelor’s degree program in fall of 2013, by type of high school credits earned and selected student and parent characteristics: 2013—Continued
SOURCE: U.S. Department of Education, National Center for Education Statistics, High School Longitudinal Study of 2009 (HSLS:09) 2013 Update and High School Transcripts Restricted-use Data File.
NOTE: AP = Advanced Placement; IB = International Baccalaureate. Estimates are based on fall 2009 ninth-graders who had received a high school diploma from any high school before September 2013, when the high school transcript data collection began. Students in this group whose exact graduation date is unknown are included. Students who had not received a diploma, received a diploma in the fall of 2013 or later, or for whom transcript data were incomplete are excluded. Students’ high school credits earned were collected from the high school transcripts and reflect Carnegie units. The Carnegie unit is a standard of measurement that represents one credit for 120 hours of classroom time over the course of a year at the secondary-school level in the United States, equivalent to the completion of a 1-year academic course taken one period a day, 5 days a week. Students’ associate’s and bachelor’s degree program enrollment status was collected in the 2013 Update. The lowest fifth, middle three-fifths, and highest fifth categories are based on the distribution of fall-term ninth-grade students. Data were weighted using the weight W3W1W2STUTR. This weight accounts for (1) base-year school nonresponse; (2) high school transcript nonresponse; and (3) student nonresponse in the base year, first follow-up, and 2013 Update.
8 Students in these racial/ethnic groups tend to be underrepresented in AP, IB, and dual-enrollment courses. These data were only collected from students’ ninth-grade schools in the base year of the study; data were not collected for any schools students had transferred to as of the first follow-up data collection. Therefore, estimates are based on 2009 data for students who received their high school diploma from their ninth-grade school.
3 These estimates include enrollment of students who earned credits in AP or IB courses and credits in dual-enrollment courses that were offered through a program or taken independently. See footnote 1 for a definition of dual enrollment and dual-enrollment programs.
– 76 –

National Center for Education Statistics
Selected student and parent characteristics
Earned no AP, IB, or dual-
enrollment credits
Earned AP or IB
credits only
Earned dual-enrollment
credits only
Earned both AP or IB and
dual-enrollment credits
Total 1.16 1.18 4.09 2.23
Student’s sex (2009)Female 1.45 1.41 5.33 3.46Male 1.62 1.60 4.85 1.99
Student’s race/ethnicity (2009)Asian 4.63 2.84 † 2.71Black/African American 3.27 5.47 12.20 20.57Hispanic/Latino 2.69 3.72 11.05 6.08Other 2.75 3.19 12.94 10.17White 1.38 1.27 3.59 2.10
Student’s native language (2009) English 1.08 1.25 3.52 2.59English and a non-English language 5.34 4.33 † 3.70Non-English 4.43 4.56 14.67 4.62
Parents’ socioeconomic status (2009) Lowest fifth 2.51 6.18 13.30 12.95Middle three-fifths 1.33 1.37 4.33 3.36Highest fifth 1.90 1.21 4.60 2.04
Parents’ highest level of education (2009)High school credential or less 1.65 2.90 6.41 6.52Undergraduate degree 1.85 1.50 5.11 3.27Graduate degree 2.42 1.43 5.01 1.29
Student’s educational expectations (2009)High school credential 2.32 9.45 13.42 †Undergraduate degree 2.32 2.22 5.31 5.71Graduate degree 1.82 1.46 3.38 2.07Don’t know 2.36 3.15 9.09 7.11
Student’s mathematics achievement (2009) Lowest fifth 2.81 5.65 8.41 †Middle three-fifths 1.50 1.53 4.65 3.18Highest fifth 3.10 1.44 4.10 2.20
Student’s school sector (2012) Public 1.18 1.16 4.49 2.45
Regular 1.25 1.24 4.64 2.51Charter or special-program school 4.43 4.99 † †Career/technical/vocational or alternative school 11.65 † † †
Private 3.34 2.94 7.26 2.43
See notes at end of table.
Table S13. Standard errors for table 13: Among fall 2009 ninth-graders who received a high school diploma by the fall of 2013, percentage of students who enrolled in an associate’s or bachelor’s degree program in fall of 2013, by type of high school credits earned and selected student and parent characteristics: 2013
Percent enrolled in associate’s or bachelor’s degree program
– 77 –

National Center for Education Statistics
Selected student and parent characteristics
Earned no AP, IB, or dual-
enrollment credits
Earned AP or IB
credits only
Earned dual-enrollment
credits only
Earned both AP or IB and
dual-enrollment credits
Student’s school region (2012) Northeast 2.88 2.79 9.77 3.52Midwest 1.74 1.93 5.65 2.65South 1.73 1.95 5.86 2.76West 3.11 2.66 14.74 9.07
Student’s school locale (2012) City 2.83 2.50 10.89 4.65Suburb 2.01 1.59 6.77 2.92Town 3.53 4.82 5.92 4.88Rural 1.51 2.29 6.41 4.47
Student’s school size (2012) Fewer than 500 students 2.56 3.00 6.42 2.72500 to 1,199 students 1.85 2.56 5.17 2.801,200 or more students 1.64 1.42 8.63 3.51
Student’s school percentage of students who received free or reduced-price lunch (2012)
Lowest fifth (0–18 percent of students) 2.44 1.38 6.03 2.02Middle three-fifths (19–67 percent of students) 1.43 1.39 4.61 3.22Highest fifth (68–100 percent of students) 2.54 4.26 13.30 5.93
Student’s school percentage of students who were non-Hispanic Black or African American, non-Hispanic American Indian or Alaska Native, and Hispanic or Latino students of any race (2009)
Lowest fifth (0–7 percent of students) 2.07 2.29 3.66 2.47Middle three-fifths (8–64 percent of students) 1.81 1.49 6.86 3.99Highest fifth (65–100 percent of students) 3.72 4.17 11.32 4.58
Student’s school percentage of English language learners (2012)
0 percent 2.34 2.03 8.04 3.251 to 5 percent 1.56 1.55 4.11 2.66More than 5 percent 2.12 2.26 9.69 5.96
High school from which student received diploma (2013)
Ninth-grade school 1.24 1.14 4.11 2.40Another high school 2.96 4.64 12.53 7.78
SOURCE: U.S. Department of Education, National Center for Education Statistics, High School Longitudinal Study of 2009 (HSLS:09) 2013 Update and High School Transcripts Restricted-use Data File.
† Not applicable.
Percent enrolled in associate’s or bachelor’s degree program
Table S13. Standard errors for table 13: Among fall 2009 ninth-graders who received a high school diploma by the fall of 2013, percentage of students who enrolled in an associate’s or bachelor’s degree program in fall of 2013, by type of high school credits earned and selected student and parent characteristics: 2013—Continued
– 78 –

National Center for Education Statistics
Selected student and parent characteristics
Earned no dual-enrollment
credits1
Earned any dual-enrollment
credits on college campus2
Earned dual-enrollment
credits off college campus only3
Total 58.1 75.2 77.8
Student’s sex (2009)Female 61.2 77.9 75.7Male 55.0 71.6 80.3
Student’s race/ethnicity (2009)4
Asian 75.6 ‡ 85.2Black/African American 53.0 ‡ 50.9Hispanic/Latino 48.8 73.2 74.6Other 53.9 ‡ 67.5White 62.6 78.9 81.0
Student’s native language (2009) English 59.7 73.8 79.2English and a non-English language 53.3 ‡ 82.2Non-English 52.3 ‡ 61.7
Parents’ socioeconomic status (2009)5
Lowest fifth 38.3 ‡ 52.1Middle three-fifths 55.0 69.0 75.1Highest fifth 83.3 92.2 89.2
Parents’ highest level of education (2009)High school credential or less 44.3 62.3 64.8Undergraduate degree 69.9 74.6 81.6Graduate degree 82.8 93.8 94.5
Student’s educational expectations (2009)High school credential 34.9 ‡ 56.2Undergraduate degree 57.4 80.4 81.4Graduate degree 70.5 84.2 82.4Don’t know 48.3 45.3 ! 65.3
Student’s mathematics achievement (2009)6
Lowest fifth 38.1 ‡ 43.7Middle three-fifths 56.1 72.2 74.0Highest fifth 79.3 92.8 88.1
Student’s school sector (2012) Public 56.8 77.3 77.1
Regular 56.7 76.5 77.6Charter or special-program school 64.2 ‡ ‡Career/technical/vocational or alternative school 37.9 ‡ ‡
Private 84.8 ‡ 88.2
Table 14. Among fall 2009 ninth-graders who received a high school diploma by the fall of 2013, percentage of students who enrolled in an associate’s or bachelor’s degree program in fall of 2013, by location of dual-enrollment courses and selected student and parent characteristics: 2013
Percent enrolled in associate’s or bachelor’s degree program
See notes at end of table.
– 79 –

National Center for Education Statistics
Selected student and parent characteristics
Earned no dual-enrollment
credits1
Earned any dual-enrollment
credits on college campus2
Earned dual-enrollment
credits off college campus only3
Student’s school region (2012) Northeast 65.4 ‡ 87.9Midwest 61.5 71.0 78.7South 54.1 76.8 76.1West 56.1 65.1 70.9
Student’s school locale (2012) City 59.2 62.4 73.2Suburb 63.5 91.2 81.6Town 51.9 ‡ 78.0Rural 54.7 73.5 78.4
Student’s school size (2012) Fewer than 500 students 59.1 71.6 81.9500 to 1,199 students 57.2 77.0 79.91,200 or more students 59.8 78.8 75.2
Student’s school percentage of students who received free or reduced-price lunch (2012)7
Lowest fifth (0–18 percent of students) 79.2 75.3 87.2Middle three-fifths (19–67 percent of students) 55.2 77.1 77.2Highest fifth (68–100 percent of students) 46.5 75.7 57.5
Student’s school percentage of students who were non-Hispanic Black or African American, non-Hispanic American Indian or Alaska Native, and Hispanic or Latino students of any race (2009)8
Lowest fifth (0–7 percent of students) 62.8 ‡ 84.0Middle three-fifths (8–64 percent of students) 62.2 74.2 75.2Highest fifth (65–100 percent of students) 51.9 85.9 78.9
Student’s school percentage of English language learners (2012)
0 percent 66.3 63.0 79.81 to 5 percent 58.2 78.3 82.5More than 5 percent 55.6 84.9 67.1
High school from which student received diploma (2013)
Ninth-grade school 60.6 76.7 79.2Another high school 42.8 59.3 ! 63.4
See notes at end of table.
Percent enrolled in associate’s or bachelor’s degree program
Table 14. Among fall 2009 ninth-graders who received a high school diploma by the fall of 2013, percentage of students who enrolled in an associate’s or bachelor’s degree program in fall of 2013, by location of dual-enrollment courses and selected student and parent characteristics: 2013—Continued
– 80 –

National Center for Education Statistics
SOURCE: U.S. Department of Education, National Center for Education Statistics, High School Longitudinal Study of 2009 (HSLS:09) 2013 Update and High School Transcripts Restricted-use Data File.
NOTE: AP = Advanced Placement; IB = International Baccalaureate. Estimates are based on fall 2009 ninth-graders who had received a high school diploma from any high school before September 2013, when the high school transcript data collection began. Students in this group whose exact graduation date is unknown are included. Students who had not received a diploma, received a diploma in the fall of 2013 or later, or for whom transcript data were incomplete are excluded. Students’ high school credits earned were collected from the high school transcripts and reflect Carnegie units. The Carnegie unit is a standard of measurement that represents one credit for 120 hours of classroom time over the course of a year at the secondary-school level in the United States, equivalent to the completion of a 1-year academic course taken one period a day, 5 days a week. Students’ associate’s and bachelor’s degree program enrollment status was collected in the 2013 Update. The lowest fifth, middle three-fifths, and highest fifth categories are based on the distribution of fall-term ninth-grade students. Data were weighted using the weight W3W1W2STUTR. This weight accounts for (1) base-year school nonresponse; (2) high school transcript nonresponse; and (3) student nonresponse in the base year, first follow-up, and 2013 Update.
2 These estimates include enrollment of students who earned dual-enrollment credits in a course taken on a college campus. This includes dual-enrollment courses that were offered through a program and dual-enrollment courses taken independently. See footnote 1 for a definition of dual enrollment and dual-enrollment programs. Courses taken at community colleges and 4-year colleges and universities are included. Courses taken at high schools, career or vocational centers, and online are excluded.
‡ Reporting standards not met either because the standard error is greater than 50 percent of the estimate or because there were too few cases for a reliable estimate.
5 Parents’ socioeconomic status was calculated using parents’ education, occupation, and family income.6 Student’s mathematics achievement was measured by a two-stage adaptive assessment in algebraic reasoning developed for HSLS:09.
3 These estimates include enrollment of students who only earned dual-enrollment credits in a course taken off of a college campus. This includes dual-enrollment courses that were offered through a program and dual-enrollment courses taken independently. See footnote 1 for a definition of dual enrollment and dual-enrollment programs. Courses taken at high schools, career or vocational centers, and online are included. Courses taken at community colleges and 4-year colleges and universities are excluded.
Table 14. Among fall 2009 ninth-graders who received a high school diploma by the fall of 2013, percentage of students who enrolled in an associate’s or bachelor’s degree program in fall of 2013, by location of dual-enrollment courses and selected student and parent characteristics: 2013—Continued
! Interpret data with caution. Estimate is unstable because the standard error is between 30 and 50 percent of the estimate.
1 Dual enrollment refers to taking postsecondary courses while also enrolled in high school. Students may take dual-enrollment courses through a program offered by their high school or independently. A high school dual-enrollment program is an organized system with special guidelines that might have to do with, for example, entrance or eligibility requirements, funding, and limits on coursetaking. These estimates include college-entrance exam scores of students who did not earn any credits in dual-enrollment courses that were offered through a program or taken independently.
4 All race categories exclude Hispanic or Latino origin unless specified. “Other” includes American Indian, Alaska Native, Native Hawaiian, other Pacific Islander, and individuals who indicated Two or more races or Other.
7 To be eligible for free lunch under the National School Lunch Program (NSLP), a federally assisted meal program, a student must be from a household with an income at or below 130 percent of the poverty threshold. To be eligible for reduced-price lunch, a student must be from a household with an income between 130 percent and 185 percent of the poverty threshold. Therefore, the percentage of students receiving free or reduced-price lunch (FRPL) under the NSLP provides a proxy measure for the concentration of low-income students within a school. However, this percentage cannot be used as a strict measure of the percentage of children at or below 185 percent of the poverty threshold because some students are eligible for FRPL based on criteria other than income, and some schools and districts provide FRPL to all students regardless of income.8 Students in these racial/ethnic groups tend to be AP, IB, and dual-enrollment courses. These data were only collected from students’ ninth-grade schools in the base year of the study; data were not collected for any schools students had transferred to as of the first follow-up data collection. Therefore, estimates are based on 2009 data for students who received their high school diploma from their ninth-grade school.
– 81 –

National Center for Education Statistics
Selected student and parent characteristics
Earned no dual-enrollment
credits
Earned any dual-enrollment
credits on college campus
Earned dual-enrollment
credits off college campus only
Total 1.01 4.40 2.29
Student’s sex (2009)Female 1.10 5.88 3.42Male 1.44 5.83 2.57
Student’s race/ethnicity (2009)Asian 2.80 † 4.80Black/African American 3.18 † 14.87Hispanic/Latino 2.29 11.70 7.00Other 2.13 † 8.59White 1.05 4.24 2.01
Student’s native language (2009) English 0.98 4.82 2.16English and a non-English language 4.46 † 6.70Non-English 3.61 † 8.29
Parents’ socioeconomic status (2009) Lowest fifth 2.53 † 9.64Middle three-fifths 1.07 6.20 2.87Highest fifth 1.02 3.66 2.19
Parents’ highest level of education (2009)High school credential or less 1.57 7.56 5.04Undergraduate degree 1.19 8.65 2.64Graduate degree 1.31 4.51 1.63
Student’s educational expectations (2009)High school credential 2.92 † 13.31Undergraduate degree 1.92 7.00 4.50Graduate degree 1.20 4.14 2.13Don’t know 1.81 15.41 6.02
Student’s mathematics achievement (2009) Lowest fifth 2.64 † 9.24Middle three-fifths 1.15 6.35 2.92Highest fifth 1.36 3.89 2.24
Student’s school sector (2012) Public 1.07 4.66 2.48
Regular 1.13 4.89 2.54Charter or special-program school 4.06 † †Career/technical/vocational or alternative school 8.80 † †
Private 2.52 † 2.73
See notes at end of table.
Percent enrolled in associate’s or bachelor’s degree program
Table S14. Standard errors for table 14: Among fall 2009 ninth-graders who received a high school diploma by the fall of 2013, percentage of students who enrolled in an associate’s or bachelor’s degree program in fall of 2013, by location of dual-enrollment courses and selected student and parent characteristics: 2013
– 82 –

National Center for Education Statistics
Selected student and parent characteristics
Earned no dual-enrollment
credits
Earned any dual-enrollment
credits on college campus
Earned dual-enrollment
credits off college campus only
Student’s school region (2012) Northeast 2.53 † 3.81Midwest 1.51 10.66 4.35South 1.55 5.51 2.78West 3.00 15.48 8.64
Student’s school locale (2012) City 2.29 10.48 5.19Suburb 1.59 3.37 3.43Town 2.97 † 3.73Rural 1.66 7.02 3.97
Student’s school size (2012) Fewer than 500 students 2.15 9.27 3.82500 to 1,199 students 1.81 7.52 3.701,200 or more students 1.36 6.43 3.82
Student’s school percentage of students who received free or reduced-price lunch (2012)
Lowest fifth (0–18 percent of students) 1.44 12.14 2.54Middle three-fifths (19–67 percent of students) 1.20 6.32 2.95Highest fifth (68–100 percent of students) 2.69 9.54 12.84
Student’s school percentage of students who were non-Hispanic Black or African American, non-Hispanic American Indian or Alaska Native, and Hispanic or Latino students of any race (2009)
Lowest fifth (0–7 percent of students) 1.79 † 2.16Middle three-fifths (8–64 percent of students) 1.55 7.18 4.14Highest fifth (65–100 percent of students) 3.54 5.48 6.70
Student’s school percentage of English language learners (2012)
0 percent 2.04 9.05 4.351 to 5 percent 1.34 4.48 2.38More than 5 percent 1.96 9.78 6.10
High school from which student received diploma (2013)
Ninth-grade school 1.08 4.49 2.41Another high school 2.31 18.80 8.20
† Not applicable.SOURCE: U.S. Department of Education, National Center for Education Statistics, High School Longitudinal Study of 2009 (HSLS:09) 2013 Update and High School Transcripts Restricted-use Data File.
Table S14. Standard errors for table 14: Among fall 2009 ninth-graders who received a high school diploma by the fall of 2013, percentage of students who enrolled in an associate’s or bachelor’s degree program in fall of 2013, by location of dual-enrollment courses and selected student and parent characteristics: 2013—Continued
Percent enrolled in associate’s or bachelor’s degree program
– 83 –

National Center for Education Statistics
Selected student and parent characteristics
All fall 2009
ninth-graders
Fall 2009 ninth-graders who
received a high school
diploma by the fall of 2013
Fall 2009 ninth-graders who
received a high school diploma by the fall of 2013 and
had a complete transcript
(tables 5–14)
Fall 2009 ninth-graders who received a high
school diploma by the fall of 2013 from the
schools they attended in the fall of 2009 and had
a complete transcript(tables 1–4)
Weighted number of students 4,191,570 3,445,833 3,291,294 2,864,178
Total 100.0 100.0 100.0 100.0Student’s sex (2009)
Female 49.7 50.6 51.0 50.8Male 50.3 49.4 49.0 49.2
Student’s race/ethnicity (2009)1
Asian 3.6 3.8 3.8 4.0Black/African American 13.7 12.5 12.2 11.2Hispanic/Latino 22.0 21.0 21.1 20.1Other 9.1 8.7 8.6 8.5White 51.7 54.0 54.4 56.2
Student’s native language (2009) English 82.6 82.9 82.9 83.3English and a non-English language 6.0 5.9 5.9 5.6Non-English 11.4 11.3 11.3 11.1
Parents’ socioeconomic status (2009)2
Lowest fifth 19.6 16.9 16.8 15.9Middle three-fifths 59.9 60.4 60.5 60.3Highest fifth 20.4 22.7 22.7 23.8
Parents’ highest level of education (2009)High school credential or less 46.7 43.7 43.4 42.4Undergraduate degree 38.4 40.2 40.4 40.7Graduate degree 14.9 16.1 16.2 16.9
Student’s educational expectations (2009)High school credential 14.0 11.3 10.9 9.9Undergraduate degree 23.5 24.4 24.4 24.6Graduate degree 41.3 43.7 44.1 44.8Don’t know 21.2 20.6 20.6 20.7
Student’s mathematics achievement (2009)3
Lowest fifth 17.9 14.9 14.5 13.8Middle three-fifths 60.6 61.3 61.4 61.2Highest fifth 21.4 23.8 24.0 25.0
Student’s school sector (2012) Public 92.9 92.7 92.6 92.8
Regular 83.4 84.5 84.4 85.5Charter or special-program school 6.1 5.9 6.1 5.6Career/technical/vocational or alternative school 3.3 2.3 2.2 1.7
Private 7.1 7.3 7.4 7.2
Table 15. Percentage distribution of selected student and parent characteristics, by student population: 2013
See notes at end of table.
Student populations
– 84 –

National Center for Education Statistics
Selected student and parent characteristics
All fall 2009
ninth-graders
Fall 2009 ninth-graders who
received a high school
diploma by the fall of 2013
Fall 2009 ninth-graders who
received a high school diploma by the fall of 2013 and
had a complete transcript
(tables 5–14)
Fall 2009 ninth-graders who received a high
school diploma by the fall of 2013 from the
schools they attended in the fall of 2009 and had
a complete transcript(tables 1–4)
Student’s school region (2012) Northeast 17.7 18.3 18.5 19.2Midwest 21.9 22.0 22.0 22.6South 37.7 38.3 38.3 38.0West 22.6 21.5 21.2 20.3
Student’s school locale (2012) City 30.8 29.9 29.9 28.6Suburb 28.5 28.8 28.9 29.1Town 12.1 12.4 12.4 12.8Rural 28.7 28.9 28.8 29.6
Student’s school size (2012) Fewer than 500 students 18.7 17.1 16.7 15.9500 to 1,199 students 29.4 30.3 30.7 30.81,200 or more students 51.9 52.7 52.6 53.2
Student’s school percentage of students who received free or reduced-price lunch (2012)4
Lowest fifth (0–18 percent of students) 20.2 22.1 22.0 22.2Middle three-fifths (19–67 percent of students) 59.9 59.9 59.9 60.3Highest fifth (68–100 percent of students) 19.9 18.1 18.1 17.5
Student’s school percentage of students who were non-Hispanic Black or African American, non-Hispanic American Indian or Alaska Native, and Hispanic or Latino students of any race (2009)5
Lowest fifth (0–7 percent of students) 24.4 24.5 24.1 24.1Middle three-fifths (8–64 percent of students) 58.8 58.8 59.2 59.2Highest fifth (65–100 percent of students) 16.8 16.7 16.7 16.7
Student’s school percentage of English language learners (2012)
0 percent 18.2 17.9 17.7 17.61 to 5 percent 48.9 50.1 50.9 51.4More than 5 percent 32.9 32.0 31.4 31.0
Student’s school offerings (2012)6
Offered AP and/or IB course only — — — 11.0Offered dual-enrollment program only7 — — — 8.0Offered AP or IB course and dual-enrollment program8 — — — 81.0
High school from which student received diploma (2013)
Ninth-grade school 86.5 86.8 87.2 100.0Another high school 13.5 13.2 12.8 0.0
Table 15. Percentage distribution of selected student and parent characteristics, by student population: 2013—Continued
See notes at end of table.
Student populations
– 85 –

National Center for Education Statistics
1 All race categories exclude Hispanic or Latino origin unless specified. “Other” includes American Indian, Alaska Native, Native Hawaiian, other Pacific Islander, and individuals who indicated Two or more races or Other.
— Not available.
Table 15. Percentage distribution of selected student and parent characteristics, by student population: 2013—Continued
SOURCE: U.S. Department of Education, National Center for Education Statistics, High School Longitudinal Study of 2009 (HSLS:09) 2013 Update and High School Transcripts Restricted-use Data File.
NOTE: AP = Advanced Placement; IB = International Baccalaureate. The lowest fifth, middle three-fifths, and highest fifth categories are based on the distribution of fall-term ninth-grade students. Data were weighted using the weight W3W1W2STUTR. This weight accounts for (1) base-year school nonresponse; (2) high school transcript nonresponse; and (3) student nonresponse in the base year, first follow-up, and 2013 Update. Detail may not sum to totals because of rounding.
8 Students whose ninth-grade schools offered AP or IB courses and a dual-enrollment program are included in these estimates. Students whose schools did not offer a dual-enrollment program are excluded even if they took dual-enrollment courses independently. See footnote 7 for a definition of dual enrollment and dual-enrollment programs.
7 Dual enrollment refers to taking postsecondary courses while also enrolled in high school. Students may take dual-enrollment courses through a program offered by their high school or independently. A high school dual-enrollment program is an organized system with special guidelines that might have to do with, for example, entrance or eligibility requirements, funding, and limits on coursetaking. Students and credits earned by students whose ninth-grade schools offered a dual-enrollment program but did not offer AP or IB courses are included in these estimates. Students whose schools did not offer a dual-enrollment program are excluded even if they took dual-enrollment courses independently.
6 These data were only collected from students’ ninth-grade schools; data were not collected from any schools students had transferred to as of the first follow-up data collection. Estimates are based on 2012 data for students who received their high school diploma from their ninth-grade school.
5 Students in these racial/ethnic groups tend to be underrepresented in AP, IB, and dual-enrollment courses. These data were only collected from students’ ninth-grade schools in the base year of the study; data were not collected for any schools students had transferred to as of the first follow-up data collection. Therefore, estimates are based on 2009 data for students who received their high school diploma from their ninth-grade school.
4 To be eligible for free lunch under the National School Lunch Program (NSLP), a federally assisted meal program, a student must be from a household with an income at or below 130 percent of the poverty threshold. To be eligible for reduced-price lunch, a student must be from a household with an income between 130 percent and 185 percent of the poverty threshold. Therefore, the percentage of students receiving free or reduced-price lunch (FRPL) under the NSLP provides a proxy measure for the concentration of low-income students within a school. However, this percentage cannot be used as a strict measure of the percentage of children at or below 185 percent of the poverty threshold because some students are eligible for FRPL based on criteria other than income, and some schools and districts provide FRPL to all students regardless of income.
3 Student’s mathematics achievement was measured by a two-stage adaptive assessment in algebraic reasoning developed for HSLS:09.
2 Parents’ socioeconomic status was calculated using parents’ education, occupation, and family income.
– 86 –

National Center for Education Statistics
Selected student and parent characteristics
All fall 2009
ninth-graders
Fall 2009 ninth-graders who
received a high school
diploma by the fall of 2013
Fall 2009 ninth-graders who
received a high school diploma by the fall of 2013 and
had a complete transcript
(tables 5–14)
Fall 2009 ninth-graders who received a high
school diploma by the fall of 2013 from the
schools they attended in the fall of 2009 and had
a complete transcript(tables 1–4)
Weighted number of students † † † †
Total † † † †Student’s sex (2009)
Female 0.73 0.79 0.81 0.94Male 0.73 0.79 0.81 0.94
Student’s race/ethnicity (2009)Asian 0.36 0.40 0.41 0.47Black/African American 0.90 0.87 0.87 0.87Hispanic/Latino 1.04 1.02 1.03 1.13Other 0.43 0.47 0.48 0.53White 1.12 1.24 1.28 1.29
Student’s native language (2009) English 0.93 0.88 0.90 0.98English and a non-English language 0.37 0.41 0.41 0.43Non-English 0.87 0.89 0.90 0.95
Parents’ socioeconomic status (2009) Lowest fifth 0.80 0.85 0.87 0.79Middle three-fifths 0.66 0.75 0.78 0.82Highest fifth 0.70 0.77 0.79 0.81
Parents’ highest level of education (2009)High school credential or less 1.09 1.15 1.12 1.15Undergraduate degree 0.84 0.93 0.91 0.92Graduate degree 0.55 0.58 0.59 0.63
Student’s educational expectations (2009)High school credential 0.61 0.60 0.57 0.55Undergraduate degree 0.61 0.66 0.68 0.69Graduate degree 0.76 0.76 0.76 0.83Don’t know 0.56 0.58 0.59 0.61
Student’s mathematics achievement (2009)Lowest fifth 0.92 0.93 0.94 1.00Middle three-fifths 0.79 0.91 0.93 1.04Highest fifth 0.76 0.85 0.86 0.92
Student’s school sector (2012) Public 0.24 0.39 0.41 0.46
Regular 1.44 1.59 1.63 1.63Charter or special-program school 1.29 1.46 1.52 1.51Career/technical/vocational or alternative school 1.04 1.00 1.04 1.15
Private 0.24 0.39 0.41 0.46
Table S15. Standard errors for table 15: Percentage distribution of selected student and parent characteristics, by student population: 2013
Student populations
See notes at end of table.
– 87 –

National Center for Education Statistics
Selected student and parent characteristics
All fall 2009
ninth-graders
Fall 2009 ninth-graders who
received a high school
diploma by the fall of 2013
Fall 2009 ninth-graders who
received a high school diploma by the fall of 2013 and
had a complete transcript
(tables 5–14)
Fall 2009 ninth-graders who received a high
school diploma by the fall of 2013 from the
schools they attended in the fall of 2009 and had
a complete transcript(tables 1–4)
Student’s school region (2012) Northeast 0.07 0.60 0.71 0.76Midwest 0.19 0.51 0.62 0.71South 0.18 0.54 0.61 0.75West 0.18 0.60 0.78 0.98
Student’s school locale (2012) City 0.84 1.14 1.25 1.20Suburb 1.25 1.37 1.38 1.44Town 1.09 1.19 1.21 1.36Rural 1.17 1.36 1.45 1.57
Student’s school size (2012) Fewer than 500 students 1.45 1.49 1.50 1.63500 to 1,199 students 1.93 2.06 2.10 2.211,200 or more students 1.99 2.15 2.20 2.29
Student’s school percentage of students who received free or reduced-price lunch (2012)
Lowest fifth (0–18 percent of students) 1.50 1.64 1.64 1.76Middle three-fifths (19–67 percent of students) 2.06 2.14 2.14 2.31Highest fifth (68–100 percent of students) 1.84 1.83 1.85 2.00
Student’s school percentage of students who were non-Hispanic Black or African American, non-Hispanic American Indian or Alaska Native, and Hispanic or Latino students of any race (2009)
Lowest fifth (0–7 percent of students) 1.78 1.78 1.83 1.83Middle three-fifths (8–64 percent of students) 2.74 2.74 2.84 2.84Highest fifth (65–100 percent of students) 2.34 2.35 2.42 2.42
Student’s school percentage of English language learners (2012)
0 percent 1.33 1.41 1.42 1.581 to 5 percent 2.05 2.17 2.22 2.46More than 5 percent 1.81 1.95 1.99 2.20
Student’s school offerings (2012)Offers AP and/or IB course only † † † 1.61Offers dual-enrollment program only † † † 1.27Offers AP or IB courses and dual-enrollment program † † † 2.05
High school from which student received diploma (2013)
Ninth-grade school 0.79 0.79 0.80 †Another high school 0.79 0.79 0.80 †
Student populations
Table S15. Standard errors for table 15: Percentage distribution of selected student and parent characteristics, by student population: 2013—Continued
† Not applicable. SOURCE: U.S. Department of Education, National Center for Education Statistics, High School Longitudinal Study of 2009 (HSLS:09) 2013 Update and High School Transcripts Restricted-use Data File.
– 88 –