Embed Size (px)
Citation preview

UNIVERSIDAD NACIONAL DE EDUCACION A DISTANCIAEscuela Tecnica Superior de Ingenierıa Informatica
Departamento de Lenguajes y Sistemas Informaticos
WEB PEOPLE SEARCH
TESIS DOCTORAL
Javier Artiles PiconLicenciado en Linguıstica Computacional
2009


UNIVERSIDAD NACIONAL DE EDUCACION A DISTANCIAEscuela Tecnica Superior de Ingenierıa Informatica
Departamento de Lenguajes y Sistemas Informaticos
WEB PEOPLE SEARCH
Javier Artiles PiconLicenciado en Linguıstica Computacional por la Universidad Complutense de Madrid
Directores:
Julio Gonzalo Arroyo
Profesor Titular de Universidad del Departamento de Lenguajes y Sistemas Informaticosde la Universidad Nacional de Educacion a Distancia
Enrique Amigo Cabrera
Profesor Ayudante Doctor del Departamento de Lenguajes y Sistemas Informaticosde la Universidad Nacional de Educacion a Distancia


A mis padres, Julio y Meryam;a mi hermana, Solange;a mi tıo, Jaime

6
Acknowledgements
This section would exceed the actual length the book if I were to thank my super-visors, Julio Gonzalo and Enrique Amigo, for everything they have done for mythesis. I am deeply indebted to Julio, who put a lot of confidence in me when I firstcame to UNED and who offered me the unique chance to work in this enthrallingfield of research. Julio has provided me with patient guidance in the art of scientificresearch and he has never missed the opportunity to remind me I still have a lot tolearn. I am indebted to Enrique for sharing both his tireless curiosity and genuinescientific perseverance with me. His innumerable contributions to the methodologyof evaluation have been crucial for the completion of this work. I want to thank bothfor instilling their passion for research, endless creativity and positive vibes in me. Iwould never have been able to write this thesis without their help.
I want to express my humble gratitude to Felisa Verdejo, who is responsible forcreating and managing such a favorable research environment as the one we enjoyin the PLN group at UNED.
I want to thank Satoshi Sekine for harboring me in his research group at NYU.His deep experience and proficient aid have been indispensable while organisingboth evaluation campaigns recorded in this thesis.
Thanks to Anselmo Penas for having supervised and coordinated my firstresearch project. He has always had enough time to listen to me and to offer me hisexperience as researcher through the years.
I would also like to thank my colleagues from the Languages and ComputerSystems Department at UNED. I would like to thank Vıctor Peinado, Juan Cigarran,Fernando Lopez-Ostenero and Vıctor Fresno in particular for all the travels, projectsand works we have shared together. I could not possibly have found better compan-ions for this journey.
I would like to thank Eduardo Valls for sharing his command of the EnglishLanguage with me in order to improve the accuracy and style of this text.
Last, but not least, I would most sincerely like to thank my family. I would liketo thank my parents, Julio and Meryam, for instiling true critical and independentawareness in me as well as for supporting me through all these years. I would liketo thank Solange for having met her obligations as older sister when I most neededthem. And, finally, I would like to thank my uncle Jaime for all his encouragementand wholehearted love.

8

Agradecimientos
Esta seccion empequenecerıa el resto si escribiera todas las cosas que debo agradecera mis directores de tesis, Julio Gonzalo y Enrique Amigo. Estoy en deuda conJulio, quien confio en mı cuando llegue por primera vez a la UNED y me ofrecio laoportunidad de trabajar en un area apasionante. Julio me ha guiado con paciencia enel arte de la investigacion cientıfica y cada dıa me recuerda lo mucho que me quedapor aprender. A Enrique le debo el compartir conmigo su infatigable curiosidad y suconstancia de autentico cientıfico. Sus aportaciones a la metodologıa de evaluacionhan sido esenciales para este trabajo. A los dos les agradezco el contagiarme supasion por la investigacion, su creatividad y su energıa positiva. Sin su ayuda estatesis nunca se habrıa escrito.
Quiero expresar mi gratitud a Felisa Verdejo, quien ha creado y dirige un entornode investigacion tan favorable como el que tenemos en el grupo PLN de la UNED.
Le agradezco a Satoshi Sekine el haberme acogido en su grupo de investigacionen la Universidad de Nueva York. Su experiencia y ayuda han sido imprescindiblespara la organizacion de las dos campanas de evaluacion que se presentan en estetrabajo.
A Anselmo Penas le agradezco el haber dirigido mi primer trabajo de investi-gacion. Durante todos estos anos siempre tuvo tiempo para escucharme y ofrecermesu experiencia como investigador.
Quisiera tambien agradecer a mis companeros del Departamento de Lengua-jes y Sistemas Informaticos de la UNED por el buen ambiente de trabajo y elconocimiento compartido durante este tiempo. En particular, quiero agradecer suayuda a Vıctor Peinado, Juan Cigarran, Fernando Lopez-Ostenero y Vıctor Fresnocon quienes he compartido proyectos y trabajos. No podrıa haber deseado mejorescompaneros para este viaje.
Agradezco muy especialmente a mi familia: a mis padres Julio y Meryam, porensenarme a pensar con espıritu crıtico e independiente y por su apoyo durantetodos estos anos; a Solange, por haber ejercido de hermana mayor cuando mas lonecesitaba; y a mi tıo Jaime, por sus palabras de animo y su carino incondicional.

10
Abstract
In this thesis we have addressed the problem of name ambiguity while searchingfor people on the Web. At the beginning of our work, in 2004, there were veryfew research papers on this topic, and no commercial web search engine wouldprovide this type of facility. For this reason, our research methodology initiallyfocused on the design and organisation (together with Prof. Sekine from New YorkUniversity) of a competitive evaluation campaign for Web People Search systems.Once the campaign had been run for two years, we used the standard test suites builtto perform our own empirical studies on the nature and challenges of the task.
The evaluation campaign, WePS, was organized in 2007 (as a SemEval 2007task) and in 2009 (as a WWW 2009 workshop). WePS was crucial in the process tolay the foundations of a proper scientific study of the Web People Search problem.These were the main accomplishments:
• Standardisation of the problem: now a majority of researchers focus onthe problem as a search results mining task (clustering and informationextraction), as it has been defined in WePS.
• Creation of standard benchmarks for the task: since the first WePS campaignin 2007, the number of publications related to Web People Search has grownsubstantially, and most of them use the WePS test suites as a de-facto standardbenchmark. As of summer 2009, there were already more than 70 researchpapers citing WePS overviews; this not only suggests that WePS has indeedbecome a standard reference for the task, but also that it has contributed toarouse the interest in this kind of research problems.
• Design of evaluation metrics for the task:
1. We have performed a careful formal analysis of several extrinsic clus-tering evaluation metrics based on formal constraints, to conclude thatBCubed metrics are the most suitable for the task. We have also ex-tended the original BCubed definition to allow for overlapping clusters,which is a practical requirement of the task. Our results are generalenough to be employed in other clustering tasks.
2. We have introduced a new metric combination function, UnanimousImprovement Ratio (UIR), which, unlike Van Rijsbergen’s F, does not
12
require an a-priori weighting of metrics (in our case, BCubed Precisionand Recall). In an extensive empirical study we have shown that UIRprovides rich information to compare the performance of systems, whichwas impossible with previous existing metric combinations functions(most prominently F). Using the results of the WePS-2 campaign, wehave shown that F and UIR provide complementary information and,altogether, constitute a powerful analytical tool to compare systems.Although we have tested UIR only in the context of our task, it couldbe potentially useful in any task where several evaluation metrics areneeded to capture the quality of a system, as it happens in several NaturalLanguage Processing problems.
Using the test suites produced in the two WePS evaluation campaigns, wehave then performed a number of empirical studies in order to enhance a betterunderstanding and comprehension of both the nature of the task involved and theway to solve it:
• First, we have studied the potential effects of using (interactive) query re-finements to perform the Web People Search task. We have discovered that,although in most occasions there is an expression that can be used as a near-perfect refinement to retrieve all and only those documents referring to anindividual, the nature of these ideal refinements is unpredictable and veryunlikely to be hypothesized by the user. This confirms the need for searchresults clustering, and also suggests that looking for an optimal refinementmay be a strategy of automatic systems to accomplish the task (and one thathas not been used by any participant in the WePS campaigns).
• Second, we have studied the usefulness of linguistic (computationally in-tensive) features as compared to word n-grams and other cheap features tosolve our clustering problem. Notably, named entities, which are the mostpopular feature immediately after bag-of-words approaches, does not seem toprovide a direct competitive advantage to solve the task. We have reachedthis conclusion abstracting from a particular choice of Machine Learning andText Clustering algorithms, by using a Maximal Pairwise Accuracy estimatorintroduced in this thesis.
• As a side effect of our empirical study, we have built a system which, usingthe confidence of a binary classifier (whether two pages are coreferent ornot) as a similarity metric between document pairs to feed a HierarchicalAgglomerative Clustering algorithm, provides the best results for the taskknown to us (F0.5 = 0.83 vs. 0.82 for the best WePS-2 system), withoutusing computationally intensive linguistic features.
Resumen
En esta tesis hemos abordado el problema de la ambiguedad de nombres en labusqueda de personas en la Web. Al inicio de nuestro trabajo, en 2004, habıa muypocos artıculos de investigacion sobre este tema, y ningun buscador web comercialofrecıa este tipo de servicio. Por esta razon, nuestra metodologıa de investigacion seenfoco inicialmente en el diseno y la organizacion (junto con el Dr. Satoshi Sekinede la Universidad de Nueva York) de una campana de evaluacion competitiva parasistemas de Busqueda de Personas en la Web. Tras la celebracion de dos campanasde evaluacion, utilizamos las colecciones de prueba elaboradas para realizar nuestrospropios estudios empıricos sobre la naturaleza y los desafıos de la tarea.
La campana de evaluacion, WePS, tuvo lugar en 2007 (como una tarea deSemeval 2007) y en 2009 (como un workshop de la conferencia WWW 2009). Estacampana fue crucial para sentar las bases para un estudio cientıfico del problema dela Busqueda de Personas en la Web. Estos fueron los principales logros:
• Estandarizacion del problema: ahora la mayorıa de investigadores enfocan elproblema como una tarea de minerıa de resultados de busqueda (clustering –agrupacion – y extraccion de informacion), tal y como lo definimos en WePS.
• Creacion de un estandar para la comparacion de sistemas: desde la primeracampana WePS en 2007, el numero de publicaciones relacionadas con laBusqueda de Personas en la Web ha crecido sustancialmente, y la mayorıausa colecciones de prueba desarrolladas en WePS. En el verano de 2009, yamas de 70 artıculos de investigacion referenciaban la tarea. Esto no solosugiere que WePS se ha convertido en un estandar de referencia para latarea, sino tambien que ha contribuido a aumentar el interes en este tema deinvestigacion.
• Diseno de metricas de evaluacion para la tarea:
1. Hemos realizado un cuidadoso analisis, basado en restricciones for-males, de varias metricas extrınsecas de evaluacion de sistemas declustering, y hemos concluıdo que las metricas BCubed son las masadecuadas para la tarea. Tambien hemos extendido la definicion originalde BCubed para permitir clusters solapados, que es un requisito practicode la tarea. Nuestros resultados son suficientemente generales comopara ser empleados en otras tareas de agrupacion.
14
2. Hemos introducido una nueva funcion para la combinacion de metricas,el Unanimous Improvement Ratio (UIR) o Ratio de Mejora Unanime,el cual, al contrario que la funcion F de Van Rijsbergen, no requiereun pesado a-priori de las metricas (en nuestro caso, BCubed Preci-sion y Recall). En un extenso estudio empırico hemos mostrado queUIR proporciona informacion muy valiosa para la comparacion de sis-temas, informacion que no proporcionan las funciones de combinacionde metricas existentes (principalmente F). Utilizando los resultadosde la campana WePS-2, hemos mostrado que F y UIR proporcionaninformacion complementaria y, en conjunto, constituyen una potenteherramienta de analisis para comparar sistemas. Aunque hemos probadoUIR solo en el contexto de nuestra tarea, podrıa ser util en cualquiertarea donde se necesiten varias metricas de evaluacion para capturar lacalidad de los sistemas, como ocurre en muchos problema de Proce-samiento del Lenguaje Natural.
Utilizando las colecciones de prueba desarrolladas en las dos campanas deevaluacion WePS, hemos realizado una serie de estudios empıricos orientados aobtener una mejor comprension tanto de la naturaleza de la tarea como de la manerade resolverla:
• En primer lugar, hemos estudiado los efectos potenciales de usar refinamientosde consultas (interactivos) para realizar la tarea de Busqueda de Personasen la Web. Hemos descubierto que, aunque en la mayorıa de las ocasionesexiste una expresion que puede ser utilizada como refinamiento casi perfectopara recuperar todos y solo los documentos que refieren a una persona, lanaturaleza de esto refinamientos ideales es impredecible y son muy difıcilesde encontrar por un usuario. Esto confirma la necesidad de agrupar losresultados de busqueda, y tambien sugiere que buscar un refinamiento optimopuede ser una estrategia para sistemas que intentan resolver la tarea (unaestrategia que aun no ha sido utilizada por los participantes en las campanasWePS).
• En segundo lugar, hemos estudiado la utilidad de los rasgos linguısticos(computacionalmente costosos) en comparacion con n-gramas de palabrasy otros rasgos “baratos” para resolver nuestro problema de agrupacion. Sor-prendentemente, las entidades nombradas, que son son el tipo de rasgo maspopular despues de las aproximaciones basadas en ”bolsas de palabras”, noparecen aportar una ventaja competitiva directa para resolver la tarea. Hemosalcanzado esta conclusion con independencia de la eleccion del algoritmode aprendizaje automatico y del algoritmo de clustering usados, mediante eluso del estimador Maximal Pairwise Precision (Precision Maxima de Pares)presentado en esta tesis.
• Como efecto secundario de nuestro estudio empırico, hemos construido un

15
sistema que, utilizando la confianza de un clasificador binario (el cual detectasi dos documentos son o no correferentes) como metrica de similitud entrepares de documentos para alimentar al algoritmo de Agrupacion Aglomer-ativa Jerarquica, aporta los mejores resultados para la tarea que conocemos((F0,5 = 0, 83 frente a 0,82 del mejor sistema en WePS-2), sin utilizar rasgoslinguısticos computacionalmente costosos.

16
Contents
Contents 17
List of Figures 21
List of Tables 23
I Background 25
1 Introduction 271.1 The Ambiguity of People Names on the Web . . . . . . . . . . . 291.2 Web People Search Services . . . . . . . . . . . . . . . . . . . . 301.3 Web People Search and Other Related NLP Tasks . . . . . . . . . 331.4 Goals . . . . . . . . . . . . . . . . . . . . . . . . . . . . . . . . 351.5 How we Addressed the Web People Search Problem . . . . . . . . 361.6 Structure of the Thesis . . . . . . . . . . . . . . . . . . . . . . . 37
2 State of the Art 412.1 Test Collections . . . . . . . . . . . . . . . . . . . . . . . . . . . 41
2.1.1 Manually Annotated Test Collections . . . . . . . . . . . 422.1.2 Pseudo-ambiguity Test Collections . . . . . . . . . . . . . 46
2.2 Document Representation . . . . . . . . . . . . . . . . . . . . . . 502.3 Similarity Metrics . . . . . . . . . . . . . . . . . . . . . . . . . . 512.4 Clustering Methods . . . . . . . . . . . . . . . . . . . . . . . . . 51
2.4.1 Clustering Process . . . . . . . . . . . . . . . . . . . . . 522.4.2 Stopping Criteria . . . . . . . . . . . . . . . . . . . . . . 542.4.3 Linkage . . . . . . . . . . . . . . . . . . . . . . . . . . . 54
2.5 Evaluation Metrics . . . . . . . . . . . . . . . . . . . . . . . . . 56
II Benchmarking 59
3 The WePS-1 Campaign 613.1 Preliminary Testbed . . . . . . . . . . . . . . . . . . . . . . . . . 613.2 WePS-1 Testbed . . . . . . . . . . . . . . . . . . . . . . . . . . . 63
3.2.1 Training Data . . . . . . . . . . . . . . . . . . . . . . . . 64
18 CONTENTS
3.2.2 Test Data . . . . . . . . . . . . . . . . . . . . . . . . . . 663.2.3 Annotation Process . . . . . . . . . . . . . . . . . . . . . 66
3.3 Evaluation Methodology . . . . . . . . . . . . . . . . . . . . . . 683.4 Campaign Design . . . . . . . . . . . . . . . . . . . . . . . . . . 693.5 Results of the Evaluation Campaign . . . . . . . . . . . . . . . . 703.6 Conclusions . . . . . . . . . . . . . . . . . . . . . . . . . . . . . 71
4 Comparison of Extrinsic Clustering Evaluation Metrics Based on For-mal Constraints 734.1 Formal Constraints on Evaluation Metrics for Clustering Tasks . . 74
4.1.1 Constraint 1: Cluster Homogeneity . . . . . . . . . . . . 744.1.2 Constraint 2: Cluster Completeness . . . . . . . . . . . . 754.1.3 Constraint 3: Rag Bag . . . . . . . . . . . . . . . . . . . 754.1.4 Constraint 4: Clusters Size vs. Quantity . . . . . . . . . . 76
4.2 Comparison of Evaluation Metrics . . . . . . . . . . . . . . . . . 774.2.1 Evaluation by Set Matching . . . . . . . . . . . . . . . . 774.2.2 Metrics Based on Counting Pairs . . . . . . . . . . . . . . 784.2.3 Metrics based on entropy . . . . . . . . . . . . . . . . . . 804.2.4 Evaluation Metrics Based on Edit Distance . . . . . . . . 814.2.5 BCubed: a Mixed Family of Metrics . . . . . . . . . . . . 81
4.3 Related Work: Other Proposed Formal Constraints . . . . . . . . 844.3.1 Dom’s Constraints . . . . . . . . . . . . . . . . . . . . . 844.3.2 Meila’s Constraints . . . . . . . . . . . . . . . . . . . . . 86
4.4 Evaluation of Overlapping Clustering . . . . . . . . . . . . . . . 864.4.1 Extending Standard Metrics for Overlapping Clustering . 874.4.2 Extending BCubed Metrics . . . . . . . . . . . . . . . . . 874.4.3 Extended BCubed: Example of Usage . . . . . . . . . . . 904.4.4 Extended BCubed Applied to WePS-1 . . . . . . . . . . . 93
4.5 Conclusions . . . . . . . . . . . . . . . . . . . . . . . . . . . . . 95
5 Combining Evaluation Metrics via the Unanimous Improvement Ratio 975.1 The Effects of Metric Weighting in Clustering Tasks . . . . . . . 985.2 Proposal . . . . . . . . . . . . . . . . . . . . . . . . . . . . . . . 101
5.2.1 Unanimous Improvements . . . . . . . . . . . . . . . . . 1015.2.2 Unanimous Improvement Ratio . . . . . . . . . . . . . . 102
5.3 Experiments . . . . . . . . . . . . . . . . . . . . . . . . . . . . . 1035.3.1 Rewarding Robustness Across α Values . . . . . . . . . . 1035.3.2 Reflecting Improvement Ranges . . . . . . . . . . . . . . 1055.3.3 UIR Threshold . . . . . . . . . . . . . . . . . . . . . . . 105
5.4 Conclusions . . . . . . . . . . . . . . . . . . . . . . . . . . . . . 107
6 The WePS-2 Campaign 1096.1 Testbed . . . . . . . . . . . . . . . . . . . . . . . . . . . . . . . 109
6.1.1 Development Data . . . . . . . . . . . . . . . . . . . . . 1096.1.2 Test Data . . . . . . . . . . . . . . . . . . . . . . . . . . 110
CONTENTS 19
6.1.3 Manual Annotation . . . . . . . . . . . . . . . . . . . . . 1116.2 Evaluation Methodology . . . . . . . . . . . . . . . . . . . . . . 113
6.2.1 Campaign Design . . . . . . . . . . . . . . . . . . . . . . 1146.3 Participants . . . . . . . . . . . . . . . . . . . . . . . . . . . . . 1146.4 Results of the Evaluation . . . . . . . . . . . . . . . . . . . . . . 115
6.4.1 Comparison of Systems . . . . . . . . . . . . . . . . . . 1166.4.2 Robustness of F Results with Different α Values . . . . . 117
6.5 Conclusions . . . . . . . . . . . . . . . . . . . . . . . . . . . . . 120
III Empirical Studies 121
7 The Scope of Query Refinement in the WePS Task 1237.1 Dataset . . . . . . . . . . . . . . . . . . . . . . . . . . . . . . . 1237.2 Experiments . . . . . . . . . . . . . . . . . . . . . . . . . . . . . 1247.3 Results . . . . . . . . . . . . . . . . . . . . . . . . . . . . . . . . 1277.4 Conclusions . . . . . . . . . . . . . . . . . . . . . . . . . . . . . 129
8 The Role of Named Entities in WePS 1318.1 Experimental Settings . . . . . . . . . . . . . . . . . . . . . . . . 132
8.1.1 Features . . . . . . . . . . . . . . . . . . . . . . . . . . . 1328.1.2 Reformulating WePS as a Classification Task . . . . . . . 133
8.2 Analysis of Individual Features . . . . . . . . . . . . . . . . . . . 1348.2.1 Feature Performance . . . . . . . . . . . . . . . . . . . . 1348.2.2 Redundancy . . . . . . . . . . . . . . . . . . . . . . . . . 135
8.3 Analysis of Feature Combinations . . . . . . . . . . . . . . . . . 1378.4 Results on the Clustering Task . . . . . . . . . . . . . . . . . . . 1398.5 Conclusions . . . . . . . . . . . . . . . . . . . . . . . . . . . . . 141
9 Conclusions 1439.1 Contributions . . . . . . . . . . . . . . . . . . . . . . . . . . . . 143
9.1.1 The Need for Name Disambiguation Systems . . . . . . . 1439.1.2 Development of Reference Test collections . . . . . . . . 1449.1.3 Development of Improved Clustering Evaluation Metrics . 1459.1.4 The Relevance of the Clustering Stopping Criterion . . . . 1459.1.5 The Role of Named Entities . . . . . . . . . . . . . . . . 1469.1.6 Testbeds and Software Released . . . . . . . . . . . . . . 147
9.2 Further Directions . . . . . . . . . . . . . . . . . . . . . . . . . . 147
Bibliography 149
A Publications 159

20 CONTENTS
List of Figures
1.1 Search results for a name shared by many people . . . . . . . . . 281.2 Celebrities sharing the name “Michael Moore” according to Wikipedia 301.3 Zoominfo: sample person profile . . . . . . . . . . . . . . . . . . 311.4 Zoominfo: error disambiguating mentions of the same person . . . 311.5 Name disambiguation error in Spock . . . . . . . . . . . . . . . . 321.6 Name disambiguation error in ArnetMiner . . . . . . . . . . . . . 321.7 Thesis iterative process . . . . . . . . . . . . . . . . . . . . . . . 37
2.1 Example of name conflation for generating a pseudo-ambiguous name 462.2 A dendrogram of a clustering of 10 web search results for the query
“John Smith” . . . . . . . . . . . . . . . . . . . . . . . . . . . . 532.3 Single-link: maximum similarity . . . . . . . . . . . . . . . . . . 552.4 Complete-link: minimum similarity . . . . . . . . . . . . . . . . 552.5 Group-average: average of all similarities . . . . . . . . . . . . . 552.6 Centroid: average of inter-similarity . . . . . . . . . . . . . . . . 552.7 Example of a cross-document coreference chain . . . . . . . . . . 57
3.1 WePS-1 baseline systems . . . . . . . . . . . . . . . . . . . . . . 69
4.1 Clustering evaluation metric constraint 1: Cluster Homogeneity . 754.2 Clustering evaluation metric constraint 2: Cluster Completeness . 754.3 Clustering evaluation metric constraint 3: Rag Bag . . . . . . . . 764.4 Clustering evaluation metric constraint 4: Size vs. Quantity . . . . 774.5 Clustering constraint 2 example . . . . . . . . . . . . . . . . . . 784.6 Satisfaction of Formal Constraints: Examples . . . . . . . . . . . 794.7 Example of computing the BCubed precision and recall for one item 824.8 More noise clusters implies less quality . . . . . . . . . . . . . . 854.9 Clustering evaluation metric constraint 5: Item Multiplicity . . . . 884.10 Computing the multiplicity recall and precision between two items
for extended BCubed metrics . . . . . . . . . . . . . . . . . . . . 894.11 BCubed computing example 1 (ideal solution): Precision=1 Recall=1 904.12 BCubed computing example 2 (duplicating clusters): Precision=0.86
Recall=1 . . . . . . . . . . . . . . . . . . . . . . . . . . . . . . . 904.13 BCubed computing example 3 (duplicating clusters): Precision=0.81
Recall=1 . . . . . . . . . . . . . . . . . . . . . . . . . . . . . . . 91
22 LIST OF FIGURES
4.14 BCubed computing example 4 (removing item occurrences): Preci-sion=1 Recall=0.68 . . . . . . . . . . . . . . . . . . . . . . . . . 91
4.15 BCubed computing example 5 (splitting clusters): Precision=1 Re-call=0.74 . . . . . . . . . . . . . . . . . . . . . . . . . . . . . . 91
4.16 BCubed computing example 6 (joining clusters): Precision=0.88Recall=0.94 . . . . . . . . . . . . . . . . . . . . . . . . . . . . . 91
4.17 F average over BCubed Precision and Recall satisfies all formalconstraints: F (P,R) = 1
α 1P
+(1−α) 1R
. . . . . . . . . . . . . . . . 92
4.18 Clustering output of a cheat system . . . . . . . . . . . . . . . . . 93
5.1 Evaluation results for clustering systems in WePS-1 . . . . . . . . 985.2 WePS-1 system evaluation results for several F parametrisations . 995.3 F measure vs. UIR: rewarding robustness . . . . . . . . . . . . . 1025.4 F vs. UIR: reflecting improvement ranges . . . . . . . . . . . . . 1045.5 UIR vs. the improvement according to the less improved metric. . 1055.6 Improvement detected across UIR thresholds . . . . . . . . . . . 106
6.1 WePS-2 clustering annotation GUI . . . . . . . . . . . . . . . . . 113
8.1 Precision/Recall curve of token-based features . . . . . . . . . . . 1358.2 Precision/Recall curve of word n-grams . . . . . . . . . . . . . . 1368.3 Precision/Recall curve of NEs obtained with the Stanford NER tool 1378.4 Precision/Recall curve of NEs obtained with the OAK NER tool . 1388.5 Independence of similarity criteria with respect to the token based
feature . . . . . . . . . . . . . . . . . . . . . . . . . . . . . . . . 1398.6 Estimated PWA upper bound versus the real PWA of decision trees
trained with feature combinations . . . . . . . . . . . . . . . . . 1408.7 Maximal Pairwise Accuracy vs. results of a Decision Tree . . . . 141
List of Tables
2.1 Example of concept-instance pairs . . . . . . . . . . . . . . . . . 432.2 Summary of manually annotated test collections . . . . . . . . . . 452.3 Summary of pseudo-ambiguous test collections . . . . . . . . . . 49
3.1 WePS-1 preliminary testbed: annotation statistics . . . . . . . . . 623.2 WePS-1 trial testbed: number of people for each name . . . . . . 633.3 WePS-1 training data . . . . . . . . . . . . . . . . . . . . . . . . 653.4 WePS-1 test data . . . . . . . . . . . . . . . . . . . . . . . . . . 673.5 WePS-1 team ranking . . . . . . . . . . . . . . . . . . . . . . . . 71
4.1 WePS-1 system ranking according to Purity, Inverse Purity andF(Purity, Inverse Purity) . . . . . . . . . . . . . . . . . . . . . . . 94
4.2 WePS-1 system ranking according to Extended BCubed Precision,Extended BCubed Recall, and its F combination. . . . . . . . . . 94
5.1 WePS-1 rankings for F0.5 and F0.2 using Purity and Inverse Purity 1005.2 Statistical significance of improvements: F0.5 vs. F0.2 . . . . . . 1005.3 UIR and F0.5 increase when F increases for all α values . . . . . . 1045.4 UIR and F0.5 increases vs. statistical significance tests . . . . . . 104
6.1 WePS-2 test data . . . . . . . . . . . . . . . . . . . . . . . . . . 1116.2 WePS-2 official team ranking using B-Cubed measures . . . . . . 1166.3 WePS-2 team ranking using Purity/Inverse Purity metrics . . . . . 1186.4 WePS-2 results with BCubed Precision and Recall, F and UIR
measures. . . . . . . . . . . . . . . . . . . . . . . . . . . . . . . 119
7.1 Query refinement results for clusters of size 1 . . . . . . . . . . . 1247.2 Query refinement results for clusters of size 2 . . . . . . . . . . . 1257.3 Query refinement results for clusters of size >=3 . . . . . . . . . 1267.4 Query refinement results for clusters of size 1 . . . . . . . . . . . 1267.5 Query refinement results for clusters of size 2 . . . . . . . . . . . 1267.6 Query refinement results for clusters of size >=3 . . . . . . . . . 1277.7 Distribution of the person attributes used for the ”best-ae“ query
refinement strategy . . . . . . . . . . . . . . . . . . . . . . . . . 127
8.1 Distribution of instances in the WePS classification testbed . . . . 134

24 LIST OF TABLES
8.2 Evaluation of Decision Tree models on the WePS-2 clustering task 141

Part I
Background

Chapter 1
Introduction
Let us suppose that an Information Technology company has opened a projectmanager position and hundreds of people submit their resume. The position needsto be filled by a reliable worker, and only few candidates can be interviewed. Inview of this circumstance, the company decides to supplement the resume withpersonal information available on the Web.
The employee in charge of collecting all candidates’ data uses a popular websearch engine, querying for each person’s name and browsing the first ten pagesof search results (100 documents) for documents with information regarding thatparticular candidate. Unfortunately, many documents refer to other people whoshare the same name.
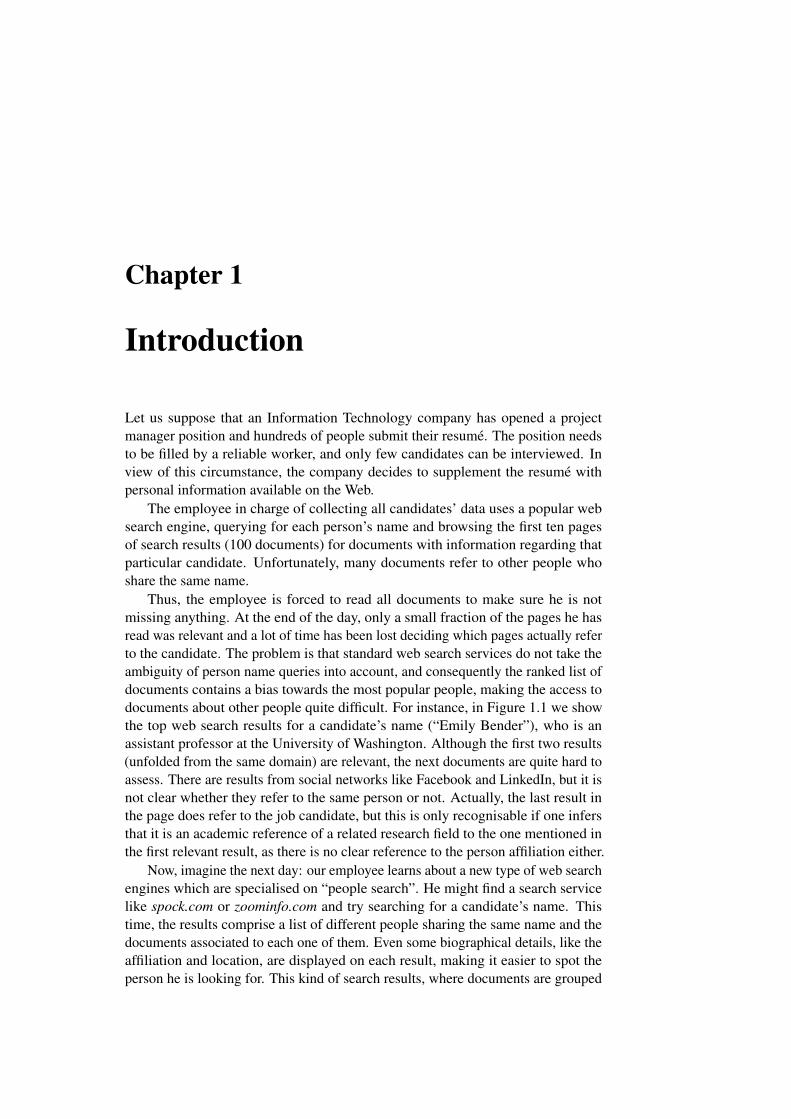
Thus, the employee is forced to read all documents to make sure he is notmissing anything. At the end of the day, only a small fraction of the pages he hasread was relevant and a lot of time has been lost deciding which pages actually referto the candidate. The problem is that standard web search services do not take theambiguity of person name queries into account, and consequently the ranked list ofdocuments contains a bias towards the most popular people, making the access todocuments about other people quite difficult. For instance, in Figure 1.1 we showthe top web search results for a candidate’s name (“Emily Bender”), who is anassistant professor at the University of Washington. Although the first two results(unfolded from the same domain) are relevant, the next documents are quite hard toassess. There are results from social networks like Facebook and LinkedIn, but it isnot clear whether they refer to the same person or not. Actually, the last result inthe page does refer to the job candidate, but this is only recognisable if one infersthat it is an academic reference of a related research field to the one mentioned inthe first relevant result, as there is no clear reference to the person affiliation either.
Now, imagine the next day: our employee learns about a new type of web searchengines which are specialised on “people search”. He might find a search servicelike spock.com or zoominfo.com and try searching for a candidate’s name. Thistime, the results comprise a list of different people sharing the same name and thedocuments associated to each one of them. Even some biographical details, like theaffiliation and location, are displayed on each result, making it easier to spot theperson he is looking for. This kind of search results, where documents are grouped
28 Introduction
Figure 1.1: Search results for a name shared by many people
1.1 The Ambiguity of People Names on the Web 29
according to the person they refer to, are achieved by automatic methods and helpour employee to finish, quite quickly, a task that otherwise would take many hoursto a human. We will call Web People Search the task of grouping and mining searchresults for a person name according to the individuals sharing that name.
In this thesis, we formalise the Web People Search task (WePS) and study itsrelationship with the previous work in Natural Language Processing (NLP). Wedevelop an evaluation framework for the empirical study of this task and apply it oncompetitive evaluation campaigns in order to compare approaches from differentresearch groups. This framework will allow us to justify empirically the need forautomatic methods in this task, test different evaluation metrics, compare systemsand evaluate the impact of different document representations.
1.1 The Ambiguity of People Names on the Web
A study of the query log of the AllTheWeb and Altavista search sites [SJP04]gives an idea of the relevance of the people search task: 11-17% of the querieswere composed of a person name with additional terms and 4% were identifiedsimply as people names. All in all, three in four users were seeking information onnon-celebrities.
In addition, ambiguity represents a characteristic feature of most people’s names.According to the data available from 1990 U.S. Census Bureau, only 90,000 differentnames were shared by 100 million people [AGV05]. As the amount of informationavailable in the WWW grows, a higher number of people is mentioned in differentweb pages. This means that a search for a person name will most likely return alarge amount of documents, mentioning different people with the same name.
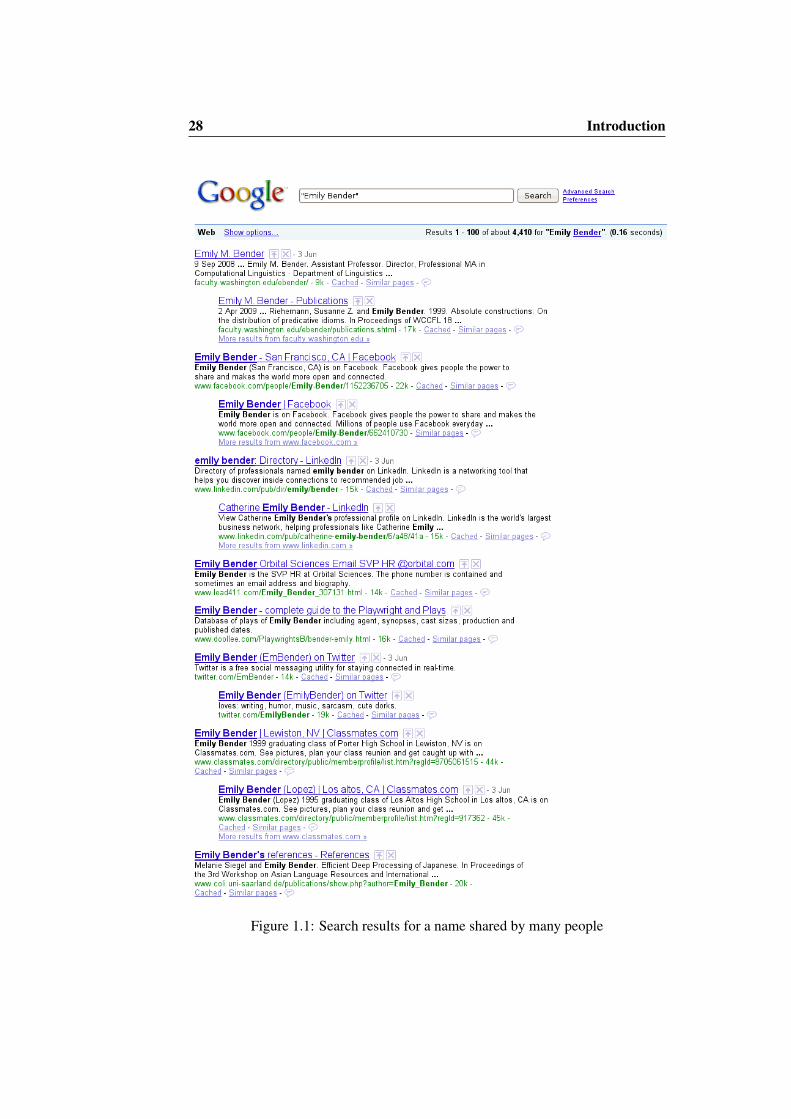
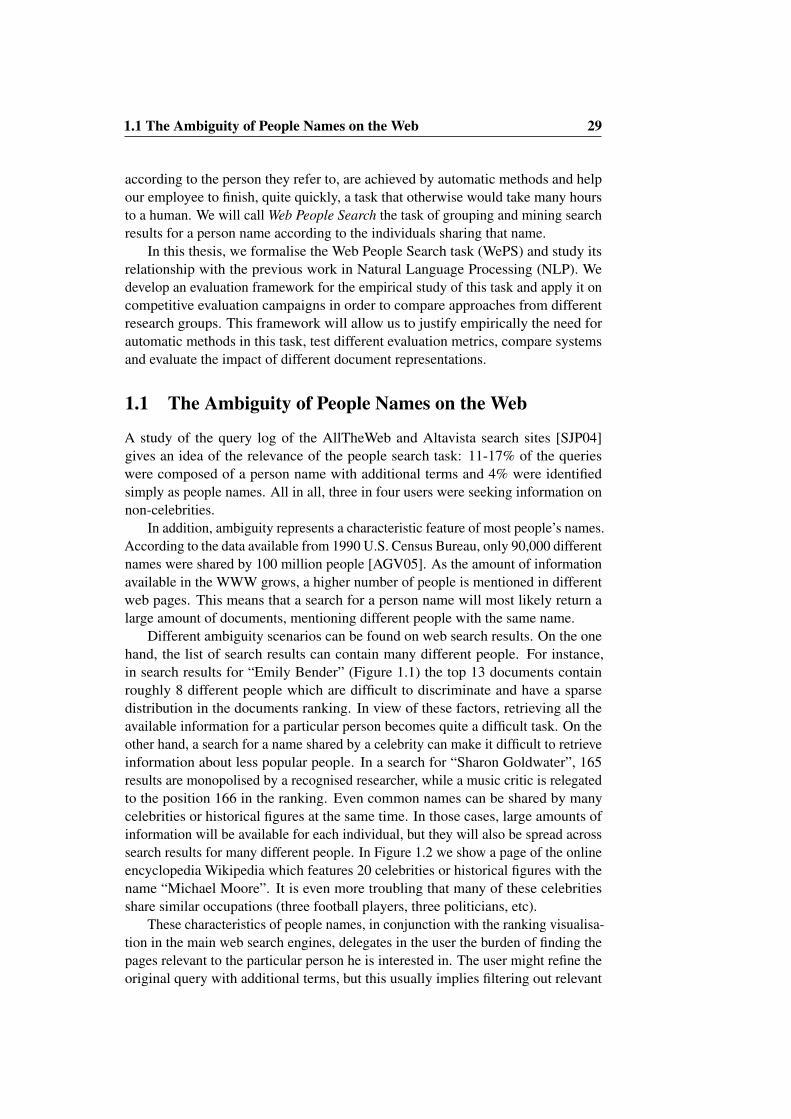
Different ambiguity scenarios can be found on web search results. On the onehand, the list of search results can contain many different people. For instance,in search results for “Emily Bender” (Figure 1.1) the top 13 documents containroughly 8 different people which are difficult to discriminate and have a sparsedistribution in the documents ranking. In view of these factors, retrieving all theavailable information for a particular person becomes quite a difficult task. On theother hand, a search for a name shared by a celebrity can make it difficult to retrieveinformation about less popular people. In a search for “Sharon Goldwater”, 165results are monopolised by a recognised researcher, while a music critic is relegatedto the position 166 in the ranking. Even common names can be shared by manycelebrities or historical figures at the same time. In those cases, large amounts ofinformation will be available for each individual, but they will also be spread acrosssearch results for many different people. In Figure 1.2 we show a page of the onlineencyclopedia Wikipedia which features 20 celebrities or historical figures with thename “Michael Moore”. It is even more troubling that many of these celebritiesshare similar occupations (three football players, three politicians, etc).
These characteristics of people names, in conjunction with the ranking visualisa-tion in the main web search engines, delegates in the user the burden of finding thepages relevant to the particular person he is interested in. The user might refine theoriginal query with additional terms, but this usually implies filtering out relevant
30 Introduction
documents in the process. Surprisingly, in Spink’s study [SJP04], it was noted thatfew person name searches included query reformulation.
Figure 1.2: Celebrities sharing the name “Michael Moore” according to Wikipedia
1.2 Web People Search Services
At the time of starting this research (late 2004) there were no people search servicesonline searching on web data. The situation has changed dramatically since then.
The ambiguity of people names has recently become both an active researchtopic and a relevant application domain for web search services. Zoominfo.com,Spock.com, ArnetMiner, 123people.com are but a few examples of sites whichperform Web People Search, albeit with limited disambiguation capabilities. Thefollowing examples will show that, although an important effort has been recently

1.2 Web People Search Services 31
made by most Information Retrieval companies, name disambiguation in web searchresults is still an unsolved problem.
In 2005, ZoomInfo was launched as a Web People Search service. In broad ZoomInfoterms this service focuses on business related people1. From the standpoint of ourresearch, Zoominfo can be considered the first people search commercial initiative.Submitting a query to Zoominfo results in a list of people profiles, each one (fig.1.3) containing information extracted from various web pages in which the personis mentioned.
Figure 1.3: Zoominfo: sample person profile
Figure 1.4: Zoominfo: error disambiguating mentions of the same person
1Zoominfo also powers people searches for Business Week.
32 Introduction
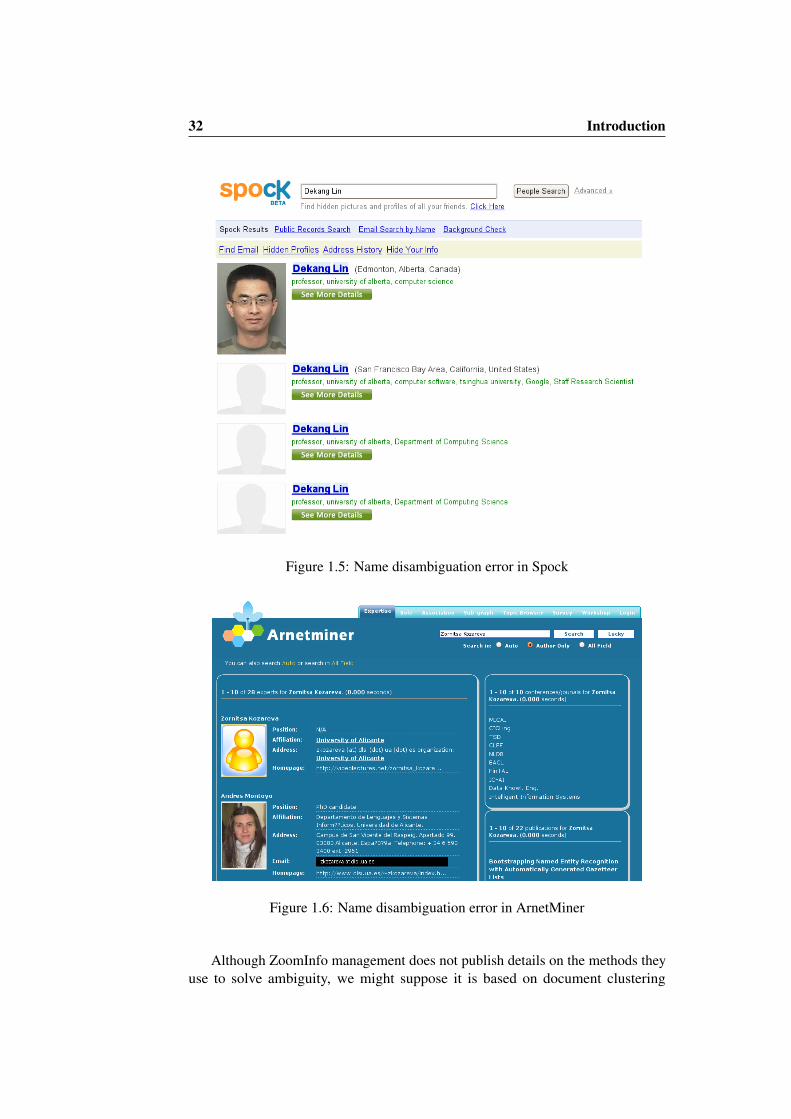
Figure 1.5: Name disambiguation error in Spock
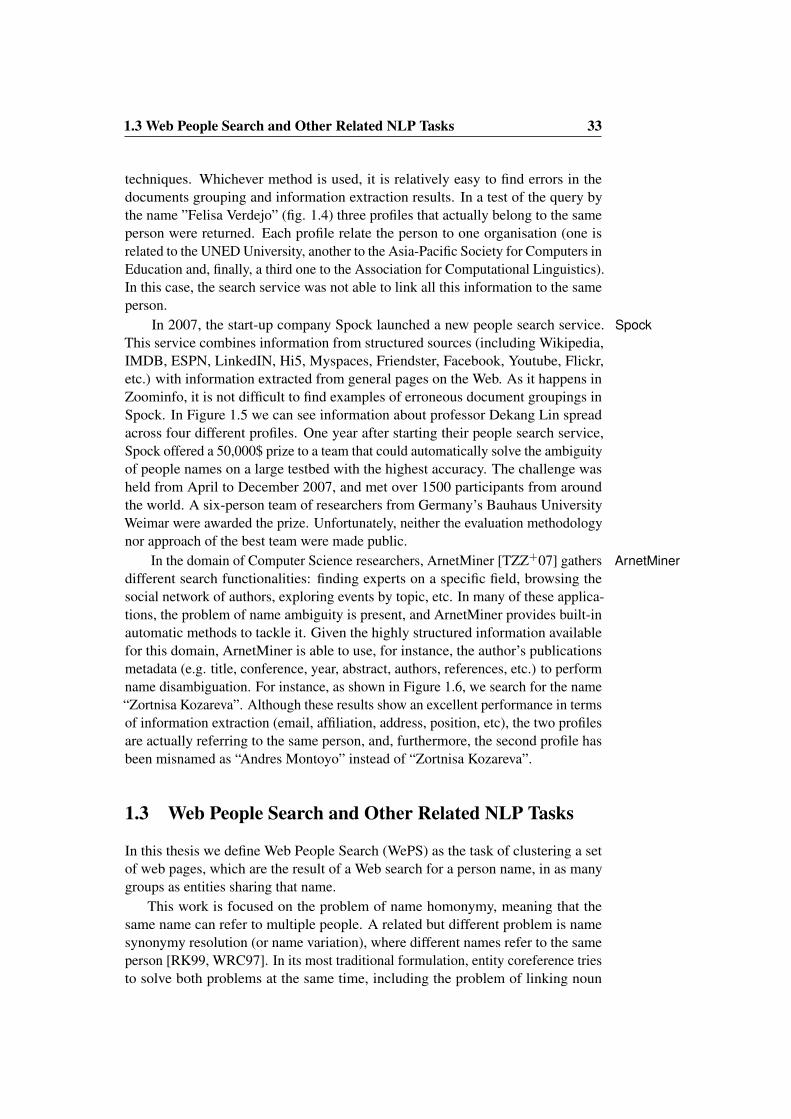
Figure 1.6: Name disambiguation error in ArnetMiner
Although ZoomInfo management does not publish details on the methods theyuse to solve ambiguity, we might suppose it is based on document clustering
1.3 Web People Search and Other Related NLP Tasks 33
techniques. Whichever method is used, it is relatively easy to find errors in thedocuments grouping and information extraction results. In a test of the query bythe name ”Felisa Verdejo” (fig. 1.4) three profiles that actually belong to the sameperson were returned. Each profile relate the person to one organisation (one isrelated to the UNED University, another to the Asia-Pacific Society for Computers inEducation and, finally, a third one to the Association for Computational Linguistics).In this case, the search service was not able to link all this information to the sameperson.
In 2007, the start-up company Spock launched a new people search service. SpockThis service combines information from structured sources (including Wikipedia,IMDB, ESPN, LinkedIN, Hi5, Myspaces, Friendster, Facebook, Youtube, Flickr,etc.) with information extracted from general pages on the Web. As it happens inZoominfo, it is not difficult to find examples of erroneous document groupings inSpock. In Figure 1.5 we can see information about professor Dekang Lin spreadacross four different profiles. One year after starting their people search service,Spock offered a 50,000$ prize to a team that could automatically solve the ambiguityof people names on a large testbed with the highest accuracy. The challenge washeld from April to December 2007, and met over 1500 participants from aroundthe world. A six-person team of researchers from Germany’s Bauhaus UniversityWeimar were awarded the prize. Unfortunately, neither the evaluation methodologynor approach of the best team were made public.
In the domain of Computer Science researchers, ArnetMiner [TZZ+07] gathers ArnetMinerdifferent search functionalities: finding experts on a specific field, browsing thesocial network of authors, exploring events by topic, etc. In many of these applica-tions, the problem of name ambiguity is present, and ArnetMiner provides built-inautomatic methods to tackle it. Given the highly structured information availablefor this domain, ArnetMiner is able to use, for instance, the author’s publicationsmetadata (e.g. title, conference, year, abstract, authors, references, etc.) to performname disambiguation. For instance, as shown in Figure 1.6, we search for the name“Zortnisa Kozareva”. Although these results show an excellent performance in termsof information extraction (email, affiliation, address, position, etc), the two profilesare actually referring to the same person, and, furthermore, the second profile hasbeen misnamed as “Andres Montoyo” instead of “Zortnisa Kozareva”.
1.3 Web People Search and Other Related NLP Tasks
In this thesis we define Web People Search (WePS) as the task of clustering a setof web pages, which are the result of a Web search for a person name, in as manygroups as entities sharing that name.
This work is focused on the problem of name homonymy, meaning that thesame name can refer to multiple people. A related but different problem is namesynonymy resolution (or name variation), where different names refer to the sameperson [RK99, WRC97]. In its most traditional formulation, entity coreference triesto solve both problems at the same time, including the problem of linking noun
34 Introduction
phrases and pronouns, and considering different types of ambiguous entities (peoplenames, but also locations and organisations).
Name homonymy is not as frequent inside the same document as it is whenCross-documentcoreference considering a whole collection of texts. In this sense Cross-document Coreference
Resolution (CDC) is a task strongly related with WePS. The objective of CDCis to reconstruct the coreference chain (i.e., a set of expressions referring to oneindividual) of an entity mentioned in a collection of documents. Unlike CDC,the WePS task focuses on a single person name and does not require building acomplete coreference chain linking every mention of entities in the collection, butjust grouping documents that mention the same person with that name. The CDCtask varies different research works: in some cases it only deals with people names[BB98b, GA04], it includes in other cases other entity types [LMR05, PPK05];and in other works it includes name variation [Blu05, BF08]. As we will showin Chapter 2, CDC evolution has set the ground for the methods and evaluationmethodology that will be used in the WePS task.
WePS has close links with Word Sense Disambiguation (WSD). WSD isWord SenseDisambiguation the task assigning a sense to a word in a given context [AE06]. In both cases,
the addressed problem is the resolution of the ambiguity in a natural languageexpression. However, we should consider some differences:
• WSD can rely on dictionaries to define the number of possible senses in aword. In the case of name ambiguity, no such dictionary is available, eventhough, in plain theory there is an exact number of people sharing the samename.
• WSD typically focuses on the disambiguation of common words (nouns,verbs, adjectives) for which a relatively small number of senses exist com-pared to the hundreds or thousands of people that might share the same name.However, word senses in dictionaries often bear subtle differences whichmake them hard to distinguish in practice, while person name ambiguity canbe considered as a homograph-level type of ambiguity.
• Boundaries between word senses in a dictionary are often subtle or evenconflicting, making binary decisions is harder and sometimes even useless,depending on the application. In the case of person name disambiguation,distinctions can be either easier to establish (radically different people sharingthe same name) or very difficult (for instance, when namesakes share thesame occupation), but there is always an objective reality behind the different“senses” of a person name.
An interesting variation of WSD is presented by the Word Sense InductionWord Sense Inductiontask (WSI) [PL02b], also known as Word Sense Discrimination. In this case, thegoal consists of discovering the senses of a word in a given a set of contexts. Thistask is closer to WePS in that no dictionary is used to guide the disambiguationprocess and that semantic clustering techniques (see Chapter 2.4) typically havea predominant role both in WePS and WSI [PL02b, Nei02, Rap03]. Still, WSI
1.4 Goals 35
maintains the other essential differences we have mentioned between word andname sense disambiguation.
A particular instance of the WePS task takes place in online communities Citation disambiguationwhere each individual is explicitly linked to others. This is the case, for example,of authors mentioned in scholar citations [HZG05, TKL06, KNL+09]. As wesaw in the previous section, ArnetMiner provides a disambiguation solution forthis domain restricted scenario. The case of author ambiguity in scholar citationspresents a major problem for the integration and search of bibliographic sources.Citation Disambiguation (CD) tries to solve this issue, usually exploiting the meta-information available in most publications (co-authorship, author affiliation, email,etc).
With the advent of social networks in the WWW, name disambiguation hasbecome major focus of research in those cases too. Malin [Mal05] studied methodsfor the disambiguation of entities in the Internet Movie Database. Bekkerman[BM05] approaches the problem of disambiguating web appearances of a group ofpeople.
WePS can also be considered as an intermediate task in fields like Expert Expert findingfinding (EF), which consists of finding people that have a certain type of knowledge[Bal08]. This task has recently received increased attention, especially since thelaunch of an expert finding task as part of the enterprise track at TREC in 2005[CdVS05]. Given a query (describing the area in which a particular expertise isbeing sought), participating systems have to return a ranked list of people names inresponse. In this case, WePS could serve as means of providing more accurate andcomplete information about people in a particular area of expertise.
Name disambiguation has been also formulated as the task of, given one Results re-rankingrelevant document about a person, finding other documents that talk about thesame person [Guh04]. The input of this task is not person name, but a documentmentioning a particular person and a ranking of search results. The goal here is tobring documents that are relevant for that particular user information need on top.A drawback of this interaction model is that users must browse search results inorder to find at least one document that matches the person they are looking for. Toour knowledge, this approach to the name disambiguation problem has not beenpursued in other works.
1.4 Goals
The main goal of this thesis is to create the appropriate resources and to establisha well grounded methodology for the evaluation of name disambiguation systems.This goal in turn is divided in three main objectives:
1. To formalise the name disambiguation problem in web search results. Thefollowing goals are derived from this objective:
• Review the treatment of the name disambiguation problem in relatedNatural Language Processing areas (Word Sense Disambiguation, Cross-
36 Introduction
document Coreference, Record Linkage, Expert Finding, Citation Dis-ambiguation, etc).
• To motivate empirically the need for automatic methods in order toassist Web People Search.
2. To create an evaluation framework for Web People Search systems. This aimimplies the following sub-goals:
• To define a name disambiguation task that allows the empirical compar-ison of different approaches.
• To create a testbed corpus, based on real web results for ambiguouspeople names. The testbed should provide a representative sample ofthe problem.
• To adopt an evaluation methodology and quality measures for WePSsystems.
3. To analyse the most prominent features of the name disambiguation problemas well as the most promising research directions in the development ofWePS systems. Specifically, we focus on the document representation phase.To validate the impact of different document representations empirically,independently of the choice if clustering algorithm, term weighting criteria,etc. We aim to compare the performance of features requiring an in-depthlinguistic processing (mainly, named entities) versus features like word n-grams and terms in the document.
1.5 How we Addressed the Web People Search Problem
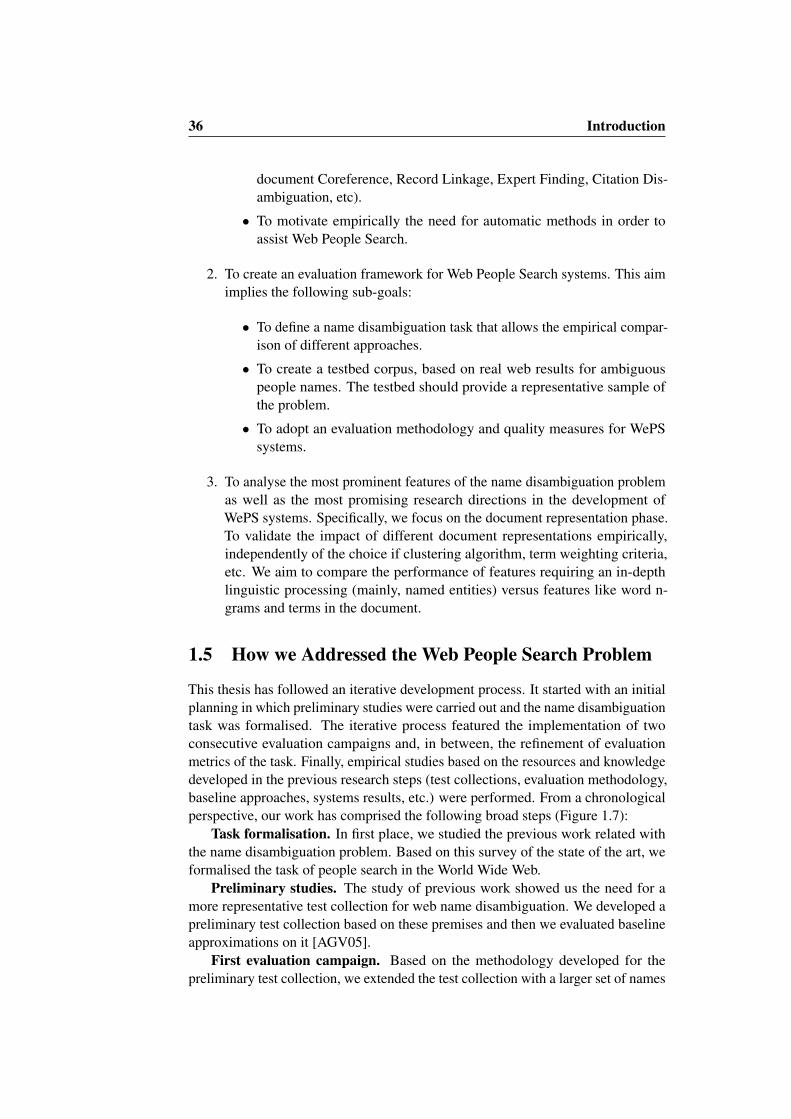
This thesis has followed an iterative development process. It started with an initialplanning in which preliminary studies were carried out and the name disambiguationtask was formalised. The iterative process featured the implementation of twoconsecutive evaluation campaigns and, in between, the refinement of evaluationmetrics of the task. Finally, empirical studies based on the resources and knowledgedeveloped in the previous research steps (test collections, evaluation methodology,baseline approaches, systems results, etc.) were performed. From a chronologicalperspective, our work has comprised the following broad steps (Figure 1.7):
Task formalisation. In first place, we studied the previous work related withthe name disambiguation problem. Based on this survey of the state of the art, weformalised the task of people search in the World Wide Web.
Preliminary studies. The study of previous work showed us the need for amore representative test collection for web name disambiguation. We developed apreliminary test collection based on these premises and then we evaluated baselineapproximations on it [AGV05].
First evaluation campaign. Based on the methodology developed for thepreliminary test collection, we extended the test collection with a larger set of names
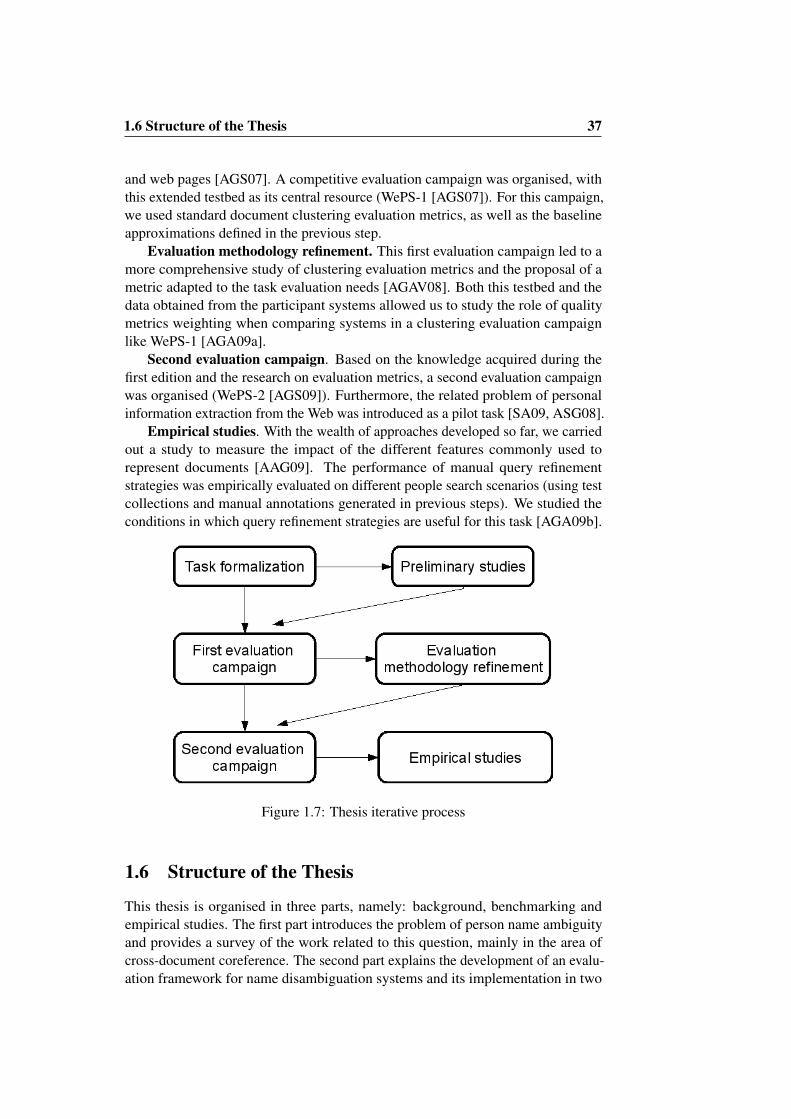
1.6 Structure of the Thesis 37
and web pages [AGS07]. A competitive evaluation campaign was organised, withthis extended testbed as its central resource (WePS-1 [AGS07]). For this campaign,we used standard document clustering evaluation metrics, as well as the baselineapproximations defined in the previous step.
Evaluation methodology refinement. This first evaluation campaign led to amore comprehensive study of clustering evaluation metrics and the proposal of ametric adapted to the task evaluation needs [AGAV08]. Both this testbed and thedata obtained from the participant systems allowed us to study the role of qualitymetrics weighting when comparing systems in a clustering evaluation campaignlike WePS-1 [AGA09a].
Second evaluation campaign. Based on the knowledge acquired during thefirst edition and the research on evaluation metrics, a second evaluation campaignwas organised (WePS-2 [AGS09]). Furthermore, the related problem of personalinformation extraction from the Web was introduced as a pilot task [SA09, ASG08].
Empirical studies. With the wealth of approaches developed so far, we carriedout a study to measure the impact of the different features commonly used torepresent documents [AAG09]. The performance of manual query refinementstrategies was empirically evaluated on different people search scenarios (using testcollections and manual annotations generated in previous steps). We studied theconditions in which query refinement strategies are useful for this task [AGA09b].
Figure 1.7: Thesis iterative process
1.6 Structure of the Thesis
This thesis is organised in three parts, namely: background, benchmarking andempirical studies. The first part introduces the problem of person name ambiguityand provides a survey of the work related to this question, mainly in the area ofcross-document coreference. The second part explains the development of an evalu-ation framework for name disambiguation systems and its implementation in two

38 Introduction
competitive evaluation campaigns. Finally, the third part presents empirical studieson the impact of query refinement strategies and the impact of different featurerepresentations. These main parts comprise the following individual chapters:
I: Background
• Chapter 1 presents the motivation for the study of automatic approaches tothe name disambiguation problem. We formalise this problem as the “WebPeople Search task”. We review current commercial initiatives and present abrief survey of the related research areas.
• Chapter 2 provides a survey of approaches to the problem prior to our work.This survey reviews the test collections, document representation approaches,similarity metrics, clustering methods and evaluation metrics employed in theliterature.
II: Benchmarking
• Chapter 3 presents the task definition, resources, participation, and compar-ative results for the Web People Search task, which was organised as partof the SemEval-2007 evaluation exercise. This task consists of, given thefirst 100 documents retrieved from a web search engine using an ambiguousperson name as query, cluster them according to the actual entities that arementioned in each document.
• In Chapter 4 we define a few intuitive formal constraints which shed lighton those aspects of the quality of a clustering that are captured by differentmetric families. These formal constraints are compared with other constraintsproposed in the literature. Considering the characteristics of Web PeopleSearch, we also extend the analysis to the problem of overlapping clustering,where items can simultaneously belong to more than one cluster. BCubedmetrics [BB98b] are chosen as the only ones that both satisfy all formalconstraints and can be adapted to cover the overlapping clustering task.
• Chapter 5 presents the Unanimous Improvement Ratio (UIR), a measure thatallows to compare systems using two evaluation metrics without dependencieson relative metric weights. For clustering tasks, this kind of measure becomesnecessary given the trade-off between precision and recall oriented metricswhich usually depends on a clustering threshold parameter stated in thealgorithm.
• Chapter 6 describes the second WePS (Web People Search) Evaluationcampaign. This chapter presents the definition, resources, methodology andevaluation metrics, participation and comparative results for the clusteringtask.
1.6 Structure of the Thesis 39
III: Empirical studies
• In Chapter 7 we study whether it is reasonable to assume that pages aboutthe desired person can be interactively filtered by the user by adding queryterms. We justify the need for automatic methods that solve the person nameambiguity on web search results empirically.
• In Chapter 8 we compare the coverage, reliability and independence of anumber of features constitute potential information sources for this clusteringtask, paying special attention to the role of named entities in the texts to beclustered. Although named entities are used in most approaches, our resultsshow that, regardless of the Machine Learning or Clustering algorithm used,named entity recognition and classification by themselves only make a smallcontribution to solve the problem.
• Chapter 8 discusses our conclusions and contributions. We also present thefuture research lines of this work.

40 Introduction
Chapter 2
State of the Art
In this chapter, we will review previous work related to the resolution and evaluationof person name ambiguity. We will present the main features of test collectionsthat have been used in order to study the performance of different systems, as wellas the evaluation metrics that have been used to measure it. We will also reviewthe methods and document representations different researchers have chosen inprevious works about the subject.
2.1 Test Collections
Test collections constitute an essential tool for comparing different approaches to thesame Natural Language Processing (NLP) task. Typically, an NLP test collectioncomprises a textual corpus and data that is used as ground truth to be compared tothe systems output.
Systems for person name disambiguation have been tested initially on cross-document coreference (see Section 1.3) test collections. In these collections, eachmention of an ambiguous name is disambiguated. Note that, strictly speaking, forthe cross-document coreference task, each mention of an ambiguous name has tobe annotated, while in the name disambiguation task, as we have defined it (seeIntroduction), it suffices to group the documents containing at least one mentionreferring to the same person with the ambiguous name. Many cross-documentcoreference test collections have been built upon newswire corpora [BB98b, WL02,FH04, GA04, PPK05, Ped06]. It has not been until recently that web collectionshave become predominant [MY03, AKE04, WGLD05, Man06, CM07a]. Thesecollections are usually obtained by querying a search engine for an ambiguous nameand retrieving a certain number of documents from the top results. Web collectionsare characterised by noisy contexts, in which well-formed sentences are not asabundant as they are in news articles and little or no information is provided todisambiguate a name.
Only few of these collections have been reused by different researchers. Usu-ally, they are created ad-hoc for each particular research work. In addition to that,the evaluation methodology, quality measures and task definitions vary among re-
42 State of the Art
search works. These conditions have prevented a consistent comparison of differentapproaches.
We will classify test collections in two types, according to the method employedfor its creation: (i) manually annotated testbeds and (ii) testbeds created usingautomatic methods (pseudo-ambiguity).
2.1.1 Manually Annotated Test Collections
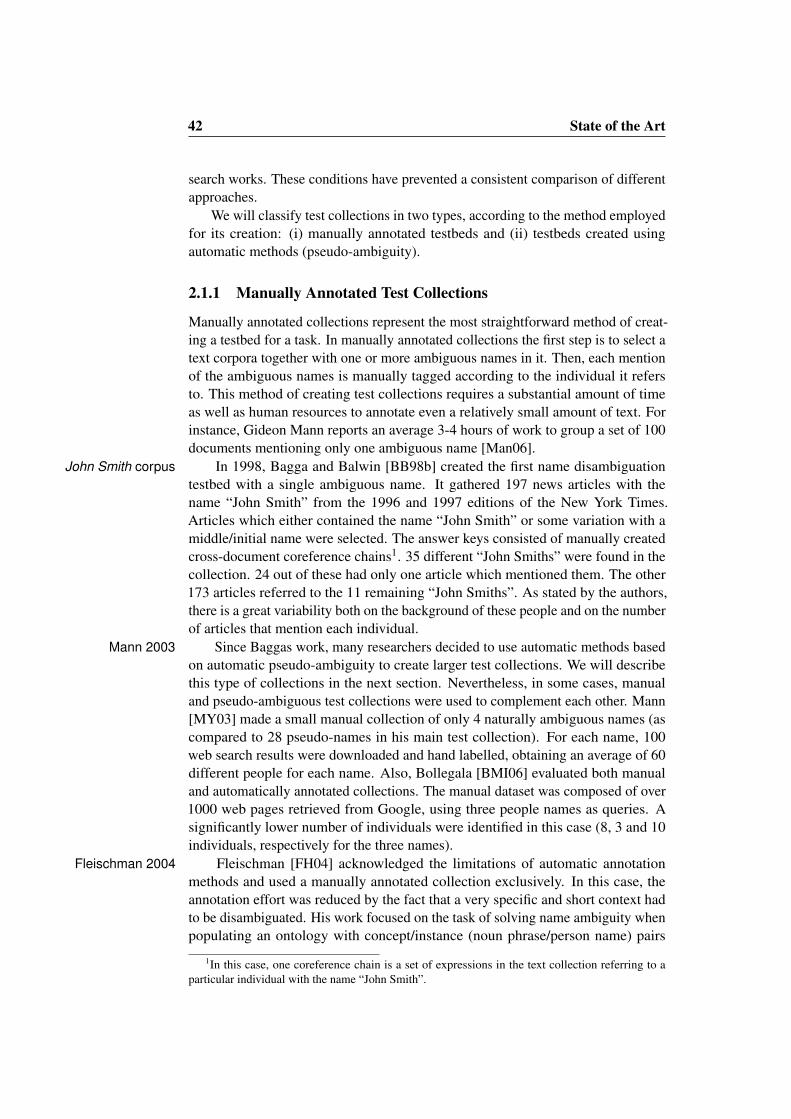
Manually annotated collections represent the most straightforward method of creat-ing a testbed for a task. In manually annotated collections the first step is to select atext corpora together with one or more ambiguous names in it. Then, each mentionof the ambiguous names is manually tagged according to the individual it refersto. This method of creating test collections requires a substantial amount of timeas well as human resources to annotate even a relatively small amount of text. Forinstance, Gideon Mann reports an average 3-4 hours of work to group a set of 100documents mentioning only one ambiguous name [Man06].
In 1998, Bagga and Balwin [BB98b] created the first name disambiguationJohn Smith corpustestbed with a single ambiguous name. It gathered 197 news articles with thename “John Smith” from the 1996 and 1997 editions of the New York Times.Articles which either contained the name “John Smith” or some variation with amiddle/initial name were selected. The answer keys consisted of manually createdcross-document coreference chains1. 35 different “John Smiths” were found in thecollection. 24 out of these had only one article which mentioned them. The other173 articles referred to the 11 remaining “John Smiths”. As stated by the authors,there is a great variability both on the background of these people and on the numberof articles that mention each individual.
Since Baggas work, many researchers decided to use automatic methods basedMann 2003on automatic pseudo-ambiguity to create larger test collections. We will describethis type of collections in the next section. Nevertheless, in some cases, manualand pseudo-ambiguous test collections were used to complement each other. Mann[MY03] made a small manual collection of only 4 naturally ambiguous names (ascompared to 28 pseudo-names in his main test collection). For each name, 100web search results were downloaded and hand labelled, obtaining an average of 60different people for each name. Also, Bollegala [BMI06] evaluated both manualand automatically annotated collections. The manual dataset was composed of over1000 web pages retrieved from Google, using three people names as queries. Asignificantly lower number of individuals were identified in this case (8, 3 and 10individuals, respectively for the three names).
Fleischman [FH04] acknowledged the limitations of automatic annotationFleischman 2004methods and used a manually annotated collection exclusively. In this case, theannotation effort was reduced by the fact that a very specific and short context hadto be disambiguated. His work focused on the task of solving name ambiguity whenpopulating an ontology with concept/instance (noun phrase/person name) pairs
1In this case, one coreference chain is a set of expressions in the text collection referring to aparticular individual with the name “John Smith”.
2.1 Test Collections 43
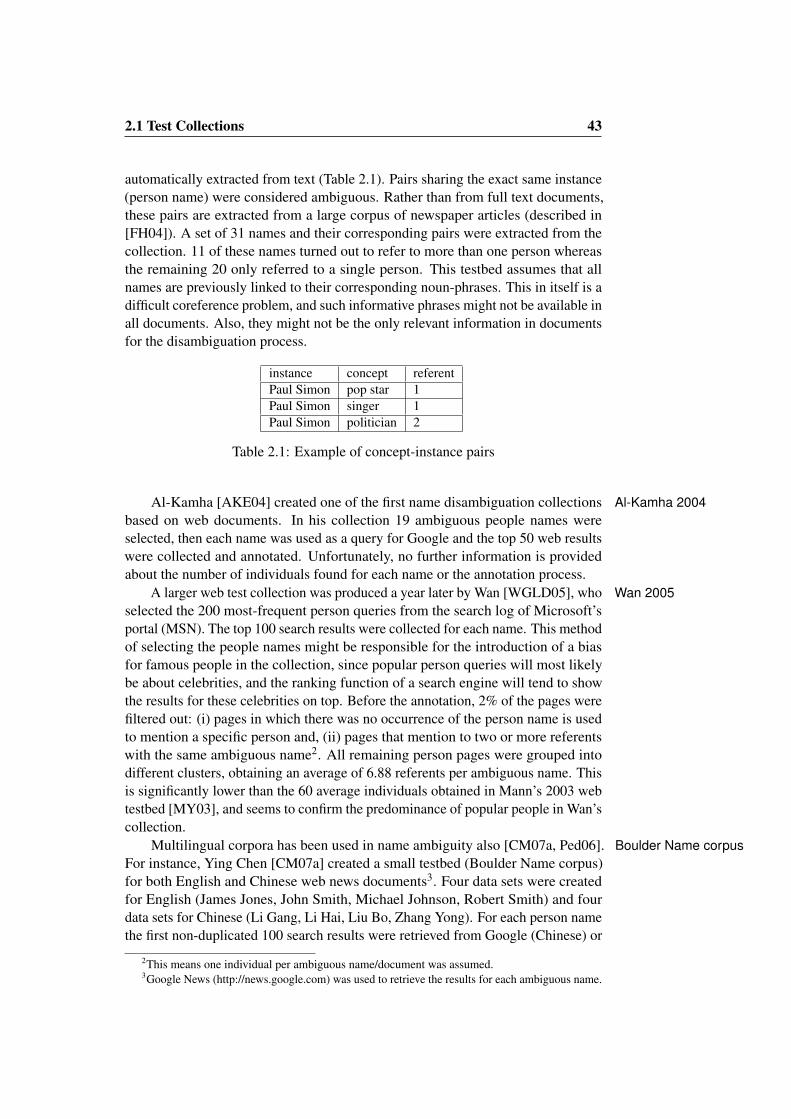
automatically extracted from text (Table 2.1). Pairs sharing the exact same instance(person name) were considered ambiguous. Rather than from full text documents,these pairs are extracted from a large corpus of newspaper articles (described in[FH04]). A set of 31 names and their corresponding pairs were extracted from thecollection. 11 of these names turned out to refer to more than one person whereasthe remaining 20 only referred to a single person. This testbed assumes that allnames are previously linked to their corresponding noun-phrases. This in itself is adifficult coreference problem, and such informative phrases might not be available inall documents. Also, they might not be the only relevant information in documentsfor the disambiguation process.
instance concept referentPaul Simon pop star 1Paul Simon singer 1Paul Simon politician 2
Table 2.1: Example of concept-instance pairs
Al-Kamha [AKE04] created one of the first name disambiguation collections Al-Kamha 2004based on web documents. In his collection 19 ambiguous people names wereselected, then each name was used as a query for Google and the top 50 web resultswere collected and annotated. Unfortunately, no further information is providedabout the number of individuals found for each name or the annotation process.
A larger web test collection was produced a year later by Wan [WGLD05], who Wan 2005selected the 200 most-frequent person queries from the search log of Microsoft’sportal (MSN). The top 100 search results were collected for each name. This methodof selecting the people names might be responsible for the introduction of a biasfor famous people in the collection, since popular person queries will most likelybe about celebrities, and the ranking function of a search engine will tend to showthe results for these celebrities on top. Before the annotation, 2% of the pages werefiltered out: (i) pages in which there was no occurrence of the person name is usedto mention a specific person and, (ii) pages that mention to two or more referentswith the same ambiguous name2. All remaining person pages were grouped intodifferent clusters, obtaining an average of 6.88 referents per ambiguous name. Thisis significantly lower than the 60 average individuals obtained in Mann’s 2003 webtestbed [MY03], and seems to confirm the predominance of popular people in Wan’scollection.
Multilingual corpora has been used in name ambiguity also [CM07a, Ped06]. Boulder Name corpusFor instance, Ying Chen [CM07a] created a small testbed (Boulder Name corpus)for both English and Chinese web news documents3. Four data sets were createdfor English (James Jones, John Smith, Michael Johnson, Robert Smith) and fourdata sets for Chinese (Li Gang, Li Hai, Liu Bo, Zhang Yong). For each person namethe first non-duplicated 100 search results were retrieved from Google (Chinese) or
2This means one individual per ambiguous name/document was assumed.3Google News (http://news.google.com) was used to retrieve the results for each ambiguous name.
44 State of the Art
Google news (English). The ambiguity found in this collection is characterised by afew popular individuals and a long tail of “singletons” (people mentioned in onlyone document). This effort for multilingual collections was preceded by Pedersen[Ped06], who used pseudoambiguity in the annotation process (see next section).
The Web03 corpus [Man06] 4 is the test collection which best fits our definitionWeb03 corpusof the Web People Search task. It comprises web documents retrieved from a searchengine. The selected ambiguous names are common, yet not necessarily associatedto a celebrity, broadening the types of ambiguity scenarios to be found in thecollection. For the name selection first and last names were sampled independentlyfrom the U.S. Census distribution. Each name was searched in Google, and then thetop 100 search results (at maximum) were downloaded. The resulting collectionis composed of 882 web pages, 32 names and 212 people sharing those names. Aconservative approach was used to group the pages: two pages were consideredto refer to the same person only when certain information appearing in both pagescould be used to relate them (e.g. same affiliation, city of residence, etc.). If nomatching information was found between the two pages, they remained separate.As in the Boulder Name Corpus, a long tail of infrequent individuals is found in thiscollection: 155 (73%) out of all 212 referents were mentioned in just one page. Thelarge number of people that only appears in one document is due to the usage ofvery common names from the U.S. Census. The average number of people sharinga name is 6.6. This might seem a low degree of ambiguity for such common names,but it must be noted that in average, the actual number of documents annotated foreach name is also very low (27.5).
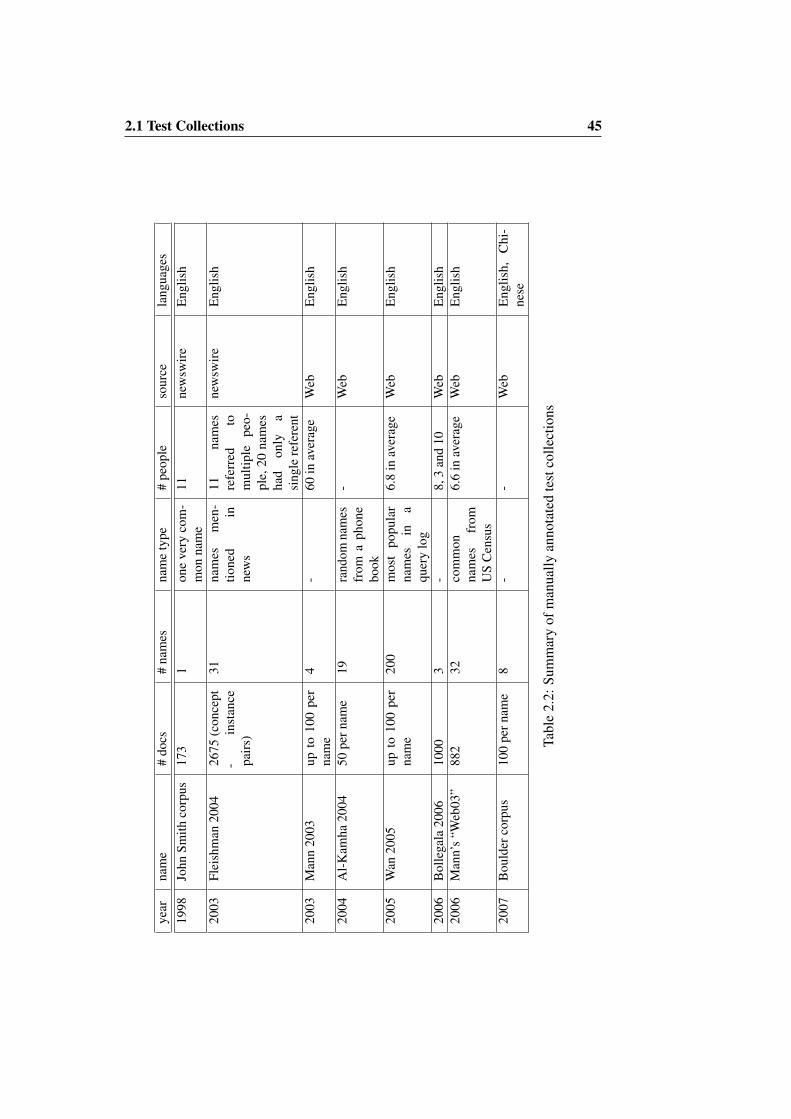
Table 2.2 summarises some of the characteristics of the manual collections wehave reviewed 5. Most of the collections reviewed are not appropriate for the WePStask. Newswire datasets like the “John Smith” corpus and Fleischman’s collection[BB98b, FH04] are discarded, because we are focused on web search results. Thecriteria to sample people names also proves to be conflictive. Using only popularnames as in Wan’s collection [WGLD05] does not relate to search scenarios suchas the one described in the introduction to this thesis. In cases like Mann 2003,Bollegala 2006 and the Boulder corpus [MY03, BMI06, CM07a], the number ofambiguous names sampled is too small.
All in all, Mann’s “Web03” collection [Man06] provides the best testbed forthe evaluation of the name disambiguation task6. And yet, there are aspects of thetestbed design that could be improved. For instance: (i) providing a wider variety ofname sources (both common names and names of celebrities), (ii) increasing thenumber of samples of ambiguous names in the collection and (iii) increasing thenumber of documents for each name.
4http://www.cs.jhu.edu/ gsm/publications/Web03.tar.gz5Note that not all the information is available for each collection.6[AKE04] is a similar collection but has a smaller number of ambiguous names.
2.1 Test Collections 45
year
nam
e#
docs
#na
mes
nam
ety
pe#
peop
leso
urce
lang
uage
s19
98Jo
hnSm
ithco
rpus
173
1on
eve
ryco
m-
mon
nam
e11
new
swir
eE
nglis
h
2003
Flei
shm
an20
0426
75(c
once
pt-
inst
ance
pair
s)
31na
mes
men
-tio
ned
inne
ws
11na
mes
refe
rred
tom
ultip
lepe
o-pl
e,20
nam
esha
don
lya
sing
lere
fere
nt
new
swir
eE
nglis
h
2003
Man
n20
03up
to10
0pe
rna
me
4-
60in
aver
age
Web
Eng
lish
2004
Al-
Kam
ha20
0450
pern
ame
19ra
ndom
nam
esfr
oma
phon
ebo
ok
-W
ebE
nglis
h
2005
Wan
2005
upto
100
per
nam
e20
0m
ost
popu
lar
nam
esin
aqu
ery
log
6.8
inav
erag
eW
ebE
nglis
h
2006
Bol
lega
la20
0610
003
-8,
3an
d10
Web
Eng
lish
2006
Man
n’s
“Web
03”
882
32co
mm
onna
mes
from
US
Cen
sus
6.6
inav
erag
eW
ebE
nglis
h
2007
Bou
lder
corp
us10
0pe
rnam
e8
--
Web
Eng
lish,
Chi
-ne
se
Tabl
e2.
2:Su
mm
ary
ofm
anua
llyan
nota
ted
test
colle
ctio
ns
46 State of the Art
2.1.2 Pseudo-ambiguity Test Collections
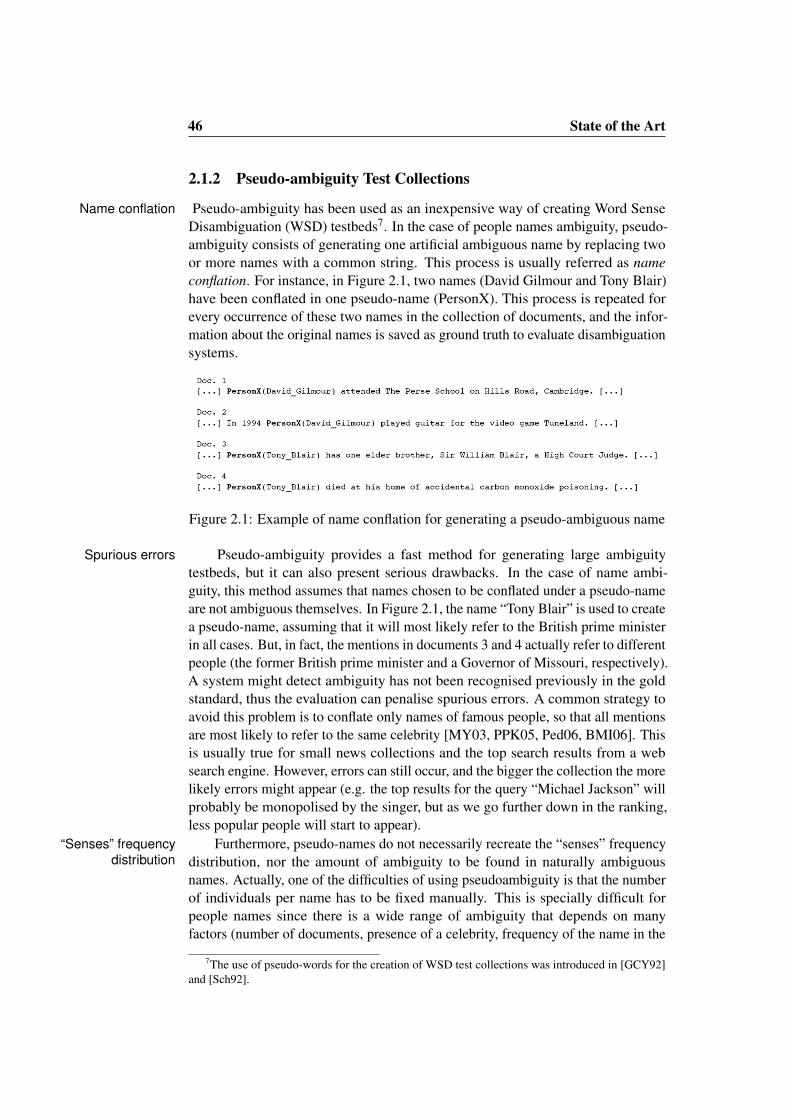
Pseudo-ambiguity has been used as an inexpensive way of creating Word SenseName conflationDisambiguation (WSD) testbeds7. In the case of people names ambiguity, pseudo-ambiguity consists of generating one artificial ambiguous name by replacing twoor more names with a common string. This process is usually referred as nameconflation. For instance, in Figure 2.1, two names (David Gilmour and Tony Blair)have been conflated in one pseudo-name (PersonX). This process is repeated forevery occurrence of these two names in the collection of documents, and the infor-mation about the original names is saved as ground truth to evaluate disambiguationsystems.
Figure 2.1: Example of name conflation for generating a pseudo-ambiguous name
Pseudo-ambiguity provides a fast method for generating large ambiguitySpurious errorstestbeds, but it can also present serious drawbacks. In the case of name ambi-guity, this method assumes that names chosen to be conflated under a pseudo-nameare not ambiguous themselves. In Figure 2.1, the name “Tony Blair” is used to createa pseudo-name, assuming that it will most likely refer to the British prime ministerin all cases. But, in fact, the mentions in documents 3 and 4 actually refer to differentpeople (the former British prime minister and a Governor of Missouri, respectively).A system might detect ambiguity has not been recognised previously in the goldstandard, thus the evaluation can penalise spurious errors. A common strategy toavoid this problem is to conflate only names of famous people, so that all mentionsare most likely to refer to the same celebrity [MY03, PPK05, Ped06, BMI06]. Thisis usually true for small news collections and the top search results from a websearch engine. However, errors can still occur, and the bigger the collection the morelikely errors might appear (e.g. the top results for the query “Michael Jackson” willprobably be monopolised by the singer, but as we go further down in the ranking,less popular people will start to appear).
Furthermore, pseudo-names do not necessarily recreate the “senses” frequency“Senses” frequencydistribution distribution, nor the amount of ambiguity to be found in naturally ambiguous
names. Actually, one of the difficulties of using pseudoambiguity is that the numberof individuals per name has to be fixed manually. This is specially difficult forpeople names since there is a wide range of ambiguity that depends on manyfactors (number of documents, presence of a celebrity, frequency of the name in the
7The use of pseudo-words for the creation of WSD test collections was introduced in [GCY92]and [Sch92].
2.1 Test Collections 47
population, etc).The John Smith corpus created by Bagga [BB98b] (see previous section) “person-x” corpus
was used six years later by Gooi and Allan [GA04] to compare their system withBagga’s original approach. The small size of the collection and the fact that it onlyrepresented the ambiguity of one name motivated the creation of a larger testbedusing automatic annotation. A single pseudo-ambiguous name was generated fromthe conflation of a large list of people names. First, a named entity recognition toolwas used to detect people names in the Text Retrieval Conference (TREC) newswirecollections. Then, all occurrences of a random set of people names was replacedby the string “person-x”, keeping the information about the original names. A totalof 14,767 different people names mentioned 34,404 times were replaced with thepseudo-name “person-x”. Although the annotation process is automatic, thoroughmanual work had to be carried out in order to avoid conflating ambiguous names andto include variations of the chosen names in each document. The result was a single,but enormously ambiguous, pseudo-name. The primary objective of this work wasto compare Bagga’s approach with others, and thus the corpus design was intendedto be similar in that it contained only one ambiguous name. Leaving aside thedownsides related to pseudo-ambiguous names, it seems unrealistic to evaluate onlyone ambiguous name at the time. Names can provide radically different ambiguityscenarios and, as we will see in Chapter 3, this circumstance has consequences inthe performance of name disambiguation systems.
In Mann [MY03], 28 pseudo-names were made by conflating two presumably Mann 2003unambiguous names. These pseudo-names were created combining 8 real peoplenames of celebrities, historical figures, etc. In the same work, Mann used a smallermanually annotated corpus (see previous section). It is noteworthy that there is quitea wide gap between the ambiguity assigned to pseudo-names (2 individuals pername) and the one found in naturally ambiguous names (an average of 60 differentpeople reported for 4 different names). Actually, Mann does not evaluate all clustersin the hand labelled collection, but rather a three way partition of the clustering (thetwo biggest clusters, plus one containing everything else in the collection). Theevaluation is only performed over the two biggest clusters. This choice removes thedifficulty of clustering infrequent people, for which little information is available,and makes results found in the two collections more comparable. On the other hand,the reality of the hand labelled data is largely ignored, which, in a way, seems tospoil the interest of evaluating on naturally occurring ambiguity.
Another example of fixed ambiguity is Pedersen’s 2005 testbed [PPK05], Pedersen 2005where pseudo-names are limited to only two “senses”. All the contexts associatedwith each pair were extracted from a large corpus of newswire text. Each contextconsisted of approximately 25 words to the left and right of the ambiguous name.The corpus employed in these experiments was the Agence France Press EnglishService (AFE) portion of the GigaWord English Corpus, as distributed by theLinguistic Data Consortium. The AFE corpus consists of 170,969,000 words ofEnglish text which appeared in the AFE newswire from May 1994 to May 1997,and from December 2001 to June 2002. Overall this represents approximately 1.2GB of text (uncompressed).
48 State of the Art
A multilingual test collection was created by Pedersen [Ped06] from a largePedersen 2006newswire corpora in four languages, Bulgarian, English, Romanian and Spanish.Evaluation contexts were created by conflating together pairs of popular names ofpeople and places (likely to be unambiguous). The following pairs of names wereconflated in all four languages: George Bush-Tony Blair, Mexico-India, USA-Paris,Ronaldo-David Beckham, Diego Maradona-Roberto Baggio, and NATO-USA. Asin its previous work, these pairs were conflated creating pseudo-names with two“senses”.
Bollegala [BMI06] carried out an evaluation using fixed ambiguity pseudo-Bollegala 2006names as well as naturally ambiguous names (see previous section). 50 documentswere obtained from a web search engine for three different people names, and thenmerged on a single pseudo-name. The names correspond to Maria Sharapova, BillGates and Bill Clinton.
One of the largest pseudo-ambiguity test collections for name disambiguationSpock Challengecorpus was released between April - December 2007 by the startup company Spock. This
collection was part of a competition for automatic person name disambiguationsystems8. The wining team was awarded a monetary price. Unfortunately, detailsabout the test collection, evaluation methodology and winning strategy were notpublished. The test collection was available only during the development period ofthe contest.
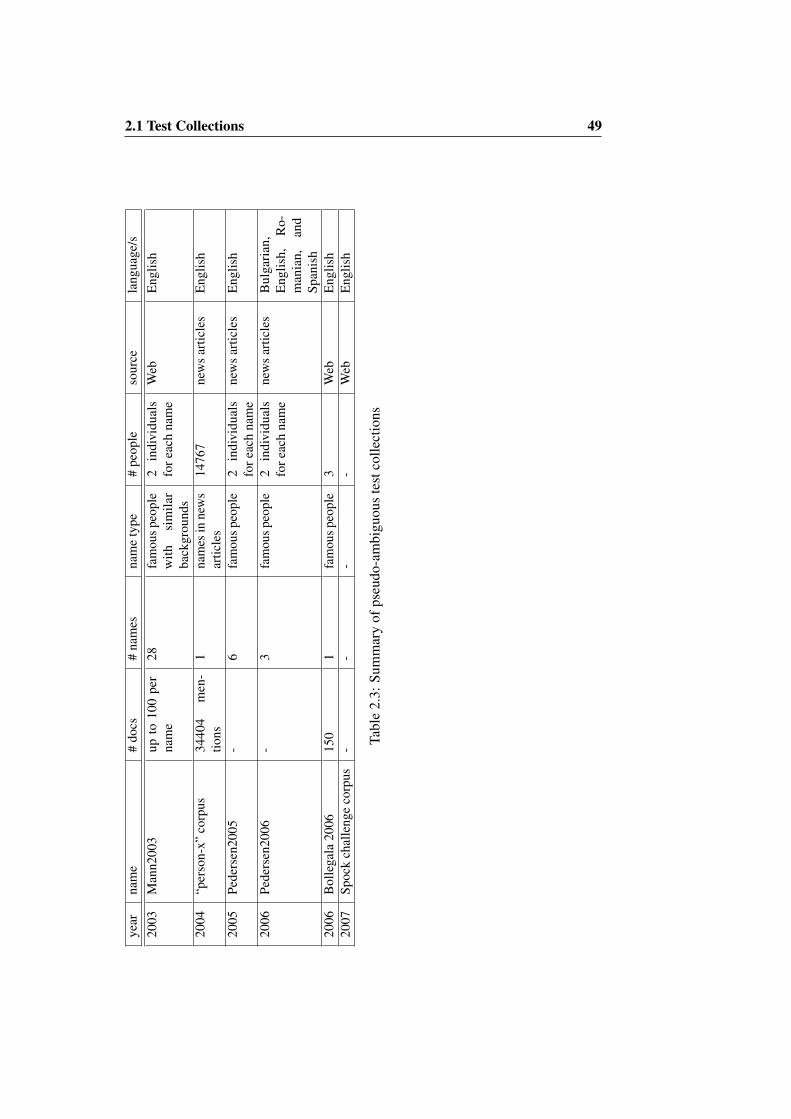
In Table 2.3, we have summed up the main features of automatically generatedtest collections. Surprisingly, these collections have been generated for a smallnumber of names (with the exception of [Man06]). Furthermore, the amount of“senses” assigned to pseudo-names has been either extremely low or over the top(14767 people for one name in the “person-x” corpus), but nobody has tried toemulate the distribution of people names ambiguity that can be found on naturallyambiguous names. In this thesis we will show that estimating the number of peoplementioned with the ambiguous name is one of the main challenges for systemdesigners. For this reason, the generation of test collections through pseudo-namesdoes not seem an optimal choice.
8http://challenge.spock.com/
2.1 Test Collections 49ye
arna
me
#do
cs#
nam
esna
me
type
#pe
ople
sour
cela
ngua
ge/s
2003
Man
n200
3up
to10
0pe
rna
me
28fa
mou
speo
ple
with
sim
ilar
back
grou
nds
2in
divi
dual
sfo
reac
hna
me
Web
Eng
lish
2004
“per
son-
x”co
rpus
3440
4m
en-
tions
1na
mes
inne
ws
artic
les
1476
7ne
ws
artic
les
Eng
lish
2005
Pede
rsen
2005
-6
fam
ousp
eopl
e2
indi
vidu
als
fore
ach
nam
ene
ws
artic
les
Eng
lish
2006
Pede
rsen
2006
-3
fam
ousp
eopl
e2
indi
vidu
als
fore
ach
nam
ene
ws
artic
les
Bul
gari
an,
Eng
lish,
Ro-
man
ian,
and
Span
ish
2006
Bol
lega
la20
0615
01
fam
ousp
eopl
e3
Web
Eng
lish
2007
Spoc
kch
alle
nge
corp
us-
--
-W
ebE
nglis
h
Tabl
e2.
3:Su
mm
ary
ofps
eudo
-am
bigu
ous
test
colle
ctio
ns
50 State of the Art
2.2 Document Representation
Many different features have been used to represent documents in which an ambigu-Bag of Wordsous name is mentioned. The most basic is the Bag of Words (BoW) representation,where the document text is processed as an unordered collection of words. Inmost systems, words from the full document are used either as the only feature[BB98b, GA04] or in combination with others [KCN+07]. Other works have usedsmaller portions of the document to produce BoW representations. For instance,Bagga [BB98b] produced within-document coreference chains in order to extractall sentences that refer to the same entity in the document (a similar approach isfollowed by Gooi and Bollegala [GA04, BMI06]). A simpler approach consists ofselecting the text on a window of words around each occurrence of the ambiguousname. In Mann’s work [Man06], context windows of 50 or 100 words obtainedsignificantly better results than the use of the entire document in a pseudo-ambiguitytest collection, but no significant difference in the naturally ambiguous names wasascertained. Finally, word n-grams have been also employed. Document representa-tion consisting of statistically significant bigrams that occur in the same context asthe ambiguous name have also been used [PPK05].
Researchers like Cucerzan and Nguyen [Cuc07, NC08] have explored theWikipedia informationuse of Wikipedia information to improve the disambiguation process. Wikipediaprovides candidate entities that are linked to specific mentions in a text. The obviouslimitation of this approach lies in the fact that only celebrities and historical figurescan be identified in this way. These approaches are yet to be applied to the specifictask of grouping search results.
Biographical features are strongly related to NEs and have been also proposedBiographical featuresfor this task due to its high level of precision. Mann [MY03] extracted thesefeatures using lexical patterns to group pages about the same person. Al-Kamha[AKE04] used a simpler approach, based on hand coded features (e.g. email, zipcodes, addresses, etc). In Wan’s work [WGLD05], biographical information (personname, title, organisation, email address and phone number) is shown to improve theclustering results when combined with lexical features (words from the document)and NE (person, location, organisation).
NEs are a frequently used feature for name disambiguation. Ravin [RK99]Named entitiesintroduced a rule-based approach that tackles both variation and ambiguity whileanalysing the structure of names. In most recent research, NEs (person, locationand organisations) are extracted from the text and used as a source of evidence tocalculate the similarity between documents (see for instance [Blu05, KCN+07]).However, the advantages of using NE have not yet been clarified. For instance,Blume [Blu05] uses NEs coocurring with the ambiguous mentions of a name as a keyfeature for the disambiguation process. Saggion [Sag08] compared the performaceof NEs versus BoW features. In his experiments only one of several representationsbased on organisation NEs outperformed the word based approach. Furthermore,this result is highly dependent on the choice of metric weighting (NEs achieve highprecision at the cost of a low recall and viceversa for BoW).
In summary, with the exception of representations that use the link structure
2.3 Similarity Metrics 51
[BM05, Mal05] or graph representations [KCN+07], the most common documentrepresentations for the problem include BoW and NEs, and in some cases biograph-ical features retrieved from the text.
2.3 Similarity Metrics
The next step after choosing the set of features that represent documents mentioningan ambiguous name is to select a method of measuring the semantic similaritybetween those mentions. It is commonly assumed that similar contexts tend to referto the same people. Hence, the similarity between documents is measured in thetask of grouping documents about the same person.
Cosine [MS99] is the most frequently used similarity metric in previous work Cosine[BB98b, WL02, MY03, AKE04, NLS04, WGLD05, BM05, Mal05, BMI06]. Thedistance between two documents is computed as the cosine of the angle betweentheir corresponding vectors. Each component of a document vector represents acertain feature. Only the presence/absence of the feature might be indicated (forbinary vectors), or a certain weight might be assigned in order to account for itsimportance in that specific document (real-valued vectors). For the general case oftwo n-dimensional vectors ~x and ~y in a real-valued space, the cosine measure canbe calculated as follows:
cos(~x, ~y) =~x· ~y|~x||~y|
=∑ni=1 xiyi√∑n
i=1 x2i
√∑ni=1 y
2i
Kullback-Leibler Divergence [MS99] has been also used in name disambigua- Kullback-LeiblerDivergencetion [GA04]. The KL divergence measures how different two probability distribu-
tions are. The more dissimilar the distributions are, the higher the KL divergence. Ifthe distance is 0, then both distributions are identical.
Finally, classification has been used in the name disambiguation problem to Classification formetrics combinationobtain a value represeting the confidence that a pair of documents are coreferent
[FH04, AKE04, Tiw05]. A document-to-document matrix is generated with theseconfidence values and then fed to a standard clustering algorithm. This approach hasthe advantage of optimising the combination of many similarity metrics according toa training collection. For instance, Fleischman [FH04] trained a Maximum Entropymodel to give the probability that two names referred to the same individual.
2.4 Clustering Methods
Once the similarity between documents has been calculated, the next step consistsof grouping documents mentioning the ambiguous name according to the actualindividual they refer to. Name disambiguation systems use clustering methods toperform this step. Clustering algorithms group a set of elements (e.g. documents)into subsets or clusters. Their goal is to create internally coherent clusters that are
52 State of the Art
clearly different from each other. In other words, elements within a cluster shouldbe as similar as possible; and elements in different clusters should be as dissimilaras possible.
Clustering is the most common form of unsupervised learning. It differsUnsupervised learningfrom supervised learning in that the learner is given only unlabelled examples. Inclustering, it is both the distribution and makeup of the data which determine clustermembership. In the case of the name disambiguation problem, it is not feasibleto learn how to classify documents for every individual. Thus, the unsupervisedquality of clustering methods provides an appropriate approach to the problem.
As we saw in the previous section, there are systems that, conversely, trainSupervised learninga boolean classifier to decide whether a pair of documents is coreferent in orderto obtain a reliable similarity criterion [FH04, NLS04, AKE04, Tiw05]. It is alsocommon to train certain variables like the weight assigned to different featuresor the stopping criteria. So, it is not uncommon for systems in this task to use adevelopment/training set to choose a value for those variables.
In general, the assignment models employed in the previous work are disjunctiveOverlapping clustering(hard clustering), meaning that one object can belong to one and only one cluster.This is related to the assumption that the occurrences of a person name in the samedocument always refer to the same entity (Yarowsky’s “one sense per discourse”).In reality, it is not infrequent to find an ambiguous name referring to multiple peoplein the same document (overlapping clustering). As we will see in Chapters 3 and 6,our task definition does allow the same document to be assigned to multiple clustersto account for this fact in the data.
2.4.1 Clustering Process
In its foundational work of 1998 Bagga [BB98b] proposed a cross-documentIncremental VectorSpace coreference system that uses the Incremental Vector Space clustering algorithm.
The system works as follows: First, a cluster is created with one document. Then,the next document is compared against the first cluster. If the similarity computed isabove a predefined threshold, then both documents are considered to be coreferentand clustered together. Otherwise, a new cluster is created for the document. At eachstep, a new document is compared to all existing clusters and then is subsequentlymerged into the cluster with the highest similarity if it is above the predefinedthreshold. The same process continues until all documents have been clustered.
Hierarchical Agglomerative Clustering (HAC), also called bottom-up hier-HierarchicalAgglomerative
Clusteringarchical clustering, is frequently employed in name disambiguation literature[MY03, GA04, WGLD05, BMI06]. In this algorithm the first step is to createone cluster for each document in the collection. Then, for each cluster the similarityto all other clusters is calculated. If the highest similarity computed is above apredefined threshold, the two clusters are merged together (agglomerated). If anymerging was performed during the last iteration, the process keeps looking for themost similar pairs and merging. The algorithm stops when no more merging is done(no pair of clusters has a similarity above the predefined threshold).
A HAC clustering can be visualised as a dendrogram. Each merge is represented
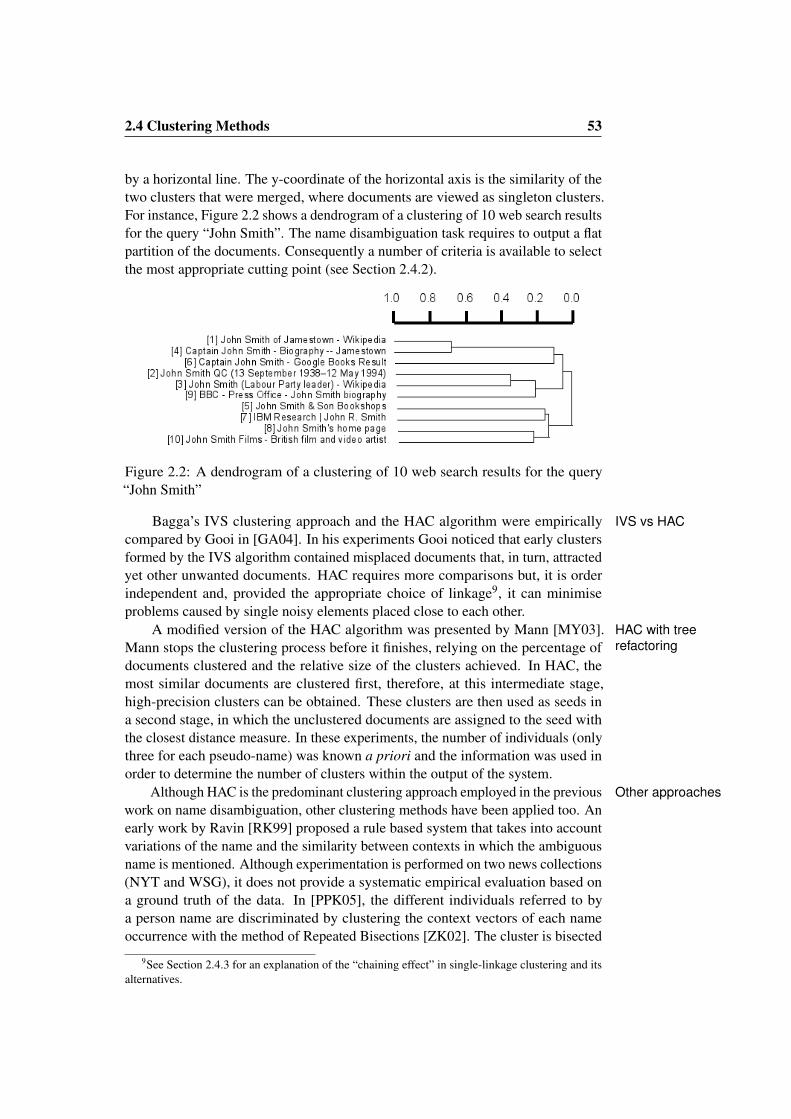
2.4 Clustering Methods 53
by a horizontal line. The y-coordinate of the horizontal axis is the similarity of thetwo clusters that were merged, where documents are viewed as singleton clusters.For instance, Figure 2.2 shows a dendrogram of a clustering of 10 web search resultsfor the query “John Smith”. The name disambiguation task requires to output a flatpartition of the documents. Consequently a number of criteria is available to selectthe most appropriate cutting point (see Section 2.4.2).
Figure 2.2: A dendrogram of a clustering of 10 web search results for the query“John Smith”
Bagga’s IVS clustering approach and the HAC algorithm were empirically IVS vs HACcompared by Gooi in [GA04]. In his experiments Gooi noticed that early clustersformed by the IVS algorithm contained misplaced documents that, in turn, attractedyet other unwanted documents. HAC requires more comparisons but, it is orderindependent and, provided the appropriate choice of linkage9, it can minimiseproblems caused by single noisy elements placed close to each other.
A modified version of the HAC algorithm was presented by Mann [MY03]. HAC with treerefactoringMann stops the clustering process before it finishes, relying on the percentage of
documents clustered and the relative size of the clusters achieved. In HAC, themost similar documents are clustered first, therefore, at this intermediate stage,high-precision clusters can be obtained. These clusters are then used as seeds ina second stage, in which the unclustered documents are assigned to the seed withthe closest distance measure. In these experiments, the number of individuals (onlythree for each pseudo-name) was known a priori and the information was used inorder to determine the number of clusters within the output of the system.
Although HAC is the predominant clustering approach employed in the previous Other approacheswork on name disambiguation, other clustering methods have been applied too. Anearly work by Ravin [RK99] proposed a rule based system that takes into accountvariations of the name and the similarity between contexts in which the ambiguousname is mentioned. Although experimentation is performed on two news collections(NYT and WSG), it does not provide a systematic empirical evaluation based ona ground truth of the data. In [PPK05], the different individuals referred to bya person name are discriminated by clustering the context vectors of each nameoccurrence with the method of Repeated Bisections [ZK02]. The cluster is bisected
9See Section 2.4.3 for an explanation of the “chaining effect” in single-linkage clustering and itsalternatives.
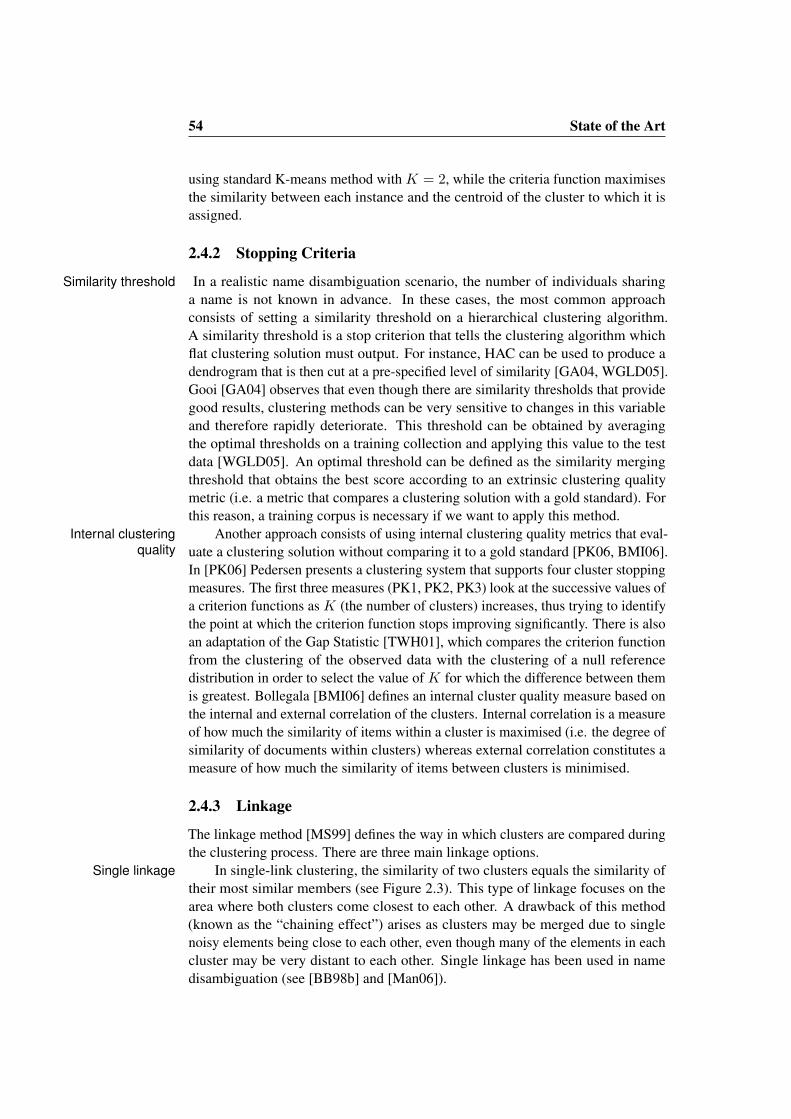
54 State of the Art
using standard K-means method with K = 2, while the criteria function maximisesthe similarity between each instance and the centroid of the cluster to which it isassigned.
2.4.2 Stopping Criteria
In a realistic name disambiguation scenario, the number of individuals sharingSimilarity thresholda name is not known in advance. In these cases, the most common approachconsists of setting a similarity threshold on a hierarchical clustering algorithm.A similarity threshold is a stop criterion that tells the clustering algorithm whichflat clustering solution must output. For instance, HAC can be used to produce adendrogram that is then cut at a pre-specified level of similarity [GA04, WGLD05].Gooi [GA04] observes that even though there are similarity thresholds that providegood results, clustering methods can be very sensitive to changes in this variableand therefore rapidly deteriorate. This threshold can be obtained by averagingthe optimal thresholds on a training collection and applying this value to the testdata [WGLD05]. An optimal threshold can be defined as the similarity mergingthreshold that obtains the best score according to an extrinsic clustering qualitymetric (i.e. a metric that compares a clustering solution with a gold standard). Forthis reason, a training corpus is necessary if we want to apply this method.
Another approach consists of using internal clustering quality metrics that eval-Internal clusteringquality uate a clustering solution without comparing it to a gold standard [PK06, BMI06].
In [PK06] Pedersen presents a clustering system that supports four cluster stoppingmeasures. The first three measures (PK1, PK2, PK3) look at the successive values ofa criterion functions as K (the number of clusters) increases, thus trying to identifythe point at which the criterion function stops improving significantly. There is alsoan adaptation of the Gap Statistic [TWH01], which compares the criterion functionfrom the clustering of the observed data with the clustering of a null referencedistribution in order to select the value of K for which the difference between themis greatest. Bollegala [BMI06] defines an internal cluster quality measure based onthe internal and external correlation of the clusters. Internal correlation is a measureof how much the similarity of items within a cluster is maximised (i.e. the degree ofsimilarity of documents within clusters) whereas external correlation constitutes ameasure of how much the similarity of items between clusters is minimised.
2.4.3 Linkage
The linkage method [MS99] defines the way in which clusters are compared duringthe clustering process. There are three main linkage options.
In single-link clustering, the similarity of two clusters equals the similarity ofSingle linkagetheir most similar members (see Figure 2.3). This type of linkage focuses on thearea where both clusters come closest to each other. A drawback of this method(known as the “chaining effect”) arises as clusters may be merged due to singlenoisy elements being close to each other, even though many of the elements in eachcluster may be very distant to each other. Single linkage has been used in namedisambiguation (see [BB98b] and [Man06]).
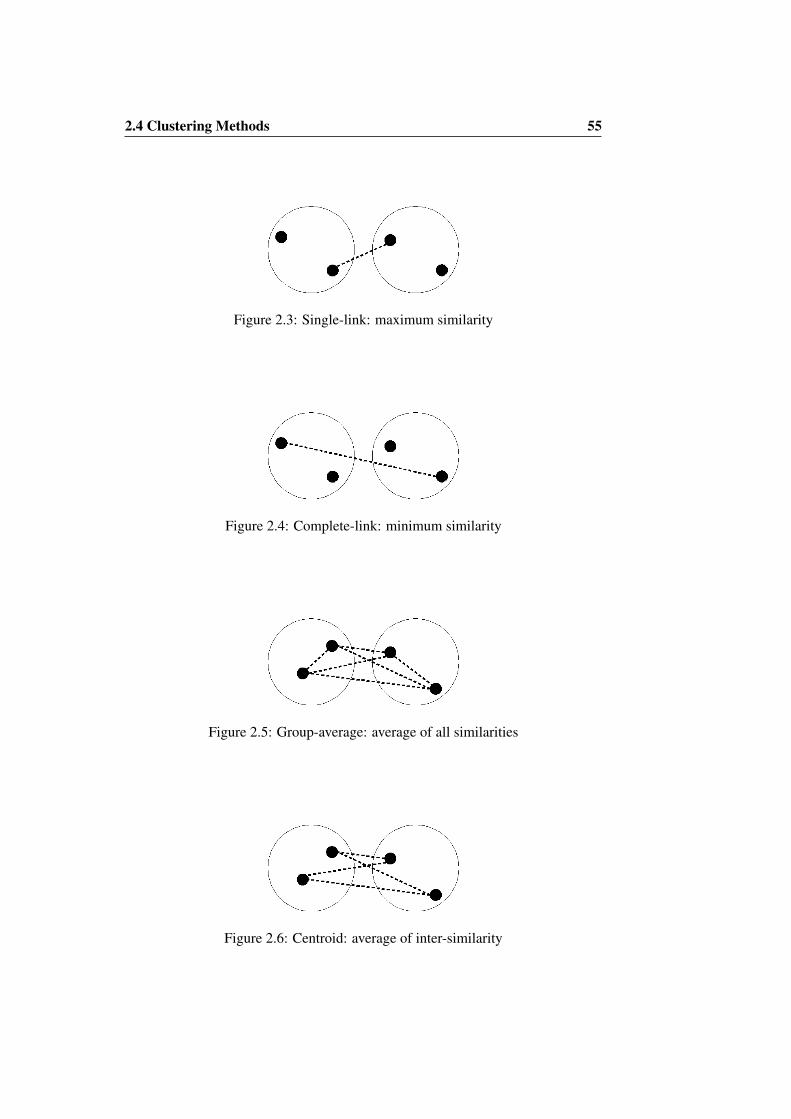
2.4 Clustering Methods 55
Figure 2.3: Single-link: maximum similarity
Figure 2.4: Complete-link: minimum similarity
Figure 2.5: Group-average: average of all similarities
Figure 2.6: Centroid: average of inter-similarity
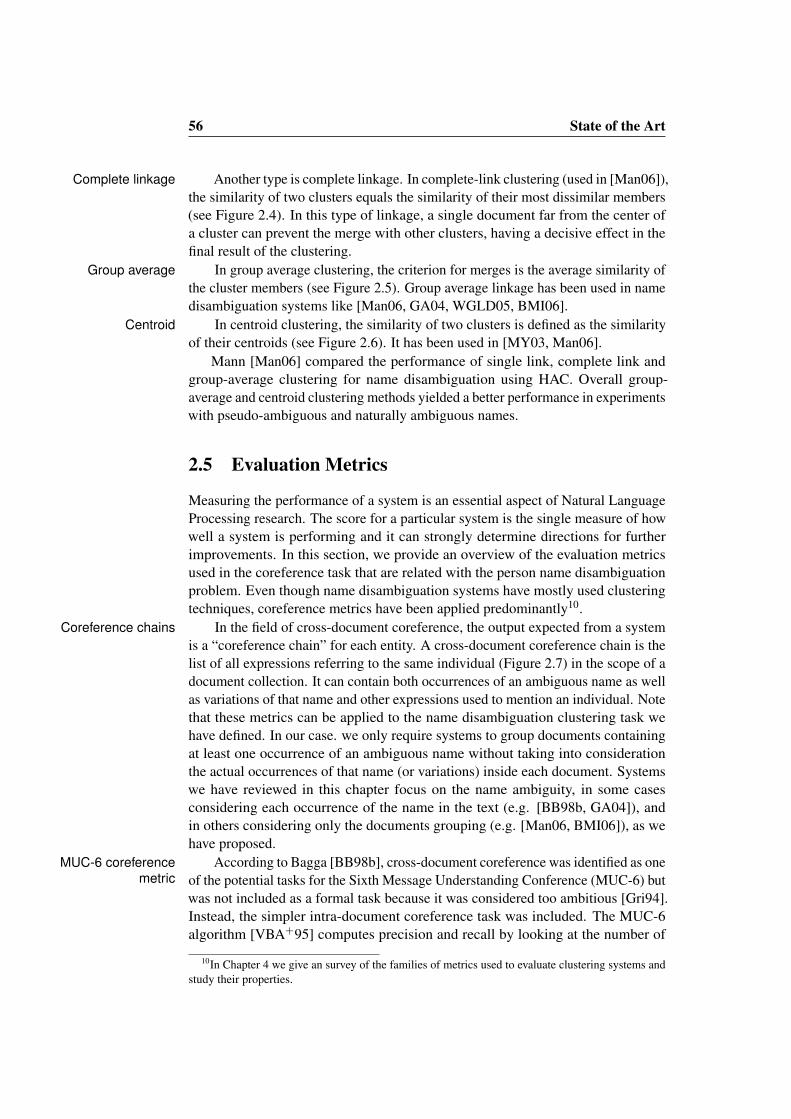
56 State of the Art
Another type is complete linkage. In complete-link clustering (used in [Man06]),Complete linkagethe similarity of two clusters equals the similarity of their most dissimilar members(see Figure 2.4). In this type of linkage, a single document far from the center ofa cluster can prevent the merge with other clusters, having a decisive effect in thefinal result of the clustering.
In group average clustering, the criterion for merges is the average similarity ofGroup averagethe cluster members (see Figure 2.5). Group average linkage has been used in namedisambiguation systems like [Man06, GA04, WGLD05, BMI06].
In centroid clustering, the similarity of two clusters is defined as the similarityCentroidof their centroids (see Figure 2.6). It has been used in [MY03, Man06].
Mann [Man06] compared the performance of single link, complete link andgroup-average clustering for name disambiguation using HAC. Overall group-average and centroid clustering methods yielded a better performance in experimentswith pseudo-ambiguous and naturally ambiguous names.
2.5 Evaluation Metrics
Measuring the performance of a system is an essential aspect of Natural LanguageProcessing research. The score for a particular system is the single measure of howwell a system is performing and it can strongly determine directions for furtherimprovements. In this section, we provide an overview of the evaluation metricsused in the coreference task that are related with the person name disambiguationproblem. Even though name disambiguation systems have mostly used clusteringtechniques, coreference metrics have been applied predominantly10.
In the field of cross-document coreference, the output expected from a systemCoreference chainsis a “coreference chain” for each entity. A cross-document coreference chain is thelist of all expressions referring to the same individual (Figure 2.7) in the scope of adocument collection. It can contain both occurrences of an ambiguous name as wellas variations of that name and other expressions used to mention an individual. Notethat these metrics can be applied to the name disambiguation clustering task wehave defined. In our case. we only require systems to group documents containingat least one occurrence of an ambiguous name without taking into considerationthe actual occurrences of that name (or variations) inside each document. Systemswe have reviewed in this chapter focus on the name ambiguity, in some casesconsidering each occurrence of the name in the text (e.g. [BB98b, GA04]), andin others considering only the documents grouping (e.g. [Man06, BMI06]), as wehave proposed.
According to Bagga [BB98b], cross-document coreference was identified as oneMUC-6 coreferencemetric of the potential tasks for the Sixth Message Understanding Conference (MUC-6) but
was not included as a formal task because it was considered too ambitious [Gri94].Instead, the simpler intra-document coreference task was included. The MUC-6algorithm [VBA+95] computes precision and recall by looking at the number of
10In Chapter 4 we give an survey of the families of metrics used to evaluate clustering systems andstudy their properties.
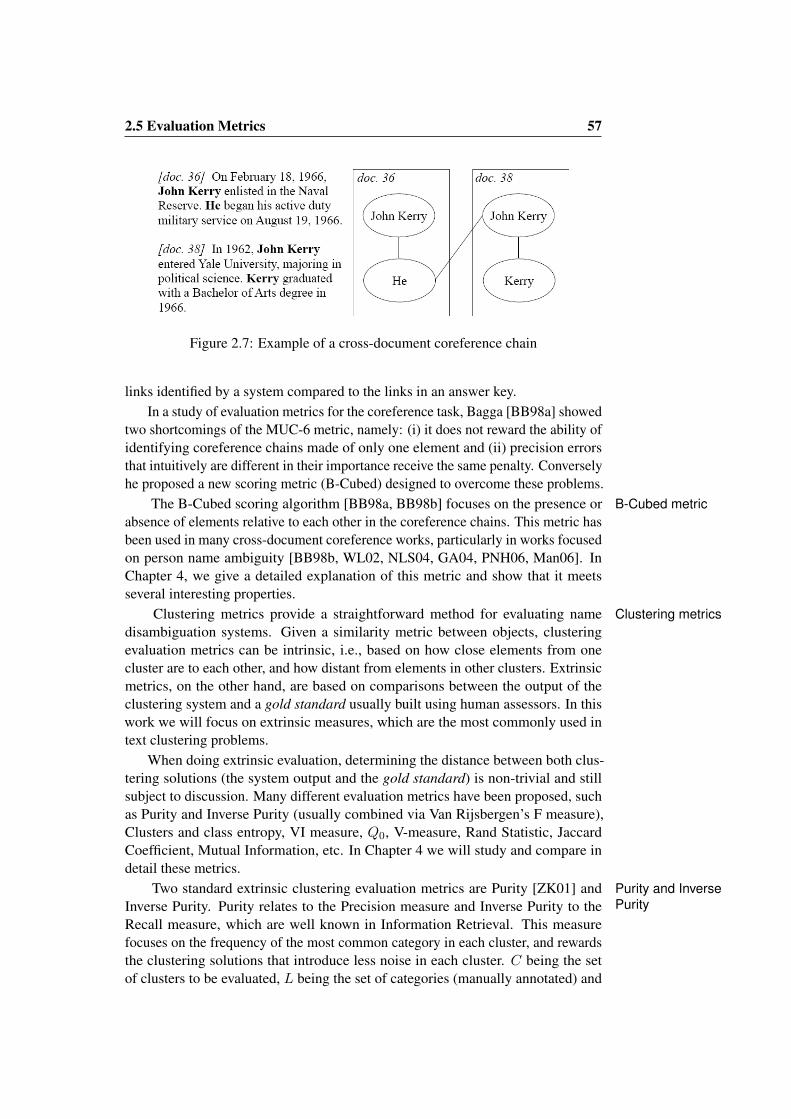
2.5 Evaluation Metrics 57
Figure 2.7: Example of a cross-document coreference chain
links identified by a system compared to the links in an answer key.In a study of evaluation metrics for the coreference task, Bagga [BB98a] showed
two shortcomings of the MUC-6 metric, namely: (i) it does not reward the ability ofidentifying coreference chains made of only one element and (ii) precision errorsthat intuitively are different in their importance receive the same penalty. Converselyhe proposed a new scoring metric (B-Cubed) designed to overcome these problems.
The B-Cubed scoring algorithm [BB98a, BB98b] focuses on the presence or B-Cubed metricabsence of elements relative to each other in the coreference chains. This metric hasbeen used in many cross-document coreference works, particularly in works focusedon person name ambiguity [BB98b, WL02, NLS04, GA04, PNH06, Man06]. InChapter 4, we give a detailed explanation of this metric and show that it meetsseveral interesting properties.
Clustering metrics provide a straightforward method for evaluating name Clustering metricsdisambiguation systems. Given a similarity metric between objects, clusteringevaluation metrics can be intrinsic, i.e., based on how close elements from onecluster are to each other, and how distant from elements in other clusters. Extrinsicmetrics, on the other hand, are based on comparisons between the output of theclustering system and a gold standard usually built using human assessors. In thiswork we will focus on extrinsic measures, which are the most commonly used intext clustering problems.
When doing extrinsic evaluation, determining the distance between both clus-tering solutions (the system output and the gold standard) is non-trivial and stillsubject to discussion. Many different evaluation metrics have been proposed, suchas Purity and Inverse Purity (usually combined via Van Rijsbergen’s F measure),Clusters and class entropy, VI measure, Q0, V-measure, Rand Statistic, JaccardCoefficient, Mutual Information, etc. In Chapter 4 we will study and compare indetail these metrics.
Two standard extrinsic clustering evaluation metrics are Purity [ZK01] and Purity and InversePurityInverse Purity. Purity relates to the Precision measure and Inverse Purity to the
Recall measure, which are well known in Information Retrieval. This measurefocuses on the frequency of the most common category in each cluster, and rewardsthe clustering solutions that introduce less noise in each cluster. C being the setof clusters to be evaluated, L being the set of categories (manually annotated) and
58 State of the Art
n the number of clustered elements, Purity is computed by taking the weightedaverage of maximal precision values:
Purity =∑i
|Ci|n
max Precision(Ci, Lj)
where the precision of a cluster Ci for a given category Lj is defined as:
Precision(Ci, Lj) =|Ci
⋂Lj |
|Ci|Inverse Purity focuses on the cluster with maximum recall for each category,
rewarding the clustering solutions that gather more elements of each category in acorresponding single cluster. Inverse Purity is defined as:
Inverse Purity =∑i
|Li|n
max Precision(Li, Cj)
Works on name disambiguation [PPK05, AKE04] are closer to our task def-inition and evaluation methodology because they evaluate their disambiguationapproach using extrinsic clustering metrics. In [PPK05] precision and recall of aclustering were evaluated using a matching metric. Al-Kamha [AKE04] used splitand merge measures, which belong to the family of edit distance clustering metrics.
Other types of evaluation have been used for the evaluation of particular researchapproaches. Some works base their evaluation in classification results rather thancoreference chains [FH04, MY03]. Fleischman [FH04] trained a classifier to decidewether a pair of contexts mentioning and ambiguous name are coreferent or not.The results are expressed in terms of the percentage of correct predictions made bythe classifier (classification accuracy). Mann [MY03] used accuracy to measure theperformance over two-class pseudo-ambiguous names.
As we have shown, there are many options to evaluate clustering algorithms,each one with different properties, and it is unclear which is the optimal metric forour problem. We will come back and solve this issue in Chapter 4

Part II
Benchmarking

Chapter 3
The WePS-1 Campaign
Developing of an evaluation framework that both provides the elements for ameaningful comparison of different approaches to the task and brings together thedifferent research groups working on the problem constitutes a crucial element ofthis thesis. In this chapter, we will describe the first Web People Search evaluationcampaign that was organised as part of the SemEval-1 evaluation exercise1. 16teams presented their systems and were evaluated using standard clustering qualitymetrics and a common test collection. This pilot experience confirmed the interestof the research community in the Web People Search problem. It also showed usthe difficulties of building a reliable testbed and the need for further research inevaluation metrics for the task.
This chapter is organized as follows: Section 3.1 presents a preliminary testbedtogether with the lessons we drew from it. Section 3.2 provides a description ofthe training and test data provided to the participants. Section 3.3 presents theevaluation measures and baseline approaches used in this campaign. The campaigndesign is briefly presented in Section 3.4. Section 3.5 gives a description of theparticipant systems and provides the evaluation results. Finally, Section 3.6 presentssome conclusions.
3.1 Preliminary Testbed
For this evaluation campaign we initially delivered a preliminary testbed that was Testbed componentsused as trial data set for the potential participants. The goal pursued during thedevelopment of this collection was to improve our overall understanding of themain characteristics of the problem in order to refine the annotation methodology2.The trial data consisted of (i) a corpus of web pages retrieved using people namesas queries to web search engines; (ii) a classification of pages according to all thedifferent people (with the same name) they refer to; (iii) manual annotations of
1SemEval-1 took place in 2007, followed by a workshop held in conjunction with ACL in Prague.SemEval-1 included 18 different tasks targeting the evaluation of systems for the semantic analysis oftext (http://www.senseval.org/).
2This collection was also used to carry a first study of baseline approaches [AGV05], comparingfull text and snippet document representations.

62 The WePS-1 Campaign
relevant information – found in the web pages – describing them (e-mail, image,profession, phone number, etc.); (iv) the results of applying a general purpose clus-tering algorithm to that annotated data, which serve as a baseline for the ambiguityresolution problem.
category instances per name per personhome page 28 2.8 0.06part of h.p. 15 1.5 0.03reference p. 412 41.2 1other 532 53.2 1.2tags instances per name per personname 5,374 537.4 11.60job 2,105 210.5 4.55author of 1,823 182.3 3.94description 438 43.8 0.95date birth 387 38.7 0.84date death 256 25.6 0.55image 232 23.2 0.50place birth 386 38.6 0.83email 282 28.2 0.61location 185 18.5 0.40phone num 136 13.6 0.29address 86 8.6 0.19place death 85 8.5 0.18fax num 37 3.7 0.08Total 11,812 1,181.2 25.51
Table 3.1: WePS-1 preliminary testbed: annotation statistics
The creation of this test collection consisted of the following steps:Testbed creation
1. Generating ten English people names, using random combinations of themost frequent first and last names in the 1990 U.S. Census
2. Collecting the first 100 web pages retrieved by the Google search engine forevery (quoted) person name.
3. Grouping documents according to the person they refer to, for every personname.
4. Classifying every web document in the collection as a (i) homepage entry (ii)part of a homepage (iii) reference page (exclusively containing informationabout the person) and (iv) other.
5. Annotating all the occurrences of certain types of descriptive information:name, job, person image, date of birth/death, place of birth/death, emailaddress, postal address, fax/phone number, location (where the person livesin), author of (e.g. books, paintings, patents...) and description (a briefdefinition of the person).
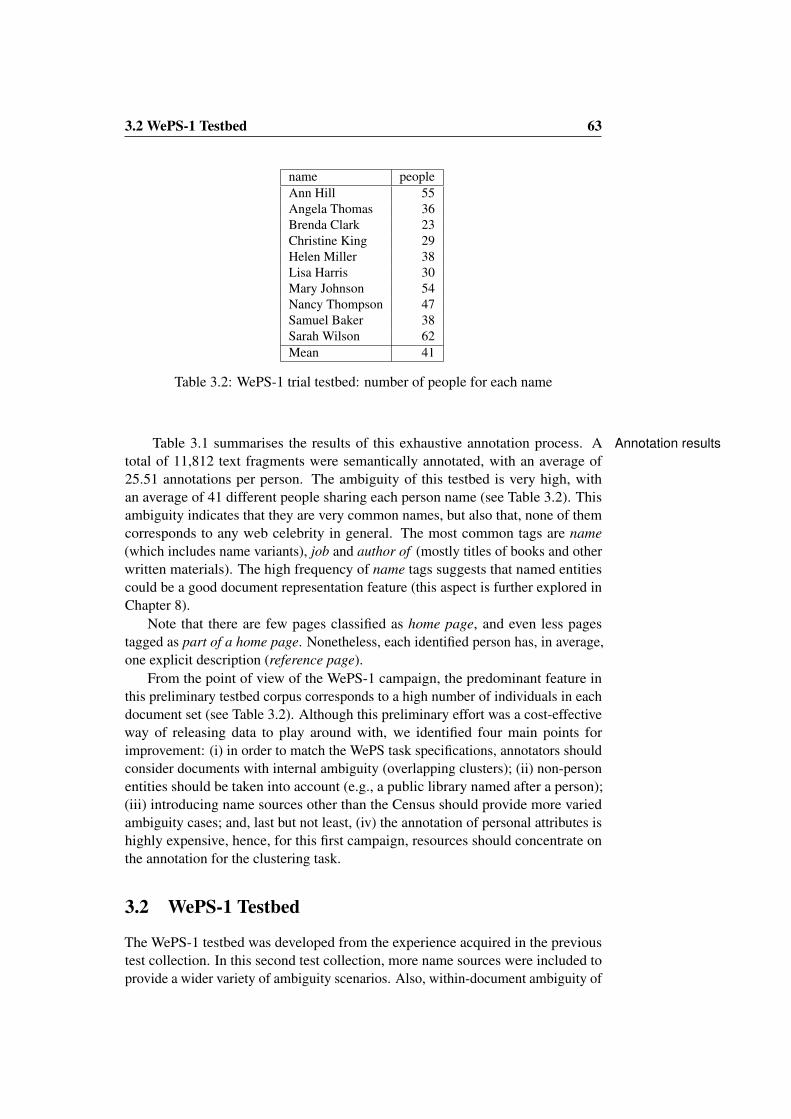
3.2 WePS-1 Testbed 63
name peopleAnn Hill 55Angela Thomas 36Brenda Clark 23Christine King 29Helen Miller 38Lisa Harris 30Mary Johnson 54Nancy Thompson 47Samuel Baker 38Sarah Wilson 62Mean 41
Table 3.2: WePS-1 trial testbed: number of people for each name
Table 3.1 summarises the results of this exhaustive annotation process. A Annotation resultstotal of 11,812 text fragments were semantically annotated, with an average of25.51 annotations per person. The ambiguity of this testbed is very high, withan average of 41 different people sharing each person name (see Table 3.2). Thisambiguity indicates that they are very common names, but also that, none of themcorresponds to any web celebrity in general. The most common tags are name(which includes name variants), job and author of (mostly titles of books and otherwritten materials). The high frequency of name tags suggests that named entitiescould be a good document representation feature (this aspect is further explored inChapter 8).
Note that there are few pages classified as home page, and even less pagestagged as part of a home page. Nonetheless, each identified person has, in average,one explicit description (reference page).
From the point of view of the WePS-1 campaign, the predominant feature inthis preliminary testbed corpus corresponds to a high number of individuals in eachdocument set (see Table 3.2). Although this preliminary effort was a cost-effectiveway of releasing data to play around with, we identified four main points forimprovement: (i) in order to match the WePS task specifications, annotators shouldconsider documents with internal ambiguity (overlapping clusters); (ii) non-personentities should be taken into account (e.g., a public library named after a person);(iii) introducing name sources other than the Census should provide more variedambiguity cases; and, last but not least, (iv) the annotation of personal attributes ishighly expensive, hence, for this first campaign, resources should concentrate onthe annotation for the clustering task.
3.2 WePS-1 Testbed
The WePS-1 testbed was developed from the experience acquired in the previoustest collection. In this second test collection, more name sources were included toprovide a wider variety of ambiguity scenarios. Also, within-document ambiguity of
64 The WePS-1 Campaign
names was taken into account during the annotation process (see Section 3.2.3). Forthe WePS-1 testbed, we decided to favour the manual clustering of a larger amountof names, instead of including page types and personal information extracted frompages as we did in the preliminary collection. The testbed was developed in twostages: first a test collection was prepared and handed over to the participants sothat they could develop their systems (training data). Then, a different collectionwas annotated to evaluate each system (test data).
3.2.1 Training Data
During the process of generating the corpus, the selection of the names playsName selectionan important role, which potentially conditions the degree of ambiguity that willbe found later in the web search results. The reasons for this variability in theambiguity of names are diverse and do not always correlate with the straightforwardcensus frequency. A much more decisive feature is, for instance, the presence offamous entities sharing the ambiguous name with less popular people. As we areconsidering top search results, these can easily be monopolised by a single popularentity in the Internet.
In order to provide different ambiguity scenarios, we selected person namesfrom different sources:
US Census. We reused the Web03 corpus [Man06], which contains 32 namesrandomly picked from the US Census, and proved to be well suited for the task.
Wikipedia. Another seven names were sampled from a list of ambiguouspeople names in the English version of Wikipedia. These were expected to havea few predominant entities (popular or historical), and, therefore, a lower level ofambiguity than the previous set.
ECDL. Finally, ten additional names were randomly selected from the ProgramCommittee listing of a Computer Science conference (ECDL 2006). This set offersa potentially low ambiguity scenario (computer science scholars usually have astronger Internet presence than other professional fields) together with the addedvalue of the a priori knowledge of a domain-specific type of entity (scholar) presentin the data.
All datasets consist of collections of web pages obtained from the 100 topRetrieval processresults for a person name query to an Internet search engine3. Note that 100 is anupper bound, since the URL returned by the search engine in some occasions nolonger exists. Datasets consist of 17 people names and 1685 associated documentsin total, that is, 99 documents per name in average. Each web page was downloadedand stored for offline processing. We also stored the basic metadata associated toeach search result, including the original URL, title, position in the results rankingand its corresponding snippet generated by the search engine.
After the annotation of this data (see Section 3.2.3), we found our predictionsAmbiguityabout the average ambiguity of each dataset were not completely accurate. InTable 3.3, we see that the ECDL-06 average ambiguity is indeed relatively low,except for the documents for “Thomas Baker”, standing as the most ambiguous name
3We used the Yahoo! Search Web Services API (http://developer.yahoo.com/search/web/).
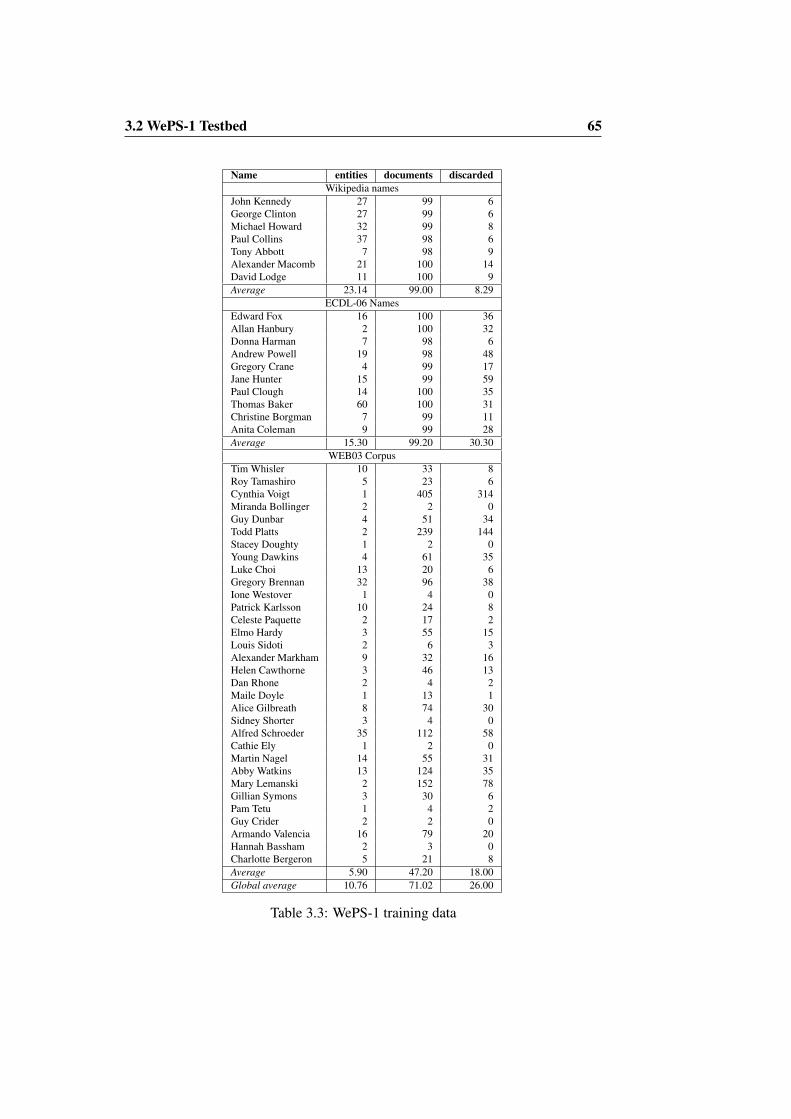
3.2 WePS-1 Testbed 65
Name entities documents discardedWikipedia names
John Kennedy 27 99 6George Clinton 27 99 6Michael Howard 32 99 8Paul Collins 37 98 6Tony Abbott 7 98 9Alexander Macomb 21 100 14David Lodge 11 100 9Average 23.14 99.00 8.29
ECDL-06 NamesEdward Fox 16 100 36Allan Hanbury 2 100 32Donna Harman 7 98 6Andrew Powell 19 98 48Gregory Crane 4 99 17Jane Hunter 15 99 59Paul Clough 14 100 35Thomas Baker 60 100 31Christine Borgman 7 99 11Anita Coleman 9 99 28Average 15.30 99.20 30.30
WEB03 CorpusTim Whisler 10 33 8Roy Tamashiro 5 23 6Cynthia Voigt 1 405 314Miranda Bollinger 2 2 0Guy Dunbar 4 51 34Todd Platts 2 239 144Stacey Doughty 1 2 0Young Dawkins 4 61 35Luke Choi 13 20 6Gregory Brennan 32 96 38Ione Westover 1 4 0Patrick Karlsson 10 24 8Celeste Paquette 2 17 2Elmo Hardy 3 55 15Louis Sidoti 2 6 3Alexander Markham 9 32 16Helen Cawthorne 3 46 13Dan Rhone 2 4 2Maile Doyle 1 13 1Alice Gilbreath 8 74 30Sidney Shorter 3 4 0Alfred Schroeder 35 112 58Cathie Ely 1 2 0Martin Nagel 14 55 31Abby Watkins 13 124 35Mary Lemanski 2 152 78Gillian Symons 3 30 6Pam Tetu 1 4 2Guy Crider 2 2 0Armando Valencia 16 79 20Hannah Bassham 2 3 0Charlotte Bergeron 5 21 8Average 5.90 47.20 18.00Global average 10.76 71.02 26.00
Table 3.3: WePS-1 training data
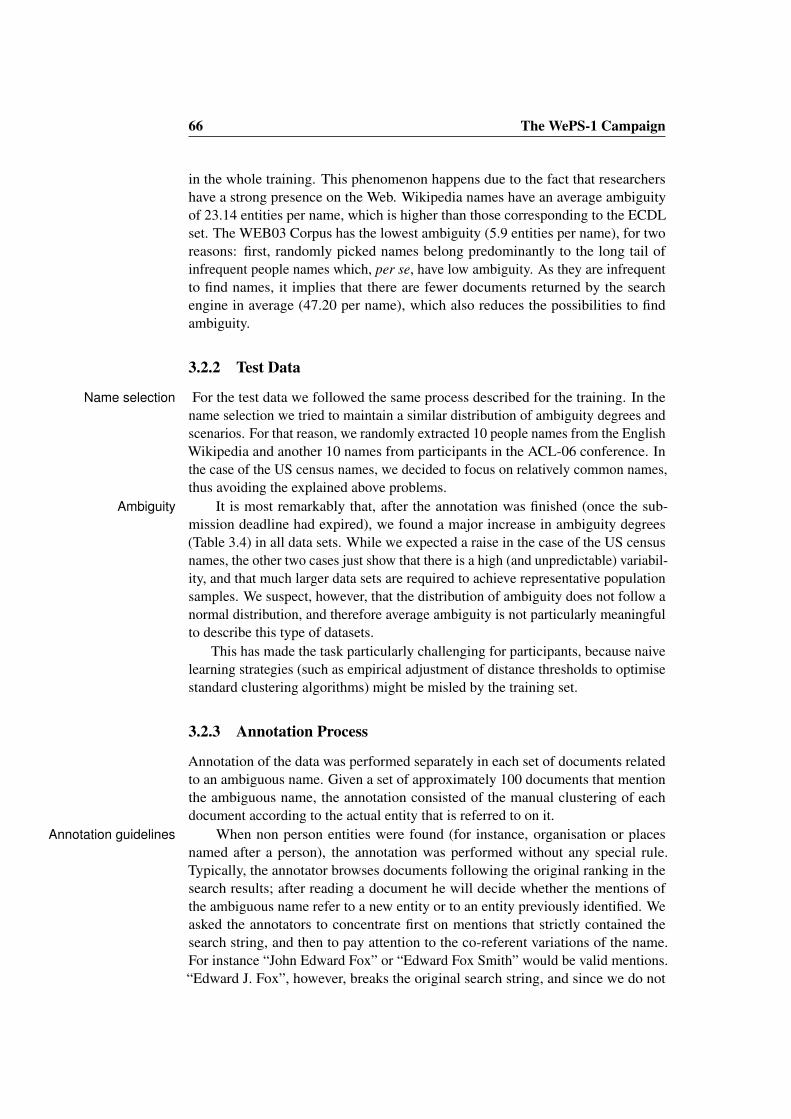
66 The WePS-1 Campaign
in the whole training. This phenomenon happens due to the fact that researchershave a strong presence on the Web. Wikipedia names have an average ambiguityof 23.14 entities per name, which is higher than those corresponding to the ECDLset. The WEB03 Corpus has the lowest ambiguity (5.9 entities per name), for tworeasons: first, randomly picked names belong predominantly to the long tail ofinfrequent people names which, per se, have low ambiguity. As they are infrequentto find names, it implies that there are fewer documents returned by the searchengine in average (47.20 per name), which also reduces the possibilities to findambiguity.
3.2.2 Test Data
For the test data we followed the same process described for the training. In theName selectionname selection we tried to maintain a similar distribution of ambiguity degrees andscenarios. For that reason, we randomly extracted 10 people names from the EnglishWikipedia and another 10 names from participants in the ACL-06 conference. Inthe case of the US census names, we decided to focus on relatively common names,thus avoiding the explained above problems.
It is most remarkably that, after the annotation was finished (once the sub-Ambiguitymission deadline had expired), we found a major increase in ambiguity degrees(Table 3.4) in all data sets. While we expected a raise in the case of the US censusnames, the other two cases just show that there is a high (and unpredictable) variabil-ity, and that much larger data sets are required to achieve representative populationsamples. We suspect, however, that the distribution of ambiguity does not follow anormal distribution, and therefore average ambiguity is not particularly meaningfulto describe this type of datasets.
This has made the task particularly challenging for participants, because naivelearning strategies (such as empirical adjustment of distance thresholds to optimisestandard clustering algorithms) might be misled by the training set.
3.2.3 Annotation Process
Annotation of the data was performed separately in each set of documents relatedto an ambiguous name. Given a set of approximately 100 documents that mentionthe ambiguous name, the annotation consisted of the manual clustering of eachdocument according to the actual entity that is referred to on it.
When non person entities were found (for instance, organisation or placesAnnotation guidelinesnamed after a person), the annotation was performed without any special rule.Typically, the annotator browses documents following the original ranking in thesearch results; after reading a document he will decide whether the mentions ofthe ambiguous name refer to a new entity or to an entity previously identified. Weasked the annotators to concentrate first on mentions that strictly contained thesearch string, and then to pay attention to the co-referent variations of the name.For instance “John Edward Fox” or “Edward Fox Smith” would be valid mentions.“Edward J. Fox”, however, breaks the original search string, and since we do not
3.2 WePS-1 Testbed 67
Name entities documents discardedWikipedia names
Arthur Morgan 19 100 52James Morehead 48 100 11James Davidson 59 98 16Patrick Killen 25 96 4William Dickson 91 100 8George Foster 42 99 11James Hamilton 81 100 15John Nelson 55 100 25Thomas Fraser 73 100 13Thomas Kirk 72 100 20Average 56.50 99.30 17.50
ACL06 NamesDekang Lin 1 99 0Chris Brockett 19 98 5James Curran 63 99 9Mark Johnson 70 99 7Jerry Hobbs 15 99 7Frank Keller 28 100 20Leon Barrett 33 98 9Robert Moore 38 98 28Sharon Goldwater 2 97 4Stephen Clark 41 97 39Average 31.00 98.40 12.80
US Census NamesAlvin Cooper 43 99 9Harry Hughes 39 98 9Jonathan Brooks 83 97 8Jude Brown 32 100 39Karen Peterson 64 100 16Marcy Jackson 51 100 5Martha Edwards 82 100 9Neil Clark 21 99 7Stephan Johnson 36 100 20Violet Howard 52 98 27Average 50.30 99.10 14.90Global average 45.93 98.93 15.07
Table 3.4: WePS-1 test data
consider name variation detection, it will only be considered valid if it is co-referentto a valid mention. In order to perform the clustering, the annotator was asked topay attention to objective data (biographical dates, related names, occupations, etc.)as well as to be conservative when making decisions.
The final result is a complete clustering of the documents, where each cluster Ambiguitycontains the documents that refer to a particular entity. Following the previousexample, when dealing with documents mentioning the name “Edward Fox” theannotator found 16 different entities bearing that name. Note that there is no a prioriknowledge about the number of entities to be discovered in a document set. Thismakes the annotation task specially difficult when there are many different entitiesand a high volume of scattered biographical information to be taken into account.
In cases where the document does not offer enough information to decide Documents filteringwhether it belongs to a cluster or if it is a new entity, the document is discardedfrom the evaluation process (but not from the dataset). Another common reason for
68 The WePS-1 Campaign
discarding documents was the absence of the person name in the document, usuallydue to a mismatch between the search engine cache and the downloaded URL.
Following this method, we found that, in many cases, different entities wereOverlapping clustersmentioned using the ambiguous name within a single document. This circumstanceproduces overlapped clusters where one document is associated to several individu-als at the same time. This was the case when a document mentions relatives withnames that contain the ambiguous string (for instance “Edward Fox” and “EdwardFox Jr.”). Another common case of within-document ambiguity is that of pagescontaining database search results, such as book lists from Amazon, actors fromIMDB, etc. A similar case occurs in pages that explicitly analyse the ambiguity ofa person name (Wikipedia “disambiguation” pages). Also, large genealogy pagesturned out to be a frequent and very difficult case. In these documents, a largenumber of individuals can be referred with the same name and with very sparseinformation to assess them. The way this situation was handled – in terms of theannotation – was to assign each document to as many clusters as entities werereferred to in it with the ambiguous name.
After the campaign was finished, a second gold standard of test data was com-Inter-annotatoragreement pleted by a different annotator. In order to check the consistency of the annotators
assesments, we compared the results evaluating the systems output with both goldstandards. The results showed no significant differences in the ranking of systems.
3.3 Evaluation Methodology
Evaluation was performed in each document set (web pages mentioning an ambigu-ous person name) of the data distributed as test. The human annotation was used asthe gold standard for the evaluation.
Each system was evaluated using the standard Purity and Inverse Purity clus-Metrics combinationtering measures (see Section 2.5). For the final ranking of systems we used theharmonic mean of Purity and Inverse Purity Fα=0.5 . The F measure [Rij74] isdefined as follows:
F =1
α 1Purity + (1− α) 1
Inverse Purity
Fα=0.2 is included as an additional measure giving more relevance to the InversePurity aspect. The rationale is that, for a search engine user, it should be easierto discard a few incorrect web pages in a cluster containing all the informationneeded than having to collect the relevant information across many different clusters.Therefore, achieving a high Inverse Purity should be rewarded more than havinghigh Purity.
Two simple baseline approaches were applied to the test data (Figure 3.1). TheBaselinesALL-IN-ONE baseline provides a clustering solution where all the documents areassigned to a single cluster. This has the effect of always achieving the highest scorein the Inverse Purity measure, because all classes have their documents in a singlecluster. On the other hand, the Purity measure will be equal to the precision of the
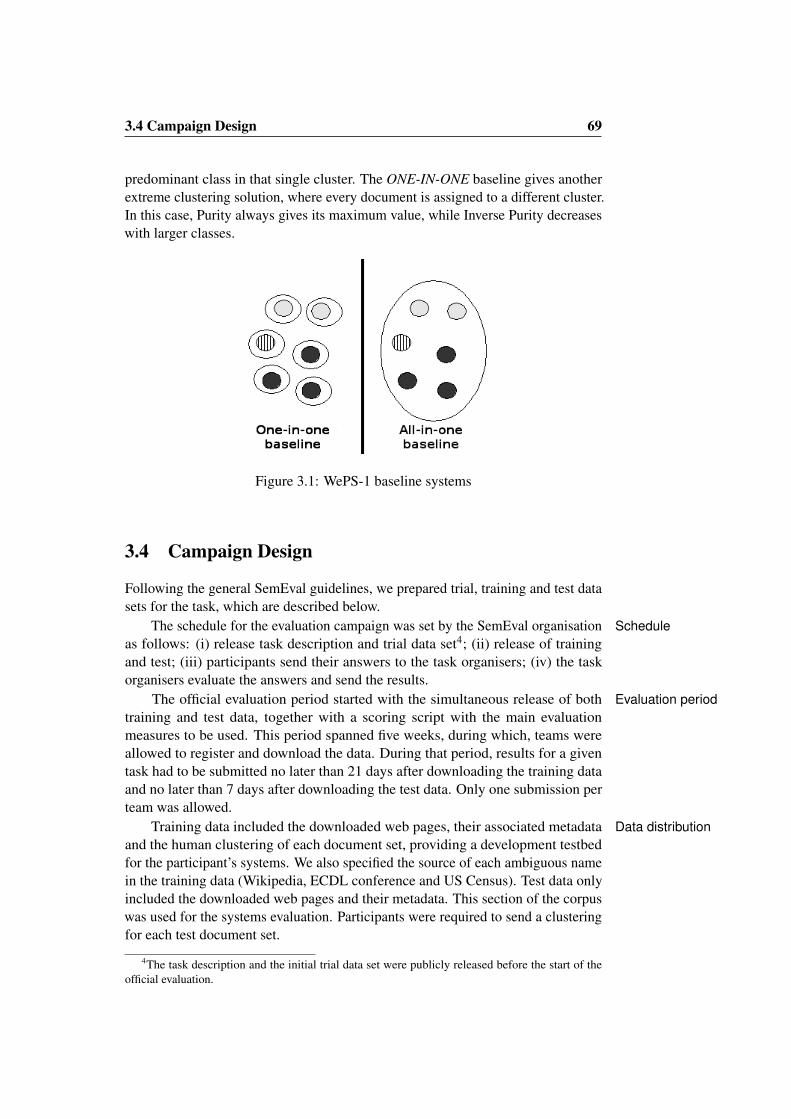
3.4 Campaign Design 69
predominant class in that single cluster. The ONE-IN-ONE baseline gives anotherextreme clustering solution, where every document is assigned to a different cluster.In this case, Purity always gives its maximum value, while Inverse Purity decreaseswith larger classes.
Figure 3.1: WePS-1 baseline systems
3.4 Campaign Design
Following the general SemEval guidelines, we prepared trial, training and test datasets for the task, which are described below.
The schedule for the evaluation campaign was set by the SemEval organisation Scheduleas follows: (i) release task description and trial data set4; (ii) release of trainingand test; (iii) participants send their answers to the task organisers; (iv) the taskorganisers evaluate the answers and send the results.
The official evaluation period started with the simultaneous release of both Evaluation periodtraining and test data, together with a scoring script with the main evaluationmeasures to be used. This period spanned five weeks, during which, teams wereallowed to register and download the data. During that period, results for a giventask had to be submitted no later than 21 days after downloading the training dataand no later than 7 days after downloading the test data. Only one submission perteam was allowed.
Training data included the downloaded web pages, their associated metadata Data distributionand the human clustering of each document set, providing a development testbedfor the participant’s systems. We also specified the source of each ambiguous namein the training data (Wikipedia, ECDL conference and US Census). Test data onlyincluded the downloaded web pages and their metadata. This section of the corpuswas used for the systems evaluation. Participants were required to send a clusteringfor each test document set.
4The task description and the initial trial data set were publicly released before the start of theofficial evaluation.
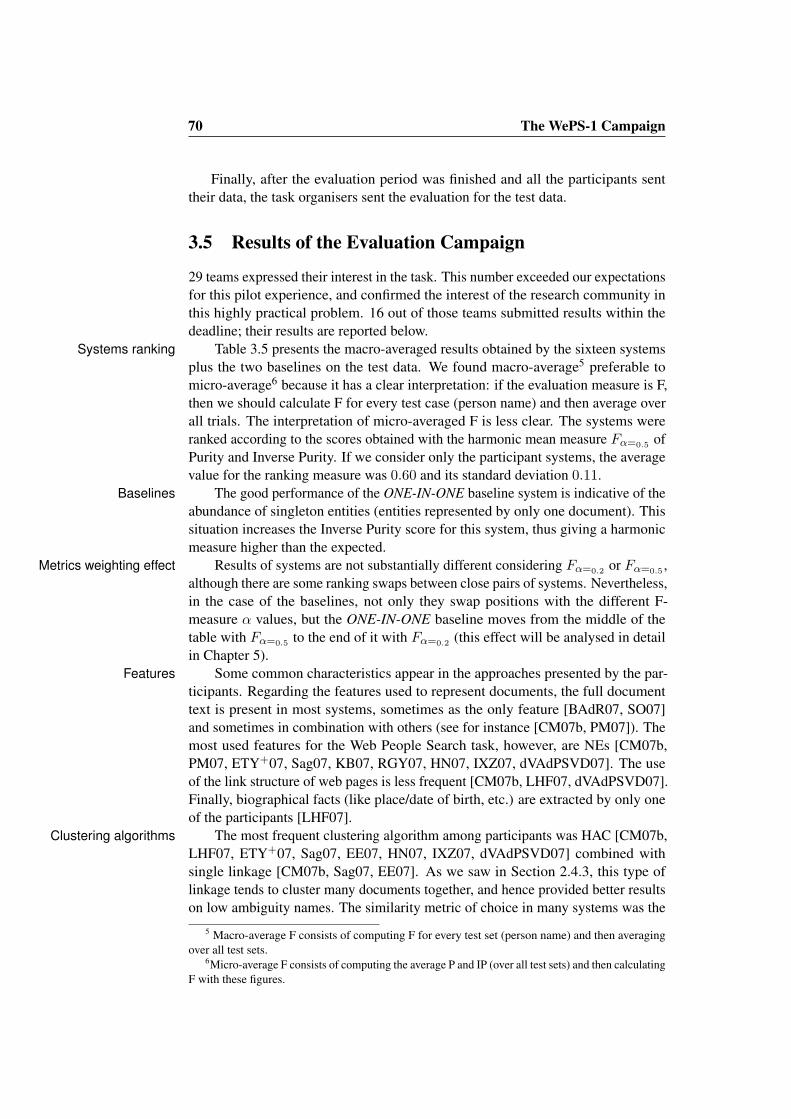
70 The WePS-1 Campaign
Finally, after the evaluation period was finished and all the participants senttheir data, the task organisers sent the evaluation for the test data.
3.5 Results of the Evaluation Campaign
29 teams expressed their interest in the task. This number exceeded our expectationsfor this pilot experience, and confirmed the interest of the research community inthis highly practical problem. 16 out of those teams submitted results within thedeadline; their results are reported below.
Table 3.5 presents the macro-averaged results obtained by the sixteen systemsSystems rankingplus the two baselines on the test data. We found macro-average5 preferable tomicro-average6 because it has a clear interpretation: if the evaluation measure is F,then we should calculate F for every test case (person name) and then average overall trials. The interpretation of micro-averaged F is less clear. The systems wereranked according to the scores obtained with the harmonic mean measure Fα=0.5 ofPurity and Inverse Purity. If we consider only the participant systems, the averagevalue for the ranking measure was 0.60 and its standard deviation 0.11.
The good performance of the ONE-IN-ONE baseline system is indicative of theBaselinesabundance of singleton entities (entities represented by only one document). Thissituation increases the Inverse Purity score for this system, thus giving a harmonicmeasure higher than the expected.
Results of systems are not substantially different considering Fα=0.2 or Fα=0.5 ,Metrics weighting effectalthough there are some ranking swaps between close pairs of systems. Nevertheless,in the case of the baselines, not only they swap positions with the different F-measure α values, but the ONE-IN-ONE baseline moves from the middle of thetable with Fα=0.5 to the end of it with Fα=0.2 (this effect will be analysed in detailin Chapter 5).
Some common characteristics appear in the approaches presented by the par-Featuresticipants. Regarding the features used to represent documents, the full documenttext is present in most systems, sometimes as the only feature [BAdR07, SO07]and sometimes in combination with others (see for instance [CM07b, PM07]). Themost used features for the Web People Search task, however, are NEs [CM07b,PM07, ETY+07, Sag07, KB07, RGY07, HN07, IXZ07, dVAdPSVD07]. The useof the link structure of web pages is less frequent [CM07b, LHF07, dVAdPSVD07].Finally, biographical facts (like place/date of birth, etc.) are extracted by only oneof the participants [LHF07].
The most frequent clustering algorithm among participants was HAC [CM07b,Clustering algorithmsLHF07, ETY+07, Sag07, EE07, HN07, IXZ07, dVAdPSVD07] combined withsingle linkage [CM07b, Sag07, EE07]. As we saw in Section 2.4.3, this type oflinkage tends to cluster many documents together, and hence provided better resultson low ambiguity names. The similarity metric of choice in many systems was the
5 Macro-average F consists of computing F for every test set (person name) and then averagingover all test sets.
6Micro-average F consists of computing the average P and IP (over all test sets) and then calculatingF with these figures.
3.6 Conclusions 71
cosine [ETY+07, Sag07, dVAdPSVD07]. Finally, regarding the clustering stoppingcriteria, most participants decided to train a value on the development datasets andapply it to the test data [CM07b, ETY+07, Sag07, RGY07, HN07]. Due to thedifferences in the amount of ambiguity found in training and test data, this strategyprobably penalised systems with less robust response to variations in the clusteringthreshold.
Macro-averaged ScoresF-measures
rank team-id α =.5 α =.2 Pur Inv Pur1 CU COMSEM .78 .83 .72 .882 IRST-BP .75 .77 .75 .803 PSNUS .75 .78 .73 .824 UVA .67 .62 .81 .605 SHEF .66 .73 .60 .826 FICO .64 .76 .53 .907 UNN .62 .67 .60 .73
ONE-IN-ONE .61 .52 1.00 .478 AUG .60 .73 .50 .889 SWAT-IV .58 .64 .55 .71
10 UA-ZSA .58 .60 .58 .6411 TITPI .57 .71 .45 .8912 JHU1-13 .53 .65 .45 .8213 DFKI2 .50 .63 .39 .8314 WIT .49 .66 .36 .9315 UC3M 13 .48 .66 .35 .9516 UBC-AS .40 .55 .30 .91
ALL-IN-ONE .40 .58 .29 1.00
Table 3.5: WePS-1 team ranking
3.6 Conclusions
The WePS-1 task ended with considerable success in terms of participation. Inaddition to that, all the collected and annotated dataset was released 7 as a benchmarkfor Web People Search systems.
The variability across test cases has proved to be large and unpredictable. A Ambiguity variabilitysystem that works well with the names in our testbed may not be reliable in practical,open search situations. Partly because of that reason, our testbed happened to beunintentionally challenging for systems, with a large difference between the averageambiguity in training and test datasets. Moreover, it is clear from this experiencethat building a reliable testbed for the task is not simple, insofar as the same namesource does not guarantee a consistent ambiguity across sets of names.
In view of the results obtained, we found it necessary to think about specific Evaluation measures
7http://nlp.uned.es/weps
72 The WePS-1 Campaign
evaluation measures beyond standard clustering metrics such as Purity and InversePurity. These metrics are not tailored to the task and were not designed to handlemultiple classification of elements. Furthermore, we found that different valuesof α in Fα have an effect in the ranking of the baseline systems when combiningmetrics. The very fact that a baseline can go from the middle of the ranking tothe bottom depending on the combining criteria has important implications inthe way we measure the contribution of systems to the problem. The two mainquestions we draw from this experience were: (i) are Purity and Inverse Puritythe most appropriate metrics for the WePS task and for clustering problems whereoverlapping elements are allowed? (ii) how does the combination of evaluationmetrics affect the ranking of systems in this task? Chapters 4 and 5 will study thesequestions in detail.
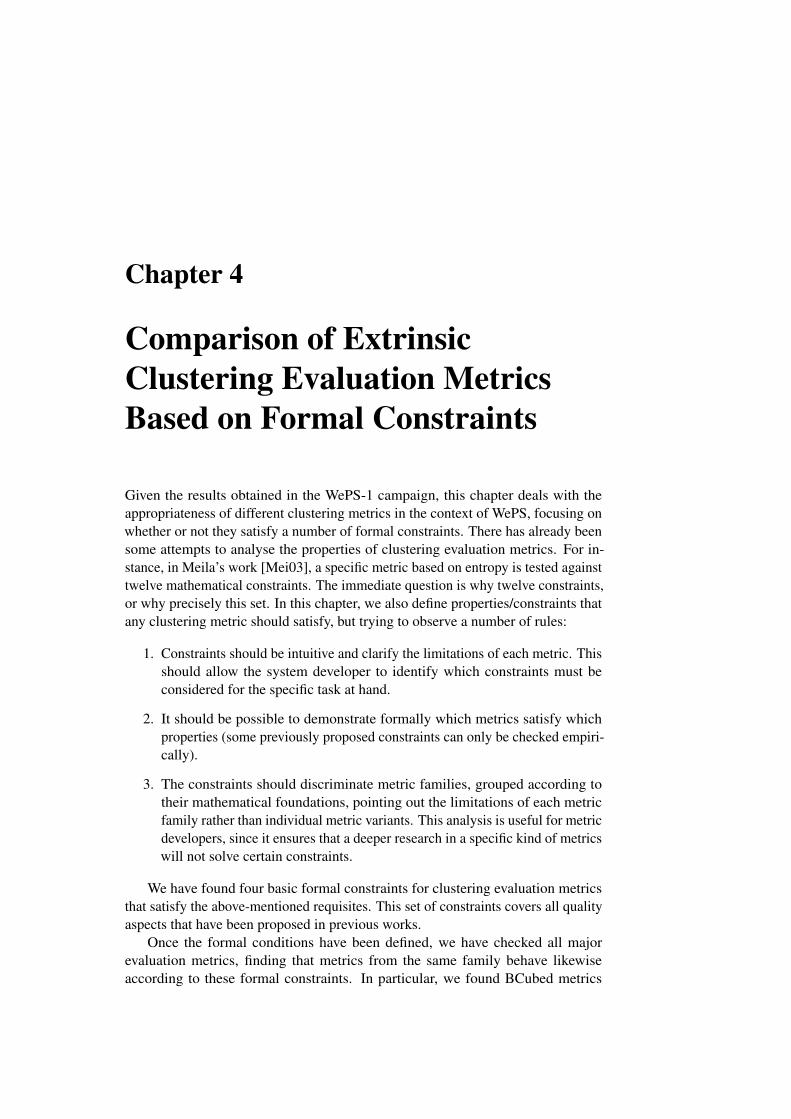
Chapter 4
Comparison of ExtrinsicClustering Evaluation MetricsBased on Formal Constraints
Given the results obtained in the WePS-1 campaign, this chapter deals with theappropriateness of different clustering metrics in the context of WePS, focusing onwhether or not they satisfy a number of formal constraints. There has already beensome attempts to analyse the properties of clustering evaluation metrics. For in-stance, in Meila’s work [Mei03], a specific metric based on entropy is tested againsttwelve mathematical constraints. The immediate question is why twelve constraints,or why precisely this set. In this chapter, we also define properties/constraints thatany clustering metric should satisfy, but trying to observe a number of rules:
1. Constraints should be intuitive and clarify the limitations of each metric. Thisshould allow the system developer to identify which constraints must beconsidered for the specific task at hand.
2. It should be possible to demonstrate formally which metrics satisfy whichproperties (some previously proposed constraints can only be checked empiri-cally).
3. The constraints should discriminate metric families, grouped according totheir mathematical foundations, pointing out the limitations of each metricfamily rather than individual metric variants. This analysis is useful for metricdevelopers, since it ensures that a deeper research in a specific kind of metricswill not solve certain constraints.
We have found four basic formal constraints for clustering evaluation metricsthat satisfy the above-mentioned requisites. This set of constraints covers all qualityaspects that have been proposed in previous works.
Once the formal conditions have been defined, we have checked all majorevaluation metrics, finding that metrics from the same family behave likewiseaccording to these formal constraints. In particular, we found BCubed metrics
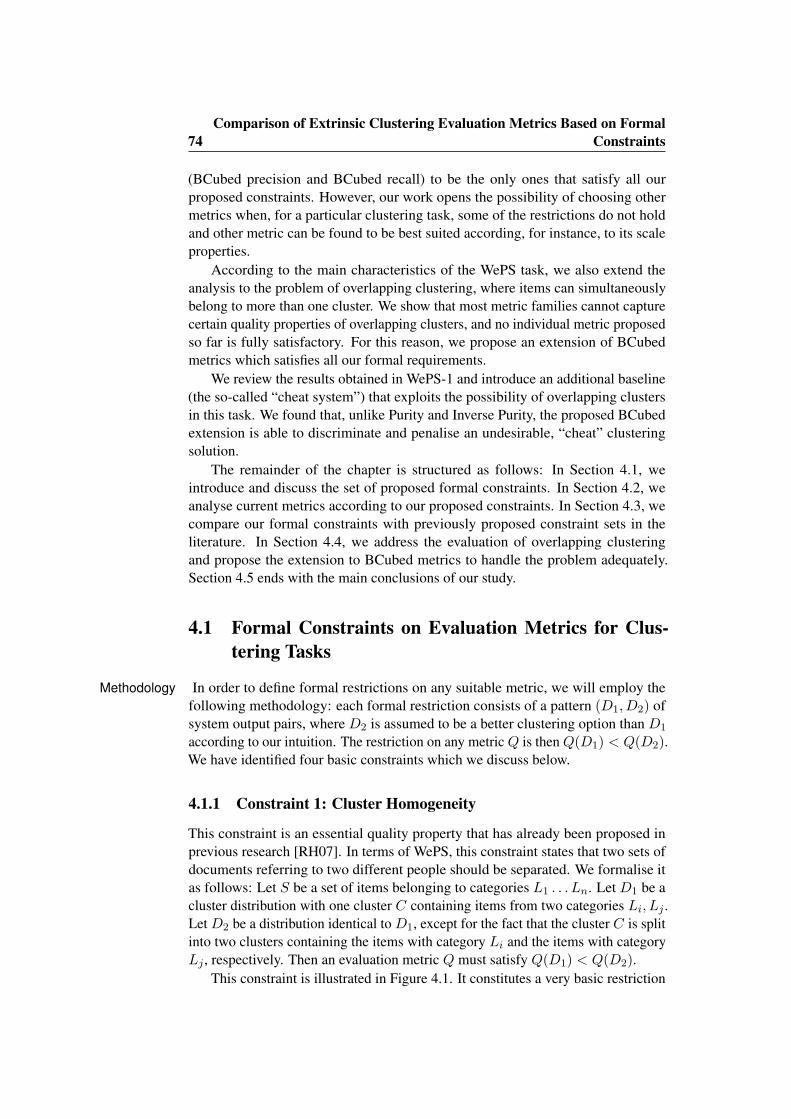
74Comparison of Extrinsic Clustering Evaluation Metrics Based on Formal
Constraints
(BCubed precision and BCubed recall) to be the only ones that satisfy all ourproposed constraints. However, our work opens the possibility of choosing othermetrics when, for a particular clustering task, some of the restrictions do not holdand other metric can be found to be best suited according, for instance, to its scaleproperties.
According to the main characteristics of the WePS task, we also extend theanalysis to the problem of overlapping clustering, where items can simultaneouslybelong to more than one cluster. We show that most metric families cannot capturecertain quality properties of overlapping clusters, and no individual metric proposedso far is fully satisfactory. For this reason, we propose an extension of BCubedmetrics which satisfies all our formal requirements.
We review the results obtained in WePS-1 and introduce an additional baseline(the so-called “cheat system”) that exploits the possibility of overlapping clustersin this task. We found that, unlike Purity and Inverse Purity, the proposed BCubedextension is able to discriminate and penalise an undesirable, “cheat” clusteringsolution.
The remainder of the chapter is structured as follows: In Section 4.1, weintroduce and discuss the set of proposed formal constraints. In Section 4.2, weanalyse current metrics according to our proposed constraints. In Section 4.3, wecompare our formal constraints with previously proposed constraint sets in theliterature. In Section 4.4, we address the evaluation of overlapping clusteringand propose the extension to BCubed metrics to handle the problem adequately.Section 4.5 ends with the main conclusions of our study.
4.1 Formal Constraints on Evaluation Metrics for Clus-tering Tasks
In order to define formal restrictions on any suitable metric, we will employ theMethodologyfollowing methodology: each formal restriction consists of a pattern (D1, D2) ofsystem output pairs, where D2 is assumed to be a better clustering option than D1
according to our intuition. The restriction on any metric Q is then Q(D1) < Q(D2).We have identified four basic constraints which we discuss below.
4.1.1 Constraint 1: Cluster Homogeneity
This constraint is an essential quality property that has already been proposed inprevious research [RH07]. In terms of WePS, this constraint states that two sets ofdocuments referring to two different people should be separated. We formalise itas follows: Let S be a set of items belonging to categories L1 . . . Ln. Let D1 be acluster distribution with one cluster C containing items from two categories Li, Lj .Let D2 be a distribution identical to D1, except for the fact that the cluster C is splitinto two clusters containing the items with category Li and the items with categoryLj , respectively. Then an evaluation metric Q must satisfy Q(D1) < Q(D2).
This constraint is illustrated in Figure 4.1. It constitutes a very basic restriction
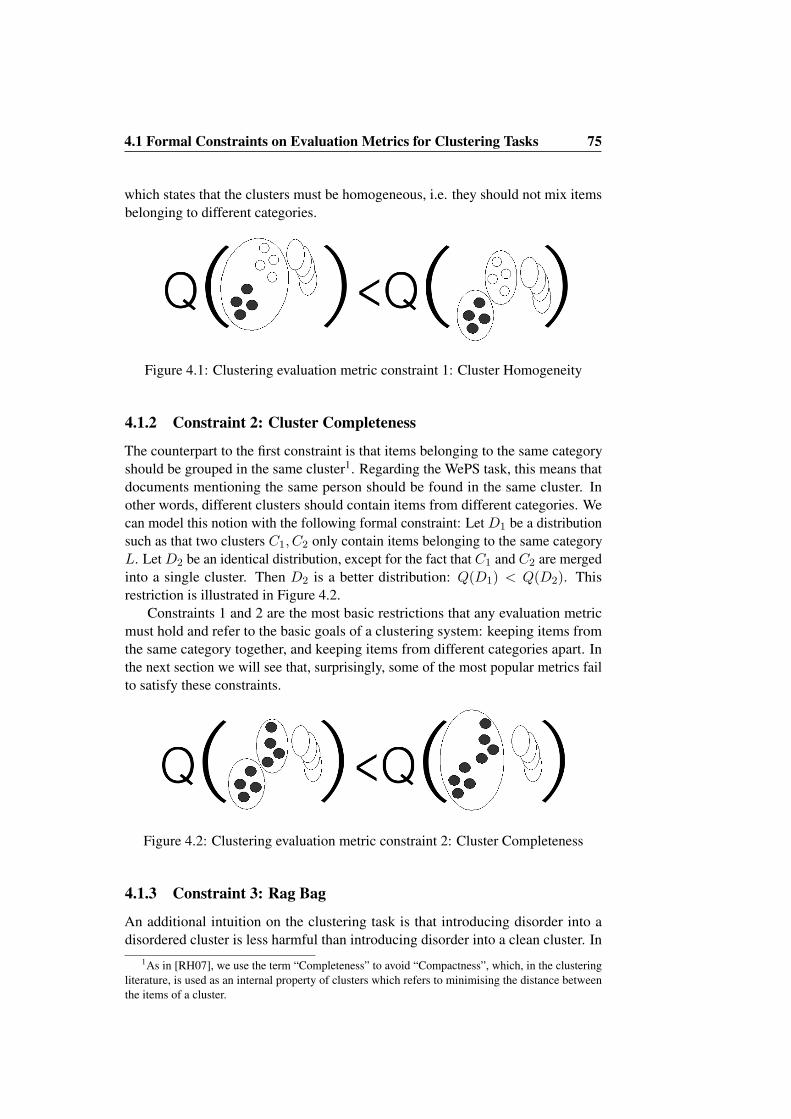
4.1 Formal Constraints on Evaluation Metrics for Clustering Tasks 75
which states that the clusters must be homogeneous, i.e. they should not mix itemsbelonging to different categories.
Figure 4.1: Clustering evaluation metric constraint 1: Cluster Homogeneity
4.1.2 Constraint 2: Cluster Completeness
The counterpart to the first constraint is that items belonging to the same categoryshould be grouped in the same cluster1. Regarding the WePS task, this means thatdocuments mentioning the same person should be found in the same cluster. Inother words, different clusters should contain items from different categories. Wecan model this notion with the following formal constraint: Let D1 be a distributionsuch as that two clusters C1, C2 only contain items belonging to the same categoryL. Let D2 be an identical distribution, except for the fact that C1 and C2 are mergedinto a single cluster. Then D2 is a better distribution: Q(D1) < Q(D2). Thisrestriction is illustrated in Figure 4.2.
Constraints 1 and 2 are the most basic restrictions that any evaluation metricmust hold and refer to the basic goals of a clustering system: keeping items fromthe same category together, and keeping items from different categories apart. Inthe next section we will see that, surprisingly, some of the most popular metrics failto satisfy these constraints.
Figure 4.2: Clustering evaluation metric constraint 2: Cluster Completeness
4.1.3 Constraint 3: Rag Bag
An additional intuition on the clustering task is that introducing disorder into adisordered cluster is less harmful than introducing disorder into a clean cluster. In
1As in [RH07], we use the term “Completeness” to avoid “Compactness”, which, in the clusteringliterature, is used as an internal property of clusters which refers to minimising the distance betweenthe items of a cluster.
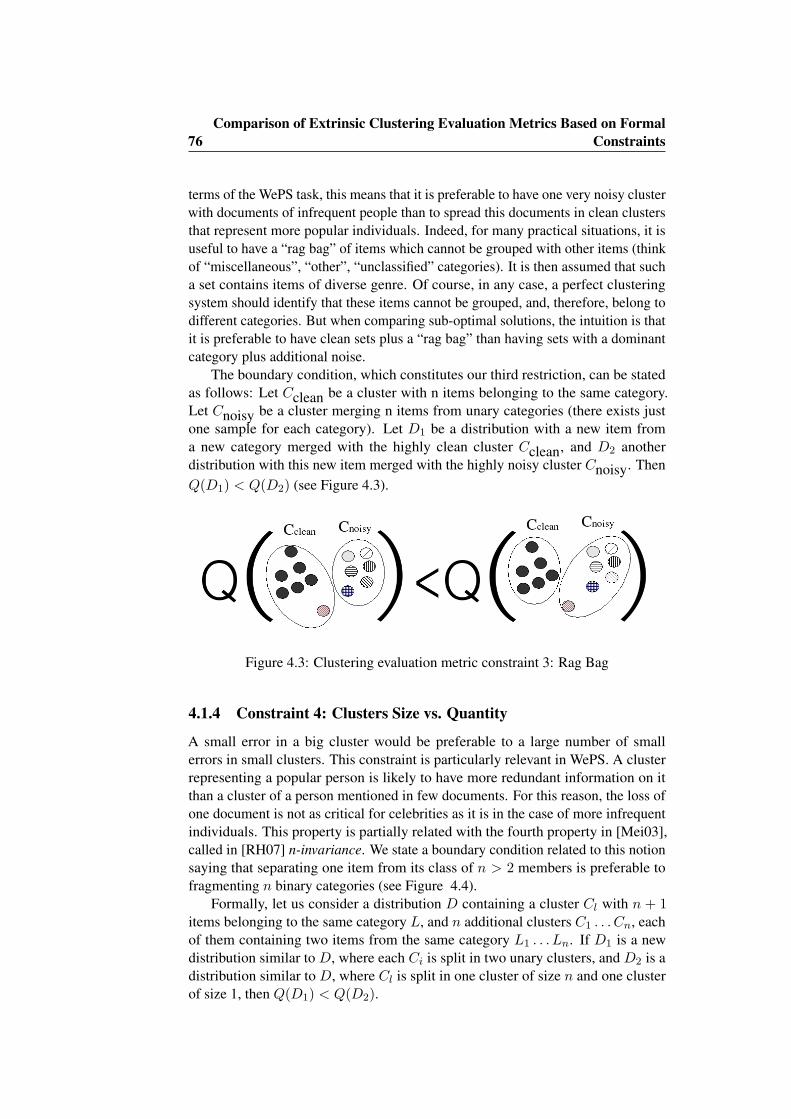
76Comparison of Extrinsic Clustering Evaluation Metrics Based on Formal
Constraints
terms of the WePS task, this means that it is preferable to have one very noisy clusterwith documents of infrequent people than to spread this documents in clean clustersthat represent more popular individuals. Indeed, for many practical situations, it isuseful to have a “rag bag” of items which cannot be grouped with other items (thinkof “miscellaneous”, “other”, “unclassified” categories). It is then assumed that sucha set contains items of diverse genre. Of course, in any case, a perfect clusteringsystem should identify that these items cannot be grouped, and, therefore, belong todifferent categories. But when comparing sub-optimal solutions, the intuition is thatit is preferable to have clean sets plus a “rag bag” than having sets with a dominantcategory plus additional noise.
The boundary condition, which constitutes our third restriction, can be statedas follows: Let Cclean be a cluster with n items belonging to the same category.Let Cnoisy be a cluster merging n items from unary categories (there exists justone sample for each category). Let D1 be a distribution with a new item froma new category merged with the highly clean cluster Cclean, and D2 anotherdistribution with this new item merged with the highly noisy cluster Cnoisy. ThenQ(D1) < Q(D2) (see Figure 4.3).
Figure 4.3: Clustering evaluation metric constraint 3: Rag Bag
4.1.4 Constraint 4: Clusters Size vs. Quantity
A small error in a big cluster would be preferable to a large number of smallerrors in small clusters. This constraint is particularly relevant in WePS. A clusterrepresenting a popular person is likely to have more redundant information on itthan a cluster of a person mentioned in few documents. For this reason, the loss ofone document is not as critical for celebrities as it is in the case of more infrequentindividuals. This property is partially related with the fourth property in [Mei03],called in [RH07] n-invariance. We state a boundary condition related to this notionsaying that separating one item from its class of n > 2 members is preferable tofragmenting n binary categories (see Figure 4.4).
Formally, let us consider a distribution D containing a cluster Cl with n + 1items belonging to the same category L, and n additional clusters C1 . . . Cn, eachof them containing two items from the same category L1 . . . Ln. If D1 is a newdistribution similar to D, where each Ci is split in two unary clusters, and D2 is adistribution similar to D, where Cl is split in one cluster of size n and one clusterof size 1, then Q(D1) < Q(D2).
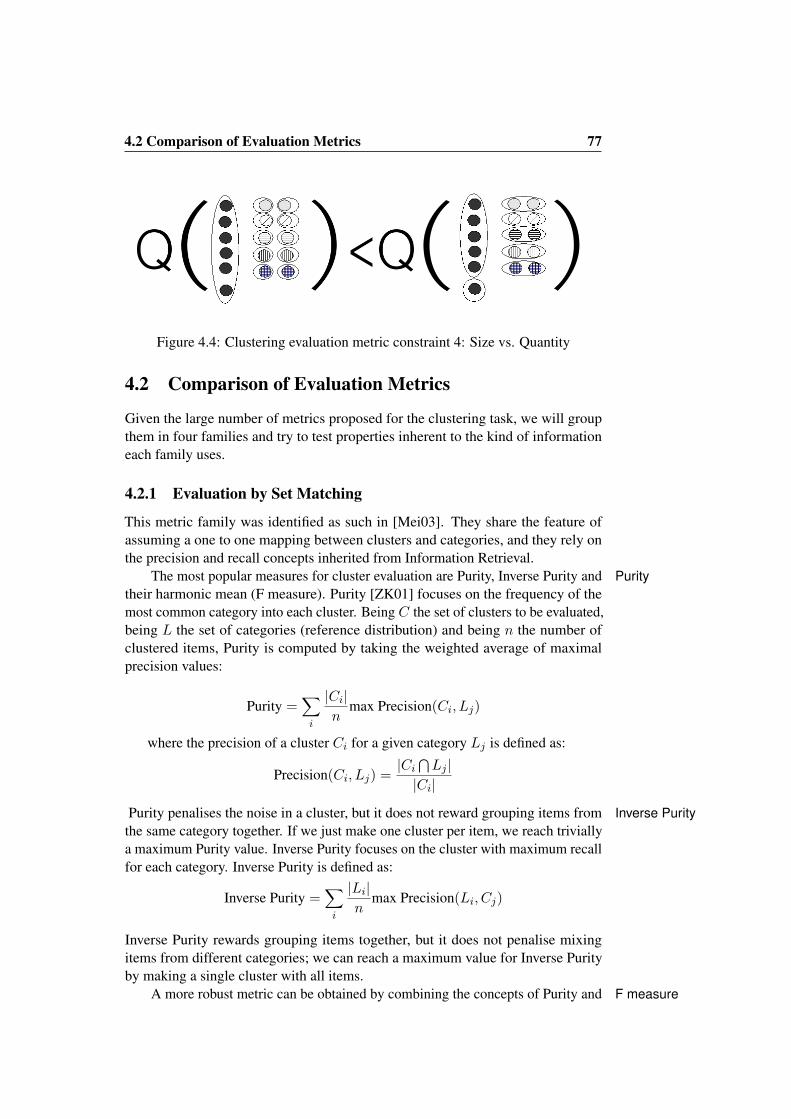
4.2 Comparison of Evaluation Metrics 77
Figure 4.4: Clustering evaluation metric constraint 4: Size vs. Quantity
4.2 Comparison of Evaluation Metrics
Given the large number of metrics proposed for the clustering task, we will groupthem in four families and try to test properties inherent to the kind of informationeach family uses.
4.2.1 Evaluation by Set Matching
This metric family was identified as such in [Mei03]. They share the feature ofassuming a one to one mapping between clusters and categories, and they rely onthe precision and recall concepts inherited from Information Retrieval.
The most popular measures for cluster evaluation are Purity, Inverse Purity and Puritytheir harmonic mean (F measure). Purity [ZK01] focuses on the frequency of themost common category into each cluster. Being C the set of clusters to be evaluated,being L the set of categories (reference distribution) and being n the number ofclustered items, Purity is computed by taking the weighted average of maximalprecision values:
Purity =∑i
|Ci|n
max Precision(Ci, Lj)
where the precision of a cluster Ci for a given category Lj is defined as:
Precision(Ci, Lj) =|Ci
⋂Lj |
|Ci|
Purity penalises the noise in a cluster, but it does not reward grouping items from Inverse Puritythe same category together. If we just make one cluster per item, we reach triviallya maximum Purity value. Inverse Purity focuses on the cluster with maximum recallfor each category. Inverse Purity is defined as:
Inverse Purity =∑i
|Li|n
max Precision(Li, Cj)
Inverse Purity rewards grouping items together, but it does not penalise mixingitems from different categories; we can reach a maximum value for Inverse Purityby making a single cluster with all items.
A more robust metric can be obtained by combining the concepts of Purity and F measure
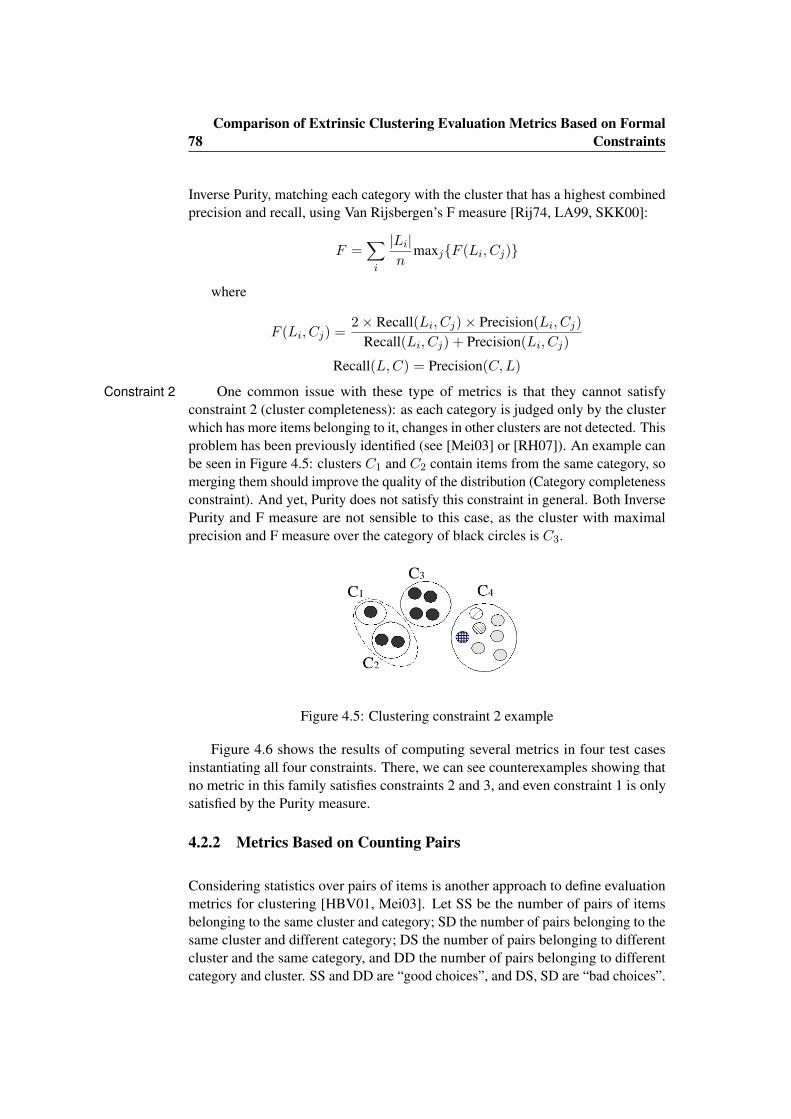
78Comparison of Extrinsic Clustering Evaluation Metrics Based on Formal
Constraints
Inverse Purity, matching each category with the cluster that has a highest combinedprecision and recall, using Van Rijsbergen’s F measure [Rij74, LA99, SKK00]:
F =∑i
|Li|n
maxj{F (Li, Cj)}
where
F (Li, Cj) =2× Recall(Li, Cj)× Precision(Li, Cj)
Recall(Li, Cj) + Precision(Li, Cj)
Recall(L,C) = Precision(C,L)
One common issue with these type of metrics is that they cannot satisfyConstraint 2constraint 2 (cluster completeness): as each category is judged only by the clusterwhich has more items belonging to it, changes in other clusters are not detected. Thisproblem has been previously identified (see [Mei03] or [RH07]). An example canbe seen in Figure 4.5: clusters C1 and C2 contain items from the same category, somerging them should improve the quality of the distribution (Category completenessconstraint). And yet, Purity does not satisfy this constraint in general. Both InversePurity and F measure are not sensible to this case, as the cluster with maximalprecision and F measure over the category of black circles is C3.
Figure 4.5: Clustering constraint 2 example
Figure 4.6 shows the results of computing several metrics in four test casesinstantiating all four constraints. There, we can see counterexamples showing thatno metric in this family satisfies constraints 2 and 3, and even constraint 1 is onlysatisfied by the Purity measure.
4.2.2 Metrics Based on Counting Pairs
Considering statistics over pairs of items is another approach to define evaluationmetrics for clustering [HBV01, Mei03]. Let SS be the number of pairs of itemsbelonging to the same cluster and category; SD the number of pairs belonging to thesame cluster and different category; DS the number of pairs belonging to differentcluster and the same category, and DD the number of pairs belonging to differentcategory and cluster. SS and DD are “good choices”, and DS, SD are “bad choices”.
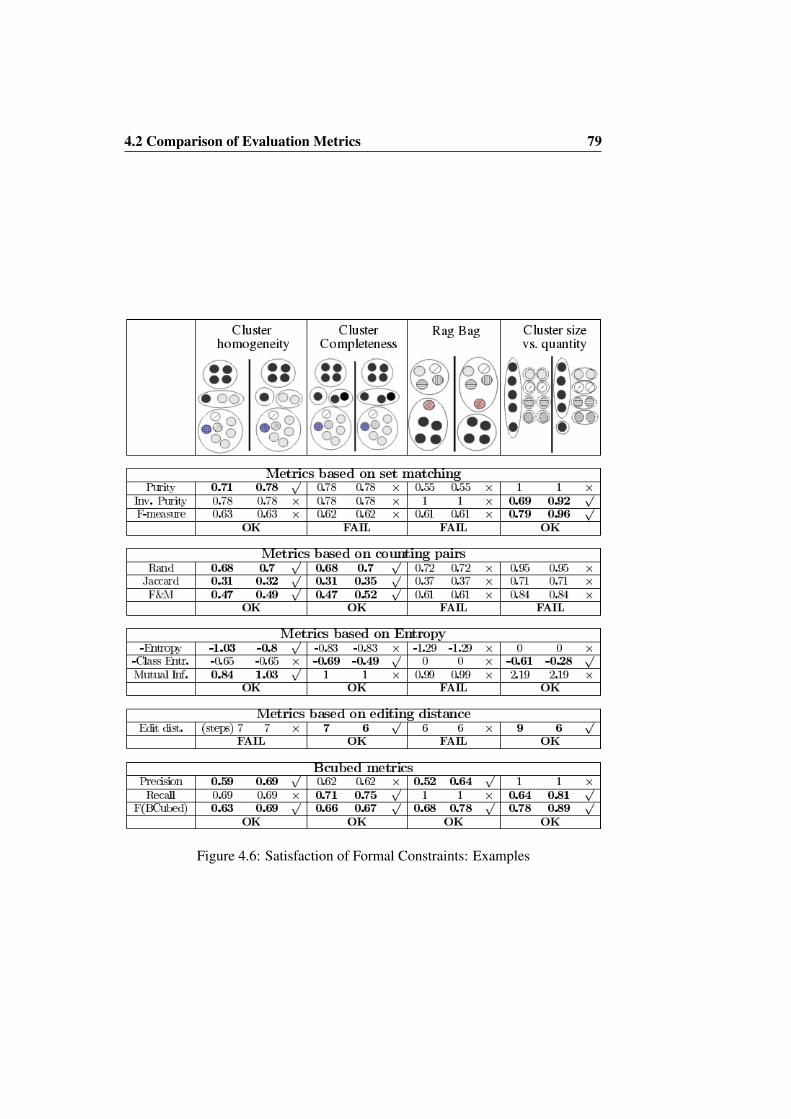
4.2 Comparison of Evaluation Metrics 79
Figure 4.6: Satisfaction of Formal Constraints: Examples
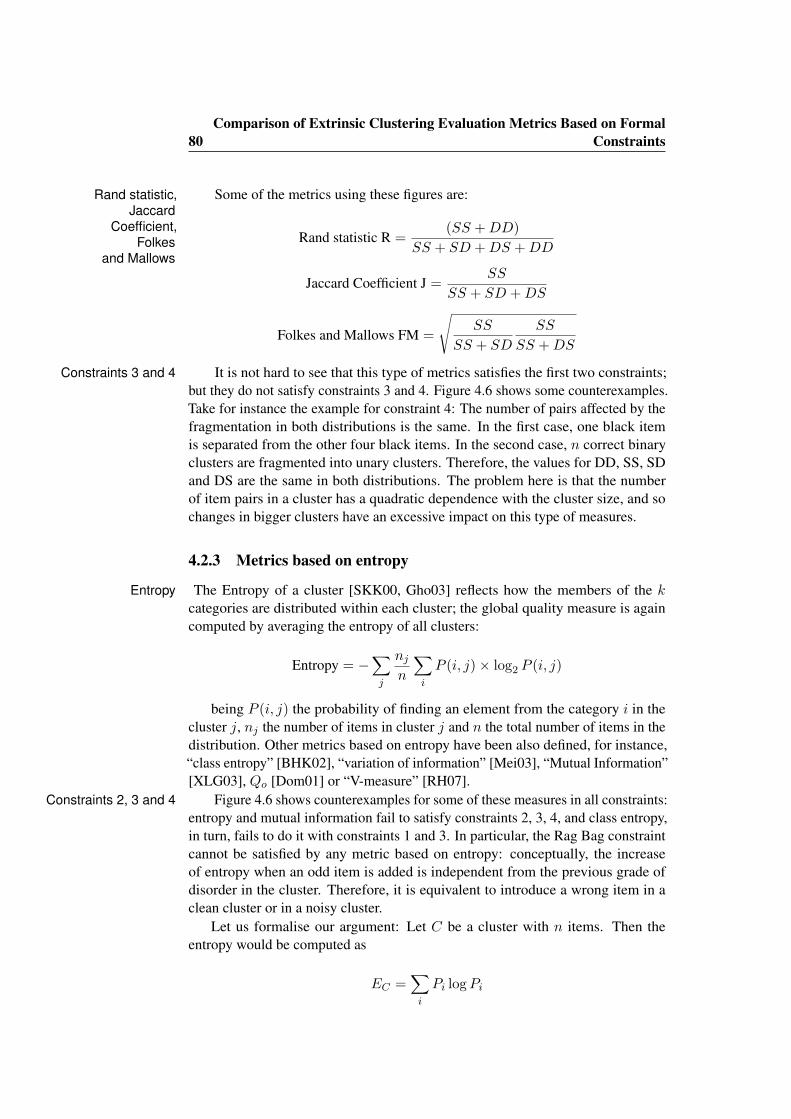
80Comparison of Extrinsic Clustering Evaluation Metrics Based on Formal
Constraints
Some of the metrics using these figures are:Rand statistic,Jaccard
Coefficient,Folkes
and Mallows
Rand statistic R =(SS +DD)
SS + SD +DS +DD
Jaccard Coefficient J =SS
SS + SD +DS
Folkes and Mallows FM =
√SS
SS + SD
SS
SS +DS
It is not hard to see that this type of metrics satisfies the first two constraints;Constraints 3 and 4but they do not satisfy constraints 3 and 4. Figure 4.6 shows some counterexamples.Take for instance the example for constraint 4: The number of pairs affected by thefragmentation in both distributions is the same. In the first case, one black itemis separated from the other four black items. In the second case, n correct binaryclusters are fragmented into unary clusters. Therefore, the values for DD, SS, SDand DS are the same in both distributions. The problem here is that the numberof item pairs in a cluster has a quadratic dependence with the cluster size, and sochanges in bigger clusters have an excessive impact on this type of measures.
4.2.3 Metrics based on entropy
The Entropy of a cluster [SKK00, Gho03] reflects how the members of the kEntropycategories are distributed within each cluster; the global quality measure is againcomputed by averaging the entropy of all clusters:
Entropy = −∑j
njn
∑i
P (i, j)× log2 P (i, j)
being P (i, j) the probability of finding an element from the category i in thecluster j, nj the number of items in cluster j and n the total number of items in thedistribution. Other metrics based on entropy have been also defined, for instance,“class entropy” [BHK02], “variation of information” [Mei03], “Mutual Information”[XLG03], Qo [Dom01] or “V-measure” [RH07].
Figure 4.6 shows counterexamples for some of these measures in all constraints:Constraints 2, 3 and 4entropy and mutual information fail to satisfy constraints 2, 3, 4, and class entropy,in turn, fails to do it with constraints 1 and 3. In particular, the Rag Bag constraintcannot be satisfied by any metric based on entropy: conceptually, the increaseof entropy when an odd item is added is independent from the previous grade ofdisorder in the cluster. Therefore, it is equivalent to introduce a wrong item in aclean cluster or in a noisy cluster.
Let us formalise our argument: Let C be a cluster with n items. Then theentropy would be computed as
EC =∑i
Pi logPi
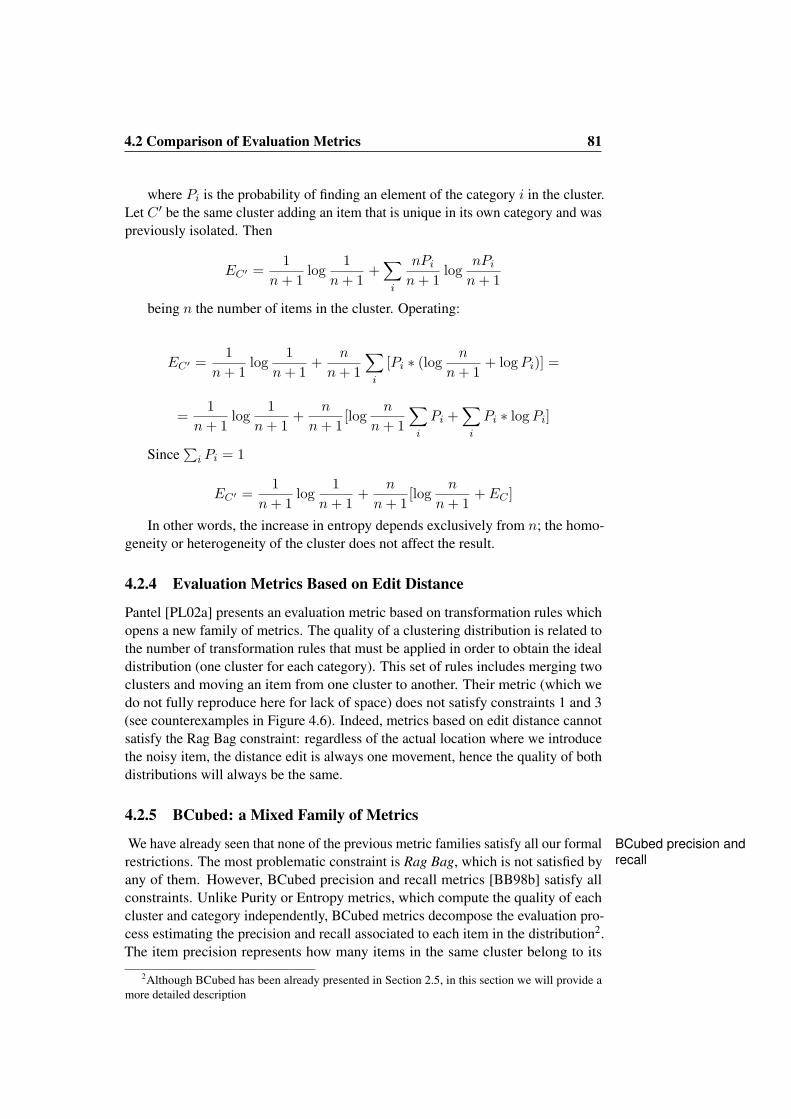
4.2 Comparison of Evaluation Metrics 81
where Pi is the probability of finding an element of the category i in the cluster.Let C ′ be the same cluster adding an item that is unique in its own category and waspreviously isolated. Then
EC′ =1
n+ 1log
1n+ 1
+∑i
nPin+ 1
lognPin+ 1
being n the number of items in the cluster. Operating:
EC′ =1
n+ 1log
1n+ 1
+n
n+ 1
∑i
[Pi ∗ (logn
n+ 1+ logPi)] =
=1
n+ 1log
1n+ 1
+n
n+ 1[log
n
n+ 1
∑i
Pi +∑i
Pi ∗ logPi]
Since∑i Pi = 1
EC′ =1
n+ 1log
1n+ 1
+n
n+ 1[log
n
n+ 1+ EC ]
In other words, the increase in entropy depends exclusively from n; the homo-geneity or heterogeneity of the cluster does not affect the result.
4.2.4 Evaluation Metrics Based on Edit Distance
Pantel [PL02a] presents an evaluation metric based on transformation rules whichopens a new family of metrics. The quality of a clustering distribution is related tothe number of transformation rules that must be applied in order to obtain the idealdistribution (one cluster for each category). This set of rules includes merging twoclusters and moving an item from one cluster to another. Their metric (which wedo not fully reproduce here for lack of space) does not satisfy constraints 1 and 3(see counterexamples in Figure 4.6). Indeed, metrics based on edit distance cannotsatisfy the Rag Bag constraint: regardless of the actual location where we introducethe noisy item, the distance edit is always one movement, hence the quality of bothdistributions will always be the same.
4.2.5 BCubed: a Mixed Family of Metrics
We have already seen that none of the previous metric families satisfy all our formal BCubed precision andrecallrestrictions. The most problematic constraint is Rag Bag, which is not satisfied by
any of them. However, BCubed precision and recall metrics [BB98b] satisfy allconstraints. Unlike Purity or Entropy metrics, which compute the quality of eachcluster and category independently, BCubed metrics decompose the evaluation pro-cess estimating the precision and recall associated to each item in the distribution2.The item precision represents how many items in the same cluster belong to its
2Although BCubed has been already presented in Section 2.5, in this section we will provide amore detailed description
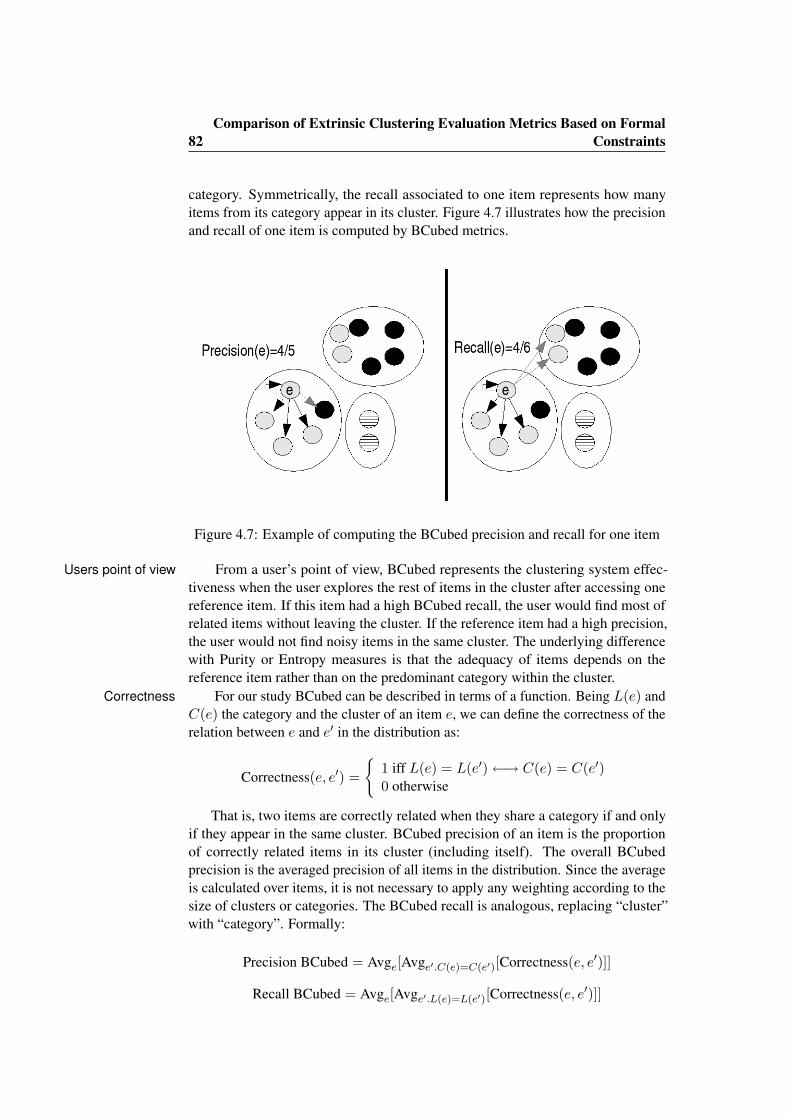
82Comparison of Extrinsic Clustering Evaluation Metrics Based on Formal
Constraints
category. Symmetrically, the recall associated to one item represents how manyitems from its category appear in its cluster. Figure 4.7 illustrates how the precisionand recall of one item is computed by BCubed metrics.
Figure 4.7: Example of computing the BCubed precision and recall for one item
From a user’s point of view, BCubed represents the clustering system effec-Users point of viewtiveness when the user explores the rest of items in the cluster after accessing onereference item. If this item had a high BCubed recall, the user would find most ofrelated items without leaving the cluster. If the reference item had a high precision,the user would not find noisy items in the same cluster. The underlying differencewith Purity or Entropy measures is that the adequacy of items depends on thereference item rather than on the predominant category within the cluster.
For our study BCubed can be described in terms of a function. Being L(e) andCorrectnessC(e) the category and the cluster of an item e, we can define the correctness of therelation between e and e′ in the distribution as:
Correctness(e, e′) =
{1 iff L(e) = L(e′)←→ C(e) = C(e′)0 otherwise
That is, two items are correctly related when they share a category if and onlyif they appear in the same cluster. BCubed precision of an item is the proportionof correctly related items in its cluster (including itself). The overall BCubedprecision is the averaged precision of all items in the distribution. Since the averageis calculated over items, it is not necessary to apply any weighting according to thesize of clusters or categories. The BCubed recall is analogous, replacing “cluster”with “category”. Formally:
Precision BCubed = Avge[Avge′.C(e)=C(e′)[Correctness(e, e′)]]
Recall BCubed = Avge[Avge′.L(e)=L(e′)[Correctness(e, e′)]]
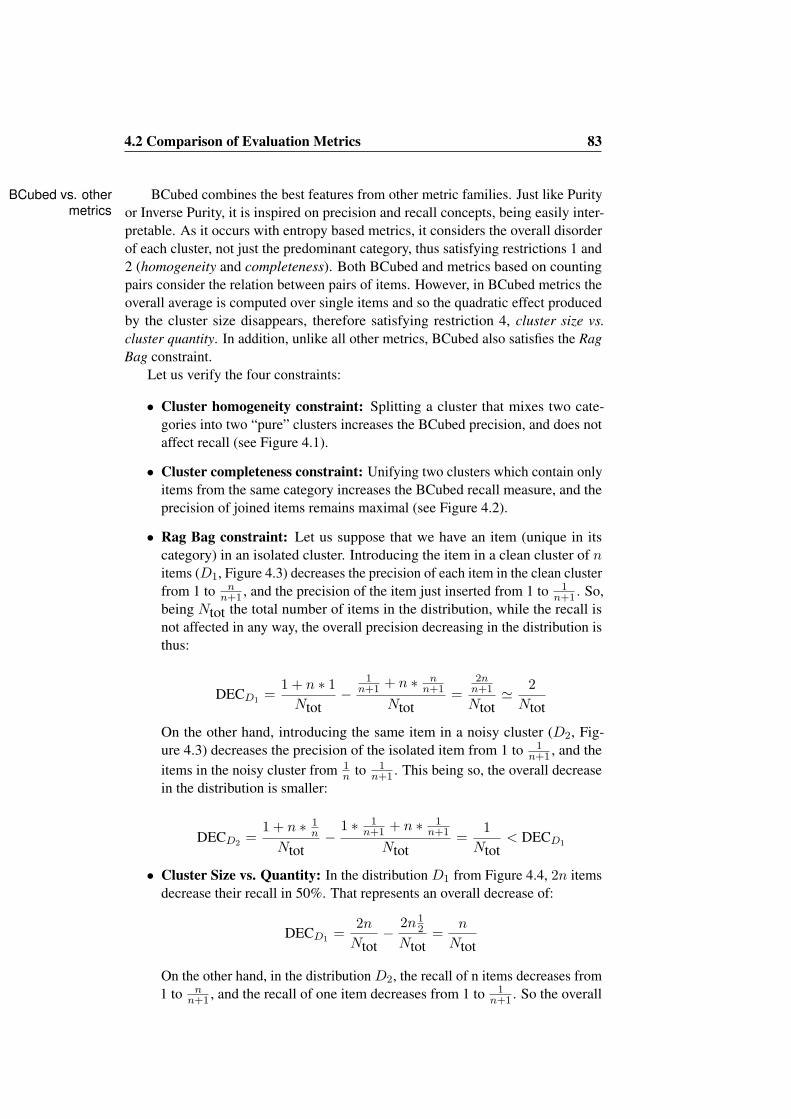
4.2 Comparison of Evaluation Metrics 83
BCubed combines the best features from other metric families. Just like PurityBCubed vs. othermetrics or Inverse Purity, it is inspired on precision and recall concepts, being easily inter-
pretable. As it occurs with entropy based metrics, it considers the overall disorderof each cluster, not just the predominant category, thus satisfying restrictions 1 and2 (homogeneity and completeness). Both BCubed and metrics based on countingpairs consider the relation between pairs of items. However, in BCubed metrics theoverall average is computed over single items and so the quadratic effect producedby the cluster size disappears, therefore satisfying restriction 4, cluster size vs.cluster quantity. In addition, unlike all other metrics, BCubed also satisfies the RagBag constraint.
Let us verify the four constraints:
• Cluster homogeneity constraint: Splitting a cluster that mixes two cate-gories into two “pure” clusters increases the BCubed precision, and does notaffect recall (see Figure 4.1).
• Cluster completeness constraint: Unifying two clusters which contain onlyitems from the same category increases the BCubed recall measure, and theprecision of joined items remains maximal (see Figure 4.2).
• Rag Bag constraint: Let us suppose that we have an item (unique in itscategory) in an isolated cluster. Introducing the item in a clean cluster of nitems (D1, Figure 4.3) decreases the precision of each item in the clean clusterfrom 1 to n
n+1 , and the precision of the item just inserted from 1 to 1n+1 . So,
being Ntot the total number of items in the distribution, while the recall isnot affected in any way, the overall precision decreasing in the distribution isthus:
DECD1 =1 + n ∗ 1Ntot
−1
n+1 + n ∗ nn+1
Ntot=
2nn+1
Ntot' 2Ntot
On the other hand, introducing the same item in a noisy cluster (D2, Fig-ure 4.3) decreases the precision of the isolated item from 1 to 1
n+1 , and theitems in the noisy cluster from 1
n to 1n+1 . This being so, the overall decrease
in the distribution is smaller:
DECD2 =1 + n ∗ 1
n
Ntot−
1 ∗ 1n+1 + n ∗ 1
n+1
Ntot=
1Ntot
< DECD1
• Cluster Size vs. Quantity: In the distribution D1 from Figure 4.4, 2n itemsdecrease their recall in 50%. That represents an overall decrease of:
DECD1 =2nNtot
−2n1
2
Ntot=
n
Ntot
On the other hand, in the distribution D2, the recall of n items decreases from1 to n
n+1 , and the recall of one item decreases from 1 to 1n+1 . So the overall
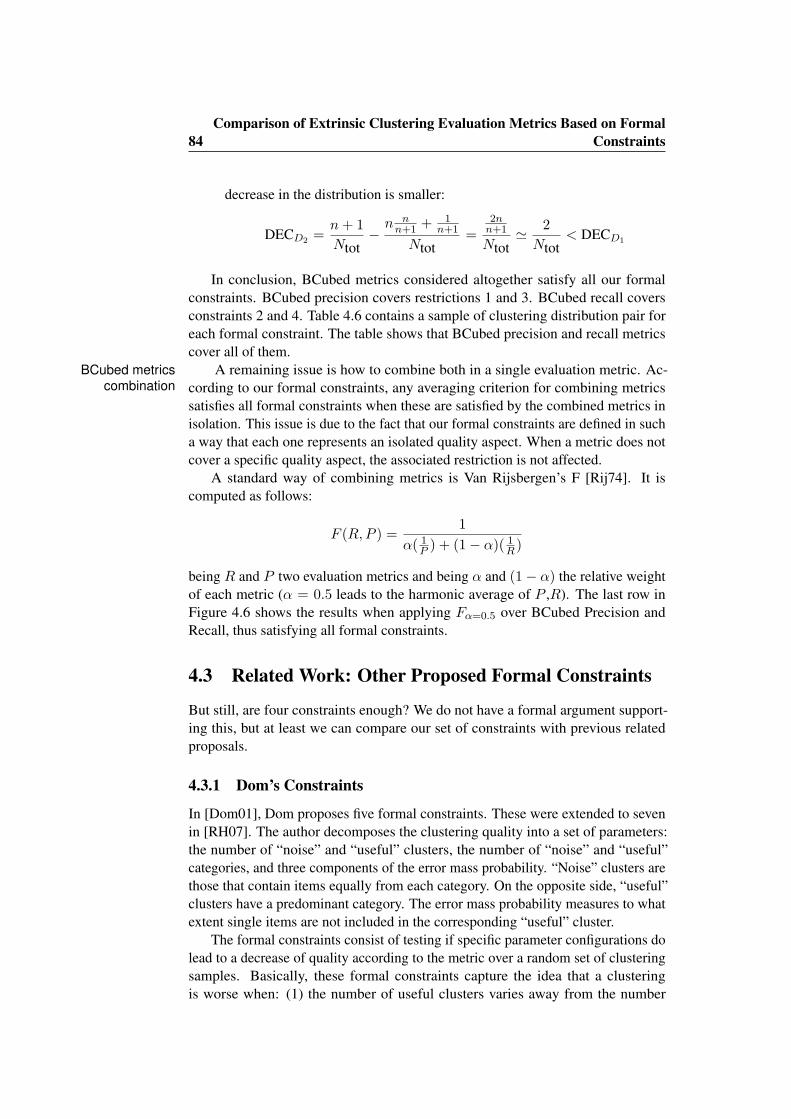
84Comparison of Extrinsic Clustering Evaluation Metrics Based on Formal
Constraints
decrease in the distribution is smaller:
DECD2 =n+ 1Ntot
−n nn+1 + 1
n+1
Ntot=
2nn+1
Ntot' 2Ntot
< DECD1
In conclusion, BCubed metrics considered altogether satisfy all our formalconstraints. BCubed precision covers restrictions 1 and 3. BCubed recall coversconstraints 2 and 4. Table 4.6 contains a sample of clustering distribution pair foreach formal constraint. The table shows that BCubed precision and recall metricscover all of them.
A remaining issue is how to combine both in a single evaluation metric. Ac-BCubed metricscombination cording to our formal constraints, any averaging criterion for combining metrics
satisfies all formal constraints when these are satisfied by the combined metrics inisolation. This issue is due to the fact that our formal constraints are defined in sucha way that each one represents an isolated quality aspect. When a metric does notcover a specific quality aspect, the associated restriction is not affected.
A standard way of combining metrics is Van Rijsbergen’s F [Rij74]. It iscomputed as follows:
F (R,P ) =1
α( 1P ) + (1− α)( 1
R)
being R and P two evaluation metrics and being α and (1− α) the relative weightof each metric (α = 0.5 leads to the harmonic average of P ,R). The last row inFigure 4.6 shows the results when applying Fα=0.5 over BCubed Precision andRecall, thus satisfying all formal constraints.
4.3 Related Work: Other Proposed Formal Constraints
But still, are four constraints enough? We do not have a formal argument support-ing this, but at least we can compare our set of constraints with previous relatedproposals.
4.3.1 Dom’s Constraints
In [Dom01], Dom proposes five formal constraints. These were extended to sevenin [RH07]. The author decomposes the clustering quality into a set of parameters:the number of “noise” and “useful” clusters, the number of “noise” and “useful”categories, and three components of the error mass probability. “Noise” clusters arethose that contain items equally from each category. On the opposite side, “useful”clusters have a predominant category. The error mass probability measures to whatextent single items are not included in the corresponding “useful” cluster.
The formal constraints consist of testing if specific parameter configurations dolead to a decrease of quality according to the metric over a random set of clusteringsamples. Basically, these formal constraints capture the idea that a clusteringis worse when: (1) the number of useful clusters varies away from the number
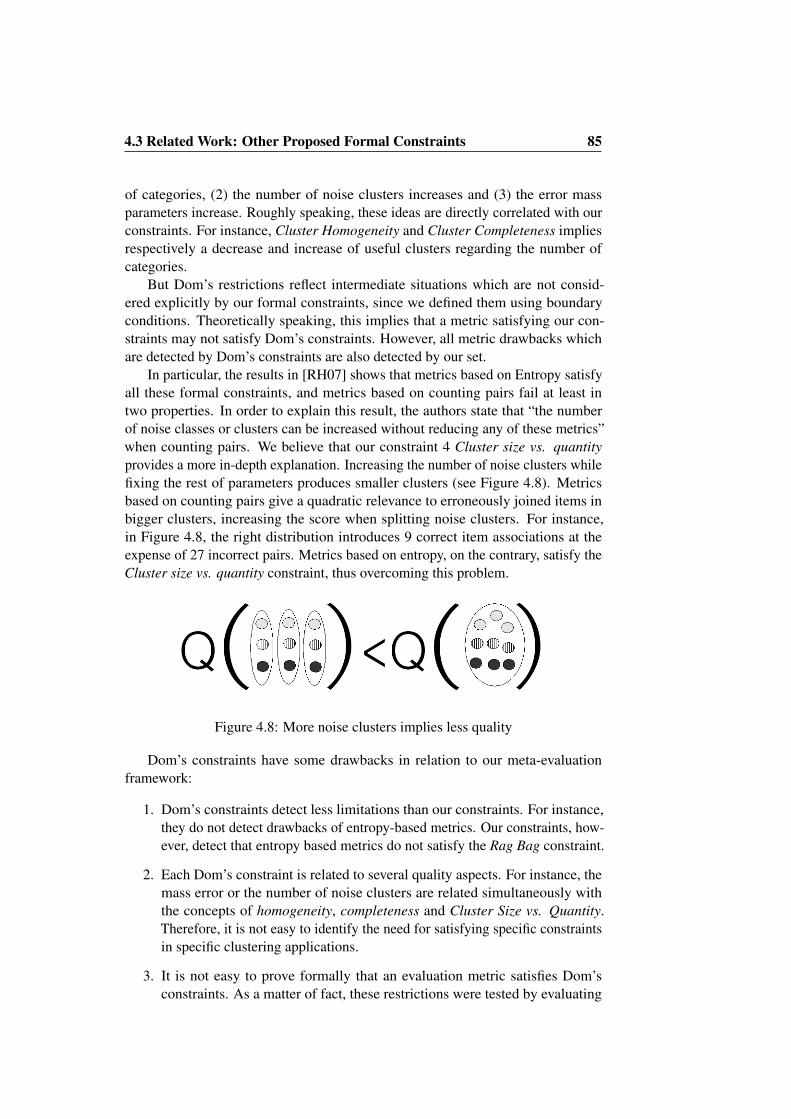
4.3 Related Work: Other Proposed Formal Constraints 85
of categories, (2) the number of noise clusters increases and (3) the error massparameters increase. Roughly speaking, these ideas are directly correlated with ourconstraints. For instance, Cluster Homogeneity and Cluster Completeness impliesrespectively a decrease and increase of useful clusters regarding the number ofcategories.
But Dom’s restrictions reflect intermediate situations which are not consid-ered explicitly by our formal constraints, since we defined them using boundaryconditions. Theoretically speaking, this implies that a metric satisfying our con-straints may not satisfy Dom’s constraints. However, all metric drawbacks whichare detected by Dom’s constraints are also detected by our set.
In particular, the results in [RH07] shows that metrics based on Entropy satisfyall these formal constraints, and metrics based on counting pairs fail at least intwo properties. In order to explain this result, the authors state that “the numberof noise classes or clusters can be increased without reducing any of these metrics”when counting pairs. We believe that our constraint 4 Cluster size vs. quantityprovides a more in-depth explanation. Increasing the number of noise clusters whilefixing the rest of parameters produces smaller clusters (see Figure 4.8). Metricsbased on counting pairs give a quadratic relevance to erroneously joined items inbigger clusters, increasing the score when splitting noise clusters. For instance,in Figure 4.8, the right distribution introduces 9 correct item associations at theexpense of 27 incorrect pairs. Metrics based on entropy, on the contrary, satisfy theCluster size vs. quantity constraint, thus overcoming this problem.
Figure 4.8: More noise clusters implies less quality
Dom’s constraints have some drawbacks in relation to our meta-evaluationframework:
1. Dom’s constraints detect less limitations than our constraints. For instance,they do not detect drawbacks of entropy-based metrics. Our constraints, how-ever, detect that entropy based metrics do not satisfy the Rag Bag constraint.
2. Each Dom’s constraint is related to several quality aspects. For instance, themass error or the number of noise clusters are related simultaneously withthe concepts of homogeneity, completeness and Cluster Size vs. Quantity.Therefore, it is not easy to identify the need for satisfying specific constraintsin specific clustering applications.
3. It is not easy to prove formally that an evaluation metric satisfies Dom’sconstraints. As a matter of fact, these restrictions were tested by evaluating
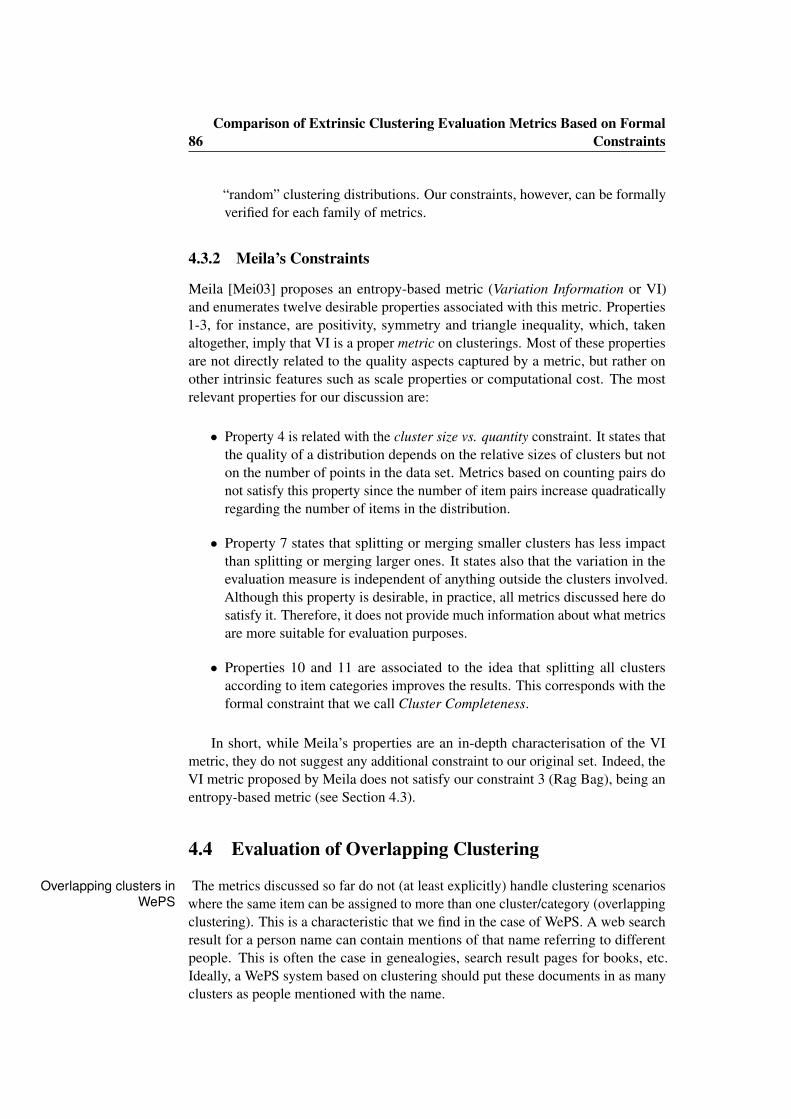
86Comparison of Extrinsic Clustering Evaluation Metrics Based on Formal
Constraints
“random” clustering distributions. Our constraints, however, can be formallyverified for each family of metrics.
4.3.2 Meila’s Constraints
Meila [Mei03] proposes an entropy-based metric (Variation Information or VI)and enumerates twelve desirable properties associated with this metric. Properties1-3, for instance, are positivity, symmetry and triangle inequality, which, takenaltogether, imply that VI is a proper metric on clusterings. Most of these propertiesare not directly related to the quality aspects captured by a metric, but rather onother intrinsic features such as scale properties or computational cost. The mostrelevant properties for our discussion are:
• Property 4 is related with the cluster size vs. quantity constraint. It states thatthe quality of a distribution depends on the relative sizes of clusters but noton the number of points in the data set. Metrics based on counting pairs donot satisfy this property since the number of item pairs increase quadraticallyregarding the number of items in the distribution.
• Property 7 states that splitting or merging smaller clusters has less impactthan splitting or merging larger ones. It states also that the variation in theevaluation measure is independent of anything outside the clusters involved.Although this property is desirable, in practice, all metrics discussed here dosatisfy it. Therefore, it does not provide much information about what metricsare more suitable for evaluation purposes.
• Properties 10 and 11 are associated to the idea that splitting all clustersaccording to item categories improves the results. This corresponds with theformal constraint that we call Cluster Completeness.
In short, while Meila’s properties are an in-depth characterisation of the VImetric, they do not suggest any additional constraint to our original set. Indeed, theVI metric proposed by Meila does not satisfy our constraint 3 (Rag Bag), being anentropy-based metric (see Section 4.3).
4.4 Evaluation of Overlapping Clustering
The metrics discussed so far do not (at least explicitly) handle clustering scenariosOverlapping clusters inWePS where the same item can be assigned to more than one cluster/category (overlapping
clustering). This is a characteristic that we find in the case of WePS. A web searchresult for a person name can contain mentions of that name referring to differentpeople. This is often the case in genealogies, search result pages for books, etc.Ideally, a WePS system based on clustering should put these documents in as manyclusters as people mentioned with the name.
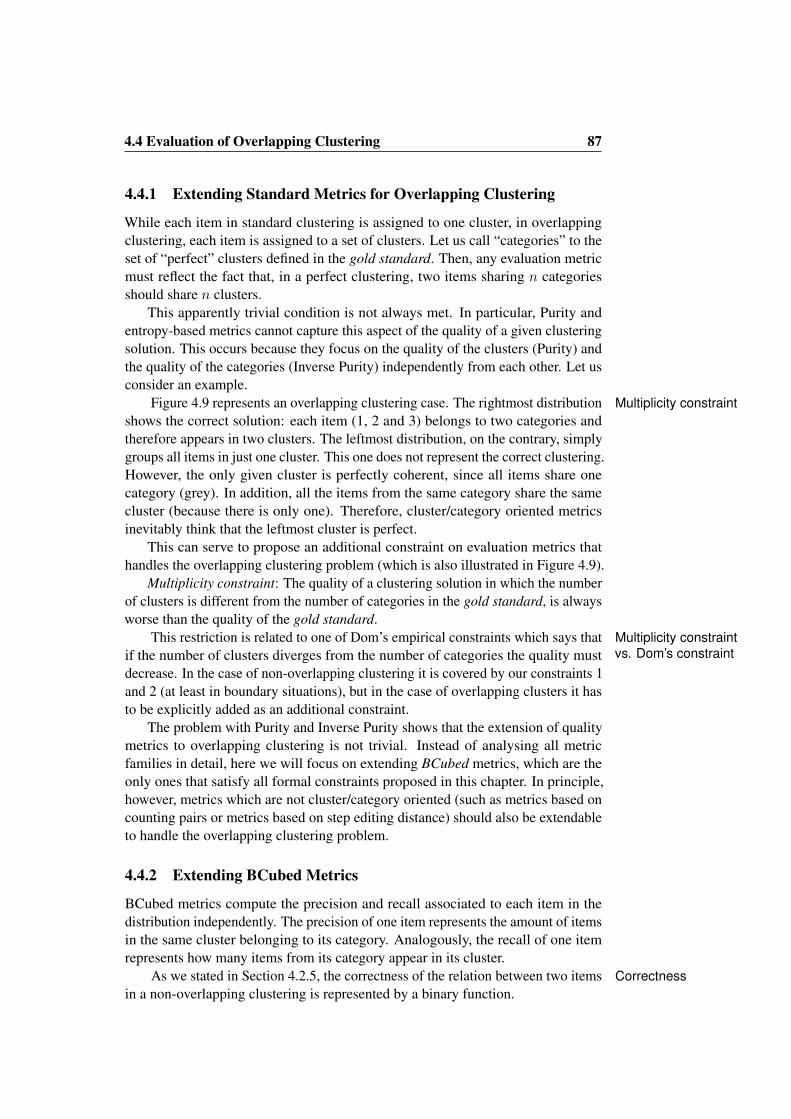
4.4 Evaluation of Overlapping Clustering 87
4.4.1 Extending Standard Metrics for Overlapping Clustering
While each item in standard clustering is assigned to one cluster, in overlappingclustering, each item is assigned to a set of clusters. Let us call “categories” to theset of “perfect” clusters defined in the gold standard. Then, any evaluation metricmust reflect the fact that, in a perfect clustering, two items sharing n categoriesshould share n clusters.
This apparently trivial condition is not always met. In particular, Purity andentropy-based metrics cannot capture this aspect of the quality of a given clusteringsolution. This occurs because they focus on the quality of the clusters (Purity) andthe quality of the categories (Inverse Purity) independently from each other. Let usconsider an example.
Figure 4.9 represents an overlapping clustering case. The rightmost distribution Multiplicity constraintshows the correct solution: each item (1, 2 and 3) belongs to two categories andtherefore appears in two clusters. The leftmost distribution, on the contrary, simplygroups all items in just one cluster. This one does not represent the correct clustering.However, the only given cluster is perfectly coherent, since all items share onecategory (grey). In addition, all the items from the same category share the samecluster (because there is only one). Therefore, cluster/category oriented metricsinevitably think that the leftmost cluster is perfect.
This can serve to propose an additional constraint on evaluation metrics thathandles the overlapping clustering problem (which is also illustrated in Figure 4.9).
Multiplicity constraint: The quality of a clustering solution in which the numberof clusters is different from the number of categories in the gold standard, is alwaysworse than the quality of the gold standard.
This restriction is related to one of Dom’s empirical constraints which says that Multiplicity constraintvs. Dom’s constraintif the number of clusters diverges from the number of categories the quality must
decrease. In the case of non-overlapping clustering it is covered by our constraints 1and 2 (at least in boundary situations), but in the case of overlapping clusters it hasto be explicitly added as an additional constraint.
The problem with Purity and Inverse Purity shows that the extension of qualitymetrics to overlapping clustering is not trivial. Instead of analysing all metricfamilies in detail, here we will focus on extending BCubed metrics, which are theonly ones that satisfy all formal constraints proposed in this chapter. In principle,however, metrics which are not cluster/category oriented (such as metrics based oncounting pairs or metrics based on step editing distance) should also be extendableto handle the overlapping clustering problem.
4.4.2 Extending BCubed Metrics
BCubed metrics compute the precision and recall associated to each item in thedistribution independently. The precision of one item represents the amount of itemsin the same cluster belonging to its category. Analogously, the recall of one itemrepresents how many items from its category appear in its cluster.
As we stated in Section 4.2.5, the correctness of the relation between two items Correctnessin a non-overlapping clustering is represented by a binary function.
88Comparison of Extrinsic Clustering Evaluation Metrics Based on Formal
Constraints
Figure 4.9: Clustering evaluation metric constraint 5: Item Multiplicity
Correctness(e, e′) =
{1 if L(e) = L(e′)←→ C(e) = C(e′)0 in other case
where L(e) is the cluster assigned to e by the clustering algorithm and C(e) isthe cluster assigned to e by the gold standard.
In the case of overlapping clustering the relation between two items can notbe represented as a binary function. This is due to the fact that, in overlappingclustering, we must take into account the multiplicity of item occurrences in clustersand categories. For instance, if two items share two categories and share justone cluster, then the clustering does not capture the relation between both itemscompletely (see items 1 and 2 in the second case of Figure 4.10). On the otherhand, if two items share three clusters but just two categories, then the clusteringintroduces more information than necessary. This is the third case in Figure 4.10.
These new aspects can be measured in terms of precision and recall betweenMultiplicity precisionand recall two items. Let us define:
Multiplicity Precision(e, e′) =Min(|C(e) ∩ C(e′)|, |L(e) ∩ L(e′)|)
|C(e) ∩ C(e′)|
Multiplicity Recall(e, e′) =Min(|C(e) ∩ C(e′)|, |L(e) ∩ L(e′)|)
|L(e) ∩ L(e′)|
where e and e′ are two items, L(e) is the set of categories and C(e) representsthe set of clusters associated to e. Note that Multiplicity Precision is definedonly when e, e′ share some cluster, and Multiplicity Recall when e, e′ share somecategory. This is enough to define BCubed extensions. Multiplicity Precision is usedwhen two items share one or more clusters, and it is maximal (1) when the numberof shared categories is lower or equal than the number of shared clusters, and it isminimal (0) when the two items do not share any category. Conversely, MultiplicityRecall is used when two items share one or more categories: it is maximal when thenumber of shared clusters is lower or equal than the number of shared categories,and it is minimal when the two items do not share any cluster.
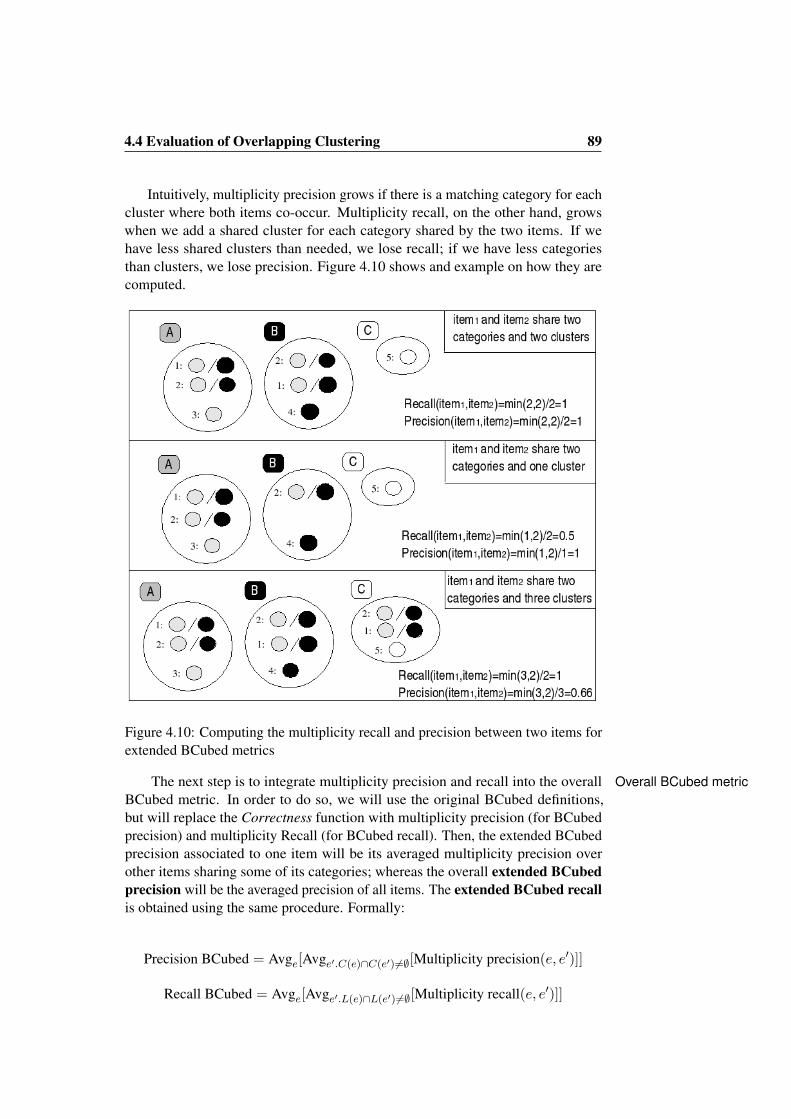
4.4 Evaluation of Overlapping Clustering 89
Intuitively, multiplicity precision grows if there is a matching category for eachcluster where both items co-occur. Multiplicity recall, on the other hand, growswhen we add a shared cluster for each category shared by the two items. If wehave less shared clusters than needed, we lose recall; if we have less categoriesthan clusters, we lose precision. Figure 4.10 shows and example on how they arecomputed.
Figure 4.10: Computing the multiplicity recall and precision between two items forextended BCubed metrics
The next step is to integrate multiplicity precision and recall into the overall Overall BCubed metricBCubed metric. In order to do so, we will use the original BCubed definitions,but will replace the Correctness function with multiplicity precision (for BCubedprecision) and multiplicity Recall (for BCubed recall). Then, the extended BCubedprecision associated to one item will be its averaged multiplicity precision overother items sharing some of its categories; whereas the overall extended BCubedprecision will be the averaged precision of all items. The extended BCubed recallis obtained using the same procedure. Formally:
Precision BCubed = Avge[Avge′.C(e)∩C(e′)6=∅[Multiplicity precision(e, e′)]]
Recall BCubed = Avge[Avge′.L(e)∩L(e′)6=∅[Multiplicity recall(e, e′)]]
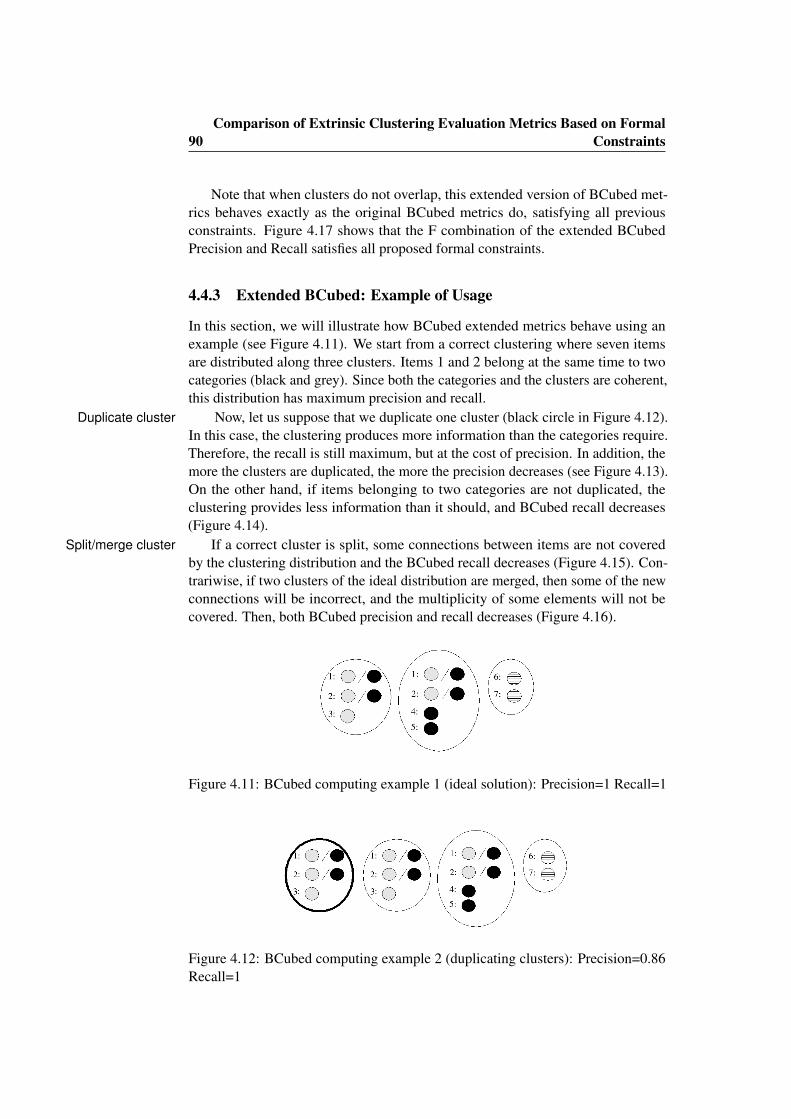
90Comparison of Extrinsic Clustering Evaluation Metrics Based on Formal
Constraints
Note that when clusters do not overlap, this extended version of BCubed met-rics behaves exactly as the original BCubed metrics do, satisfying all previousconstraints. Figure 4.17 shows that the F combination of the extended BCubedPrecision and Recall satisfies all proposed formal constraints.
4.4.3 Extended BCubed: Example of Usage
In this section, we will illustrate how BCubed extended metrics behave using anexample (see Figure 4.11). We start from a correct clustering where seven itemsare distributed along three clusters. Items 1 and 2 belong at the same time to twocategories (black and grey). Since both the categories and the clusters are coherent,this distribution has maximum precision and recall.
Now, let us suppose that we duplicate one cluster (black circle in Figure 4.12).Duplicate clusterIn this case, the clustering produces more information than the categories require.Therefore, the recall is still maximum, but at the cost of precision. In addition, themore the clusters are duplicated, the more the precision decreases (see Figure 4.13).On the other hand, if items belonging to two categories are not duplicated, theclustering provides less information than it should, and BCubed recall decreases(Figure 4.14).
If a correct cluster is split, some connections between items are not coveredSplit/merge clusterby the clustering distribution and the BCubed recall decreases (Figure 4.15). Con-trariwise, if two clusters of the ideal distribution are merged, then some of the newconnections will be incorrect, and the multiplicity of some elements will not becovered. Then, both BCubed precision and recall decreases (Figure 4.16).
Figure 4.11: BCubed computing example 1 (ideal solution): Precision=1 Recall=1
Figure 4.12: BCubed computing example 2 (duplicating clusters): Precision=0.86Recall=1
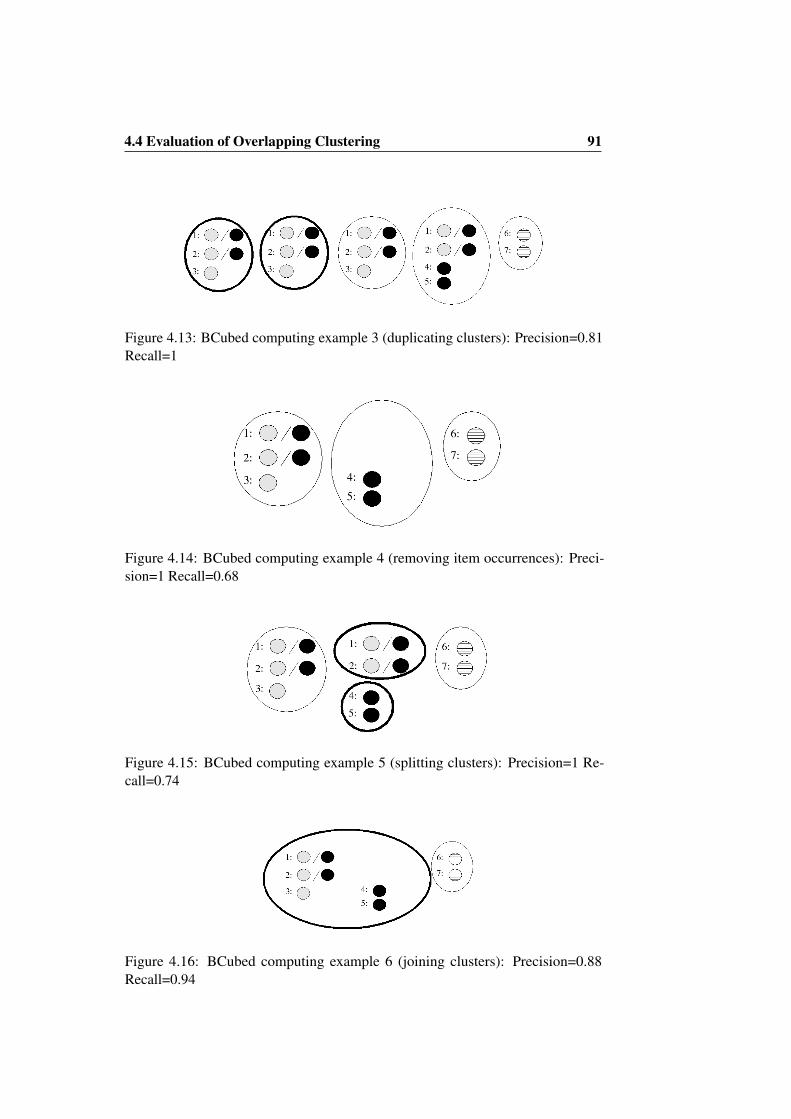
4.4 Evaluation of Overlapping Clustering 91
Figure 4.13: BCubed computing example 3 (duplicating clusters): Precision=0.81Recall=1
Figure 4.14: BCubed computing example 4 (removing item occurrences): Preci-sion=1 Recall=0.68
Figure 4.15: BCubed computing example 5 (splitting clusters): Precision=1 Re-call=0.74
Figure 4.16: BCubed computing example 6 (joining clusters): Precision=0.88Recall=0.94
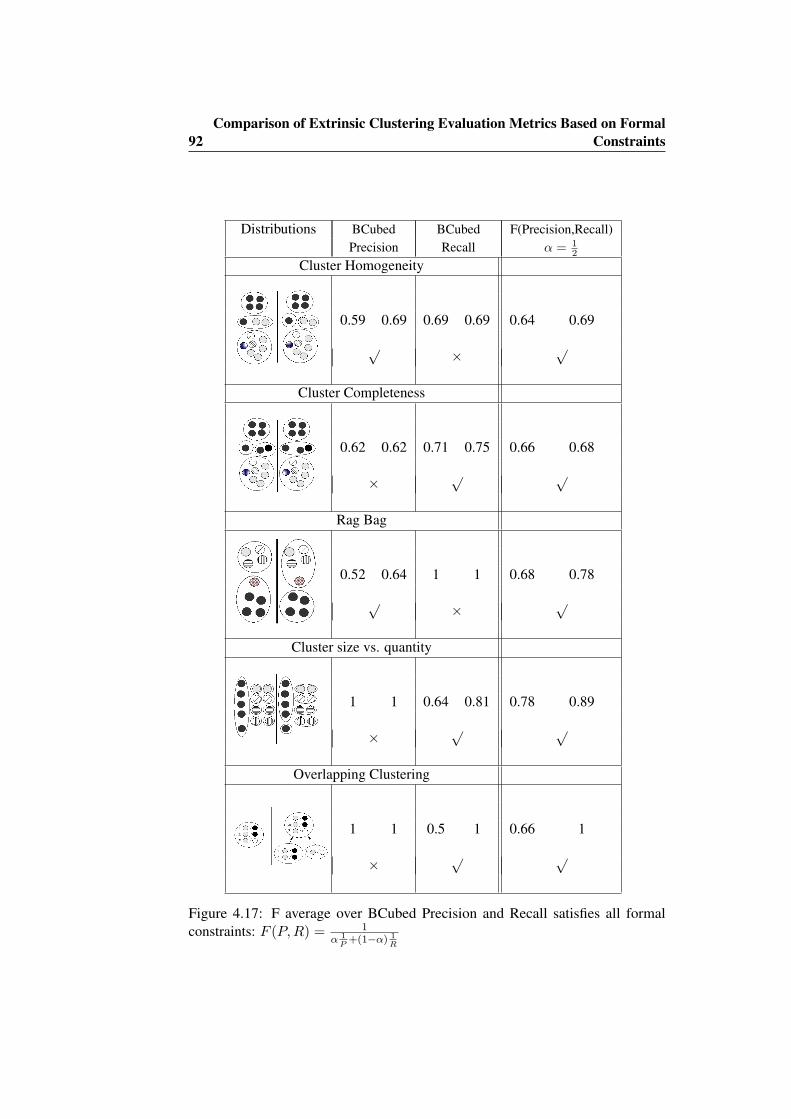
92Comparison of Extrinsic Clustering Evaluation Metrics Based on Formal
Constraints
Distributions BCubed BCubed F(Precision,Recall)Precision Recall α = 1
2
Cluster Homogeneity
0.59 0.69 0.69 0.69 0.64 0.69
√×
√
Cluster Completeness
0.62 0.62 0.71 0.75 0.66 0.68
×√ √
Rag Bag
0.52 0.64 1 1 0.68 0.78
√×
√
Cluster size vs. quantity
1 1 0.64 0.81 0.78 0.89
×√ √
Overlapping Clustering
1 1 0.5 1 0.66 1
×√ √
Figure 4.17: F average over BCubed Precision and Recall satisfies all formalconstraints: F (P,R) = 1
α 1P
+(1−α) 1R
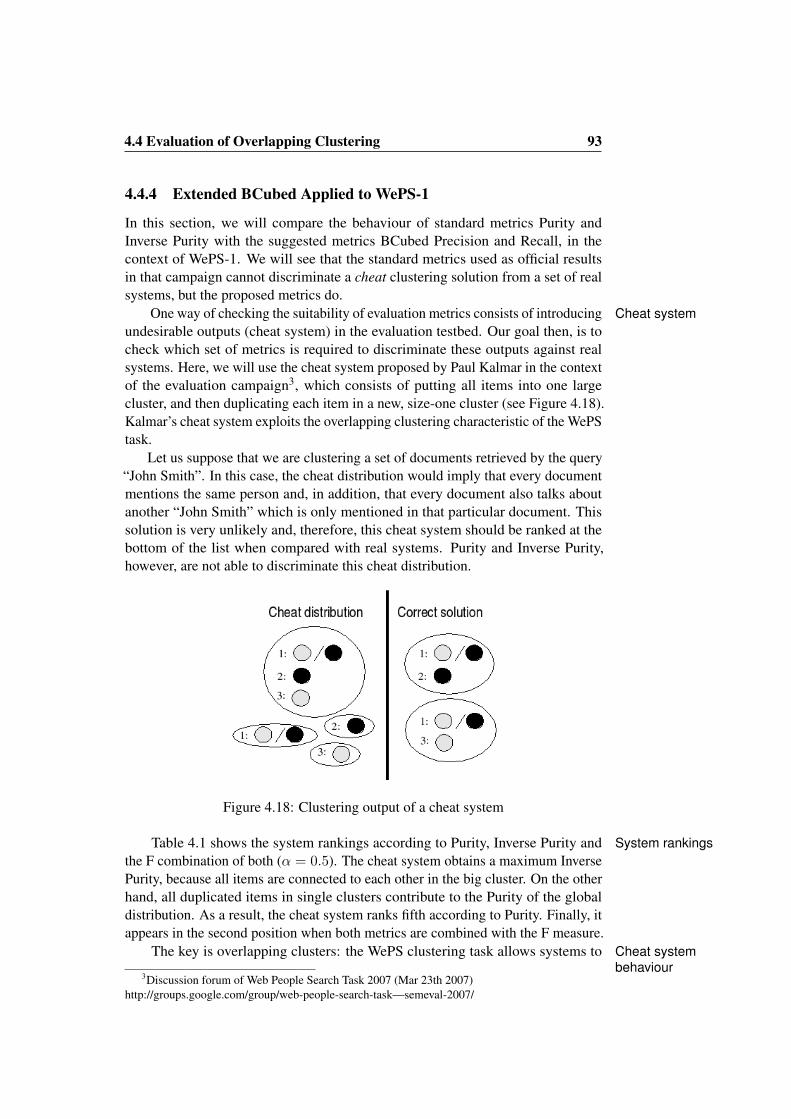
4.4 Evaluation of Overlapping Clustering 93
4.4.4 Extended BCubed Applied to WePS-1
In this section, we will compare the behaviour of standard metrics Purity andInverse Purity with the suggested metrics BCubed Precision and Recall, in thecontext of WePS-1. We will see that the standard metrics used as official resultsin that campaign cannot discriminate a cheat clustering solution from a set of realsystems, but the proposed metrics do.
One way of checking the suitability of evaluation metrics consists of introducing Cheat systemundesirable outputs (cheat system) in the evaluation testbed. Our goal then, is tocheck which set of metrics is required to discriminate these outputs against realsystems. Here, we will use the cheat system proposed by Paul Kalmar in the contextof the evaluation campaign3, which consists of putting all items into one largecluster, and then duplicating each item in a new, size-one cluster (see Figure 4.18).Kalmar’s cheat system exploits the overlapping clustering characteristic of the WePStask.
Let us suppose that we are clustering a set of documents retrieved by the query“John Smith”. In this case, the cheat distribution would imply that every documentmentions the same person and, in addition, that every document also talks aboutanother “John Smith” which is only mentioned in that particular document. Thissolution is very unlikely and, therefore, this cheat system should be ranked at thebottom of the list when compared with real systems. Purity and Inverse Purity,however, are not able to discriminate this cheat distribution.
Figure 4.18: Clustering output of a cheat system
Table 4.1 shows the system rankings according to Purity, Inverse Purity and System rankingsthe F combination of both (α = 0.5). The cheat system obtains a maximum InversePurity, because all items are connected to each other in the big cluster. On the otherhand, all duplicated items in single clusters contribute to the Purity of the globaldistribution. As a result, the cheat system ranks fifth according to Purity. Finally, itappears in the second position when both metrics are combined with the F measure.
The key is overlapping clusters: the WePS clustering task allows systems to Cheat systembehaviour
3Discussion forum of Web People Search Task 2007 (Mar 23th 2007)http://groups.google.com/group/web-people-search-task—semeval-2007/
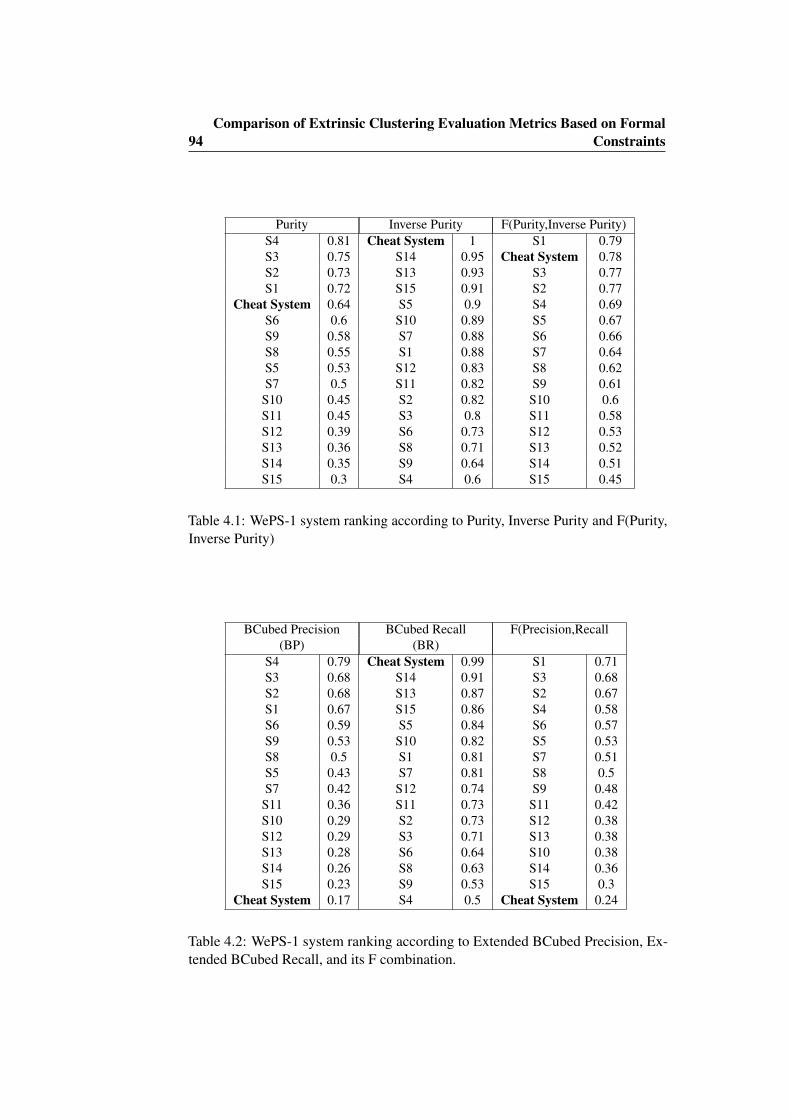
94Comparison of Extrinsic Clustering Evaluation Metrics Based on Formal
Constraints
Purity Inverse Purity F(Purity,Inverse Purity)S4 0.81 Cheat System 1 S1 0.79S3 0.75 S14 0.95 Cheat System 0.78S2 0.73 S13 0.93 S3 0.77S1 0.72 S15 0.91 S2 0.77
Cheat System 0.64 S5 0.9 S4 0.69S6 0.6 S10 0.89 S5 0.67S9 0.58 S7 0.88 S6 0.66S8 0.55 S1 0.88 S7 0.64S5 0.53 S12 0.83 S8 0.62S7 0.5 S11 0.82 S9 0.61S10 0.45 S2 0.82 S10 0.6S11 0.45 S3 0.8 S11 0.58S12 0.39 S6 0.73 S12 0.53S13 0.36 S8 0.71 S13 0.52S14 0.35 S9 0.64 S14 0.51S15 0.3 S4 0.6 S15 0.45
Table 4.1: WePS-1 system ranking according to Purity, Inverse Purity and F(Purity,Inverse Purity)
BCubed Precision BCubed Recall F(Precision,Recall(BP) (BR)
S4 0.79 Cheat System 0.99 S1 0.71S3 0.68 S14 0.91 S3 0.68S2 0.68 S13 0.87 S2 0.67S1 0.67 S15 0.86 S4 0.58S6 0.59 S5 0.84 S6 0.57S9 0.53 S10 0.82 S5 0.53S8 0.5 S1 0.81 S7 0.51S5 0.43 S7 0.81 S8 0.5S7 0.42 S12 0.74 S9 0.48S11 0.36 S11 0.73 S11 0.42S10 0.29 S2 0.73 S12 0.38S12 0.29 S3 0.71 S13 0.38S13 0.28 S6 0.64 S10 0.38S14 0.26 S8 0.63 S14 0.36S15 0.23 S9 0.53 S15 0.3
Cheat System 0.17 S4 0.5 Cheat System 0.24
Table 4.2: WePS-1 system ranking according to Extended BCubed Precision, Ex-tended BCubed Recall, and its F combination.
4.5 Conclusions 95
put a document in several clusters if it refers to multiple people. The cheat systemexploits this feature, producing a cluster of size one for each document, plus a clustercontaining all documents. For example, in Figure 4.18, three elements are shownin the cheat and the correct cluster distributions4. Inverse Purity is, by definition,perfect in the cheat system output, since all documents can be found in one cluster.This would usually correspond to a low Purity for this noisy cluster. But at thispoint, by duplicating each document and generating a new singleton cluster, we addmany clusters with maximal Purity, and hence the average Purity is substantiallyincreased. In summary, the cheat system produces a clustering which is useless, butgets a high score.
Let us see the results when using BCubed metrics. BCubed Recall behavessimilarly to Inverse Purity, ranking the cheat system in first position. BCubedPrecision, however, does not behave as Purity. In this case, the cheat system goesdown to the end of the ranking. The reason here is that BCubed computes theprecision of items rather than the precision of clusters. In the cheat system output,all items are duplicated and inserted into a single cluster, increasing the number ofclusters. Therefore, the clustering solution provides more information than required,and the overall BCubed precision of the distribution is dramatically reduced (seeSection 4.4.2). On the other hand, the BCubed recall slightly decreases (0.99)because the multiplicity of a few items belonging to more than two categories is notcovered by the cheat system.
We just compare our proposed BCubed extension to Purity/Inverse Purity be-cause, besides being the official measures used at WePS-1, they can be directlyapplied to overlapped clusters without modification. This is not possible with othermetric families, such as metrics based on counting pairs (what is now a right/wrongpair?) entropy-based metrics or step editing metrics (which need new steps forduplicating items and removing duplicates). All that metrics need to be redefinedbefore being applied to overlapping clustering problems.
4.5 Conclusions
In this chapter, we have analysed extrinsic clustering evaluation metrics from a Constraintsformal perspective, proposing a set of formal constraints that a good evaluationmetric should satisfy in a generic clustering problem. Four constraints have beenproposed. These correspond with basic intuitions about the quality features of aclustering solution. We have also compared our constraints with other related works,in order to check that they cover the basic features proposed in previous relatedresearch.
A practical conclusion of our work is that the combination of BCubed precision BCubed precision andrecalland recall metrics is the only one that is able to satisfy all constraints (for non-
overlapping clustering). We take this result as a recommendation to use BCubed
4The clustering is represented as follows: (i) elements in the clustering are identified by thenumbers, (ii) the coloured circles indicate to which class each element belongs in the gold standard(iii) more than one coloured circle next to an element means that the element belongs to multipleclasses in the gold standard
96Comparison of Extrinsic Clustering Evaluation Metrics Based on Formal
Constraints
metrics for generic clustering problems. Tt must be noted, however, that in generalterms there is a wide range of clustering applications. For certain specific applica-tions, some of the constraints may not apply, and new constraints may appear, whichcould make other metrics more suitable in those cases. Some recommendationsapply:
• If the system quality is determined by the most representative cluster for eachcategory, metrics based on matching between clusters and categories can beappropriate (e.g. Purity and Inverse Purity). However, we have to take intoaccount that these metrics do not always detect small improvements in theclustering distribution, and that they might have negative implications in thesystem evaluation/refinement cycles.
• If the system quality is not determined by the most representative clusterfor each category, other metric families based on entropy, editing distances,counting pairs, etc. would be more appropriate.
• If the system developer wants to avoid the quadratic effect over cluster sizes(related to our fourth formal constraint), we recommend to avoid using metricsbased on counting pairs. Instead of this, the developer may use entropy-basedmetrics, editing distances or BCubed metrics.
• In addition to that, if the developer does not want to penalise merging unre-lated items in a “rag bag” (“other” or “miscellaneous” cluster), then the onlyrecommendable choice is BCubed metrics.
We have also examined the case of overlapping clustering in WePS, where anOverlapping clusteringitem can belong to more than one category at once. Most evaluation metrics are notprepared to deal with cluster overlaps and its definition must be extended to handlethem. An exception is Purity and Inverse Purity, which can be applied directly, butwhich fail to satisfy a very simple constraint that we introduce specifically to handleoverlapping clustering. We have then focused on BCubed metrics, proposing anintuitive extension of BCubed precision and recall that handles overlaps, and thatbecomes the original BCubed metrics in the absence of overlapping.
We have tested the metrics using the clustering testbed from the WePS-1 com-petitive evaluation task, in which Purity and Inverse Purity (combined via VanRijsbergen’s F) were used for the official system scores. A cheating solution, whichreceives an unreasonably high F score (rank 2 in the testbed), is detected by theextended BCubed metrics, which sends the cheating solution to the last position inthe ranking.
Chapter 5
Combining Evaluation Metricsvia the Unanimous ImprovementRatio
In the previous chapter we have studied different extrinsic clustering quality metrics.We also presented the problems of evaluating overlapping clustering and ultimatelyproposed an extension of the BCubed that tackles this problem. The second questionthat was raised at the end of the WePS-1 campaign was how the combination ofmetrics affects the ranking of systems in this task. Specifically, we observed that abaseline system (ONE-IN-ONE) is ranked above many participants, but this baselinecan be ranked much lower just by modifying the metrics combination weight. In thischapter we study this problem and propose a complementary evaluation method.
There exists a wide set of extrinsic clustering quality metrics, but all of them aregrounded on two dimensions: (i) to what extent items in the same cluster also belongto the same group in the gold standard; and (ii) to what extent items in differentclusters also belong to different groups in the gold standard. We have revieweda wide set of extrinsic metrics in the previous chapter: Entropy and class entropy[SKK00, Gho03], Purity and Inverse Purity [ZK01], BCubed Precision and Recallmetrics [BB98b], metrics based on counting pairs [HBV01, Mei03], etc.1 In orderto evaluate systems, metrics are usually combined according to Van Rijsbergen’s Ffunction [Rij74]:
Fα(A,B) = A ∗B/(α ∗R+ (1− α) ∗ P )
where the α parameter allows to assign a relative weight to each metric. Afterstating the α value, the system improvements according to F are checked by meansof statistical significant tests over test cases.
Our research goals are:
1. To verify to what extent the clustering evaluation results can be biased bythe assigned metric weighting (i.e. the value for α), even when detected
1See [AGAV08] for a detailed overview.
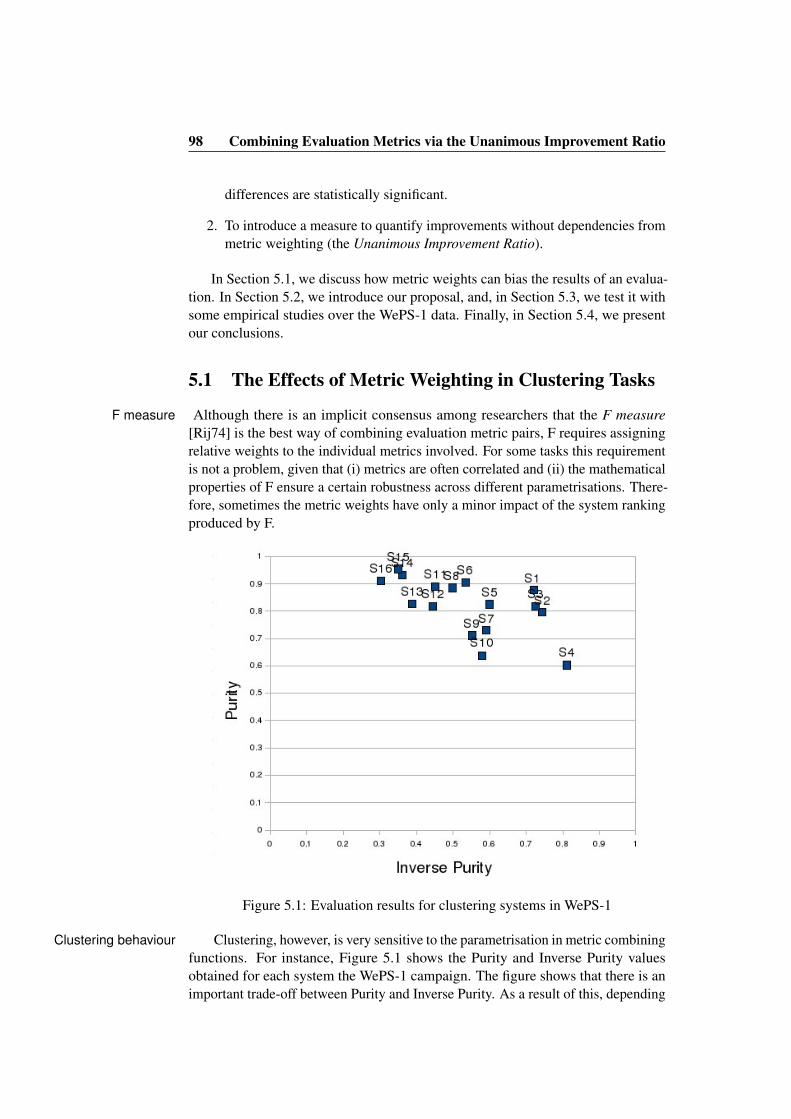
98 Combining Evaluation Metrics via the Unanimous Improvement Ratio
differences are statistically significant.
2. To introduce a measure to quantify improvements without dependencies frommetric weighting (the Unanimous Improvement Ratio).
In Section 5.1, we discuss how metric weights can bias the results of an evalua-tion. In Section 5.2, we introduce our proposal, and, in Section 5.3, we test it withsome empirical studies over the WePS-1 data. Finally, in Section 5.4, we presentour conclusions.
5.1 The Effects of Metric Weighting in Clustering Tasks
Although there is an implicit consensus among researchers that the F measureF measure[Rij74] is the best way of combining evaluation metric pairs, F requires assigningrelative weights to the individual metrics involved. For some tasks this requirementis not a problem, given that (i) metrics are often correlated and (ii) the mathematicalproperties of F ensure a certain robustness across different parametrisations. There-fore, sometimes the metric weights have only a minor impact of the system rankingproduced by F.
Figure 5.1: Evaluation results for clustering systems in WePS-1
Clustering, however, is very sensitive to the parametrisation in metric combiningClustering behaviourfunctions. For instance, Figure 5.1 shows the Purity and Inverse Purity valuesobtained for each system the WePS-1 campaign. The figure shows that there is animportant trade-off between Purity and Inverse Purity. As a result of this, depending
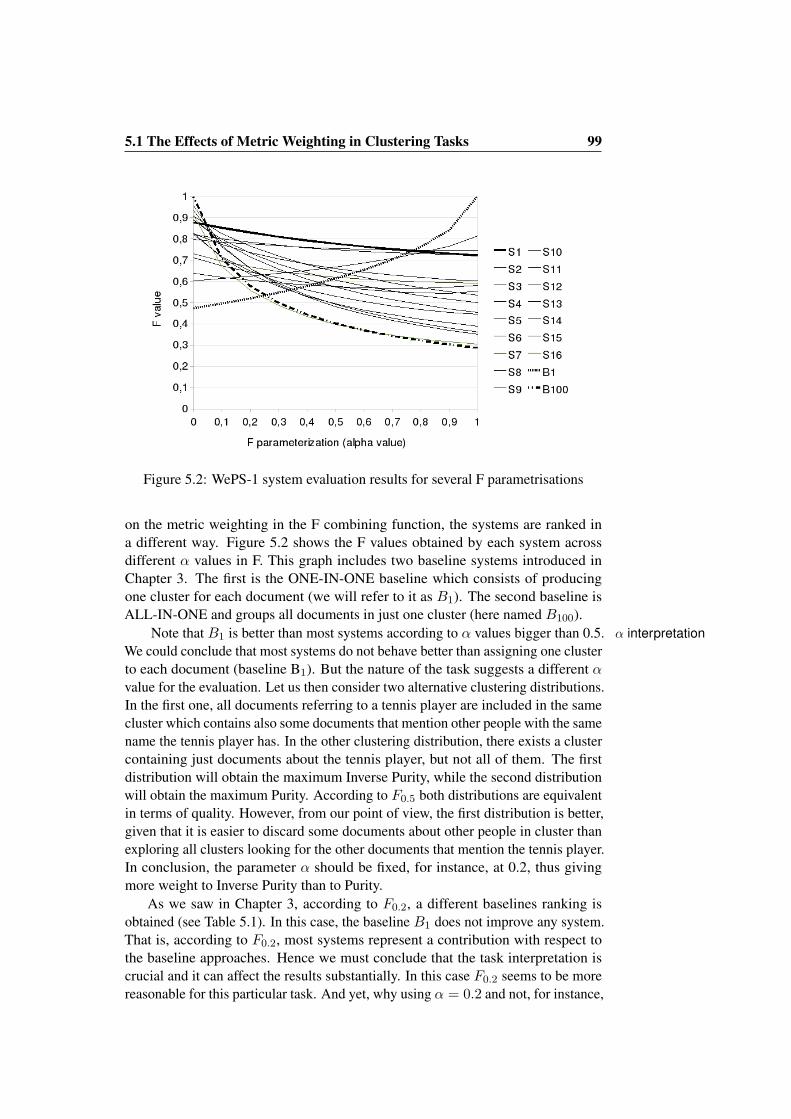
5.1 The Effects of Metric Weighting in Clustering Tasks 99
Figure 5.2: WePS-1 system evaluation results for several F parametrisations
on the metric weighting in the F combining function, the systems are ranked ina different way. Figure 5.2 shows the F values obtained by each system acrossdifferent α values in F. This graph includes two baseline systems introduced inChapter 3. The first is the ONE-IN-ONE baseline which consists of producingone cluster for each document (we will refer to it as B1). The second baseline isALL-IN-ONE and groups all documents in just one cluster (here named B100).
Note that B1 is better than most systems according to α values bigger than 0.5. α interpretationWe could conclude that most systems do not behave better than assigning one clusterto each document (baseline B1). But the nature of the task suggests a different αvalue for the evaluation. Let us then consider two alternative clustering distributions.In the first one, all documents referring to a tennis player are included in the samecluster which contains also some documents that mention other people with the samename the tennis player has. In the other clustering distribution, there exists a clustercontaining just documents about the tennis player, but not all of them. The firstdistribution will obtain the maximum Inverse Purity, while the second distributionwill obtain the maximum Purity. According to F0.5 both distributions are equivalentin terms of quality. However, from our point of view, the first distribution is better,given that it is easier to discard some documents about other people in cluster thanexploring all clusters looking for the other documents that mention the tennis player.In conclusion, the parameter α should be fixed, for instance, at 0.2, thus givingmore weight to Inverse Purity than to Purity.
As we saw in Chapter 3, according to F0.2, a different baselines ranking isobtained (see Table 5.1). In this case, the baseline B1 does not improve any system.That is, according to F0.2, most systems represent a contribution with respect tothe baseline approaches. Hence we must conclude that the task interpretation iscrucial and it can affect the results substantially. In this case F0.2 seems to be morereasonable for this particular task. And yet, why using α = 0.2 and not, for instance,
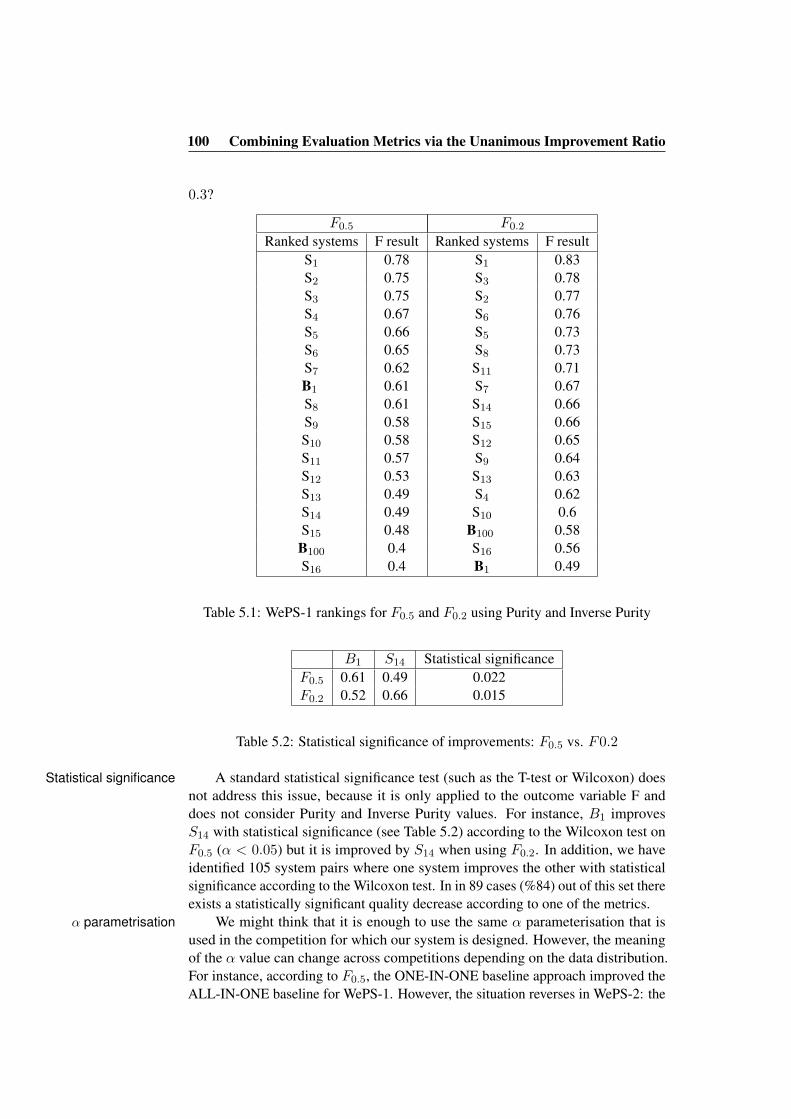
100 Combining Evaluation Metrics via the Unanimous Improvement Ratio
0.3?
F0.5 F0.2
Ranked systems F result Ranked systems F resultS1 0.78 S1 0.83S2 0.75 S3 0.78S3 0.75 S2 0.77S4 0.67 S6 0.76S5 0.66 S5 0.73S6 0.65 S8 0.73S7 0.62 S11 0.71B1 0.61 S7 0.67S8 0.61 S14 0.66S9 0.58 S15 0.66S10 0.58 S12 0.65S11 0.57 S9 0.64S12 0.53 S13 0.63S13 0.49 S4 0.62S14 0.49 S10 0.6S15 0.48 B100 0.58B100 0.4 S16 0.56S16 0.4 B1 0.49
Table 5.1: WePS-1 rankings for F0.5 and F0.2 using Purity and Inverse Purity
B1 S14 Statistical significanceF0.5 0.61 0.49 0.022F0.2 0.52 0.66 0.015
Table 5.2: Statistical significance of improvements: F0.5 vs. F0.2
A standard statistical significance test (such as the T-test or Wilcoxon) doesStatistical significancenot address this issue, because it is only applied to the outcome variable F anddoes not consider Purity and Inverse Purity values. For instance, B1 improvesS14 with statistical significance (see Table 5.2) according to the Wilcoxon test onF0.5 (α < 0.05) but it is improved by S14 when using F0.2. In addition, we haveidentified 105 system pairs where one system improves the other with statisticalsignificance according to the Wilcoxon test. In in 89 cases (%84) out of this set thereexists a statistically significant quality decrease according to one of the metrics.
We might think that it is enough to use the same α parameterisation that isα parametrisationused in the competition for which our system is designed. However, the meaningof the α value can change across competitions depending on the data distribution.For instance, according to F0.5, the ONE-IN-ONE baseline approach improved theALL-IN-ONE baseline for WePS-1. However, the situation reverses in WePS-2: the
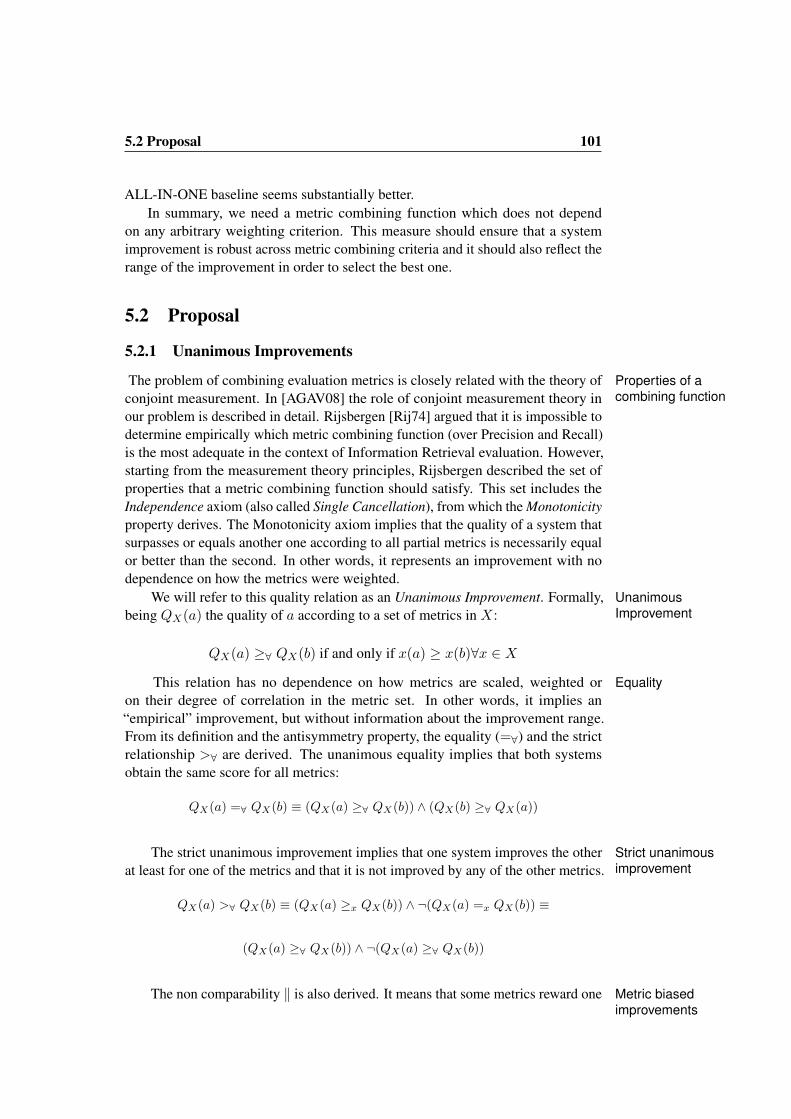
5.2 Proposal 101
ALL-IN-ONE baseline seems substantially better.In summary, we need a metric combining function which does not depend
on any arbitrary weighting criterion. This measure should ensure that a systemimprovement is robust across metric combining criteria and it should also reflect therange of the improvement in order to select the best one.
5.2 Proposal
5.2.1 Unanimous Improvements
The problem of combining evaluation metrics is closely related with the theory of Properties of acombining functionconjoint measurement. In [AGAV08] the role of conjoint measurement theory in
our problem is described in detail. Rijsbergen [Rij74] argued that it is impossible todetermine empirically which metric combining function (over Precision and Recall)is the most adequate in the context of Information Retrieval evaluation. However,starting from the measurement theory principles, Rijsbergen described the set ofproperties that a metric combining function should satisfy. This set includes theIndependence axiom (also called Single Cancellation), from which the Monotonicityproperty derives. The Monotonicity axiom implies that the quality of a system thatsurpasses or equals another one according to all partial metrics is necessarily equalor better than the second. In other words, it represents an improvement with nodependence on how the metrics were weighted.
We will refer to this quality relation as an Unanimous Improvement. Formally, UnanimousImprovementbeing QX(a) the quality of a according to a set of metrics in X:
QX(a) ≥∀ QX(b) if and only if x(a) ≥ x(b)∀x ∈ X
This relation has no dependence on how metrics are scaled, weighted or Equalityon their degree of correlation in the metric set. In other words, it implies an“empirical” improvement, but without information about the improvement range.From its definition and the antisymmetry property, the equality (=∀) and the strictrelationship >∀ are derived. The unanimous equality implies that both systemsobtain the same score for all metrics:
QX(a) =∀ QX(b) ≡ (QX(a) ≥∀ QX(b)) ∧ (QX(b) ≥∀ QX(a))
The strict unanimous improvement implies that one system improves the other Strict unanimousimprovementat least for one of the metrics and that it is not improved by any of the other metrics.
QX(a) >∀ QX(b) ≡ (QX(a) ≥x QX(b)) ∧ ¬(QX(a) =x QX(b)) ≡
(QX(a) ≥∀ QX(b)) ∧ ¬(QX(a) ≥∀ QX(b))
The non comparability ‖ is also derived. It means that some metrics reward one Metric biasedimprovements
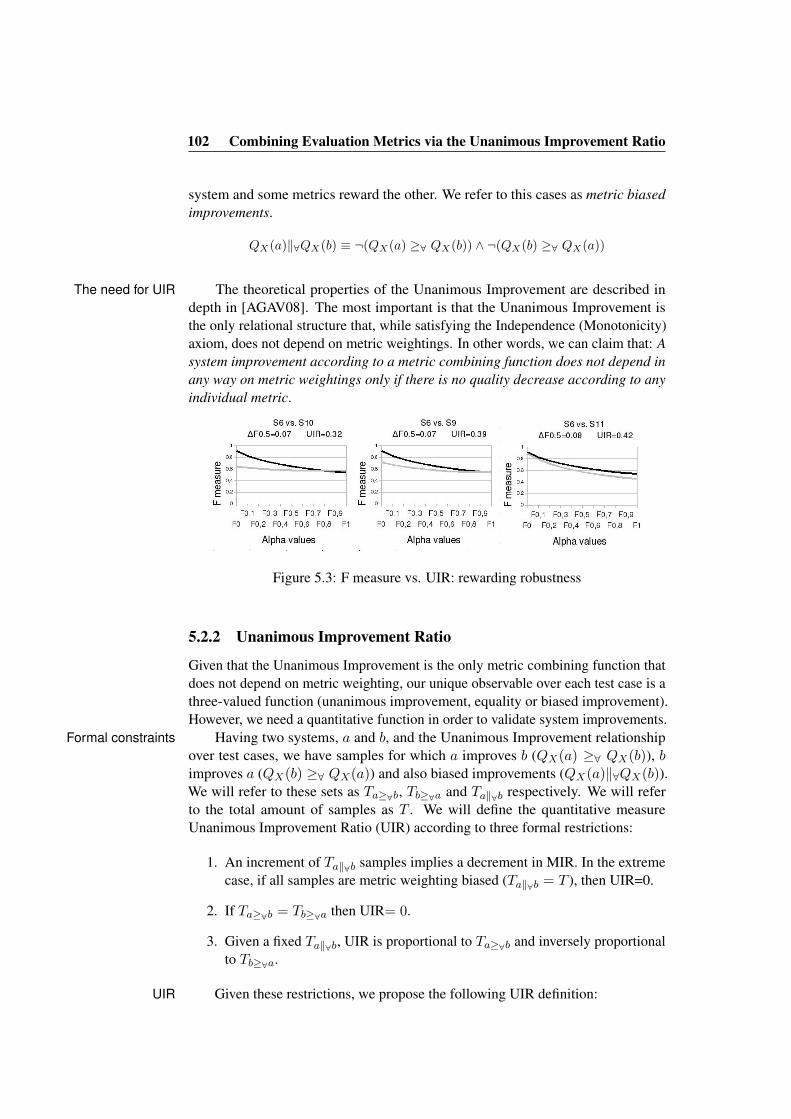
102 Combining Evaluation Metrics via the Unanimous Improvement Ratio
system and some metrics reward the other. We refer to this cases as metric biasedimprovements.
QX(a)‖∀QX(b) ≡ ¬(QX(a) ≥∀ QX(b)) ∧ ¬(QX(b) ≥∀ QX(a))
The theoretical properties of the Unanimous Improvement are described inThe need for UIRdepth in [AGAV08]. The most important is that the Unanimous Improvement isthe only relational structure that, while satisfying the Independence (Monotonicity)axiom, does not depend on metric weightings. In other words, we can claim that: Asystem improvement according to a metric combining function does not depend inany way on metric weightings only if there is no quality decrease according to anyindividual metric.
Figure 5.3: F measure vs. UIR: rewarding robustness
5.2.2 Unanimous Improvement Ratio
Given that the Unanimous Improvement is the only metric combining function thatdoes not depend on metric weighting, our unique observable over each test case is athree-valued function (unanimous improvement, equality or biased improvement).However, we need a quantitative function in order to validate system improvements.
Having two systems, a and b, and the Unanimous Improvement relationshipFormal constraintsover test cases, we have samples for which a improves b (QX(a) ≥∀ QX(b)), bimproves a (QX(b) ≥∀ QX(a)) and also biased improvements (QX(a)‖∀QX(b)).We will refer to these sets as Ta≥∀b, Tb≥∀a and Ta‖∀b respectively. We will referto the total amount of samples as T . We will define the quantitative measureUnanimous Improvement Ratio (UIR) according to three formal restrictions:
1. An increment of Ta‖∀b samples implies a decrement in MIR. In the extremecase, if all samples are metric weighting biased (Ta‖∀b = T ), then UIR=0.
2. If Ta≥∀b = Tb≥∀a then UIR= 0.
3. Given a fixed Ta‖∀b, UIR is proportional to Ta≥∀b and inversely proportionalto Tb≥∀a.
Given these restrictions, we propose the following UIR definition:UIR
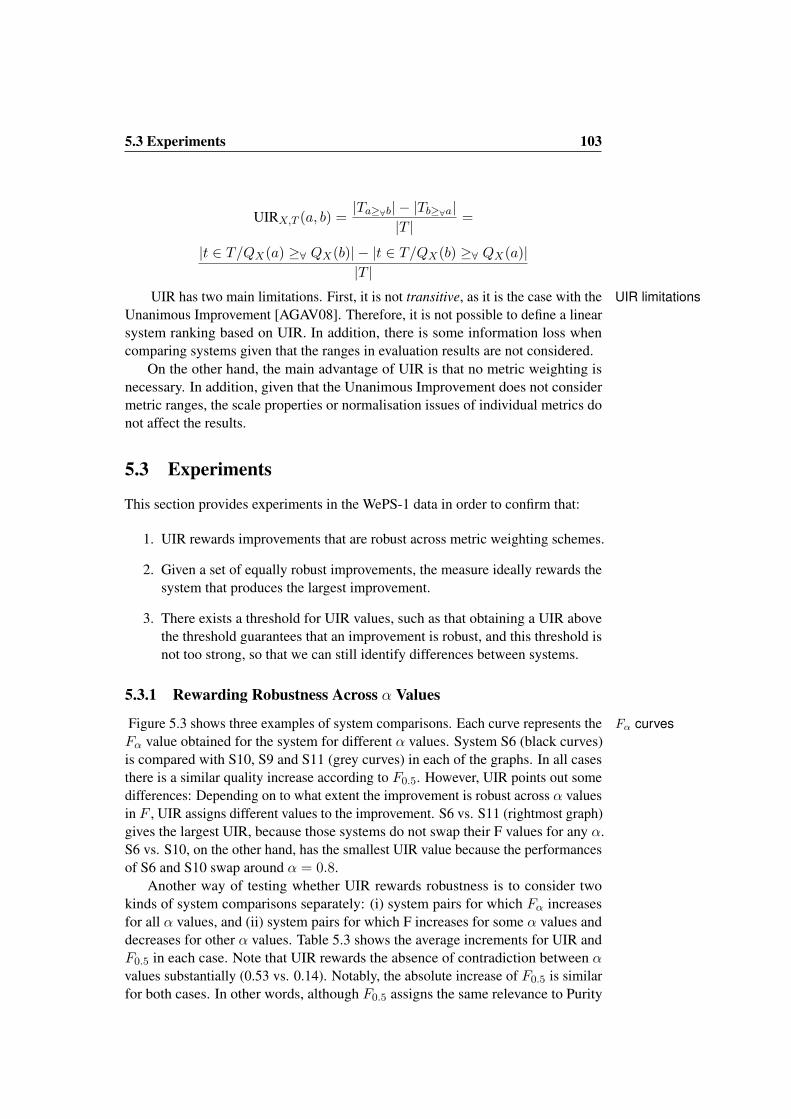
5.3 Experiments 103
UIRX,T (a, b) =|Ta≥∀b| − |Tb≥∀a|
|T |=
|t ∈ T/QX(a) ≥∀ QX(b)| − |t ∈ T/QX(b) ≥∀ QX(a)||T |
UIR has two main limitations. First, it is not transitive, as it is the case with the UIR limitationsUnanimous Improvement [AGAV08]. Therefore, it is not possible to define a linearsystem ranking based on UIR. In addition, there is some information loss whencomparing systems given that the ranges in evaluation results are not considered.
On the other hand, the main advantage of UIR is that no metric weighting isnecessary. In addition, given that the Unanimous Improvement does not considermetric ranges, the scale properties or normalisation issues of individual metrics donot affect the results.
5.3 Experiments
This section provides experiments in the WePS-1 data in order to confirm that:
1. UIR rewards improvements that are robust across metric weighting schemes.
2. Given a set of equally robust improvements, the measure ideally rewards thesystem that produces the largest improvement.
3. There exists a threshold for UIR values, such as that obtaining a UIR abovethe threshold guarantees that an improvement is robust, and this threshold isnot too strong, so that we can still identify differences between systems.
5.3.1 Rewarding Robustness Across α Values
Figure 5.3 shows three examples of system comparisons. Each curve represents the Fα curvesFα value obtained for the system for different α values. System S6 (black curves)is compared with S10, S9 and S11 (grey curves) in each of the graphs. In all casesthere is a similar quality increase according to F0.5. However, UIR points out somedifferences: Depending on to what extent the improvement is robust across α valuesin F , UIR assigns different values to the improvement. S6 vs. S11 (rightmost graph)gives the largest UIR, because those systems do not swap their F values for any α.S6 vs. S10, on the other hand, has the smallest UIR value because the performancesof S6 and S10 swap around α = 0.8.
Another way of testing whether UIR rewards robustness is to consider twokinds of system comparisons separately: (i) system pairs for which Fα increasesfor all α values, and (ii) system pairs for which F increases for some α values anddecreases for other α values. Table 5.3 shows the average increments for UIR andF0.5 in each case. Note that UIR rewards the absence of contradiction between αvalues substantially (0.53 vs. 0.14). Notably, the absolute increase of F0.5 is similarfor both cases. In other words, although F0.5 assigns the same relevance to Purity
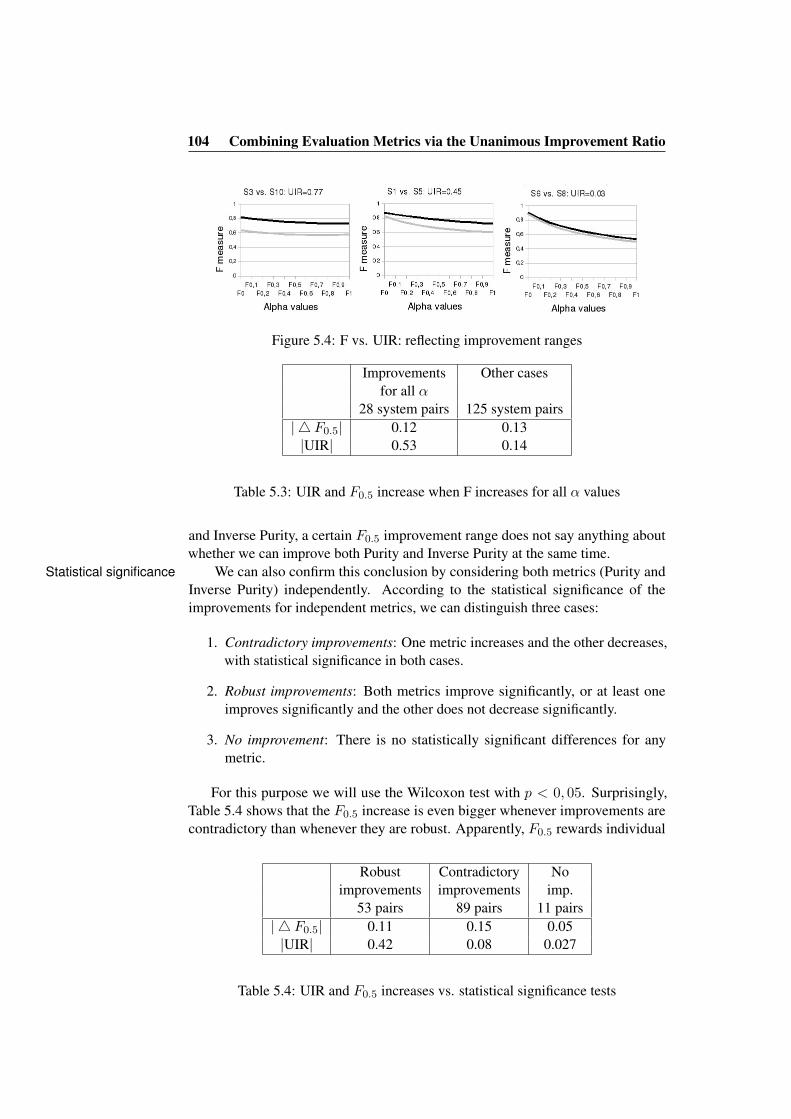
104 Combining Evaluation Metrics via the Unanimous Improvement Ratio
Figure 5.4: F vs. UIR: reflecting improvement ranges
Improvements Other casesfor all α
28 system pairs 125 system pairs| 4 F0.5| 0.12 0.13|UIR| 0.53 0.14
Table 5.3: UIR and F0.5 increase when F increases for all α values
and Inverse Purity, a certain F0.5 improvement range does not say anything aboutwhether we can improve both Purity and Inverse Purity at the same time.
We can also confirm this conclusion by considering both metrics (Purity andStatistical significanceInverse Purity) independently. According to the statistical significance of theimprovements for independent metrics, we can distinguish three cases:
1. Contradictory improvements: One metric increases and the other decreases,with statistical significance in both cases.
2. Robust improvements: Both metrics improve significantly, or at least oneimproves significantly and the other does not decrease significantly.
3. No improvement: There is no statistically significant differences for anymetric.
For this purpose we will use the Wilcoxon test with p < 0, 05. Surprisingly,Table 5.4 shows that the F0.5 increase is even bigger whenever improvements arecontradictory than whenever they are robust. Apparently, F0.5 rewards individual
Robust Contradictory Noimprovements improvements imp.
53 pairs 89 pairs 11 pairs| 4 F0.5| 0.11 0.15 0.05|UIR| 0.42 0.08 0.027
Table 5.4: UIR and F0.5 increases vs. statistical significance tests
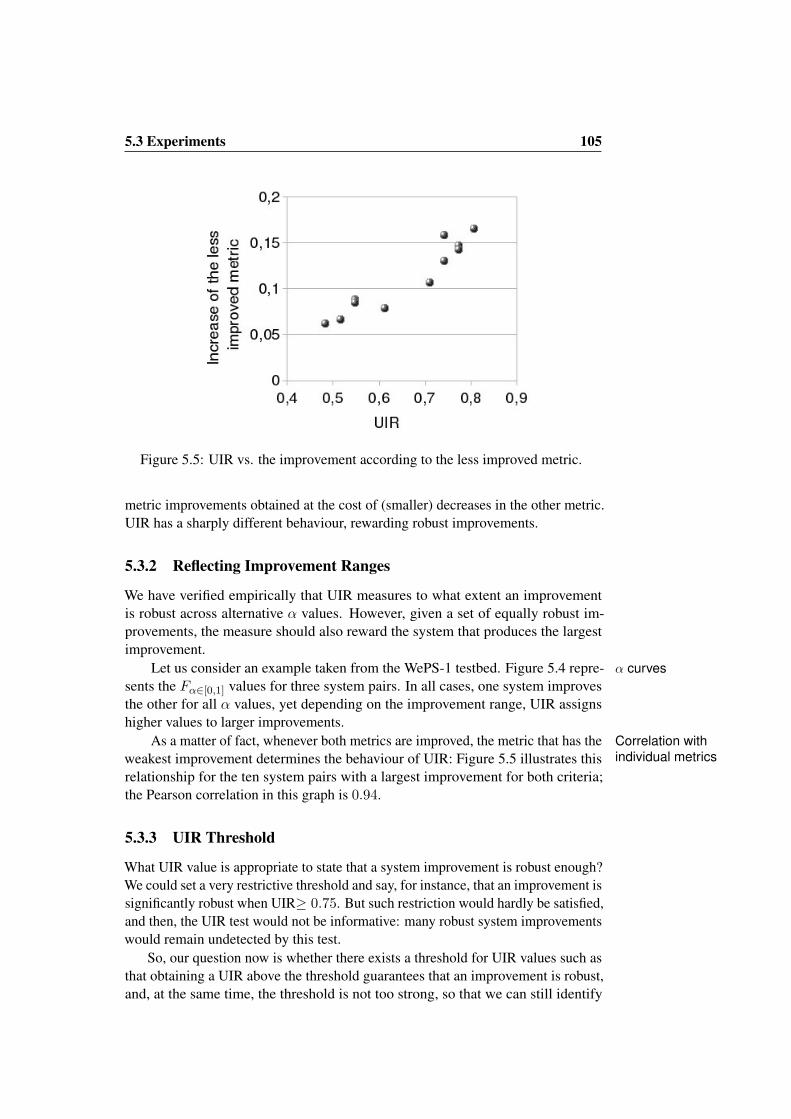
5.3 Experiments 105
Figure 5.5: UIR vs. the improvement according to the less improved metric.
metric improvements obtained at the cost of (smaller) decreases in the other metric.UIR has a sharply different behaviour, rewarding robust improvements.
5.3.2 Reflecting Improvement Ranges
We have verified empirically that UIR measures to what extent an improvementis robust across alternative α values. However, given a set of equally robust im-provements, the measure should also reward the system that produces the largestimprovement.
Let us consider an example taken from the WePS-1 testbed. Figure 5.4 repre- α curvessents the Fα∈[0,1] values for three system pairs. In all cases, one system improvesthe other for all α values, yet depending on the improvement range, UIR assignshigher values to larger improvements.
As a matter of fact, whenever both metrics are improved, the metric that has the Correlation withindividual metricsweakest improvement determines the behaviour of UIR: Figure 5.5 illustrates this
relationship for the ten system pairs with a largest improvement for both criteria;the Pearson correlation in this graph is 0.94.
5.3.3 UIR Threshold
What UIR value is appropriate to state that a system improvement is robust enough?We could set a very restrictive threshold and say, for instance, that an improvement issignificantly robust when UIR≥ 0.75. But such restriction would hardly be satisfied,and then, the UIR test would not be informative: many robust system improvementswould remain undetected by this test.
So, our question now is whether there exists a threshold for UIR values such asthat obtaining a UIR above the threshold guarantees that an improvement is robust,and, at the same time, the threshold is not too strong, so that we can still identify
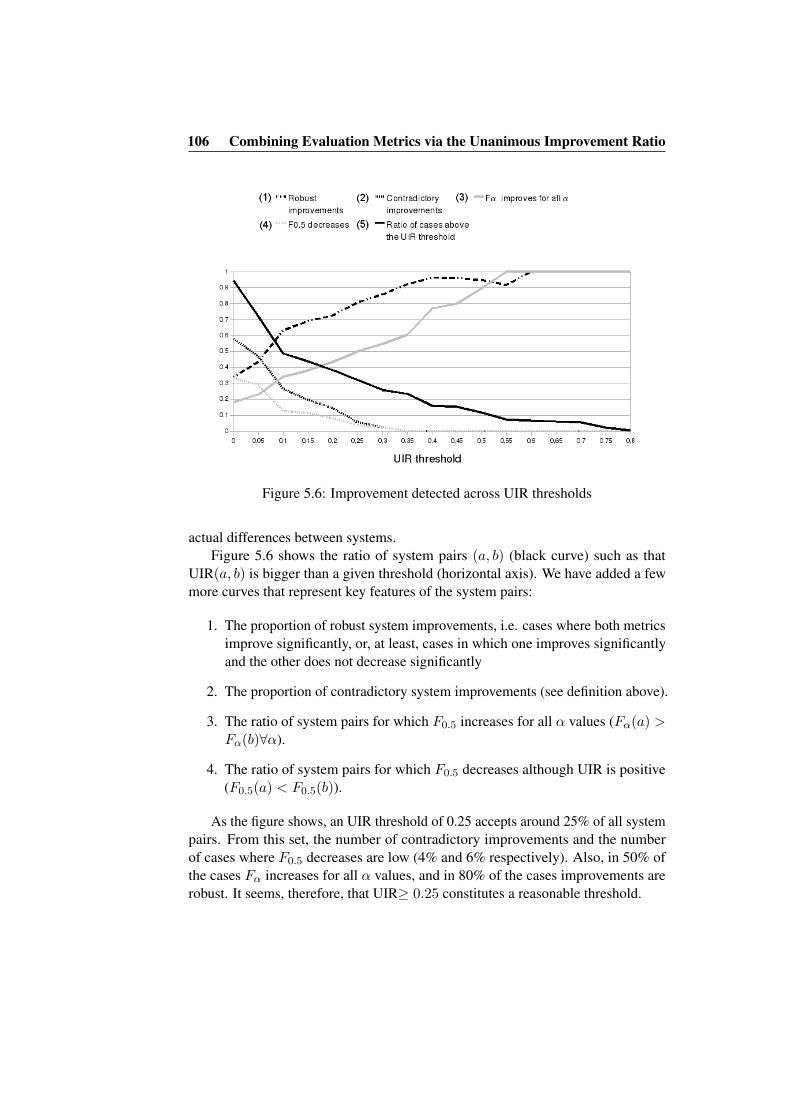
106 Combining Evaluation Metrics via the Unanimous Improvement Ratio
Figure 5.6: Improvement detected across UIR thresholds
actual differences between systems.Figure 5.6 shows the ratio of system pairs (a, b) (black curve) such as that
UIR(a, b) is bigger than a given threshold (horizontal axis). We have added a fewmore curves that represent key features of the system pairs:
1. The proportion of robust system improvements, i.e. cases where both metricsimprove significantly, or, at least, cases in which one improves significantlyand the other does not decrease significantly
2. The proportion of contradictory system improvements (see definition above).
3. The ratio of system pairs for which F0.5 increases for all α values (Fα(a) >Fα(b)∀α).
4. The ratio of system pairs for which F0.5 decreases although UIR is positive(F0.5(a) < F0.5(b)).
As the figure shows, an UIR threshold of 0.25 accepts around 25% of all systempairs. From this set, the number of contradictory improvements and the numberof cases where F0.5 decreases are low (4% and 6% respectively). Also, in 50% ofthe cases Fα increases for all α values, and in 80% of the cases improvements arerobust. It seems, therefore, that UIR≥ 0.25 constitutes a reasonable threshold.
5.4 Conclusions 107
5.4 Conclusions
The analysis we have described in this chapter shows that the comparison of systemsin clustering tasks is highly sensitive to the way of combining evaluation metrics.The UIR measure presented in this chapter allows us to combine evaluation metricswithout assigning a relative weight to each metrics, and the empirical analysis hasshowed that UIR rewards robust improvements with respect to different metricweights.
UIR can be exploited in two ways. First, according to the UIR≥ 0.25 thresholdthat was inferred from our empirical study, UIR is able to test the robustness ofsystem improvements in shared tasks (such as the WePS clustering task). Second,given that UIR provides quantitative values, it is an alternative way of selecting thebest approach during system training processes.
In the next chapter, we will test the UIR method on the results of the secondWePS campaign.

108 Combining Evaluation Metrics via the Unanimous Improvement Ratio

Chapter 6
The WePS-2 Campaign
While designing the second WePS evaluation campaign we took into accountboth the experience acquired in WePS-1 and the studies on evaluation metricsdescribed in the previous chapters. During the campaign we introduced the followingimprovements: the use of a robust clustering evaluation metric (extended BCubed);the application of a complementary results analysis (Unanimous ImprovementRatio); a more cost-effective method for the creation of the testbed; and a newattribute extraction task [SA09].
In WePS-2, 19 research teams from over the world took part in either or bothof the following tasks: (i) clustering web pages to solve the ambiguity of searchresults, and (ii) extracting 18 kinds of attribute values for target individuals whosenames appear on a set of web pages.
In this chapter, we present an overview of the WePS 2 clustering task, including:a description of the datasets (Section 6.1), the methodology to produce our goldstandard, the evaluation methodology (Section 6.2) and the campaign design. Wealso provide an overview of the participating systems in Section 6.3. The results ofthe evaluation are presented and discussed in Section 6.4, and we finish with someconcluding remarks in Section 6.5.
6.1 Testbed
The data distributed to participants was divided in development and test data.
6.1.1 Development Data
This data was handed to participants so that they could develop and test theirsystems before processing the evaluation test set. The development data consists ofthe corpora and clustering gold standard previously used for the WePS-1 campaign(Chapter 3), and it was built basically with the same methodology used in WePS-2.The WePS-1 data includes 47 ambiguous names and up to 100 manually clusteredsearch results for each name. The number of clusters per name has a large variability(from 1 up to 91 different people sharing the same name) even for the 10 namesextracted from Wikipedia biographies. Once again, we assumed that names with a
110 The WePS-2 Campaign
Wikipedia entry would be less ambiguous (because a celebrity tends to monopolisesearch results), but our Wikipedia names had an average of 23 clusters per name inthe WePS-1 training data and twice this amount in the WePS-1 test data. Note thataverage ambiguity is not very informative for this task, because it does not seem tofollow a binomial distribution: a name corresponding with just two people seems aslikely to occur as a name with 30 or a name with 90.
Additionally, this data includes the Web03 corpus [Man06] which features amore diverse number of documents for each name and a lower average ambiguity.
6.1.2 Test Data
The WePS-2 test data consists of 30 datasets (Table 6.1), each one correspondingName sourcesto a certain ambiguous name. As in WePS-1, three different sources were used toobtain the names:
Wikipedia. Ten names were randomly sampled from the list of biographies inthe English version of Wikipedia. In this occasion, unlike the WePS-1 dataset, ourhypothesis of lower ambiguity for names in the Wikipedia has a correspondencewith the data: as we can see from the results of the manual annotation (Table 6.1),six out of these ten datasets, contain less than ten different people, and three aredominated by only one person.
ACL’08. Another ten names where randomly extracted from the list of Pro-gramme Committee members for the annual meeting of the Association for Com-putational Linguistics (ACL’08). These cases present a different type of ambiguityscenario, in which we know in advance that at least someone of the people mentionedshould be a Computer Science scholar.
US Census. Using the lists of first and last names in the 1990 US Census1 data,we composed 10 random names. In order to avoid extremely rare or inexistent namecombinations, we weighted the probability of choosing a name according to itsfrequency in the Census. The result is a set of fairly ambiguous names, with anaverage of 30 different people mentioned in each dataset.
We obtained the top 150 search results for each name from an Internet searchSearch resultsengine2 (using the name as a quoted query and searching only for pages written inEnglish). All the information obtained from the search results (snippets, positionin the ranking, document title, original URL) was stored and distributed to theparticipants as part of the datasets.
Some web pages from the search results were not included in the final corpus.Documents filteringIn some cases, pages could not be downloaded or were not available at the time thecorpus was created. We also filtered out documents that did not contain at least oneoccurrence of the person name. Finally, in order to simplify the preprocessing taskfor participants, only HTML pages were included in the datasets.
1http://www.census.gov/genealogy/names/2We used the Web Search Service API provided by Yahoo! (http://developer.yahoo.com/search/)
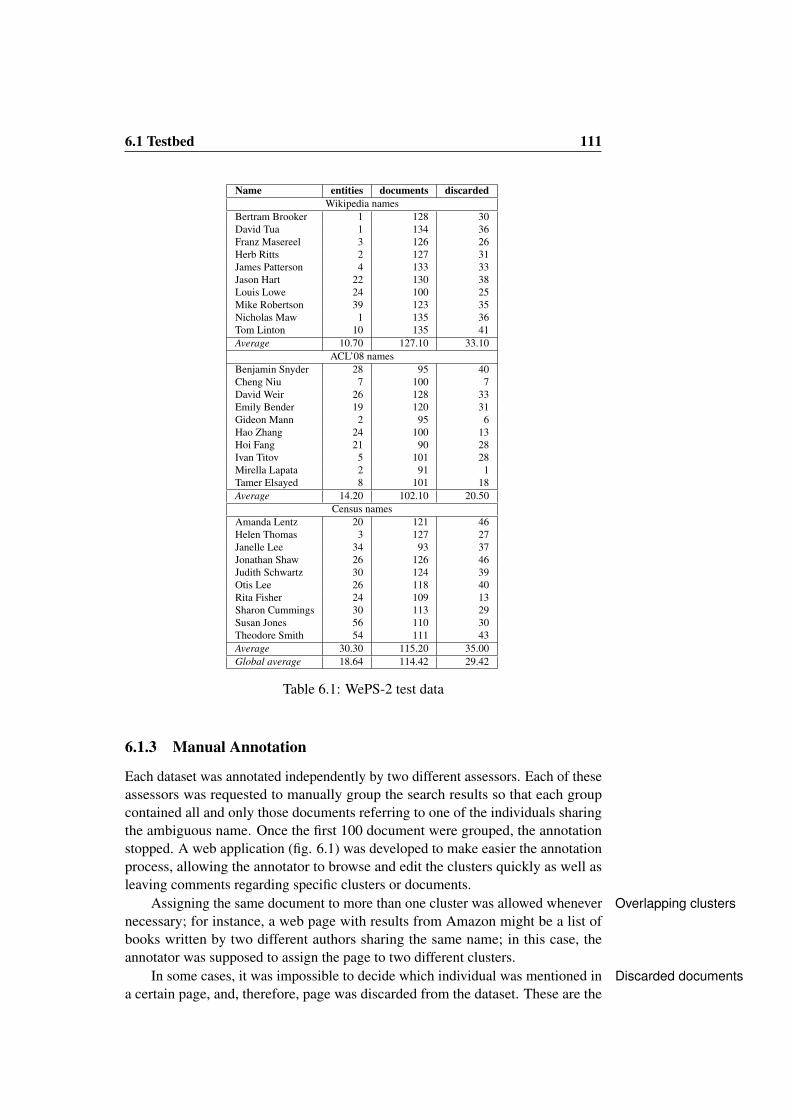
6.1 Testbed 111
Name entities documents discardedWikipedia names
Bertram Brooker 1 128 30David Tua 1 134 36Franz Masereel 3 126 26Herb Ritts 2 127 31James Patterson 4 133 33Jason Hart 22 130 38Louis Lowe 24 100 25Mike Robertson 39 123 35Nicholas Maw 1 135 36Tom Linton 10 135 41Average 10.70 127.10 33.10
ACL’08 namesBenjamin Snyder 28 95 40Cheng Niu 7 100 7David Weir 26 128 33Emily Bender 19 120 31Gideon Mann 2 95 6Hao Zhang 24 100 13Hoi Fang 21 90 28Ivan Titov 5 101 28Mirella Lapata 2 91 1Tamer Elsayed 8 101 18Average 14.20 102.10 20.50
Census namesAmanda Lentz 20 121 46Helen Thomas 3 127 27Janelle Lee 34 93 37Jonathan Shaw 26 126 46Judith Schwartz 30 124 39Otis Lee 26 118 40Rita Fisher 24 109 13Sharon Cummings 30 113 29Susan Jones 56 110 30Theodore Smith 54 111 43Average 30.30 115.20 35.00Global average 18.64 114.42 29.42
Table 6.1: WePS-2 test data
6.1.3 Manual Annotation
Each dataset was annotated independently by two different assessors. Each of theseassessors was requested to manually group the search results so that each groupcontained all and only those documents referring to one of the individuals sharingthe ambiguous name. Once the first 100 document were grouped, the annotationstopped. A web application (fig. 6.1) was developed to make easier the annotationprocess, allowing the annotator to browse and edit the clusters quickly as well asleaving comments regarding specific clusters or documents.
Assigning the same document to more than one cluster was allowed whenever Overlapping clustersnecessary; for instance, a web page with results from Amazon might be a list ofbooks written by two different authors sharing the same name; in this case, theannotator was supposed to assign the page to two different clusters.
In some cases, it was impossible to decide which individual was mentioned in Discarded documentsa certain page, and, therefore, page was discarded from the dataset. These are the
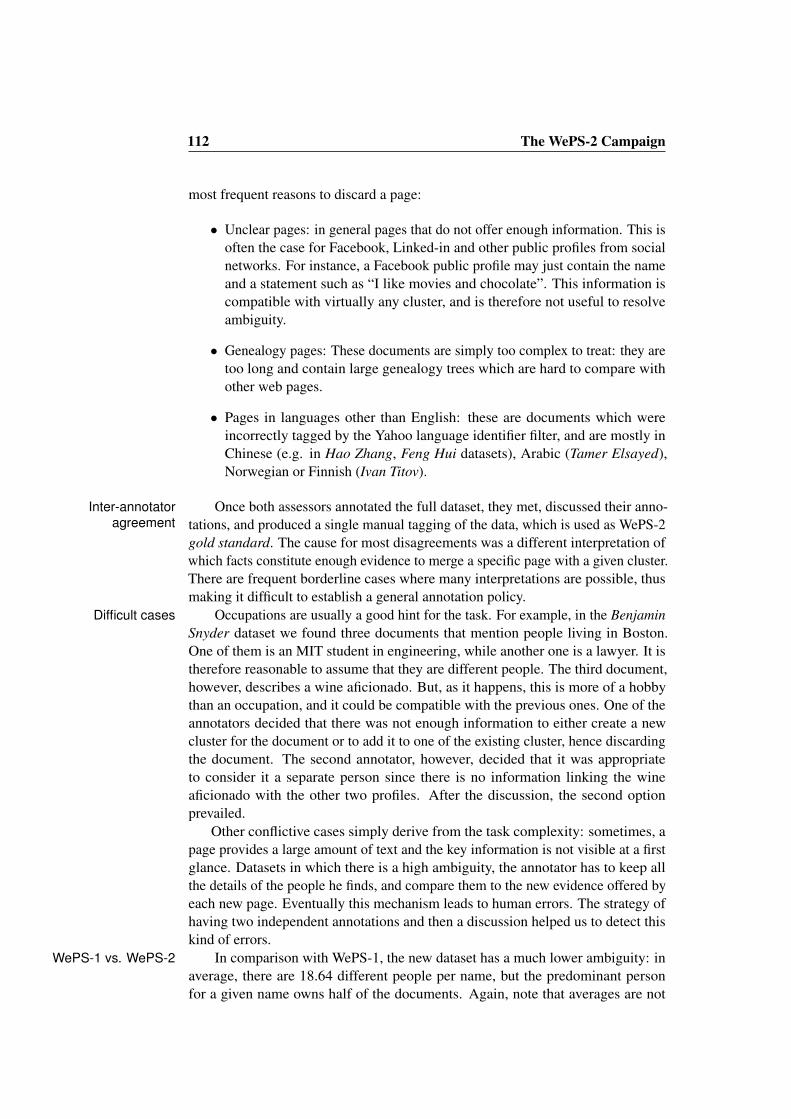
112 The WePS-2 Campaign
most frequent reasons to discard a page:
• Unclear pages: in general pages that do not offer enough information. This isoften the case for Facebook, Linked-in and other public profiles from socialnetworks. For instance, a Facebook public profile may just contain the nameand a statement such as “I like movies and chocolate”. This information iscompatible with virtually any cluster, and is therefore not useful to resolveambiguity.
• Genealogy pages: These documents are simply too complex to treat: they aretoo long and contain large genealogy trees which are hard to compare withother web pages.
• Pages in languages other than English: these are documents which wereincorrectly tagged by the Yahoo language identifier filter, and are mostly inChinese (e.g. in Hao Zhang, Feng Hui datasets), Arabic (Tamer Elsayed),Norwegian or Finnish (Ivan Titov).
Once both assessors annotated the full dataset, they met, discussed their anno-Inter-annotatoragreement tations, and produced a single manual tagging of the data, which is used as WePS-2
gold standard. The cause for most disagreements was a different interpretation ofwhich facts constitute enough evidence to merge a specific page with a given cluster.There are frequent borderline cases where many interpretations are possible, thusmaking it difficult to establish a general annotation policy.
Occupations are usually a good hint for the task. For example, in the BenjaminDifficult casesSnyder dataset we found three documents that mention people living in Boston.One of them is an MIT student in engineering, while another one is a lawyer. It istherefore reasonable to assume that they are different people. The third document,however, describes a wine aficionado. But, as it happens, this is more of a hobbythan an occupation, and it could be compatible with the previous ones. One of theannotators decided that there was not enough information to either create a newcluster for the document or to add it to one of the existing cluster, hence discardingthe document. The second annotator, however, decided that it was appropriateto consider it a separate person since there is no information linking the wineaficionado with the other two profiles. After the discussion, the second optionprevailed.
Other conflictive cases simply derive from the task complexity: sometimes, apage provides a large amount of text and the key information is not visible at a firstglance. Datasets in which there is a high ambiguity, the annotator has to keep allthe details of the people he finds, and compare them to the new evidence offered byeach new page. Eventually this mechanism leads to human errors. The strategy ofhaving two independent annotations and then a discussion helped us to detect thiskind of errors.
In comparison with WePS-1, the new dataset has a much lower ambiguity: inWePS-1 vs. WePS-2average, there are 18.64 different people per name, but the predominant personfor a given name owns half of the documents. Again, note that averages are not
6.2 Evaluation Methodology 113
particularly informative, because there are many extreme cases. For instance, thereare 3 (out of 30) names referring to just one person, and 6 cases with 30 or moredifferent people sharing a single name.
There is also a higher number of discarded documents compared to WePS-1. This is due to the more conservative tagging guidelines that prevented manydocuments with insufficient information from being grouped.
Figure 6.1: WePS-2 clustering annotation GUI
6.2 Evaluation Methodology
In this campaign, we used the extended BCubed clustering metrics for evaluating Extended BCubedthe systems. As we thoroughly described in Chapter 4, B-Cubed [BB98b] metricsare the only ones that satisfy four intuitive formal constraints on evaluation metricsfor the clustering problem. We then extended the original B-Cubed definition tohandle overlapping clustering.
As we did in WePS-1 (Section 3.3), the ranking of systems was obtained using Metrics combinationF-measure Fα=0.5 in order to combine the metrics (in this case BCubed precisionand BCubed recall). We also included the results for Fα=0.2 . This additionalmeasure rewards a better recall while still considering the precision aspect. Thisparametrisation of the F measure captures the intuition that filtering out a few noisydocuments from the relevant cluster (i.e. having a problem of precision) is moreacceptable to the user than having to inspect all other clusters in search for missinginformation (i.e. having a problem of recall in the relevant cluster). An additionalresults analysis was performed using the UIR (Unanimous Improvement Ratio)measure described in Chapter 5.
114 The WePS-2 Campaign
As in WePS-1, two simple baseline approaches were applied to the test data:BaselinesALL-IN-ONE and ONE-IN-ONE. A third baseline consists of a simple clusteringsystem: a HAC algorithm with single linkage. Similarity is calculated using cosine;documents are represented by a bag of words and weighted with tf*idf. We evaluatedtwo variations of this baseline, one that uses a BoW of tokens in the document(HAC-TOKENS) and other that uses bigrams (HAC-BIGRAMS). English stopwordsare removed in each case. A fixed similarity threshold is obtained from the trainingdata and then applied to the test data.
The selection of an appropriate threshold (or other clustering stop criteria)Upper bound systemsis a challenging issue [PK06] in the WePS task. In order to provide an upperbound of the results that can be achieved with the previous baseline system and aperfect threshold selection, we have evaluated the results obtained whenever the bestthreshold is selected for each topic (i.e. each person name) – BEST-HAC-TOKENSand BEST-HAC-BIGRAMS–. This is not a baseline, but it gives us an insight on therelevance of the clustering threshold, as well as the degree of improvement simplebaseline systems like HAC-TOKENS and HAC-BIGRAMS are capable of.
Finally, we have also included the WePS-1 cheat system in the results, in orderWePS-1 cheat systemto verify that the new metrics detect and penalise this non-informative baseline.
6.2.1 Campaign Design
The schedule for the evaluation campaign was set as follows: (i) release of thetask description, development data sets and scoring program; (ii) release of the testdata sets; (iii) participants send their answers to the task organisers3; (iv) the taskorganisers evaluate the answers and send the results.
The task description was released before the start of the official evaluation. TheTask descriptiontraining data and evaluation scripts were already available since they were producedand published during the WePS-1 campaign. The participants had three months todevelop their systems.
The official evaluation period started with the release of the test datasets. TheseEvaluation perioddatasets included the search results metadata and HTML documents for each dataset.Participants had one week to run their systems and submit up to five different setsof answers to the organisers.
Once the evaluation period finished, the answers were evaluated by the organis-Results submissioners and the detailed results were submitted all of the teams. The ranking with allsubmitted runs was then made public, as well as the gold standard for the test data.
6.3 Participants
In this section we summarise some of the common traits found in the systemsdeveloped by the participants.
All systems have some preprocessing stage where HTML documents are con-Preprocessing
3Participants were allowed to submit up to five runs.
6.4 Results of the Evaluation 115
verted into plain text (Java HTML Parser4 and Beautiful Soup5 were among themost popular tools used for this purpose). The next steps generally involve to-kenisation, stop-word removal and, in some cases, sentence detection [CLH09,IOS+09, RBGST09, HZ09]. Porter stemming was performed by some teams[BHH+09, GMV+09, LZL+09, MRA09, Ven09], although it is not clear to whichextent it affects the clustering results (some of the top systems use it and some donot).
The most commonly used feature is the Bag of Words (BoW). Nevertheless, in Featuressome cases it was restricted to sentences where the ambiguous name occurs withina window of words [IOS+09, RBGST09, KF09]. Named entity recognition (NER)is usually presented as a critical feature in order to obtain accurate clustering results.Indeed, it is the second most commonly used feature [IOS+09, NTCKM09, KF09,HZ09, PTV+09, GO09]6. Surprisingly, three out of the top four systems in theranking did not use NER [CLH09, BHH+09, IOS+09, RBGST09]. It seems NERis not necessary to build a competitive system, although it may still be a valuablesource of information. In most cases, features were weighted using simple tf*idffunctions. Other measures used were the gain ratio [LFHDC09], Kullback-Leiblerdivergence [MRA09] and self information [RBGST09].
Bigrams were used by [CLH09, RBGST09] and seemed to provide a good trade-off between precision and recall. Among the most sparse features we find systemsthat used hyperlinks [IOS+09, GO09, CLH09, LFHDC09], email addresses, phonenumbers, dates [LFHDC09], variations of the ambiguous name [GO09], etc.
Hierarchical Agglomerative Clustering (HAC) is the most popular cluster- Clustering algorithmsing algorithm, although the choice of linkage varies (e.g. single link in [CLH09,NTCKM09], group average in [IOS+09]). In cases where a hierarchical algorithmlike HAC was used, the number of clusters in the output was usually determinedby a fixed similarity threshold. This threshold determines how close two ele-ments (documents or clusters) must be in order to be grouped together. Two teams[LFHDC09, Ven09] used a relatively novel clustering algorithm: Fuzzy ants cluster-ing [SDCCK07]. This algorithm determines by itself the number of clusters withoutthe necessity of a similarity threshold. The similarity measure between documentswas commonly handled using the cosine of feature vectors.
Only four teams considered overlapping clusters, but this feature did not play Overlapping clustersan important role on the WePS-2 data.
6.4 Results of the Evaluation
We were contacted by 32 teams expressing their interest in the clustering task. 17teams out of them submitted a total of 75 different runs.
4http://htmlparser.sourceforge.net/5http://www.crummy.com/software/BeautifulSoup/6The most used tool was Stanford’s NER software (http://nlp.stanford.edu/ner/).
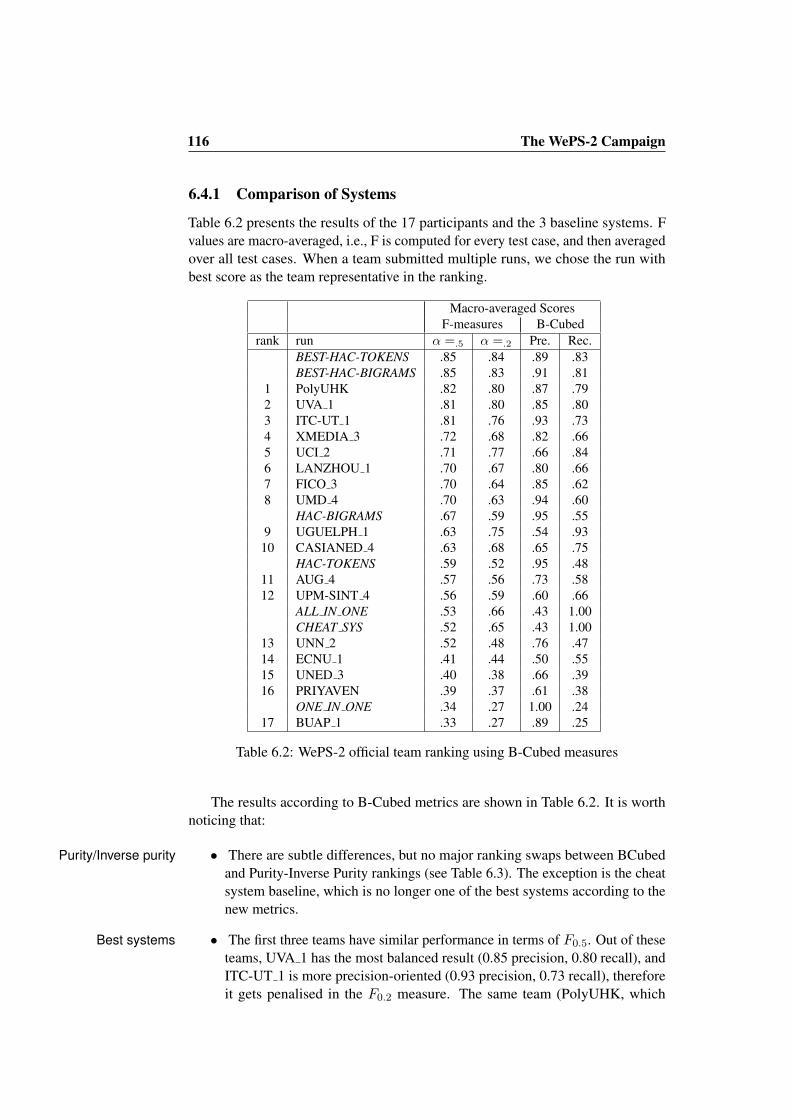
116 The WePS-2 Campaign
6.4.1 Comparison of Systems
Table 6.2 presents the results of the 17 participants and the 3 baseline systems. Fvalues are macro-averaged, i.e., F is computed for every test case, and then averagedover all test cases. When a team submitted multiple runs, we chose the run withbest score as the team representative in the ranking.
Macro-averaged ScoresF-measures B-Cubed
rank run α =.5 α =.2 Pre. Rec.BEST-HAC-TOKENS .85 .84 .89 .83BEST-HAC-BIGRAMS .85 .83 .91 .81
1 PolyUHK .82 .80 .87 .792 UVA 1 .81 .80 .85 .803 ITC-UT 1 .81 .76 .93 .734 XMEDIA 3 .72 .68 .82 .665 UCI 2 .71 .77 .66 .846 LANZHOU 1 .70 .67 .80 .667 FICO 3 .70 .64 .85 .628 UMD 4 .70 .63 .94 .60
HAC-BIGRAMS .67 .59 .95 .559 UGUELPH 1 .63 .75 .54 .93
10 CASIANED 4 .63 .68 .65 .75HAC-TOKENS .59 .52 .95 .48
11 AUG 4 .57 .56 .73 .5812 UPM-SINT 4 .56 .59 .60 .66
ALL IN ONE .53 .66 .43 1.00CHEAT SYS .52 .65 .43 1.00
13 UNN 2 .52 .48 .76 .4714 ECNU 1 .41 .44 .50 .5515 UNED 3 .40 .38 .66 .3916 PRIYAVEN .39 .37 .61 .38
ONE IN ONE .34 .27 1.00 .2417 BUAP 1 .33 .27 .89 .25
Table 6.2: WePS-2 official team ranking using B-Cubed measures
The results according to B-Cubed metrics are shown in Table 6.2. It is worthnoticing that:
• There are subtle differences, but no major ranking swaps between BCubedPurity/Inverse purityand Purity-Inverse Purity rankings (see Table 6.3). The exception is the cheatsystem baseline, which is no longer one of the best systems according to thenew metrics.
• The first three teams have similar performance in terms of F0.5. Out of theseBest systemsteams, UVA 1 has the most balanced result (0.85 precision, 0.80 recall), andITC-UT 1 is more precision-oriented (0.93 precision, 0.73 recall), thereforeit gets penalised in the F0.2 measure. The same team (PolyUHK, which
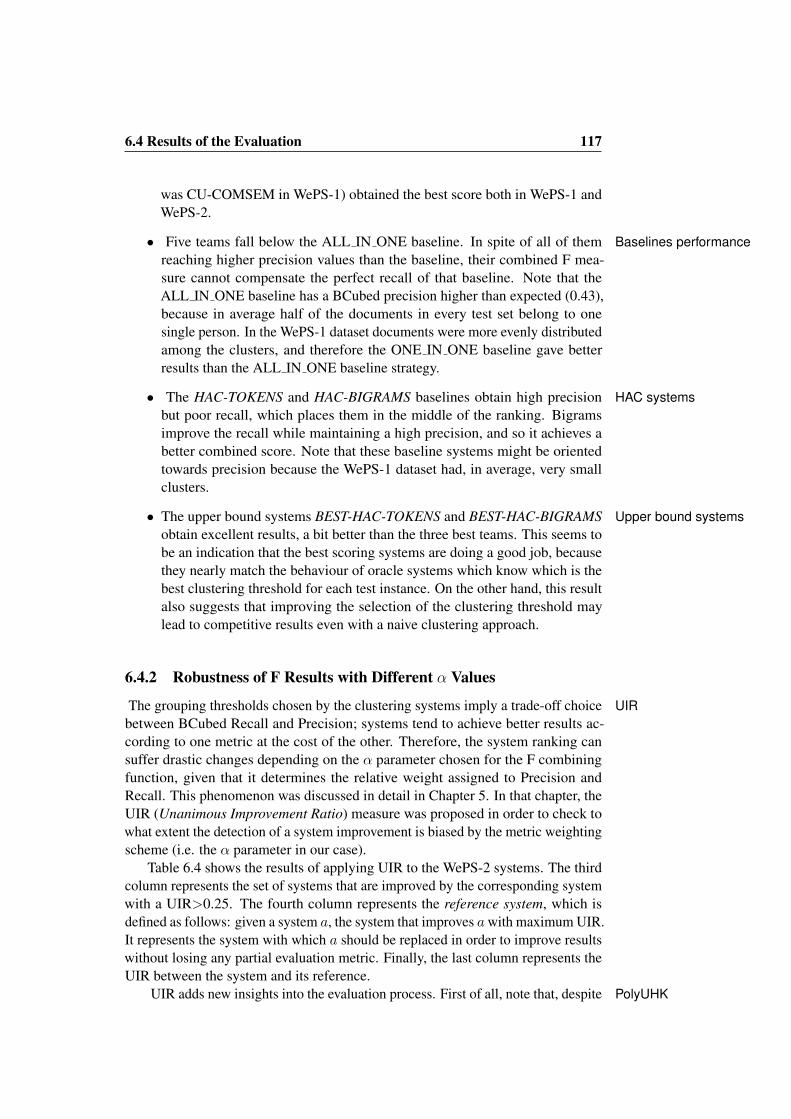
6.4 Results of the Evaluation 117
was CU-COMSEM in WePS-1) obtained the best score both in WePS-1 andWePS-2.
• Five teams fall below the ALL IN ONE baseline. In spite of all of them Baselines performancereaching higher precision values than the baseline, their combined F mea-sure cannot compensate the perfect recall of that baseline. Note that theALL IN ONE baseline has a BCubed precision higher than expected (0.43),because in average half of the documents in every test set belong to onesingle person. In the WePS-1 dataset documents were more evenly distributedamong the clusters, and therefore the ONE IN ONE baseline gave betterresults than the ALL IN ONE baseline strategy.
• The HAC-TOKENS and HAC-BIGRAMS baselines obtain high precision HAC systemsbut poor recall, which places them in the middle of the ranking. Bigramsimprove the recall while maintaining a high precision, and so it achieves abetter combined score. Note that these baseline systems might be orientedtowards precision because the WePS-1 dataset had, in average, very smallclusters.
• The upper bound systems BEST-HAC-TOKENS and BEST-HAC-BIGRAMS Upper bound systemsobtain excellent results, a bit better than the three best teams. This seems tobe an indication that the best scoring systems are doing a good job, becausethey nearly match the behaviour of oracle systems which know which is thebest clustering threshold for each test instance. On the other hand, this resultalso suggests that improving the selection of the clustering threshold maylead to competitive results even with a naive clustering approach.
6.4.2 Robustness of F Results with Different α Values
The grouping thresholds chosen by the clustering systems imply a trade-off choice UIRbetween BCubed Recall and Precision; systems tend to achieve better results ac-cording to one metric at the cost of the other. Therefore, the system ranking cansuffer drastic changes depending on the α parameter chosen for the F combiningfunction, given that it determines the relative weight assigned to Precision andRecall. This phenomenon was discussed in detail in Chapter 5. In that chapter, theUIR (Unanimous Improvement Ratio) measure was proposed in order to check towhat extent the detection of a system improvement is biased by the metric weightingscheme (i.e. the α parameter in our case).
Table 6.4 shows the results of applying UIR to the WePS-2 systems. The thirdcolumn represents the set of systems that are improved by the corresponding systemwith a UIR>0.25. The fourth column represents the reference system, which isdefined as follows: given a system a, the system that improves awith maximum UIR.It represents the system with which a should be replaced in order to improve resultswithout losing any partial evaluation metric. Finally, the last column represents theUIR between the system and its reference.
UIR adds new insights into the evaluation process. First of all, note that, despite PolyUHK
118 The WePS-2 Campaign
Macro-averaged ScoresF-measures
rank run α =.5 α =.2 Pur Inv PurBEST-HAC-TOKENS .90 .89 .93 .88BEST-HAC-BIGRAMS .90 .87 .94 .86
1 PolyUHK .88 .87 .91 .862 UVA 1 .87 .87 .89 .873 ITC-UT 1 .87 .83 .95 .81
CHEAT SYS .87 .94 .78 1.004 UMD 4 .81 .76 .95 .725 XMEDIA 3 .80 .76 .91 .736 UCI 2 .80 .84 .75 .897 LANZHOU 1 .80 .78 .85 .778 FICO 3 .80 .76 .90 .73
HAC-BIGRAMS .78 .64 .96 .679 UGUELPH 1 .74 .84 .64 .95
10 CASIANED 4 .73 .77 .72 .83HAC-TOKENS .71 .64 .96 .60
11 AUG 4 .69 .68 .79 .6812 UPM-SINT 4 .67 .70 .69 .74
ALL IN ONE .67 .79 .56 1.0013 UNN 2 .64 .59 .80 .5714 ECNU 1 .53 .56 .60 .6315 PRIYAVEN .53 .49 .71 .4816 UNED 3 .51 .48 .71 .4817 BUAP 1 .37 .30 .89 .27
ONE IN ONE .34 .27 1.00 .24
Table 6.3: WePS-2 team ranking using Purity/Inverse Purity metrics
the three top-scoring systems having a similar performance in terms of F (0.82, 0.81and 0.81), PolyUHK is consistently the best according to UIR (it is the referencefor 10 systems). In the most extreme case, UIR(PolyUHK,PRIYAVEN)=1, whichmeans that PolyUHK improves both precision and recall of PRIYAVEN for all testcases in the dataset. Therefore, UIR clearly points out a best system, where F alonecould only discern a set of three top scoring systems.
Although the ALL IN ONE baseline is better than five systems according to F,Baseline approachesit is not better than any of them according to UIR. In fact, only the ONE IN ONEbaseline is able to improve some system (BUAP 2). Therefore, UIR also addsthe capability of detecting baseline approaches: if a system is adopting a baselinebehaviour (for instance, using a very low clustering threshold that ends up setting upone big cluster), F will not clearly signal this problem (the F value obtained is betterthan five systems), but UIR will certainly signal a problem, because this baselinestrategy cannot robustly improve any system.
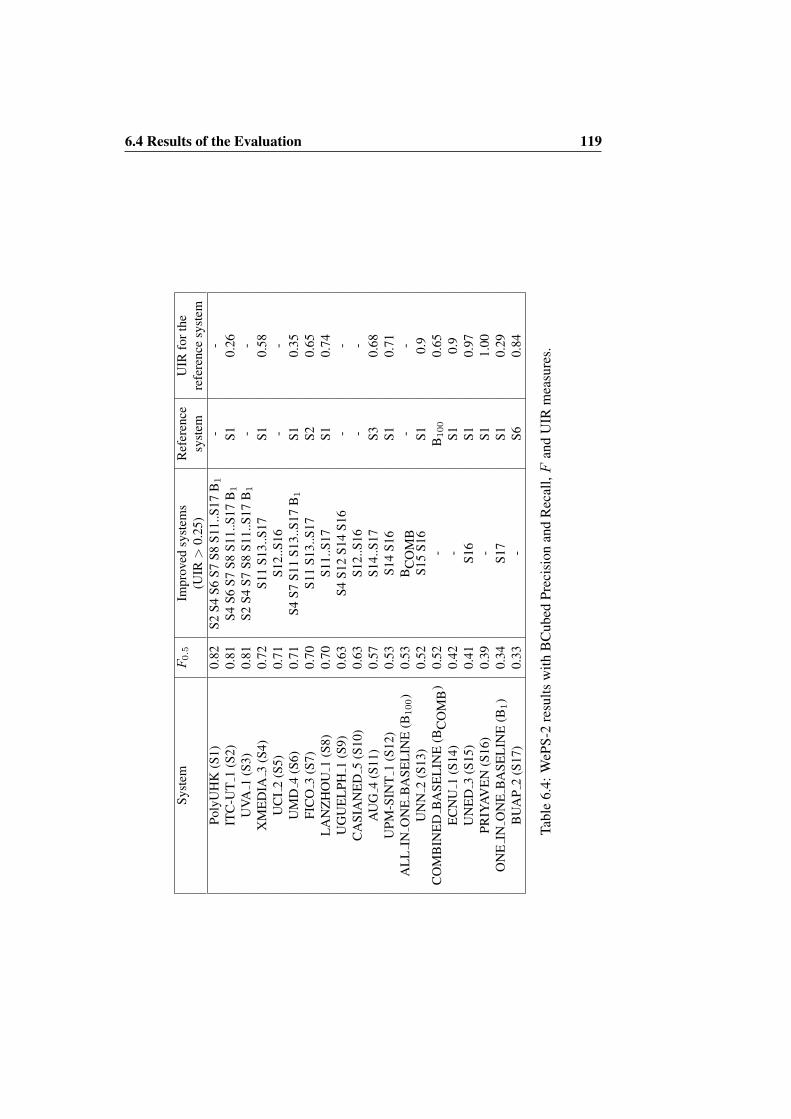
6.4 Results of the Evaluation 119
Syst
emF
0.5
Impr
oved
syst
ems
Ref
eren
ceU
IRfo
rthe
(UIR>
0.25
)sy
stem
refe
renc
esy
stem
Poly
UH
K(S
1)0.
82S2
S4S6
S7S8
S11.
.S17
B1
--
ITC
-UT
1(S
2)0.
81S4
S6S7
S8S1
1..S
17B
1S1
0.26
UVA
1(S
3)0.
81S2
S4S7
S8S1
1..S
17B
1-
-X
ME
DIA
3(S
4)0.
72S1
1S1
3..S
17S1
0.58
UC
I2
(S5)
0.71
S12.
.S16
--
UM
D4
(S6)
0.71
S4S7
S11
S13.
.S17
B1
S10.
35FI
CO
3(S
7)0.
70S1
1S1
3..S
17S2
0.65
LA
NZ
HO
U1
(S8)
0.70
S11.
.S17
S10.
74U
GU
EL
PH1
(S9)
0.63
S4S1
2S1
4S1
6-
-C
ASI
AN
ED
5(S
10)
0.63
S12.
.S16
--
AU
G4
(S11
)0.
57S1
4..S
17S3
0.68
UPM
-SIN
T1
(S12
)0.
53S1
4S1
6S1
0.71
AL
LIN
ON
EB
ASE
LIN
E(B
100)
0.53
BC
OM
B-
-U
NN
2(S
13)
0.52
S15
S16
S10.
9C
OM
BIN
ED
BA
SEL
INE
(BC
OM
B)
0.52
-B
100
0.65
EC
NU
1(S
14)
0.42
-S1
0.9
UN
ED
3(S
15)
0.41
S16
S10.
97PR
IYAV
EN
(S16
)0.
39-
S11.
00O
NE
INO
NE
BA
SEL
INE
(B1)
0.34
S17
S10.
29B
UA
P2
(S17
)0.
33-
S60.
84
Tabl
e6.
4:W
ePS-
2re
sults
with
BC
ubed
Prec
isio
nan
dR
ecal
l,F
and
UIR
mea
sure
s.
120 The WePS-2 Campaign
6.5 Conclusions
The WePS-2 campaign maintained the high level of participation achieved in itsfirst edition. This campaign has also featured more robust clustering evaluationmeasures and a more efficient annotation process, based on the experience acquiredin WePS-1. The results of the evaluation have been also analysed using a novelapproach (Unanimous Improvement Ratio) that tackles the bias introduced by metricweighting schemes.
In parallel with the clustering task, WePS-2 also included a new person At-tribute Extraction task [SA09] which is not reported in this thesis. The extraction ofbiographical attributes can be a valuable source of information for accurate docu-ment clustering, but it also represents an important aid for real users to browse theclustering results.
During a discussion panel with WePS-2 we received feedback from participants.A particularly interesting suggestion was that, in order to focus on the comparisonof clustering and feature selection methods, participants could share feature vec-tors provided by the organisation, along with the test collections. Moreover, in aforthcoming edition of the WePS campaign we intend to address the relationshipsbetween both tasks in an integrated way. This should provide new insights into thechallenges faced by WePS systems.

Part III
Empirical Studies

Chapter 7
The Scope of Query Refinementin the WePS Task
In the context of the WePS task, one question that naturally arises is whethersearch results clustering can effectively help users for this task. Eventually, a queryrefinement made by the user – for instance, adding an affiliation or a location –might have the desired disambiguation effect without compromising recall. Thehypothesis underlying most research on Web People Search is that query refinementis risky, because it can enhance precision but it will usually harm recall. Adding thecurrent affiliation of a person, for instance, might make information about previousjobs disappear from search results.
The goal of this chapter is to empirically confirm this hypothesis. We want toevaluate the actual impact of using query refinements in the Web People Search(WePS) clustering task (as defined in the framework of the WePS evaluation). Inorder to do so, we have studied to what extent a query refinement can successfullyfilter relevant results and which type of refinements are the most successful. In ourexperiments, we have considered the search results associated to one individual as aset of relevant documents. We have tested the ability of different query refinementstrategies to retrieve those documents. Our results are conclusive: in most occasionsthere is a “near-perfect” refinement that filters out most relevant information abouta given person, but this refinement is very hard to predict from a user’s perspective.
In Section 7.1, we describe the datasets that were used for our experiments. Theexperimental methodology and results are presented in Section 7.2. Finally, wepresent our conclusions in Section 7.4.
7.1 Dataset
We have used the WePS-2 testbed for our experiments. In order to generate queryrefinement candidates, we extracted several types of features from each document.First, we applied a simple preprocessing to the HTML documents in the corpus,converting them to plain text and tokenising. Then, we extracted tokens and wordn-grams for each document (up to four words length). A list of English stopwords
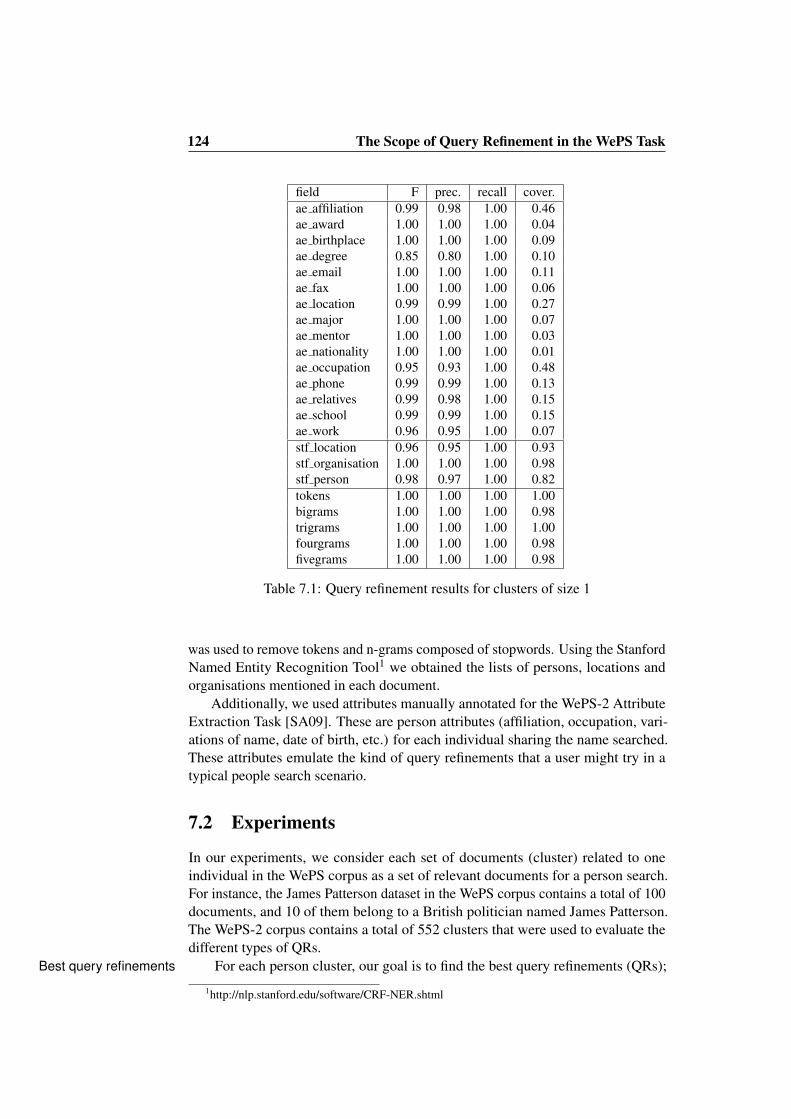
124 The Scope of Query Refinement in the WePS Task
field F prec. recall cover.ae affiliation 0.99 0.98 1.00 0.46ae award 1.00 1.00 1.00 0.04ae birthplace 1.00 1.00 1.00 0.09ae degree 0.85 0.80 1.00 0.10ae email 1.00 1.00 1.00 0.11ae fax 1.00 1.00 1.00 0.06ae location 0.99 0.99 1.00 0.27ae major 1.00 1.00 1.00 0.07ae mentor 1.00 1.00 1.00 0.03ae nationality 1.00 1.00 1.00 0.01ae occupation 0.95 0.93 1.00 0.48ae phone 0.99 0.99 1.00 0.13ae relatives 0.99 0.98 1.00 0.15ae school 0.99 0.99 1.00 0.15ae work 0.96 0.95 1.00 0.07stf location 0.96 0.95 1.00 0.93stf organisation 1.00 1.00 1.00 0.98stf person 0.98 0.97 1.00 0.82tokens 1.00 1.00 1.00 1.00bigrams 1.00 1.00 1.00 0.98trigrams 1.00 1.00 1.00 1.00fourgrams 1.00 1.00 1.00 0.98fivegrams 1.00 1.00 1.00 0.98
Table 7.1: Query refinement results for clusters of size 1
was used to remove tokens and n-grams composed of stopwords. Using the StanfordNamed Entity Recognition Tool1 we obtained the lists of persons, locations andorganisations mentioned in each document.
Additionally, we used attributes manually annotated for the WePS-2 AttributeExtraction Task [SA09]. These are person attributes (affiliation, occupation, vari-ations of name, date of birth, etc.) for each individual sharing the name searched.These attributes emulate the kind of query refinements that a user might try in atypical people search scenario.
7.2 Experiments
In our experiments, we consider each set of documents (cluster) related to oneindividual in the WePS corpus as a set of relevant documents for a person search.For instance, the James Patterson dataset in the WePS corpus contains a total of 100documents, and 10 of them belong to a British politician named James Patterson.The WePS-2 corpus contains a total of 552 clusters that were used to evaluate thedifferent types of QRs.
For each person cluster, our goal is to find the best query refinements (QRs);Best query refinements
1http://nlp.stanford.edu/software/CRF-NER.shtml

7.2 Experiments 125
field F prec. recall cover.ae affiliation 0.76 0.99 0.65 0.40ae award 0.67 1.00 0.50 0.02ae birthplace 0.67 1.00 0.50 0.10ae degree 0.63 0.87 0.54 0.15ae email 0.74 1.00 0.60 0.16ae fax 0.67 1.00 0.50 0.09ae location 0.77 1.00 0.66 0.32ae major 0.71 1.00 0.56 0.09ae mentor 0.75 1.00 0.63 0.04ae nationality 0.67 1.00 0.50 0.01ae occupation 0.76 0.98 0.65 0.52ae phone 0.75 1.00 0.63 0.13ae relatives 0.78 0.96 0.68 0.15ae school 0.68 0.96 0.56 0.17ae work 0.81 1.00 0.72 0.17stf location 0.83 0.97 0.77 0.98stf organisation 0.89 1.00 0.83 1.00stf person 0.83 0.99 0.74 0.98tokens 0.96 0.99 0.94 1.00bigrams 0.95 1.00 0.92 1.00trigrams 0.94 1.00 0.92 1.00fourgrams 0.91 1.00 0.86 0.99fivegrams 0.89 1.00 0.84 0.99
Table 7.2: Query refinement results for clusters of size 2
in an ideal case, an expression that is present in all documents in the cluster butnot present in documents outside the cluster. For each QR type (affiliation, e-mail,n-grams of various sizes, etc.) we consider all candidates found in at least onedocument from the cluster, and we pick up the one that leads to the best harmonicmean (Fα=.5) of precision and recall on the cluster documents (there might be morethan one).
For instance, when we evaluate a set of token QR candidates for the politicianin the James Patterson dataset, we find that among all tokens that appear in thedocuments of its cluster, ”republican” gives us a perfect score, while “politician“obtains a low precision (we retrieve documents from other politicians named JamesPatterson).
In some cases a cluster might not have any candidate for a particular type of QR. CoverageFor instance, manual person attributes like phone number are sparse and will not beavailable for every individual, whereas tokens and n-grams are always present. Weexclude those cases when computing F, and instead we report a coverage measurewhich represents the number of clusters which have at least one candidate of thistype of QR. In this way, we know how often we can use an attribute (coverage) andhow useful it is whenever it is available (F measure).
These figures represent a ceiling for each type of query refinement: they repre-sent the efficiency of the query when the user selects the best possible refinement
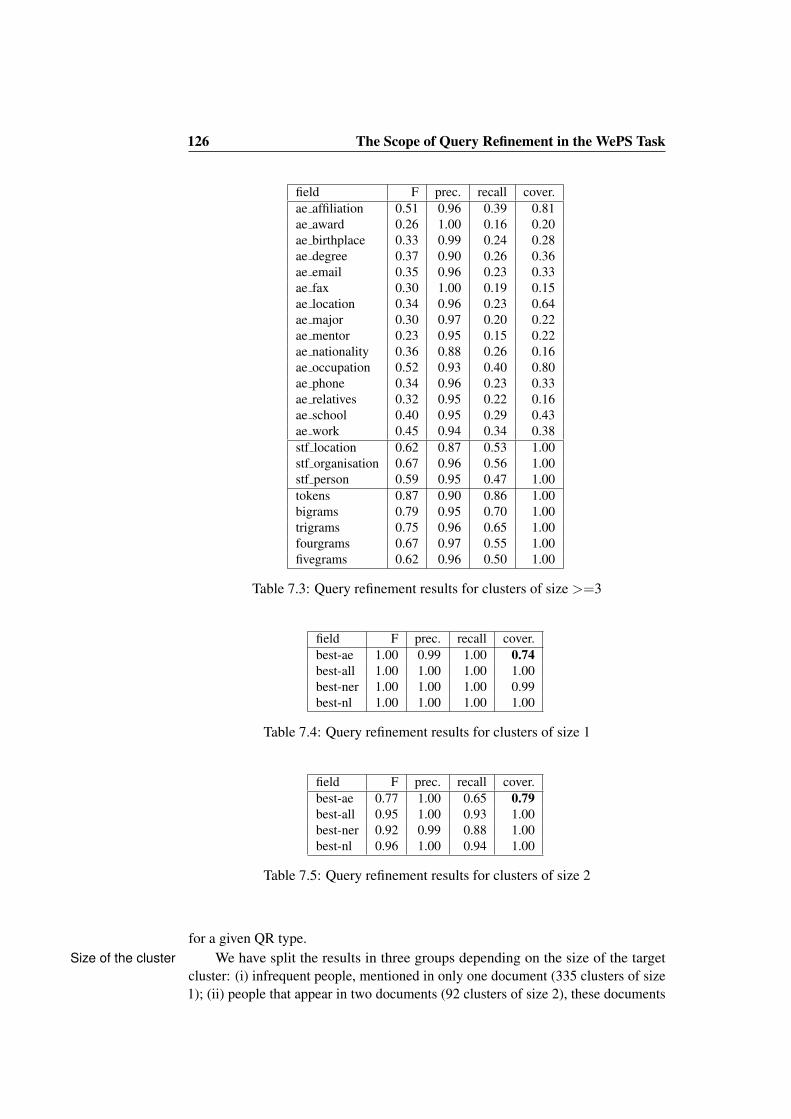
126 The Scope of Query Refinement in the WePS Task
field F prec. recall cover.ae affiliation 0.51 0.96 0.39 0.81ae award 0.26 1.00 0.16 0.20ae birthplace 0.33 0.99 0.24 0.28ae degree 0.37 0.90 0.26 0.36ae email 0.35 0.96 0.23 0.33ae fax 0.30 1.00 0.19 0.15ae location 0.34 0.96 0.23 0.64ae major 0.30 0.97 0.20 0.22ae mentor 0.23 0.95 0.15 0.22ae nationality 0.36 0.88 0.26 0.16ae occupation 0.52 0.93 0.40 0.80ae phone 0.34 0.96 0.23 0.33ae relatives 0.32 0.95 0.22 0.16ae school 0.40 0.95 0.29 0.43ae work 0.45 0.94 0.34 0.38stf location 0.62 0.87 0.53 1.00stf organisation 0.67 0.96 0.56 1.00stf person 0.59 0.95 0.47 1.00tokens 0.87 0.90 0.86 1.00bigrams 0.79 0.95 0.70 1.00trigrams 0.75 0.96 0.65 1.00fourgrams 0.67 0.97 0.55 1.00fivegrams 0.62 0.96 0.50 1.00
Table 7.3: Query refinement results for clusters of size >=3
field F prec. recall cover.best-ae 1.00 0.99 1.00 0.74best-all 1.00 1.00 1.00 1.00best-ner 1.00 1.00 1.00 0.99best-nl 1.00 1.00 1.00 1.00
Table 7.4: Query refinement results for clusters of size 1
field F prec. recall cover.best-ae 0.77 1.00 0.65 0.79best-all 0.95 1.00 0.93 1.00best-ner 0.92 0.99 0.88 1.00best-nl 0.96 1.00 0.94 1.00
Table 7.5: Query refinement results for clusters of size 2
for a given QR type.We have split the results in three groups depending on the size of the targetSize of the cluster
cluster: (i) infrequent people, mentioned in only one document (335 clusters of size1); (ii) people that appear in two documents (92 clusters of size 2), these documents
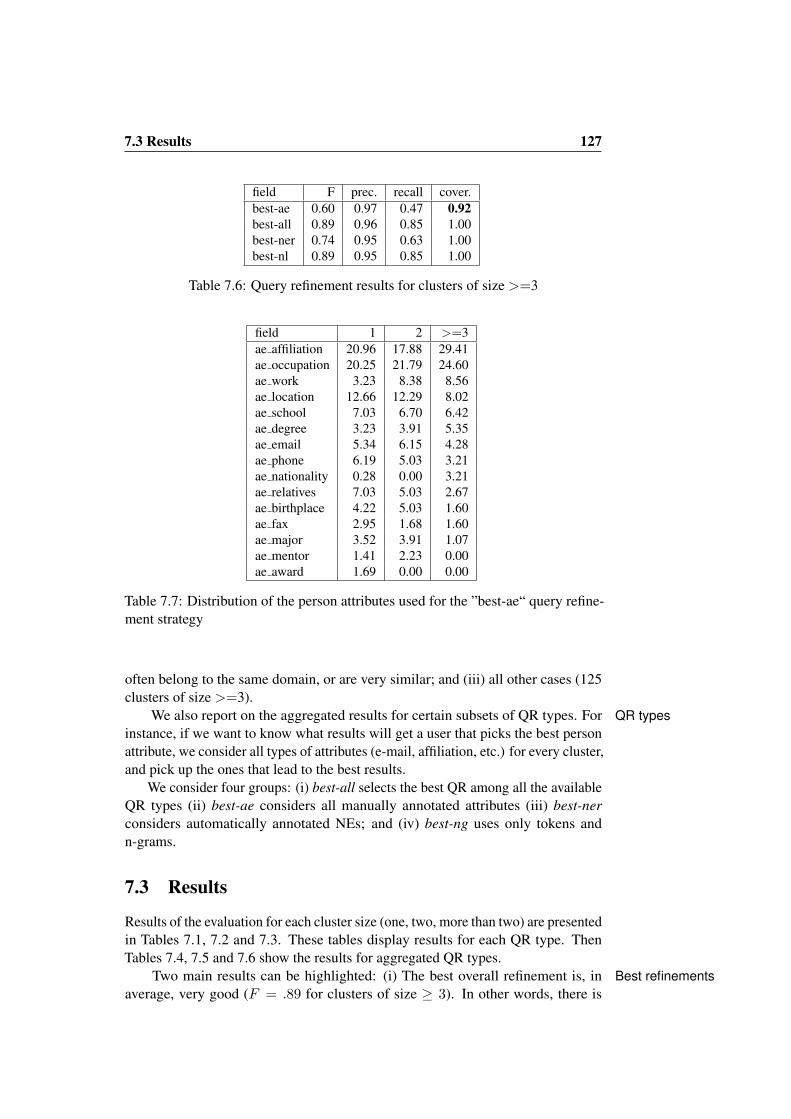
7.3 Results 127
field F prec. recall cover.best-ae 0.60 0.97 0.47 0.92best-all 0.89 0.96 0.85 1.00best-ner 0.74 0.95 0.63 1.00best-nl 0.89 0.95 0.85 1.00
Table 7.6: Query refinement results for clusters of size >=3
field 1 2 >=3ae affiliation 20.96 17.88 29.41ae occupation 20.25 21.79 24.60ae work 3.23 8.38 8.56ae location 12.66 12.29 8.02ae school 7.03 6.70 6.42ae degree 3.23 3.91 5.35ae email 5.34 6.15 4.28ae phone 6.19 5.03 3.21ae nationality 0.28 0.00 3.21ae relatives 7.03 5.03 2.67ae birthplace 4.22 5.03 1.60ae fax 2.95 1.68 1.60ae major 3.52 3.91 1.07ae mentor 1.41 2.23 0.00ae award 1.69 0.00 0.00
Table 7.7: Distribution of the person attributes used for the ”best-ae“ query refine-ment strategy
often belong to the same domain, or are very similar; and (iii) all other cases (125clusters of size >=3).
We also report on the aggregated results for certain subsets of QR types. For QR typesinstance, if we want to know what results will get a user that picks the best personattribute, we consider all types of attributes (e-mail, affiliation, etc.) for every cluster,and pick up the ones that lead to the best results.
We consider four groups: (i) best-all selects the best QR among all the availableQR types (ii) best-ae considers all manually annotated attributes (iii) best-nerconsiders automatically annotated NEs; and (iv) best-ng uses only tokens andn-grams.
7.3 Results
Results of the evaluation for each cluster size (one, two, more than two) are presentedin Tables 7.1, 7.2 and 7.3. These tables display results for each QR type. ThenTables 7.4, 7.5 and 7.6 show the results for aggregated QR types.
Two main results can be highlighted: (i) The best overall refinement is, in Best refinementsaverage, very good (F = .89 for clusters of size ≥ 3). In other words, there is
128 The Scope of Query Refinement in the WePS Task
usually at least one QR that leads to (approximately) the desired set of results; (ii)this best refinement, however, is not necessarily an intuitive choice for the user.One would expect users to refine the query with a person’s attribute, such as hisaffiliation or location. But the results for the best (manually extracted) attribute aresignificantly worse (F = .60 for clusters of size ≥ 3), and they cannot always beused (coverage is .74, .79 and .92 for clusters of size 1, 2 and ≥ 3).
The manually tagged attributes from WePS-2 are very precise, although theirManual attributesindividual coverage over the different person clusters is generally low. Affiliationand occupation, which are the most frequent attributes, obtain the largest coverage(0.81 and 0.80 for sizes ≥ 3). Moreover, the recall of this type of QRs is low inclusters of two, three or more documents. When evaluating the “best-ae” strategy,we found that there is at least one manual attribute that can be used as QR with highprecision in many clusters. This is mostly the case for clusters of three or moredocuments (0.92 coverage) and it decreases with smaller clusters, probably becausethere is less information about the person and, consequently less biographicalattributes are to be found.
In Table 7.7 we show the distribution of the actual QR types selected by the“best-ae” strategy. The best type is affiliation, which is selected in 29% of the cases.Affiliation and occupation together cover around half of the cases (54%), and therest is a long tail in which each attribute makes a small contribution to the total.Again, this is a strong indication that the best refinement is probably very difficultto predict a priori for the user.
Automatically recognised named entities in the documents obtain better resultsNamed entitiesin general than manually tagged attributes. This is probably due to the fact that theycan capture all kinds of related entities, or just entities that happen to coocur withthe person name. For instance, the pages of a university professor that is usuallymentioned together with his PhD students could be refined with any of their names.This circumstance shows us that a good QR can be any information related to theperson, but also that we might need to know the person very well in advance inorder to choose this QR.
Tokens and n-grams give us a kind of “upper boundary” of what is possible toTokens and n-gramsachieve using QRs. Furthermore, they include almost anything that is found in themanual attributes and the named entities. They also frequently include QRs that arenot realistic for a human refinement. For instance, in clusters of just two documentsit is not uncommon that both pages belong to the same domain or that they arenear duplicates. In those cases, tokens and ngram QR will probably include noninformative strings. In some cases, the QRs found are neither directly biographicalor related NEs, but topical information (e.g. the term “soccer“ in the pages of afootball player or the ngram ”alignment via structured multilabel“ that is the titleof a paper written by a Computer Science researcher). These cases widen, evenmore, the range of effective QRs. The overall results of using tokens and n-gramsare almost perfect for all clusters, but at the cost of considering every possible bit ofinformation about the person or even unrelated text.

7.4 Conclusions 129
7.4 Conclusions
In this chapter we have studied the potential effects of using query refinements toperform the Web People Search task. We have shown that, although in generalthere are query refinements that perform well to retrieve the documents of mostindividuals, the nature of these ideal refinements varies widely in the studied dataset,and there is no single intuitive strategy leading to robust results. Even if the attributesof the person are well known beforehand (which is hardly realistic, given the factthat, in most cases, this is precisely the information needed by the user), there isno way of anticipating which expression will lead to good results for a particularperson. This leads us to confirm that search results clustering might indeed be ofpractical help in real world situations.
As to future work, we are keen to set up interactive experiments in order tostudy the way in which search engine users perform name query refinements. Wealso intend to compare the upper boundary of query refinements to the actualperformance of users.

130 The Scope of Query Refinement in the WePS Task
Chapter 8
The Role of Named Entities inWePS
Our goal in this chapter is to study which document features can contribute to theWePS task. More specifically, we try to find out the role that can be played bynamed entities (NEs).
NEs have been extensively used in name disambiguation, as shown in Sec-tion 2.2. Moreover, among the 16 teams that submitted results for the first WePScampaign, 10 of them1 used NEs in their document representation. This makes NEsthe second most common type of feature – only the BoW feature was more popular.Other features used by the systems include noun phrases [CM07b], word n-grams[PM07], emails and URLs [dVAdPSVD07], etc. In 2009, the WePS-2 campaignshowed similar trends regarding the use of NE features.
Due to the complexity of systems, the results of the WePS evaluation do notprovide a direct answer regarding the advantages of using NEs over other computa-tionally lighter features such as BoW or word n-grams. But the WePS campaignsdid provide a useful, standardised resource to perform a type of studies that werenot possible in the past. In the next section, we describe this dataset as well as howit has been adapted for our purposes.
In this part of our thesis we intend to answer the following questions: (i) Howreliable is NEs overlap between documents as a source of evidence to cluster pages?(ii) How much recall does it provide? (iii) How unique is this signal? (i.e. is itredundant with other sources of information such as n-gram overlap?); and (iv) Howsensitive is this signal to the peculiarities of a given NE recognition system, such asthe granularity of its NE classification and the quality of its results?
Our aim here is to reach conclusions which are are not tied to a particular choiceof Clustering or Machine Learning algorithms. We have made two decisions inthis direction: first, we have focused on the problem of deciding whether two webpages refer to the same individual or not (page coreference task). This is the kind ofrelatedness measure that most clustering algorithms use, but, in this way, we can
1By team ID: CU-COMSEM, IRST-BP, PSNUS, SHEF, FICO, UNN, AUG, JHU1, DFKI2,UC3M13
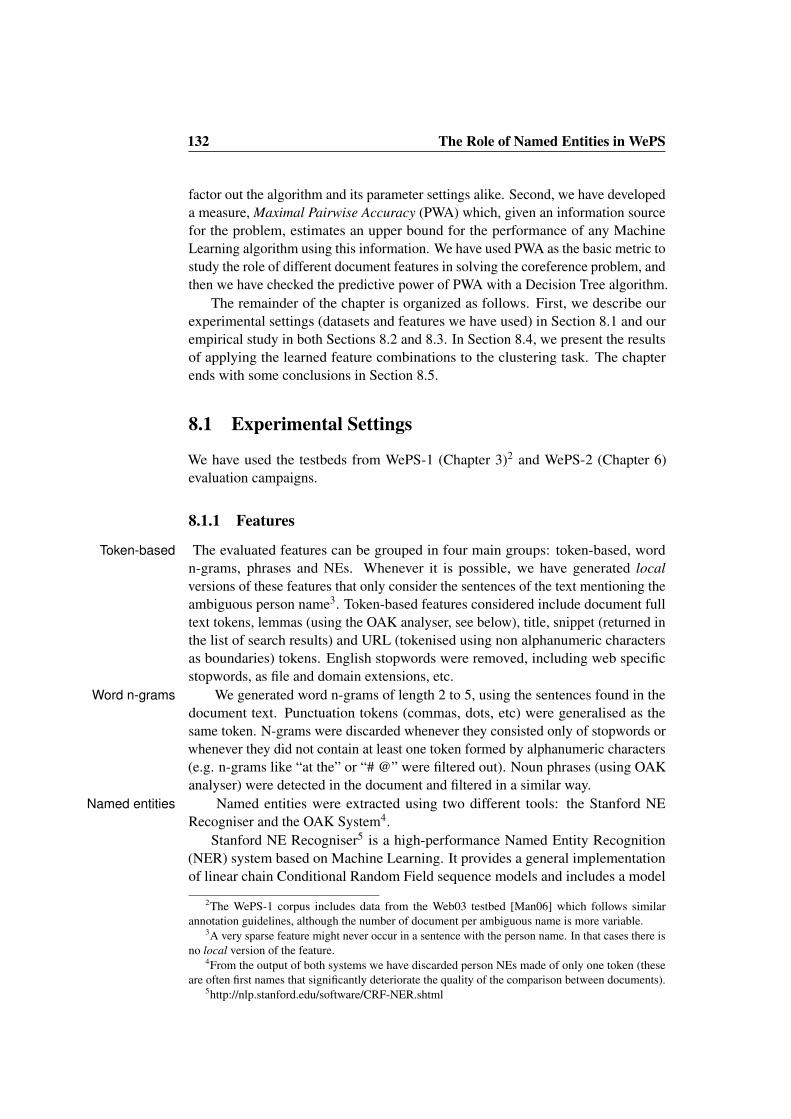
132 The Role of Named Entities in WePS
factor out the algorithm and its parameter settings alike. Second, we have developeda measure, Maximal Pairwise Accuracy (PWA) which, given an information sourcefor the problem, estimates an upper bound for the performance of any MachineLearning algorithm using this information. We have used PWA as the basic metric tostudy the role of different document features in solving the coreference problem, andthen we have checked the predictive power of PWA with a Decision Tree algorithm.
The remainder of the chapter is organized as follows. First, we describe ourexperimental settings (datasets and features we have used) in Section 8.1 and ourempirical study in both Sections 8.2 and 8.3. In Section 8.4, we present the resultsof applying the learned feature combinations to the clustering task. The chapterends with some conclusions in Section 8.5.
8.1 Experimental Settings
We have used the testbeds from WePS-1 (Chapter 3)2 and WePS-2 (Chapter 6)evaluation campaigns.
8.1.1 Features
The evaluated features can be grouped in four main groups: token-based, wordToken-basedn-grams, phrases and NEs. Whenever it is possible, we have generated localversions of these features that only consider the sentences of the text mentioning theambiguous person name3. Token-based features considered include document fulltext tokens, lemmas (using the OAK analyser, see below), title, snippet (returned inthe list of search results) and URL (tokenised using non alphanumeric charactersas boundaries) tokens. English stopwords were removed, including web specificstopwords, as file and domain extensions, etc.
We generated word n-grams of length 2 to 5, using the sentences found in theWord n-gramsdocument text. Punctuation tokens (commas, dots, etc) were generalised as thesame token. N-grams were discarded whenever they consisted only of stopwords orwhenever they did not contain at least one token formed by alphanumeric characters(e.g. n-grams like “at the” or “# @” were filtered out). Noun phrases (using OAKanalyser) were detected in the document and filtered in a similar way.
Named entities were extracted using two different tools: the Stanford NENamed entitiesRecogniser and the OAK System4.
Stanford NE Recogniser5 is a high-performance Named Entity Recognition(NER) system based on Machine Learning. It provides a general implementationof linear chain Conditional Random Field sequence models and includes a model
2The WePS-1 corpus includes data from the Web03 testbed [Man06] which follows similarannotation guidelines, although the number of document per ambiguous name is more variable.
3A very sparse feature might never occur in a sentence with the person name. In that cases there isno local version of the feature.
4From the output of both systems we have discarded person NEs made of only one token (theseare often first names that significantly deteriorate the quality of the comparison between documents).
5http://nlp.stanford.edu/software/CRF-NER.shtml
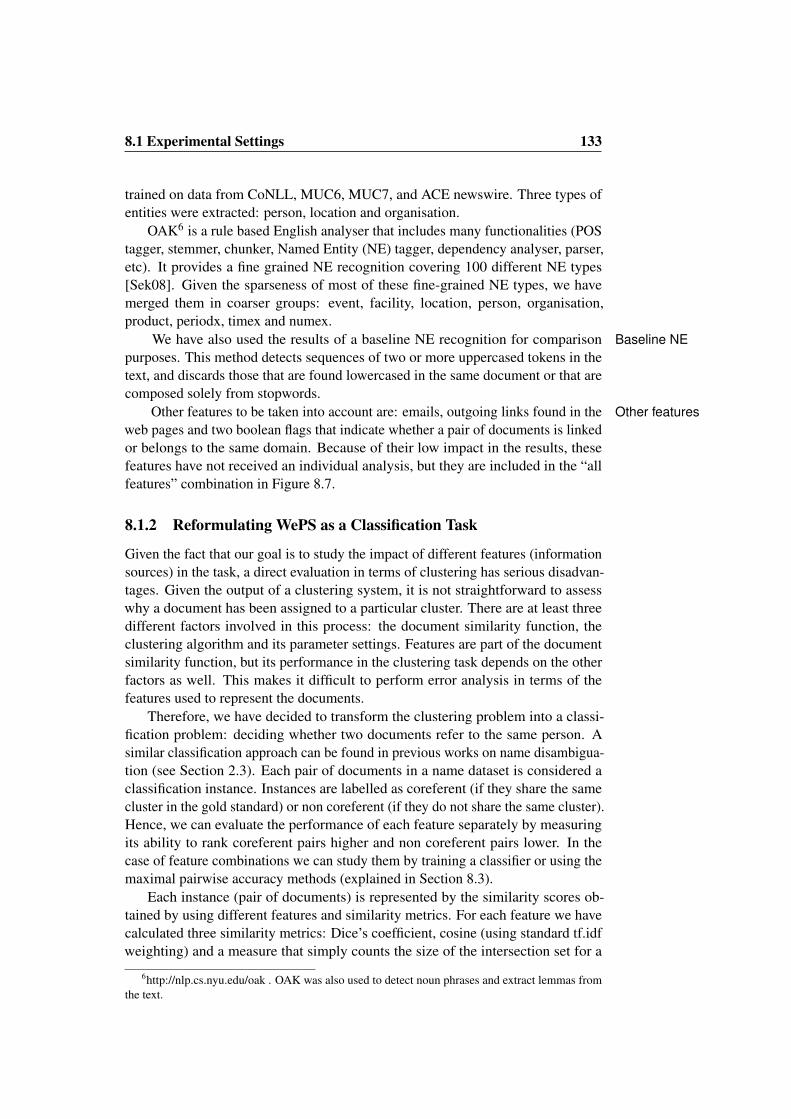
8.1 Experimental Settings 133
trained on data from CoNLL, MUC6, MUC7, and ACE newswire. Three types ofentities were extracted: person, location and organisation.
OAK6 is a rule based English analyser that includes many functionalities (POStagger, stemmer, chunker, Named Entity (NE) tagger, dependency analyser, parser,etc). It provides a fine grained NE recognition covering 100 different NE types[Sek08]. Given the sparseness of most of these fine-grained NE types, we havemerged them in coarser groups: event, facility, location, person, organisation,product, periodx, timex and numex.
We have also used the results of a baseline NE recognition for comparison Baseline NEpurposes. This method detects sequences of two or more uppercased tokens in thetext, and discards those that are found lowercased in the same document or that arecomposed solely from stopwords.
Other features to be taken into account are: emails, outgoing links found in the Other featuresweb pages and two boolean flags that indicate whether a pair of documents is linkedor belongs to the same domain. Because of their low impact in the results, thesefeatures have not received an individual analysis, but they are included in the “allfeatures” combination in Figure 8.7.
8.1.2 Reformulating WePS as a Classification Task
Given the fact that our goal is to study the impact of different features (informationsources) in the task, a direct evaluation in terms of clustering has serious disadvan-tages. Given the output of a clustering system, it is not straightforward to assesswhy a document has been assigned to a particular cluster. There are at least threedifferent factors involved in this process: the document similarity function, theclustering algorithm and its parameter settings. Features are part of the documentsimilarity function, but its performance in the clustering task depends on the otherfactors as well. This makes it difficult to perform error analysis in terms of thefeatures used to represent the documents.
Therefore, we have decided to transform the clustering problem into a classi-fication problem: deciding whether two documents refer to the same person. Asimilar classification approach can be found in previous works on name disambigua-tion (see Section 2.3). Each pair of documents in a name dataset is considered aclassification instance. Instances are labelled as coreferent (if they share the samecluster in the gold standard) or non coreferent (if they do not share the same cluster).Hence, we can evaluate the performance of each feature separately by measuringits ability to rank coreferent pairs higher and non coreferent pairs lower. In thecase of feature combinations we can study them by training a classifier or using themaximal pairwise accuracy methods (explained in Section 8.3).
Each instance (pair of documents) is represented by the similarity scores ob-tained by using different features and similarity metrics. For each feature we havecalculated three similarity metrics: Dice’s coefficient, cosine (using standard tf.idfweighting) and a measure that simply counts the size of the intersection set for a
6http://nlp.cs.nyu.edu/oak . OAK was also used to detect noun phrases and extract lemmas fromthe text.
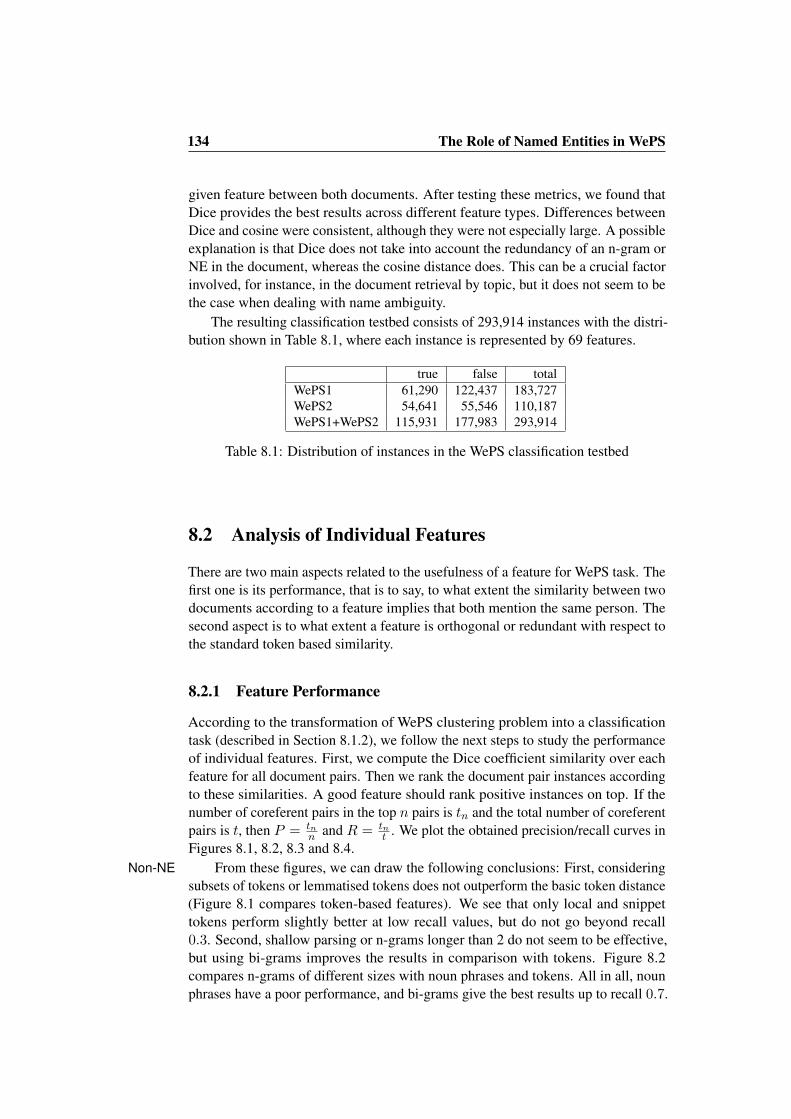
134 The Role of Named Entities in WePS
given feature between both documents. After testing these metrics, we found thatDice provides the best results across different feature types. Differences betweenDice and cosine were consistent, although they were not especially large. A possibleexplanation is that Dice does not take into account the redundancy of an n-gram orNE in the document, whereas the cosine distance does. This can be a crucial factorinvolved, for instance, in the document retrieval by topic, but it does not seem to bethe case when dealing with name ambiguity.
The resulting classification testbed consists of 293,914 instances with the distri-bution shown in Table 8.1, where each instance is represented by 69 features.
true false totalWePS1 61,290 122,437 183,727WePS2 54,641 55,546 110,187WePS1+WePS2 115,931 177,983 293,914
Table 8.1: Distribution of instances in the WePS classification testbed
8.2 Analysis of Individual Features
There are two main aspects related to the usefulness of a feature for WePS task. Thefirst one is its performance, that is to say, to what extent the similarity between twodocuments according to a feature implies that both mention the same person. Thesecond aspect is to what extent a feature is orthogonal or redundant with respect tothe standard token based similarity.
8.2.1 Feature Performance
According to the transformation of WePS clustering problem into a classificationtask (described in Section 8.1.2), we follow the next steps to study the performanceof individual features. First, we compute the Dice coefficient similarity over eachfeature for all document pairs. Then we rank the document pair instances accordingto these similarities. A good feature should rank positive instances on top. If thenumber of coreferent pairs in the top n pairs is tn and the total number of coreferentpairs is t, then P = tn
n and R = tnt . We plot the obtained precision/recall curves in
Figures 8.1, 8.2, 8.3 and 8.4.From these figures, we can draw the following conclusions: First, consideringNon-NE
subsets of tokens or lemmatised tokens does not outperform the basic token distance(Figure 8.1 compares token-based features). We see that only local and snippettokens perform slightly better at low recall values, but do not go beyond recall0.3. Second, shallow parsing or n-grams longer than 2 do not seem to be effective,but using bi-grams improves the results in comparison with tokens. Figure 8.2compares n-grams of different sizes with noun phrases and tokens. All in all, nounphrases have a poor performance, and bi-grams give the best results up to recall 0.7.
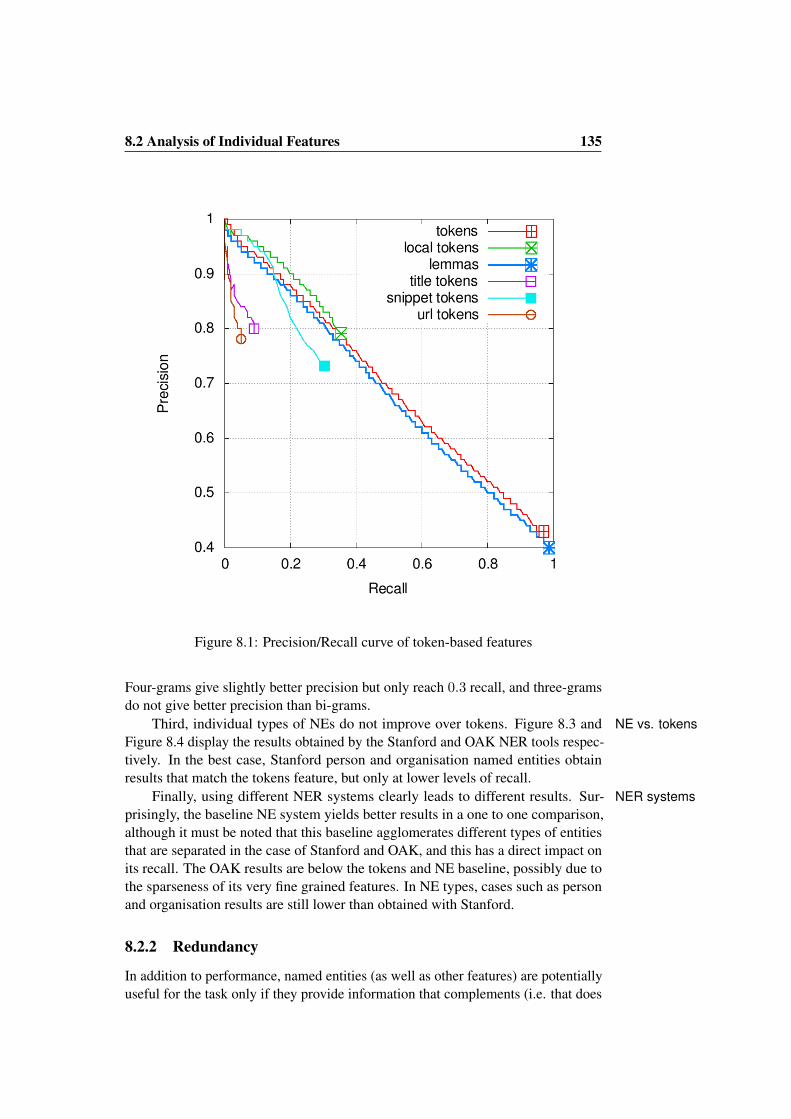
8.2 Analysis of Individual Features 135
Figure 8.1: Precision/Recall curve of token-based features
Four-grams give slightly better precision but only reach 0.3 recall, and three-gramsdo not give better precision than bi-grams.
Third, individual types of NEs do not improve over tokens. Figure 8.3 and NE vs. tokensFigure 8.4 display the results obtained by the Stanford and OAK NER tools respec-tively. In the best case, Stanford person and organisation named entities obtainresults that match the tokens feature, but only at lower levels of recall.
Finally, using different NER systems clearly leads to different results. Sur- NER systemsprisingly, the baseline NE system yields better results in a one to one comparison,although it must be noted that this baseline agglomerates different types of entitiesthat are separated in the case of Stanford and OAK, and this has a direct impact onits recall. The OAK results are below the tokens and NE baseline, possibly due tothe sparseness of its very fine grained features. In NE types, cases such as personand organisation results are still lower than obtained with Stanford.
8.2.2 Redundancy
In addition to performance, named entities (as well as other features) are potentiallyuseful for the task only if they provide information that complements (i.e. that does
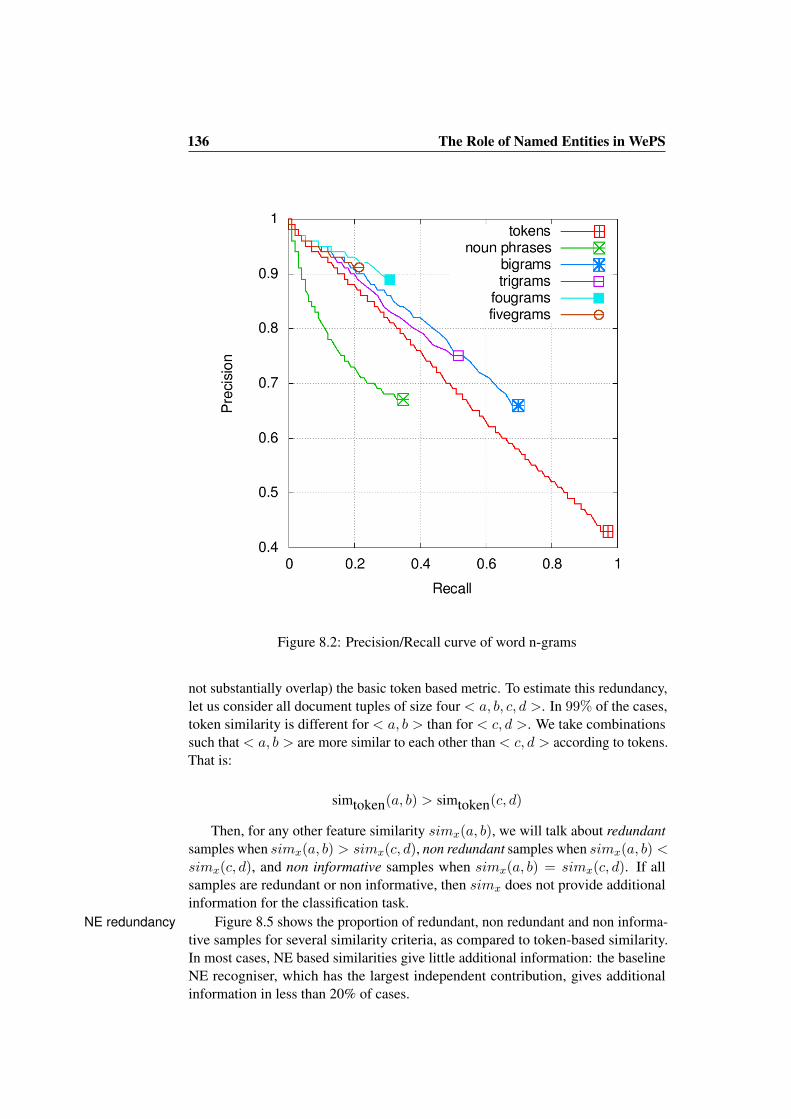
136 The Role of Named Entities in WePS
Figure 8.2: Precision/Recall curve of word n-grams
not substantially overlap) the basic token based metric. To estimate this redundancy,let us consider all document tuples of size four < a, b, c, d >. In 99% of the cases,token similarity is different for < a, b > than for < c, d >. We take combinationssuch that < a, b > are more similar to each other than < c, d > according to tokens.That is:
simtoken(a, b) > simtoken(c, d)
Then, for any other feature similarity simx(a, b), we will talk about redundantsamples when simx(a, b) > simx(c, d), non redundant samples when simx(a, b) <simx(c, d), and non informative samples when simx(a, b) = simx(c, d). If allsamples are redundant or non informative, then simx does not provide additionalinformation for the classification task.
Figure 8.5 shows the proportion of redundant, non redundant and non informa-NE redundancytive samples for several similarity criteria, as compared to token-based similarity.In most cases, NE based similarities give little additional information: the baselineNE recogniser, which has the largest independent contribution, gives additionalinformation in less than 20% of cases.
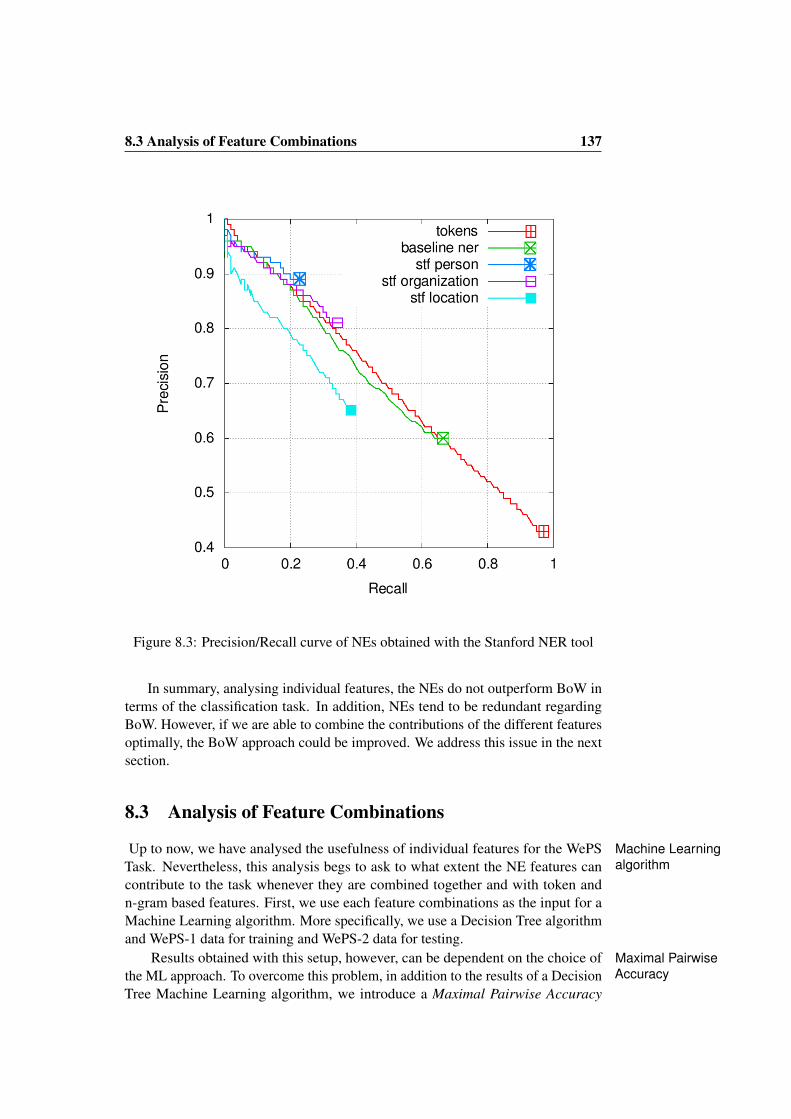
8.3 Analysis of Feature Combinations 137
Figure 8.3: Precision/Recall curve of NEs obtained with the Stanford NER tool
In summary, analysing individual features, the NEs do not outperform BoW interms of the classification task. In addition, NEs tend to be redundant regardingBoW. However, if we are able to combine the contributions of the different featuresoptimally, the BoW approach could be improved. We address this issue in the nextsection.
8.3 Analysis of Feature Combinations
Up to now, we have analysed the usefulness of individual features for the WePS Machine LearningalgorithmTask. Nevertheless, this analysis begs to ask to what extent the NE features can
contribute to the task whenever they are combined together and with token andn-gram based features. First, we use each feature combinations as the input for aMachine Learning algorithm. More specifically, we use a Decision Tree algorithmand WePS-1 data for training and WePS-2 data for testing.
Results obtained with this setup, however, can be dependent on the choice of Maximal PairwiseAccuracythe ML approach. To overcome this problem, in addition to the results of a Decision
Tree Machine Learning algorithm, we introduce a Maximal Pairwise Accuracy
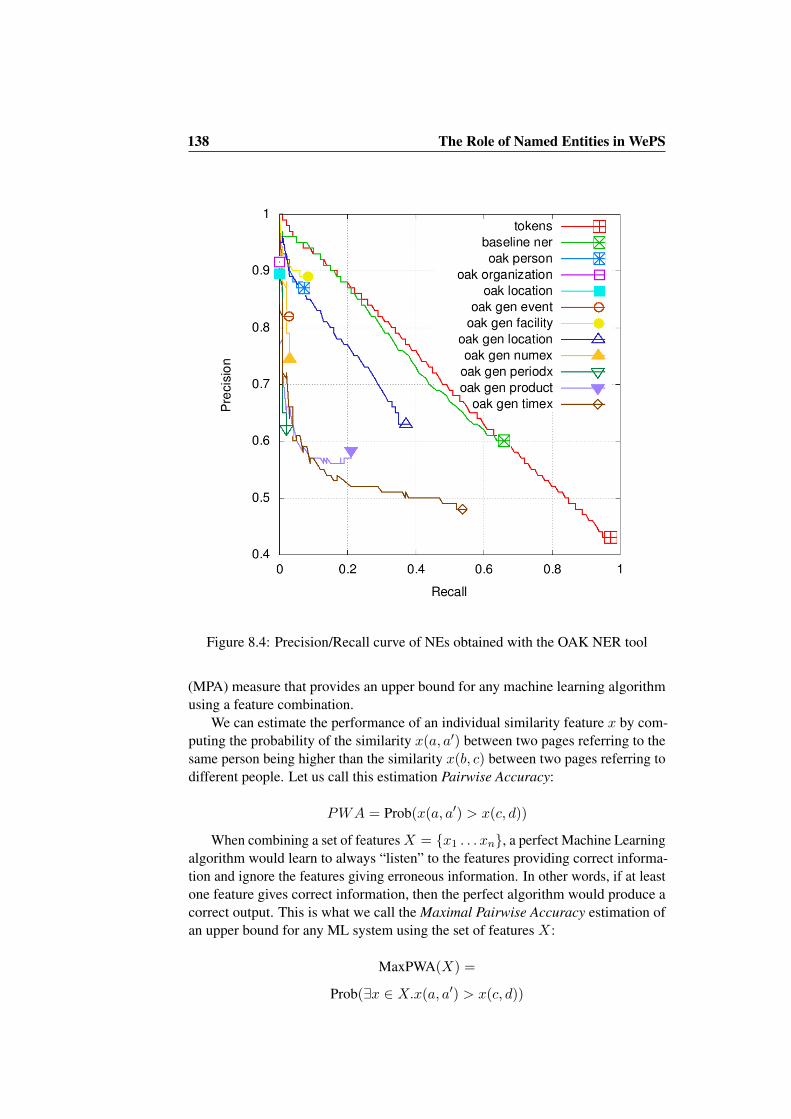
138 The Role of Named Entities in WePS
Figure 8.4: Precision/Recall curve of NEs obtained with the OAK NER tool
(MPA) measure that provides an upper bound for any machine learning algorithmusing a feature combination.
We can estimate the performance of an individual similarity feature x by com-puting the probability of the similarity x(a, a′) between two pages referring to thesame person being higher than the similarity x(b, c) between two pages referring todifferent people. Let us call this estimation Pairwise Accuracy:
PWA = Prob(x(a, a′) > x(c, d))
When combining a set of featuresX = {x1 . . . xn}, a perfect Machine Learningalgorithm would learn to always “listen” to the features providing correct informa-tion and ignore the features giving erroneous information. In other words, if at leastone feature gives correct information, then the perfect algorithm would produce acorrect output. This is what we call the Maximal Pairwise Accuracy estimation ofan upper bound for any ML system using the set of features X:
MaxPWA(X) =
Prob(∃x ∈ X.x(a, a′) > x(c, d))
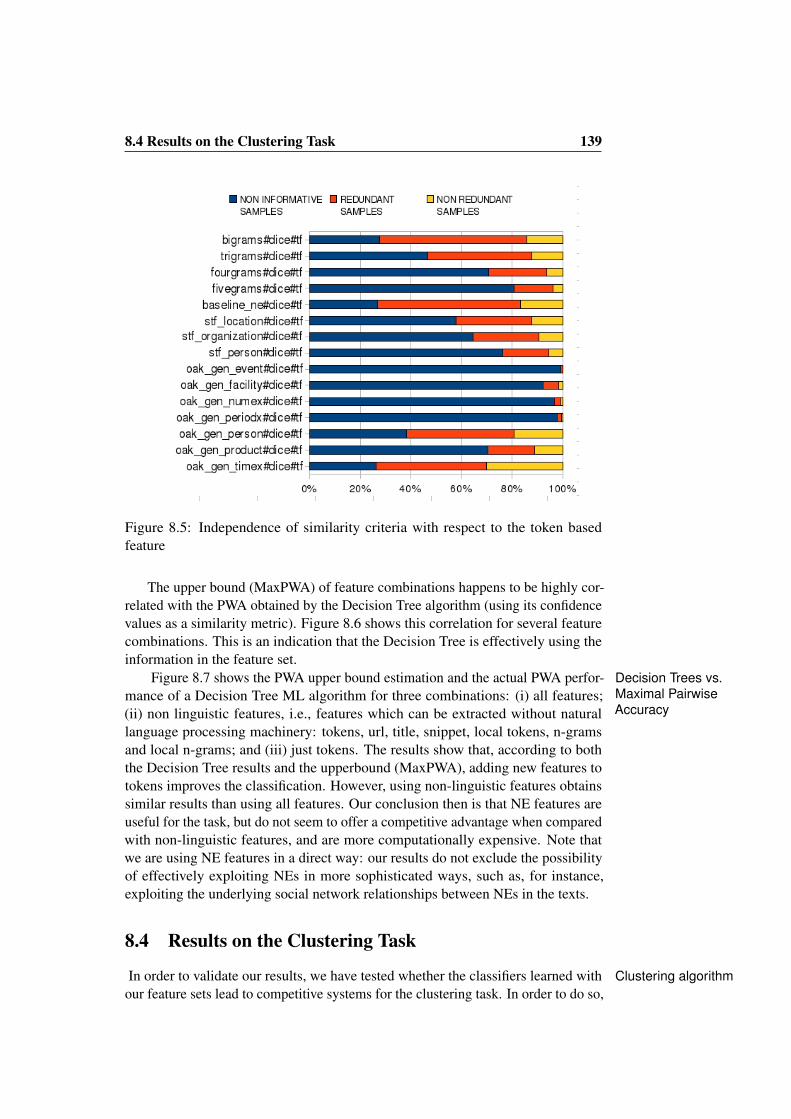
8.4 Results on the Clustering Task 139
Figure 8.5: Independence of similarity criteria with respect to the token basedfeature
The upper bound (MaxPWA) of feature combinations happens to be highly cor-related with the PWA obtained by the Decision Tree algorithm (using its confidencevalues as a similarity metric). Figure 8.6 shows this correlation for several featurecombinations. This is an indication that the Decision Tree is effectively using theinformation in the feature set.
Figure 8.7 shows the PWA upper bound estimation and the actual PWA perfor- Decision Trees vs.Maximal PairwiseAccuracy
mance of a Decision Tree ML algorithm for three combinations: (i) all features;(ii) non linguistic features, i.e., features which can be extracted without naturallanguage processing machinery: tokens, url, title, snippet, local tokens, n-gramsand local n-grams; and (iii) just tokens. The results show that, according to boththe Decision Tree results and the upperbound (MaxPWA), adding new features totokens improves the classification. However, using non-linguistic features obtainssimilar results than using all features. Our conclusion then is that NE features areuseful for the task, but do not seem to offer a competitive advantage when comparedwith non-linguistic features, and are more computationally expensive. Note thatwe are using NE features in a direct way: our results do not exclude the possibilityof effectively exploiting NEs in more sophisticated ways, such as, for instance,exploiting the underlying social network relationships between NEs in the texts.
8.4 Results on the Clustering Task
In order to validate our results, we have tested whether the classifiers learned with Clustering algorithmour feature sets lead to competitive systems for the clustering task. In order to do so,
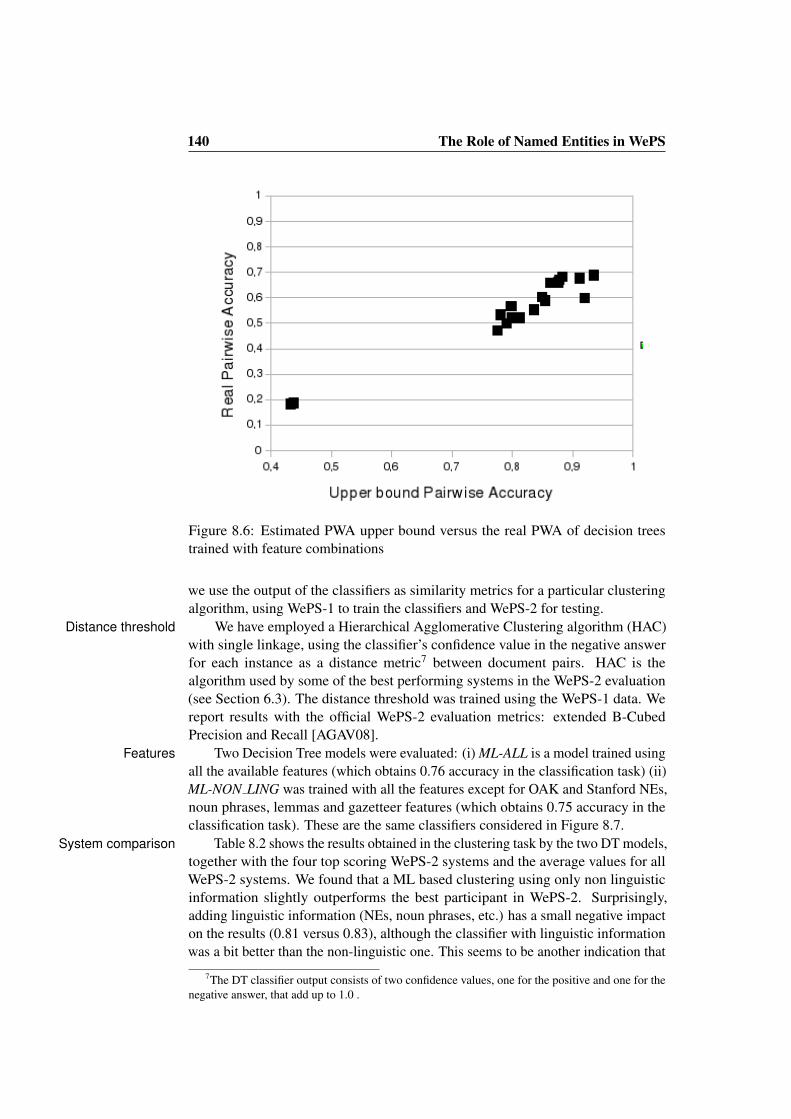
140 The Role of Named Entities in WePS
Figure 8.6: Estimated PWA upper bound versus the real PWA of decision treestrained with feature combinations
we use the output of the classifiers as similarity metrics for a particular clusteringalgorithm, using WePS-1 to train the classifiers and WePS-2 for testing.
We have employed a Hierarchical Agglomerative Clustering algorithm (HAC)Distance thresholdwith single linkage, using the classifier’s confidence value in the negative answerfor each instance as a distance metric7 between document pairs. HAC is thealgorithm used by some of the best performing systems in the WePS-2 evaluation(see Section 6.3). The distance threshold was trained using the WePS-1 data. Wereport results with the official WePS-2 evaluation metrics: extended B-CubedPrecision and Recall [AGAV08].
Two Decision Tree models were evaluated: (i) ML-ALL is a model trained usingFeaturesall the available features (which obtains 0.76 accuracy in the classification task) (ii)ML-NON LING was trained with all the features except for OAK and Stanford NEs,noun phrases, lemmas and gazetteer features (which obtains 0.75 accuracy in theclassification task). These are the same classifiers considered in Figure 8.7.
Table 8.2 shows the results obtained in the clustering task by the two DT models,System comparisontogether with the four top scoring WePS-2 systems and the average values for allWePS-2 systems. We found that a ML based clustering using only non linguisticinformation slightly outperforms the best participant in WePS-2. Surprisingly,adding linguistic information (NEs, noun phrases, etc.) has a small negative impacton the results (0.81 versus 0.83), although the classifier with linguistic informationwas a bit better than the non-linguistic one. This seems to be another indication that
7The DT classifier output consists of two confidence values, one for the positive and one for thenegative answer, that add up to 1.0 .
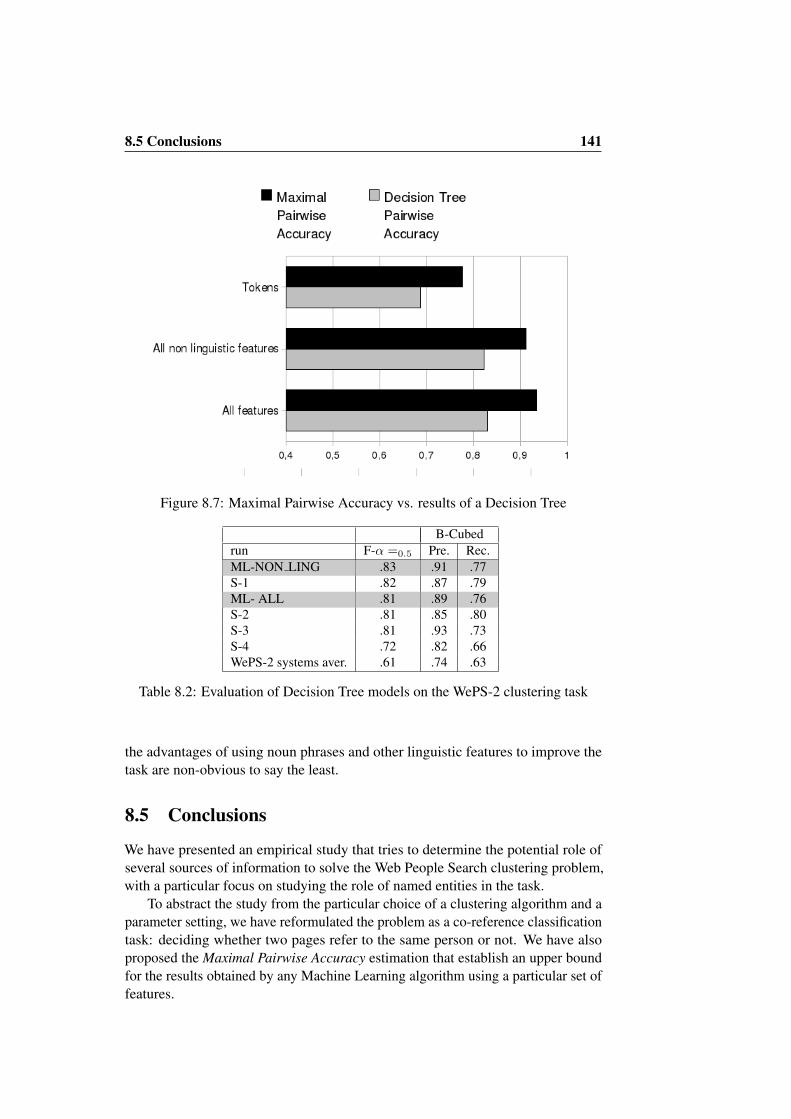
8.5 Conclusions 141
Figure 8.7: Maximal Pairwise Accuracy vs. results of a Decision Tree
B-Cubedrun F-α =0.5 Pre. Rec.ML-NON LING .83 .91 .77S-1 .82 .87 .79ML- ALL .81 .89 .76S-2 .81 .85 .80S-3 .81 .93 .73S-4 .72 .82 .66WePS-2 systems aver. .61 .74 .63
Table 8.2: Evaluation of Decision Tree models on the WePS-2 clustering task
the advantages of using noun phrases and other linguistic features to improve thetask are non-obvious to say the least.
8.5 Conclusions
We have presented an empirical study that tries to determine the potential role ofseveral sources of information to solve the Web People Search clustering problem,with a particular focus on studying the role of named entities in the task.
To abstract the study from the particular choice of a clustering algorithm and aparameter setting, we have reformulated the problem as a co-reference classificationtask: deciding whether two pages refer to the same person or not. We have alsoproposed the Maximal Pairwise Accuracy estimation that establish an upper boundfor the results obtained by any Machine Learning algorithm using a particular set offeatures.
142 The Role of Named Entities in WePS
Our results indicate that (i) named entities do not provide a substantial competi-tive advantage in the clustering process when compared to a rich combination ofsimpler features that do not require linguistic processing (local, global and snippettokens, n-grams, etc.); (ii) results are sensitive to the NER system used: when usingall NE features for training, the richer number of features provided by OAK seemsto have an advantage over the simpler set of NE classes in Stanford NER and abaseline NE system.
This is not exactly a prescription against the use of NEs for Web People Search,because linguistic knowledge can be useful for other aspects of the problem, such asvisualisation of results and description of the persons/clusters obtained: for example,from a user point of view a network of the connections of a person with otherpersons and organisations (which can only be done with NER) can be part of aperson’s profile and may help to provide a summary of the cluster contents. Andyet, from the perspective of the clustering problem per se, a direct use of NEs andother linguistic features does not seem to pay off.
Chapter 9
Conclusions
We now summarise the results obtained in this work, highlight our contributions tothe research topic and discuss our plans for future work.
9.1 Contributions
In this thesis, we have made a number of contributions to the problem of nameambiguity while searching for people in the World Wide Web. These contributionsfocused on five main topics: (i) a study of the actual necessity to solve this problemautomatically, (ii) the development of reference test collections, (iii) the developmentof improved evaluation metrics, (iv) a thorough study of the relevance of predictingthe number of clusters and its implication in the evaluation process and (v) anin-depth study of the role named entities and other linguistic features play in thistask. Our work has led to a number of scientific conclusions and also to therelease of a number of software packages for the research community; both types ofcontributions are summarised below.
9.1.1 The Need for Name Disambiguation Systems
Our experimentation on the scope of query refinement strategies (see Chapter 7) hasprovided us with empirical evidence of the actual need for automatic approachesto the task. We have found that in most cases there is an optimal query refinement(i.e. a number of words added to the person name) which leads to near optimalprecision and recall. However, this high performance query refinement is unlikelyto be hypothesized by an actual user in a practical search scenario. Therefore, it isindeed necessary to develop automatic approaches in order to help users to find allrelevant information about the person they are looking up.
This result supports the interest raised by the problem both in the scientificcommunity and in the Web search business (see Chapter 1). As it happens, given thefact that there usually is a near-perfect refinement, this trend can be used to developnew approaches to the problem (search for optimal query refinements).
144 Conclusions
9.1.2 Development of Reference Test collections
We carried out a dedicated evaluation campaign, WePS, held in 2007 (as a SemEval2007 task) and in 2009 (as a WWW 2009 workshop). These campaigns laid thefoundations of a proper scientific study of the Web People Search problem. Thesewere our main accomplishments:
• Standardisation of the problem: at present, a majority of researchers fo-cuses on the problem as a search results mining (clustering and informationextraction) task, as it has been defined in WePS.
• Creation of standard benchmarks for the task: since the launch of the firstWePS campaign in 2007, the number of publications related to Web PeopleSearch has grown substantially. Most of them use the WePS test suites as ade facto standard benchmark. As of summer 2009 there were already morethan 70 research papers citing WePS overviews; this not only suggests thatWePS has indeed become a standard reference for the task, but also that it hascontributed to raise the interest in this kind of research problems.
WePS-1 and WePS-2 datasets were built following a consistent methodology,and altogether provide a reasonable benchmark with around 8,000 manually an-notated documents (including an exhaustive annotation of person attributes in theWePS-2 dataset). The decision to create the testbeds manually was supportedby careful study of previous research. Other testbeds using automatic annotationmethods (pseudo-ambiguity) do not provide a realistic distribution of individualsassociated to a name (see Section 2.1.2). In this thesis, we have shown this is a keyaspect of the task, since the number of individuals sharing a person name is difficultto predict. Even names obtained from the same sources (in our case, Wikipediaentries and a list of prominent scholars in a specific Computer Science field) presenta wide dispersion of their ambiguity. Furthermore, the overall degree of ambiguitydoes not seem to follow a normal distribution.
Nevertheless, manual annotation constitutes an expensive, somewhat tricky pro-cess (see Sections 3.2.3 and 6.1.3). Before starting the WePS campaign, we expectedannotation to be much simpler than for a Word Sense Disambiguation testbed. Afterall, we just had to distinguish homographs, and being able to distinguish whethertwo documents refer to two different (and often unrelated) people seemed quitean easy task to accomplish. It appears we had too optimistic expectancies: webdocuments are often very short, and they tend to provide partial descriptions ofpeople. When comparing two documents, we usually have two partial descriptionswhich are more or less likely to be compatible. For instance, if two people share thesame name, the same job and they live in the same city, they are probably (but notcertainly!) the same, the probability depending on the actual size of the city, thespecificity of the job and the originality of the name. For this reason, if we wantto create a consistent testbed, it is utterly necessary to train assessors to reach acommon implicit evidence threshold for clustering two documents.
Note that we had to remove certain (otherwise valid) types of documents, suchas genealogies and public (that is, Facebook-like) profiles from social networks,
9.1 Contributions 145
because either they introduce a great deal of uncertainty in the clustering process(Facebook public profiles are usually very thin) or they require too much annotationeffort (as is usually case with genealogies). Even after removing these pages,there still was a considerable number of documents humans could not annotatewith absolute certainty. In any case we found that, although the annotation task isdifficult, rankings are stable across different annotators (similarly to what happensin traditional IR test collections): when evaluating systems using gold standardsproduced independently by two annotators there was no significant changes in thesystem ranking (see Section 3.2.3).
9.1.3 Development of Improved Clustering Evaluation Metrics
The first step we need to take in order to assess the appropriateness of an evaluationmetric is to define the set of constraints that must be satisfied. We have seenthat the constraints found in the state of the art can be summarised in just fourboundary conditions, setting aside scale aspects (see Section 4). When we examinedthe variety of clustering metrics that had been proposed, we grouped them infamilies and observed that metrics in each family satisfied the same basic conditions.Surprisingly all evaluation metrics (with the notable exception of BCubed precisionand recall), did not satisfy all four conditions.
Another aspect we have analysed is the evaluation of overlapping clustering.In spite of overlapping not being a very frequent phenomenon in this task, it isnecessary to take it into account during the evaluation process. After extendingthe BCubed metrics for overlapping clusters, our experiments showed that theyovercame the limitations of other standard clustering metrics.
Finally, we also proposed the Unanimous Improvement Ratio as a measurethat complements Precision and Recall weighting functions (most prominently VanRijsbergen’s F measure) indicating the robustness of differences in F to changesin the α parameter that assigns the relative weights of Precision and Recall. OurUnanimous Improvement Ratio can be used in any evaluation methodology thatinvolves combining the contribution from different quality metrics, but it is ofparticular value in the context of text clustering tasks. One of the reasons for thiscircumstance is the crucial role played by the clustering stopping criterion whichdetermines the number of clusters in the output. In terms of the WePS task, thiscriterion should match with the number of individuals associated with a name, thatis, the degree of ambiguity.
9.1.4 The Relevance of the Clustering Stopping Criterion
Both in the state of the art collections and in our own testbeds, we have seen that thedegree of ambiguity is quite variable and it is not as predictable as expected, evenwhen comparing names from the same source (e.g. encyclopedia). This aspect of theproblem presents a challenge for systems. According to our experiments, a simplebaseline system can achieve higher scores than the best team in WePS competitionsby using the best possible threshold for each topic (see Section 8.4). Therefore,
146 Conclusions
the accurate estimation of the number of clusters represents a key aspect of thedisambiguation process. Nevertheless, a good cluster stopping criterion has provedto be insufficient for achieving a high performance. Our experiments indicate thattraining the stopping criteria over a baseline approach achieves poor results (seeSection 8.4). However, whenever the relative weight of similarity features is trainedas well, a robust and competitive result is obtained (see Section 6.4).
In terms of evaluation, the stopping criterion determines the trade-off betweenprecision and recall metrics (e.g. Purity and Inverse Purity). We have shown thatthis trade-off is more prominent across clustering systems than in other tasks (seeSection 5.1). This notion leads to a high variability in the rankings depending onthe relative weight of individual metrics. That is why the Unanimous ImprovementRatio provides crucial information in the context of the task.
9.1.5 The Role of Named Entities
Most recent work on name ambiguity uses person names, organisations and locationscoocurring in documents as a key feature for the task. Consequently, named entityrecognition has been used extensively in name disambiguation systems. One ofour goals here was to check whether linguistic information and named entities inparticular – which are computationally costly to extract, as compared to the usualInformation Retrieval features – can indeed provide a competitive advantage tosolve name ambiguity in Web People Search.
Our experiments have shown that named entities are not necessarily more usefulthan other features such as word n-grams (see Section 8). Given the fact thatthis notion represents a negative result, we have been particularly exhaustive inour experimentation. We have compared the performance of different documentrepresentations in terms of detecting coreferent document pairs and also in termsof clustering. In addition, we have considered feature types both individually andin combination. During the study, we found that named entities did not achievebetter results than word n-grams in this particular case. The combination of bothtypes of features using machine learning algorithms does not seem able to providebetter results than n-grams. In broad terms, our experiments indicate that linguisticinformation (named entities, noun phrases, etc.) cannot be directly exploited bya machine learning process to provide better results than computationally cheapfeatures such as word n-grams.
But the latter result does not necessarily represent a prescription against usingnamed entities in order to solve the problem. We have just used explicit namedentity occurrences in the documents as candidate features for Machine Learningalgorithms, but there are more sophisticated ways of using this type of information.For instance, named entities are interrelated, and the social network of entities canperhaps be used to add implicit information into the clustering process (or even moreso, to lead the whole process!). In addition, extracting named entities is probablyuseful to present the information to the user and simplify the task of choosing theintended person/cluster.
9.2 Further Directions 147
9.1.6 Testbeds and Software Released
During the research phase of this thesis, three products have been both generatedand made available to the research community:
• The large testbed for the Web People Search task 1. This testbed consists ofthree manually annotated collections developed for the WePS-1 and WePS-2evaluation campaigns [AGV05, AGS07, AGS09]. The WePS datasets havebeen used in research works other than the WePS campaigns (see for instance[KNTM08, CMP08]). These specific collections have been made availablepre-processed, semantically annotated with NLP tools and indexed with theLucene search software. Both are freely downloadable from the Web.
• A graphical user interface has been designed to assist the manual groupingof document collections. The interface has been used for the generation ofthe WePS-2 clustering test collection and can be employed in the annotationprocess of other document clustering tasks.
• An evaluation package has been released, including standard clustering evalu-ation metrics, the extended BCubed metrics and the Unanimous ImprovementRatio .
9.2 Further Directions
There are at least four research questions which remain open for future work:The first one consists on the exploration of new approaches to the representation
of documents. Some of the aspects that could be studied in the future includefeature weighting techniques, the definition of new similarity metrics betweendocuments and the usage of external resources such as Wikipedia or the GoogleN-gram corpus. These studies should set the ground for stronger baseline systemsin future evaluation campaigns.
Regarding the evaluation, the methods proposed for WePS task can be appliedto new domains and tasks. In addition, we are currently working on the definition ofclustering quality metrics that take into account the estimated cognitive effort of theuser whenever exploring search results. Although some models have been proposed[HP96, Leu01, CPGV05], they do not consider aspects such as the probability thata cluster would be explored by the user. Generally speaking, we have to study howbest to assist users when searching people in the Web by considering the interactiveaspects of the task and bringing actual users into the evaluation loop.
Finally, there seem to be many possibilities for future WePS campaigns. TheWeb People Search problem is related also to the problem of searching organisationsin the Web. It seems we could easily extend the task in this direction. It is alsointeresting to consider the multilingual aspects of the task. Indeed, current WebPeople Search engines (Spock, Zoominfo, etc.) are not yet able to identify that two
1Available in http://nlp.uned.es/weps/weps-1-data/ and http://nlp.uned.es/weps/weps-2-data/
148 Conclusions
document clusters actually refer to the same person whenever they are expressed indifferent languages. Another interesting aspect is to address the relations betweenclustering and attribute extraction in an integrated task. This should provide newinsights into the challenges faced by WePS systems. Finally, WePS participantshave also suggested to have a track where participants share the same documentrepresentations (feature vectors), and therefore focus exclusively on how to use thatrepresentation to provide an efficient clustering.
Let us conclude by observing that searching people in the World Wide Webis one of the many tasks which were not adequately supported by standard searchengines when we started this research, back in 2004. Since then, things havequickly evolved in the Web: people enter personal information in different ways (forinstance, having a Facebook profile is now much more common than having a webhome page or a blog), and search engines integrate a higher amount of information(not just web pages) in a much more sophisticated manner. We see our researcheffort as a modest contribution in a massive effort to turn Web search facilities intopowerful text mining engines. These mining engines will be able to filter, classifyand synthesise information in different ways according to different informationneeds. We hope that our research represents a step – even if small – into one ofthe biggest challenges faced by this type of systems: facing name ambiguity as anessential step towards effective information fusion.

Bibliography
[AAG09] Javier Artiles, Enrique Amigo, and Julio Gonzalo. The role ofnamed entities in Web People Search. In EMNLP ’09: Proceed-ings of the ACL-09 conference on Empirical methods in NaturalLanguage Processing. Association for Computational Linguistics,2009.
[AE06] Eneko Agirre and Philip Edmonds, editors. Word Sense Disam-biguation: Algorithms and Applications. Springer, 2006.
[AGA09a] Enrique Amigo, Julio Gonzalo, and Javier Artiles. CombiningEvaluation Metrics via the Unanimous Improvement Ratio and itsApplication in WePS Clustering Task. In 2nd Web People SearchEvaluation Workshop (WePS 2009), 18th WWW Conference, 2009.
[AGA09b] Javier Artiles, Julio Gonzalo, and Enrique Amigo. The impactof query refinement in the Web People Search Task. In ACL2009, Proceedings of the 47th Annual Meeting of the Associationfor Computational Linguistics. Association for ComputationalLinguistics, 2009.
[AGAV08] Enrique Amigo, Julio Gonzalo, Javier Artiles, and Felisa Verdejo.A comparison of extrinsic clustering evaluation metrics based onformal constraints. Journal of Information Retrieval, 2008.
[AGS07] Javier Artiles, Julio Gonzalo, and Satoshi Sekine. The SemEval-2007 WePS Evaluation: Establishing a benchmark for the WebPeople Search Task. In Proceedings of the Fourth InternationalWorkshop on Semantic Evaluations (SemEval-2007). Associationfor Computational Linguistics, 2007.
[AGS09] Javier Artiles, Julio Gonzalo, and Satoshi Sekine. WePS 2 Evalu-ation Campaign: Overview of the Web People Search ClusteringTask. In 2nd Web People Search Evaluation Workshop (WePS2009), 18th WWW Conference, 2009.
[AGV05] Javier Artiles, Julio Gonzalo, and Felisa Verdejo. A testbed forpeople searching strategies in the WWW. In SIGIR, 2005.
150 BIBLIOGRAPHY
[AKE04] Reema Al-Kamha and David Embley. Grouping search-enginereturned citations for person-name queries. In WIDM ’04: Pro-ceedings of the 6th annual ACM international workshop on Webinformation and data management. ACM Press, 2004.
[ASG08] Javier Artiles, Satoshi Sekine, and Julio Gonzalo. Web PeopleSearch: results of the first evaluation and the plan for the second.In WWW ’08: Proceeding of the 17th international conference onWorld Wide Web, pages 1071–1072, New York, NY, USA, 2008.ACM.
[BAdR07] Krisztian Balog, Leif Azzopardi, and Maarten de Rijke. UVA:Language Modeling Techniques for Web People Search. In Pro-ceedings of the Fourth International Workshop on Semantic Eval-uations. ACL, 2007.
[Bal08] Krisztian Balog. People Search in the Enterprise. PhD thesis,University of Amsterdam, June 2008.
[BB98a] Amit Bagga and Breck Baldwin. Algorithms for scoring corefer-ence chains. In In The First International Conference on LanguageResources and Evaluation Workshop on Linguistics Coreference,pages 563–566, 1998.
[BB98b] Amit Bagga and Breck Baldwin. Entity-Based Cross-DocumentCoreferencing Using the Vector Space Model. In Proceedings ofthe 36th Annual Meeting of the Association for Computational Lin-guistics and the 17th International Conference on ComputationalLinguistics (COLING-ACL’98), pages 79–85, 1998.
[BF08] Alex Baron and Marjorie Freedman. Who is Who and What isWhat: Experiments in Cross-Document Co-Reference. In EMNLP,pages 274–283. Association for Computational Linguistics, 2008.
[BHH+09] Krisztian Balog, Jiyin He, Katja Hofmann, Valentin Jijkoun,Christof Monz, Manos Tsagkias, Wouter Weerkamp, and Maartende Rijke. The University of Amsterdam at WePS2. In 2nd WebPeople Search Evaluation Workshop (WePS 2009), 18th WWWConference, 2009.
[BHK02] J. Bakus, M. F. Hussin, and M. Kamel. A SOM-Based DocumentClustering Using Phrases. In Proceedings of the 9th InternationalConference on Neural Information Procesing (ICONIP’02), 2002.
[Blu05] Matthias Blume. Automatic Entity Disambiguation: Benefitsto NER, Relation Extraction, Link Analysis, and Inference. InInternational Conference on Intelligence Analysis, 2005.
BIBLIOGRAPHY 151
[BM05] Ron Bekkerman and Andrew McCallum. Disambiguating WebAppearances of People in a Social Network. In Proceedings ofthe 14th international conference on World Wide Web, 2005.
[BMI06] Danushka Bollegala, Yutaka Matsuo, and Mitsuru Ishizuka. Ex-tracting Key Phrases to Disambiguate Personal Name Queries inWeb Search. In Proceedings of the Workshop on How Can Com-putational Linguistics Improve Information Retrieval? at ACL’06,2006.
[CdVS05] Nick Craswell, Arjen de Vries, and Ian Soboroff. Overview ofthe TREC-2005 Enterprise Track. In TREC 2005 ConferenceNotebook, pages 199–205, 2005.
[CLH09] Ying Chen, Sophia Yat Mei Lee, and Chu-Ren Huang. PolyUHK:A Robust Information Extraction System for Web Personal Names.In 2nd Web People Search Evaluation Workshop (WePS 2009),18th WWW Conference, 2009.
[CM07a] Ying Chen and James Martin. Towards Robust UnsupervisedPersonal Disambiguation. In EMNLP-CoNLL-2007, 2007.
[CM07b] Ying Chen and James H. Martin. CU-COMSEM: Exploring RichFeatures for Unsupervised Web Personal Name Disambiguation.In Proceedings of the Fourth International Workshop on SemanticEvaluations. ACL, 2007.
[CMP08] Ying Chen, James Martin, and Martha Palmer. Robust Disam-biguation of Web-Based Personal Names. In ICSC ’08: Pro-ceedings of the 2008 IEEE International Conference on SemanticComputing, pages 276–283, Washington, DC, USA, 2008. IEEEComputer Society.
[CPGV05] Juan M. Cigarran, Anselmo Penas, Julio Gonzalo, and FelisaVerdejo. Evaluating Hierarchical Clustering of Search Results. InSPIRE, pages 49–54, 2005.
[Cuc07] Silviu Cucerzan. Large Scale Named Entity DisambiguationBased on Wikipedia Data. In The EMNLP-CoNLL-2007, 2007.
[Dom01] Byron Dom. An Information-Theoretic External Cluster-ValidityMeasure. IBM Research Report, 2001.
[dVAdPSVD07] David del Valle-Agudo, Cesar de Pablo-Sanchez, andMarıa Teresa Vicente-Dıez. UC3M-13: Disambiguation of PersonNames Based on the Composition of Simple Bags of Typed Terms.In Proceedings of the Fourth International Workshop on SemanticEvaluations. ACL, 2007.
152 BIBLIOGRAPHY
[EE07] Jeremy Ellman and Gary Emery. UNN-WePS: Web Person Searchusing co-Present Names and Lexical Chains. In Proceedingsof the Fourth International Workshop on Semantic Evaluations.Association for Computational Linguistics, 2007.
[ETY+07] Ergin Elmacioglu, Yee Fan Tan, Su Yan, Min-Yen Kan, and Dong-won Lee. PSNUS: Web People Name Disambiguation by SimpleClustering with Rich Features. In Proceedings of the Fourth In-ternational Workshop on Semantic Evaluations. Association forComputational Linguistics, 2007.
[FH04] Michael Ben Fleischman and Eduard Hovy. Multi-DocumentPerson Name Resolution. In 42nd Annual Meeting of the Associa-tion for Computational Linguistics (ACL), Reference ResolutionWorkshop, 2004.
[GA04] Chung Heong Gooi and James Allan. Cross-Document Corefer-ence on a Large Scale Corpus. In HLT-NAACL, 2004.
[GCY92] William A. Gale, Kenneth W. Church, and David Yarowsky. Workon statistical methods for Word Sense Disambiguation. In WorkingNotes of the AAAI Fall Symposium on Probabilistic Approachesto Natural Language, pages 54–60, 1992.
[Gho03] J. Ghosh. Scalable Clustering Methods for Data Mining. In NongYe, editor, Handbook of Data Mining. Lawrence Erlbaum, 2003.
[GMV+09] Jose Carlos Gonzalez, Pablo Mate, Laura Vadillo, Rocıo So-tomayor, and Alvaro Carrera. Learning by doing: A baseline ap-proach to the clustering of web people search results. In 2nd WebPeople Search Evaluation Workshop (WePS 2009), 18th WWWConference, 2009.
[GO09] Jun Gong and Douglas Oard. Determine the Entity Number inHierarchical Clustering for Web Personal Name Disambiguation.In 2nd Web People Search Evaluation Workshop (WePS 2009),18th WWW Conference, 2009.
[Gri94] Ralph Grishman. Whither written language evaluation? In HLT’94: Proceedings of the workshop on Human Language Technol-ogy, pages 120–125, Morristown, NJ, USA, 1994. Association forComputational Linguistics.
[Guh04] Guha, R. and Garg, A. Disambiguating people in search. Technicalreport, Stanford University, 2004.
[HBV01] Maria Halkidi, Yannis Batistakis, and Michalis Vazirgiannis. OnClustering Validation Techniques. Journal of Intelligent Informa-tion Systems, 17(2-3):107–145, 2001.
BIBLIOGRAPHY 153
[HN07] Andrea Heyl and Gunter Neumann. DFKI2: An InformationExtraction Based Approach to People Disambiguation. In Pro-ceedings of the Fourth International Workshop on Semantic Eval-uations. Association for Computational Linguistics, 2007.
[HP96] Marti A. Hearst and Jan O. Pedersen. Reexamining the clus-ter hypothesis: scatter/gather on retrieval results. In SIGIR ’96:Proceedings of the 19th annual international ACM SIGIR confer-ence on Research and development in information retrieval, pages76–84. ACM Press, 1996.
[HZ09] Xianpei Han and Jun Zhao. CASIANED: Web Personal NameDisambiguation Based on Professional Categorization. In 2nd WebPeople Search Evaluation Workshop (WePS 2009), 18th WWWConference, 2009.
[HZG05] Hui Han, Hongyuan Zha, and C. Lee Giles. Name disambigua-tion in author citations using a K-way spectral clustering method.pages 334–343, June 2005.
[IOS+09] Masaki Ikeda, Shingo Ono, Issei Sato, Minoru Yoshida, and Hi-roshi Nakagawa. Person Name Disambiguation on the Web byTwoStage Clustering. In 2nd Web People Search Evaluation Work-shop (WePS 2009), 18th WWW Conference, 2009.
[IXZ07] Jose Iria, Lei Xia, and Ziqi Zhang. WIT: Web People Search Dis-ambiguation using Random Walks. In Proceedings of the FourthInternational Workshop on Semantic Evaluations. Association forComputational Linguistics, 2007.
[KB07] Paul Kalmar and Matthias Blume. FICO: Web Person Disambigua-tion Via Weighted Similarity of Entity Contexts. In Proceedingsof the Fourth International Workshop on Semantic Evaluations.Association for Computational Linguistics, 2007.
[KCN+07] Dmitri V. Kalashnikov, Stella Chen, Rabia Nuray, Sharad Mehro-tra, and Naveen Ashish. Disambiguation Algorithm for PeopleSearch on the Web. In Proc. of IEEE International Conference onData Engineering (IEEE ICDE), 2007.
[KF09] Paul Kalmar and Dayne Freitag. Features for Web Person Dis-ambiguation. In 2nd Web People Search Evaluation Workshop(WePS 2009), 18th WWW Conference, 2009.
[KNL+09] I.S. Kang, S.H. Na, S. Lee, H. Jung, P. Kim, W.K. Sung, and J.H.Lee. On co-authorship for author disambiguation. InformationProcessing and Management, 45(1):84–97, 2009.
154 BIBLIOGRAPHY
[KNTM08] Dmitri V. Kalashnikov, Rabia Nuray-Turan, and Sharad Mehrotra.Towards Breaking the Quality Curse. A Web-Querying Approachto Web People Search. In Proc. of Annual International ACMSIGIR Conference, 2008.
[LA99] B. Larsen and C. Aone. Fast and Effective Text Mining UsingLinear-Time Document Clustering. In Knowledge Discovery andData Mining, pages 16–22, 1999.
[Leu01] Anton Leuski. Evaluating document clustering for InteractiveInformation Retrieval. In CIKM ’01: Proceedings of the tenthinternational conference on Information and knowledge manage-ment, pages 33–40, New York, NY, USA, 2001. ACM.
[LFHDC09] Els Lefever, Timur Fayruzov, Veronique Hoste, and MartineDe Cock. Fuzzy Ants Clustering for Web People Search. In2nd Web People Search Evaluation Workshop (WePS 2009), 18thWWW Conference, 2009.
[LHF07] Els Lefever, Veronique Hoste, and Timur Fayruzov. AUG: Acombined classification and clustering approach for web peopledisambiguation. In Proceedings of the Fourth International Work-shop on Semantic Evaluations. Association for ComputationalLinguistics, 2007.
[LMR05] X. Li, P. Morie, and D. Roth. Semantic integration in text: Fromambiguous names to identifiable entities. AI Magazine. SpecialIssue on Semantic Integration, 26(1):45–58, 2005.
[LZL+09] Man Lan, Yu Zhe Zhang, Yue Lu, Jian Su, and Chew Lim Tan.Which who are they? people attribute extraction and disambigua-tion in web search results. In 2nd Web People Search EvaluationWorkshop (WePS 2009), 18th WWW Conference, 2009.
[Mal05] Bradley Malin. Unsupervised name disambiguation via social net-work similarity. In Workshop on Link Analysis, Counterterrorism,and Security, 2005.
[Man06] Gideon Mann. Multi-Document Statistical Fact Extraction andFusion. PhD thesis, Johns Hopkins University, 2006.
[Mei03] Marina Meila. Comparing clusterings. In Proceedings of COLT03, 2003.
[MRA09] Juan Martınez-Romo and Lourdes Araujo. Web People SearchDisambiguation using Language Model Techniques. In 2nd WebPeople Search Evaluation Workshop (WePS 2009), 18th WWWConference, 2009.
BIBLIOGRAPHY 155
[MS99] Christopher D. Manning and Hinrich Schtze. Foundations ofStatistical Natural Language Processing. The MIT Press, June1999.
[MY03] Gideon S. Mann and David Yarowsky. Unsupervised personalname disambiguation. In Proceedings of the Seventh Confer-ence on Natural Language Learning (CoNLL) at HLT-NAACL.Association for Computational Linguistics, 2003.
[NC08] Hien T. Nguyen and Tru H. Cao. Named Entity Disambiguation:A Hybrid Statistical and Rule-Based Incremental Approach, pages420–433. Springer, 2008.
[Nei02] D. B. Neill. Fully Automatic Word Sense Induction by SemanticClustering. Master’s thesis, Cambridge University, 2002.
[NLS04] Cheng Niu, Wei Li, and Rohini K. Srihari. Weakly supervisedlearning for cross-document person name disambiguation sup-ported by information extraction. In Proceedings of the 42ndAnnual Meeting on Association for Computational Linguistics.Association for Computational Linguistics, 2004.
[NTCKM09] Rabia Nuray-Turan, Zhaoqi Chen, Dmitri Kalashnikov, andSharad Mehrotra. Exploiting Web querying for Web People Searchin WePS2. In Rabia Nuray-Turan Zhaoqi Chen Dmitri V. Kalash-nikov Sharad Mehrotra, 2009.
[Ped06] Ted Pedersen. Improving Name Discrimination : A LanguageSalad Approach. In Proceedings of the EACL 2006 Workshop onCross-Language Knowledge Induction, 2006.
[PK06] Ted Pedersen and Anagha Kulkarni. Automatic cluster stoppingwith criterion functions and the gap statistic. In Proceedingsof the 2006 Conference of the North American Chapter of theAssociation for Computational Linguistics on Human LanguageTechnology, pages 276–279, Morristown, NJ, USA, 2006. Associ-ation for Computational Linguistics.
[PL02a] P. Pantel and D. Lin. Efficiently Clustering Documents withCommittees. In Proceedings of the PRICAI 2002 7th Pacific RimInternational Conference on Artificial Intelligence, pages 18–22,Tokyo, Japan, August 2002.
[PL02b] Patrick Pantel and Dekang Lin. Discovering word senses fromtext. In KDD ’02: Proceedings of the eighth ACM SIGKDD in-ternational conference on Knowledge discovery and data mining,pages 613–619, New York, NY, USA, 2002. ACM.
156 BIBLIOGRAPHY
[PM07] Octavian Popescu and Bernardo Magnini. IRST-BP: Web Peo-ple Search Using Name Entities. In Proceedings of the FourthInternational Workshop on Semantic Evaluations. Association forComputational Linguistics, 2007.
[PNH06] Xuan-Hieu Phan, Le-Minh Nguyen, and Susumu Horiguchi. Per-sonal Name Resolution Crossover Documents by a Semantics-Based Approach. IEICE TRANS. INF. & SYST., E89-D, 2006.
[PPK05] Ted Pedersen, Amruta Purandare, and Anagha Kulkarni. NameDiscrimination by Clustering Similar Contexts. In CICLing, 2005.
[PTV+09] David Pinto, Mireya Tovar, Darnes Vilarino, Hector Dıaz, andHector Jimenez-Salazar. An Unsupervised Approach based onFingerprinting to the Web People Search task. In 2nd Web PeopleSearch Evaluation Workshop (WePS 2009), 18th WWW Confer-ence, 2009.
[Rap03] Reinhard Rapp. Word sense discovery based on sense descriptordissimilarity. In Proceedings of the Ninth Machine TranslationSummit, pages 315–322, 2003.
[RBGST09] Lorenza Romano, Krisztian Buza, Claudio Giuliano, and LarsSchmidt-Thieme. XMedia: Web People Search by Clusteringwith Machinely Learned Similarity Measures. In 2nd Web PeopleSearch Evaluation Workshop (WePS 2009), 18th WWW Confer-ence, 2009.
[RGY07] Delip Rao, Nikesh Garera, and David Yarowsky. JHU1 : An Un-supervised Approach to Person Name Disambiguation using WebSnippets. In Proceedings of the Fourth International Workshop onSemantic Evaluations. Association for Computational Linguistics,2007.
[RH07] Andrew Rosenberg and Julia Hirschberg. V-Measure: A Condi-tional Entropy-Based External Cluster Evaluation Measure. InProceedings of the 2007 Joint Conference on Empirical Meth-ods in Natural Language Processing and Computational NaturalLanguage Learning (EMNLP-CoNLL), pages 410–420, 2007.
[Rij74] Van C. Rijsbergen. Foundation of evaluation. Journal of Docu-mentation, 30(4):365–373, 1974.
[RK99] Y. Ravin and Z. Kazi. Is Hillary Rodham Clinton the President?Disambiguating names across documents. In Proceedings of theACL ’99 Workshop on Coreference and its Applications Associa-tion for Computational Linguistics, 1999.
BIBLIOGRAPHY 157
[SA09] Satoshi Sekine and Javier Artiles. WePS2 Attribute ExtractionTask. In 2nd Web People Search Evaluation Workshop (WePS2009), 18th WWW Conference, 2009.
[Sag07] Horacio Saggion. SHEF: Semantic Tagging and SummarizationTechniques Applied to Cross-document Coreference. In Proceed-ings of the Fourth International Workshop on Semantic Evalua-tions. Association for Computational Linguistics, 2007.
[Sag08] Horacio Saggion. Experiments on Semantic-based Clustering forCross-document Coreference. In International Joint Conferenceon Natural language Processing, 2008.
[Sch92] Hinrich Schutze. Context space. In Working Notes of the AAAIFall Symposium on Probabilistic Approaches to Natural Language,pages 54–60, 1992.
[SDCCK07] Steven Schockaert, Martine De Cock, Chris Cornelis, and Eti-enne E. Kerre. Clustering web search results using fuzzy ants:Research Articles. Int. J. Intell. Syst., 22(5):455–474, 2007.
[Sek08] Satoshi Sekine. Extended Named Entity Ontology with AttributeInformation. In Proceedings of the Sixth International LanguageResources and Evaluation (LREC’08), 2008.
[SJP04] Amanda Spink, Bernard Jansen, and Jan Pedersen. Searching forpeople on Web search engines. Journal of Documentation, 60:266– 278, 2004.
[SKK00] M. Steinbach, G. Karypis, and V. Kumar. A comparison of docu-ment clustering techniques, 2000.
[SO07] Kazunari Sugiyama and Manabu Okumura. TITPI: Web PeopleSearch Task Using Semi-Supervised Clustering Approach. InProceedings of the Fourth International Workshop on SemanticEvaluations. ACL, 2007.
[Tiw05] Charu Tiwari. Entity Identification On The Web. Master’s thesis,School Of Information Technology, Indian Institute of Technology,Bombay, 2005.
[TKL06] Y.F. Tan, M.Y. Kan, and D. Lee. Search engine driven authordisambiguation. In Proceedings of the 6th ACM/IEEE-CS jointconference on Digital libraries, pages 314–315. ACM New York,NY, USA, 2006.
[TWH01] R. Tibshirani, G. Walther, and T. Hastie. Estimating the numberof clusters in a dataset via the Gap statistic. Journal of the RoyalStatistics Society (Series B), page 411–423, 2001.
158 BIBLIOGRAPHY
[TZZ+07] Jie Tang, Jing Zhang, Duo Zhang, Limin Yao, Chunlin Zhu, andJuan-Zi Li. ArnetMiner: An Expertise Oriented Search Systemfor Web Community. In Semantic Web Challenge, 2007.
[VBA+95] Marc Vilain, John Burger, John Aberdeen, Dennis Connolly,and Lynette Hirschman. A model-theoretic coreference scor-ing scheme. In MUC6 ’95: Proceedings of the 6th conferenceon Message understanding, pages 45–52, Morristown, NJ, USA,1995. Association for Computational Linguistics.
[Ven09] Priya Venkateshan. Clustering Web People Search Results UsingFuzzy Ant- Based Clustering. In 2nd Web People Search Evalua-tion Workshop (WePS 2009), 18th WWW Conference, 2009.
[WGLD05] Xiaojun Wan, Jianfeng Gao, Mu Li, and Binggong Ding. Per-son resolution in person search results: WebHawk. In CIKM
’05: Proceedings of the 14th ACM international conference onInformation and knowledge management. ACM Press, 2005.
[WL02] D. Winchester and M. Lee. Using Proper Names to Cluster Docu-ments. Technical report, Acquiring (and Using) Linguistic (andWorld) Knowledge for Information Access: Papers from the springSymposium (Technical Report SS-02-09), 2002.
[WRC97] Nina Wacholder, Yael Ravin, and Misook Choi. Disambiguationof Proper Names in Text. In ANLP, pages 202–208, 1997.
[XLG03] Wei Xu, Xin Liu, and Yihong Gong. Document clustering basedon non-negative matrix factorization. In SIGIR ’03: Proceedingsof the 26th annual international ACM SIGIR conference on Re-search and development in informaion retrieval, pages 267–273.ACM Press, 2003.
[ZK01] Y. Zhao and G. Karypis. Criterion functions for document clus-tering: Experiments and analysis. Technical Report TR 01–40,Department of Computer Science, University of Minnesota, Min-neapolis, MN, 2001.
[ZK02] Ying Zhao and George Karypis. Evaluation of hierarchical cluster-ing algorithms for document datasets. In CIKM ’02: Proceedingsof the eleventh international conference on Information and knowl-edge management, pages 515–524, New York, NY, USA, 2002.ACM.
Appendix A
Publications
The publications that have resulted from this thesis and their related chapters arelisted below:
Chapter 3
• Javier Artiles, Julio Gonzalo, and Felisa Verdejo. A testbed for people search-ing strategies in the WWW. In ACM Special Interest Group on InformationRetrieval (SIGIR), 2005.
• Javier Artiles, Julio Gonzalo, and Satoshi Sekine. The SemEval 2007 WePSevaluation: Establishing a benchmark for the Web People Search Task. InProceedings of the Fourth International Workshop on Semantic Evaluations(SemEval-2007). ACL, 2007.
• Javier Artiles, Satoshi Sekine, and Julio Gonzalo. Web People Search: resultsof the first evaluation and the plan for the second. In WWW ’08: Proceedingof the 17th international conference on World Wide Web, pages 1071–1072,New York, NY, USA, 2008.
Chapter 4
• Enrique Amigo, Julio Gonzalo, Javier Artiles, and Felisa Verdejo. A compar-ison of extrinsic clustering evaluation metrics based on formal constraints.Information Retrieval, 2008.
Chapter 5
• Enrique Amigo Julio Gonzalo, and Javier Artiles. Combining EvaluationMetrics via the Unanimous Improvement Ratio and its Application in WePSClustering Task. In 2nd Web People Search Evaluation Workshop (WePS2009), 18th WWW Conference, 2009.
Chapter 6
160 Publications
• Javier Artiles, Julio Gonzalo, and Satoshi Sekine. WePS 2 Evaluation Cam-paign: Overview of the Web People Search clustering Task. In 2nd WebPeople Search Evaluation Workshop (WePS 2009), 18th WWW Conference,2009.
• Satoshi Sekine and Javier Artiles. WePS2 Attribute Extraction Task. In2nd Web People Search Evaluation Workshop (WePS 2009), 18th WWWConference, 2009.
• Javier Artiles, Julio Gonzalo, and Satoshi Sekine (Eds). WePS-2: Proceedingsof the Workshop of the Second Web People Search Evaluation Campaign.Madrid, Spain. 2009.
Chapter 7
• Javier Artiles, Julio Gonzalo, and Enrique Amigo. The impact of queryrefinement in the Web People Search Task. In ACL 2009, Proceedings ofthe 47th Annual Meeting of the Association for Computational Linguistics.Association for Computational Linguistics, 2009.
Chapter 8
• Javier Artiles, Enrique Amigo, and Julio Gonzalo. The role of named entitiesin Web People Search. In EMNLP ’09: Proceedings of the ACL-09 conferenceon Empirical methods in Natural Language Processing. Association forComputational Linguistics, 2009.