Embed Size (px)
Citation preview
Web Map Caching and Tiling
Overview
David M. Horwood
June 2011
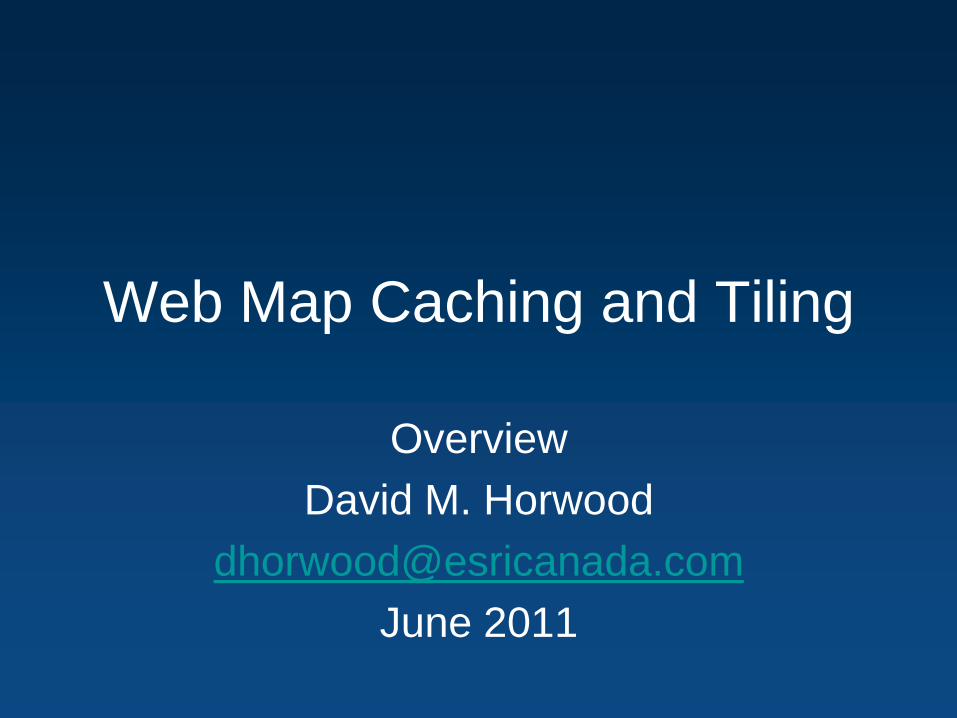
Web Mapping
• Traditional
– Geographic “projection”
– Select / Refresh workflow
– Slow, non-interactive (refresh delay)
– http://www.geographynetwork.ca/website/obm/viewer.htm
• Modern
– AJAX (Asynchronous Java and XML)
– Stream pre-rendered tiles to browser
– Browser caches tiles, no need to resend
– More interactive map (dynamic pan and zoom)
– http://www.arcgis.com/home/webmap/viewer.html?useExisting=1
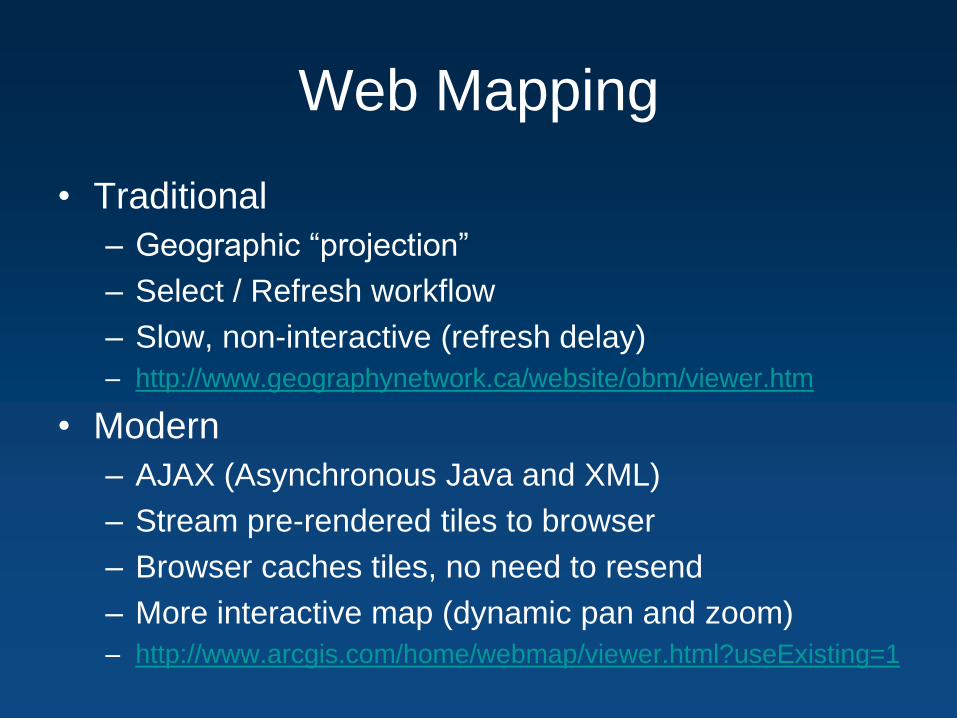
Traditional Map
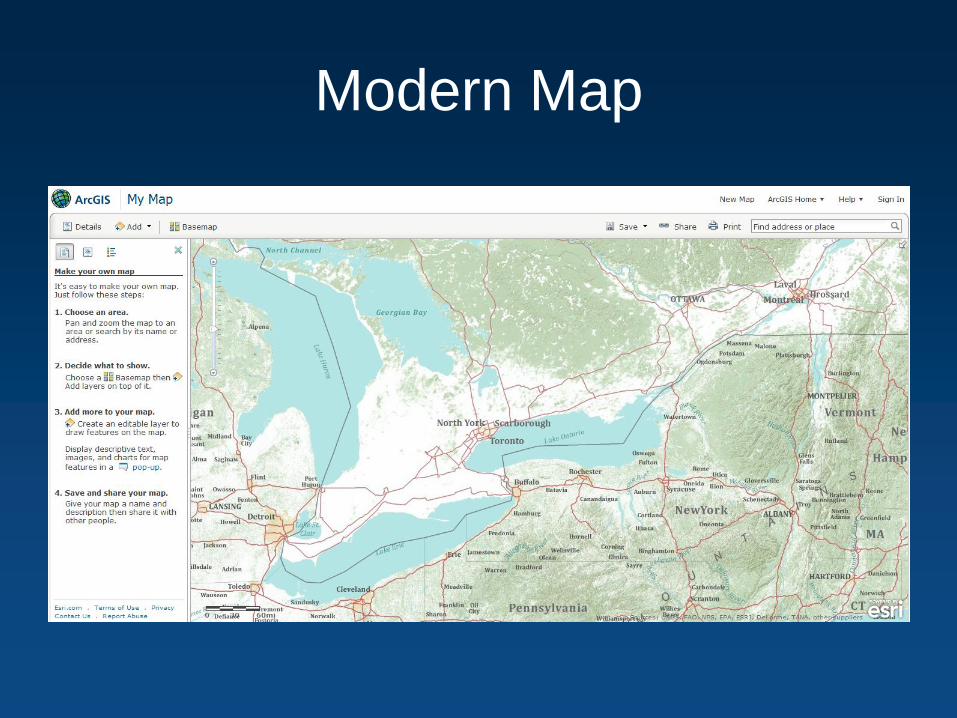
Modern Map
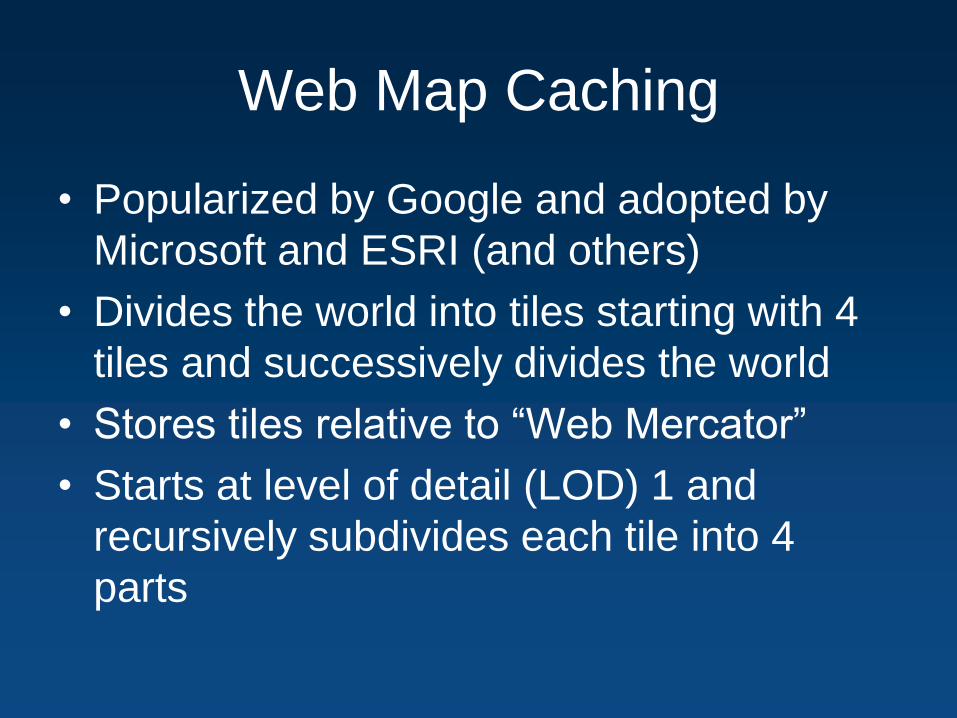
Web Map Caching
• Popularized by Google and adopted by
Microsoft and ESRI (and others)
• Divides the world into tiles starting with 4
tiles and successively divides the world
• Stores tiles relative to “Web Mercator”
• Starts at level of detail (LOD) 1 and
recursively subdivides each tile into 4
parts
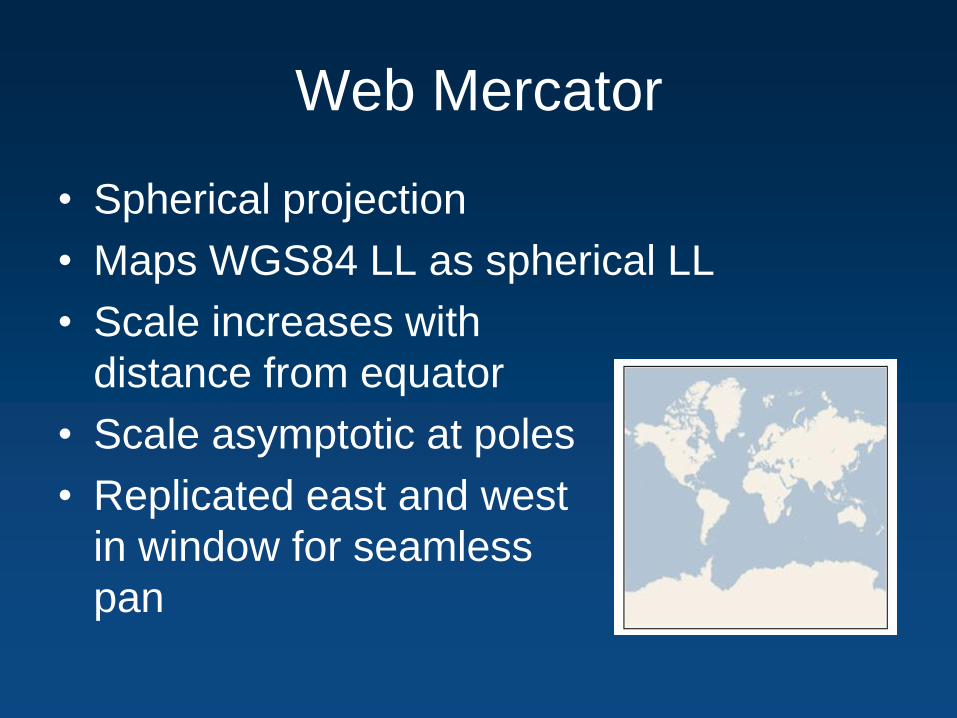
Web Mercator
• Spherical projection
• Maps WGS84 LL as spherical LL
• Scale increases with
distance from equator
• Scale asymptotic at poles
• Replicated east and west
in window for seamless
pan
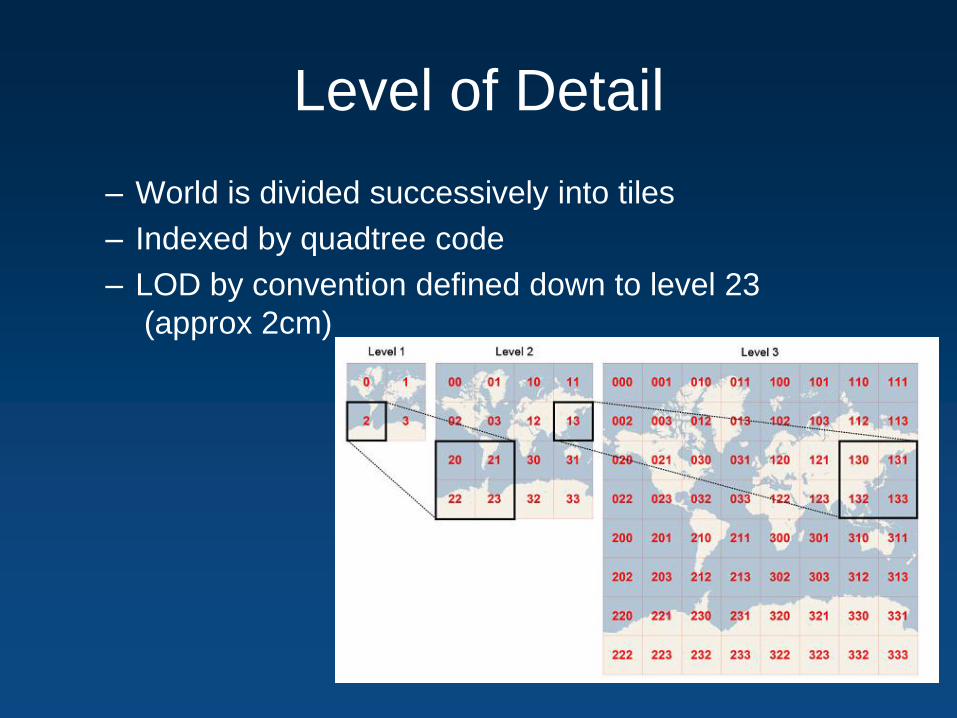
Level of Detail
– World is divided successively into tiles
– Indexed by quadtree code
– LOD by convention defined down to level 23
(approx 2cm)
Tile Size
• 256 x 256 pixels = 192KB RGB
• Tiles normally stored as JPG or PNG
– JPG for raster imagery
– PNG for rendered vector
• Compressed size ~ 40KB
– JPG fairly consistent, PNG can be variable
• Average display 1024 x 768
– 4 x 3 = 12 tiles = 480KB
– 5 x 4 = 20 tiles including overlap = 800KB
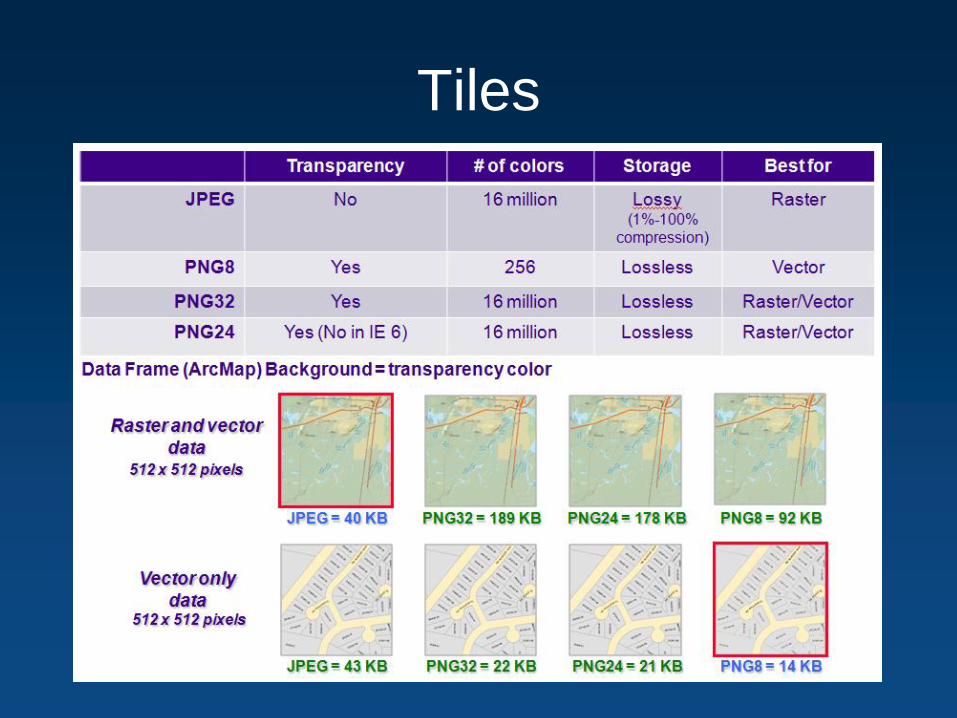
Tiles
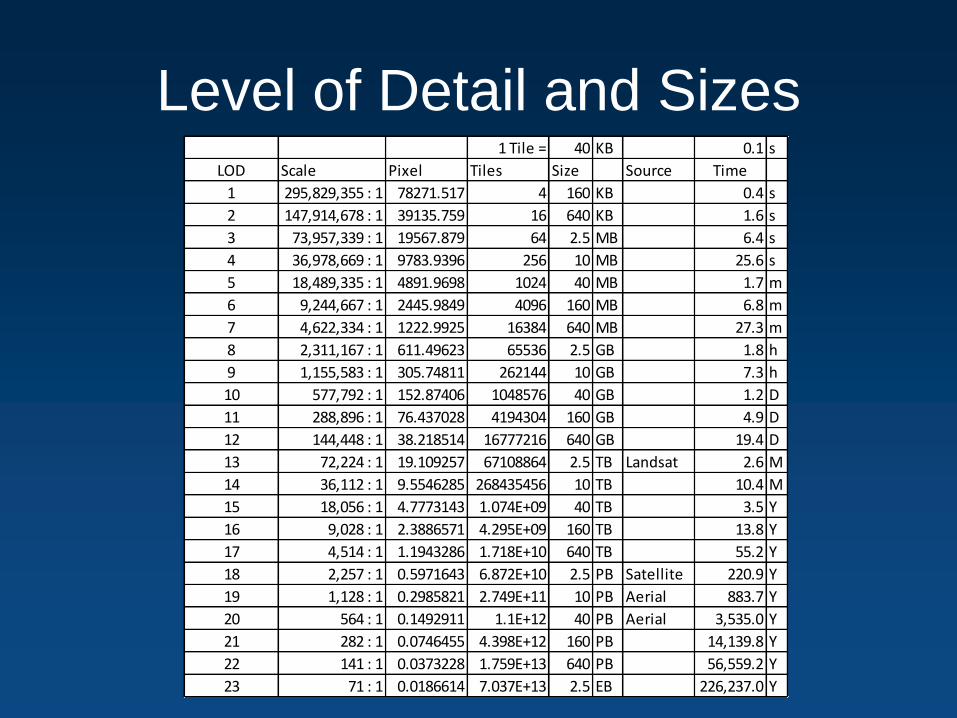
Level of Detail and Sizes1 Tile = 40 KB 0.1 s
LOD Scale Pixel Tiles Size Source Time
1 295,829,355 : 1 78271.517 4 160 KB 0.4 s
2 147,914,678 : 1 39135.759 16 640 KB 1.6 s
3 73,957,339 : 1 19567.879 64 2.5 MB 6.4 s
4 36,978,669 : 1 9783.9396 256 10 MB 25.6 s
5 18,489,335 : 1 4891.9698 1024 40 MB 1.7 m
6 9,244,667 : 1 2445.9849 4096 160 MB 6.8 m
7 4,622,334 : 1 1222.9925 16384 640 MB 27.3 m
8 2,311,167 : 1 611.49623 65536 2.5 GB 1.8 h
9 1,155,583 : 1 305.74811 262144 10 GB 7.3 h
10 577,792 : 1 152.87406 1048576 40 GB 1.2 D
11 288,896 : 1 76.437028 4194304 160 GB 4.9 D
12 144,448 : 1 38.218514 16777216 640 GB 19.4 D
13 72,224 : 1 19.109257 67108864 2.5 TB Landsat 2.6 M
14 36,112 : 1 9.5546285 268435456 10 TB 10.4 M
15 18,056 : 1 4.7773143 1.074E+09 40 TB 3.5 Y
16 9,028 : 1 2.3886571 4.295E+09 160 TB 13.8 Y
17 4,514 : 1 1.1943286 1.718E+10 640 TB 55.2 Y
18 2,257 : 1 0.5971643 6.872E+10 2.5 PB Satellite 220.9 Y
19 1,128 : 1 0.2985821 2.749E+11 10 PB Aerial 883.7 Y
20 564 : 1 0.1492911 1.1E+12 40 PB Aerial 3,535.0 Y
21 282 : 1 0.0746455 4.398E+12 160 PB 14,139.8 Y
22 141 : 1 0.0373228 1.759E+13 640 PB 56,559.2 Y
23 71 : 1 0.0186614 7.037E+13 2.5 EB 226,237.0 Y
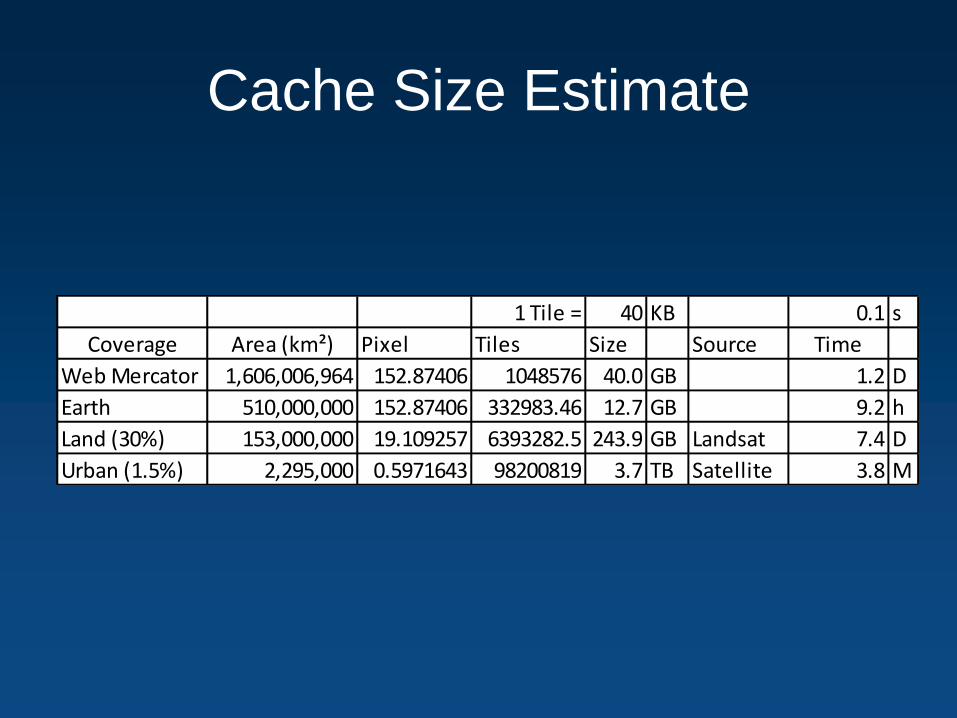
Cache Size Estimate
1 Tile = 40 KB 0.1 s
Coverage Area (km²) Pixel Tiles Size Source Time
Web Mercator 1,606,006,964 152.87406 1048576 40.0 GB 1.2 D
Earth 510,000,000 152.87406 332983.46 12.7 GB 9.2 h
Land (30%) 153,000,000 19.109257 6393282.5 243.9 GB Landsat 7.4 D
Urban (1.5%) 2,295,000 0.5971643 98200819 3.7 TB Satellite 3.8 M
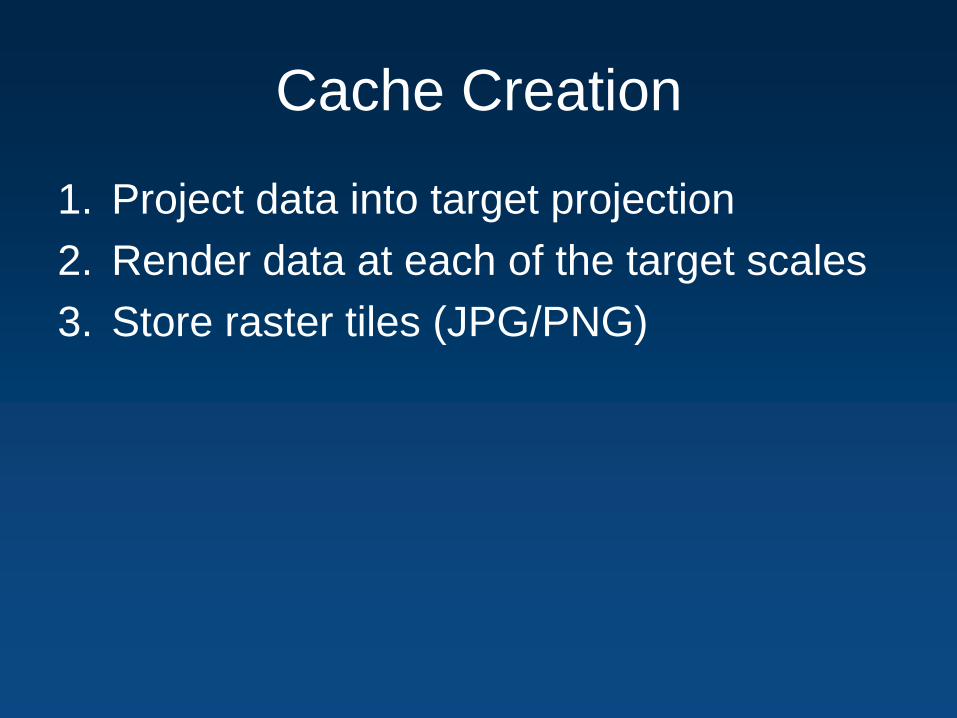
Cache Creation
1. Project data into target projection
2. Render data at each of the target scales
3. Store raster tiles (JPG/PNG)
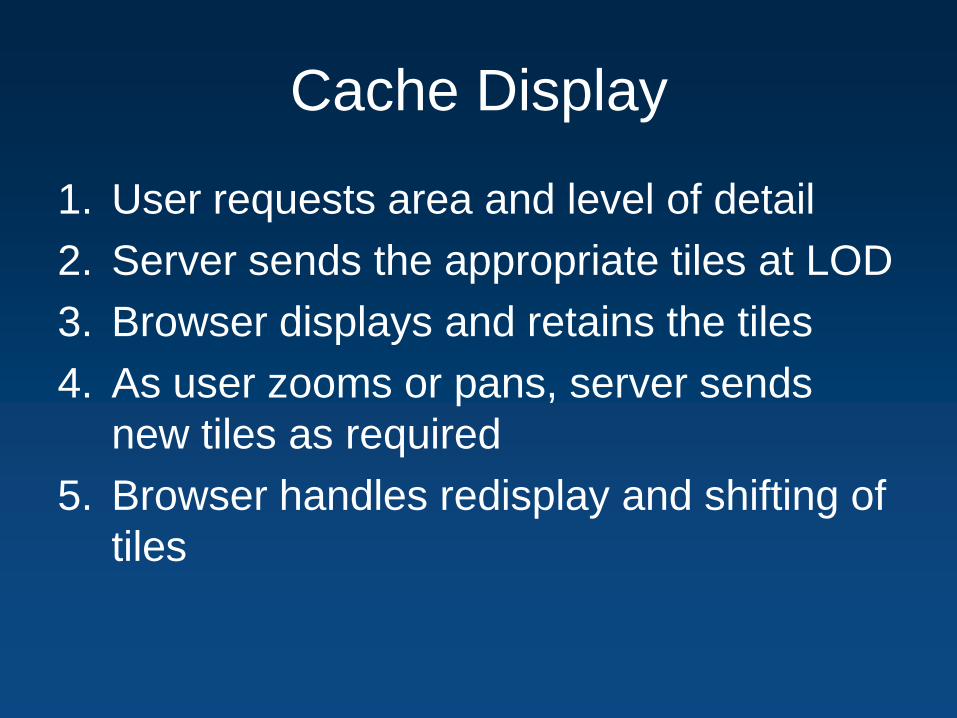
Cache Display
1. User requests area and level of detail
2. Server sends the appropriate tiles at LOD
3. Browser displays and retains the tiles
4. As user zooms or pans, server sends
new tiles as required
5. Browser handles redisplay and shifting of
tiles
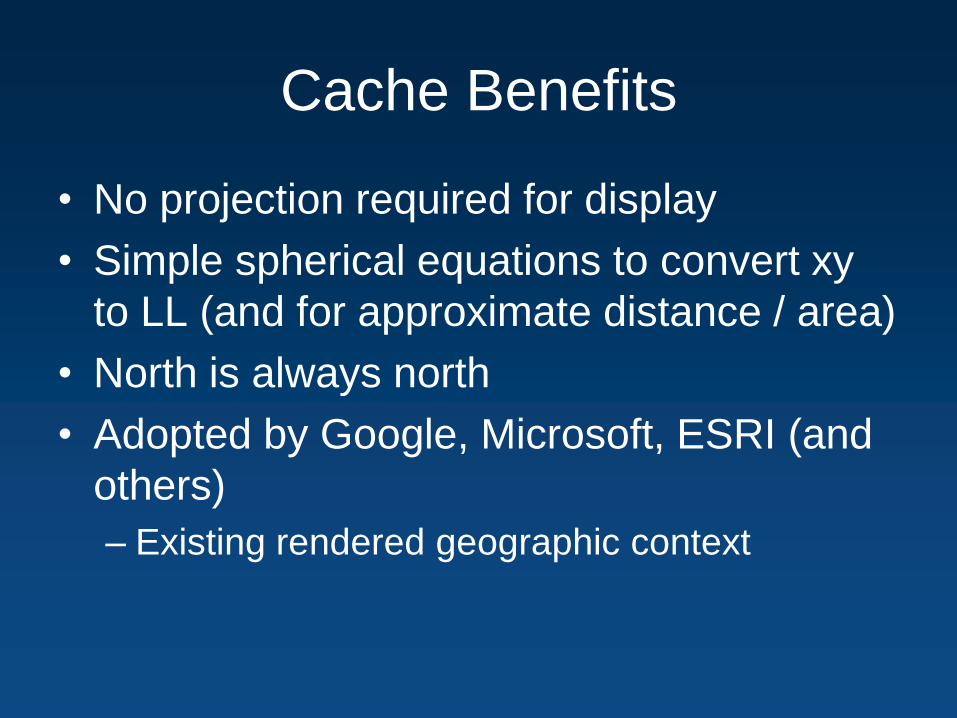
Cache Benefits
• No projection required for display
• Simple spherical equations to convert xy
to LL (and for approximate distance / area)
• North is always north
• Adopted by Google, Microsoft, ESRI (and
others)
– Existing rendered geographic context
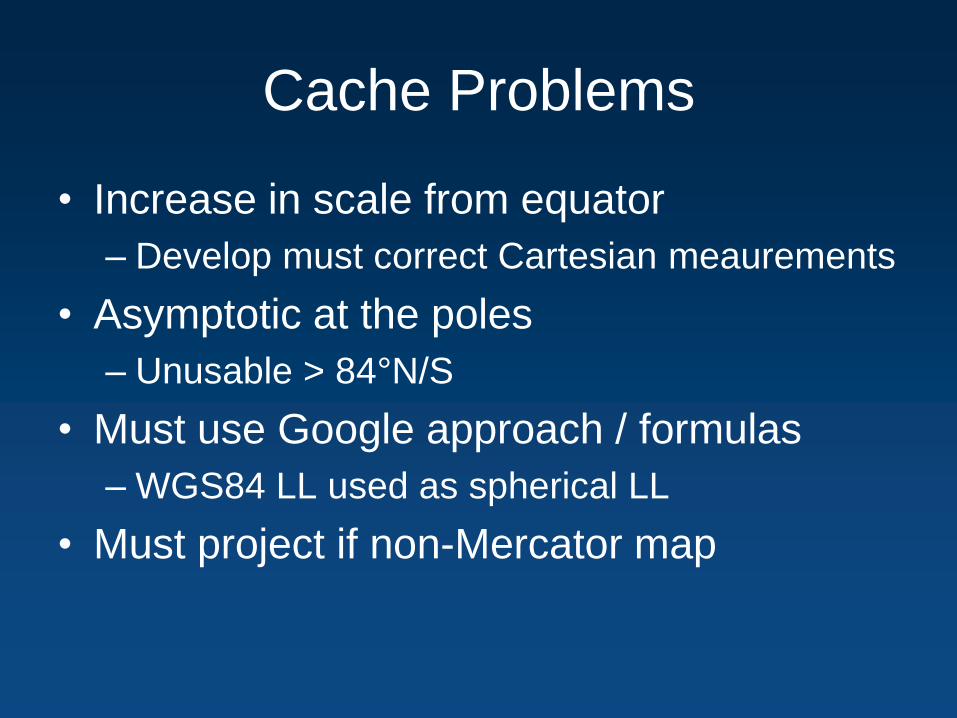
Cache Problems
• Increase in scale from equator
– Develop must correct Cartesian meaurements
• Asymptotic at the poles
– Unusable > 84°N/S
• Must use Google approach / formulas
– WGS84 LL used as spherical LL
• Must project if non-Mercator map
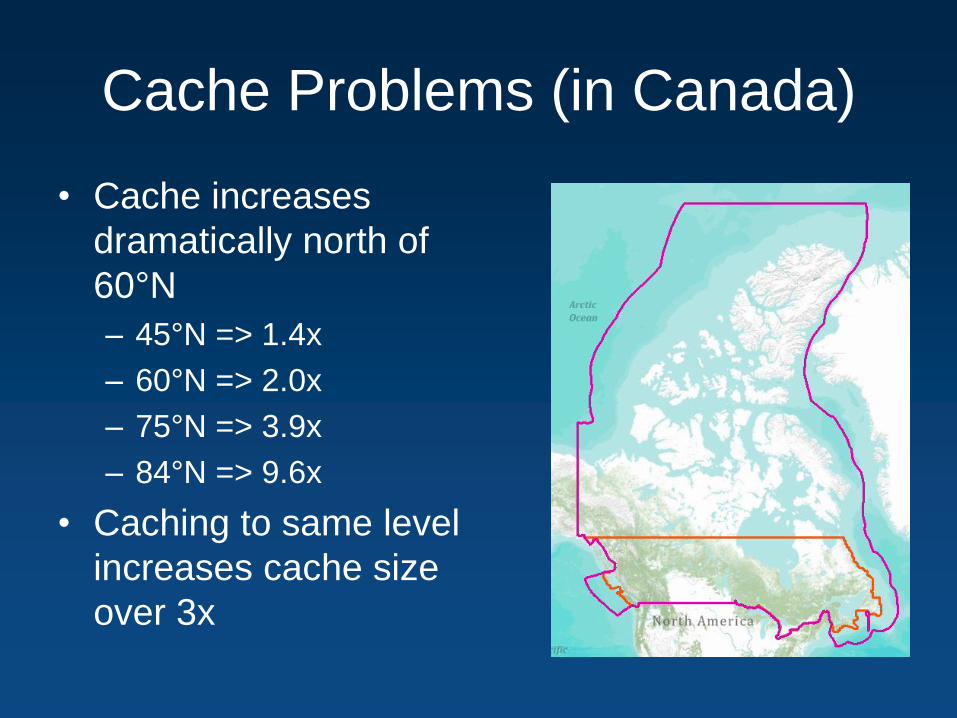
Cache Problems (in Canada)
• Cache increases
dramatically north of
60°N
– 45°N => 1.4x
– 60°N => 2.0x
– 75°N => 3.9x
– 84°N => 9.6x
• Caching to same level
increases cache size
over 3x
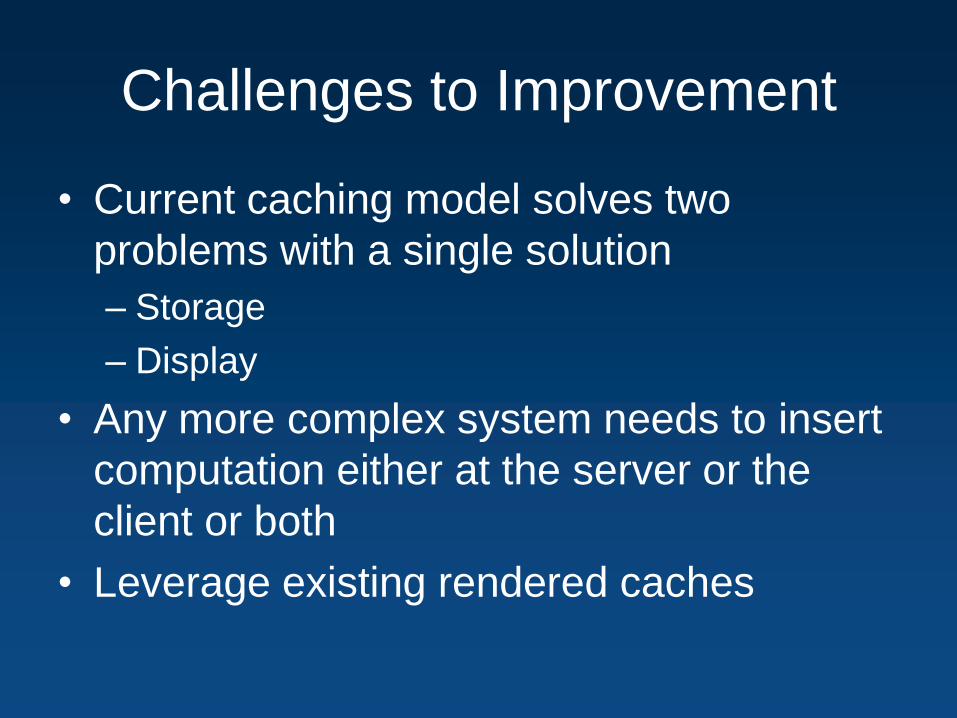
Challenges to Improvement
• Current caching model solves two
problems with a single solution
– Storage
– Display
• Any more complex system needs to insert
computation either at the server or the
client or both
• Leverage existing rendered caches
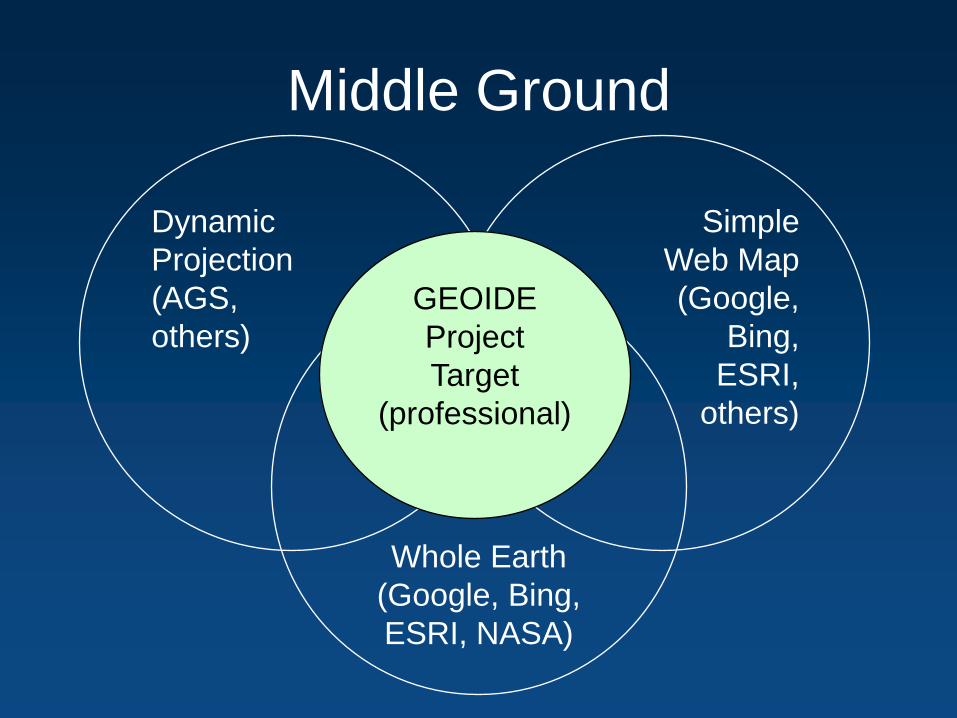
Middle Ground
Dynamic
Projection
(AGS,
others)
Simple
Web Map
(Google,
Bing,
ESRI,
others)
Whole Earth
(Google, Bing,
ESRI, NASA)
GEOIDE
Project
Target
(professional)
Alternatives
• You cannot flatten the whole earth
– Either cut into pieces (i.e., not seamless)
– View in 3D (hides one half of the earth)
• Options
– Hybrid projection (e.g., conic + cylindrical)
– Unfolding projection
– Orthographic projection of ECEF
– 3D virtual environment
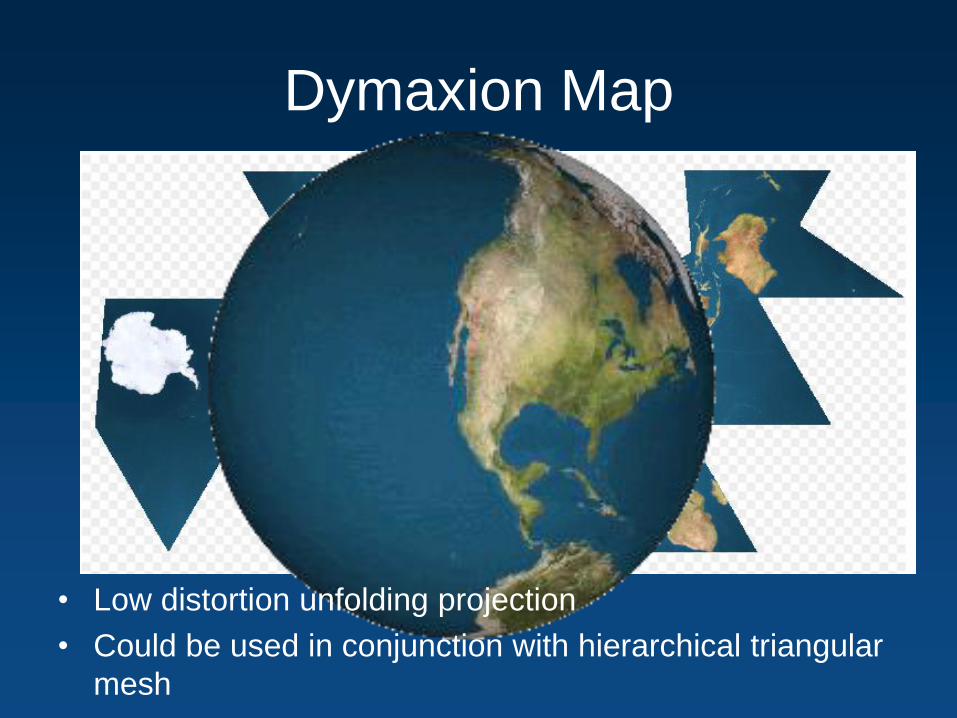
Dymaxion Map
• Low distortion unfolding projection
• Could be used in conjunction with hierarchical triangular
mesh
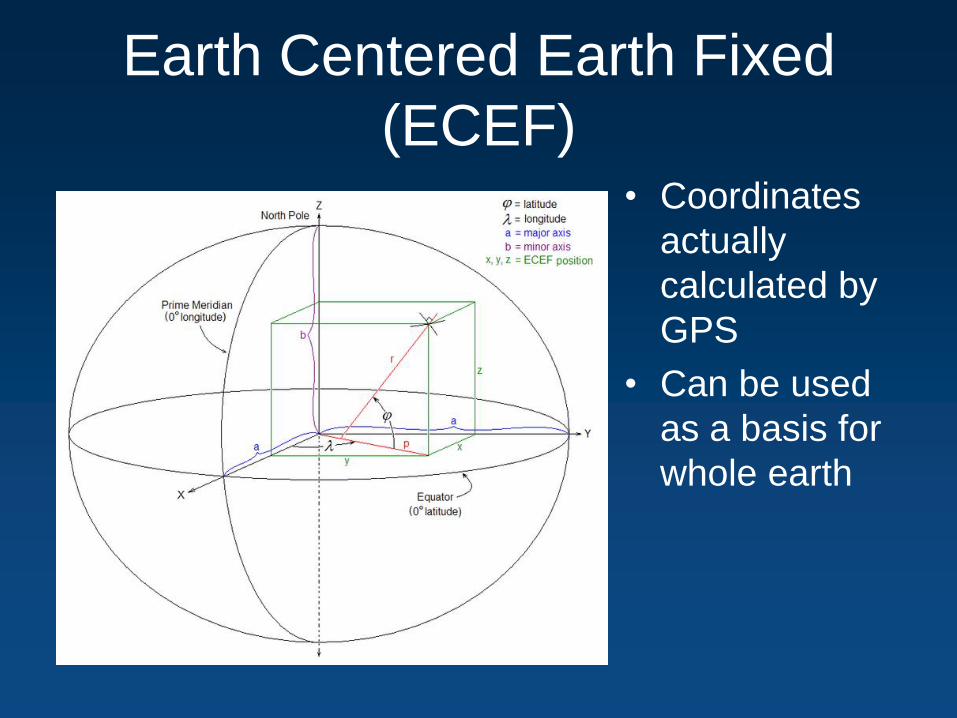
Earth Centered Earth Fixed
(ECEF)• Coordinates
actually
calculated by
GPS
• Can be used
as a basis for
whole earth
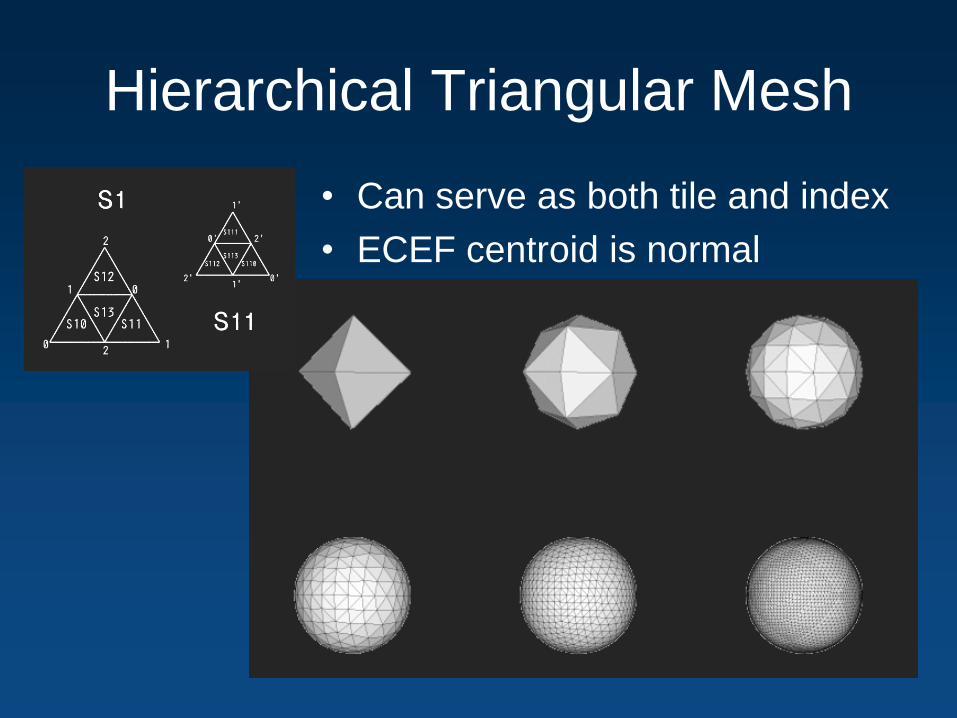
Hierarchical Triangular Mesh
• Can serve as both tile and index
• ECEF centroid is normal
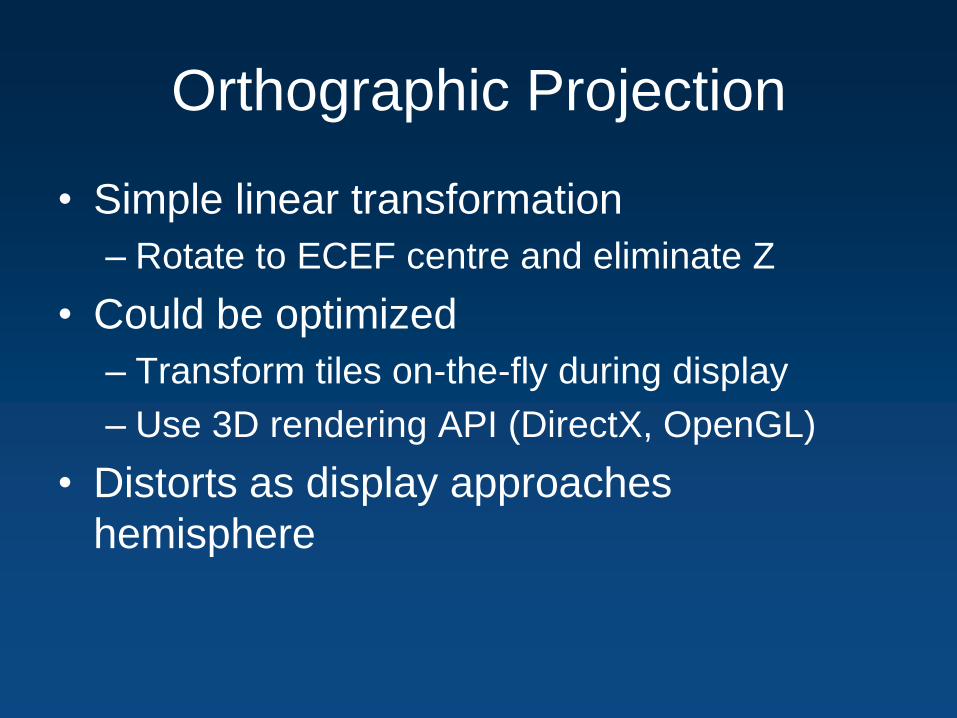
Orthographic Projection
• Simple linear transformation
– Rotate to ECEF centre and eliminate Z
• Could be optimized
– Transform tiles on-the-fly during display
– Use 3D rendering API (DirectX, OpenGL)
• Distorts as display approaches
hemisphere
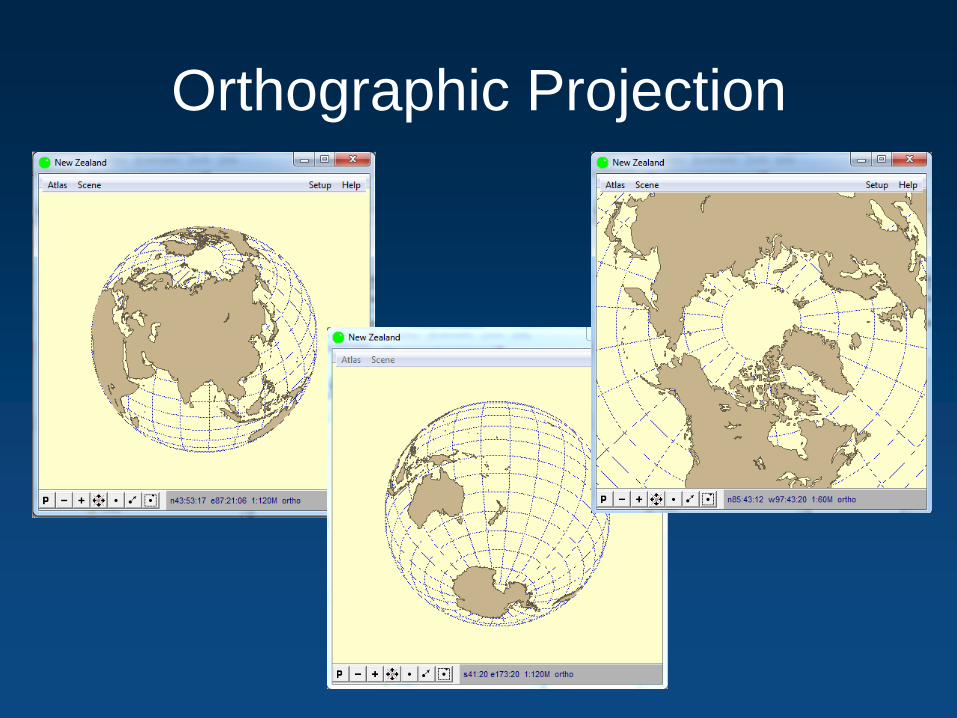
Orthographic Projection
Properties of Ideal Solution
• Whole earth
• Seamless
• Minimize distortion
• Measure distance and area
• Efficient storage and retrieval
• Multi-resolution
• Dynamic pan
• North up
• Mobile and Desktop (Browser)
• Javascript, Flex, Silverlight APIs

Questions?