Embed Size (px)
Citation preview
AN ABSTRACT OF THE THESIS OF
STUART LESLIE CATO for the M. S. in Structural Engineering (Name) (Degree) (Major)
Date thesis is presented May 13, 1964
Title WEB BUCKLING FAILURE OF BUILT -UP GIRDERS WITH
RECTANGULAR HOLES
Abstract approved (Major professor)
This thesis investigated the methods of failure in the webs of
built up girders. The beams had rectangular holes five and one -half
inches wide and seven and one -half inches high with rounded corners
in a web fourteen inches deep between flanges. The longitudinal
position of the hole edge varied from four inches to sixteen inches
from the support.
The results of the test were compared to analytical analysis
for failure by column action, plate buckling and shear in the web.
Failure occurred by local crippling in the web in the test beams with
holes four and eight inches from the support, The test beams with
holes 12 inches and 16 inches from the support failed by yielding of
the web under the applied load.
The test results indicated that further study is needed of
local stress effects at the edge of the holes.
WEB BUCKLING FAILURE OF BUILT -UP GIRDERS WITH RECTANGULAR HOLES
by
STUART LESLIE CATO
A THESIS
submitted to
OREGON STATE UNIVERSITY
in partial fulfillment of the requirements for the
degree of
MASTER OF SCIENCE
June 1964
APPROVED:
Professor' of Civil Engineering
In Charge of Major
Head of Department of Civil Engineering
Dean of Graduate School
Date thesis is presented May 13, 1964
Typed by Nancy Kerley
TABLE OF CONTENTS
Page
INTRODUCTION 1
OBJECT OF TEST 2
TEST SPECIMENS 3
Description of Specimen 3 Properties of Specimen 4
Instrumentation of Specimen 4
APPARATUS 8
Preliminary Test Final Test
TEST PROCEDURE
Trial Test Preliminary Test Final Test
RESULTS
8
8
11
13
Preliminary Tests 13
Beam 1
Beam 2
Beam 3
Beam 4
Final Results
13 14 15 15
21
Beam 1 21 Beam L 22 Beam 3 23 Beam 4 24
TABLE OF CONTENTS (continued)
Analytical Results
Page
32
Column action 32 Plate buckling 32 Shear failure 33
CONCLUSIONS AND RECOMMENDATIONS 34
BIBLIOGRAPHY 35
APPENDIX A 36
APPENDIX B 37
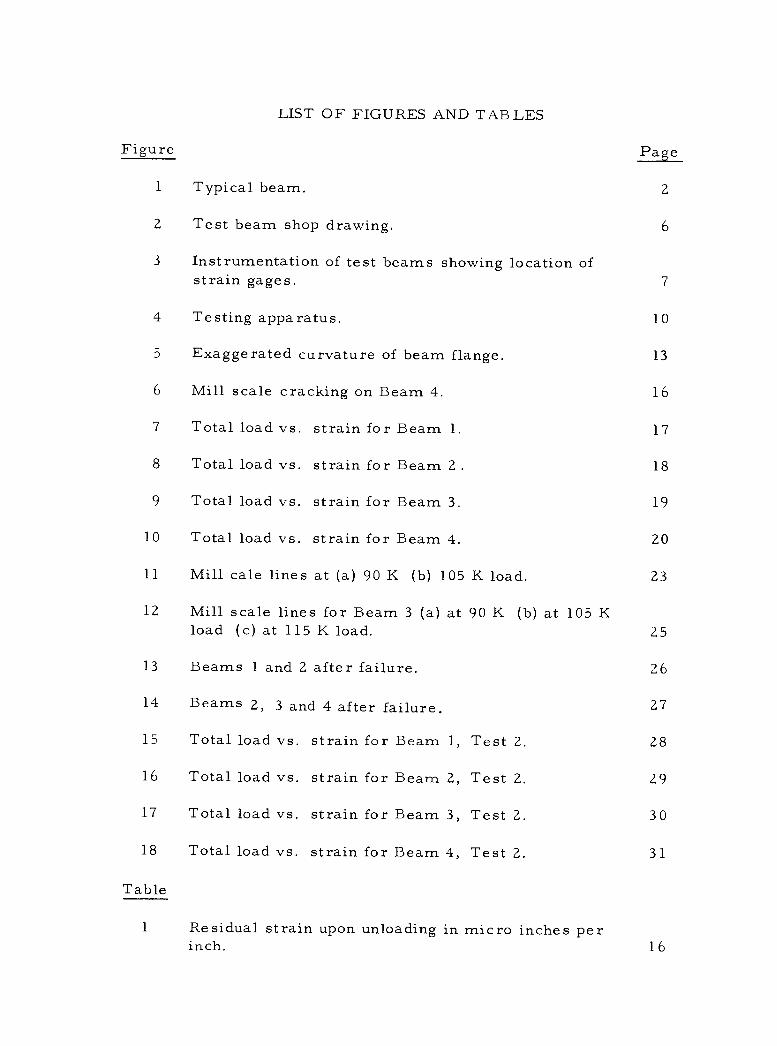
LIST OF FIGURES AND TABLES
Figure
Typical beam.
Test beam shop drawing.
Instrumentation of test beams showing location of
Page
1
2
3
2
6
strain gages. 7
4 Testing apparatus. 10
5 Exaggerated curvature of beam flange. 13
6 Mill scale cracking on Beam 4. 16
7 Total load vs. strain for Beam 1. 17
8 Total load vs. strain for Beam 2 . 18
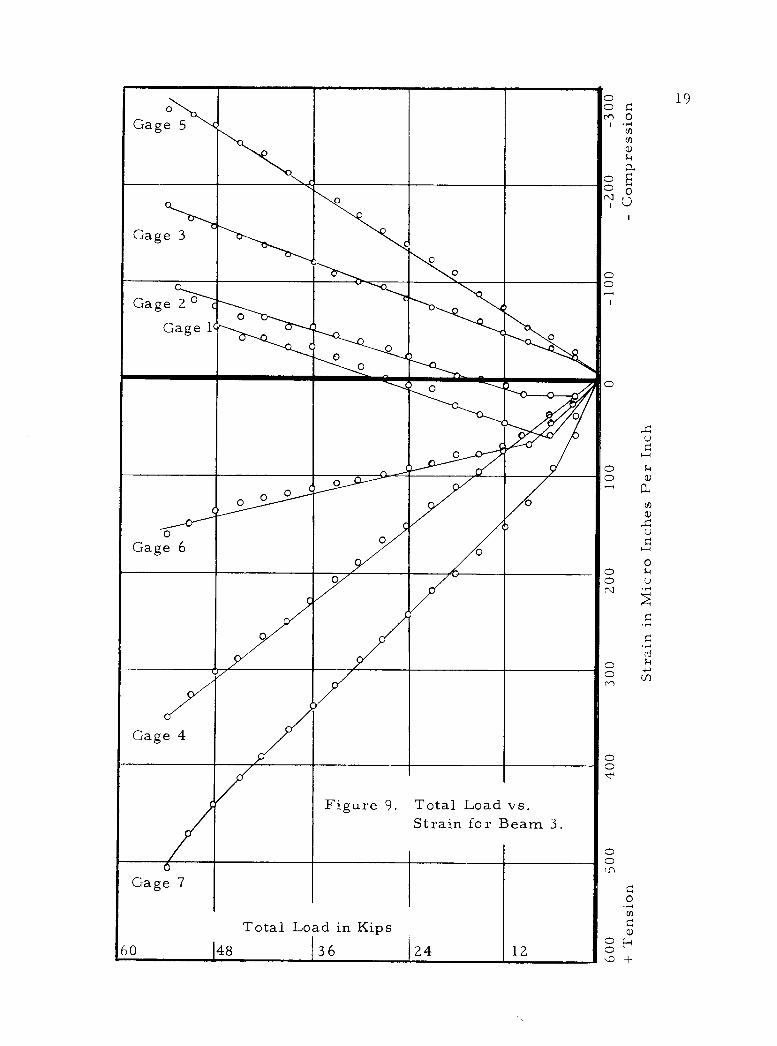
9 Total load vs. strain for Beam 3. 19
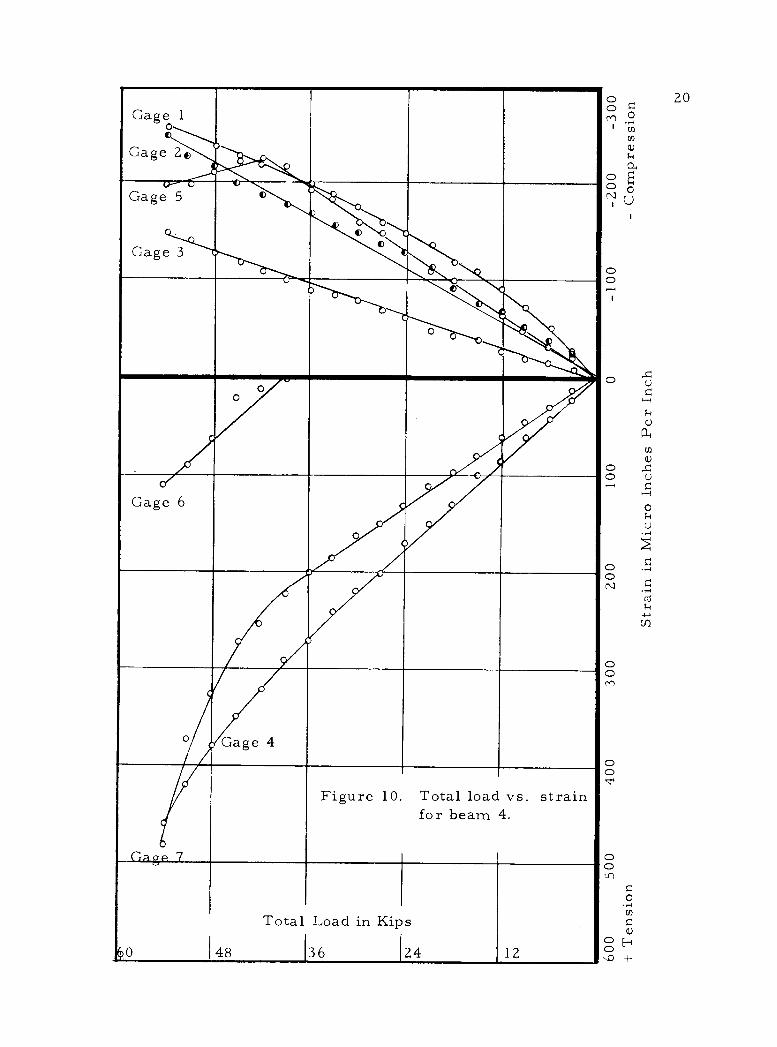
10 Total load vs. strain for Beam 4. 20
11 Mill cale lines at (a) 90 K (b) 105 K load. 23
12 Mill scale lines for Beam 3 (a) at 90 K (b) at 105 K load (c) at 115 K load. 25
13 Beams 1 and 2 after failure. 26
14 Beams 2, 3 and 4 after failure. 27
15 Total load vs, strain for Beam 1, Test 2. 28
16 Total load vs. strain for Beam 2, Test 2. 29
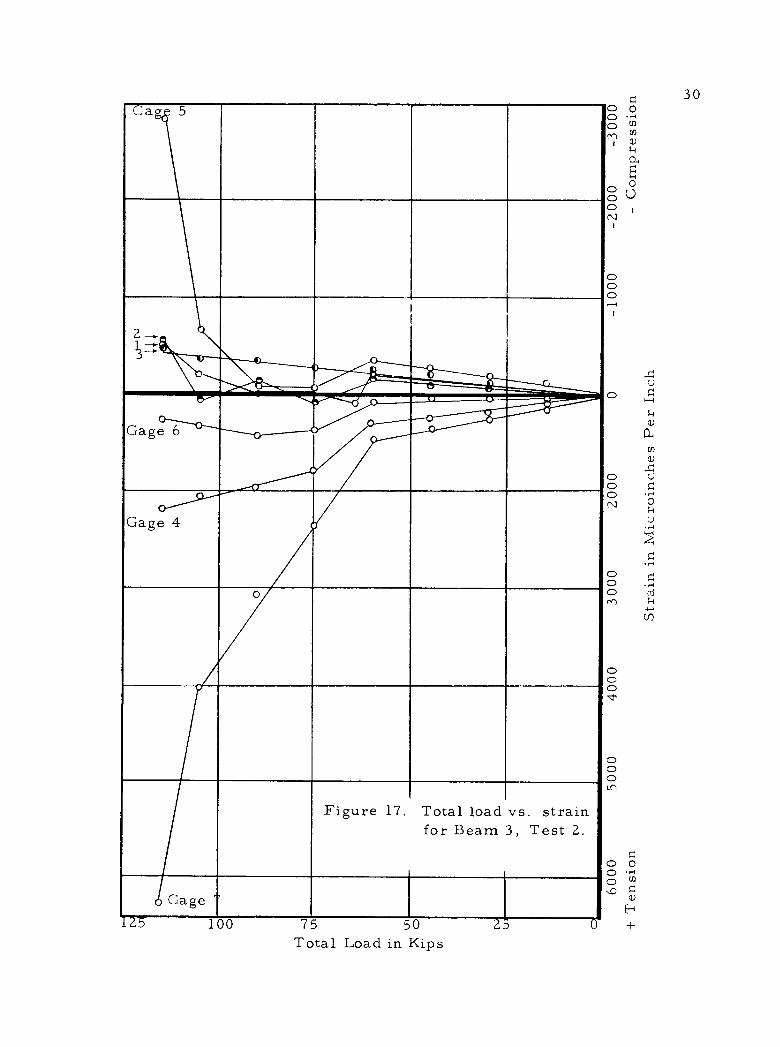
17 Total load vs, strain for Beam 3, Test Z. 30
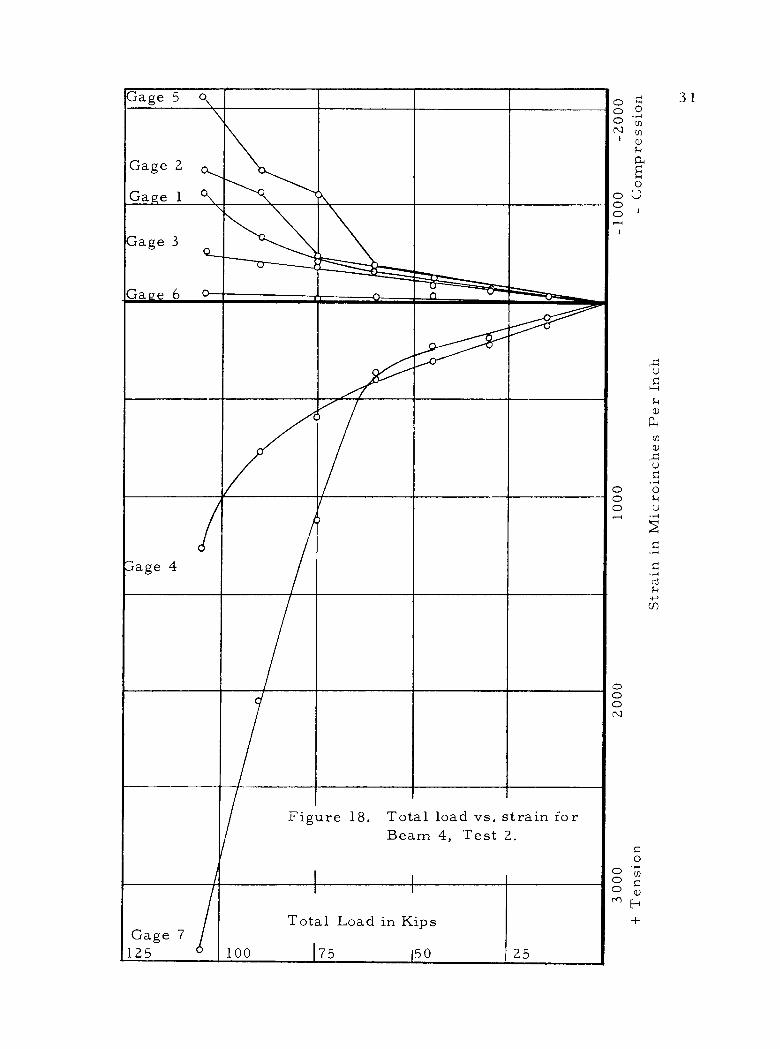
18 Total load vs, strain for Beam 4, Test Z. 31
Table
1 Residual strain upon unloading in micro inches per inch. 16
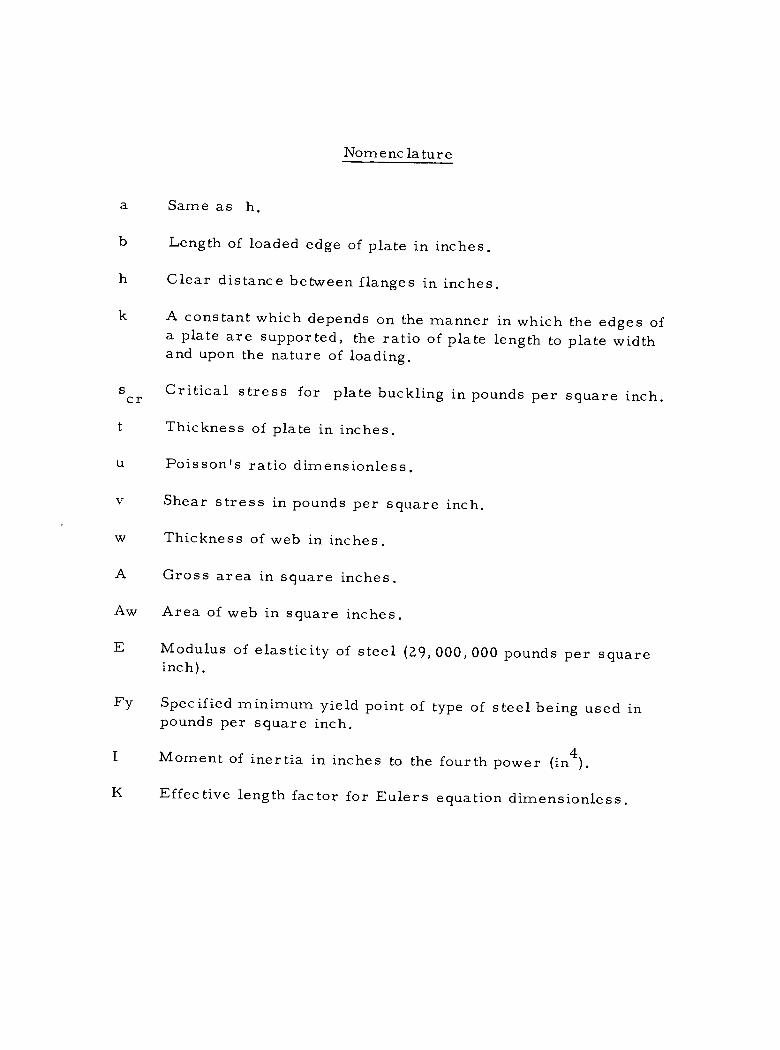
Nomenclature
a Same as h.
b Length of loaded edge of plate in inches.
h Clear distance between flanges in inches.
k A constant which depends on the manner in which the edges of a plate are supported, the ratio of plate length to plate width and upon the nature of loading.
s Critical stress for plate buckling in pounds per square inch. cr
t Thickness of plate in inches.
u Poisson's ratio dimensionless.
Shear stress in pounds per square inch.
w Thickness of web in inches.
A Gross area in square inches.
Aw Area of web in square inches.
E Modulus of elasticity of steel (29, 000, 000 pounds per square inch)
Fy Specified minimum yield point of type of steel being used in pounds per square inch.
I Moment of inertia in inches to the fourth power (in 4).
K Effective length factor for Eulers equation dimensionless,
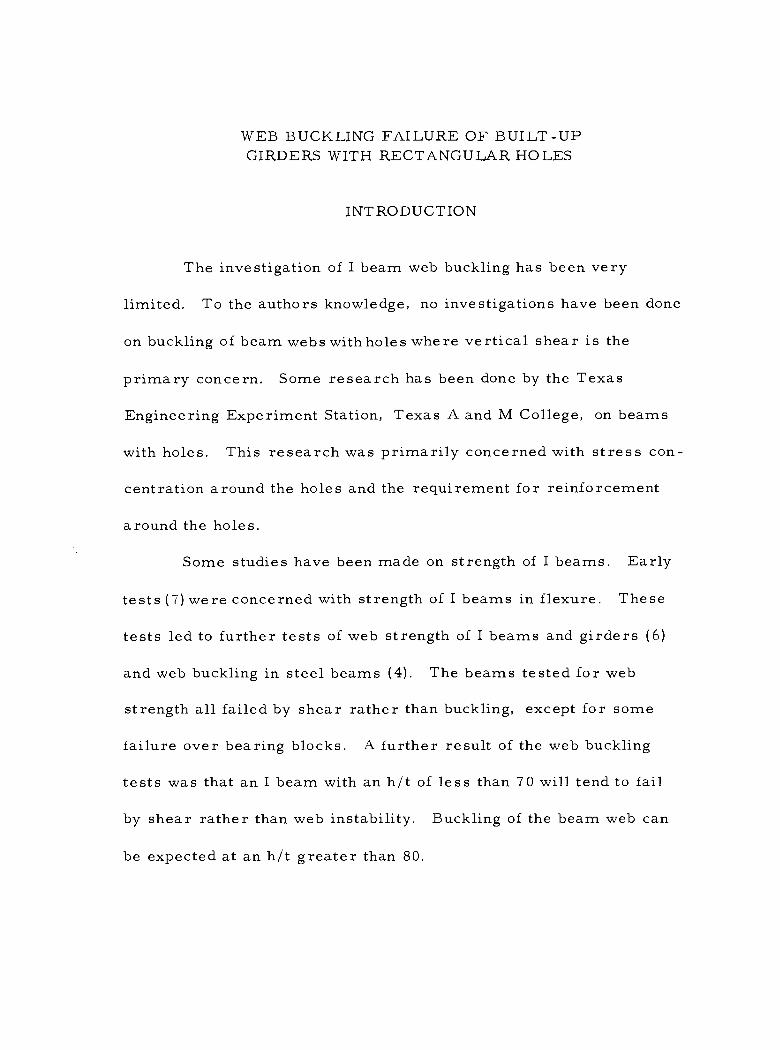
WEB BUCKLING FAILURE OF BUILT-UP GIRDERS WITH RECTANGULAR HOLES
INTRODUCTION
The investigation of I beam web buckling has been very
limited. To the authors knowledge, no investigations have been done
on buckling of beam webs with holes where vertical shear is the
primary concern. Some research has been done by the Texas
Engineering Experiment Station, Texas A and M College, on beams
with holes. This research was primarily concerned with stress con-
centration around the holes and the requirement for reinforcement
around the holes.
Some studies have been made on strength of I beams. Early
tests (7) were concerned with strength of I beams in flexure. These
tests led to further tests of web strength of I beams and girders (6)
and web buckling in steel beams (4). The beams tested for web
strength all failed by shear rather than buckling, except for some
failure over bearing blocks. A further result of the web buckling
tests was that an I beam with an h/t of less than 70 will tend to fail
by shear rather than web instability. Buckling of the beam web can
be expected at an h/t greater than 80.
OBJECT OF TEST
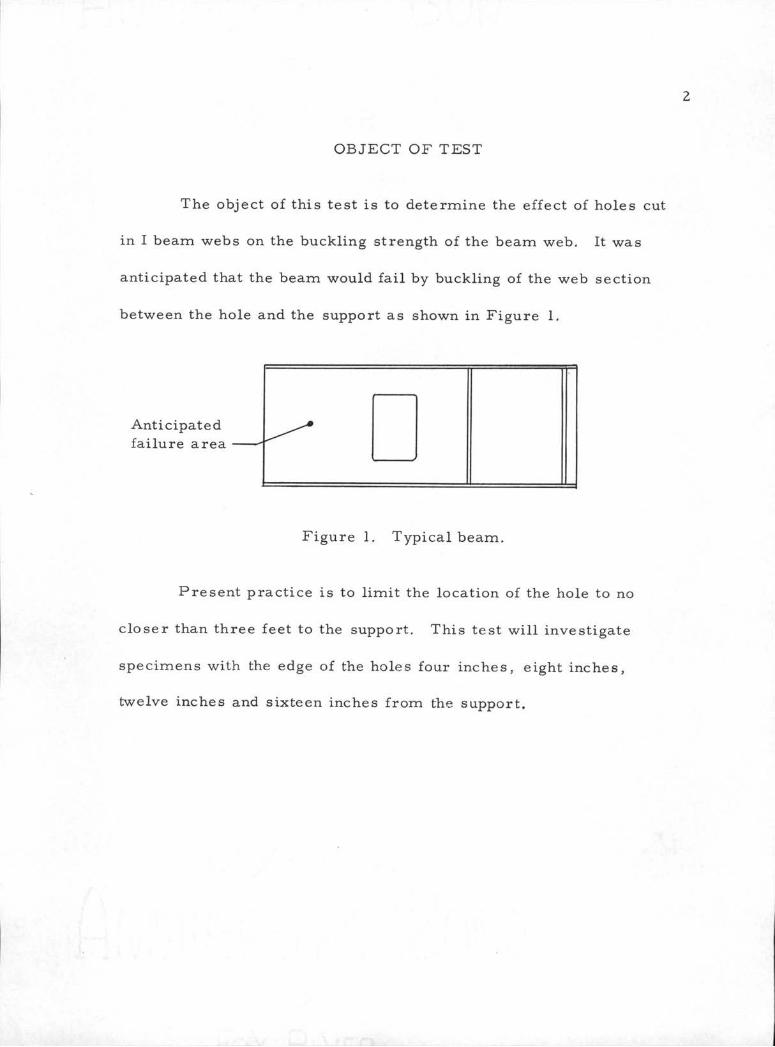
The object of this test is to determine the effect of holes cut
in I beam webs on the buckling strength of the beam web. It was
anticipated that the beam would fail by buckling of the web section
between the hole and the support as shown in Figure 1.
Anticipatedfailure area
Figure 1. Typical beam.
Present practice is to limit the location of the hole to no
closer than three feet to the support. This test will investigate
specimens with the edge of the holes four inches, eight inches,
twelve inches and sixteen inches from the support.
TEST SPECIMENS
Description of Specimen
3
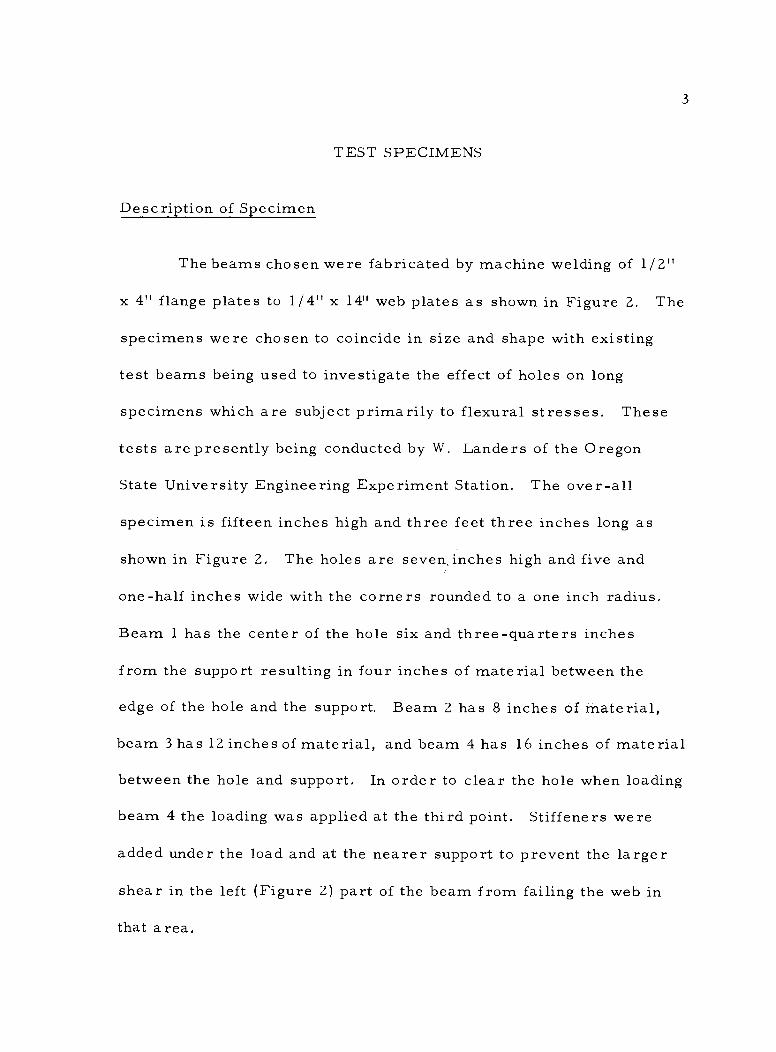
The beams chosen were fabricated by machine welding of 1/2"
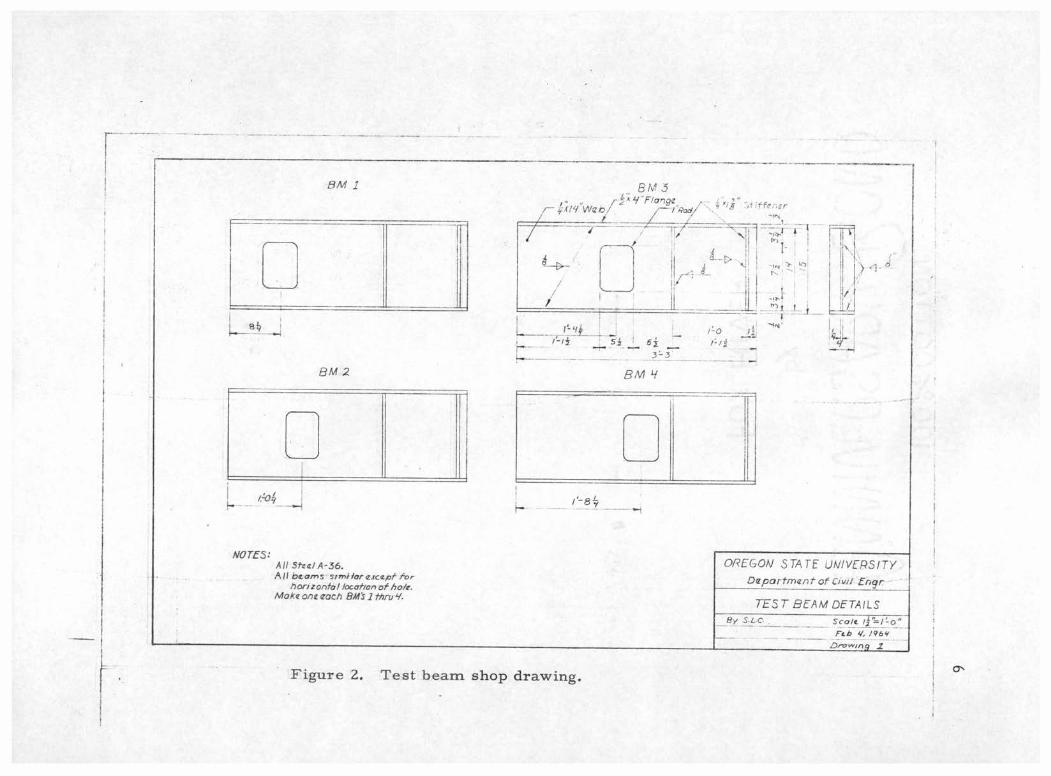
x 4" flange plates to 1/4" x 14" web plates as shown in Figure 2. The
specimens were chosen to coincide in size and shape with existing
test beams being used to investigate the effect of holes on long
specimens which are subject primarily to flexural stresses. These
tests are presently being conducted by W. Landers of the Oregon
State University Engineering Experiment Station. The over -all
specimen is fifteen inches high and three feet three inches long as
shown in Figure 2. The holes are seven inches high and five and
one -half inches wide with the corners rounded to a one inch radius.
Beam 1 has the center of the hole six and three -quarters inches
from the support resulting in four inches of material between the
edge of the hole and the support, Beam 2 has 8 inches of material,
beam 3 has 12 inches of material, and beam 4 has 16 inches of material
between the hole and support. In order to clear the hole when loading
beam 4 the loading was applied at the third point. Stiffeners were
added under the load and at the nearer support to prevent the larger
shear in the left (Figure 2) part of the beam from failing the web in
that area.
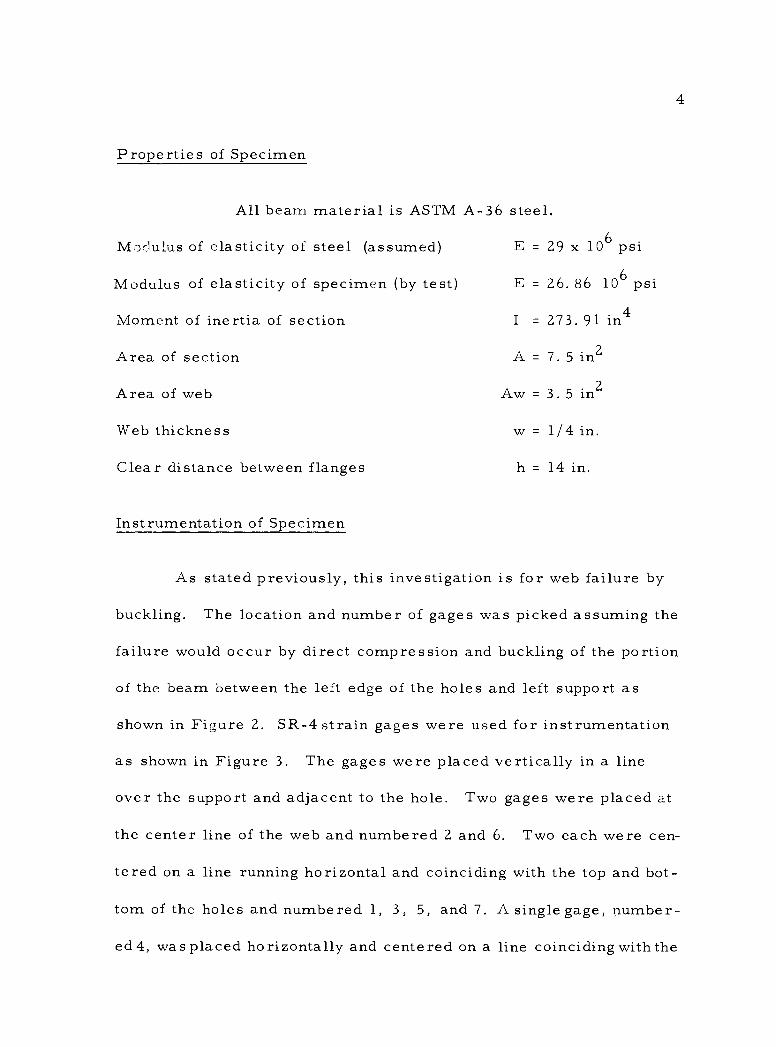
Properties of Specimen
All beam material is ASTM A -36 steel.
Mo -lulus of elasticity of steel (assumed)
Modulus of elasticity of specimen (by test)
Moment of inertia of section
Area of section
Area of web
Web thickness
Clear distance between flanges
Instrumentation of Specimen
E = 29 x 106 psi
E = 26. 86 106 psi
I = 273. 91 in4
A=7.5in2
Aw=3.5in2
w = 1/4 in.
h = 14 in.
4
As stated previously, this investigation is for web failure by
buckling. The location and number of gages was picked assuming the
failure would occur by direct compression and buckling of the portion
of the beam between the left edge of the holes and left support as
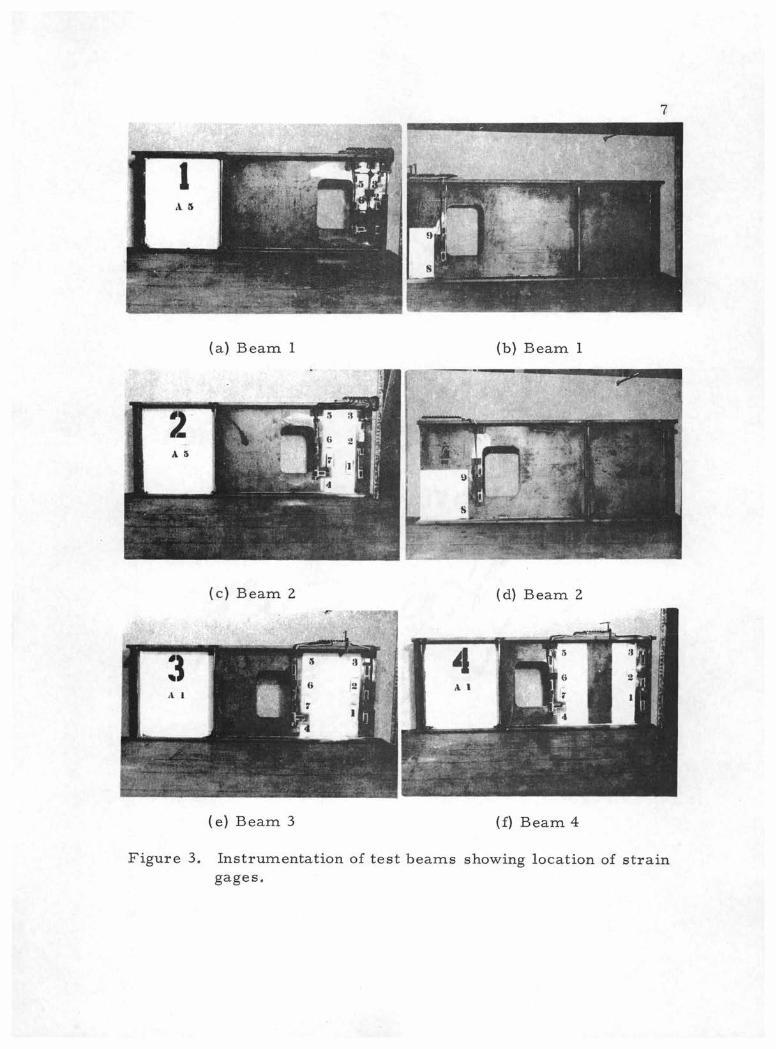
shown in Figure 2. SR -4 strain gages were used for instrumentation
as shown in Figure 3. The gages were placed vertically in a line
over the support and adjacent to the hole. Two gages were placed at
the center line of the web and numbered 2 and 6. Two each were cen-
tered on a line running horizontal and coinciding with the top and bot-
tom of the holes and numbered 1, 3, 5, and 7. A single gage, number-
ed 4, was placed horizontally and centered on a line coinciding with the
5
bottom of the hole. After preliminary tests were run it was found
that additional instrumentation was needed. Gages were added to
beams 1 and 2 on the opposite side of the web from existing gages 5
and 7 as shown in Figures 3(b) and 3(d). The gages used for beams
1 and 2 were SR -4 type A5 -S6 with a gage length of one and one -half
inches. Beams 3 and 4 used SR -4, type Al -S6 gages with a gage
length of two inches. As the primary concern was web buckling, no
strain gages were put on the flanges and no measurements of deflec-
tion were taken for the span to compute bending stress. When bending
stresses are below 20 percent of the critical value for pure bending
they lower the shearing stress that may induce buckling by approxi-
mately four percent of the critical value for pure shear (3, p. 194,
196). Because of the very small effect of bending stresses, they
were neglected for these tests.
BM 1
BM 2
1ÿ _....¡
NOTES: All Steel A -36. All beams strni ArIr except fa,
horizontal location hale. Make one each BM's 1 thru Y.
8M3 KIY W¢b/ x y Flong¢. ;t iffonzr
r< ,
I-, -ir- r1
/'--1f 5.3 6' '-" ------ - -- - 3 3 - BM 4
._G..
l 8ÿ 1.1
I I
`--i
OREGON STATE UNIVERSITY Department of Cavil *file--
TEST BEAM DETAILS By S.L.C. Scale /i. =- 1 =o _
Feb y, /964' L rowinq 1
Figure 2. Test beam shop drawing. -
..-/ -7-9-- -1-7-r , I, N o . i r - i 1 \IV i ' ! ... ,1 .i_i_
1 refi 1 , 1
, ,_...H.
, - i
1
-,4 ! ' ,
- _A....i __II / . i -r
i
I:o .
. s! `ON
.-:A;
I
L. I
7"
.
i
f- T
4
-.,
` ---- - I î '
-IN I
L `
/ iti
¡ Ì
:1 i
t--_- it ¡...- .
.
7
(a) Beam 1 (b) Beam 1
(c) Beam 2 (d) Beam 2
(e) Beam 3 (f) Beam 4
Figure 3. Instrumentation of test beams showing location of strain gages.
o
S
1 i s ,t, s
Y . 1R
A S
3 3
A (
(ì
1111
rI
'
n
r s' I.o Ssr
: ----= - ..,.
;.. 4
(;
'1 7 I !
, i
n f1 /I
° _
a,,441...10
8
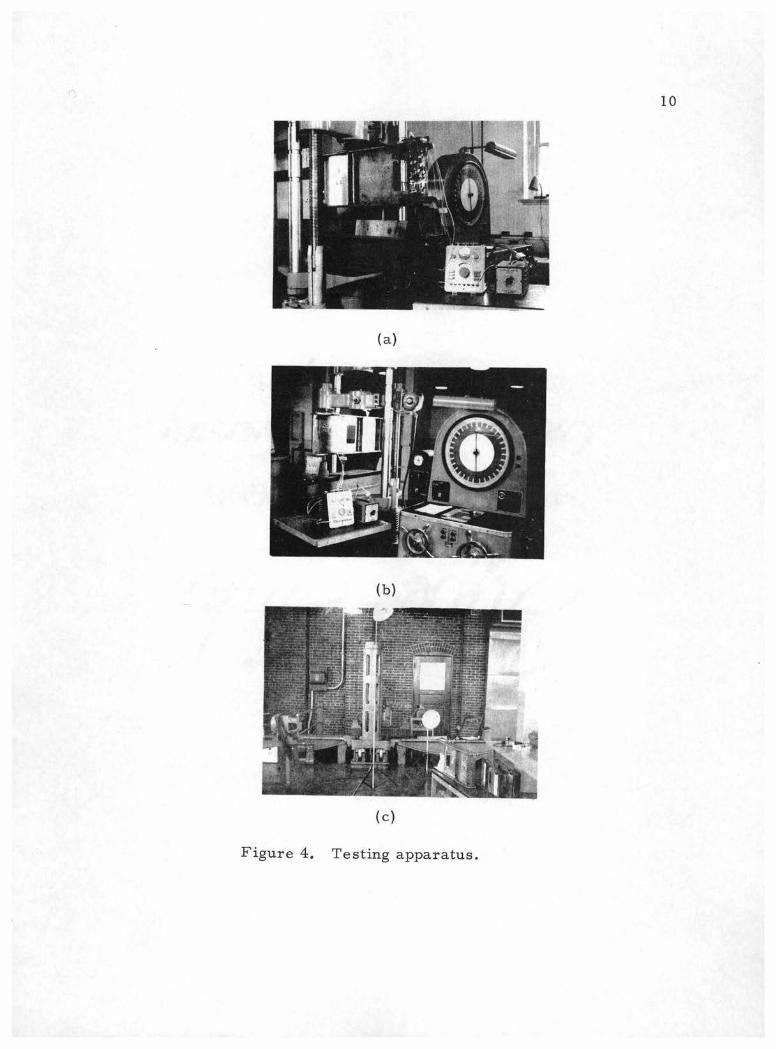
APPARATUS
Preliminary Test
The beams were supported on either end by fixed bearing
blocks with rounded heads. The beams were too long to fit the plate
of the hydraulic testing machine so a section of eight inch bearing
pile (8x8 BP 36) was cut to act as a support beam for the bearing
blocks. The support beam had to cantilever over the bearing plate of
the testing machine as shown in Figure 4(a) in order to position the
test specimen so it could be loaded at the third point. The testing
machine used was a 60 Kip Baldwin- Southwark hydraulic machine as
shown in Figure 4(b). The loading rate used was variable between
periods of sustained loadings when strain gage readings were taken.
The load was applied through a bearing block with a one inch dia-
meter curve surface. No lateral support was provided as it was not
deemed necessary.
Final Test
The second test was necessary to fail the beams. A Rhiele
150 Kip beam testing machine was used as shown in Figure 4(c). The
test specimen was again supported on fixed bearing blocks with
rounded tops. The load was applied through a bearing block with
9
rounded edges with a one -quarter inch plate, four inches wide, be-
tween the block and the flange of the beam for beams 2, 3 and 4. A
three -quarter inch plate was used for beam 1. The plate was added
to distribute the load application over the top flange.
10
(a)
(b)
(c)
Figure 4. Testing apparatus.
r)
s. -au -._.
1
TEST PROCEDURE
Trial Test
11
A trial run was taken on beam 4 to establish desirable incre-
ments of loading. The beam was loaded in 1, 000 pound increments
up to 10, 000 pounds then loaded in 2, 000 pound increments up to
30, 000 pounds. The results of the test showed that larger incre-
ments in this range of loading were desirable and 3, 000 pound incre-
ments were chosen.
Preliminary Test
The specimens were placed in the testing machine and zero
readings were taken for the strain gages. The loading was applied in
increments of 3, 000 pounds. The loads were held constant between
increments and strain gage readings were taken, The specimen was
also observed for flaking of mill scale, bowing of the web and trans-
lation of the top flange over the support. The maximum accurate
loading was 54, 000 pounds which gave a total shear of 18 Kips
in the web section. The specimen was then unloaded and zero load
readings were taken for the strain gages to determine if the cross
section had returned to its original state.
12
Final Test
The final test was run similar to the preliminary test, The
load increments were 15, 000 pounds which resulted in increasing
increments in total shear by three Kips in the portion of beam
under investigation. The loading was again held between increased
increments to observe the strain gage readings, flaking of mill scale,
bowing of the web, and translation of the top flange over the support,
Zero readings of the strain gages were not taken for the specimens.
RESULTS
Preliminary Tests
13
The results of the strains are shown in Figure 7 through 10.
None of the beams failed during the preliminary tests. Beam webs
that were bowed under loading returned to original shape upon un-
loading. The area of the top flange directly under the loading head
showed some slight crushing on all specimens but the top flange itself
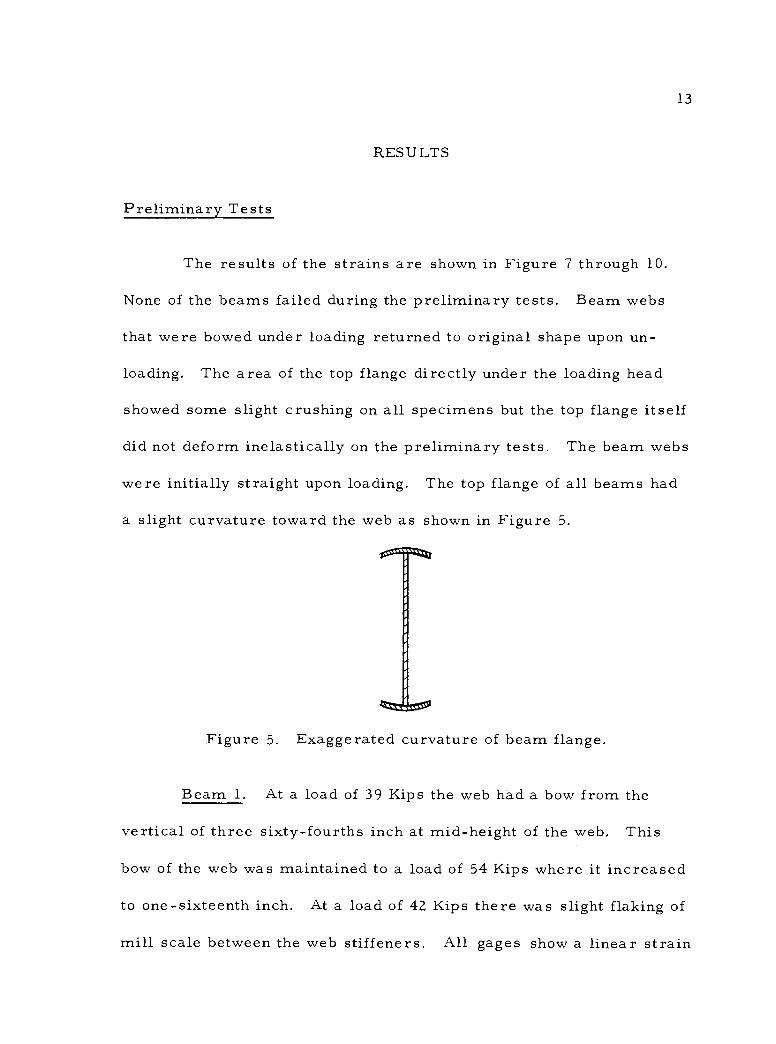
did not deform inelastically on the preliminary tests. The beam webs
were initially straight upon loading. The top flange of all beams had
a slight curvature toward the web as shown in Figure 5.
Figure 5. Exaggerated curvature of beam flange.
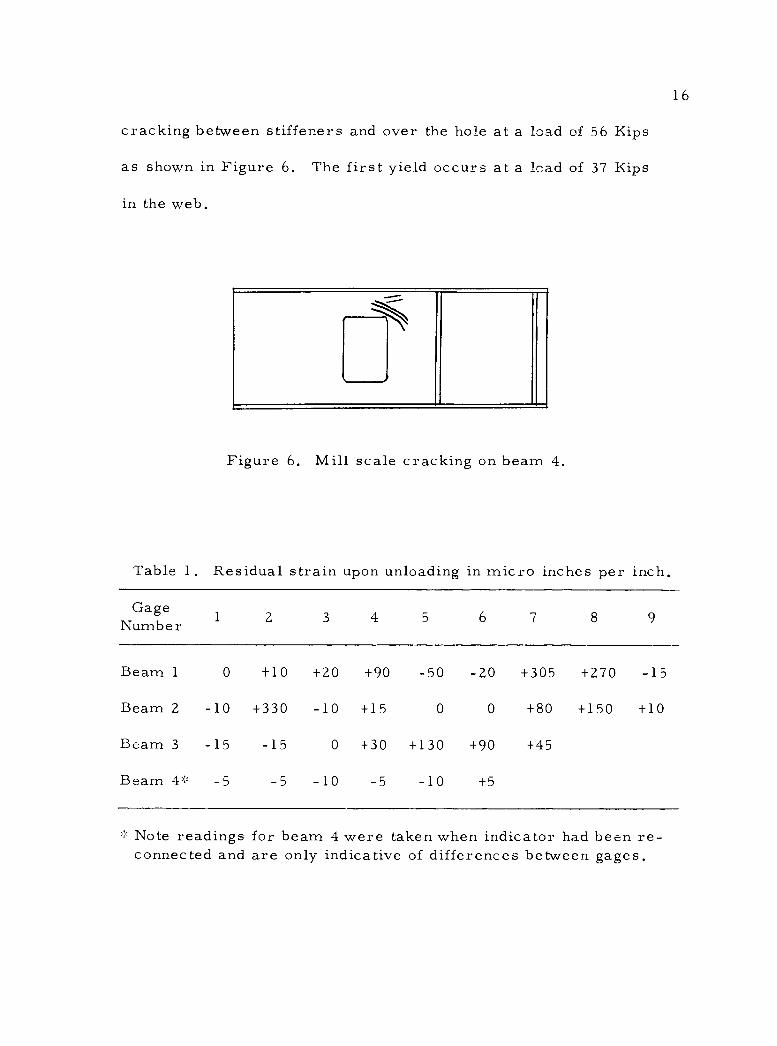
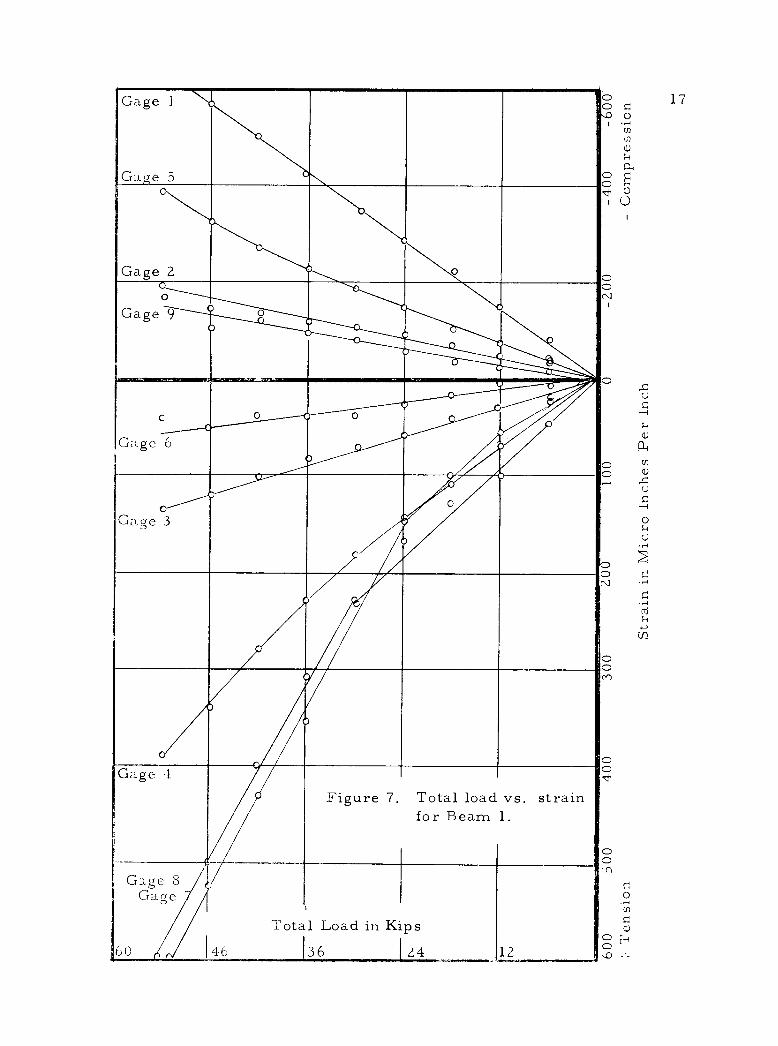
Beam 1. At a load of 39 Kips the web had a bow from the
vertical of three sixty- fourths inch at mid -height of the web. This
bow of the web was maintained to a load of 54 Kips where it increased
to one - sixteenth inch. At a load of 42 Kips there was slight flaking of
mill scale between the web stiffeners. All gages show a linear strain
14
in Figure 7 up to a load of 24 Kips. At this load gages 4 and 5 show
a slight inelastic action of the web. The area of the web at gages
7 and 8 show tensions of the same magnitude on both sides of the
web and therefore would indicate no bowing of the web in this area.
Gages 6 and 9 located at the center line of the web are of opposite
sign and indicate that bowing is present at the center line. No ra-
tional explanation of the tension effect at the bottom of the hole is
available. The effect of stress concentration may be the cause of
the tension. Additional tests with more instrumentation would be
required to study this condition of tension at the location of gages 7
and 8. Gage 7 showed erratic behavior up to a load of 24 Kips then
indicated a linear strain distribution. Gage 8 had linear strain to
30 Kips then changed slope and remained linear. Both gages 7 and
8 gave linear strain readings in the 0 to 50 Kip range in the second
tests. This would indicate that some residual strains were present
around the hole in the first tests and that they were overcome above
a load of 30 Kips. No failure of the beam was indicated in the test.
All of the gages returned fairly close to their original readings upon
unloading (Table 1) except gages 7 and 8.
Beam 2. The gages show evidence of bowing from zero to
six Kips loading (See Figure 8). Then the compressive loading over-
came the tension in the web caused by bowing over the support. This
15
was possibly an effect of the transverse flange curvature and the beam
settling firmly onto the support. The strains were fairly linear
throughout the 0 to 48 Kip loading range. Above 48 Kips slight in
elastic action is shown in gages 1, 4, 6 and 7. The same tension
effect at gage 7 is present as in beam 1. Gage 9» on the opposite side
of the web from gage 6, did not operate properly so there is no indica
tion of bowing of the web by comparing gages. The web started to
show visual evidence of bowing at a load of 50 Kips. The bow was
one thirty-second of an inch at 42 Kips and remained there until a
load of 56 Kips was reached when it had increased to three sixty-
fourths of an inch. The strain gages returned exceptionally well upon
unloading as shown in Table 1.
Beam 3. The beam strains were linear in all gages through
the entire loading range except for slight inelastic action of gage 7 at
loads exceeding 48 Kips. The strains in Figure 9 show tension over
the support to a load of six Kips. This effect might be caused by
the curvature of the flanges, mentioned previously, causing tension
until the beam settles on the support or it may be an effect of local
stress concentrations.
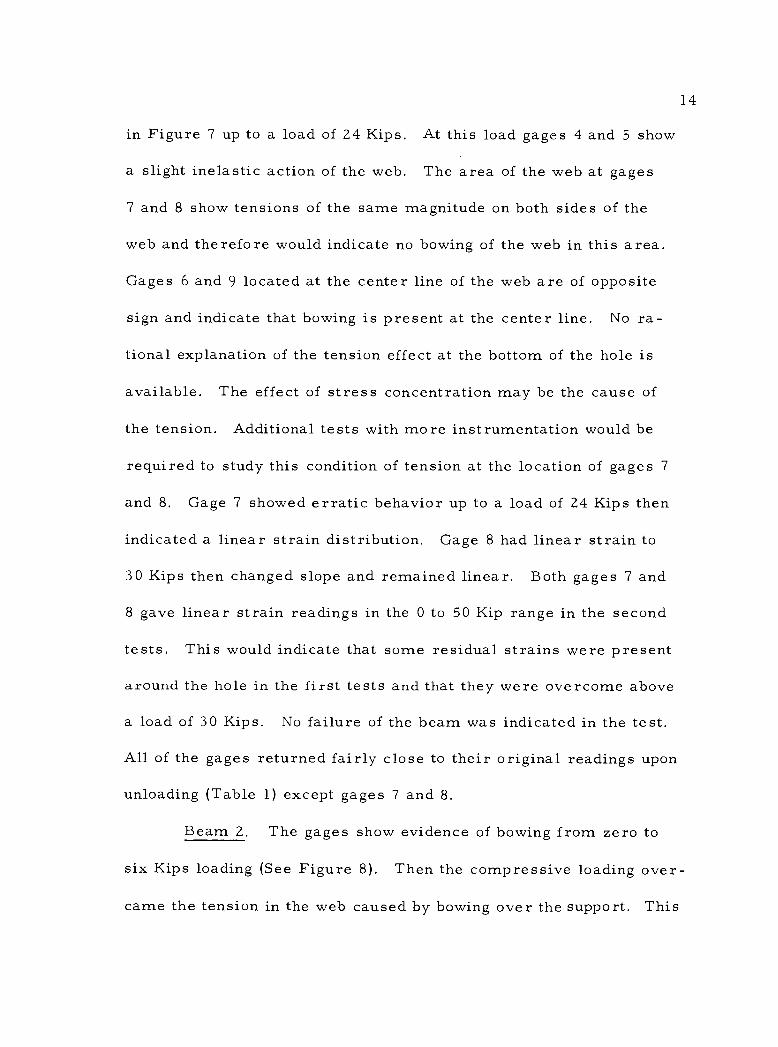
Beam 4. The strains were linear to a load of 36 Kips as
shown in Figure 10. Above a load of 36 Kips the material shows
some sign of yielding adjacent to the lower portion of the hole as
shown by strains of gages 4, 5 and 7. The beam had mill scale
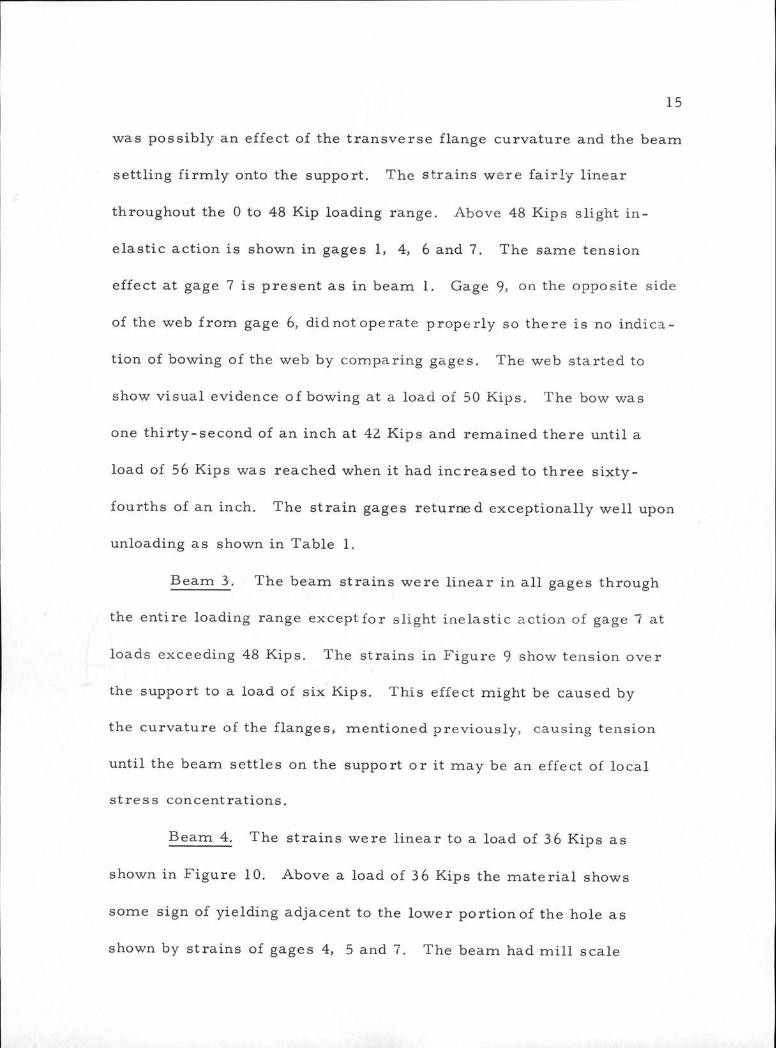
16
cracking between stiffeners and over the hole at a load of 56 Kips
as shown in Figure 6. The first yield occurs at a load of 37 Kips
in the web.
i
Figure 6. Mill scale cracking on beam 4.
Table 1. Residual strain upon unloading in micro inches per inch.
Gage Number 1 2 3 4 5 6 7 8 9
Beam 1 0 +10 +20 +90 -50 -20 +305 +270 -15
Beam 2 -10 +330 -10 +15 0 0 +80 +150 +10
Beam 3 -15 -15 0 +30 +130 +90 +45
Beam 4* -5 -5 -10 -5 -10 +5
Note readings for beam 4 were taken when indicator had been re- connected and are only indicative of differences between gages.
*
Strain in Micro Inches Per Inch
Gage 1
Gage 5
Gage 2 0
O
Gage 9 0 w
s - c
Gage 6
o o
Gage 3
o
V
''
Gage 4
Figure 7. Total load for Beam
vs. strain 1.
Gage 8 Gage
60 46
Total Load in Kips
36 24 12
0
0 0
0 0 M
17 i
.
li ! '
¡
i
o U
o o
hillik
o
G2 H +
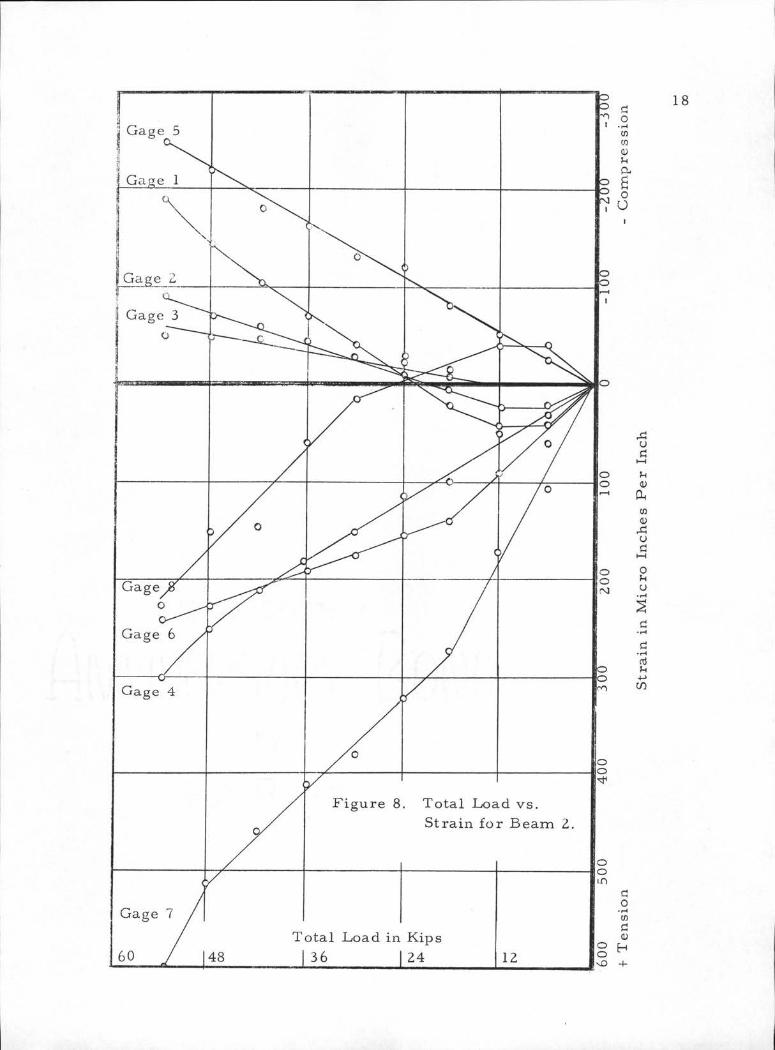
Figure 8. Total Load vs.
Strain for Beam Z.
Total Load in Kips
| 36 | 24 12
O• t-<
en
CO
ou
ft
o
u
Ao
di—i
V
Dh
en
<u
o
l-H
o^1
u
niu
+->
en
o
o
m
oo
o-r-t
W
d
H
18
+ T
ensi
on
Stra
in i
n M
icro
Inc
hes
Per
Inch
o
Gage 5
Gage 3
.
0 0
Gage 2
Gage 1
o
o o
o
o A
í o I
o
o Gage 6
° O O
°
O
o
Gage 4
o
Figure 9. Total Load Strain for Beam
vs. 3.
Gage 7
60 148
Total Load in Kips 136 24 12
o 0
O
O o H
o o
0 O
o o
o o
19
c
° o
0
+
'
.
o o rM O
tr) u) a)
a. o o o N
N
rr)
0 o .14
-
.
o
Ir
Stra
in i
n M
icro
Inc
hes
Per
Inch
Gage 1 o 0
Gage 2e ,
Gage 5
Gage 3 &kb: o
o
4 o
.4' Gage 6
o
O . Gage 4
Gage 7
Figure 10. Total load for beam
vs, strain 4.
.0 j 48
Total
136
Load in Kips
124 12
0 0
o
o 0
0 0
0 o
o o
20
.lo.
.
.
e
o
. N
á
áa
ó ó
21
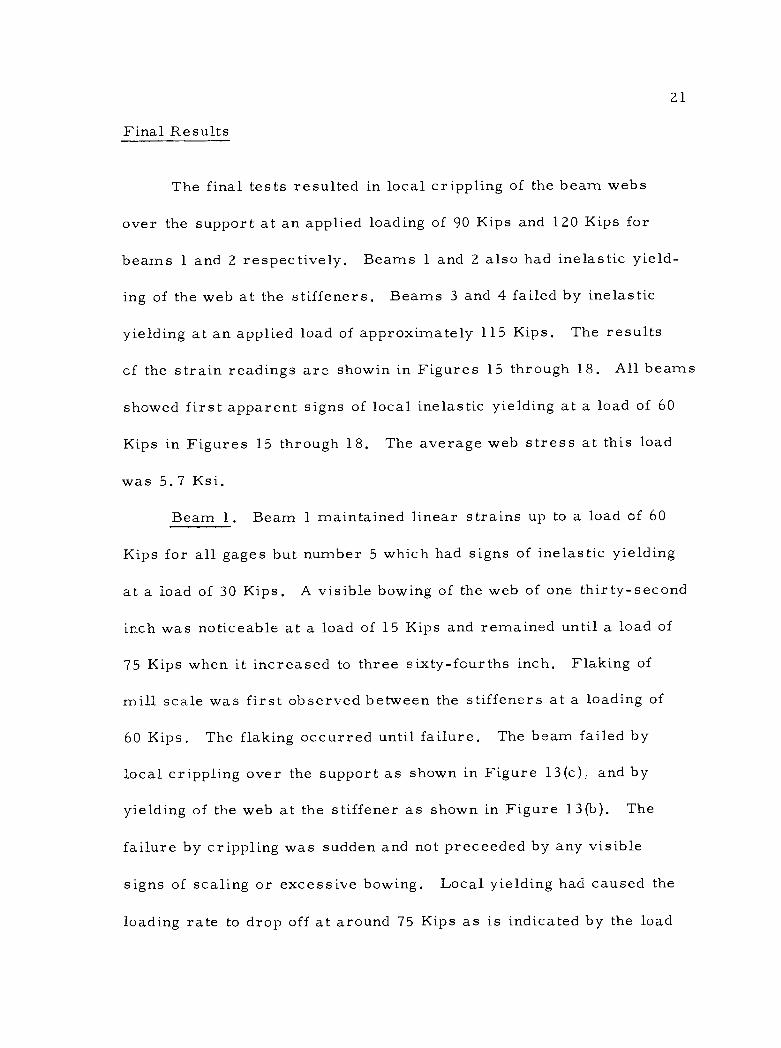
Final Results
The final tests resulted in local crippling of the beam webs
over the support at an applied loading of 90 Kips and 120 Kips for
beams 1 and 2 respectively. Beams 1 and 2 also had inelastic yield-
ing of the web at the stiffeners. Beams 3 and 4 failed by inelastic
yielding at an applied load of approximately 115 Kips. The results
of the strain readings are showin in Figures 15 through 18. All beams
showed first apparent signs of local inelastic yielding at a load of 60
Kips in Figures 15 through 18. The average web stress at this load
was 5.7 Ksi.
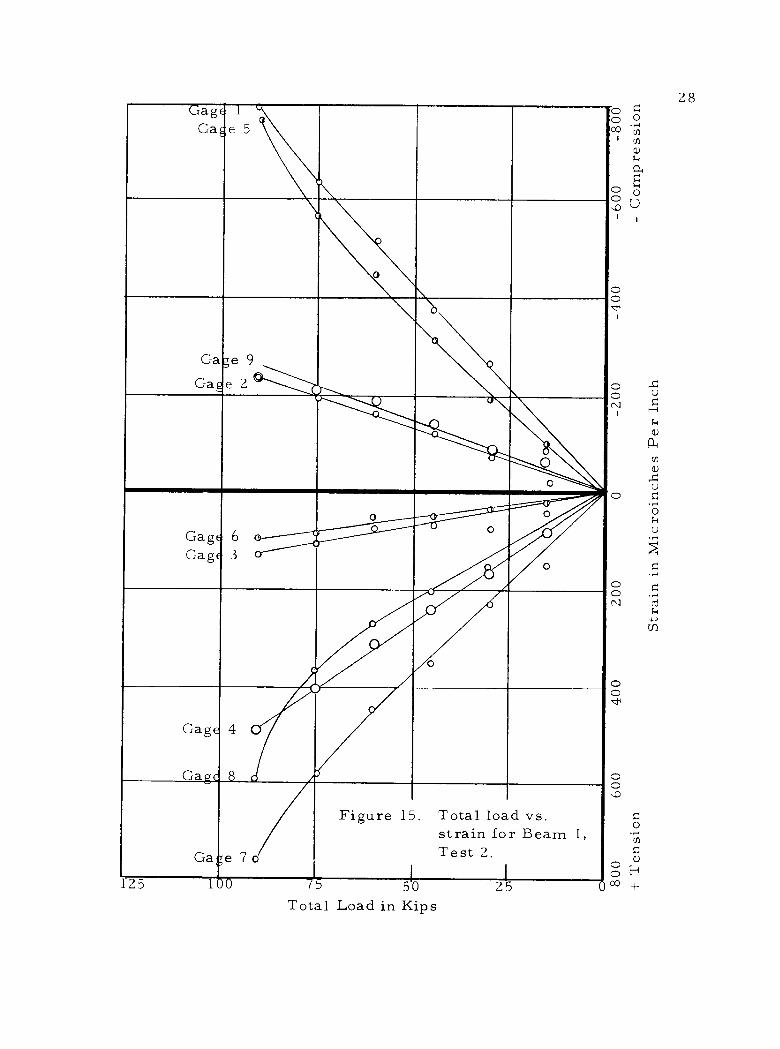
Beam 1. Beam 1 maintained linear strains up to a load of 60
Kips for all gages but number 5 which had signs of inelastic yielding
at a load of 30 Kips. A visible bowing of the web of one thirty- second
inch was noticeable at a load of 15 Kips and remained until a load of
75 Kips when it increased to three sixty -fourths inch. Flaking of
mill scale was first observed between the stiffeners at a loading of
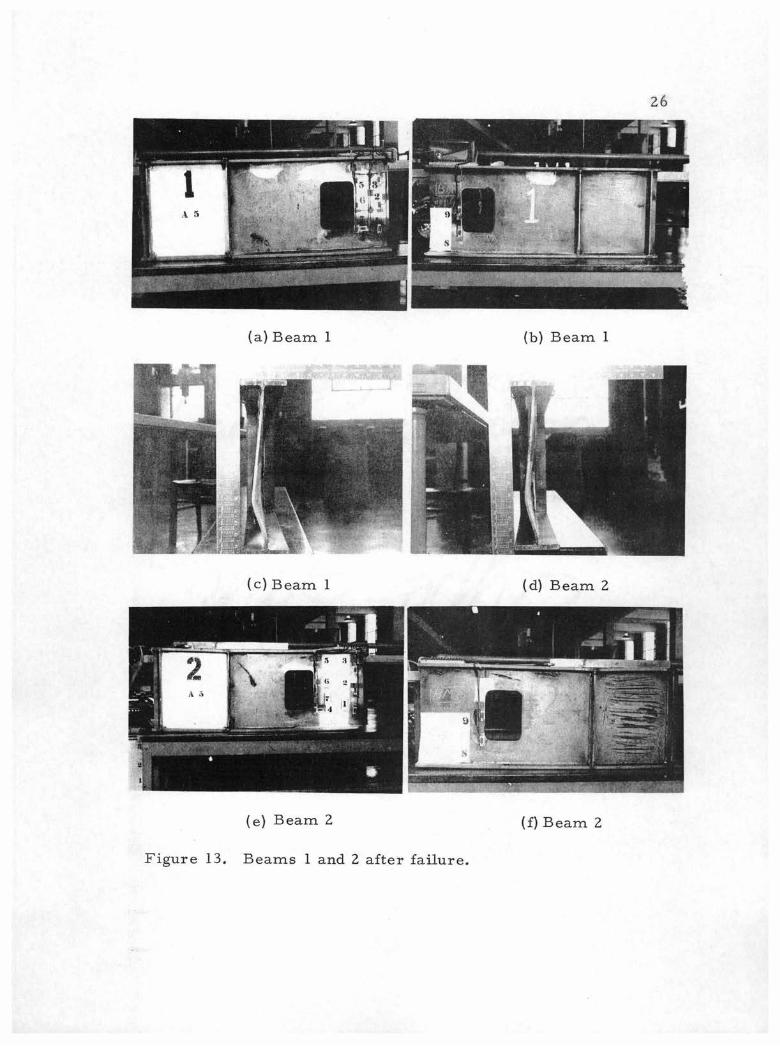
60 Kips. The flaking occurred until failure. The beam failed by
local crippling over the support as shown in Figure 13(c), and by
yielding of the web at the stiffener as shown in Figure 13(b). The
failure by crippling was sudden and not preceeded by any visible
signs of scaling or excessive bowing. Local yielding had caused the
loading rate to drop off at around 75 Kips as is indicated by the load
22
strain curve of Figure 15. The loading had been stopped at 97 Kips
to observe if any flaking of mill scale was apparent. While under
this constant load the web failed. The failure occurred at 9. 25 Ksi
of average shear stress. Inelastic yielding was first noticeable
when the average shear stress was 5.7 Ksi.
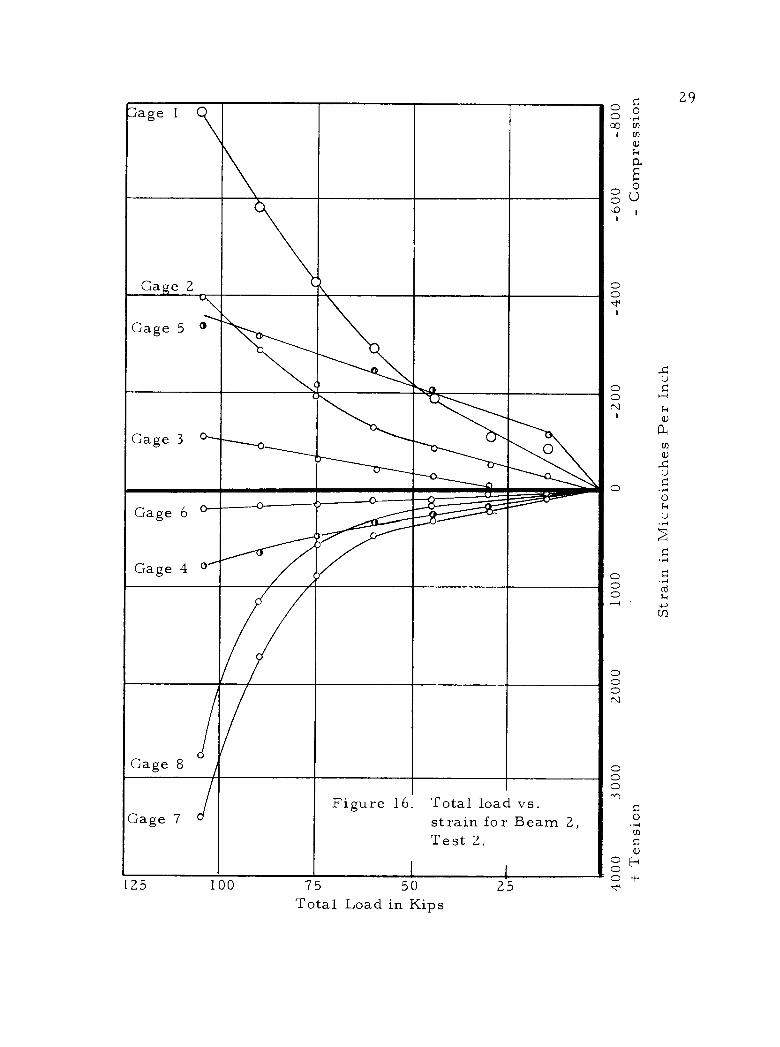
Beam 2. Beam 2 maintained linear strains (Figure 16) to a
loading of approximately 48 Kips. The gages that in the first series
of tests showed abrupt change in slope (Figure 8) of load strain
curves at a load of six Kips, did not have abrupt changes at that
load during the test. Gage 5 had an abrupt change in linear strain
at a load of 15 Kips. At a load of 30 Kips the web had a slight
visible bow to the left of vertical of one thirty- second of an inch.
This bow in the web remained up to a load of 60 Kips. At a load of
51 Kips, the top flange over the support moved left approximately
one -tenth of an inch. The bow was three sixty- fourths of an inch at
60 Kips and remained there until failure. Flaking of the mill scale
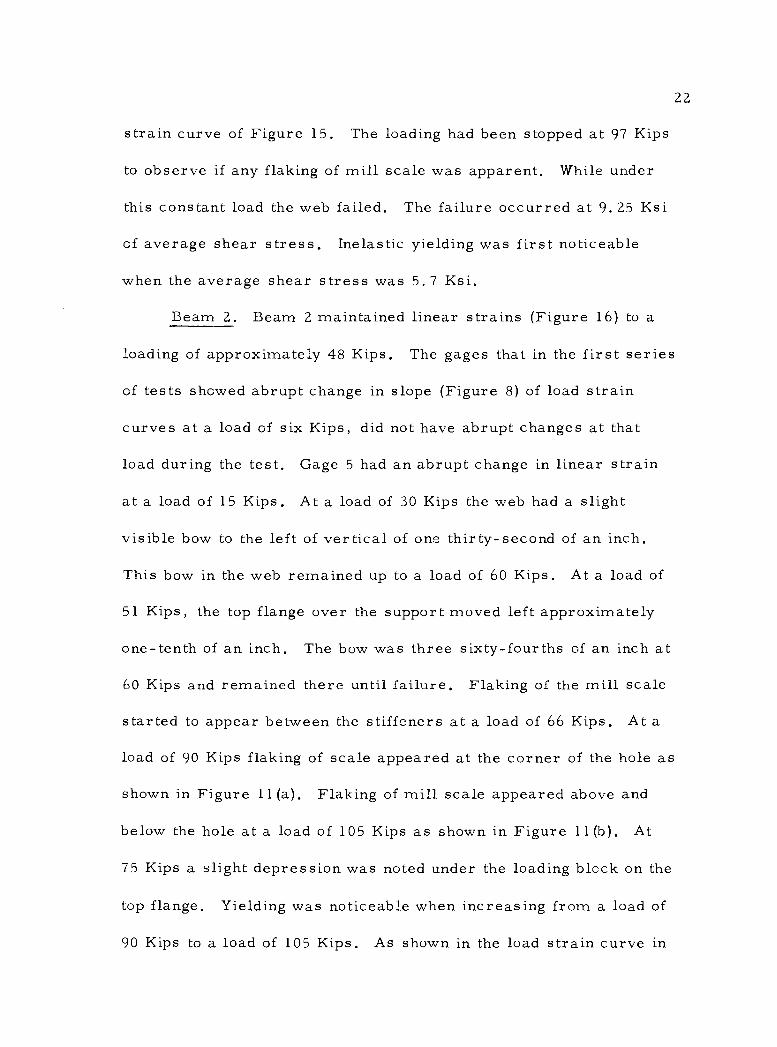
started to appear between the stiffeners at a load of 66 Kips. At a
load of 90 Kips flaking of scale appeared at the corner of the hole as
shown in Figure 11(a). Flaking of mill scale appeared above and
below the hole at a load of 105 Kips as shown in Figure 11(b). At
75 Kips a slight depression was noted under the loading block on the
top flange. Yielding was noticeable when increasing from a load of
90 Kips to a load of 105 Kips. As shown in the load strain curve in
23
(a)
...._
- `\ -:-
(b)
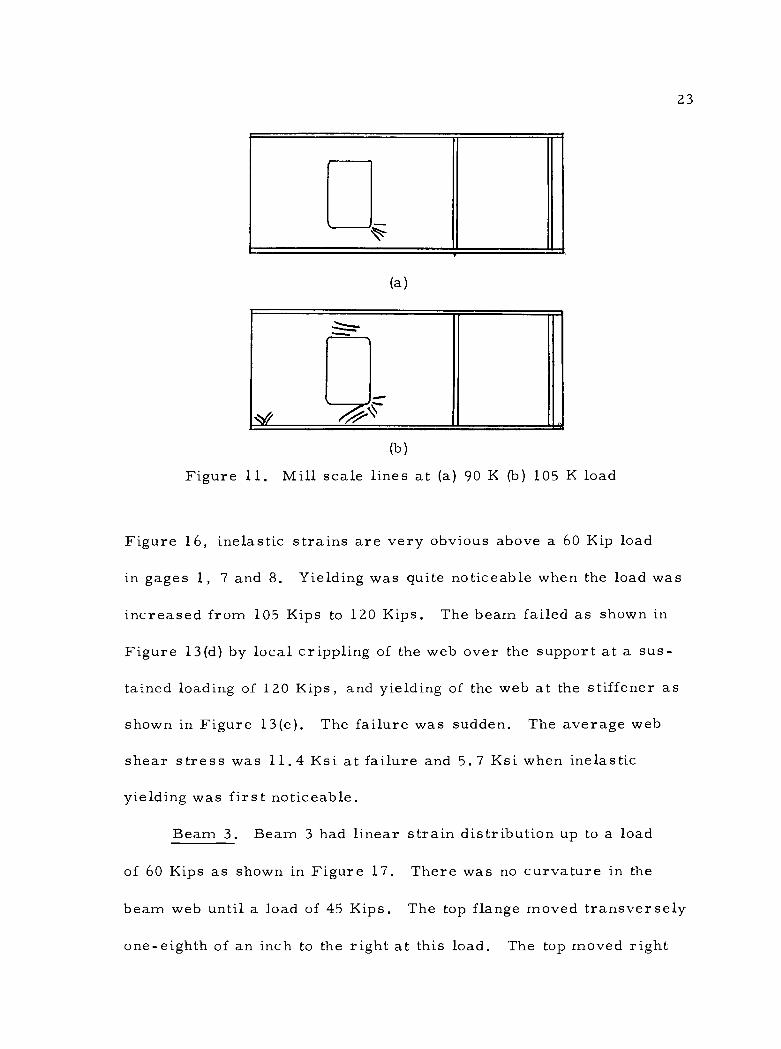
Figure 11. Mill scale lines at (a) 90 K (b) 105 K load
Figure 16, inelastic strains are very obvious above a 60 Kip load
in gages 1, 7 and 8. Yielding was quite noticeable when the load was
increased from 105 Kips to 120 Kips. The beam failed as shown in
Figure 13(d) by local crippling of the web over the support at a sus-
tained loading of 120 Kips, and yielding of the web at the stiffener as
shown in Figure 13(e). The failure was sudden. The average web
shear stress was 11.4 Ksi at failure and 5.7 Ksi when inelastic
yielding was first noticeable.
Beam 3. Beam 3 had linear strain distribution up to a load
of 60 Kips as shown in Figure 17. There was no curvature in the
beam web until a load of 45 Kips. The top flange moved transversely
one - eighth of an inch to the right at this load. The top moved right
1
24
another one -eighth of an inch at a load of 51 Kips and remained to 66
Kips. At a load of 66 Kips the top flange moved to the left. This
reversal in the direction of movement of the top flange probably
accounts for the change in slope of the strain plots of Figure 17
above a load of 60 Kips. At a load of 75 Kips the top flange had
returned to its original unloaded position. The web had a bow of
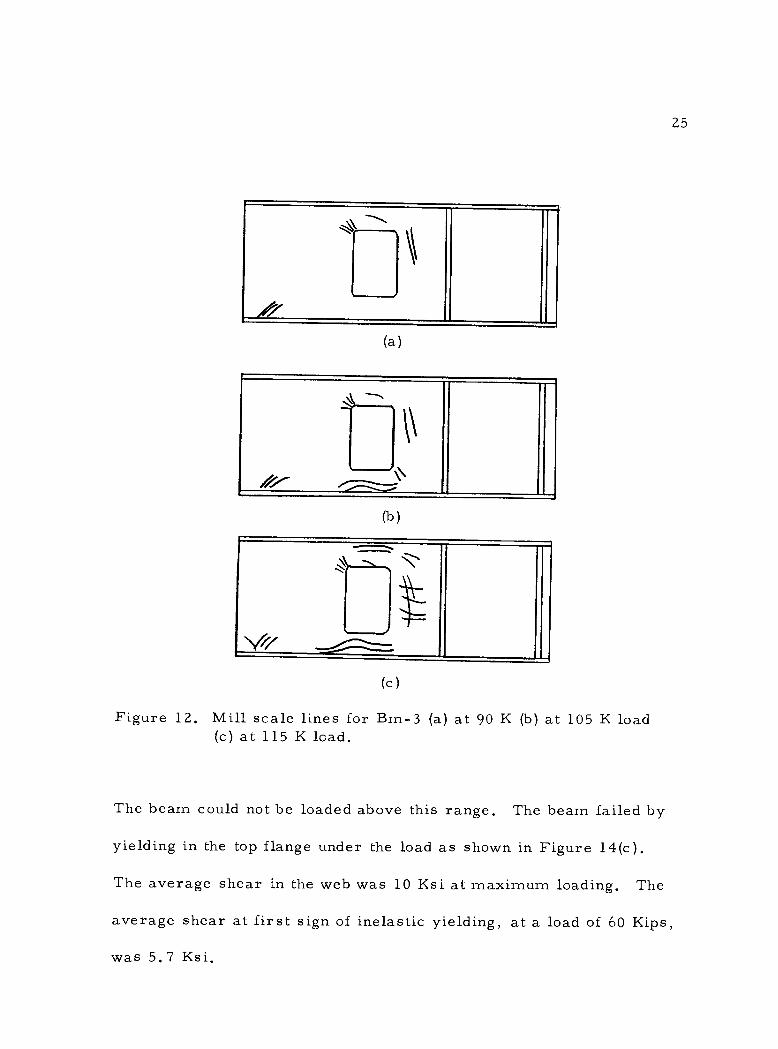
one - sixteenth inch at a load of 75 Kips. At a load of 90 Kips flaking
of mill scale appeared as shown in Figure 12(a). At a load of 105
Kips scaling increased as shown in Figure 12(b) and there was a
slight crushing under the applied load resulting in the load falling
off slightly. General yielding was apparent at a load of 111 Kips
and 115 Kips and was accompanied by heavy flaking of mill scale
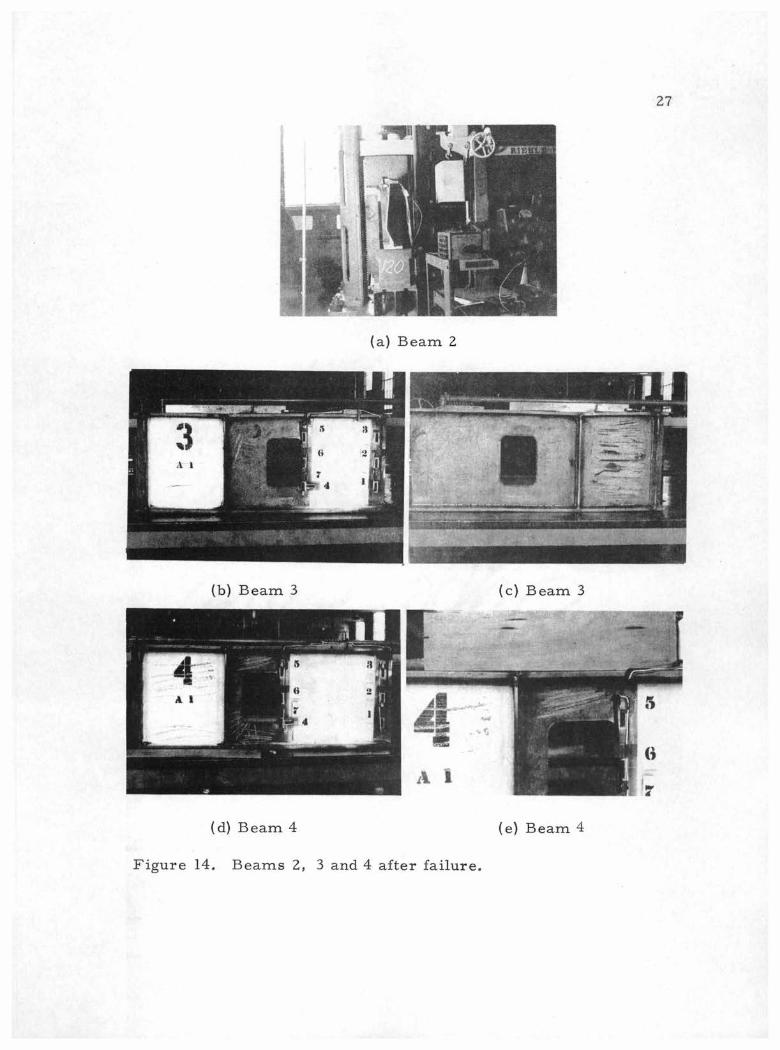
as shown in Figure 12(c). The beam failed by crushing under the
point of application of the load as shown in Figure 14(a) and 14(b).
Due to the reversal of movement of the beam flange the plot of the
load vs. strain in Figure 17 does not clearly indicate at what load
inelastic yielding first took place. The apparent first yielding at
105 Kips took place at an average shear of 10 Ksi.
Beam 4. Beam 4 maintained linear strains up to a load of 45
Kips as shown in Figure 18. The strain at gage seven showed
inelastic yielding was excessive. The web did not bow during the
test. At a load of 105 Kips there was extreme flaking of mill scale
(Figure 14(d)) over the hole and yielding of the flange under the load.
25
l
(a)
n1
(b)
(c)
Figure 12. Mill scale lines for Bm -3 (a) at 90 K (b) at 105 K load (c) at 115 K load.
The beam could not be loaded above this range. The beam failed by
yielding in the top flange under the load as shown in Figure 14(c).
The average shear in the web was 10 Ksi at maximum loading. The
average shear at first sign of inelastic yielding, at a load of 60 Kips,
was 5.7 Ksi.
`1
Y/
Z V
(a) Beam 1 (b) Beam 1
(c) Beam 1 (d) Beam 2
(e) Beam 2
Figure 13. Beams 1 and 2 after failure.
(f) Beam 2
!r Ì{ ;
ti :`}- r.... -,
, 1_:.
. .
1 41
i.I.;_' 41. o: :V fl
IR.G
,
'7 1. , =._ -
-
-- - t A
0
, ó iI&L t
rS
F
ti
i
+- -- -='s aNOMM..®
27
(a) Beam 2
(b) Beam 3 (c) Beam 3
(d) Beam 4
Figure 14. Beams 2, 3 and 4 after failure.
(e) Beam 4
. i MAnn-r
s 3
4
- -..-.... _
_.- - .
'::.-` -
A
'hTrs}t.:
1. 3 1 18 I
...i, 7 ..0,... 4 t . o '--1 -r . -
1
2 `n
- .1 _-
+ T
ensi
on
Stra
in i
n M
ic ro
inch
e s
Per
Inch
Gage Gage
1
5
o
Gage
Gage
9
O
o
Gage Gage
6 0
3
o ' O
o
o
o
Gage
Gage
4
: ,'
Gage r
7 o
Figure 15.
I
Total load strain for Test 2.
I
vs. Beam 1,
5 i5 50 Total Load in Kips
25
o o
o
o o N
o 0
o o
28
r
..
I
1 ,
'
O
0
0 0 N
0 o
®l----_,..,
o [ 0
E o U
c
Stra
in i
n M
ic ro
inch
e s
Per
Inch
67
o 0 0
0 0 0
o o o
0
rn o 0
co o 0
sdix ui peorI Telo,I, SZ OS SL 00T SZI
`Z uZLag 'SA
1Sas, .IOq LIiL'.I4s
ppoT Tew" 91 azn2i3 L 92LD
g a2.e0
- -. '1,
, .
pow-
t a2p0
9 a2p9
.
O .
, .
0-----_______0 £ a2-eJ
m
.
7 a2eo
_
I a2'er
1--
'7
o
o S a2-e0
7
+ ó H o
1 I
,
l,J--
' N
¡ 11
1 ,
. '
., '
pi
ln
GC
2
CD
' o
o
t .+
, , :o ..
I ..
I,
(51
6000
+
T
ensi
on
5000
40
00
3000
20
00
0
Stra
in i
n M
icro
inch
es P
er I
nch
-100
0 -2
000
-300
0 -
Com
pres
sion
U
U
U
r
1
Gage 4
Gage
Total load for Beam
sdix ut ppo'7 Few",
+ T
ensi
on
Stra
in i
n M
icro
inch
es P
er I
nch
Gage 5
Gage 2
Gage 1
Gage 3
G a 6
Ahho _ ---
I
Gage 4
I
Figure 18. Total Beam
load vs. strain 4, Test
for 2.
Gage 7
125 100
Total Load in Kips
175 150 25
0 o o
0 o o N
o o o
.
_..
.01011111111"111' °I.. o
/ .
I
0 0 0 N
o o o '
31 g
(L
.0
F
32
Analytical Results
The resulting failure of the beams were to be compared to
theoretical failure by column action of the web, plate buckling of
the portion between the hole and support and shear failure.
Column action. Beams 1 and 2 were analyzed for column
buckling of the portion of the web between the hole and support. It
is probable, by noting the mode of failure (Figure 13) in beams 1 and
2, that the failure was by local crippling and not buckling. Calcula-
tions were made using Euler's column equation to determine a ratio
of effective column height to the actual height of the web. The
calculation (Appendix A) gave an effective length factor (K) of
0.567 and 0.661 for beams 1 and 2.
Plate buckling. Beams 1 and 2 were analyzed for plate buck-
ling (Appendix B) assuming that the portion of web between the hole
and support was simply supported on three edges and free on the
fourth edge (3, p. 155). Beam 1 had a computed critical shear of
13.75 Ksi by the plate buckling equation and an average computed
shear of 23.5 Ksi across the section. Beam 2 had a computed
critical shear by the plate buckling equation of 16.2 Ksi. Beam 2
gave comparable results for plate buckling failure. The computed
average shearing stress across the section between the hole and
support was 16.8 Ksi. Beam 1 failed at a much higher shear than
33
the computed critical shear for plate buckling. It is interesting to
note that at a failure the product of EE for gage 7 on beams 1 and 2
was approximately 22 Ksi which is slightly higher than the critical
shearing stress of steel as computed by Von Mises shear equation.
Shear failure. Beams 3 and 4 failed at a load of approximately
105 Kips. The failure was by yielding of the web at the stiffener and
bending of the flanges under the load. The average shearing stress
between the stiffeners at this load was 23.8 Ksi which is above the
value of critical shear for steel as computed by the Von Mises shear
equation, P v = Fy/Ñ3 (2, p. 218). cr
34
CONCLUSIONS AND RECOMMENDATIONS
The critical mode of failure is controlled by shear in the
unstiffened web of the beam when the edge of the holes are 12 inches
or more from the support and h/t is < 55. This would follow the
existing design criteria for I -beams with a h/t < 70 as stated in the
AISC Steel Manual (1).
The failure of I -beams with holes in the web may be dictated
by plate buckling and /or local shear failure of the unstiffened web
when the edge of the hole is closer than 12 inches to the support and
h/t < 55.
Additional tests should be run on I -beams with holes in the
webs. The tests should include beams that have holes located within
12 inches from the support. More instrumentation is needed. Strain
gage rosettes should be used to obtain lines of principal strains at
the corners of the holes, over the supports and at the lower portion '
of the web below the hole. Vertical gages should be put on both sides
of the web to determine bowing. Tests should also be run with the
top flange secured to prevent lateral movement. The beam should
rest on a flat rocker plate rather than the support used and the load
should be applied through a plate.
35
BIBLIOGRAPHY
1. American Institute of Steel Construction. Steel construction manual. 6th ed. New York, 1963. 1 vol. (various pagings).
2. Beedle, Lynn S. et al. Structural steel design. New York, Ronald Press:- ress 1964. 819 p.
3. Gaylord, E. G. and C, N. Gaylord. Design of steel structures. New York, McGraw -Hill, 1957. 540 p.
4. Inge, Lyse and H. J. Godfrey. Investigation of web buckling in steel beams. Transactions of American Society of Civil Engineers 100:675 -705. 1935. (Paper number 1907)
5. Johnson, B. and G. G. Kubo. Web crippling at seat angle sup- ports. Bethlehem, Pennsylvania, 1941, various paging. (Fritz Engineering Lab, Lehigh University. Report number 192A2)
6. Ketchum, Milo S. and Jasper O. Draffin. Strength of light I- beams. Urbana, 1932. 41 p. (University of Illinois Engineering Experiment Station Bulletin 241)
7. Moore, H. F. The strength of I -beams in flexure. Urbana, 1913. 40 p. (University of Illinois Engineering Experiment Station. Bulletin 68)
8. Moore, H. F. and W. M. Wilson. The strength of webs of I- beams and girders . Urbana, 1916. 50 p. (University of Illinois Engineering Experiment Station. Bulletin 86)
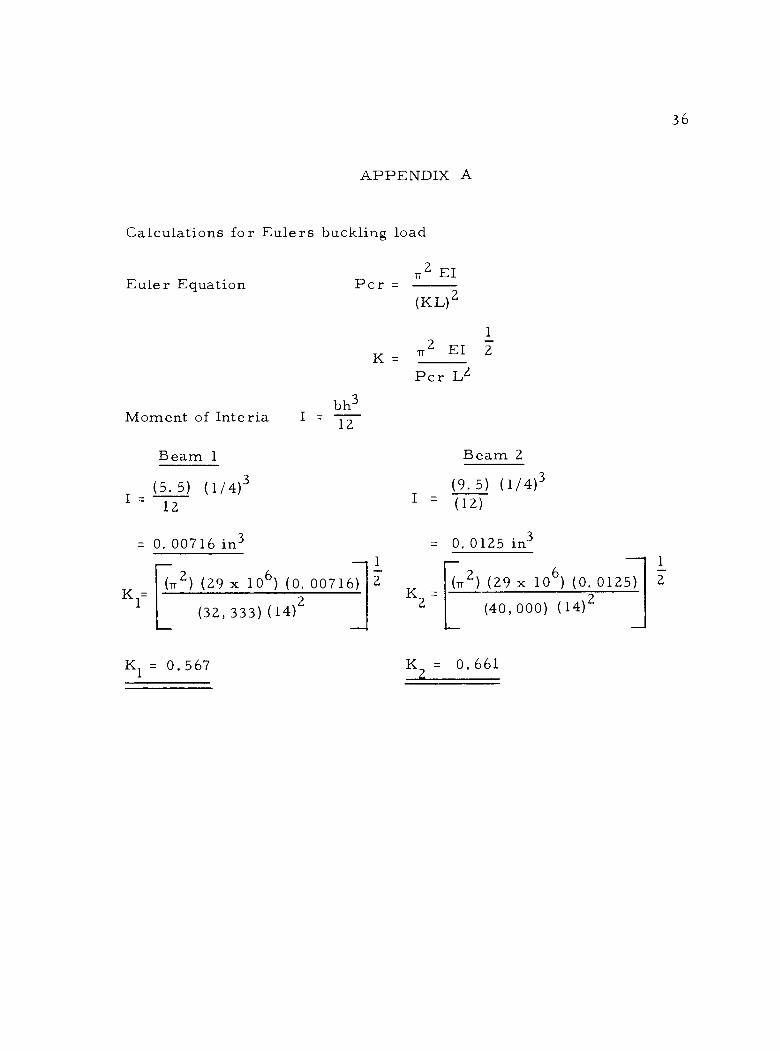
APPENDIX A
Calculations for Eulers buckling load
Euler Equation
Moment of Interia
I 12
Pcr - (KL)2
bh3 I 12
rr2 EI
K
1
n2 EI 2
Pcr L2
Beam 1 Beam 2
(5.5) (1/4)3
= 0. 00716 in3
(Tr2) (29 x 106) (0. 00716)
(32, 333) (14)2
K1 = 0. 567
1
2
(9.5) (1/4)3 I = (12)
K
= 0. 0125 in3
(29 x 106) 72) (0. 0125) 2 (40, 000) (14)2
K2 = 0.661
1
"2
36
=
- KL
=
-
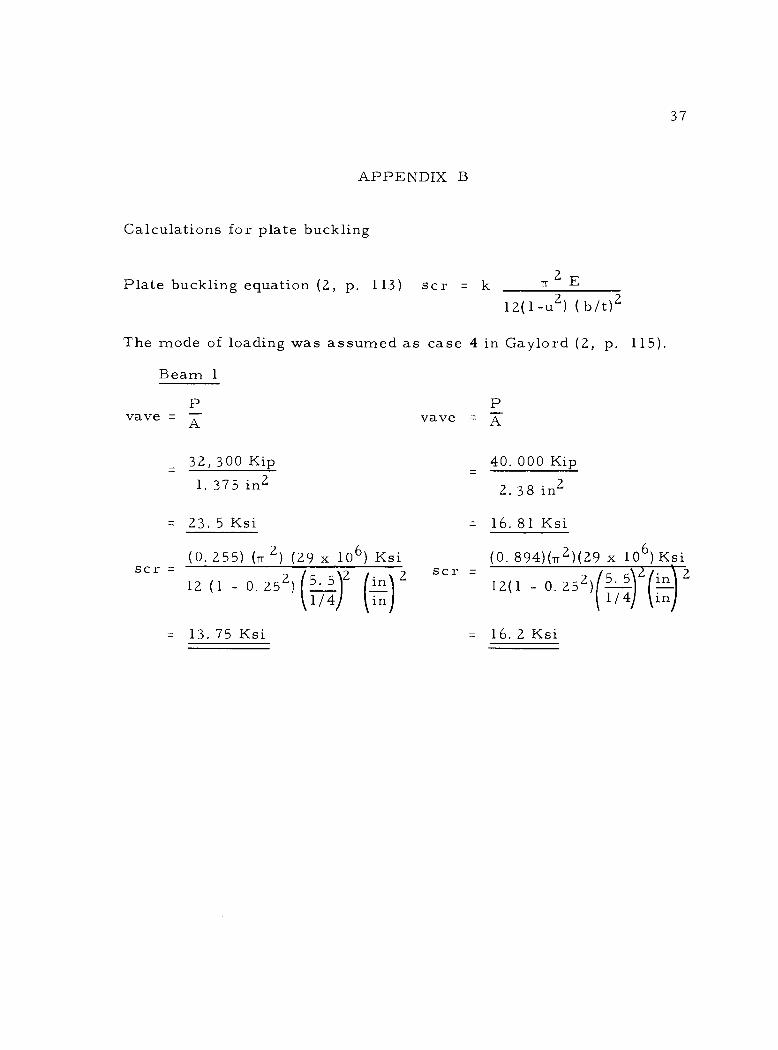
APPENDIX B
Calculations for plate buckling
Plate buckling equation (2, p. 113) scr = k
37
72 E
12(1 -u2) (b /t)2
The mode of loading was assumed as case 4 in Gaylord (2, p. 115).
Beam 1
P P vave = A vave = p
=
scr -
32, 300 Kip
=
scr
1, 375 in2
23. 5 Ksi
2) (29 x 106) Ksi (0. 255) (7
12 (1 - 0. 252) 5. 5 2 2 (in) 1/4 in
40. 000 Kip
2. 38 in2
16. 81 Ksi
(0. 894)(72)(29 x 106) Ksi
12(1 - O. 252) 5. 12(in) 2
1/ in
= 13. 75 Ksi = 16. 2 Ksi
_