Embed Size (px)
Citation preview

Web Based Geographic Information
System Oliver Clements, Ben Calton

Summary
• What is GIS?
• Why web based?
• Portal overview
• Analysis overview
• Data download
• Collaboration
• Portal administration
• Future additions
• Questions

What is GIS?
“A geographic information system (GIS) is a computer system for capturing,
storing, checking, and displaying data related to positions on Earth’s surface. GIS
can show many different kinds of data on one map. This enables people to more
easily see, analyze, and understand patterns and relationships.”Wikipedia https://en.wikipedia.org/wiki/Geographic_information_system

Why Web Based?
• Browsers are ubiquitous and available on all operating systems
• Internet connections & browser processing are becoming faster
allowing more rich web applications
• The users do not need to download / install any software or
dependencies
• Updates of the system get to users quicker so a rapid iterative
development is possible
Issues to overcome with web based
• Browser vendor specific bugs
• Limited bandwidth in developing areas
• No control of the way users access and interact with the GIS

Our Solution
• Standards based– We utilise known Open Geospatial Consortium
standard interfaces
• WMS for map tiles
• WFS for vector data
• WCS for data analysis
– This allows new data to be added with
minimal effort
• Open Source
– We use GitLab internally to track
issues/branches
– Every commit is pushed to our public
github repo
– Slight overhead but benefit from fixes and
ideas being contributed

Portal OverviewThe portal aims to provide a simple
user interface to potentially large
collections of data.

Portal OverviewThe portal aims to provide a simple
user interface to potentially large
collections of data.
Offering users multiple top level
categories to choose from

Portal OverviewThe portal aims to provide a simple
user interface to potentially large
collections of data.
Offering users multiple top level
categories to choose from.
When multiple options still remain
these are provided allowing users
to get quickly to the data they want

Portal OverviewThe portal aims to provide a simple
user interface to potentially large
collections of data.
Offering users multiple top level
categories to choose from.
When multiple options still remain
these are provided allowing users
to get quickly to the data they want
Once the user has selected their
chosen layer it is displayed on the
map and summary information
given to the user in the “layer
panel”

Portal OverviewLayers are loaded from WMS and if
a time dimension is available the
most recent data are loaded by
default.

Portal OverviewLayers are loaded from WMS and if
a time dimension is available the
most recent data are loaded by
default.
The available dates/times for a
layer are shown on a timebar at the
bottom of the page. The purple
background shows the temporal
extent and dark lines show
individual images

Portal OverviewLayers are loaded from WMS and if
a time dimension is available the
most recent data are loaded by
default.
The available dates/times for a
layer are shown on a timebar at the
bottom of the page. The purple
background shows the temporal
extent and dark lines show
individual images
The user can navigate by simply
clicking on the timebar for the date
they need. There is also the option
to move the currently shown image
by both single steps or blocks of ten
using the forward and back controls

Layer MetadataLayer information is provided in two
ways. Basic information is shown in
a table on the layer info panel

Layer MetadataLayer information is provided in two
ways. Basic information is shown in
a table on the layer info panel
More in depth information is
available in a slide out panel. This
info is stored as markdown and
then rendered to the browser as
HTML.
These panels of information give
the user all they need to
understand what the data are and
where they have come from. This is
also where any citations needed to
be included in data reuse are
available.

Analysis OverviewAlongside visualisation data
analysis is a major use case of a
GIS and being web based doesn’t
change this.

Analysis OverviewAlongside visualisation data
analysis is a major use case of a
GIS and being web based doesn’t
change this.
As with the rest of the portal we
have tried to make analysis simple
for the user. The process starts with
the user selecting an area using
polygon drawing tools.

Analysis OverviewAlongside visualisation data
analysis is a major use case of a
GIS and being web based doesn’t
change this.
As with the rest of the portal we
have tried to make ploltting simple
for the user. The process starts with
the user selecting an area using
polygon drawing tools.
Users then have the option to
choose what type of plot and for
what time range, depending on plot
type there are further options
available.

Analysis OverviewAlongside visualisation data
analysis is a major use case of a
GIS and being web based doesn’t
change this.
As with the rest of the portal we
have tried to make plotting simple
for the user. The process starts with
the user selecting an area using
polygon drawing tools.
Users then have the option to
choose what type of plot and for
what time range, depending on plot
type there are further options
available.
• Timeseries
• Hovmoller
• Scatter/Regression
• Composite
• Animation
• Match Ups

Using Additional DataUsers are not limited to visualising
data already registered in the
portal.
If a users has data available
through a WMS they have the
ability to add the layers through a
simple form. By adding the base
URL for the data service the portal
will parse the GetCapabilities XML
document and make all suitable
layers available.
If the user wishes to carry out
analysis they are prompted for the
WCS endpoint that corresponds to
the data within the WMS layer they
are analysing.
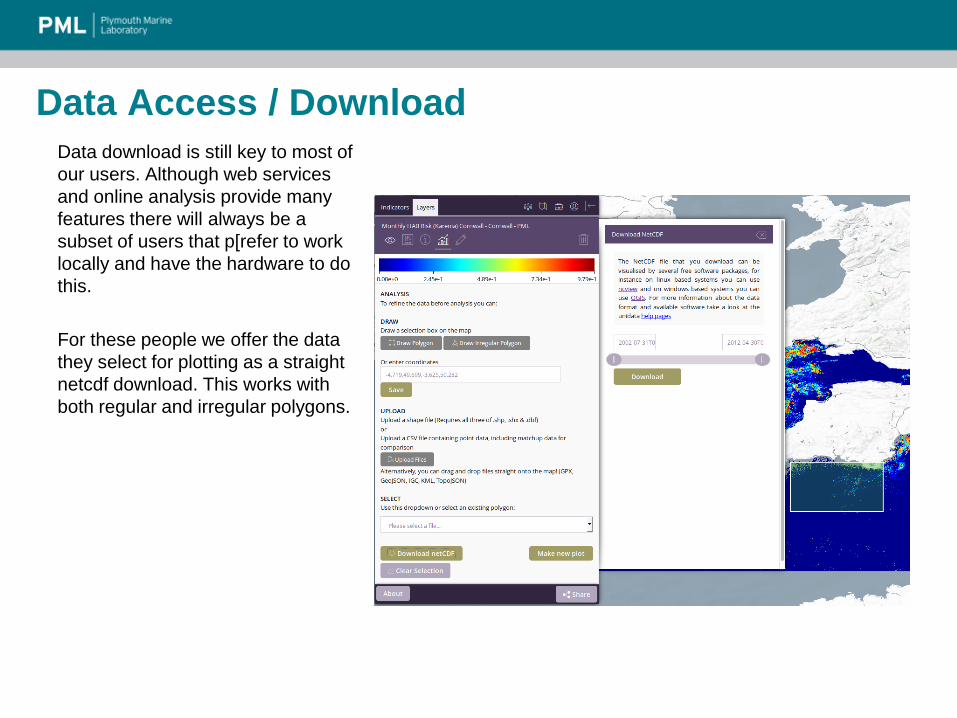
Data Access / DownloadData download is still key to most of
our users. Although web services
and online analysis provide many
features there will always be a
subset of users that p[refer to work
locally and have the hardware to do
this.
For these people we offer the data
they select for plotting as a straight
netcdf download. This works with
both regular and irregular polygons.

CollaborationThe portal also allows users to
either create a collaboration
session or join an existing one.
In the context of the GISportal a
collaboration session is similar to a
screen sharing session using
something like webEx.
The prime difference being that you
are not just seeing an image of the
presenters screen. The actions they
carry out are mirrored in your
browser.
This gives the benefit that once the
session has ended all attendees
have working portals with all work
done available to them.

Help Walk-throughThe portal provides a system by
which administrators can create
and save walk-throughs.
These are predefined work flows
with additional textual pointers
added.
The purpose of the system is to
provide guidance to new users or to
highlight specific features.
The creator can specify what text is
shown at each step, which element
is highlighted and how long each
step should be displayed for (if auto
play is enabled)

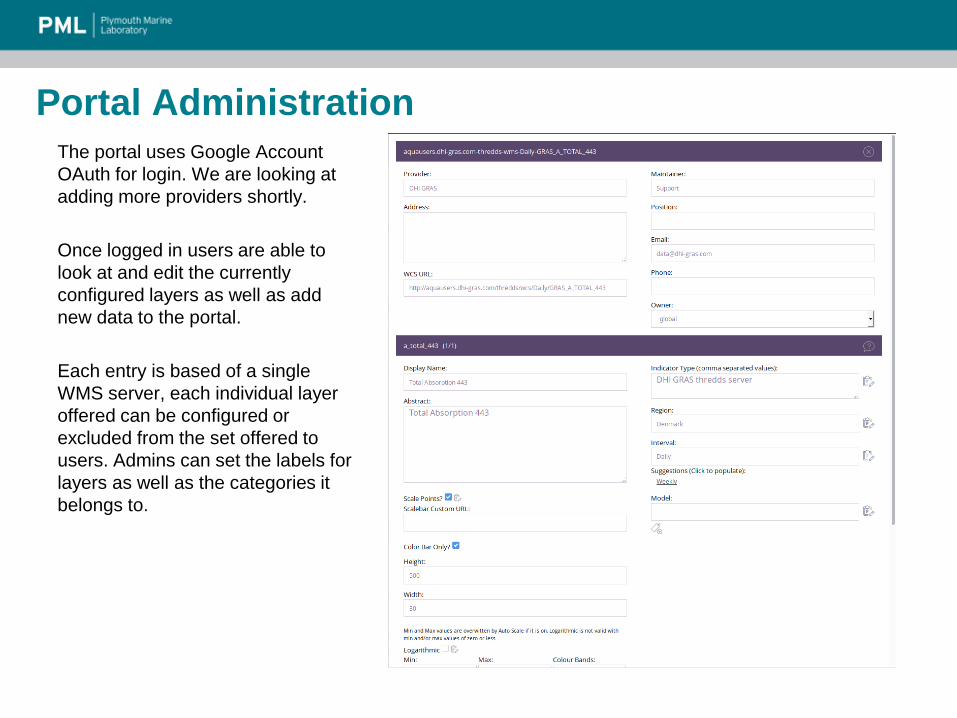
Portal AdministrationThe portal uses Google Account
OAuth for login. We are looking at
adding more providers shortly.

Portal AdministrationThe portal uses Google Account
OAuth for login. We are looking at
adding more providers shortly.
Once logged in users are able to
look at and edit the currently
configured layers as well as add
new data to the portal.
Portal AdministrationThe portal uses Google Account
OAuth for login. We are looking at
adding more providers shortly.
Once logged in users are able to
look at and edit the currently
configured layers as well as add
new data to the portal.
Each entry is based of a single
WMS server, each individual layer
offered can be configured or
excluded from the set offered to
users. Admins can set the labels for
layers as well as the categories it
belongs to.

Future Additions
• Improving the analysis options
– More charts available
– Better comparison options, i.e. create diff layer on the fly and view
on map
– In situ data visualisation and use in analysis

Future Additions
• Improving the analysis options
– More charts available
– Better comparison options, i.e. create diff layer on the fly and view
on map
– In situ data visualisation and use in analysis
• Admin tools for adding different data sources
– SOS
– WFS
• Admin tools for editing layer “extra information”
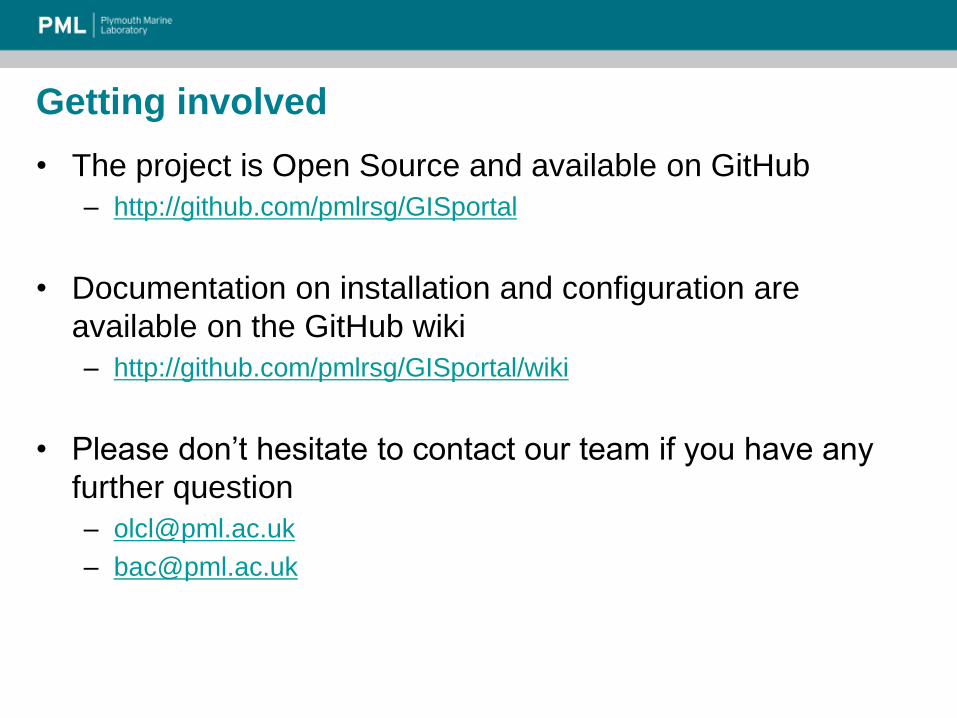
Getting involved
• The project is Open Source and available on GitHub
– http://github.com/pmlrsg/GISportal
• Documentation on installation and configuration are
available on the GitHub wiki
– http://github.com/pmlrsg/GISportal/wiki
• Please don’t hesitate to contact our team if you have any
further question
Thank you – Questions?