Embed Size (px)
Citation preview
Web-Based Enterprise Data Visualization – a 3D Approach
Oleg Kachirski, Black and Veatch
Contents
- Introduction- Why 3D?- Applications of 3D- 3D Content Authoring- 3D/4D in GIS- Challenges of Presenting 3D on the Web- Current 3D Web Technologies- 3D Portal- Q&A
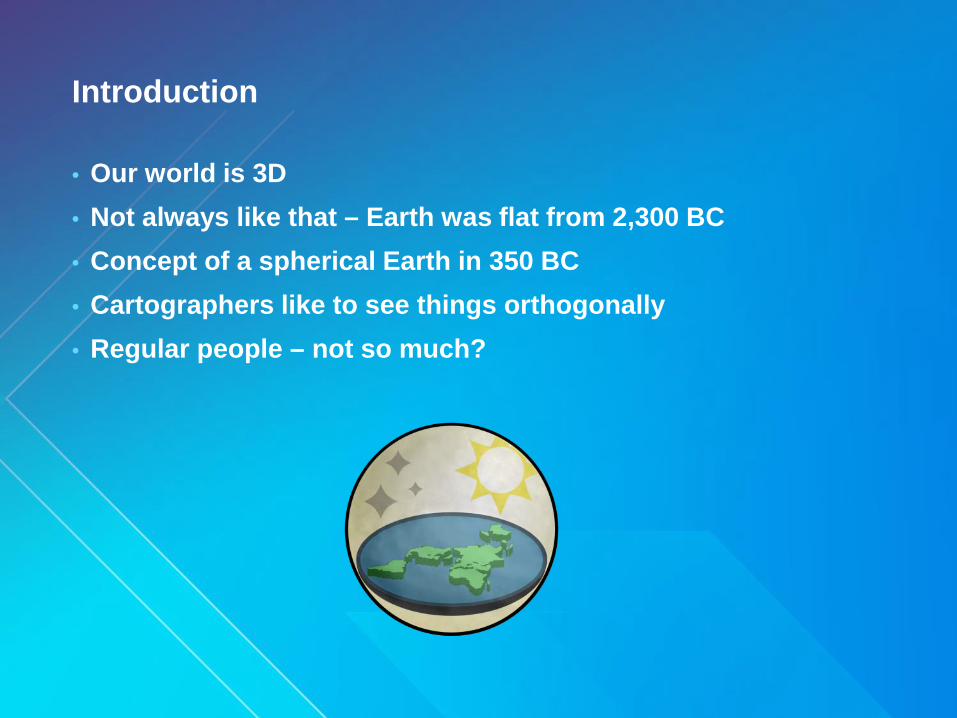
Introduction
• Our world is 3D• Not always like that – Earth was flat from 2,300 BC• Concept of a spherical Earth in 350 BC• Cartographers like to see things orthogonally• Regular people – not so much?
Why 3D?
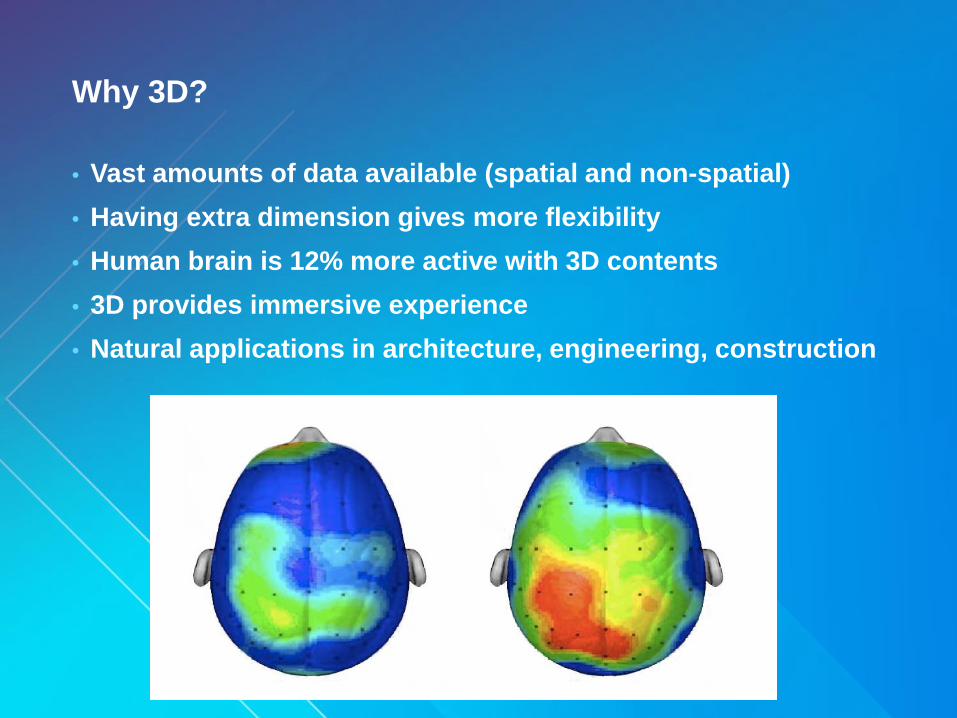
• Vast amounts of data available (spatial and non-spatial)• Having extra dimension gives more flexibility• Human brain is 12% more active with 3D contents• 3D provides immersive experience• Natural applications in architecture, engineering, construction
Applications of 3D
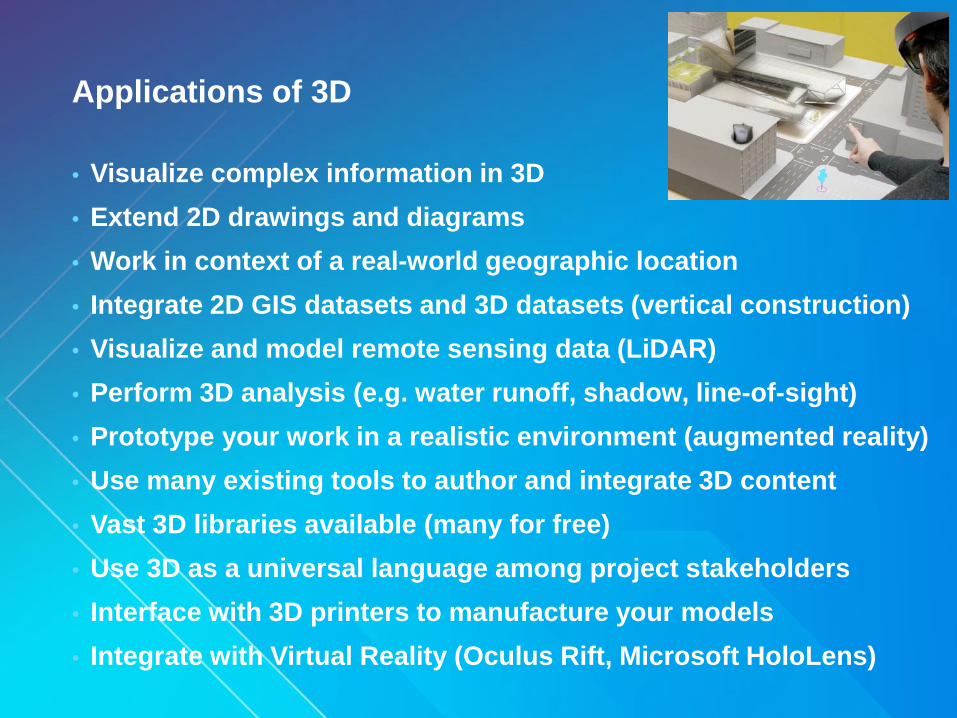
• Visualize complex information in 3D• Extend 2D drawings and diagrams• Work in context of a real-world geographic location• Integrate 2D GIS datasets and 3D datasets (vertical construction)• Visualize and model remote sensing data (LiDAR)• Perform 3D analysis (e.g. water runoff, shadow, line-of-sight)• Prototype your work in a realistic environment (augmented reality)• Use many existing tools to author and integrate 3D content• Vast 3D libraries available (many for free)• Use 3D as a universal language among project stakeholders• Interface with 3D printers to manufacture your models• Integrate with Virtual Reality (Oculus Rift, Microsoft HoloLens)
3D For The Masses
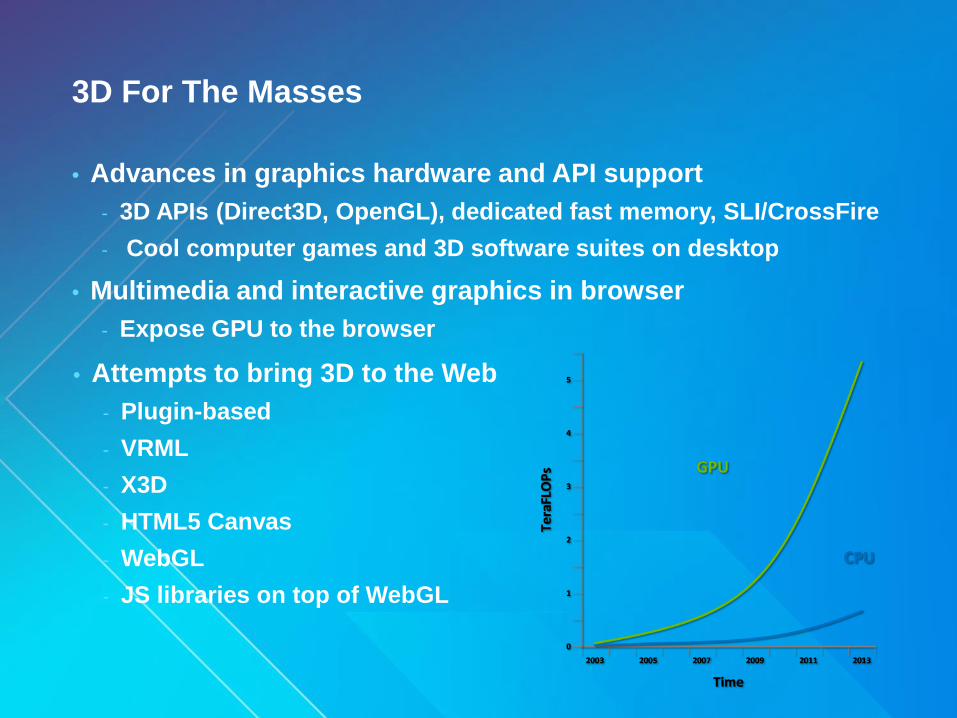
• Advances in graphics hardware and API support- 3D APIs (Direct3D, OpenGL), dedicated fast memory, SLI/CrossFire- Cool computer games and 3D software suites on desktop
• Multimedia and interactive graphics in browser- Expose GPU to the browser
• Attempts to bring 3D to the Web- Plugin-based- VRML- X3D- HTML5 Canvas- WebGL- JS libraries on top of WebGL
3D Content Sources
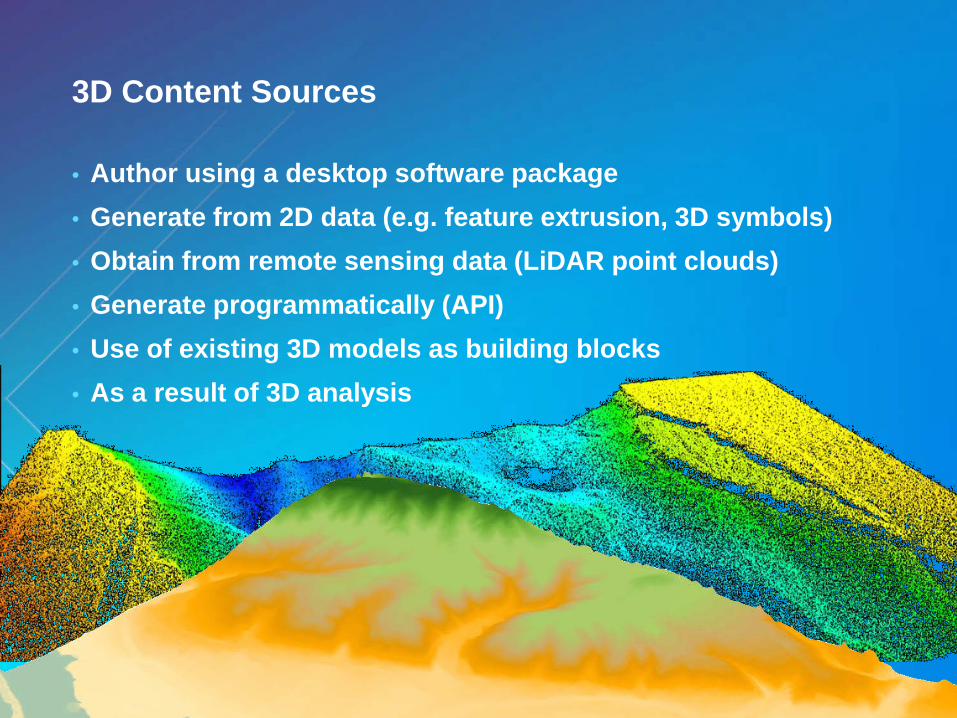
• Author using a desktop software package• Generate from 2D data (e.g. feature extrusion, 3D symbols)• Obtain from remote sensing data (LiDAR point clouds)• Generate programmatically (API)• Use of existing 3D models as building blocks• As a result of 3D analysis
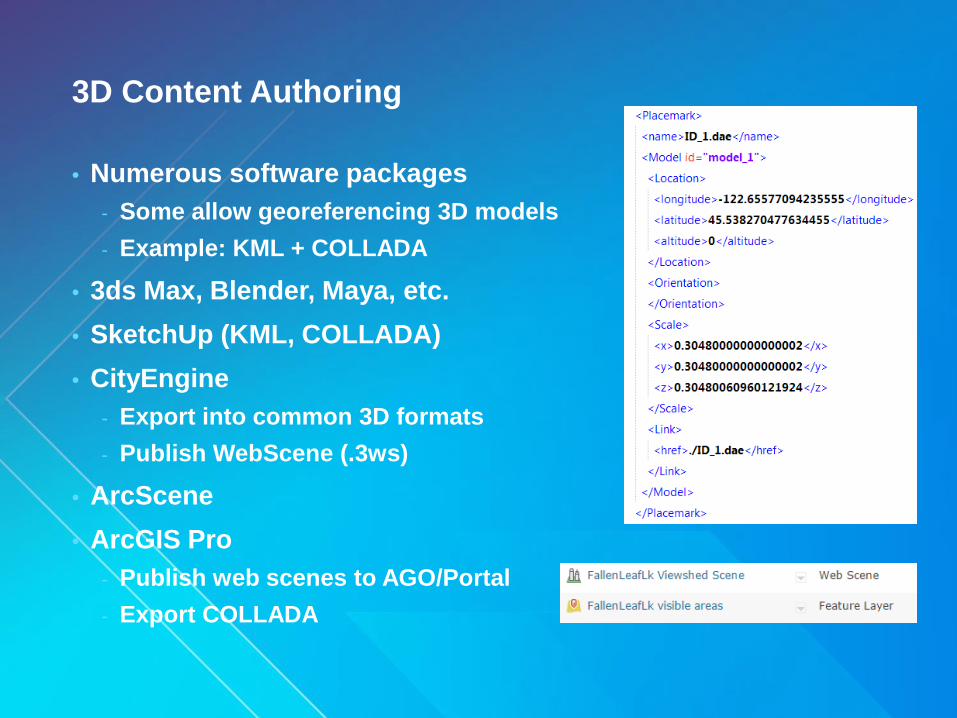
3D Content Authoring
• Numerous software packages- Some allow georeferencing 3D models- Example: KML + COLLADA
• 3ds Max, Blender, Maya, etc.• SketchUp (KML, COLLADA)• CityEngine
- Export into common 3D formats- Publish WebScene (.3ws)
• ArcScene• ArcGIS Pro
- Publish web scenes to AGO/Portal- Export COLLADA
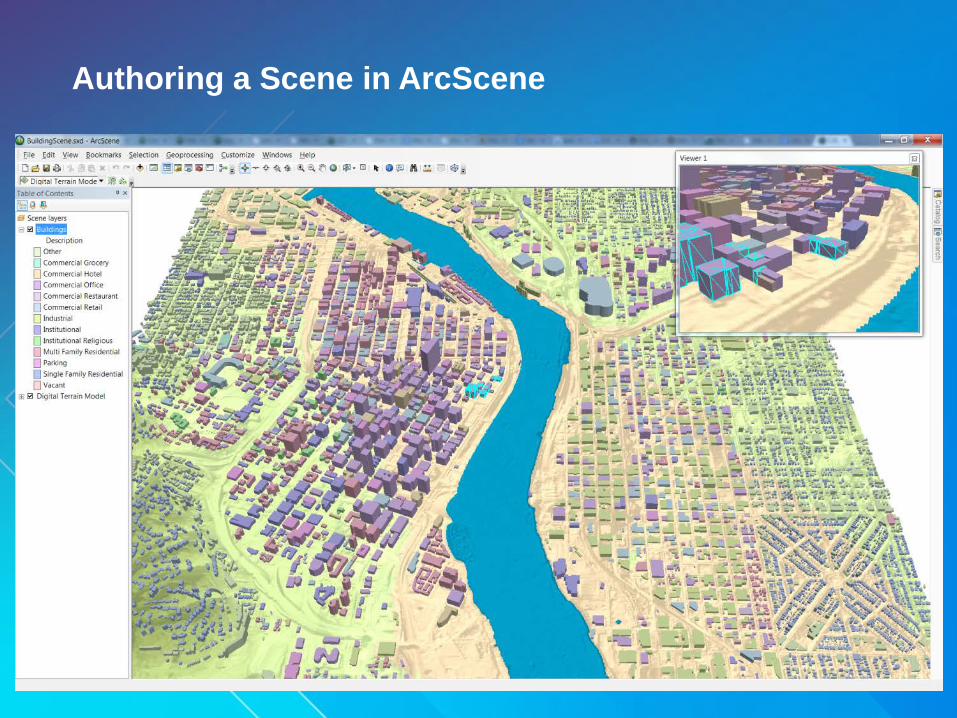
Authoring a Scene in ArcScene
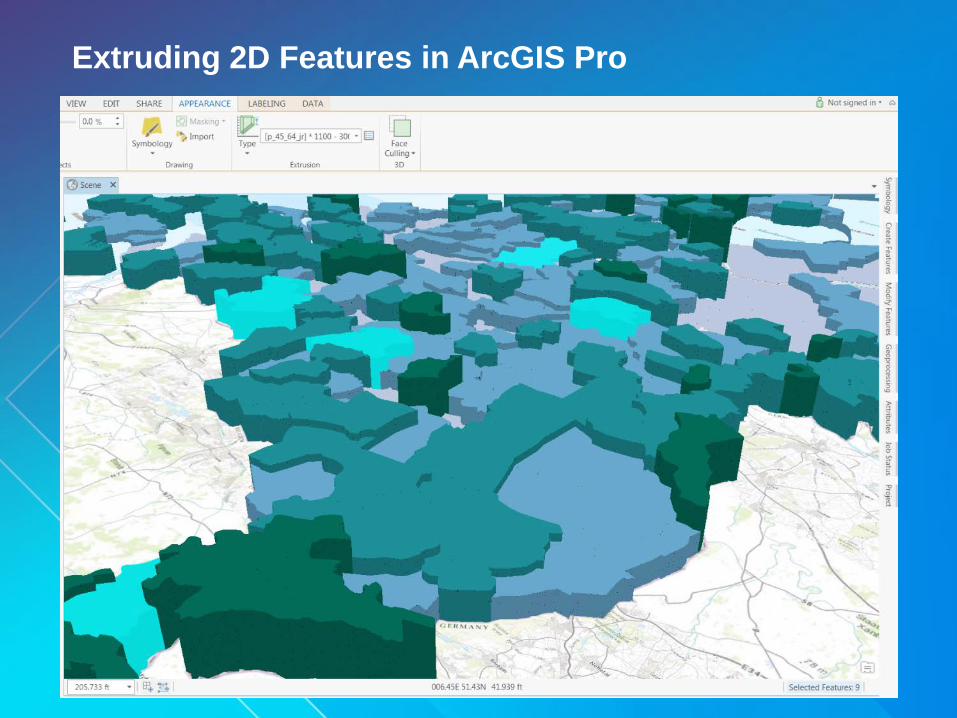
Extruding 2D Features in ArcGIS Pro
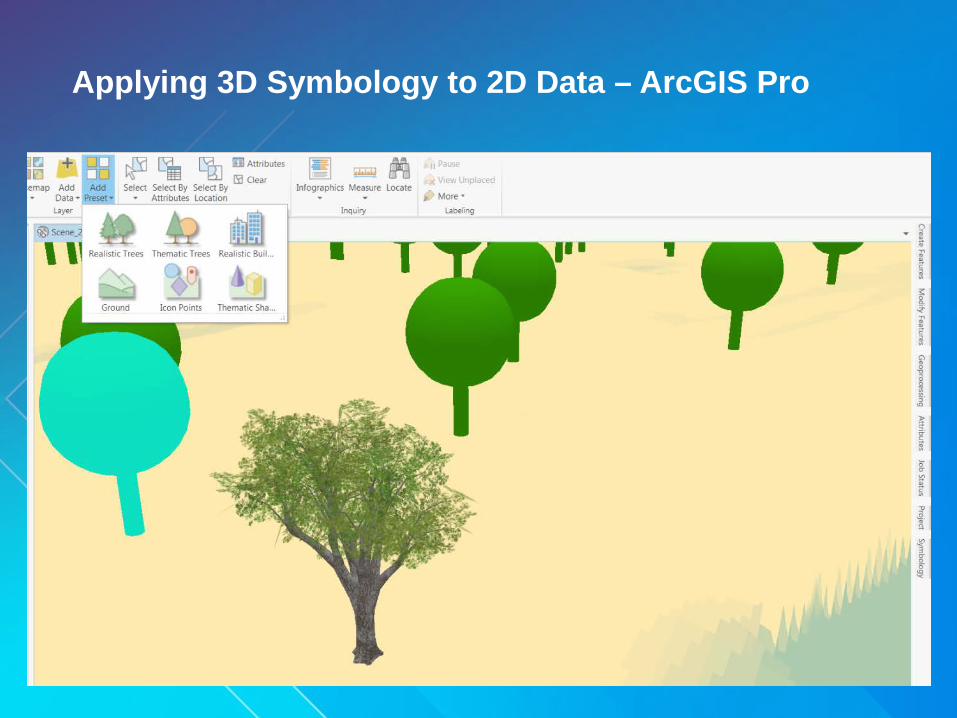
Applying 3D Symbology to 2D Data – ArcGIS Pro
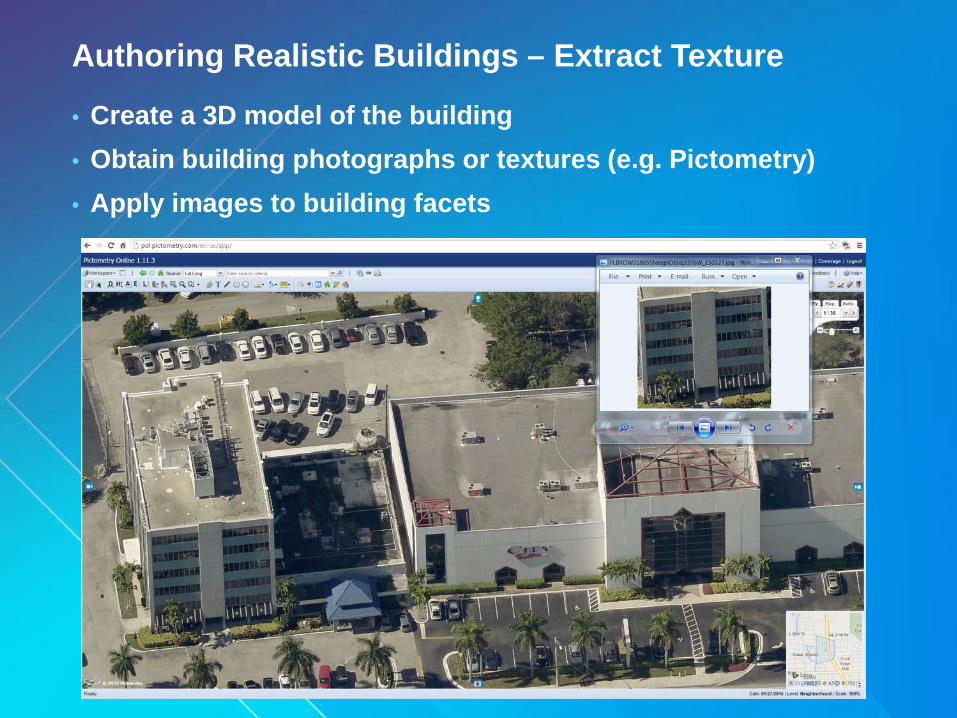
Authoring Realistic Buildings – Extract Texture
• Create a 3D model of the building• Obtain building photographs or textures (e.g. Pictometry)• Apply images to building facets
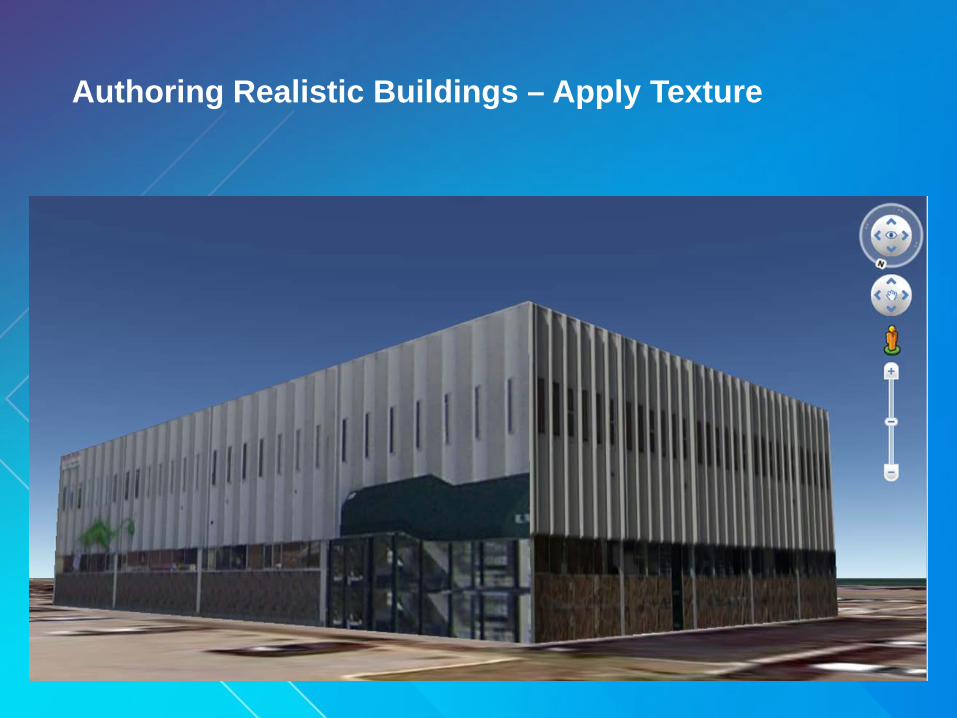
Authoring Realistic Buildings – Apply Texture
3D/4D in Web and Desktop GIS
• True distance and area calculations accounting for elevation• 3D and temporal analysis
- Hillshade- Sun shadow volume- Water runoff- Watershed- Viewshed
• Time-aware data visualization• Superimposing of 3D models onto 2D GIS maps• Overlaying of raster data over vector shapes• Presenting fused data from multiple sources
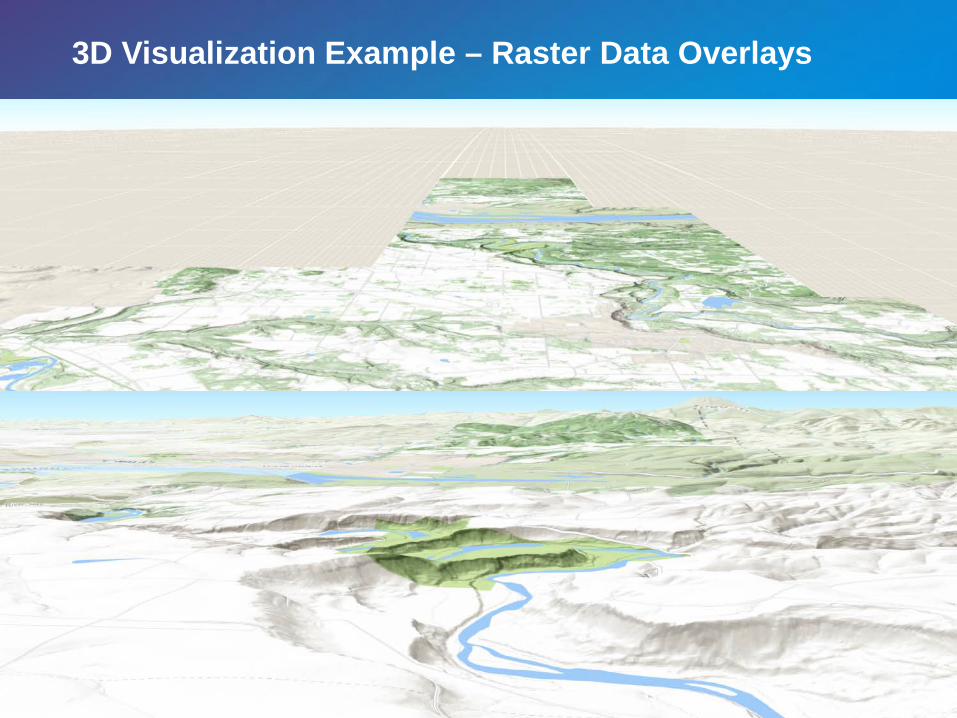
3D Visualization Example – Raster Data Overlays
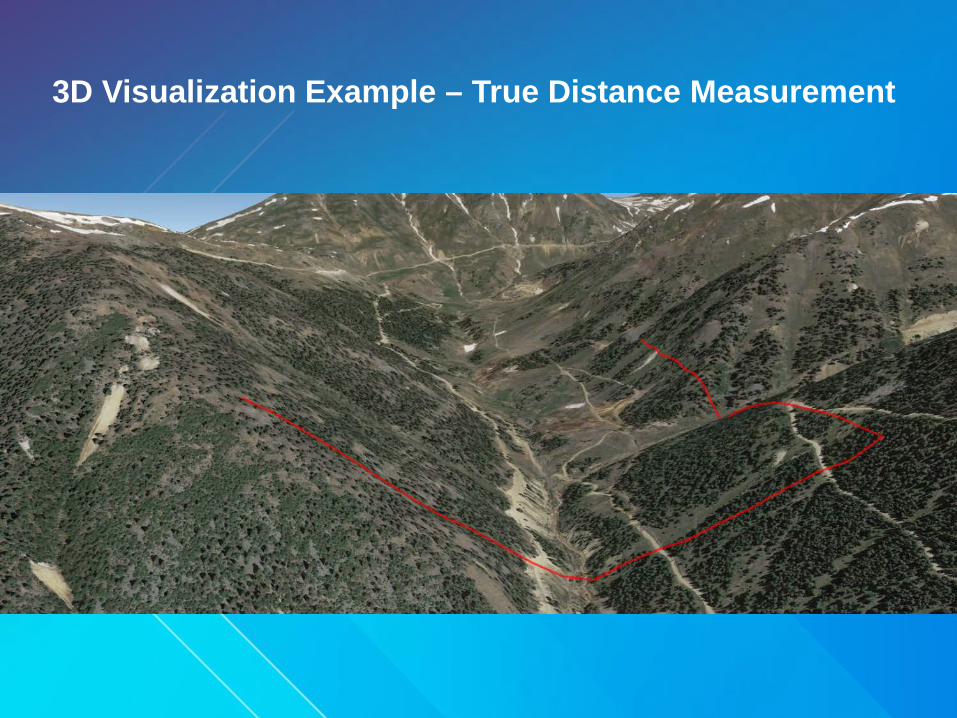
3D Visualization Example – True Distance Measurement
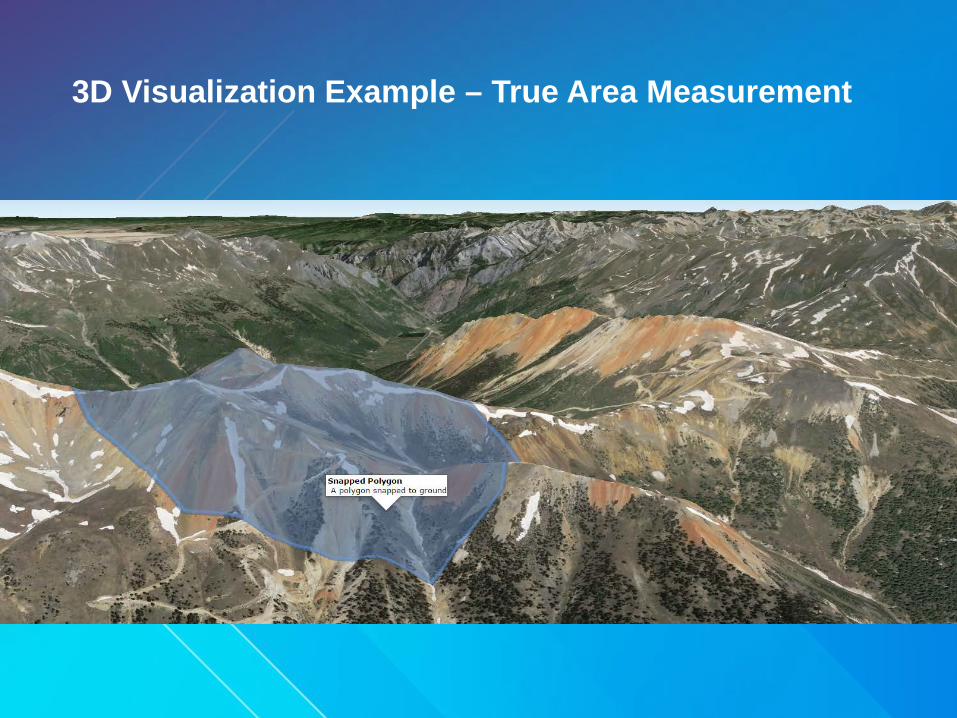
3D Visualization Example – True Area Measurement
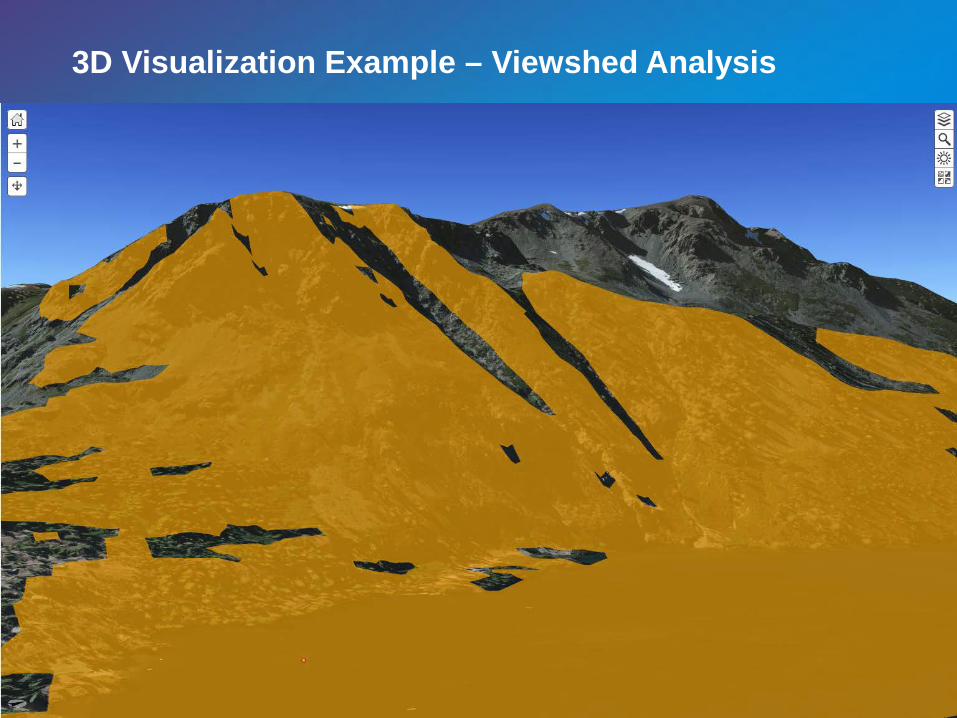
3D Visualization Example – Viewshed Analysis
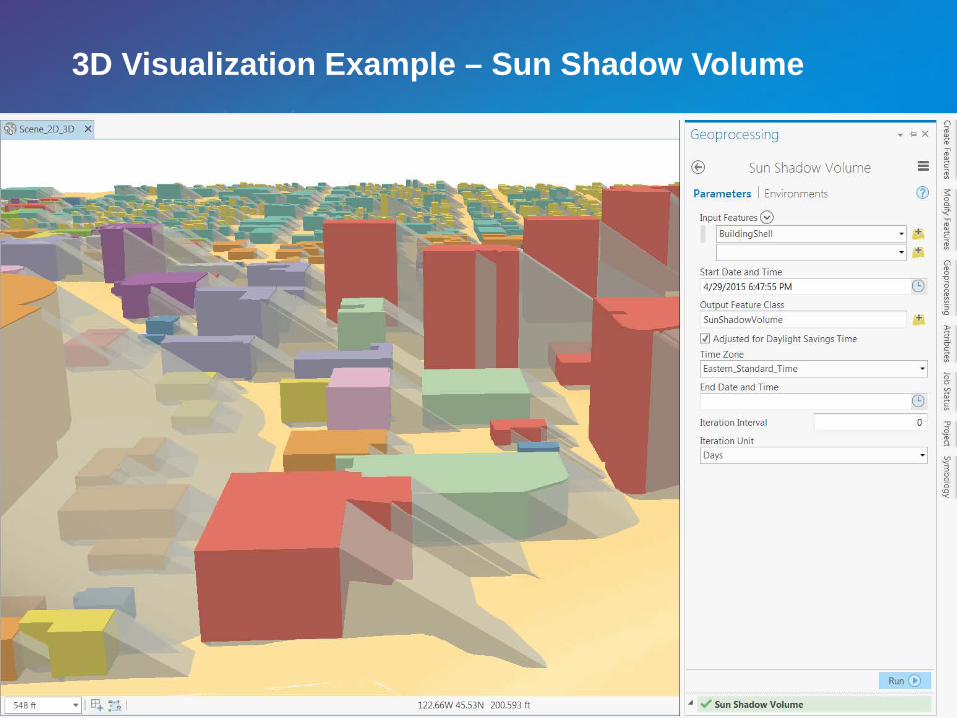
3D Visualization Example – Sun Shadow Volume
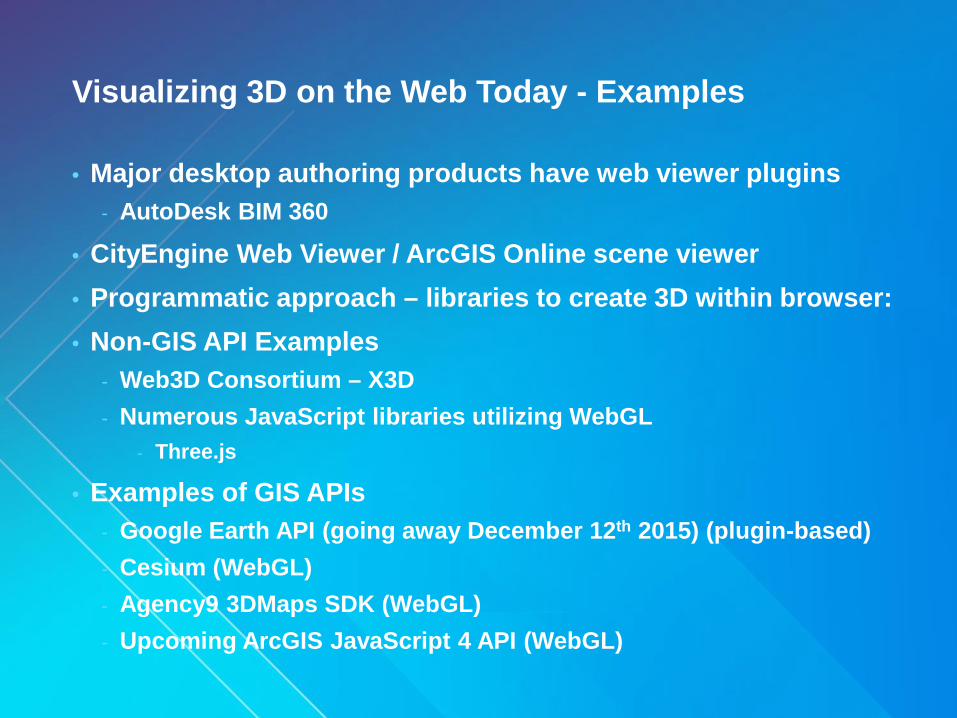
Visualizing 3D on the Web Today - Examples
• Major desktop authoring products have web viewer plugins- AutoDesk BIM 360
• CityEngine Web Viewer / ArcGIS Online scene viewer• Programmatic approach – libraries to create 3D within browser:• Non-GIS API Examples
- Web3D Consortium – X3D- Numerous JavaScript libraries utilizing WebGL
- Three.js
• Examples of GIS APIs- Google Earth API (going away December 12th 2015) (plugin-based)- Cesium (WebGL)- Agency9 3DMaps SDK (WebGL)- Upcoming ArcGIS JavaScript 4 API (WebGL)
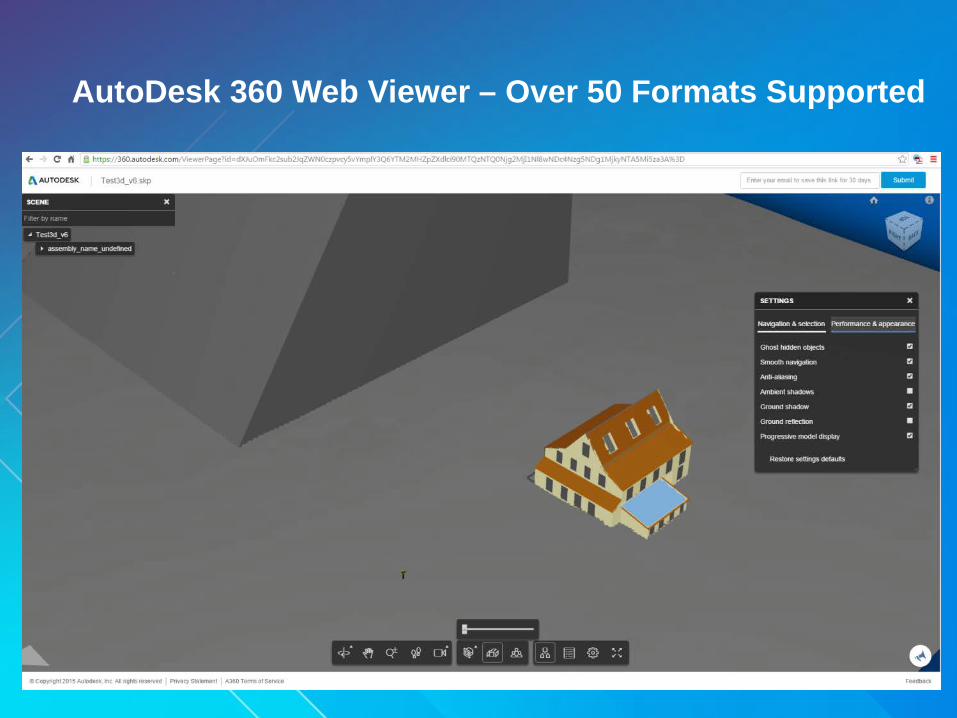
AutoDesk 360 Web Viewer – Over 50 Formats Supported
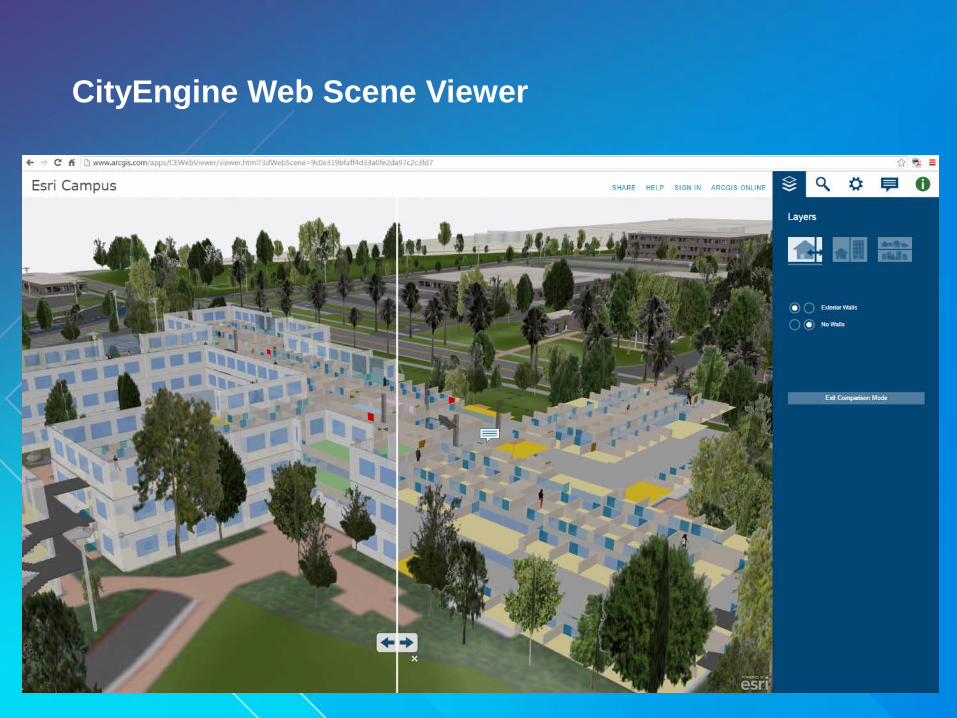
CityEngine Web Scene Viewer
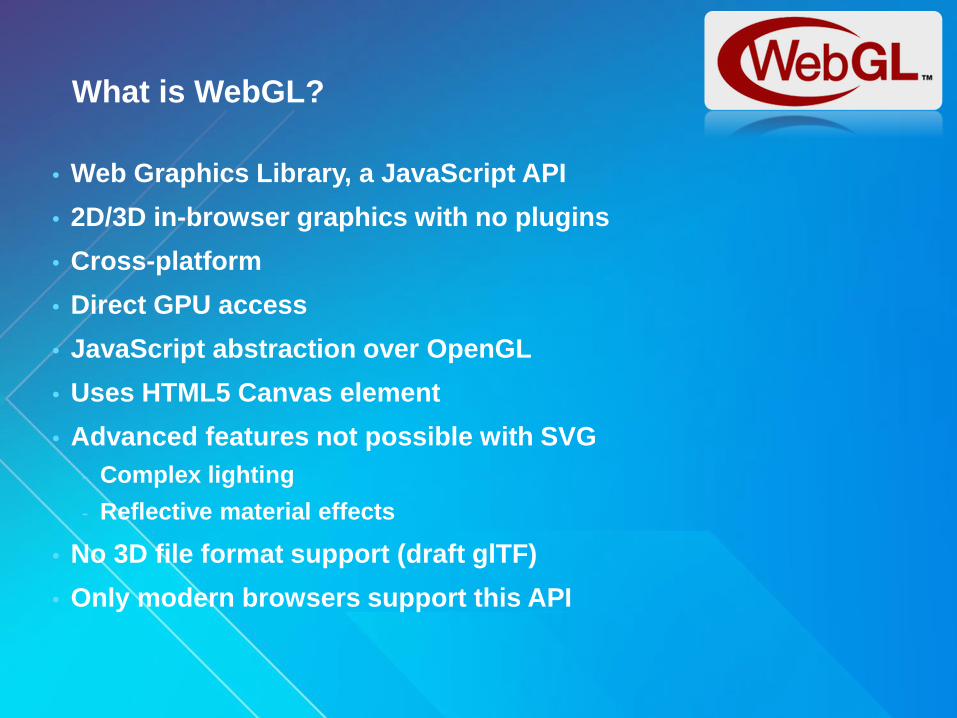
What is WebGL?
• Web Graphics Library, a JavaScript API• 2D/3D in-browser graphics with no plugins• Cross-platform• Direct GPU access• JavaScript abstraction over OpenGL• Uses HTML5 Canvas element• Advanced features not possible with SVG
- Complex lighting- Reflective material effects
• No 3D file format support (draft glTF)• Only modern browsers support this API
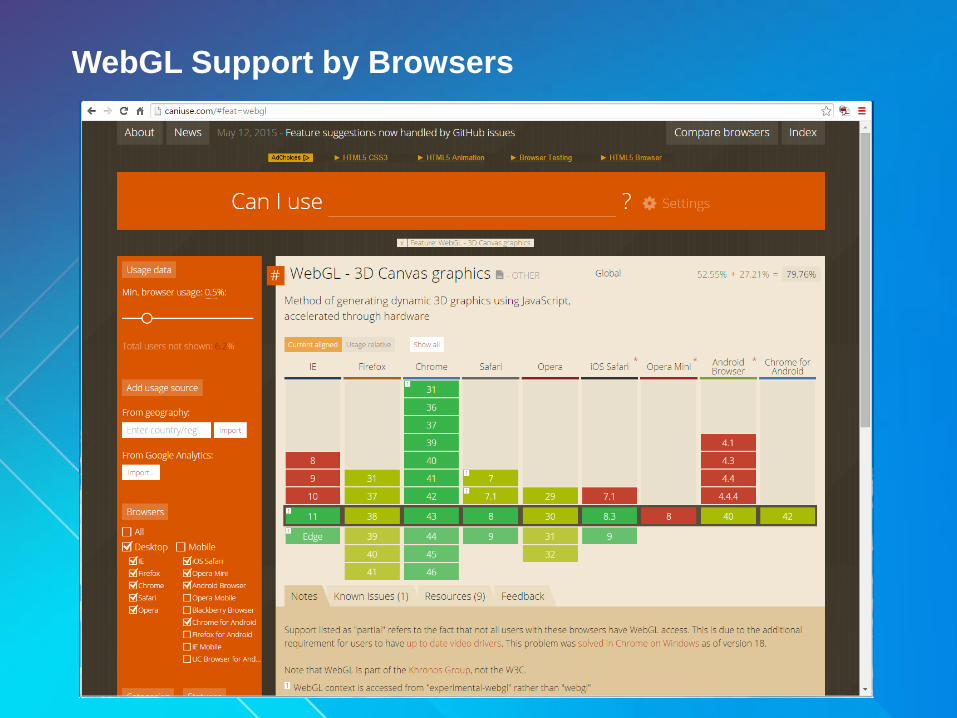
WebGL Support by Browsers
Upcoming ArcGIS JavaScript API
• Built on top of WebGL• To be released this year• Abstracts map manipulation syntax; similar for 2D and 3D• May provide a lower-level API for 3D objects, scene • Will provide a high-level web mapping API with 2D/3D support• Web AppBuilder 3D support• Manipulate 3D objects on the map• Display 3D data from web scenes• Server-side support for 3D presentation, storage and analysis
Web Scene Specification
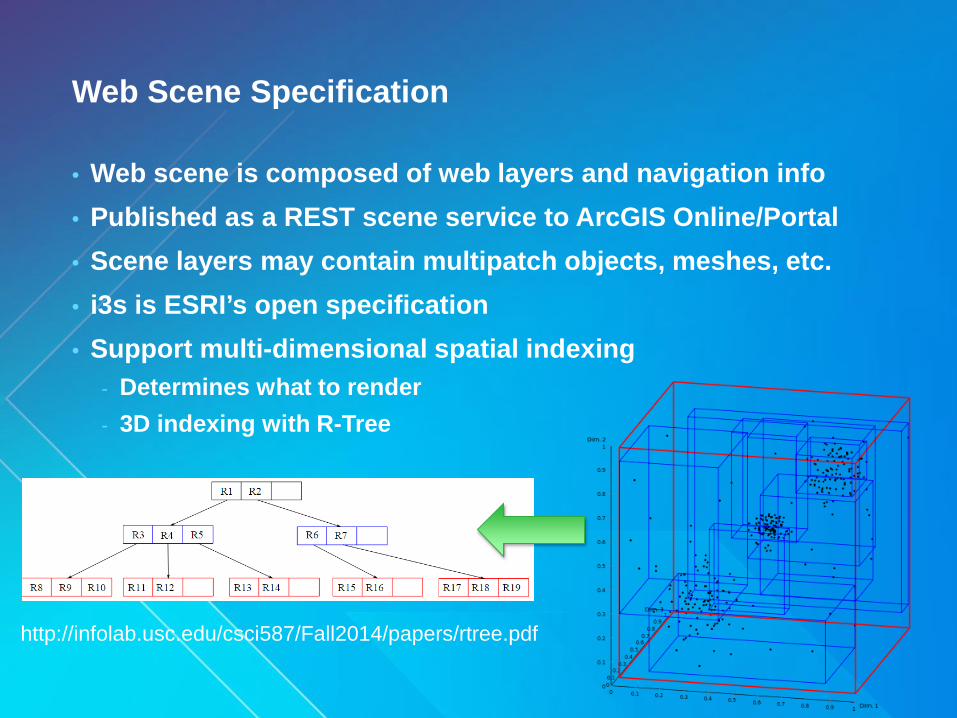
• Web scene is composed of web layers and navigation info• Published as a REST scene service to ArcGIS Online/Portal• Scene layers may contain multipatch objects, meshes, etc.• i3s is ESRI’s open specification• Support multi-dimensional spatial indexing
- Determines what to render- 3D indexing with R-Tree
http://infolab.usc.edu/csci587/Fall2014/papers/rtree.pdf
Web Scene Specification
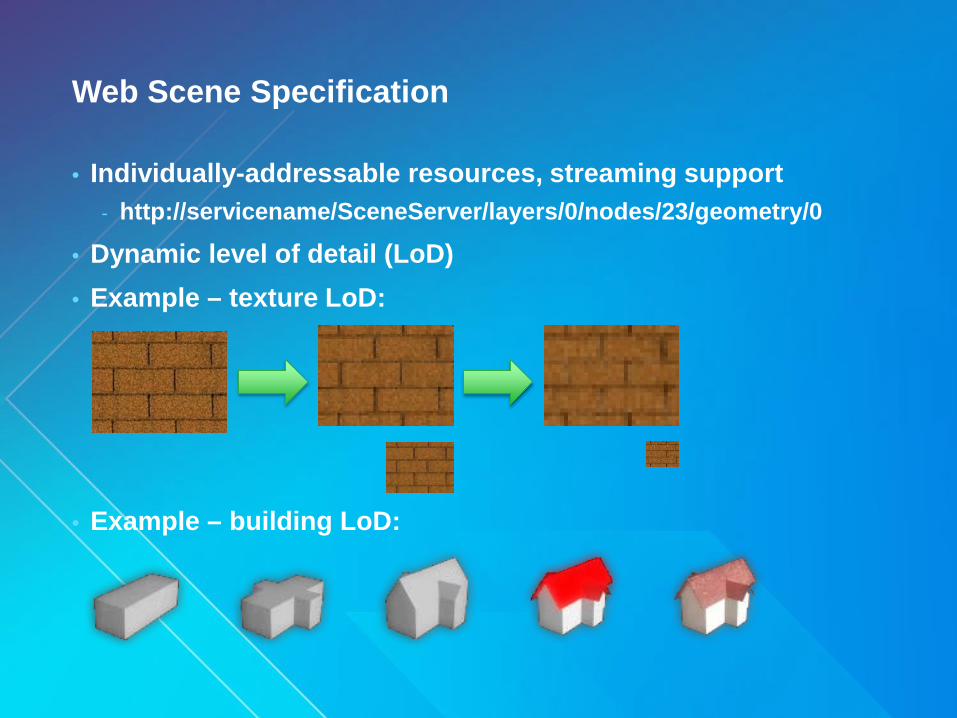
• Individually-addressable resources, streaming support- http://servicename/SceneServer/layers/0/nodes/23/geometry/0
• Dynamic level of detail (LoD)• Example – texture LoD:
• Example – building LoD:
What We Can Build With 3D API
• Interactive web-based map-centric information sharing portal- Single view on multiple datasets- Access to executive-level data
• Applicable uses:- Master Plan reference- Construction schedule visualization (horizontal & vertical)- Site suitability analysis - Conflict avoidance (project activity synchronization)- On-going operations (building maintenance, office leases)- Real-time personnel location
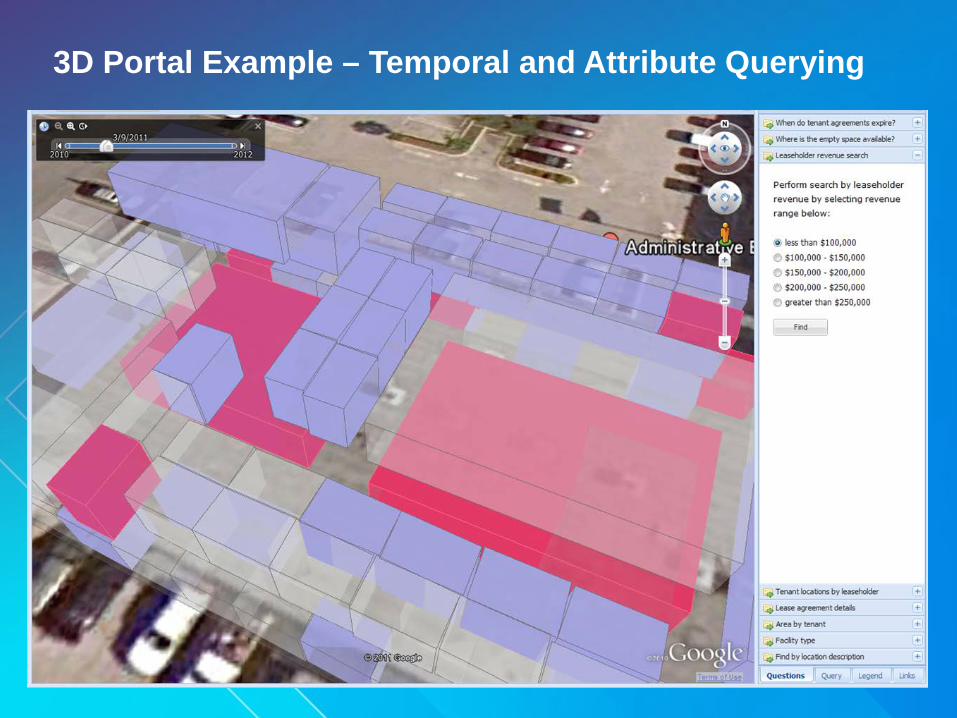
3D Portal Example – Temporal and Attribute Querying
3D Portal Benefits
• Single place to manage multiple projects• Real-time reporting environment
- Construction master planning- Program integration- Site and building management
• Real-time modeling environment- Create ‘what-if’ designs in-browser- Perform spatial and temporal analysis- Participate in distributed team design charrettes- Geo-enrich your designs with public datasets
3D Portal Integration
• Integration hub- Utilize service-oriented architecture (SOA) capabilities- Integrate data from CAD, BIM, project scheduling systems
• Utilize multiple visualization technologies- No “one size fits all” technology- Pick what works best for each scenario- Create multiple presentation layers within the portal- D3.js for graphing needs (SVG)- Three.js for in-building navigation (Canvas/WebGL)- HTML5 for videoconferencing (Canvas/Video)
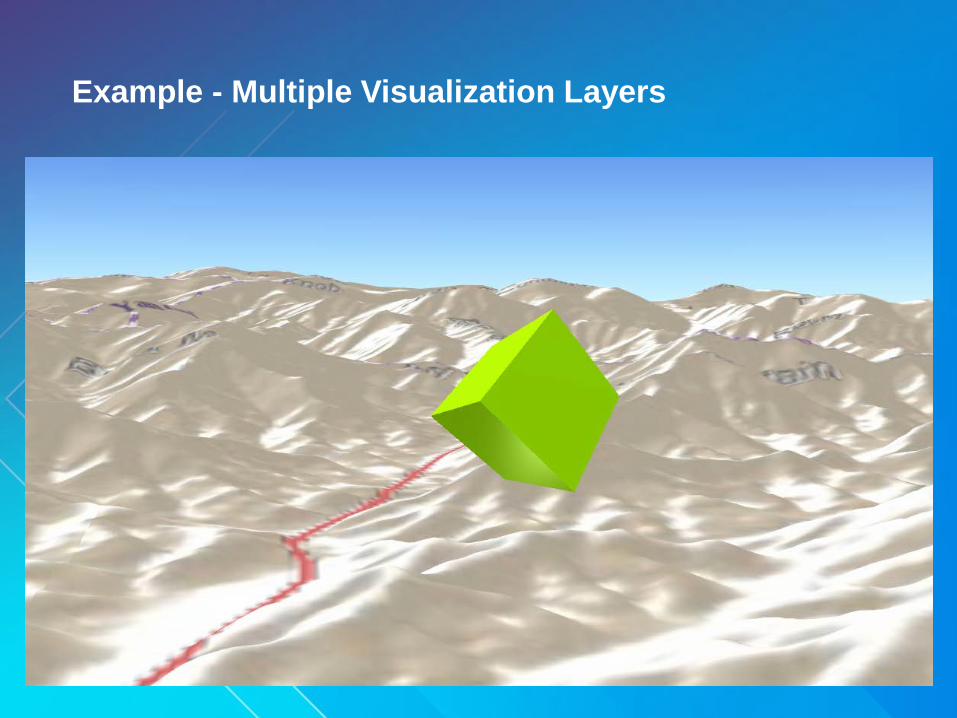
Example - Multiple Visualization Layers
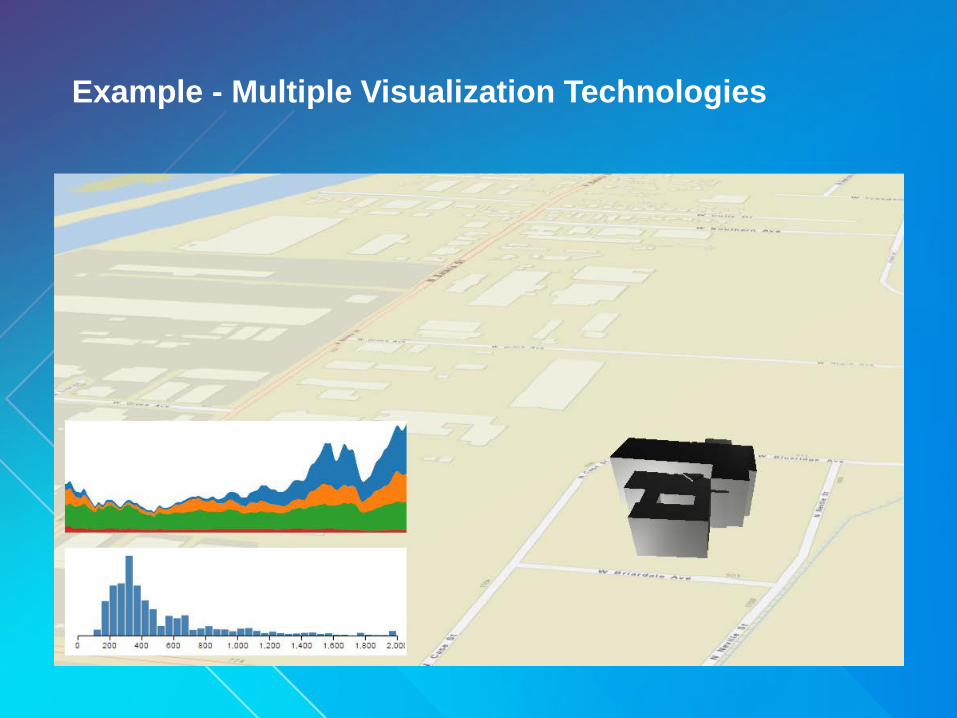
Example - Multiple Visualization Technologies

Q&A