Embed Size (px)
Citation preview
Weather Normalization Adjustment Report
2016
Atmos Energy Corp. — Mid-Tex Division
June 1, 2016
Atmos Energy (Mid-Tex) WNA Report 2016
June 1, 2016 Page 2
Table of Contents
I. Introduction ........................................................................................................................................ 3
II. Computation of Weather Normalization Adjustment Factor ..................................................... 4
III. Monthly WNA Factors ...................................................................................................................... 5
All Incorporated Cities (Except City of Dallas) ....................................................................................... 5
City of Dallas ................................................................................................................................................ 8
Appendix A - Weather Stations by City ............................................................................................... 11
Appendix B – WNA Tariff (11/1/2015) ............................................................................................... 18
Appendix C – WNA Tariff (6/1/2015) ................................................................................................. 21
Appendix D – WNA Tariff (12/4/2012) ............................................................................................... 24
Appendix E – Base Rate of Temperature Sensitive Sales ................................................................... 27
Appendix F – Heating Degree Day Data for All Incorporated Cities (Except City of Dallas)...... 29
Appendix G – Heating Degree Day Data for the City of Dallas ....................................................... 37
Appendix H – Heating Degree Data for Unincorporated Areas ...................................................... 45
Appendix I – Rider WNA Calculation Instructions............................................................................ 53
Appendix J– Sample Bill Calculation and WNA Worksheet............................................................. 57
Atmos Energy (Mid-Tex) WNA Report 2016
June 1, 2016 Page 3
I. Introduction
Weather Normalization Adjustment (WNA) is standard within the natural gas utility industry and protects the customer and the natural gas provider. During the November through April billing periods, when customers’ bills are most sensitive to increased usage during a colder winter, residential and commercial customers will notice a line item called “Rider WNA” on their gas bill. The WNA refunds over-collections when weather is colder than normal and surcharges under collections when weather is warmer than normal. In this way, WNA helps remove variances on a customer’s bill caused by abnormal weather during the heating season.
This report is intended to provide information on how WNA is calculated, and specifically the data that was used to calculate the Rider WNA on a customer’s bill during the 2015–2016 heating season. The report includes an explanation of how the WNA Factor is calculated (Section II), the monthly WNA Factors that resulted from the weather in the most recent heating season (Section III), the weather stations that are used for each city served by the Atmos Energy Mid-Tex Division (Appendix A), applicable WNA tariffs (Appendices B, C and D) the base rates for temperature sensitive sales (Appendix E), normal and actual heating degree days for the prior year’s heating season (Appendices F, G and H), and a sample bill calculation with step by step instructions for how to calculate the Rider WNA on a customer’s bill (Appendices I & J).
Atmos Energy (Mid-Tex) WNA Report 2016
June 1, 2016 Page 4
II. Computation of Weather Normalization Adjustment Factor
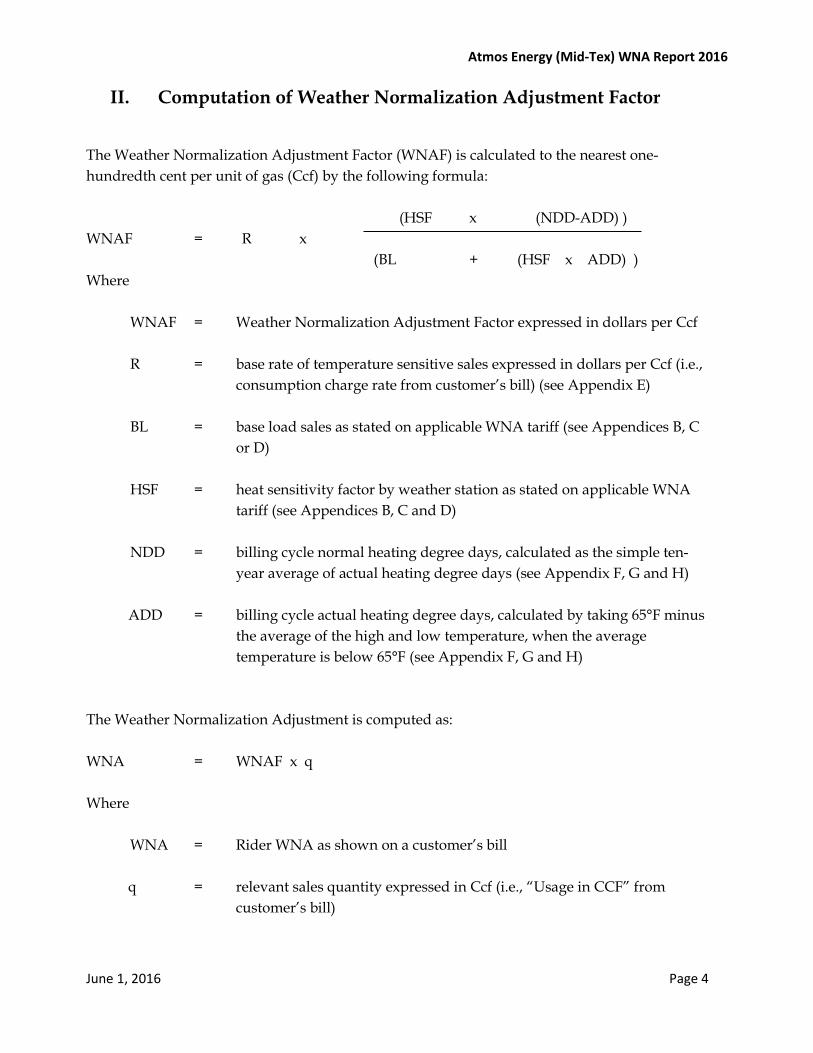
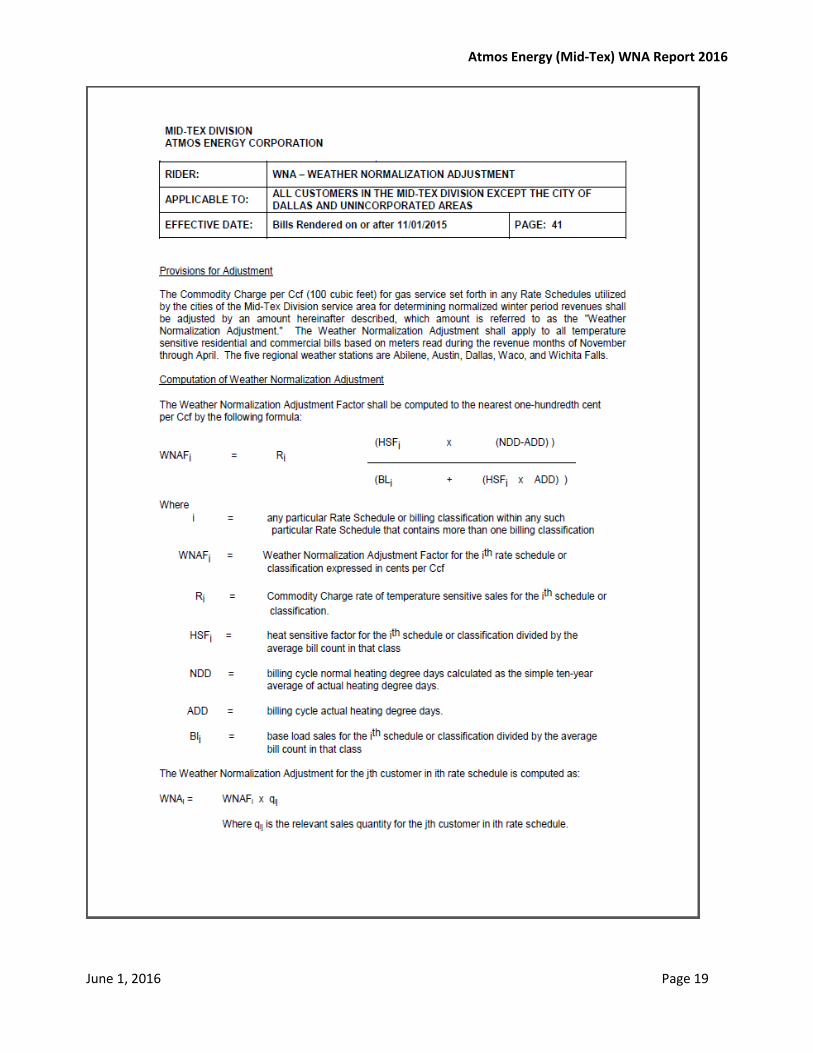
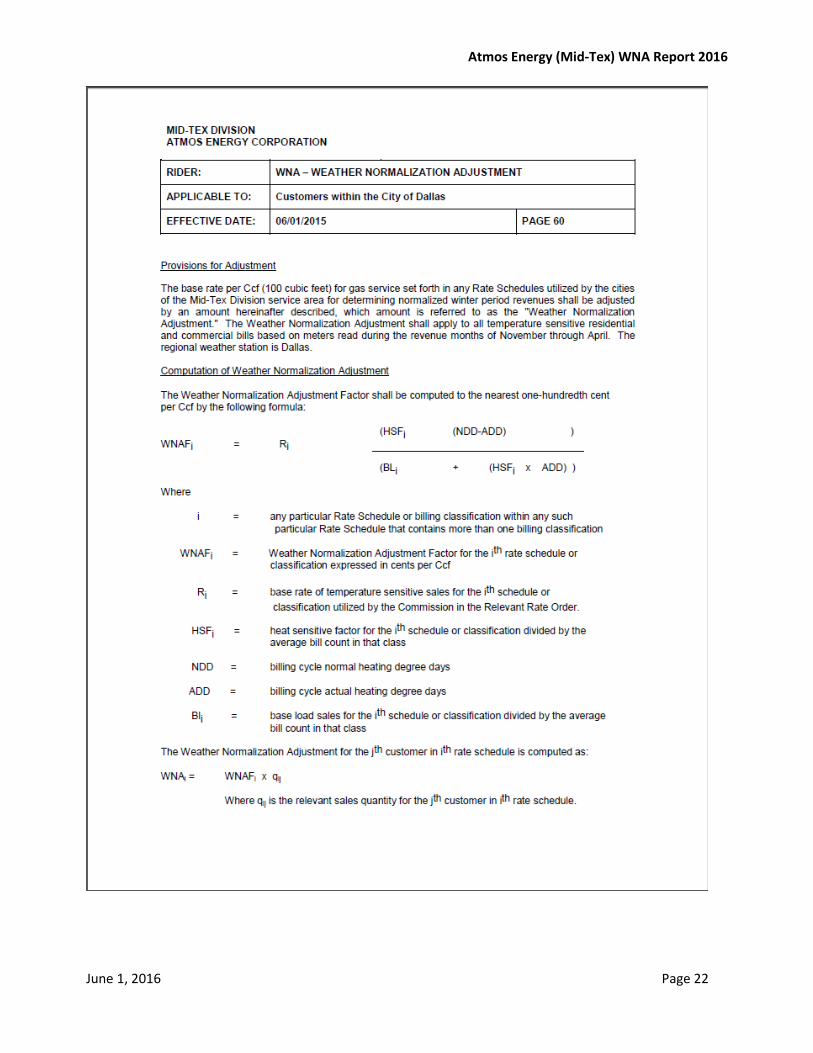
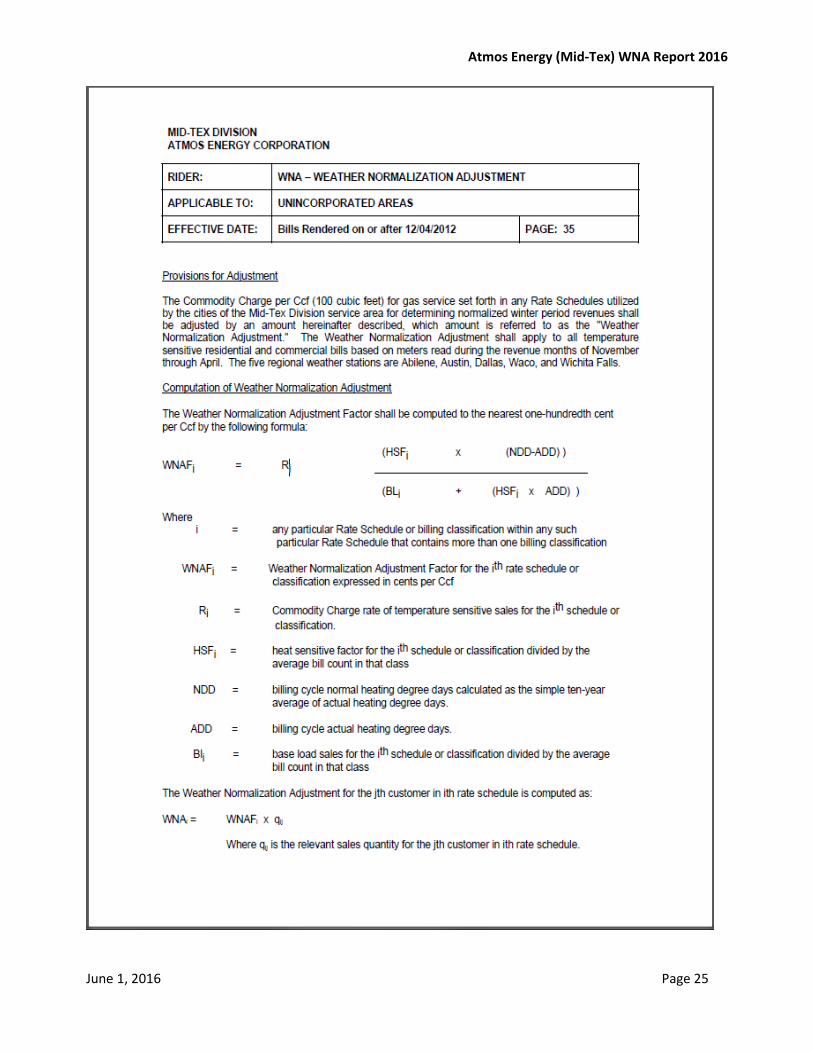
The Weather Normalization Adjustment Factor (WNAF) is calculated to the nearest one-hundredth cent per unit of gas (Ccf) by the following formula: (HSF x (NDD-ADD) ) WNAF = R x (BL + (HSF x ADD) ) Where
WNAF = Weather Normalization Adjustment Factor expressed in dollars per Ccf R = base rate of temperature sensitive sales expressed in dollars per Ccf (i.e.,
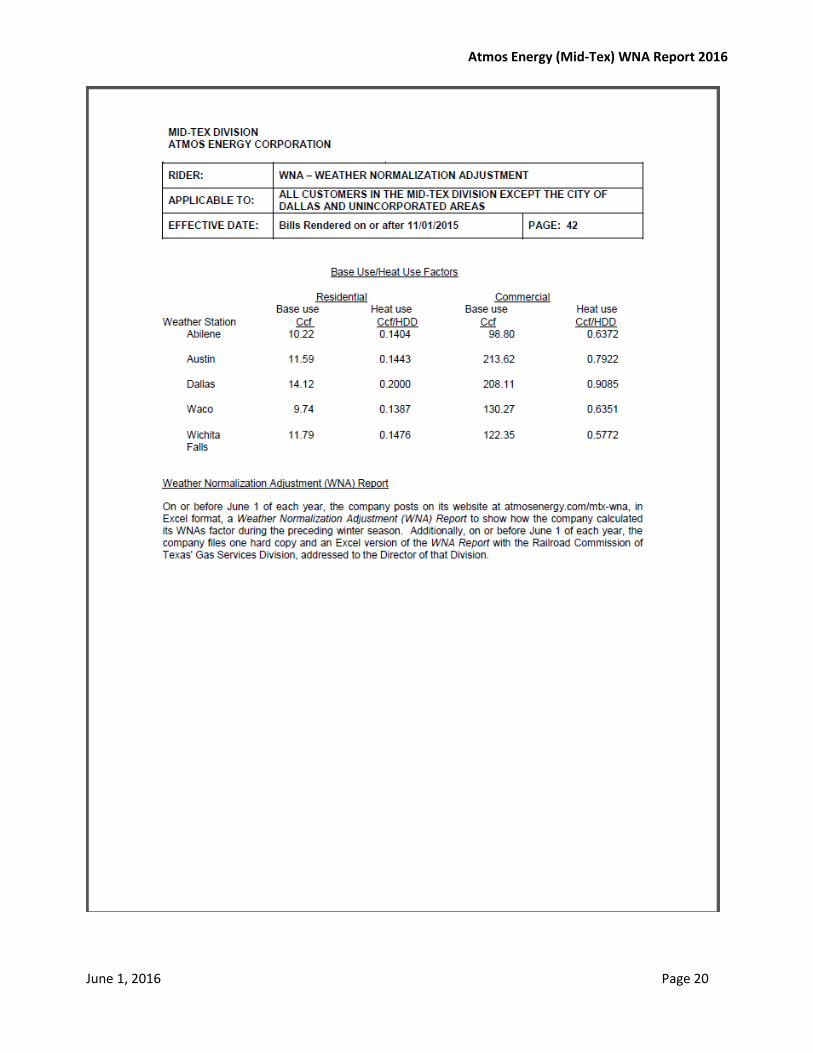
consumption charge rate from customer’s bill) (see Appendix E) BL = base load sales as stated on applicable WNA tariff (see Appendices B, C
or D) HSF = heat sensitivity factor by weather station as stated on applicable WNA
tariff (see Appendices B, C and D) NDD = billing cycle normal heating degree days, calculated as the simple ten-
year average of actual heating degree days (see Appendix F, G and H) ADD = billing cycle actual heating degree days, calculated by taking 65°F minus
the average of the high and low temperature, when the average temperature is below 65°F (see Appendix F, G and H)
The Weather Normalization Adjustment is computed as: WNA = WNAF x q
Where
WNA = Rider WNA as shown on a customer’s bill q = relevant sales quantity expressed in Ccf (i.e., “Usage in CCF” from
customer’s bill)
Atmos Energy (Mid-Tex) WNA Report 2016
June 1, 2016 Page 5
III. Monthly WNA Factors
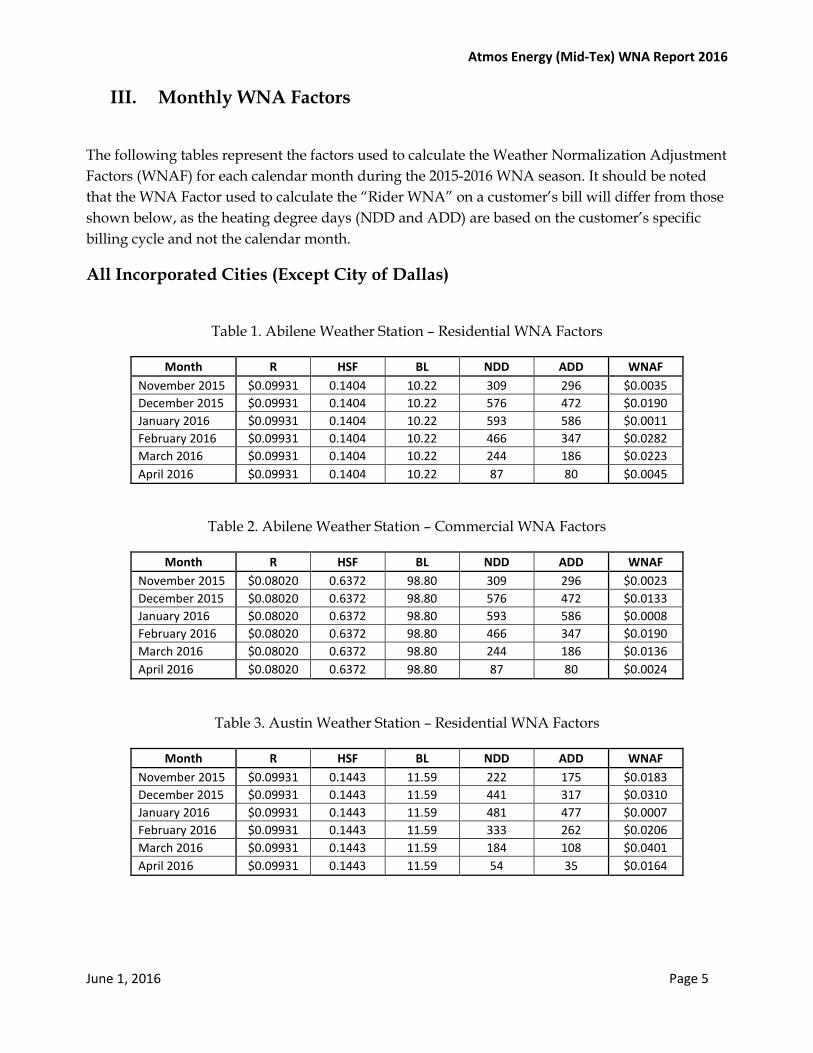
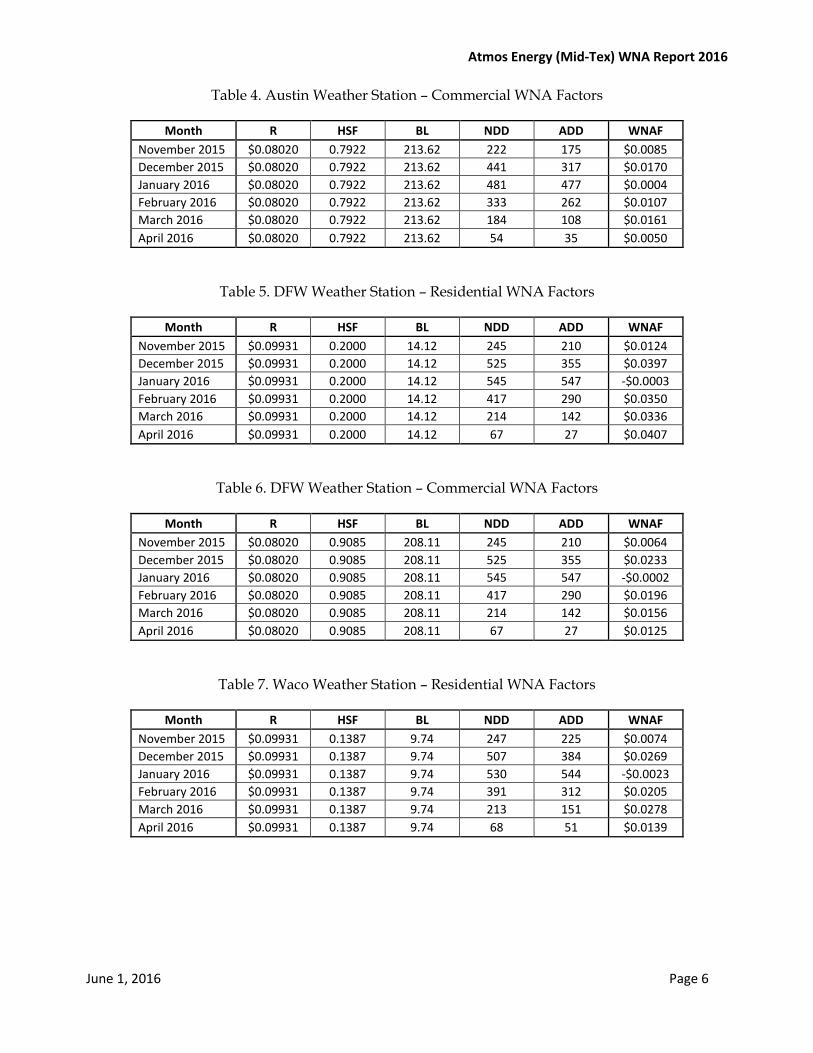
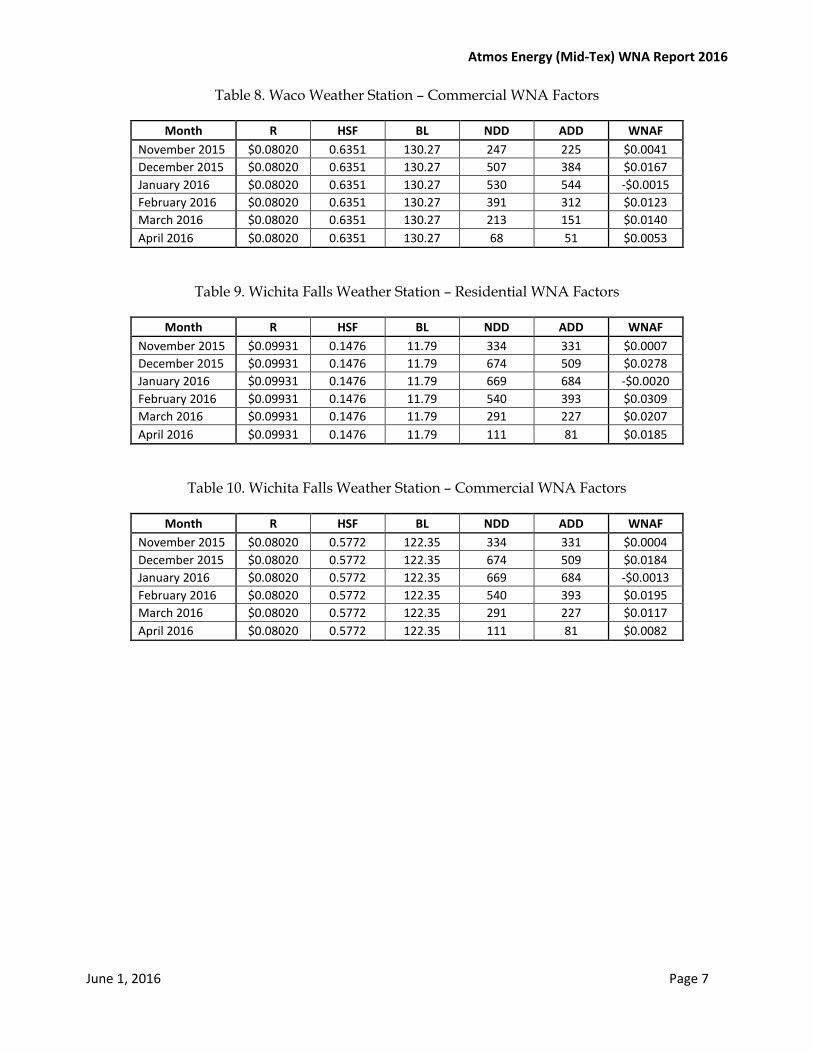
The following tables represent the factors used to calculate the Weather Normalization Adjustment Factors (WNAF) for each calendar month during the 2015-2016 WNA season. It should be noted that the WNA Factor used to calculate the “Rider WNA” on a customer’s bill will differ from those shown below, as the heating degree days (NDD and ADD) are based on the customer’s specific billing cycle and not the calendar month.
All Incorporated Cities (Except City of Dallas)
Table 1. Abilene Weather Station – Residential WNA Factors
Month R HSF BL NDD ADD WNAF November 2015 $0.09931 0.1404 10.22 309 296 $0.0035 December 2015 $0.09931 0.1404 10.22 576 472 $0.0190 January 2016 $0.09931 0.1404 10.22 593 586 $0.0011 February 2016 $0.09931 0.1404 10.22 466 347 $0.0282 March 2016 $0.09931 0.1404 10.22 244 186 $0.0223 April 2016 $0.09931 0.1404 10.22 87 80 $0.0045
Table 2. Abilene Weather Station – Commercial WNA Factors
Month R HSF BL NDD ADD WNAF November 2015 $0.08020 0.6372 98.80 309 296 $0.0023 December 2015 $0.08020 0.6372 98.80 576 472 $0.0133 January 2016 $0.08020 0.6372 98.80 593 586 $0.0008 February 2016 $0.08020 0.6372 98.80 466 347 $0.0190 March 2016 $0.08020 0.6372 98.80 244 186 $0.0136 April 2016 $0.08020 0.6372 98.80 87 80 $0.0024
Table 3. Austin Weather Station – Residential WNA Factors
Month R HSF BL NDD ADD WNAF November 2015 $0.09931 0.1443 11.59 222 175 $0.0183 December 2015 $0.09931 0.1443 11.59 441 317 $0.0310 January 2016 $0.09931 0.1443 11.59 481 477 $0.0007 February 2016 $0.09931 0.1443 11.59 333 262 $0.0206 March 2016 $0.09931 0.1443 11.59 184 108 $0.0401 April 2016 $0.09931 0.1443 11.59 54 35 $0.0164
Atmos Energy (Mid-Tex) WNA Report 2016
June 1, 2016 Page 6
Table 4. Austin Weather Station – Commercial WNA Factors
Month R HSF BL NDD ADD WNAF November 2015 $0.08020 0.7922 213.62 222 175 $0.0085 December 2015 $0.08020 0.7922 213.62 441 317 $0.0170 January 2016 $0.08020 0.7922 213.62 481 477 $0.0004 February 2016 $0.08020 0.7922 213.62 333 262 $0.0107 March 2016 $0.08020 0.7922 213.62 184 108 $0.0161 April 2016 $0.08020 0.7922 213.62 54 35 $0.0050
Table 5. DFW Weather Station – Residential WNA Factors
Month R HSF BL NDD ADD WNAF November 2015 $0.09931 0.2000 14.12 245 210 $0.0124 December 2015 $0.09931 0.2000 14.12 525 355 $0.0397 January 2016 $0.09931 0.2000 14.12 545 547 -$0.0003 February 2016 $0.09931 0.2000 14.12 417 290 $0.0350 March 2016 $0.09931 0.2000 14.12 214 142 $0.0336 April 2016 $0.09931 0.2000 14.12 67 27 $0.0407
Table 6. DFW Weather Station – Commercial WNA Factors
Month R HSF BL NDD ADD WNAF November 2015 $0.08020 0.9085 208.11 245 210 $0.0064 December 2015 $0.08020 0.9085 208.11 525 355 $0.0233 January 2016 $0.08020 0.9085 208.11 545 547 -$0.0002 February 2016 $0.08020 0.9085 208.11 417 290 $0.0196 March 2016 $0.08020 0.9085 208.11 214 142 $0.0156 April 2016 $0.08020 0.9085 208.11 67 27 $0.0125
Table 7. Waco Weather Station – Residential WNA Factors
Month R HSF BL NDD ADD WNAF November 2015 $0.09931 0.1387 9.74 247 225 $0.0074 December 2015 $0.09931 0.1387 9.74 507 384 $0.0269 January 2016 $0.09931 0.1387 9.74 530 544 -$0.0023 February 2016 $0.09931 0.1387 9.74 391 312 $0.0205 March 2016 $0.09931 0.1387 9.74 213 151 $0.0278 April 2016 $0.09931 0.1387 9.74 68 51 $0.0139
Atmos Energy (Mid-Tex) WNA Report 2016
June 1, 2016 Page 7
Table 8. Waco Weather Station – Commercial WNA Factors
Month R HSF BL NDD ADD WNAF November 2015 $0.08020 0.6351 130.27 247 225 $0.0041 December 2015 $0.08020 0.6351 130.27 507 384 $0.0167 January 2016 $0.08020 0.6351 130.27 530 544 -$0.0015 February 2016 $0.08020 0.6351 130.27 391 312 $0.0123 March 2016 $0.08020 0.6351 130.27 213 151 $0.0140 April 2016 $0.08020 0.6351 130.27 68 51 $0.0053
Table 9. Wichita Falls Weather Station – Residential WNA Factors
Month R HSF BL NDD ADD WNAF November 2015 $0.09931 0.1476 11.79 334 331 $0.0007 December 2015 $0.09931 0.1476 11.79 674 509 $0.0278 January 2016 $0.09931 0.1476 11.79 669 684 -$0.0020 February 2016 $0.09931 0.1476 11.79 540 393 $0.0309 March 2016 $0.09931 0.1476 11.79 291 227 $0.0207 April 2016 $0.09931 0.1476 11.79 111 81 $0.0185
Table 10. Wichita Falls Weather Station – Commercial WNA Factors
Month R HSF BL NDD ADD WNAF November 2015 $0.08020 0.5772 122.35 334 331 $0.0004 December 2015 $0.08020 0.5772 122.35 674 509 $0.0184 January 2016 $0.08020 0.5772 122.35 669 684 -$0.0013 February 2016 $0.08020 0.5772 122.35 540 393 $0.0195 March 2016 $0.08020 0.5772 122.35 291 227 $0.0117 April 2016 $0.08020 0.5772 122.35 111 81 $0.0082
Atmos Energy (Mid-Tex) WNA Report 2016
June 1, 2016 Page 8
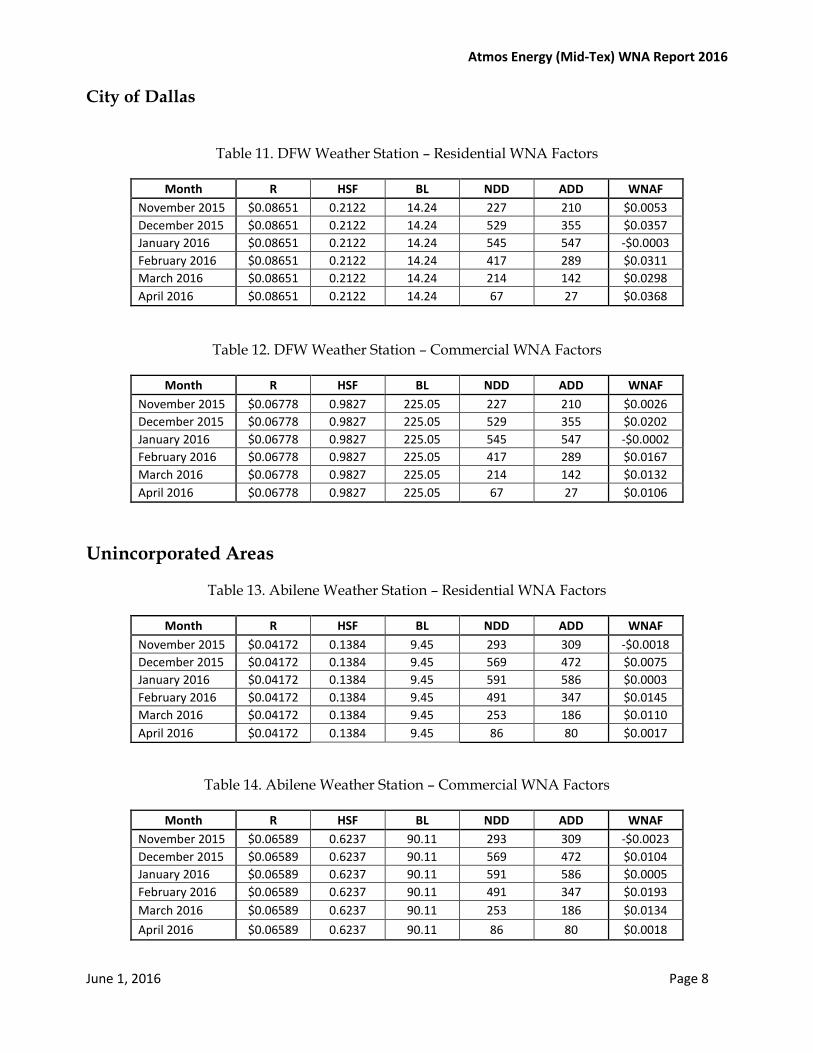
City of Dallas
Table 11. DFW Weather Station – Residential WNA Factors
Month R HSF BL NDD ADD WNAF November 2015 $0.08651 0.2122 14.24 227 210 $0.0053 December 2015 $0.08651 0.2122 14.24 529 355 $0.0357 January 2016 $0.08651 0.2122 14.24 545 547 -$0.0003 February 2016 $0.08651 0.2122 14.24 417 289 $0.0311 March 2016 $0.08651 0.2122 14.24 214 142 $0.0298 April 2016 $0.08651 0.2122 14.24 67 27 $0.0368
Table 12. DFW Weather Station – Commercial WNA Factors
Month R HSF BL NDD ADD WNAF November 2015 $0.06778 0.9827 225.05 227 210 $0.0026 December 2015 $0.06778 0.9827 225.05 529 355 $0.0202 January 2016 $0.06778 0.9827 225.05 545 547 -$0.0002 February 2016 $0.06778 0.9827 225.05 417 289 $0.0167 March 2016 $0.06778 0.9827 225.05 214 142 $0.0132 April 2016 $0.06778 0.9827 225.05 67 27 $0.0106
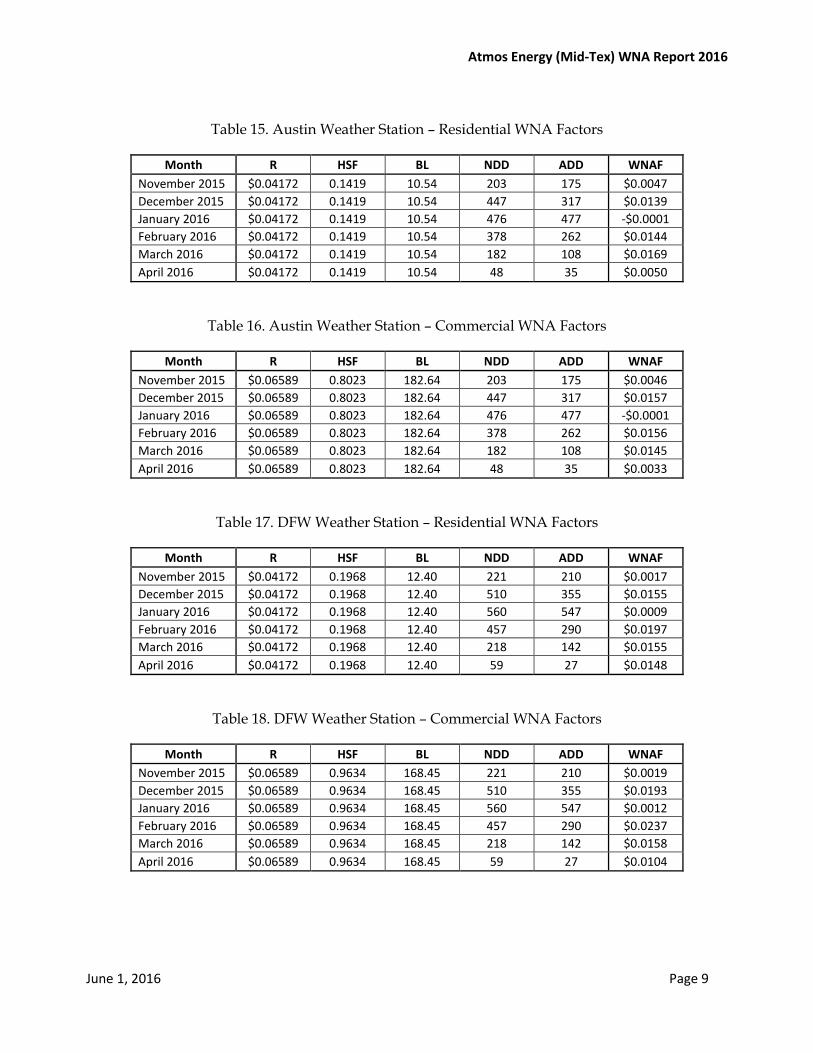
Unincorporated Areas
Table 13. Abilene Weather Station – Residential WNA Factors
Month R HSF BL NDD ADD WNAF November 2015 $0.04172 0.1384 9.45 293 309 -$0.0018 December 2015 $0.04172 0.1384 9.45 569 472 $0.0075 January 2016 $0.04172 0.1384 9.45 591 586 $0.0003 February 2016 $0.04172 0.1384 9.45 491 347 $0.0145 March 2016 $0.04172 0.1384 9.45 253 186 $0.0110 April 2016 $0.04172 0.1384 9.45 86 80 $0.0017
Table 14. Abilene Weather Station – Commercial WNA Factors
Month R HSF BL NDD ADD WNAF November 2015 $0.06589 0.6237 90.11 293 309 -$0.0023 December 2015 $0.06589 0.6237 90.11 569 472 $0.0104 January 2016 $0.06589 0.6237 90.11 591 586 $0.0005 February 2016 $0.06589 0.6237 90.11 491 347 $0.0193 March 2016 $0.06589 0.6237 90.11 253 186 $0.0134 April 2016 $0.06589 0.6237 90.11 86 80 $0.0018
Atmos Energy (Mid-Tex) WNA Report 2016
June 1, 2016 Page 9
Table 15. Austin Weather Station – Residential WNA Factors
Month R HSF BL NDD ADD WNAF November 2015 $0.04172 0.1419 10.54 203 175 $0.0047 December 2015 $0.04172 0.1419 10.54 447 317 $0.0139 January 2016 $0.04172 0.1419 10.54 476 477 -$0.0001 February 2016 $0.04172 0.1419 10.54 378 262 $0.0144 March 2016 $0.04172 0.1419 10.54 182 108 $0.0169 April 2016 $0.04172 0.1419 10.54 48 35 $0.0050
Table 16. Austin Weather Station – Commercial WNA Factors
Month R HSF BL NDD ADD WNAF November 2015 $0.06589 0.8023 182.64 203 175 $0.0046 December 2015 $0.06589 0.8023 182.64 447 317 $0.0157 January 2016 $0.06589 0.8023 182.64 476 477 -$0.0001 February 2016 $0.06589 0.8023 182.64 378 262 $0.0156 March 2016 $0.06589 0.8023 182.64 182 108 $0.0145 April 2016 $0.06589 0.8023 182.64 48 35 $0.0033
Table 17. DFW Weather Station – Residential WNA Factors
Month R HSF BL NDD ADD WNAF November 2015 $0.04172 0.1968 12.40 221 210 $0.0017 December 2015 $0.04172 0.1968 12.40 510 355 $0.0155 January 2016 $0.04172 0.1968 12.40 560 547 $0.0009 February 2016 $0.04172 0.1968 12.40 457 290 $0.0197 March 2016 $0.04172 0.1968 12.40 218 142 $0.0155 April 2016 $0.04172 0.1968 12.40 59 27 $0.0148
Table 18. DFW Weather Station – Commercial WNA Factors
Month R HSF BL NDD ADD WNAF November 2015 $0.06589 0.9634 168.45 221 210 $0.0019 December 2015 $0.06589 0.9634 168.45 510 355 $0.0193 January 2016 $0.06589 0.9634 168.45 560 547 $0.0012 February 2016 $0.06589 0.9634 168.45 457 290 $0.0237 March 2016 $0.06589 0.9634 168.45 218 142 $0.0158 April 2016 $0.06589 0.9634 168.45 59 27 $0.0104
Atmos Energy (Mid-Tex) WNA Report 2016
June 1, 2016 Page 10
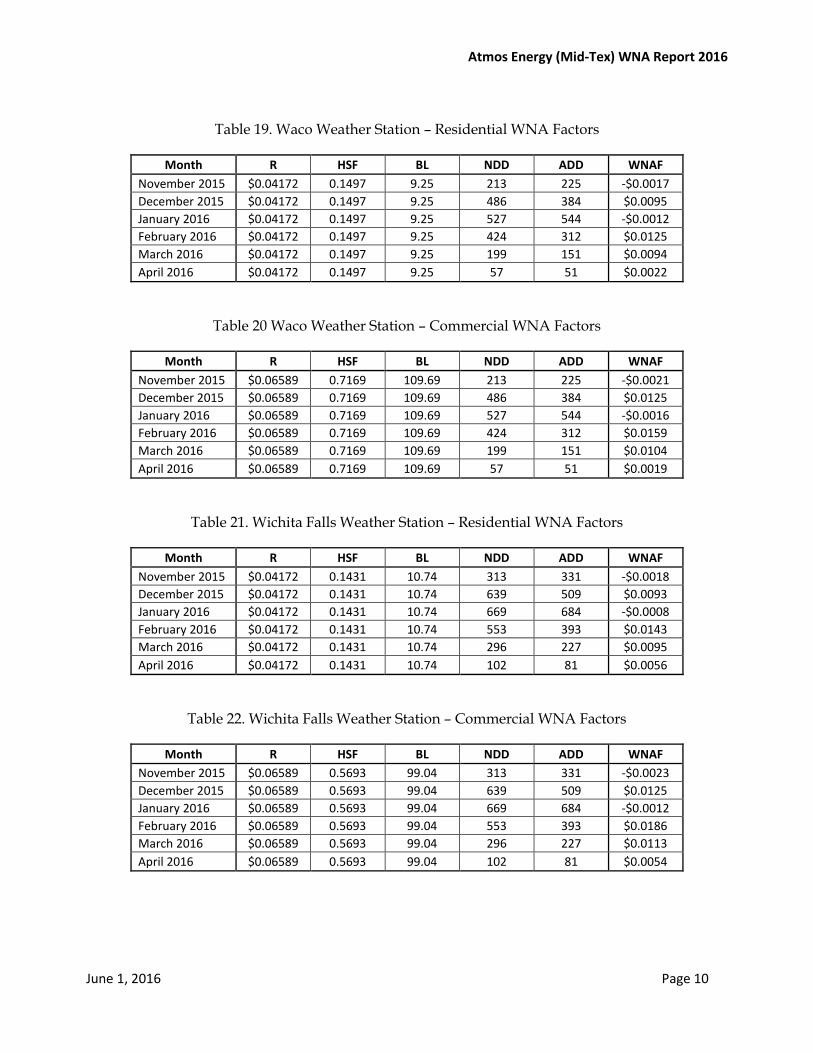
Table 19. Waco Weather Station – Residential WNA Factors
Month R HSF BL NDD ADD WNAF November 2015 $0.04172 0.1497 9.25 213 225 -$0.0017 December 2015 $0.04172 0.1497 9.25 486 384 $0.0095 January 2016 $0.04172 0.1497 9.25 527 544 -$0.0012 February 2016 $0.04172 0.1497 9.25 424 312 $0.0125 March 2016 $0.04172 0.1497 9.25 199 151 $0.0094 April 2016 $0.04172 0.1497 9.25 57 51 $0.0022
Table 20 Waco Weather Station – Commercial WNA Factors
Month R HSF BL NDD ADD WNAF November 2015 $0.06589 0.7169 109.69 213 225 -$0.0021 December 2015 $0.06589 0.7169 109.69 486 384 $0.0125 January 2016 $0.06589 0.7169 109.69 527 544 -$0.0016 February 2016 $0.06589 0.7169 109.69 424 312 $0.0159 March 2016 $0.06589 0.7169 109.69 199 151 $0.0104 April 2016 $0.06589 0.7169 109.69 57 51 $0.0019
Table 21. Wichita Falls Weather Station – Residential WNA Factors
Month R HSF BL NDD ADD WNAF November 2015 $0.04172 0.1431 10.74 313 331 -$0.0018 December 2015 $0.04172 0.1431 10.74 639 509 $0.0093 January 2016 $0.04172 0.1431 10.74 669 684 -$0.0008 February 2016 $0.04172 0.1431 10.74 553 393 $0.0143 March 2016 $0.04172 0.1431 10.74 296 227 $0.0095 April 2016 $0.04172 0.1431 10.74 102 81 $0.0056
Table 22. Wichita Falls Weather Station – Commercial WNA Factors
Month R HSF BL NDD ADD WNAF November 2015 $0.06589 0.5693 99.04 313 331 -$0.0023 December 2015 $0.06589 0.5693 99.04 639 509 $0.0125 January 2016 $0.06589 0.5693 99.04 669 684 -$0.0012 February 2016 $0.06589 0.5693 99.04 553 393 $0.0186 March 2016 $0.06589 0.5693 99.04 296 227 $0.0113 April 2016 $0.06589 0.5693 99.04 102 81 $0.0054
Atmos Energy (Mid-Tex) WNA Report 2016
June 1, 2016 Page 11
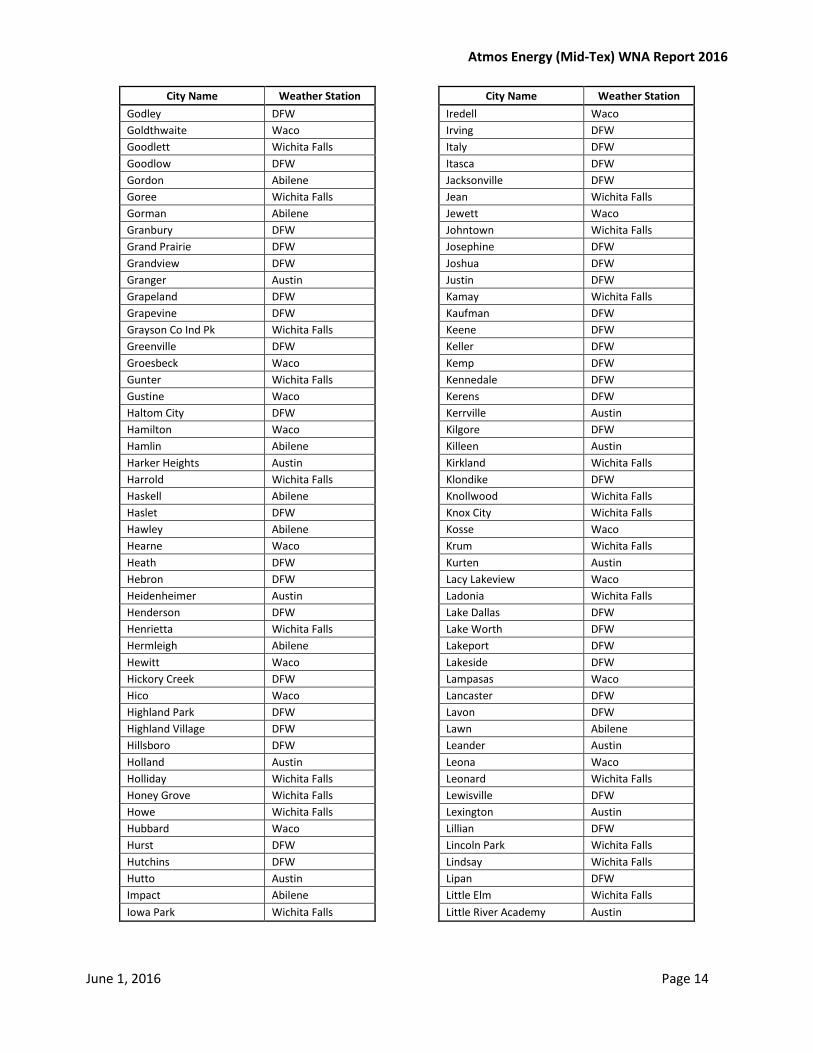
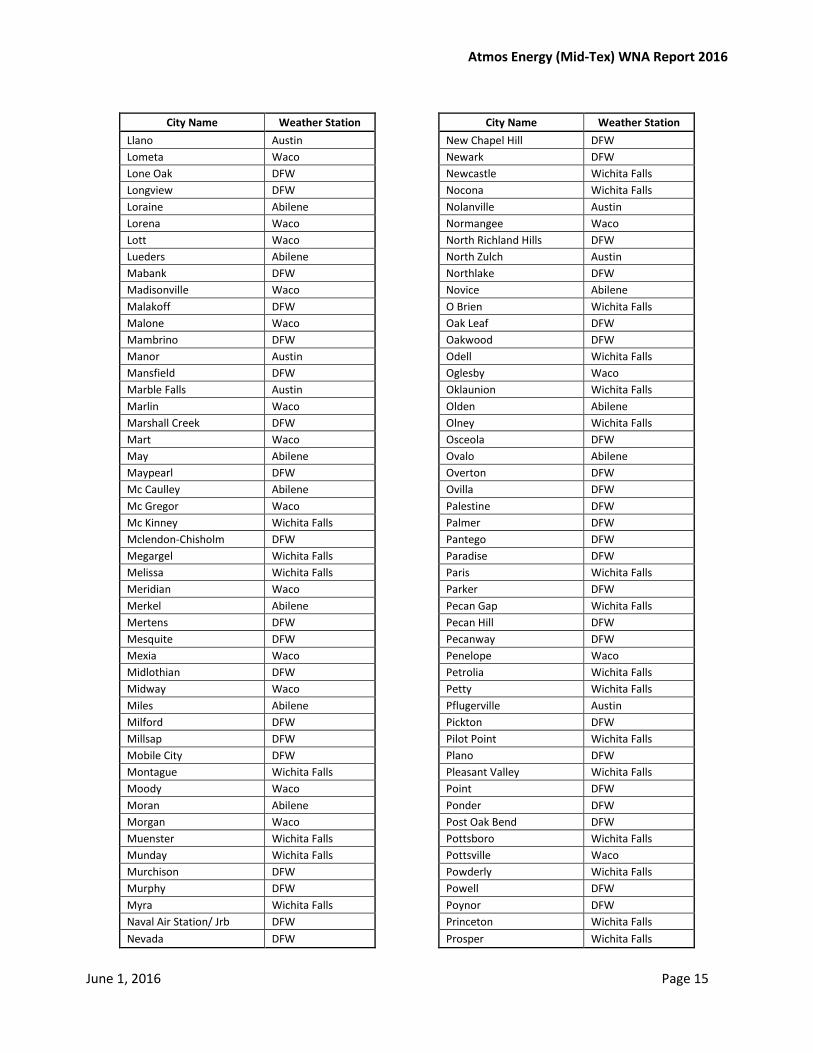
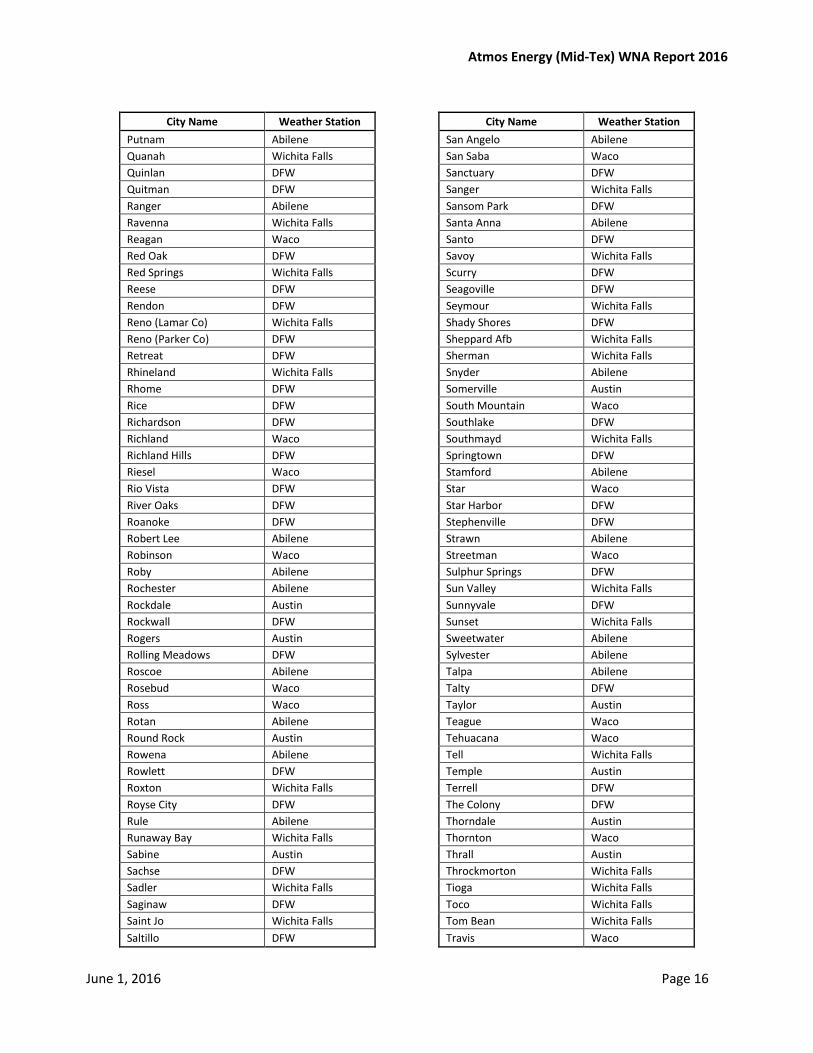
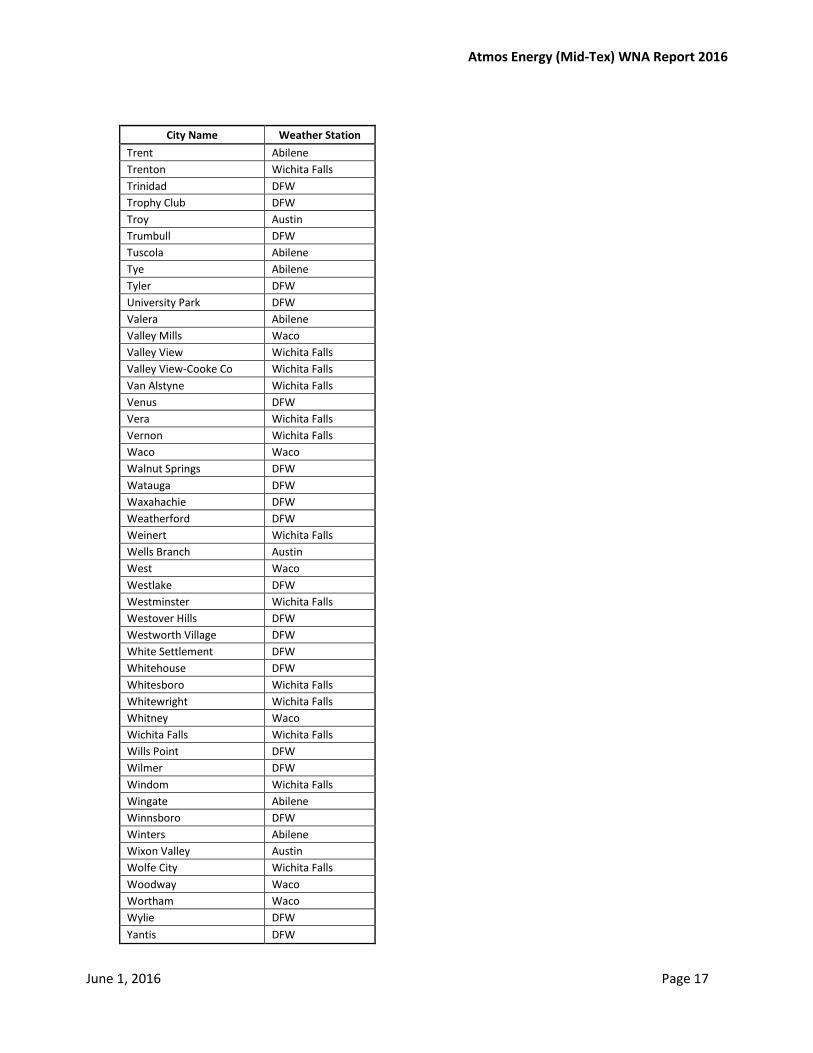
Appendix A - Weather Stations by City
Atmos Energy (Mid-Tex) WNA Report 2016
June 1, 2016 Page 12
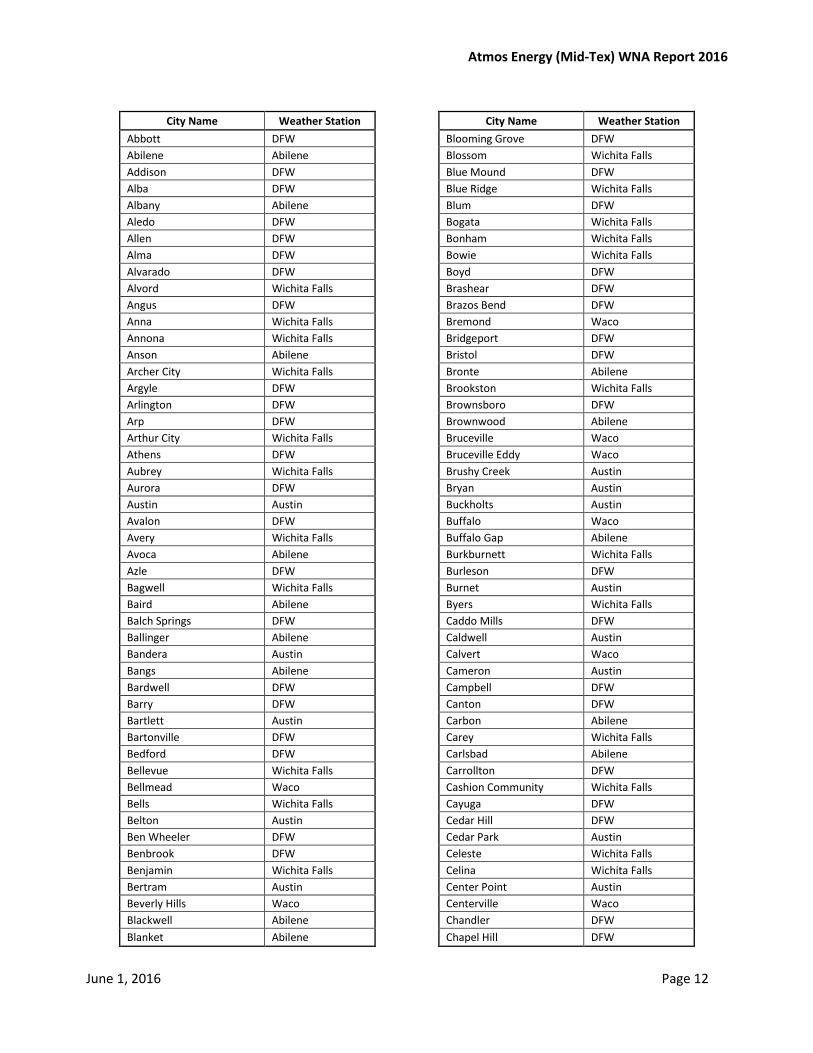
City Name Weather Station City Name Weather Station Abbott DFW Blooming Grove DFW Abilene Abilene Blossom Wichita Falls Addison DFW Blue Mound DFW Alba DFW Blue Ridge Wichita Falls Albany Abilene Blum DFW Aledo DFW Bogata Wichita Falls Allen DFW Bonham Wichita Falls Alma DFW Bowie Wichita Falls Alvarado DFW Boyd DFW Alvord Wichita Falls Brashear DFW Angus DFW Brazos Bend DFW Anna Wichita Falls Bremond Waco Annona Wichita Falls Bridgeport DFW Anson Abilene Bristol DFW Archer City Wichita Falls Bronte Abilene Argyle DFW Brookston Wichita Falls Arlington DFW Brownsboro DFW Arp DFW Brownwood Abilene Arthur City Wichita Falls Bruceville Waco Athens DFW Bruceville Eddy Waco Aubrey Wichita Falls Brushy Creek Austin Aurora DFW Bryan Austin Austin Austin Buckholts Austin Avalon DFW Buffalo Waco Avery Wichita Falls Buffalo Gap Abilene Avoca Abilene Burkburnett Wichita Falls Azle DFW Burleson DFW Bagwell Wichita Falls Burnet Austin Baird Abilene Byers Wichita Falls Balch Springs DFW Caddo Mills DFW Ballinger Abilene Caldwell Austin Bandera Austin Calvert Waco Bangs Abilene Cameron Austin Bardwell DFW Campbell DFW Barry DFW Canton DFW Bartlett Austin Carbon Abilene Bartonville DFW Carey Wichita Falls Bedford DFW Carlsbad Abilene Bellevue Wichita Falls Carrollton DFW Bellmead Waco Cashion Community Wichita Falls Bells Wichita Falls Cayuga DFW Belton Austin Cedar Hill DFW Ben Wheeler DFW Cedar Park Austin Benbrook DFW Celeste Wichita Falls Benjamin Wichita Falls Celina Wichita Falls Bertram Austin Center Point Austin Beverly Hills Waco Centerville Waco Blackwell Abilene Chandler DFW Blanket Abilene Chapel Hill DFW
Atmos Energy (Mid-Tex) WNA Report 2016
June 1, 2016 Page 13
City Name Weather Station City Name Weather Station
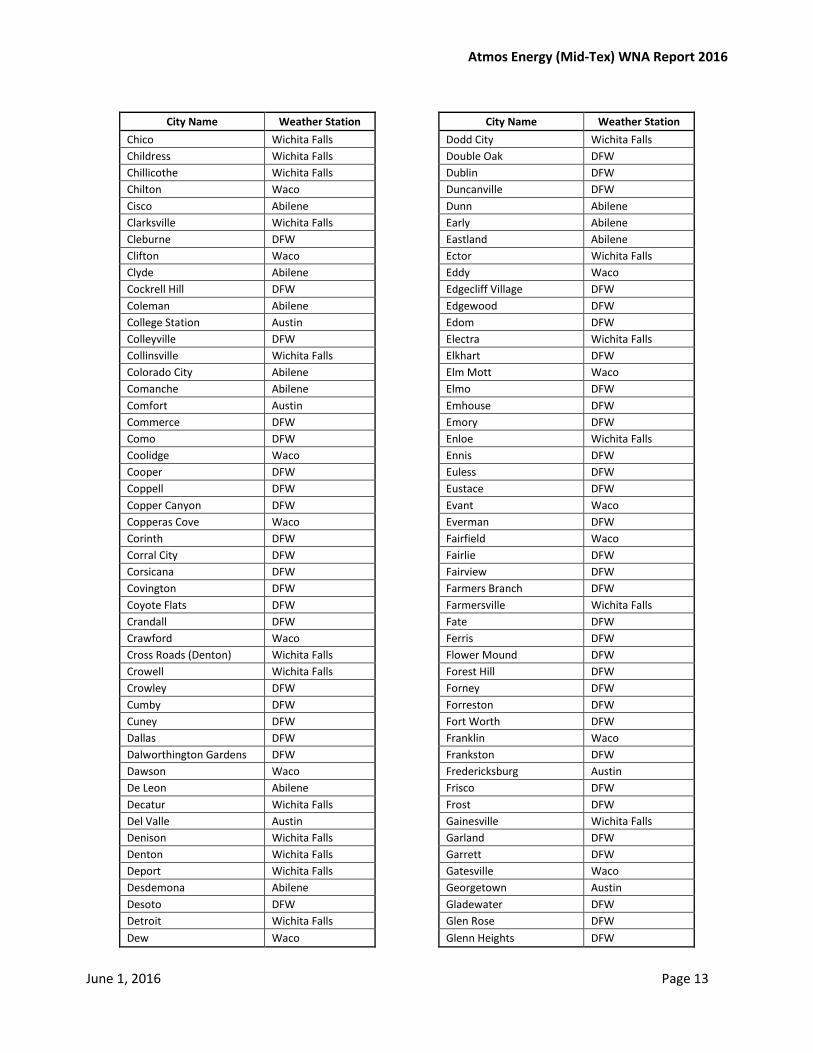
Chico Wichita Falls Dodd City Wichita Falls Childress Wichita Falls Double Oak DFW Chillicothe Wichita Falls Dublin DFW Chilton Waco Duncanville DFW Cisco Abilene Dunn Abilene Clarksville Wichita Falls Early Abilene Cleburne DFW Eastland Abilene Clifton Waco Ector Wichita Falls Clyde Abilene Eddy Waco Cockrell Hill DFW Edgecliff Village DFW Coleman Abilene Edgewood DFW College Station Austin Edom DFW Colleyville DFW Electra Wichita Falls Collinsville Wichita Falls Elkhart DFW Colorado City Abilene Elm Mott Waco Comanche Abilene Elmo DFW Comfort Austin Emhouse DFW Commerce DFW Emory DFW Como DFW Enloe Wichita Falls Coolidge Waco Ennis DFW Cooper DFW Euless DFW Coppell DFW Eustace DFW Copper Canyon DFW Evant Waco Copperas Cove Waco Everman DFW Corinth DFW Fairfield Waco Corral City DFW Fairlie DFW Corsicana DFW Fairview DFW Covington DFW Farmers Branch DFW Coyote Flats DFW Farmersville Wichita Falls Crandall DFW Fate DFW Crawford Waco Ferris DFW Cross Roads (Denton) Wichita Falls Flower Mound DFW Crowell Wichita Falls Forest Hill DFW Crowley DFW Forney DFW Cumby DFW Forreston DFW Cuney DFW Fort Worth DFW Dallas DFW Franklin Waco Dalworthington Gardens DFW Frankston DFW Dawson Waco Fredericksburg Austin De Leon Abilene Frisco DFW Decatur Wichita Falls Frost DFW Del Valle Austin Gainesville Wichita Falls Denison Wichita Falls Garland DFW Denton Wichita Falls Garrett DFW Deport Wichita Falls Gatesville Waco Desdemona Abilene Georgetown Austin Desoto DFW Gladewater DFW Detroit Wichita Falls Glen Rose DFW Dew Waco Glenn Heights DFW
Atmos Energy (Mid-Tex) WNA Report 2016
June 1, 2016 Page 14
City Name Weather Station City Name Weather Station Godley DFW Iredell Waco Goldthwaite Waco Irving DFW Goodlett Wichita Falls Italy DFW Goodlow DFW Itasca DFW Gordon Abilene Jacksonville DFW Goree Wichita Falls Jean Wichita Falls Gorman Abilene Jewett Waco Granbury DFW Johntown Wichita Falls Grand Prairie DFW Josephine DFW Grandview DFW Joshua DFW Granger Austin Justin DFW Grapeland DFW Kamay Wichita Falls Grapevine DFW Kaufman DFW Grayson Co Ind Pk Wichita Falls Keene DFW Greenville DFW Keller DFW Groesbeck Waco Kemp DFW Gunter Wichita Falls Kennedale DFW Gustine Waco Kerens DFW Haltom City DFW Kerrville Austin Hamilton Waco Kilgore DFW Hamlin Abilene Killeen Austin Harker Heights Austin Kirkland Wichita Falls Harrold Wichita Falls Klondike DFW Haskell Abilene Knollwood Wichita Falls Haslet DFW Knox City Wichita Falls Hawley Abilene Kosse Waco Hearne Waco Krum Wichita Falls Heath DFW Kurten Austin Hebron DFW Lacy Lakeview Waco Heidenheimer Austin Ladonia Wichita Falls Henderson DFW Lake Dallas DFW Henrietta Wichita Falls Lake Worth DFW Hermleigh Abilene Lakeport DFW Hewitt Waco Lakeside DFW Hickory Creek DFW Lampasas Waco Hico Waco Lancaster DFW Highland Park DFW Lavon DFW Highland Village DFW Lawn Abilene Hillsboro DFW Leander Austin Holland Austin Leona Waco Holliday Wichita Falls Leonard Wichita Falls Honey Grove Wichita Falls Lewisville DFW Howe Wichita Falls Lexington Austin Hubbard Waco Lillian DFW Hurst DFW Lincoln Park Wichita Falls Hutchins DFW Lindsay Wichita Falls Hutto Austin Lipan DFW Impact Abilene Little Elm Wichita Falls Iowa Park Wichita Falls Little River Academy Austin
Atmos Energy (Mid-Tex) WNA Report 2016
June 1, 2016 Page 15
City Name Weather Station City Name Weather Station
Llano Austin New Chapel Hill DFW Lometa Waco Newark DFW Lone Oak DFW Newcastle Wichita Falls Longview DFW Nocona Wichita Falls Loraine Abilene Nolanville Austin Lorena Waco Normangee Waco Lott Waco North Richland Hills DFW Lueders Abilene North Zulch Austin Mabank DFW Northlake DFW Madisonville Waco Novice Abilene Malakoff DFW O Brien Wichita Falls Malone Waco Oak Leaf DFW Mambrino DFW Oakwood DFW Manor Austin Odell Wichita Falls Mansfield DFW Oglesby Waco Marble Falls Austin Oklaunion Wichita Falls Marlin Waco Olden Abilene Marshall Creek DFW Olney Wichita Falls Mart Waco Osceola DFW May Abilene Ovalo Abilene Maypearl DFW Overton DFW Mc Caulley Abilene Ovilla DFW Mc Gregor Waco Palestine DFW Mc Kinney Wichita Falls Palmer DFW Mclendon-Chisholm DFW Pantego DFW Megargel Wichita Falls Paradise DFW Melissa Wichita Falls Paris Wichita Falls Meridian Waco Parker DFW Merkel Abilene Pecan Gap Wichita Falls Mertens DFW Pecan Hill DFW Mesquite DFW Pecanway DFW Mexia Waco Penelope Waco Midlothian DFW Petrolia Wichita Falls Midway Waco Petty Wichita Falls Miles Abilene Pflugerville Austin Milford DFW Pickton DFW Millsap DFW Pilot Point Wichita Falls Mobile City DFW Plano DFW Montague Wichita Falls Pleasant Valley Wichita Falls Moody Waco Point DFW Moran Abilene Ponder DFW Morgan Waco Post Oak Bend DFW Muenster Wichita Falls Pottsboro Wichita Falls Munday Wichita Falls Pottsville Waco Murchison DFW Powderly Wichita Falls Murphy DFW Powell DFW Myra Wichita Falls Poynor DFW Naval Air Station/ Jrb DFW Princeton Wichita Falls Nevada DFW Prosper Wichita Falls
Atmos Energy (Mid-Tex) WNA Report 2016
June 1, 2016 Page 16
City Name Weather Station City Name Weather Station
Putnam Abilene San Angelo Abilene Quanah Wichita Falls San Saba Waco Quinlan DFW Sanctuary DFW Quitman DFW Sanger Wichita Falls Ranger Abilene Sansom Park DFW Ravenna Wichita Falls Santa Anna Abilene Reagan Waco Santo DFW Red Oak DFW Savoy Wichita Falls Red Springs Wichita Falls Scurry DFW Reese DFW Seagoville DFW Rendon DFW Seymour Wichita Falls Reno (Lamar Co) Wichita Falls Shady Shores DFW Reno (Parker Co) DFW Sheppard Afb Wichita Falls Retreat DFW Sherman Wichita Falls Rhineland Wichita Falls Snyder Abilene Rhome DFW Somerville Austin Rice DFW South Mountain Waco Richardson DFW Southlake DFW Richland Waco Southmayd Wichita Falls Richland Hills DFW Springtown DFW Riesel Waco Stamford Abilene Rio Vista DFW Star Waco River Oaks DFW Star Harbor DFW Roanoke DFW Stephenville DFW Robert Lee Abilene Strawn Abilene Robinson Waco Streetman Waco Roby Abilene Sulphur Springs DFW Rochester Abilene Sun Valley Wichita Falls Rockdale Austin Sunnyvale DFW Rockwall DFW Sunset Wichita Falls Rogers Austin Sweetwater Abilene Rolling Meadows DFW Sylvester Abilene Roscoe Abilene Talpa Abilene Rosebud Waco Talty DFW Ross Waco Taylor Austin Rotan Abilene Teague Waco Round Rock Austin Tehuacana Waco Rowena Abilene Tell Wichita Falls Rowlett DFW Temple Austin Roxton Wichita Falls Terrell DFW Royse City DFW The Colony DFW Rule Abilene Thorndale Austin Runaway Bay Wichita Falls Thornton Waco Sabine Austin Thrall Austin Sachse DFW Throckmorton Wichita Falls Sadler Wichita Falls Tioga Wichita Falls Saginaw DFW Toco Wichita Falls Saint Jo Wichita Falls Tom Bean Wichita Falls Saltillo DFW Travis Waco
Atmos Energy (Mid-Tex) WNA Report 2016
June 1, 2016 Page 17
City Name Weather Station Trent Abilene Trenton Wichita Falls Trinidad DFW Trophy Club DFW Troy Austin Trumbull DFW Tuscola Abilene Tye Abilene Tyler DFW University Park DFW Valera Abilene Valley Mills Waco Valley View Wichita Falls Valley View-Cooke Co Wichita Falls Van Alstyne Wichita Falls Venus DFW Vera Wichita Falls Vernon Wichita Falls Waco Waco Walnut Springs DFW Watauga DFW Waxahachie DFW Weatherford DFW Weinert Wichita Falls Wells Branch Austin West Waco Westlake DFW Westminster Wichita Falls Westover Hills DFW Westworth Village DFW White Settlement DFW Whitehouse DFW Whitesboro Wichita Falls Whitewright Wichita Falls Whitney Waco Wichita Falls Wichita Falls Wills Point DFW Wilmer DFW Windom Wichita Falls Wingate Abilene Winnsboro DFW Winters Abilene Wixon Valley Austin Wolfe City Wichita Falls Woodway Waco Wortham Waco Wylie DFW Yantis DFW
Atmos Energy (Mid-Tex) WNA Report 2016
June 1, 2016 Page 18
Appendix B – WNA Tariff (11/1/2015)
Applicable to: All Customers in the Mid-Tex Division (except the City of Dallas and Unincorporated Areas)
Period: Bills rendered November 1, 2015 to April 30, 2016
Atmos Energy (Mid-Tex) WNA Report 2016
June 1, 2016 Page 19
Atmos Energy (Mid-Tex) WNA Report 2016
June 1, 2016 Page 20
Atmos Energy (Mid-Tex) WNA Report 2016
June 1, 2016 Page 21
Appendix C – WNA Tariff (6/1/2015)
Applicable to: Customers within City of Dallas
Period: Bills rendered November 1, 2015 to April 30, 2016
Atmos Energy (Mid-Tex) WNA Report 2016
June 1, 2016 Page 22
Atmos Energy (Mid-Tex) WNA Report 2016
June 1, 2016 Page 23
Atmos Energy (Mid-Tex) WNA Report 2016
June 1, 2016 Page 24
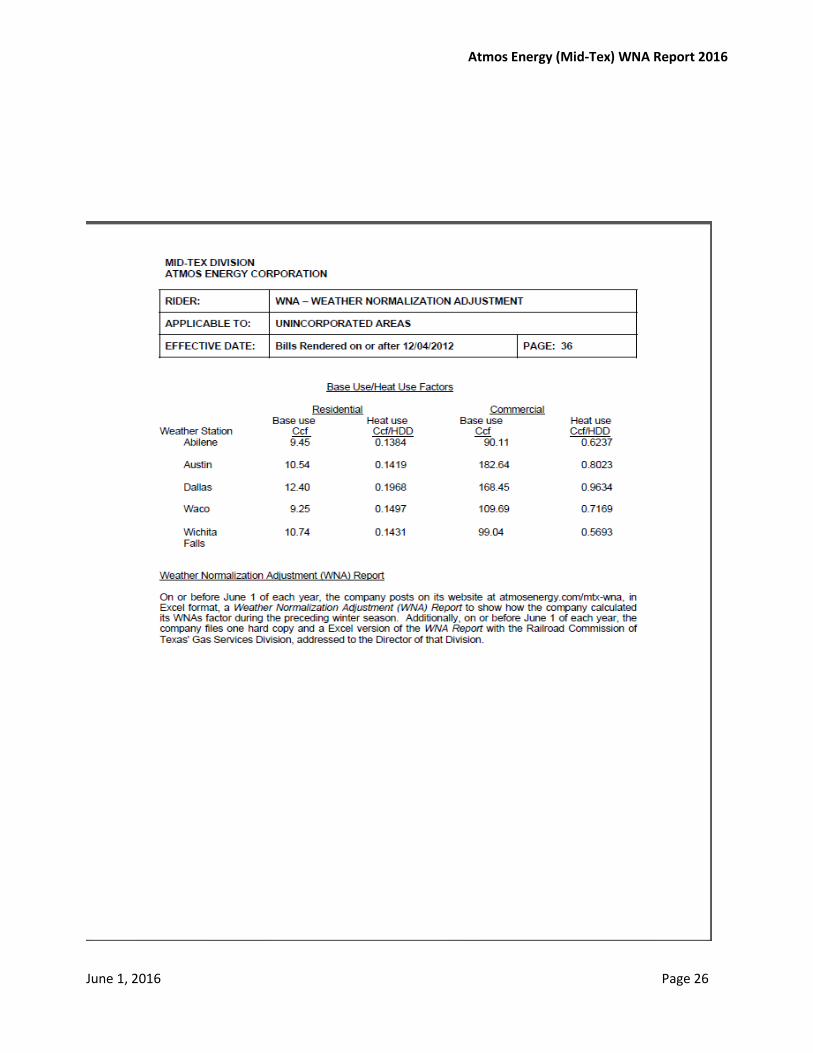
Appendix D – WNA Tariff (12/4/2012)
Applicable to: Unincorporated Areas
Period: Bills rendered November 1, 2015 to April 30, 2016
Atmos Energy (Mid-Tex) WNA Report 2016
June 1, 2016 Page 25
Atmos Energy (Mid-Tex) WNA Report 2016
June 1, 2016 Page 26
Atmos Energy (Mid-Tex) WNA Report 2016
June 1, 2016 Page 27
Appendix E – Base Rate of Temperature Sensitive Sales
Atmos Energy (Mid-Tex) WNA Report 2016
June 1, 2016 Page 28
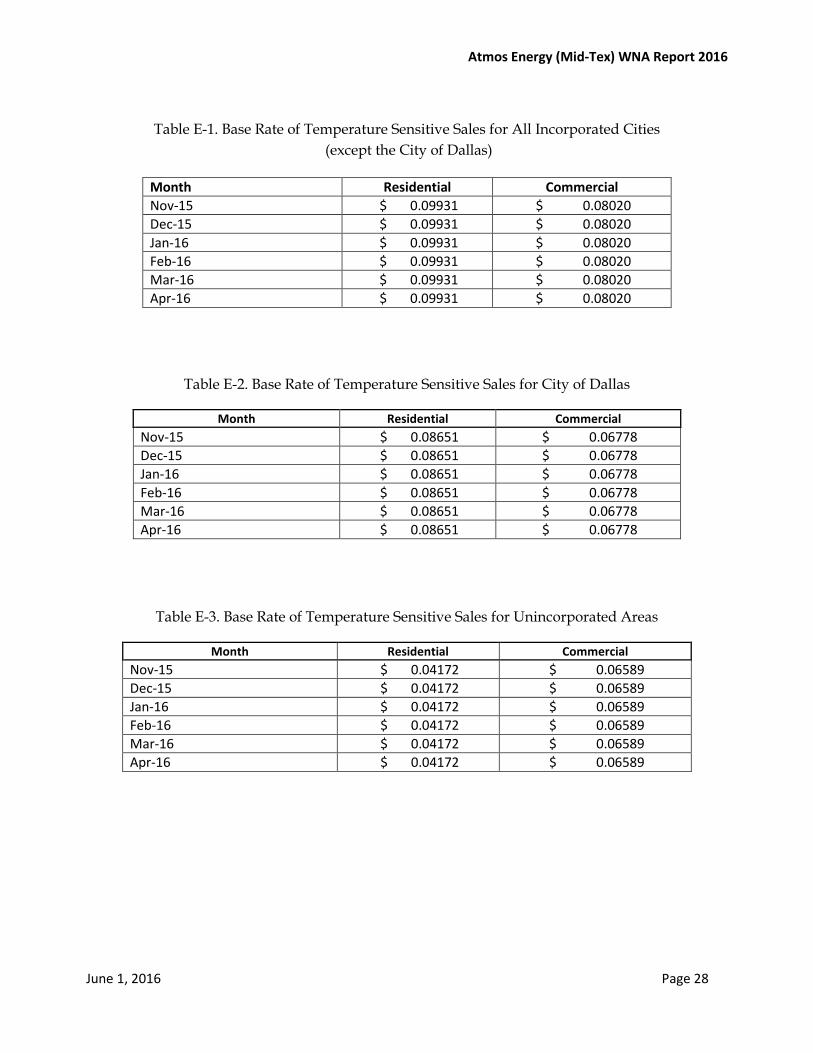
Table E-1. Base Rate of Temperature Sensitive Sales for All Incorporated Cities (except the City of Dallas)
Month Residential Commercial Nov-15 $ 0.09931 $ 0.08020 Dec-15 $ 0.09931 $ 0.08020 Jan-16 $ 0.09931 $ 0.08020 Feb-16 $ 0.09931 $ 0.08020 Mar-16 $ 0.09931 $ 0.08020 Apr-16 $ 0.09931 $ 0.08020
Table E-2. Base Rate of Temperature Sensitive Sales for City of Dallas
Month Residential Commercial Nov-15 $ 0.08651 $ 0.06778 Dec-15 $ 0.08651 $ 0.06778 Jan-16 $ 0.08651 $ 0.06778 Feb-16 $ 0.08651 $ 0.06778 Mar-16 $ 0.08651 $ 0.06778 Apr-16 $ 0.08651 $ 0.06778
Table E-3. Base Rate of Temperature Sensitive Sales for Unincorporated Areas
Month Residential Commercial Nov-15 $ 0.04172 $ 0.06589 Dec-15 $ 0.04172 $ 0.06589 Jan-16 $ 0.04172 $ 0.06589 Feb-16 $ 0.04172 $ 0.06589 Mar-16 $ 0.04172 $ 0.06589 Apr-16 $ 0.04172 $ 0.06589
Atmos Energy (Mid-Tex) WNA Report 2016
June 1, 2016 Page 29
Appendix F – Heating Degree Day Data for All Incorporated Cities (Except City of Dallas)
Atmos Energy (Mid-Tex) WNA Report 2016
June 1, 2016 Page 30
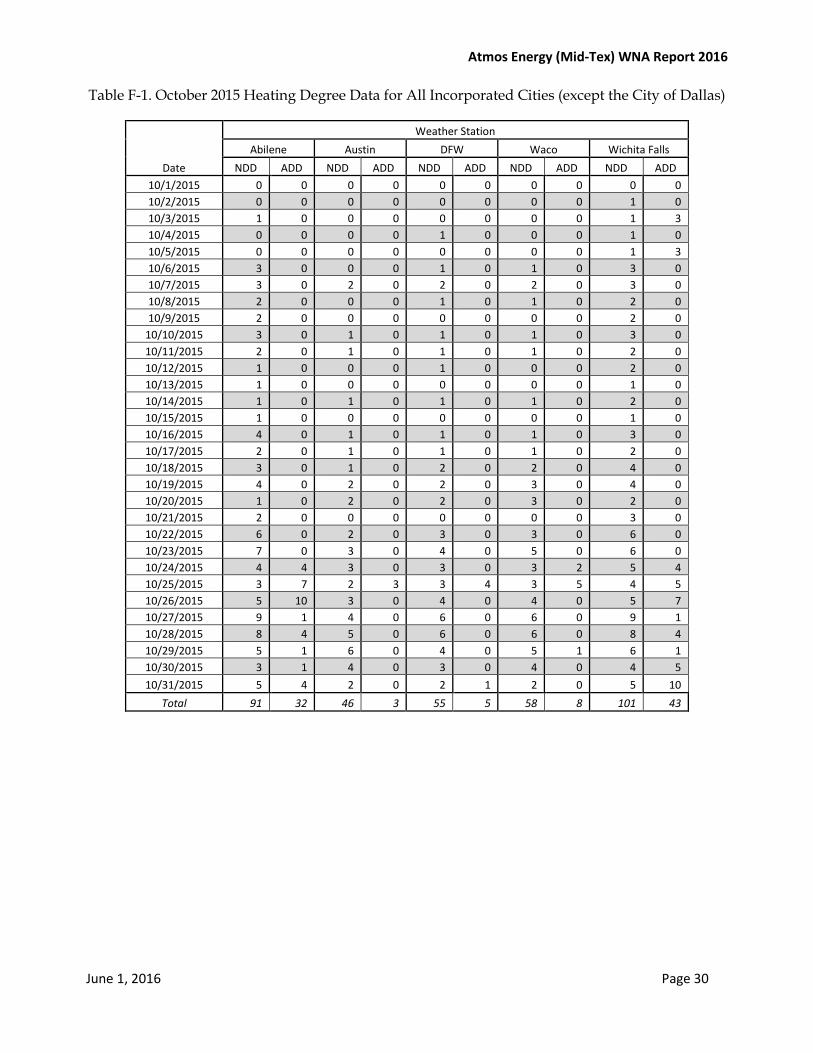
Table F-1. October 2015 Heating Degree Data for All Incorporated Cities (except the City of Dallas)
Date
Weather Station Abilene Austin DFW Waco Wichita Falls
NDD ADD NDD ADD NDD ADD NDD ADD NDD ADD 10/1/2015 0 0 0 0 0 0 0 0 0 0 10/2/2015 0 0 0 0 0 0 0 0 1 0 10/3/2015 1 0 0 0 0 0 0 0 1 3 10/4/2015 0 0 0 0 1 0 0 0 1 0 10/5/2015 0 0 0 0 0 0 0 0 1 3 10/6/2015 3 0 0 0 1 0 1 0 3 0 10/7/2015 3 0 2 0 2 0 2 0 3 0 10/8/2015 2 0 0 0 1 0 1 0 2 0 10/9/2015 2 0 0 0 0 0 0 0 2 0
10/10/2015 3 0 1 0 1 0 1 0 3 0 10/11/2015 2 0 1 0 1 0 1 0 2 0 10/12/2015 1 0 0 0 1 0 0 0 2 0 10/13/2015 1 0 0 0 0 0 0 0 1 0 10/14/2015 1 0 1 0 1 0 1 0 2 0 10/15/2015 1 0 0 0 0 0 0 0 1 0 10/16/2015 4 0 1 0 1 0 1 0 3 0 10/17/2015 2 0 1 0 1 0 1 0 2 0 10/18/2015 3 0 1 0 2 0 2 0 4 0 10/19/2015 4 0 2 0 2 0 3 0 4 0 10/20/2015 1 0 2 0 2 0 3 0 2 0 10/21/2015 2 0 0 0 0 0 0 0 3 0 10/22/2015 6 0 2 0 3 0 3 0 6 0 10/23/2015 7 0 3 0 4 0 5 0 6 0 10/24/2015 4 4 3 0 3 0 3 2 5 4 10/25/2015 3 7 2 3 3 4 3 5 4 5 10/26/2015 5 10 3 0 4 0 4 0 5 7 10/27/2015 9 1 4 0 6 0 6 0 9 1 10/28/2015 8 4 5 0 6 0 6 0 8 4 10/29/2015 5 1 6 0 4 0 5 1 6 1 10/30/2015 3 1 4 0 3 0 4 0 4 5 10/31/2015 5 4 2 0 2 1 2 0 5 10
Total 91 32 46 3 55 5 58 8 101 43
Atmos Energy (Mid-Tex) WNA Report 2016
June 1, 2016 Page 31
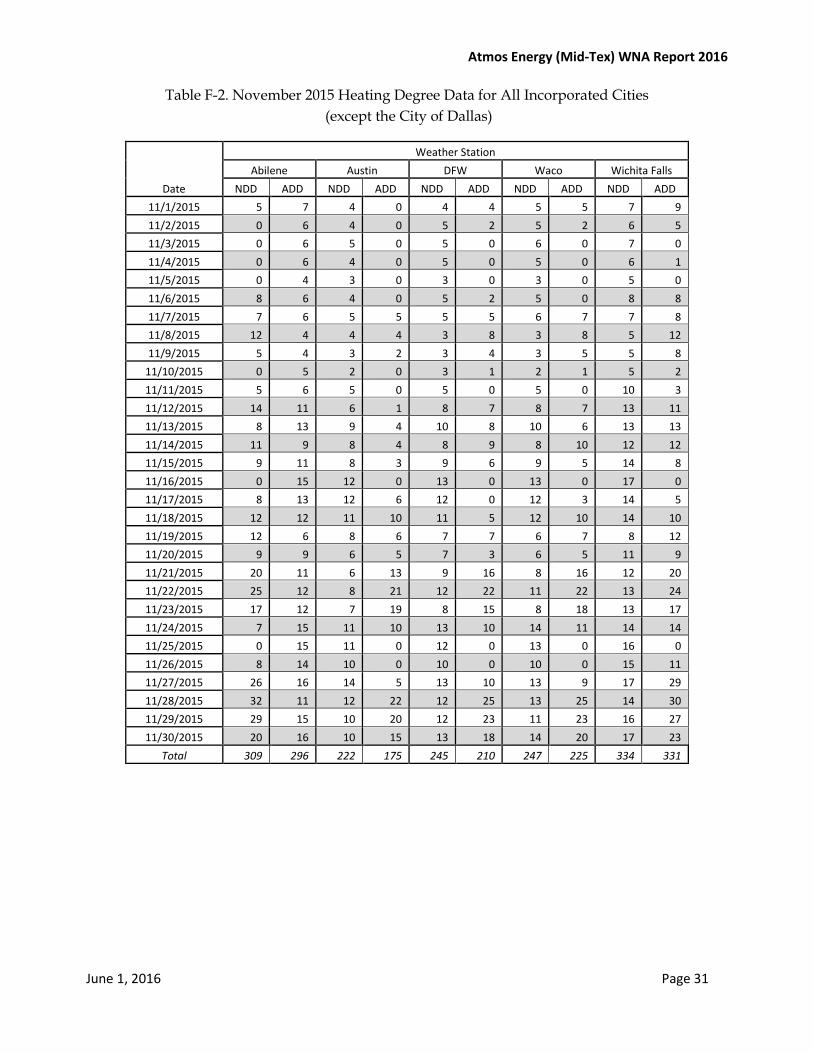
Table F-2. November 2015 Heating Degree Data for All Incorporated Cities (except the City of Dallas)
Date
Weather Station Abilene Austin DFW Waco Wichita Falls
NDD ADD NDD ADD NDD ADD NDD ADD NDD ADD 11/1/2015 5 7 4 0 4 4 5 5 7 9 11/2/2015 0 6 4 0 5 2 5 2 6 5 11/3/2015 0 6 5 0 5 0 6 0 7 0 11/4/2015 0 6 4 0 5 0 5 0 6 1 11/5/2015 0 4 3 0 3 0 3 0 5 0 11/6/2015 8 6 4 0 5 2 5 0 8 8 11/7/2015 7 6 5 5 5 5 6 7 7 8 11/8/2015 12 4 4 4 3 8 3 8 5 12 11/9/2015 5 4 3 2 3 4 3 5 5 8
11/10/2015 0 5 2 0 3 1 2 1 5 2 11/11/2015 5 6 5 0 5 0 5 0 10 3 11/12/2015 14 11 6 1 8 7 8 7 13 11 11/13/2015 8 13 9 4 10 8 10 6 13 13 11/14/2015 11 9 8 4 8 9 8 10 12 12 11/15/2015 9 11 8 3 9 6 9 5 14 8 11/16/2015 0 15 12 0 13 0 13 0 17 0 11/17/2015 8 13 12 6 12 0 12 3 14 5 11/18/2015 12 12 11 10 11 5 12 10 14 10 11/19/2015 12 6 8 6 7 7 6 7 8 12 11/20/2015 9 9 6 5 7 3 6 5 11 9 11/21/2015 20 11 6 13 9 16 8 16 12 20 11/22/2015 25 12 8 21 12 22 11 22 13 24 11/23/2015 17 12 7 19 8 15 8 18 13 17 11/24/2015 7 15 11 10 13 10 14 11 14 14 11/25/2015 0 15 11 0 12 0 13 0 16 0 11/26/2015 8 14 10 0 10 0 10 0 15 11 11/27/2015 26 16 14 5 13 10 13 9 17 29 11/28/2015 32 11 12 22 12 25 13 25 14 30 11/29/2015 29 15 10 20 12 23 11 23 16 27 11/30/2015 20 16 10 15 13 18 14 20 17 23
Total 309 296 222 175 245 210 247 225 334 331
Atmos Energy (Mid-Tex) WNA Report 2016
June 1, 2016 Page 32
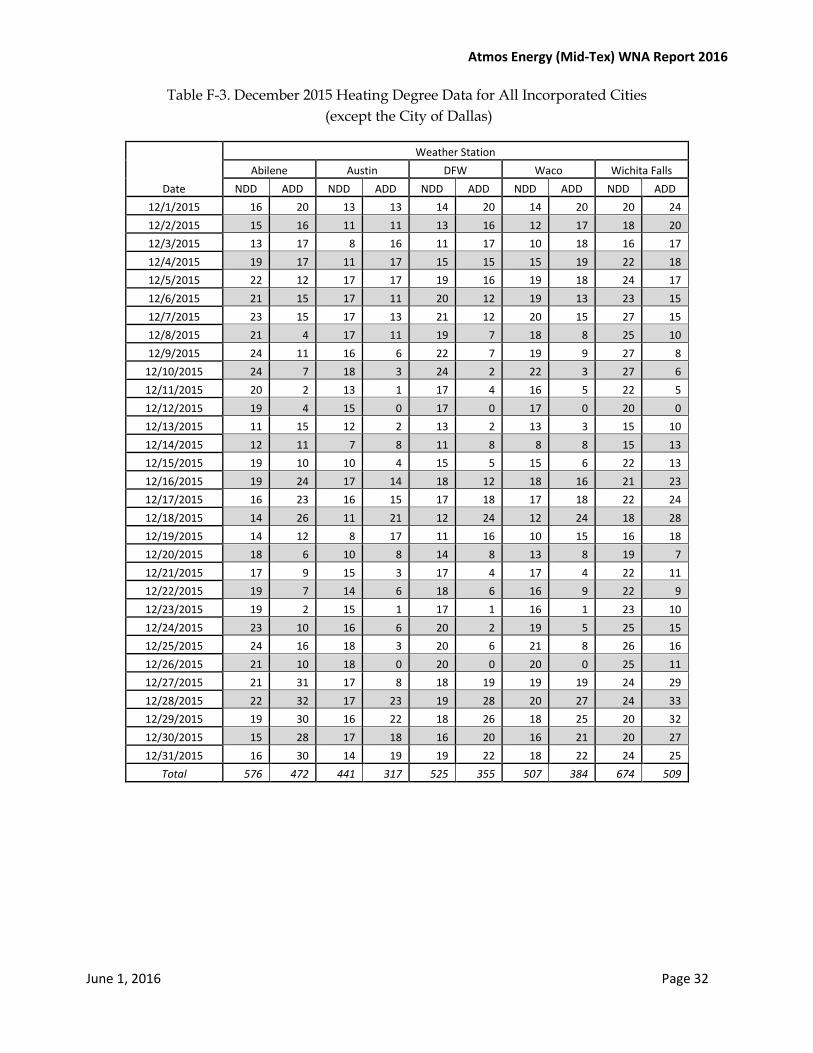
Table F-3. December 2015 Heating Degree Data for All Incorporated Cities (except the City of Dallas)
Date
Weather Station Abilene Austin DFW Waco Wichita Falls
NDD ADD NDD ADD NDD ADD NDD ADD NDD ADD 12/1/2015 16 20 13 13 14 20 14 20 20 24 12/2/2015 15 16 11 11 13 16 12 17 18 20 12/3/2015 13 17 8 16 11 17 10 18 16 17 12/4/2015 19 17 11 17 15 15 15 19 22 18 12/5/2015 22 12 17 17 19 16 19 18 24 17 12/6/2015 21 15 17 11 20 12 19 13 23 15 12/7/2015 23 15 17 13 21 12 20 15 27 15 12/8/2015 21 4 17 11 19 7 18 8 25 10 12/9/2015 24 11 16 6 22 7 19 9 27 8
12/10/2015 24 7 18 3 24 2 22 3 27 6 12/11/2015 20 2 13 1 17 4 16 5 22 5 12/12/2015 19 4 15 0 17 0 17 0 20 0 12/13/2015 11 15 12 2 13 2 13 3 15 10 12/14/2015 12 11 7 8 11 8 8 8 15 13 12/15/2015 19 10 10 4 15 5 15 6 22 13 12/16/2015 19 24 17 14 18 12 18 16 21 23 12/17/2015 16 23 16 15 17 18 17 18 22 24 12/18/2015 14 26 11 21 12 24 12 24 18 28 12/19/2015 14 12 8 17 11 16 10 15 16 18 12/20/2015 18 6 10 8 14 8 13 8 19 7 12/21/2015 17 9 15 3 17 4 17 4 22 11 12/22/2015 19 7 14 6 18 6 16 9 22 9 12/23/2015 19 2 15 1 17 1 16 1 23 10 12/24/2015 23 10 16 6 20 2 19 5 25 15 12/25/2015 24 16 18 3 20 6 21 8 26 16 12/26/2015 21 10 18 0 20 0 20 0 25 11 12/27/2015 21 31 17 8 18 19 19 19 24 29 12/28/2015 22 32 17 23 19 28 20 27 24 33 12/29/2015 19 30 16 22 18 26 18 25 20 32 12/30/2015 15 28 17 18 16 20 16 21 20 27 12/31/2015 16 30 14 19 19 22 18 22 24 25
Total 576 472 441 317 525 355 507 384 674 509
Atmos Energy (Mid-Tex) WNA Report 2016
June 1, 2016 Page 33
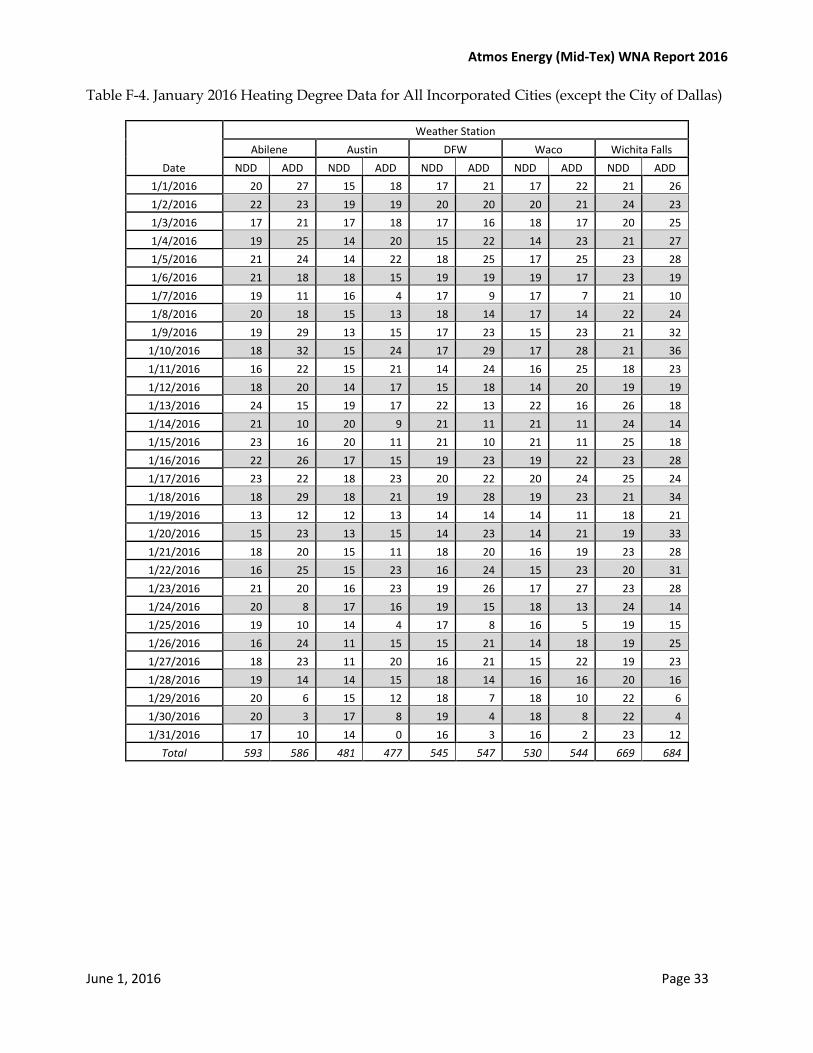
Table F-4. January 2016 Heating Degree Data for All Incorporated Cities (except the City of Dallas)
Date
Weather Station Abilene Austin DFW Waco Wichita Falls
NDD ADD NDD ADD NDD ADD NDD ADD NDD ADD 1/1/2016 20 27 15 18 17 21 17 22 21 26 1/2/2016 22 23 19 19 20 20 20 21 24 23 1/3/2016 17 21 17 18 17 16 18 17 20 25 1/4/2016 19 25 14 20 15 22 14 23 21 27 1/5/2016 21 24 14 22 18 25 17 25 23 28 1/6/2016 21 18 18 15 19 19 19 17 23 19 1/7/2016 19 11 16 4 17 9 17 7 21 10 1/8/2016 20 18 15 13 18 14 17 14 22 24 1/9/2016 19 29 13 15 17 23 15 23 21 32
1/10/2016 18 32 15 24 17 29 17 28 21 36 1/11/2016 16 22 15 21 14 24 16 25 18 23 1/12/2016 18 20 14 17 15 18 14 20 19 19 1/13/2016 24 15 19 17 22 13 22 16 26 18 1/14/2016 21 10 20 9 21 11 21 11 24 14 1/15/2016 23 16 20 11 21 10 21 11 25 18 1/16/2016 22 26 17 15 19 23 19 22 23 28 1/17/2016 23 22 18 23 20 22 20 24 25 24 1/18/2016 18 29 18 21 19 28 19 23 21 34 1/19/2016 13 12 12 13 14 14 14 11 18 21 1/20/2016 15 23 13 15 14 23 14 21 19 33 1/21/2016 18 20 15 11 18 20 16 19 23 28 1/22/2016 16 25 15 23 16 24 15 23 20 31 1/23/2016 21 20 16 23 19 26 17 27 23 28 1/24/2016 20 8 17 16 19 15 18 13 24 14 1/25/2016 19 10 14 4 17 8 16 5 19 15 1/26/2016 16 24 11 15 15 21 14 18 19 25 1/27/2016 18 23 11 20 16 21 15 22 19 23 1/28/2016 19 14 14 15 18 14 16 16 20 16 1/29/2016 20 6 15 12 18 7 18 10 22 6 1/30/2016 20 3 17 8 19 4 18 8 22 4 1/31/2016 17 10 14 0 16 3 16 2 23 12
Total 593 586 481 477 545 547 530 544 669 684
Atmos Energy (Mid-Tex) WNA Report 2016
June 1, 2016 Page 34
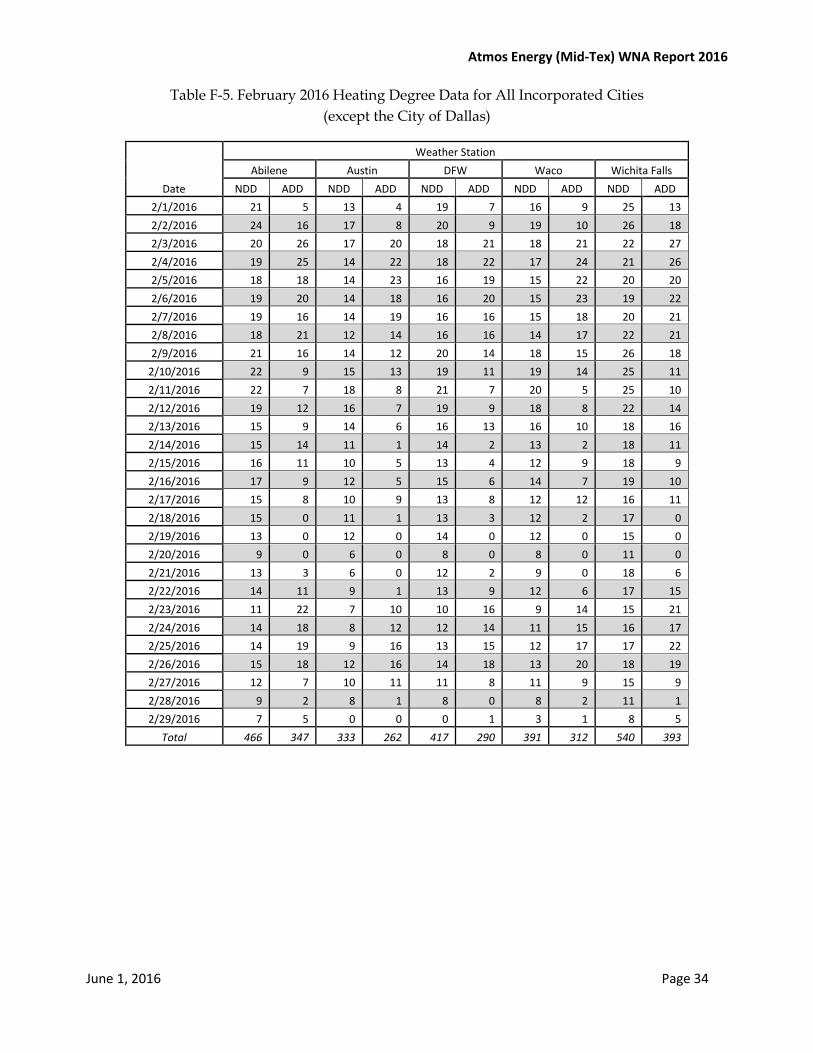
Table F-5. February 2016 Heating Degree Data for All Incorporated Cities (except the City of Dallas)
Date
Weather Station Abilene Austin DFW Waco Wichita Falls
NDD ADD NDD ADD NDD ADD NDD ADD NDD ADD 2/1/2016 21 5 13 4 19 7 16 9 25 13 2/2/2016 24 16 17 8 20 9 19 10 26 18 2/3/2016 20 26 17 20 18 21 18 21 22 27 2/4/2016 19 25 14 22 18 22 17 24 21 26 2/5/2016 18 18 14 23 16 19 15 22 20 20 2/6/2016 19 20 14 18 16 20 15 23 19 22 2/7/2016 19 16 14 19 16 16 15 18 20 21 2/8/2016 18 21 12 14 16 16 14 17 22 21 2/9/2016 21 16 14 12 20 14 18 15 26 18
2/10/2016 22 9 15 13 19 11 19 14 25 11 2/11/2016 22 7 18 8 21 7 20 5 25 10 2/12/2016 19 12 16 7 19 9 18 8 22 14 2/13/2016 15 9 14 6 16 13 16 10 18 16 2/14/2016 15 14 11 1 14 2 13 2 18 11 2/15/2016 16 11 10 5 13 4 12 9 18 9 2/16/2016 17 9 12 5 15 6 14 7 19 10 2/17/2016 15 8 10 9 13 8 12 12 16 11 2/18/2016 15 0 11 1 13 3 12 2 17 0 2/19/2016 13 0 12 0 14 0 12 0 15 0 2/20/2016 9 0 6 0 8 0 8 0 11 0 2/21/2016 13 3 6 0 12 2 9 0 18 6 2/22/2016 14 11 9 1 13 9 12 6 17 15 2/23/2016 11 22 7 10 10 16 9 14 15 21 2/24/2016 14 18 8 12 12 14 11 15 16 17 2/25/2016 14 19 9 16 13 15 12 17 17 22 2/26/2016 15 18 12 16 14 18 13 20 18 19 2/27/2016 12 7 10 11 11 8 11 9 15 9 2/28/2016 9 2 8 1 8 0 8 2 11 1 2/29/2016 7 5 0 0 0 1 3 1 8 5
Total 466 347 333 262 417 290 391 312 540 393
Atmos Energy (Mid-Tex) WNA Report 2016
June 1, 2016 Page 35
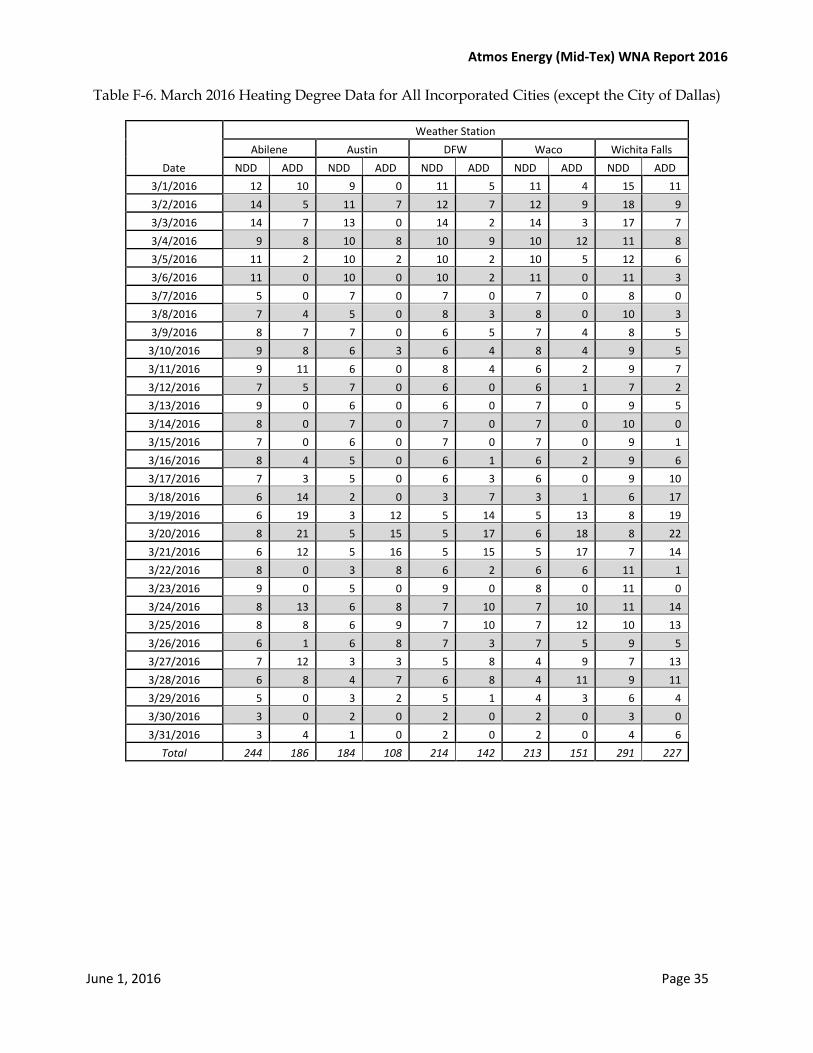
Table F-6. March 2016 Heating Degree Data for All Incorporated Cities (except the City of Dallas)
Date
Weather Station Abilene Austin DFW Waco Wichita Falls
NDD ADD NDD ADD NDD ADD NDD ADD NDD ADD 3/1/2016 12 10 9 0 11 5 11 4 15 11 3/2/2016 14 5 11 7 12 7 12 9 18 9 3/3/2016 14 7 13 0 14 2 14 3 17 7 3/4/2016 9 8 10 8 10 9 10 12 11 8 3/5/2016 11 2 10 2 10 2 10 5 12 6 3/6/2016 11 0 10 0 10 2 11 0 11 3 3/7/2016 5 0 7 0 7 0 7 0 8 0 3/8/2016 7 4 5 0 8 3 8 0 10 3 3/9/2016 8 7 7 0 6 5 7 4 8 5
3/10/2016 9 8 6 3 6 4 8 4 9 5 3/11/2016 9 11 6 0 8 4 6 2 9 7 3/12/2016 7 5 7 0 6 0 6 1 7 2 3/13/2016 9 0 6 0 6 0 7 0 9 5 3/14/2016 8 0 7 0 7 0 7 0 10 0 3/15/2016 7 0 6 0 7 0 7 0 9 1 3/16/2016 8 4 5 0 6 1 6 2 9 6 3/17/2016 7 3 5 0 6 3 6 0 9 10 3/18/2016 6 14 2 0 3 7 3 1 6 17 3/19/2016 6 19 3 12 5 14 5 13 8 19 3/20/2016 8 21 5 15 5 17 6 18 8 22 3/21/2016 6 12 5 16 5 15 5 17 7 14 3/22/2016 8 0 3 8 6 2 6 6 11 1 3/23/2016 9 0 5 0 9 0 8 0 11 0 3/24/2016 8 13 6 8 7 10 7 10 11 14 3/25/2016 8 8 6 9 7 10 7 12 10 13 3/26/2016 6 1 6 8 7 3 7 5 9 5 3/27/2016 7 12 3 3 5 8 4 9 7 13 3/28/2016 6 8 4 7 6 8 4 11 9 11 3/29/2016 5 0 3 2 5 1 4 3 6 4 3/30/2016 3 0 2 0 2 0 2 0 3 0 3/31/2016 3 4 1 0 2 0 2 0 4 6
Total 244 186 184 108 214 142 213 151 291 227

Atmos Energy (Mid-Tex) WNA Report 2016
June 1, 2016 Page 36
Table F-7. April 2016 Heating Degree Data for All Incorporated Cities (except the City of Dallas)
Date
Weather Station Abilene Austin DFW Waco Wichita Falls
NDD ADD NDD ADD NDD ADD NDD ADD NDD ADD 4/1/2016 2 17 1 10 1 6 1 10 2 11 4/2/2016 3 12 1 8 3 7 2 10 5 12 4/3/2016 4 5 3 8 3 5 3 7 5 3 4/4/2016 5 0 3 1 4 0 4 0 7 0 4/5/2016 5 0 4 4 6 0 6 0 8 0 4/6/2016 5 3 3 1 5 0 4 2 7 1 4/7/2016 6 0 4 2 5 0 5 1 6 0 4/8/2016 6 0 4 0 3 0 4 1 6 7 4/9/2016 3 8 3 0 2 2 3 7 4 3
4/10/2016 3 0 1 0 2 0 1 0 4 0 4/11/2016 5 0 2 0 2 0 3 0 5 3 4/12/2016 2 7 2 0 2 0 2 2 4 10 4/13/2016 2 4 2 0 2 7 2 4 4 8 4/14/2016 5 5 4 1 5 0 5 3 6 7 4/15/2016 4 0 3 0 3 0 3 4 4 2 4/16/2016 3 0 4 0 2 0 3 0 3 0 4/17/2016 2 4 1 0 2 0 1 0 4 1 4/18/2016 3 9 1 0 2 0 2 0 4 5 4/19/2016 3 1 2 0 2 0 3 0 3 0 4/20/2016 1 3 1 0 1 0 1 0 3 5 4/21/2016 0 0 0 0 1 0 1 0 1 0 4/22/2016 0 0 0 0 0 0 0 0 0 0 4/23/2016 2 0 0 0 2 0 2 0 2 0 4/24/2016 3 0 2 0 2 0 2 0 3 0 4/25/2016 1 0 0 0 1 0 0 0 2 0 4/26/2016 2 0 0 0 1 0 1 0 3 0 4/27/2016 3 1 1 0 1 0 1 0 3 0 4/28/2016 1 0 1 0 1 0 1 0 1 0 4/29/2016 1 0 0 0 0 0 0 0 1 0 4/30/2016 2 1 1 0 1 0 2 0 1 3
Total 87 80 54 35 67 27 68 51 111 81
Atmos Energy (Mid-Tex) WNA Report 2016
June 1, 2016 Page 37
Appendix G – Heating Degree Day Data for the City of Dallas
Atmos Energy (Mid-Tex) WNA Report 2016
June 1, 2016 Page 38
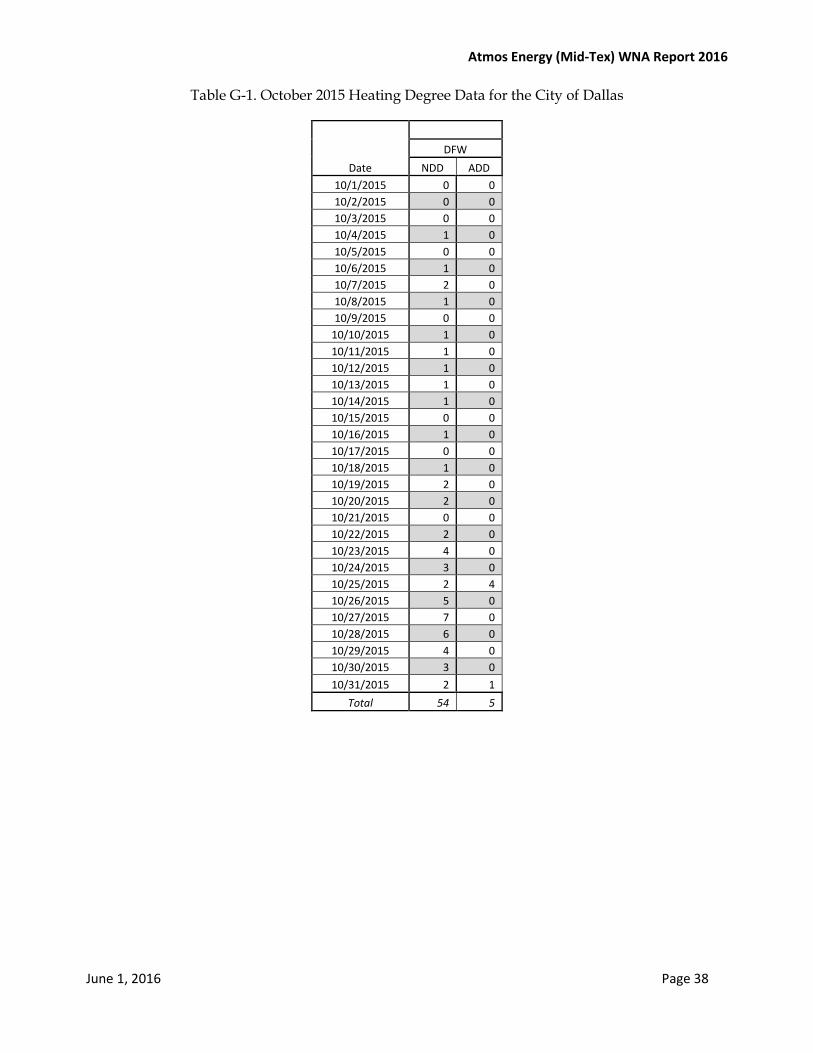
Table G-1. October 2015 Heating Degree Data for the City of Dallas
Date
DFW
NDD ADD 10/1/2015 0 0 10/2/2015 0 0 10/3/2015 0 0 10/4/2015 1 0 10/5/2015 0 0 10/6/2015 1 0 10/7/2015 2 0 10/8/2015 1 0 10/9/2015 0 0
10/10/2015 1 0 10/11/2015 1 0 10/12/2015 1 0 10/13/2015 1 0 10/14/2015 1 0 10/15/2015 0 0 10/16/2015 1 0 10/17/2015 0 0 10/18/2015 1 0 10/19/2015 2 0 10/20/2015 2 0 10/21/2015 0 0 10/22/2015 2 0 10/23/2015 4 0 10/24/2015 3 0 10/25/2015 2 4 10/26/2015 5 0 10/27/2015 7 0 10/28/2015 6 0 10/29/2015 4 0 10/30/2015 3 0 10/31/2015 2 1
Total 54 5
Atmos Energy (Mid-Tex) WNA Report 2016
June 1, 2016 Page 39
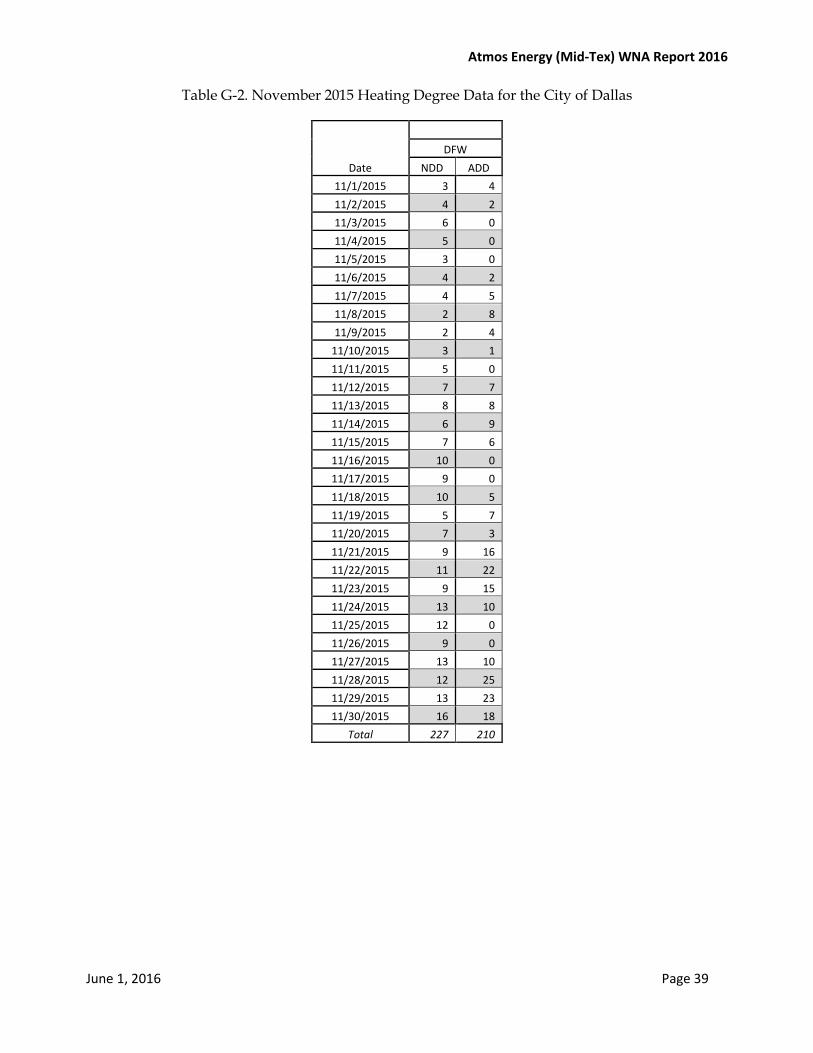
Table G-2. November 2015 Heating Degree Data for the City of Dallas
Date
DFW
NDD ADD 11/1/2015 3 4 11/2/2015 4 2 11/3/2015 6 0 11/4/2015 5 0 11/5/2015 3 0 11/6/2015 4 2 11/7/2015 4 5 11/8/2015 2 8 11/9/2015 2 4
11/10/2015 3 1 11/11/2015 5 0 11/12/2015 7 7 11/13/2015 8 8 11/14/2015 6 9 11/15/2015 7 6 11/16/2015 10 0 11/17/2015 9 0 11/18/2015 10 5 11/19/2015 5 7 11/20/2015 7 3 11/21/2015 9 16 11/22/2015 11 22 11/23/2015 9 15 11/24/2015 13 10 11/25/2015 12 0 11/26/2015 9 0 11/27/2015 13 10 11/28/2015 12 25 11/29/2015 13 23 11/30/2015 16 18
Total 227 210
Atmos Energy (Mid-Tex) WNA Report 2016
June 1, 2016 Page 40
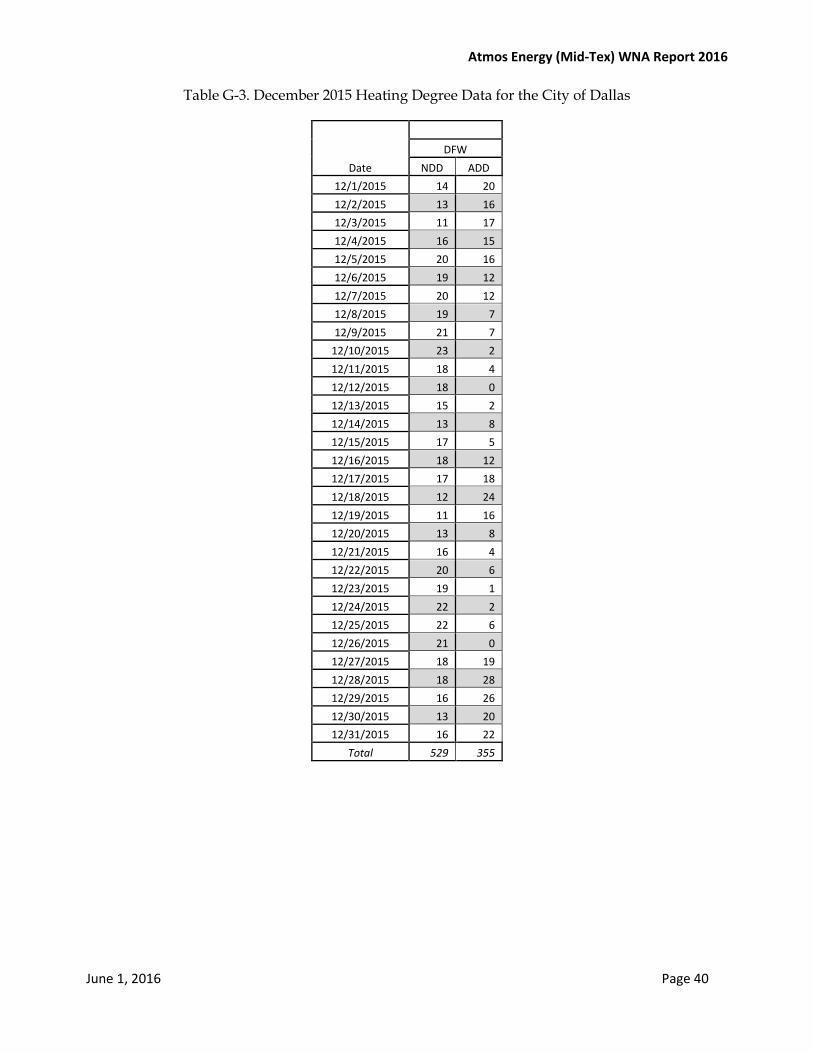
Table G-3. December 2015 Heating Degree Data for the City of Dallas
Date
DFW
NDD ADD 12/1/2015 14 20 12/2/2015 13 16 12/3/2015 11 17 12/4/2015 16 15 12/5/2015 20 16 12/6/2015 19 12 12/7/2015 20 12 12/8/2015 19 7 12/9/2015 21 7
12/10/2015 23 2 12/11/2015 18 4 12/12/2015 18 0 12/13/2015 15 2 12/14/2015 13 8 12/15/2015 17 5 12/16/2015 18 12 12/17/2015 17 18 12/18/2015 12 24 12/19/2015 11 16 12/20/2015 13 8 12/21/2015 16 4 12/22/2015 20 6 12/23/2015 19 1 12/24/2015 22 2 12/25/2015 22 6 12/26/2015 21 0 12/27/2015 18 19 12/28/2015 18 28 12/29/2015 16 26 12/30/2015 13 20 12/31/2015 16 22
Total 529 355
Atmos Energy (Mid-Tex) WNA Report 2016
June 1, 2016 Page 41
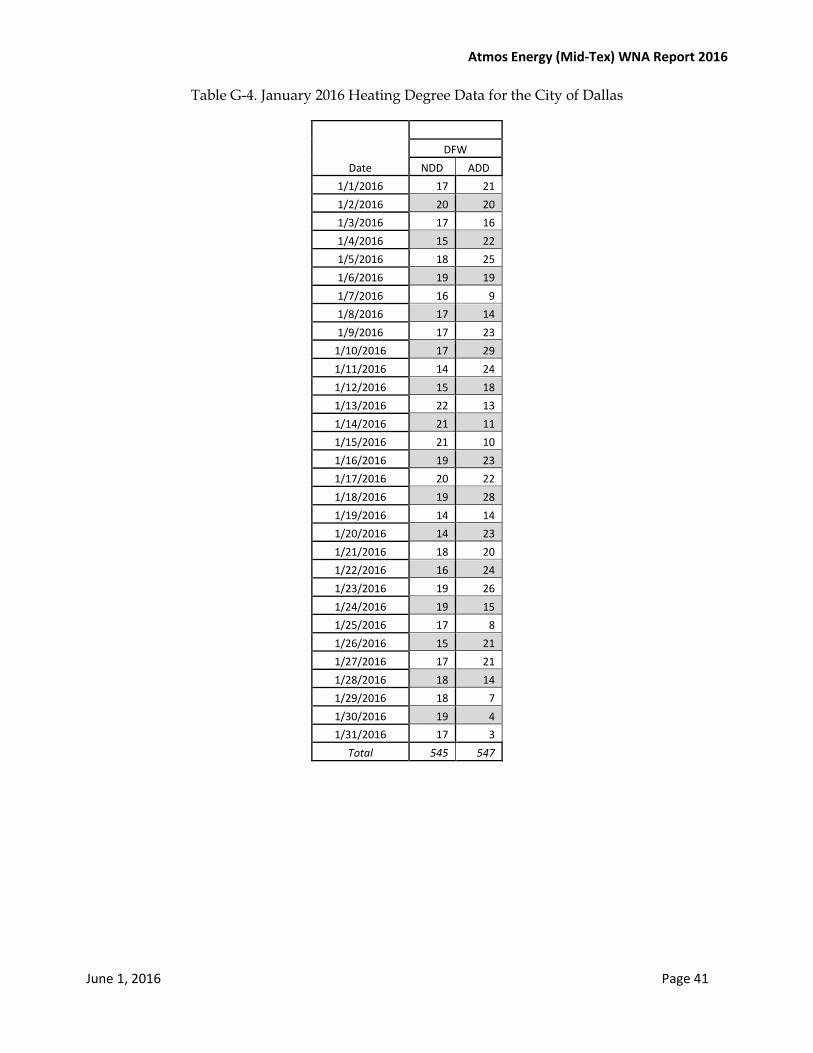
Table G-4. January 2016 Heating Degree Data for the City of Dallas
Date
DFW
NDD ADD 1/1/2016 17 21 1/2/2016 20 20 1/3/2016 17 16 1/4/2016 15 22 1/5/2016 18 25 1/6/2016 19 19 1/7/2016 16 9 1/8/2016 17 14 1/9/2016 17 23
1/10/2016 17 29 1/11/2016 14 24 1/12/2016 15 18 1/13/2016 22 13 1/14/2016 21 11 1/15/2016 21 10 1/16/2016 19 23 1/17/2016 20 22 1/18/2016 19 28 1/19/2016 14 14 1/20/2016 14 23 1/21/2016 18 20 1/22/2016 16 24 1/23/2016 19 26 1/24/2016 19 15 1/25/2016 17 8 1/26/2016 15 21 1/27/2016 17 21 1/28/2016 18 14 1/29/2016 18 7 1/30/2016 19 4 1/31/2016 17 3
Total 545 547
Atmos Energy (Mid-Tex) WNA Report 2016
June 1, 2016 Page 42
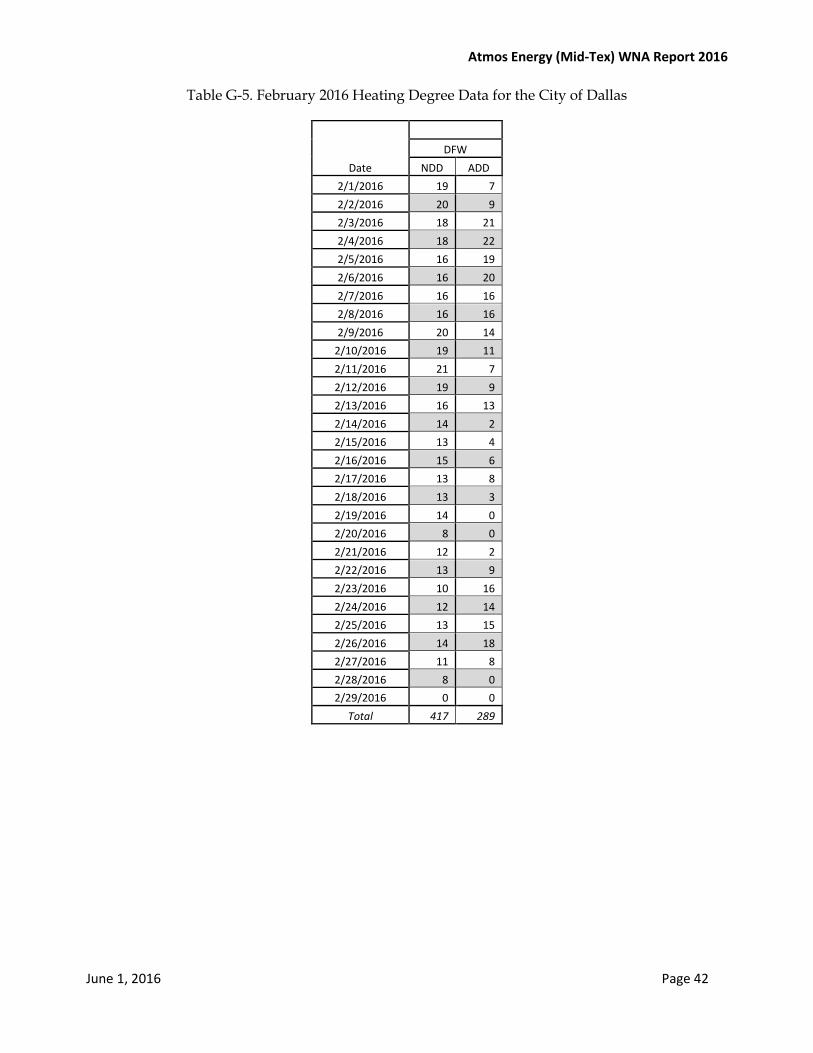
Table G-5. February 2016 Heating Degree Data for the City of Dallas
Date
DFW
NDD ADD 2/1/2016 19 7 2/2/2016 20 9 2/3/2016 18 21 2/4/2016 18 22 2/5/2016 16 19 2/6/2016 16 20 2/7/2016 16 16 2/8/2016 16 16 2/9/2016 20 14
2/10/2016 19 11 2/11/2016 21 7 2/12/2016 19 9 2/13/2016 16 13 2/14/2016 14 2 2/15/2016 13 4 2/16/2016 15 6 2/17/2016 13 8 2/18/2016 13 3 2/19/2016 14 0 2/20/2016 8 0 2/21/2016 12 2 2/22/2016 13 9 2/23/2016 10 16 2/24/2016 12 14 2/25/2016 13 15 2/26/2016 14 18 2/27/2016 11 8 2/28/2016 8 0 2/29/2016 0 0
Total 417 289

Atmos Energy (Mid-Tex) WNA Report 2016
June 1, 2016 Page 43
Table G-6. March 2016 Heating Degree Data for the City of Dallas
Date
DFW
NDD ADD 3/1/2016 11 5 3/2/2016 12 7 3/3/2016 14 2 3/4/2016 10 9 3/5/2016 10 2 3/6/2016 10 2 3/7/2016 7 0 3/8/2016 8 3 3/9/2016 6 5
3/10/2016 6 4 3/11/2016 8 4 3/12/2016 6 0 3/13/2016 6 0 3/14/2016 7 0 3/15/2016 7 0 3/16/2016 6 1 3/17/2016 6 3 3/18/2016 3 7 3/19/2016 5 14 3/20/2016 5 17 3/21/2016 5 15 3/22/2016 6 2 3/23/2016 9 0 3/24/2016 7 10 3/25/2016 7 10 3/26/2016 7 3 3/27/2016 5 8 3/28/2016 6 8 3/29/2016 5 1 3/30/2016 2 0 3/31/2016 2 0
Total 214 142
Atmos Energy (Mid-Tex) WNA Report 2016
June 1, 2016 Page 44
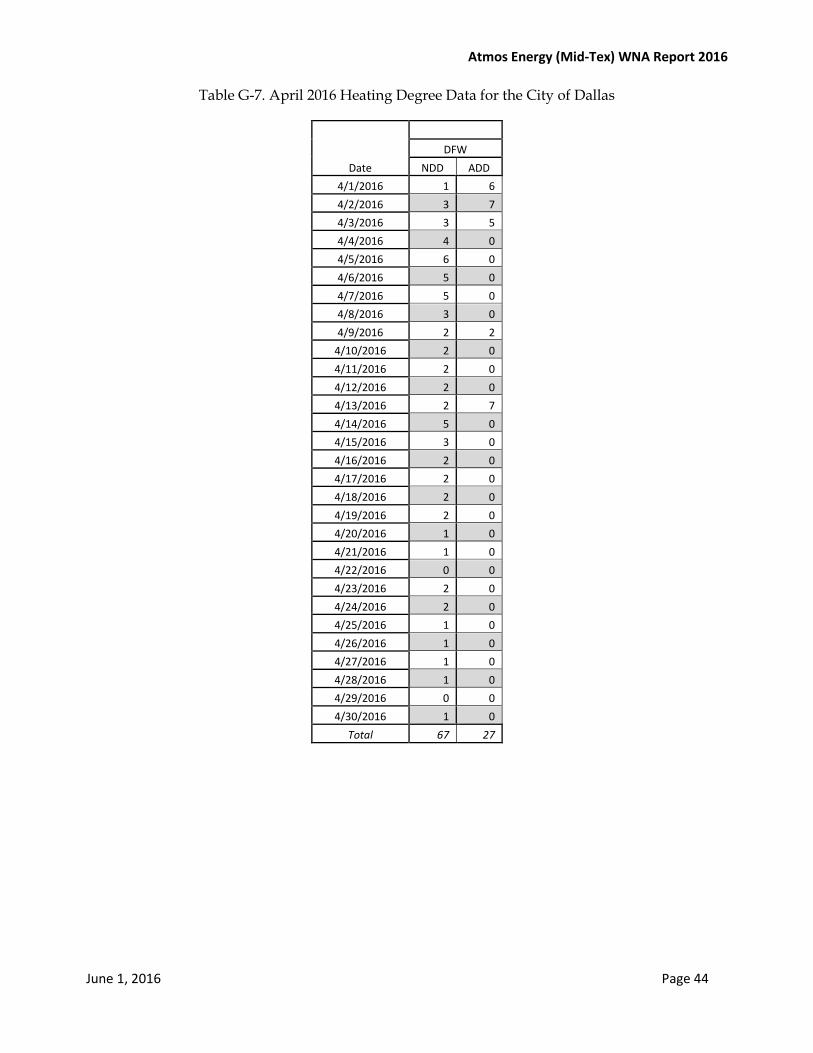
Table G-7. April 2016 Heating Degree Data for the City of Dallas
Date
DFW
NDD ADD 4/1/2016 1 6 4/2/2016 3 7 4/3/2016 3 5 4/4/2016 4 0 4/5/2016 6 0 4/6/2016 5 0 4/7/2016 5 0 4/8/2016 3 0 4/9/2016 2 2
4/10/2016 2 0 4/11/2016 2 0 4/12/2016 2 0 4/13/2016 2 7 4/14/2016 5 0 4/15/2016 3 0 4/16/2016 2 0 4/17/2016 2 0 4/18/2016 2 0 4/19/2016 2 0 4/20/2016 1 0 4/21/2016 1 0 4/22/2016 0 0 4/23/2016 2 0 4/24/2016 2 0 4/25/2016 1 0 4/26/2016 1 0 4/27/2016 1 0 4/28/2016 1 0 4/29/2016 0 0 4/30/2016 1 0
Total 67 27
Atmos Energy (Mid-Tex) WNA Report 2016
June 1, 2016 Page 45
Appendix H – Heating Degree Data for Unincorporated Areas
Atmos Energy (Mid-Tex) WNA Report 2016
June 1, 2016 Page 46
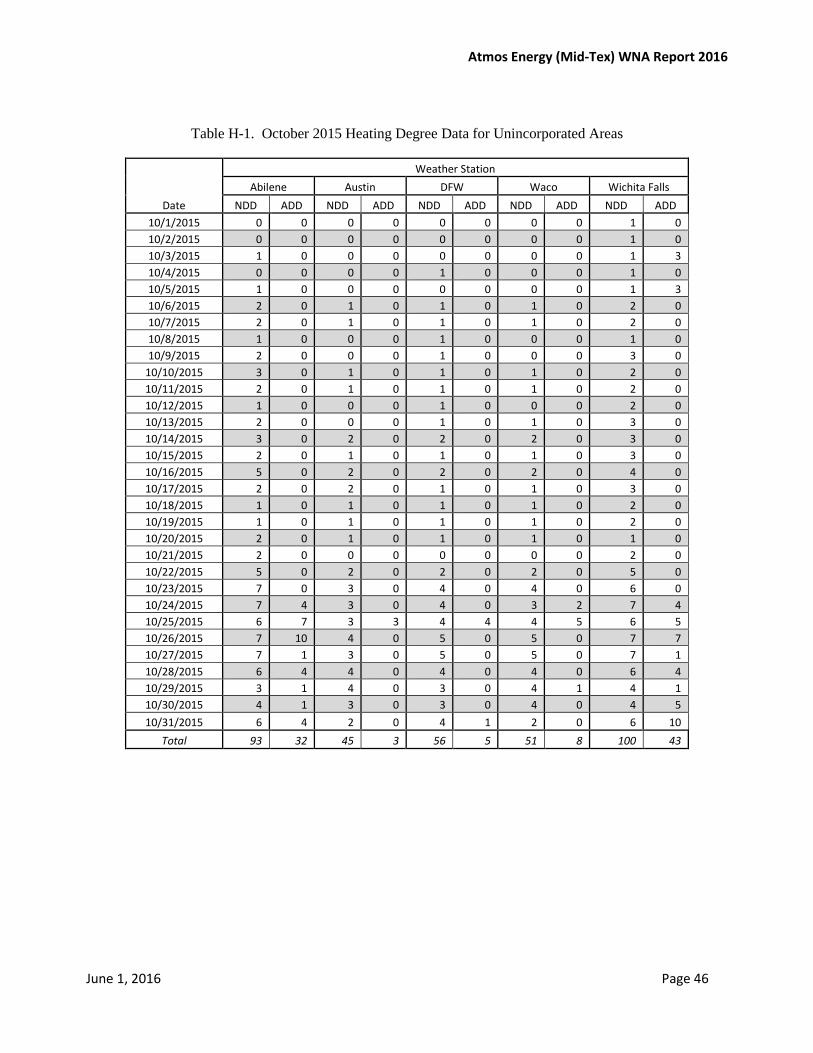
Table H-1. October 2015 Heating Degree Data for Unincorporated Areas
Date
Weather Station Abilene Austin DFW Waco Wichita Falls
NDD ADD NDD ADD NDD ADD NDD ADD NDD ADD 10/1/2015 0 0 0 0 0 0 0 0 1 0 10/2/2015 0 0 0 0 0 0 0 0 1 0 10/3/2015 1 0 0 0 0 0 0 0 1 3 10/4/2015 0 0 0 0 1 0 0 0 1 0 10/5/2015 1 0 0 0 0 0 0 0 1 3 10/6/2015 2 0 1 0 1 0 1 0 2 0 10/7/2015 2 0 1 0 1 0 1 0 2 0 10/8/2015 1 0 0 0 1 0 0 0 1 0 10/9/2015 2 0 0 0 1 0 0 0 3 0
10/10/2015 3 0 1 0 1 0 1 0 2 0 10/11/2015 2 0 1 0 1 0 1 0 2 0 10/12/2015 1 0 0 0 1 0 0 0 2 0 10/13/2015 2 0 0 0 1 0 1 0 3 0 10/14/2015 3 0 2 0 2 0 2 0 3 0 10/15/2015 2 0 1 0 1 0 1 0 3 0 10/16/2015 5 0 2 0 2 0 2 0 4 0 10/17/2015 2 0 2 0 1 0 1 0 3 0 10/18/2015 1 0 1 0 1 0 1 0 2 0 10/19/2015 1 0 1 0 1 0 1 0 2 0 10/20/2015 2 0 1 0 1 0 1 0 1 0 10/21/2015 2 0 0 0 0 0 0 0 2 0 10/22/2015 5 0 2 0 2 0 2 0 5 0 10/23/2015 7 0 3 0 4 0 4 0 6 0 10/24/2015 7 4 3 0 4 0 3 2 7 4 10/25/2015 6 7 3 3 4 4 4 5 6 5 10/26/2015 7 10 4 0 5 0 5 0 7 7 10/27/2015 7 1 3 0 5 0 5 0 7 1 10/28/2015 6 4 4 0 4 0 4 0 6 4 10/29/2015 3 1 4 0 3 0 4 1 4 1 10/30/2015 4 1 3 0 3 0 4 0 4 5 10/31/2015 6 4 2 0 4 1 2 0 6 10
Total 93 32 45 3 56 5 51 8 100 43
Atmos Energy (Mid-Tex) WNA Report 2016
June 1, 2016 Page 47
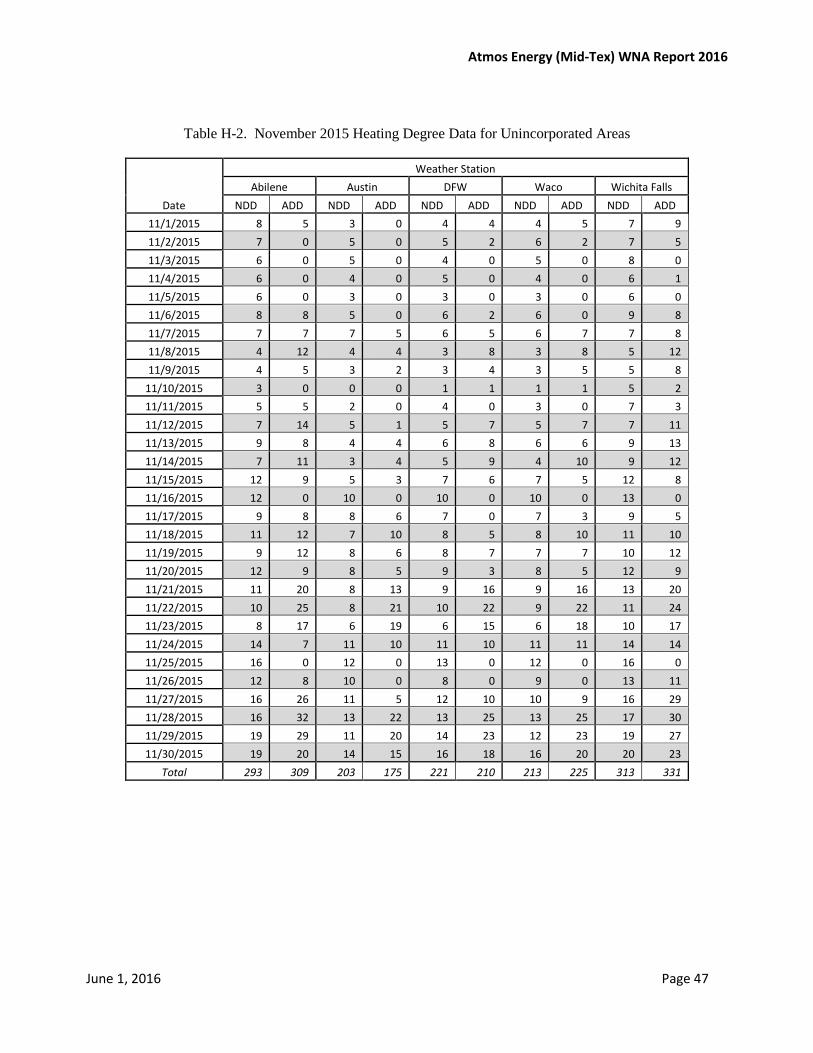
Table H-2. November 2015 Heating Degree Data for Unincorporated Areas
Date
Weather Station Abilene Austin DFW Waco Wichita Falls
NDD ADD NDD ADD NDD ADD NDD ADD NDD ADD 11/1/2015 8 5 3 0 4 4 4 5 7 9 11/2/2015 7 0 5 0 5 2 6 2 7 5 11/3/2015 6 0 5 0 4 0 5 0 8 0 11/4/2015 6 0 4 0 5 0 4 0 6 1 11/5/2015 6 0 3 0 3 0 3 0 6 0 11/6/2015 8 8 5 0 6 2 6 0 9 8 11/7/2015 7 7 7 5 6 5 6 7 7 8 11/8/2015 4 12 4 4 3 8 3 8 5 12 11/9/2015 4 5 3 2 3 4 3 5 5 8
11/10/2015 3 0 0 0 1 1 1 1 5 2 11/11/2015 5 5 2 0 4 0 3 0 7 3 11/12/2015 7 14 5 1 5 7 5 7 7 11 11/13/2015 9 8 4 4 6 8 6 6 9 13 11/14/2015 7 11 3 4 5 9 4 10 9 12 11/15/2015 12 9 5 3 7 6 7 5 12 8 11/16/2015 12 0 10 0 10 0 10 0 13 0 11/17/2015 9 8 8 6 7 0 7 3 9 5 11/18/2015 11 12 7 10 8 5 8 10 11 10 11/19/2015 9 12 8 6 8 7 7 7 10 12 11/20/2015 12 9 8 5 9 3 8 5 12 9 11/21/2015 11 20 8 13 9 16 9 16 13 20 11/22/2015 10 25 8 21 10 22 9 22 11 24 11/23/2015 8 17 6 19 6 15 6 18 10 17 11/24/2015 14 7 11 10 11 10 11 11 14 14 11/25/2015 16 0 12 0 13 0 12 0 16 0 11/26/2015 12 8 10 0 8 0 9 0 13 11 11/27/2015 16 26 11 5 12 10 10 9 16 29 11/28/2015 16 32 13 22 13 25 13 25 17 30 11/29/2015 19 29 11 20 14 23 12 23 19 27 11/30/2015 19 20 14 15 16 18 16 20 20 23
Total 293 309 203 175 221 210 213 225 313 331
Atmos Energy (Mid-Tex) WNA Report 2016
June 1, 2016 Page 48
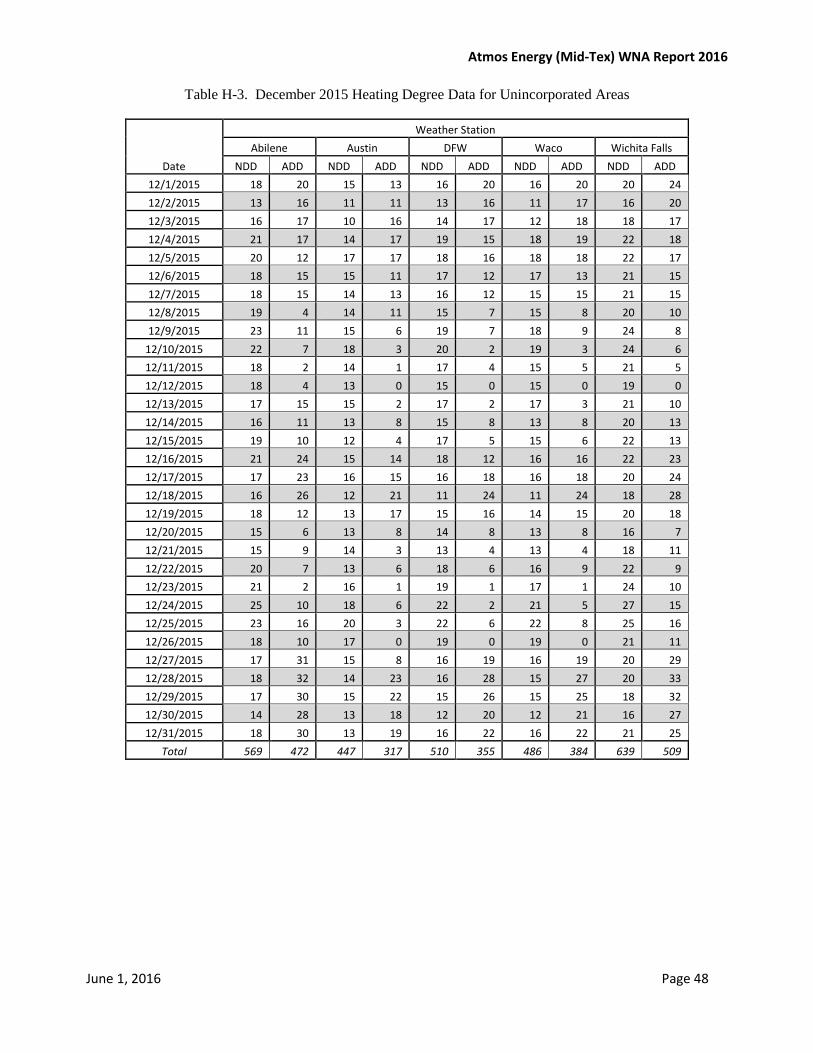
Table H-3. December 2015 Heating Degree Data for Unincorporated Areas
Date
Weather Station Abilene Austin DFW Waco Wichita Falls
NDD ADD NDD ADD NDD ADD NDD ADD NDD ADD 12/1/2015 18 20 15 13 16 20 16 20 20 24 12/2/2015 13 16 11 11 13 16 11 17 16 20 12/3/2015 16 17 10 16 14 17 12 18 18 17 12/4/2015 21 17 14 17 19 15 18 19 22 18 12/5/2015 20 12 17 17 18 16 18 18 22 17 12/6/2015 18 15 15 11 17 12 17 13 21 15 12/7/2015 18 15 14 13 16 12 15 15 21 15 12/8/2015 19 4 14 11 15 7 15 8 20 10 12/9/2015 23 11 15 6 19 7 18 9 24 8
12/10/2015 22 7 18 3 20 2 19 3 24 6 12/11/2015 18 2 14 1 17 4 15 5 21 5 12/12/2015 18 4 13 0 15 0 15 0 19 0 12/13/2015 17 15 15 2 17 2 17 3 21 10 12/14/2015 16 11 13 8 15 8 13 8 20 13 12/15/2015 19 10 12 4 17 5 15 6 22 13 12/16/2015 21 24 15 14 18 12 16 16 22 23 12/17/2015 17 23 16 15 16 18 16 18 20 24 12/18/2015 16 26 12 21 11 24 11 24 18 28 12/19/2015 18 12 13 17 15 16 14 15 20 18 12/20/2015 15 6 13 8 14 8 13 8 16 7 12/21/2015 15 9 14 3 13 4 13 4 18 11 12/22/2015 20 7 13 6 18 6 16 9 22 9 12/23/2015 21 2 16 1 19 1 17 1 24 10 12/24/2015 25 10 18 6 22 2 21 5 27 15 12/25/2015 23 16 20 3 22 6 22 8 25 16 12/26/2015 18 10 17 0 19 0 19 0 21 11 12/27/2015 17 31 15 8 16 19 16 19 20 29 12/28/2015 18 32 14 23 16 28 15 27 20 33 12/29/2015 17 30 15 22 15 26 15 25 18 32 12/30/2015 14 28 13 18 12 20 12 21 16 27 12/31/2015 18 30 13 19 16 22 16 22 21 25
Total 569 472 447 317 510 355 486 384 639 509
Atmos Energy (Mid-Tex) WNA Report 2016
June 1, 2016 Page 49
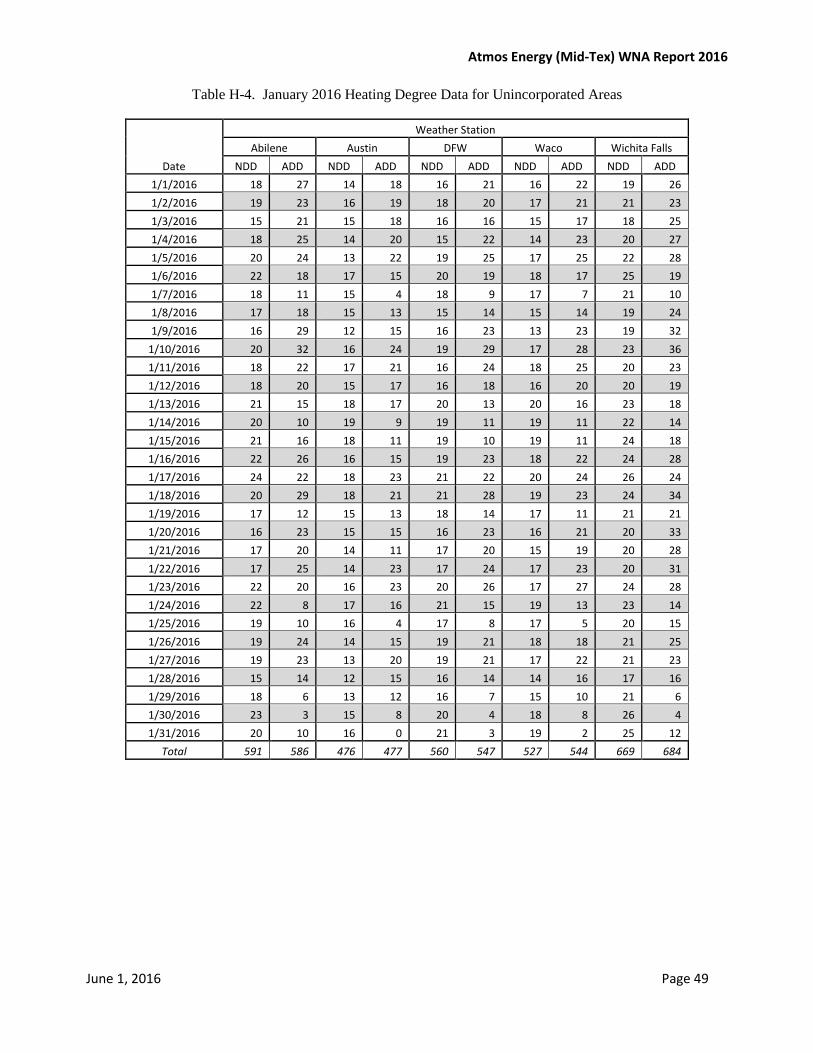
Table H-4. January 2016 Heating Degree Data for Unincorporated Areas
Date
Weather Station Abilene Austin DFW Waco Wichita Falls
NDD ADD NDD ADD NDD ADD NDD ADD NDD ADD 1/1/2016 18 27 14 18 16 21 16 22 19 26 1/2/2016 19 23 16 19 18 20 17 21 21 23 1/3/2016 15 21 15 18 16 16 15 17 18 25 1/4/2016 18 25 14 20 15 22 14 23 20 27 1/5/2016 20 24 13 22 19 25 17 25 22 28 1/6/2016 22 18 17 15 20 19 18 17 25 19 1/7/2016 18 11 15 4 18 9 17 7 21 10 1/8/2016 17 18 15 13 15 14 15 14 19 24 1/9/2016 16 29 12 15 16 23 13 23 19 32
1/10/2016 20 32 16 24 19 29 17 28 23 36 1/11/2016 18 22 17 21 16 24 18 25 20 23 1/12/2016 18 20 15 17 16 18 16 20 20 19 1/13/2016 21 15 18 17 20 13 20 16 23 18 1/14/2016 20 10 19 9 19 11 19 11 22 14 1/15/2016 21 16 18 11 19 10 19 11 24 18 1/16/2016 22 26 16 15 19 23 18 22 24 28 1/17/2016 24 22 18 23 21 22 20 24 26 24 1/18/2016 20 29 18 21 21 28 19 23 24 34 1/19/2016 17 12 15 13 18 14 17 11 21 21 1/20/2016 16 23 15 15 16 23 16 21 20 33 1/21/2016 17 20 14 11 17 20 15 19 20 28 1/22/2016 17 25 14 23 17 24 17 23 20 31 1/23/2016 22 20 16 23 20 26 17 27 24 28 1/24/2016 22 8 17 16 21 15 19 13 23 14 1/25/2016 19 10 16 4 17 8 17 5 20 15 1/26/2016 19 24 14 15 19 21 18 18 21 25 1/27/2016 19 23 13 20 19 21 17 22 21 23 1/28/2016 15 14 12 15 16 14 14 16 17 16 1/29/2016 18 6 13 12 16 7 15 10 21 6 1/30/2016 23 3 15 8 20 4 18 8 26 4 1/31/2016 20 10 16 0 21 3 19 2 25 12
Total 591 586 476 477 560 547 527 544 669 684
Atmos Energy (Mid-Tex) WNA Report 2016
June 1, 2016 Page 50
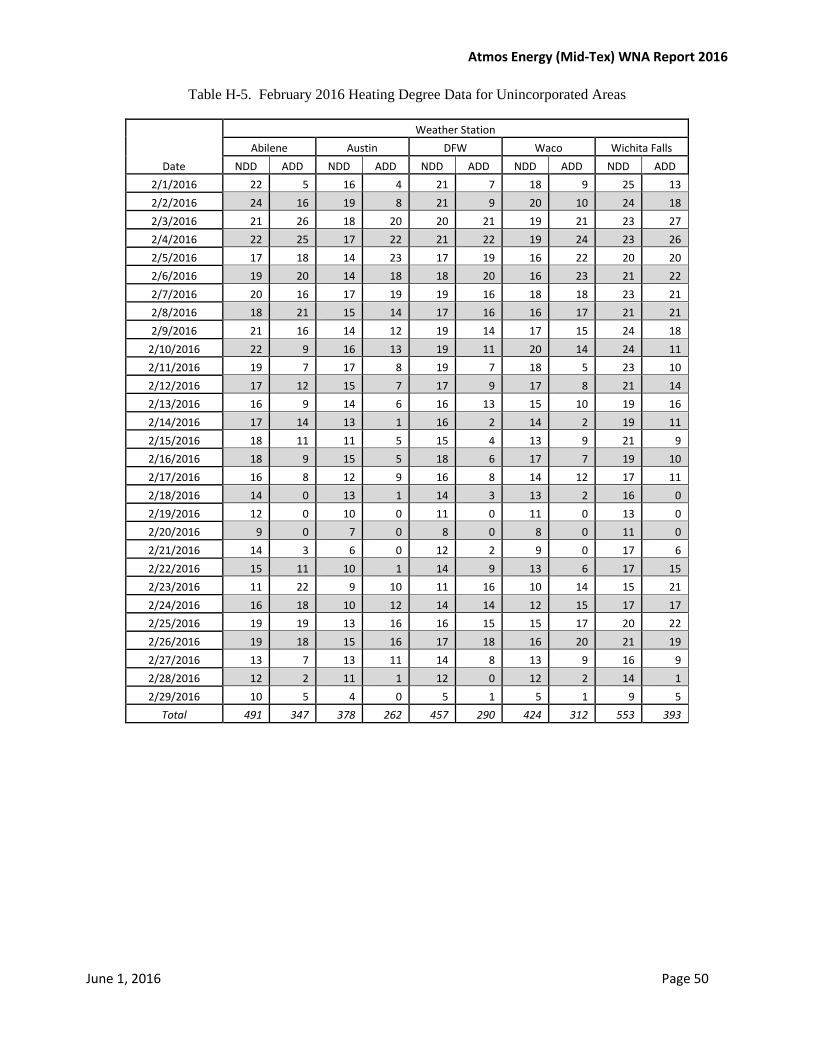
Table H-5. February 2016 Heating Degree Data for Unincorporated Areas
Date
Weather Station Abilene Austin DFW Waco Wichita Falls
NDD ADD NDD ADD NDD ADD NDD ADD NDD ADD 2/1/2016 22 5 16 4 21 7 18 9 25 13 2/2/2016 24 16 19 8 21 9 20 10 24 18 2/3/2016 21 26 18 20 20 21 19 21 23 27 2/4/2016 22 25 17 22 21 22 19 24 23 26 2/5/2016 17 18 14 23 17 19 16 22 20 20 2/6/2016 19 20 14 18 18 20 16 23 21 22 2/7/2016 20 16 17 19 19 16 18 18 23 21 2/8/2016 18 21 15 14 17 16 16 17 21 21 2/9/2016 21 16 14 12 19 14 17 15 24 18
2/10/2016 22 9 16 13 19 11 20 14 24 11 2/11/2016 19 7 17 8 19 7 18 5 23 10 2/12/2016 17 12 15 7 17 9 17 8 21 14 2/13/2016 16 9 14 6 16 13 15 10 19 16 2/14/2016 17 14 13 1 16 2 14 2 19 11 2/15/2016 18 11 11 5 15 4 13 9 21 9 2/16/2016 18 9 15 5 18 6 17 7 19 10 2/17/2016 16 8 12 9 16 8 14 12 17 11 2/18/2016 14 0 13 1 14 3 13 2 16 0 2/19/2016 12 0 10 0 11 0 11 0 13 0 2/20/2016 9 0 7 0 8 0 8 0 11 0 2/21/2016 14 3 6 0 12 2 9 0 17 6 2/22/2016 15 11 10 1 14 9 13 6 17 15 2/23/2016 11 22 9 10 11 16 10 14 15 21 2/24/2016 16 18 10 12 14 14 12 15 17 17 2/25/2016 19 19 13 16 16 15 15 17 20 22 2/26/2016 19 18 15 16 17 18 16 20 21 19 2/27/2016 13 7 13 11 14 8 13 9 16 9 2/28/2016 12 2 11 1 12 0 12 2 14 1 2/29/2016 10 5 4 0 5 1 5 1 9 5
Total 491 347 378 262 457 290 424 312 553 393
Atmos Energy (Mid-Tex) WNA Report 2016
June 1, 2016 Page 51
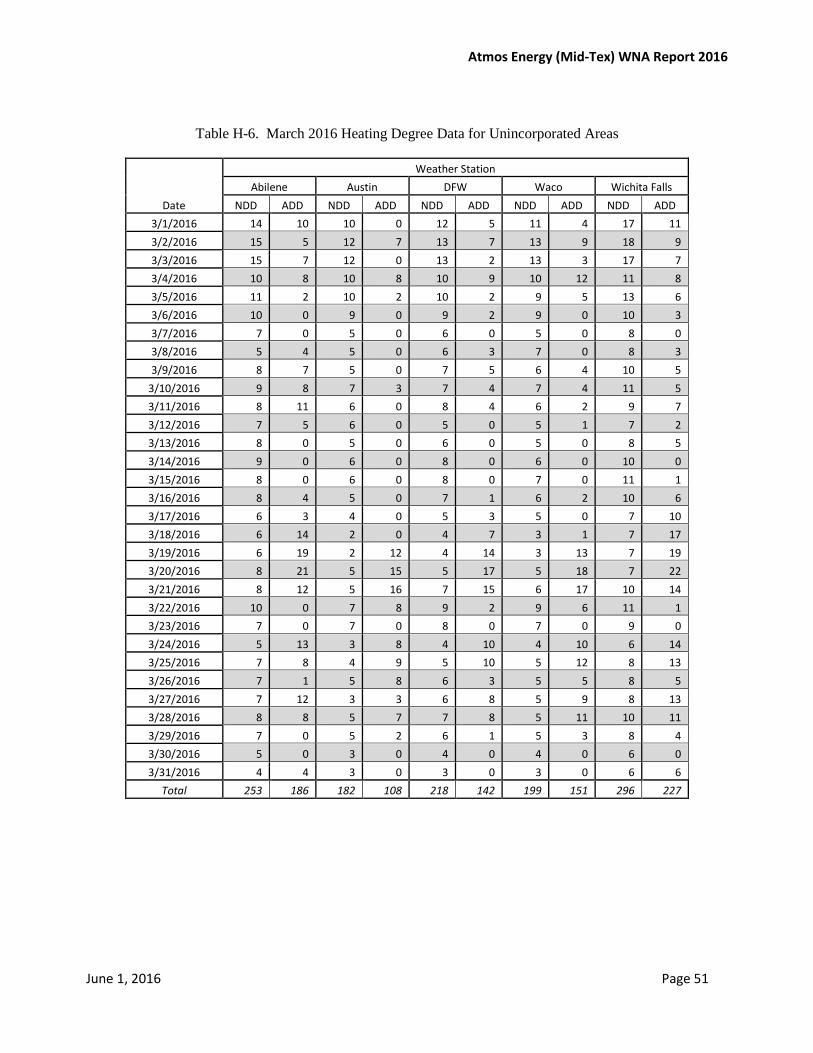
Table H-6. March 2016 Heating Degree Data for Unincorporated Areas
Date
Weather Station Abilene Austin DFW Waco Wichita Falls
NDD ADD NDD ADD NDD ADD NDD ADD NDD ADD 3/1/2016 14 10 10 0 12 5 11 4 17 11 3/2/2016 15 5 12 7 13 7 13 9 18 9 3/3/2016 15 7 12 0 13 2 13 3 17 7 3/4/2016 10 8 10 8 10 9 10 12 11 8 3/5/2016 11 2 10 2 10 2 9 5 13 6 3/6/2016 10 0 9 0 9 2 9 0 10 3 3/7/2016 7 0 5 0 6 0 5 0 8 0 3/8/2016 5 4 5 0 6 3 7 0 8 3 3/9/2016 8 7 5 0 7 5 6 4 10 5
3/10/2016 9 8 7 3 7 4 7 4 11 5 3/11/2016 8 11 6 0 8 4 6 2 9 7 3/12/2016 7 5 6 0 5 0 5 1 7 2 3/13/2016 8 0 5 0 6 0 5 0 8 5 3/14/2016 9 0 6 0 8 0 6 0 10 0 3/15/2016 8 0 6 0 8 0 7 0 11 1 3/16/2016 8 4 5 0 7 1 6 2 10 6 3/17/2016 6 3 4 0 5 3 5 0 7 10 3/18/2016 6 14 2 0 4 7 3 1 7 17 3/19/2016 6 19 2 12 4 14 3 13 7 19 3/20/2016 8 21 5 15 5 17 5 18 7 22 3/21/2016 8 12 5 16 7 15 6 17 10 14 3/22/2016 10 0 7 8 9 2 9 6 11 1 3/23/2016 7 0 7 0 8 0 7 0 9 0 3/24/2016 5 13 3 8 4 10 4 10 6 14 3/25/2016 7 8 4 9 5 10 5 12 8 13 3/26/2016 7 1 5 8 6 3 5 5 8 5 3/27/2016 7 12 3 3 6 8 5 9 8 13 3/28/2016 8 8 5 7 7 8 5 11 10 11 3/29/2016 7 0 5 2 6 1 5 3 8 4 3/30/2016 5 0 3 0 4 0 4 0 6 0 3/31/2016 4 4 3 0 3 0 3 0 6 6
Total 253 186 182 108 218 142 199 151 296 227
Atmos Energy (Mid-Tex) WNA Report 2016
June 1, 2016 Page 52
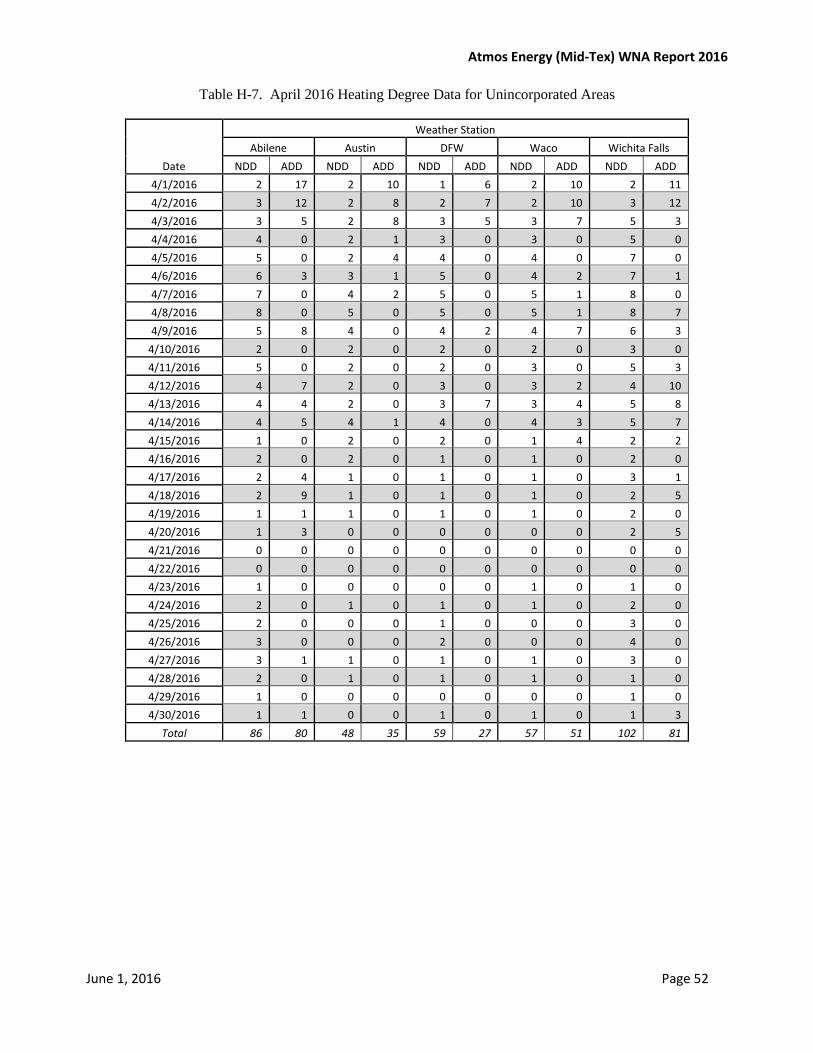
Table H-7. April 2016 Heating Degree Data for Unincorporated Areas
Date
Weather Station Abilene Austin DFW Waco Wichita Falls
NDD ADD NDD ADD NDD ADD NDD ADD NDD ADD 4/1/2016 2 17 2 10 1 6 2 10 2 11 4/2/2016 3 12 2 8 2 7 2 10 3 12 4/3/2016 3 5 2 8 3 5 3 7 5 3 4/4/2016 4 0 2 1 3 0 3 0 5 0 4/5/2016 5 0 2 4 4 0 4 0 7 0 4/6/2016 6 3 3 1 5 0 4 2 7 1 4/7/2016 7 0 4 2 5 0 5 1 8 0 4/8/2016 8 0 5 0 5 0 5 1 8 7 4/9/2016 5 8 4 0 4 2 4 7 6 3
4/10/2016 2 0 2 0 2 0 2 0 3 0 4/11/2016 5 0 2 0 2 0 3 0 5 3 4/12/2016 4 7 2 0 3 0 3 2 4 10 4/13/2016 4 4 2 0 3 7 3 4 5 8 4/14/2016 4 5 4 1 4 0 4 3 5 7 4/15/2016 1 0 2 0 2 0 1 4 2 2 4/16/2016 2 0 2 0 1 0 1 0 2 0 4/17/2016 2 4 1 0 1 0 1 0 3 1 4/18/2016 2 9 1 0 1 0 1 0 2 5 4/19/2016 1 1 1 0 1 0 1 0 2 0 4/20/2016 1 3 0 0 0 0 0 0 2 5 4/21/2016 0 0 0 0 0 0 0 0 0 0 4/22/2016 0 0 0 0 0 0 0 0 0 0 4/23/2016 1 0 0 0 0 0 1 0 1 0 4/24/2016 2 0 1 0 1 0 1 0 2 0 4/25/2016 2 0 0 0 1 0 0 0 3 0 4/26/2016 3 0 0 0 2 0 0 0 4 0 4/27/2016 3 1 1 0 1 0 1 0 3 0 4/28/2016 2 0 1 0 1 0 1 0 1 0 4/29/2016 1 0 0 0 0 0 0 0 1 0 4/30/2016 1 1 0 0 1 0 1 0 1 3
Total 86 80 48 35 59 27 57 51 102 81
Atmos Energy (Mid-Tex) WNA Report 2016
June 1, 2016 Page 53
Appendix I – Rider WNA Calculation Instructions
Atmos Energy (Mid-Tex) WNA Report 2016
June 1, 2016 Page 54
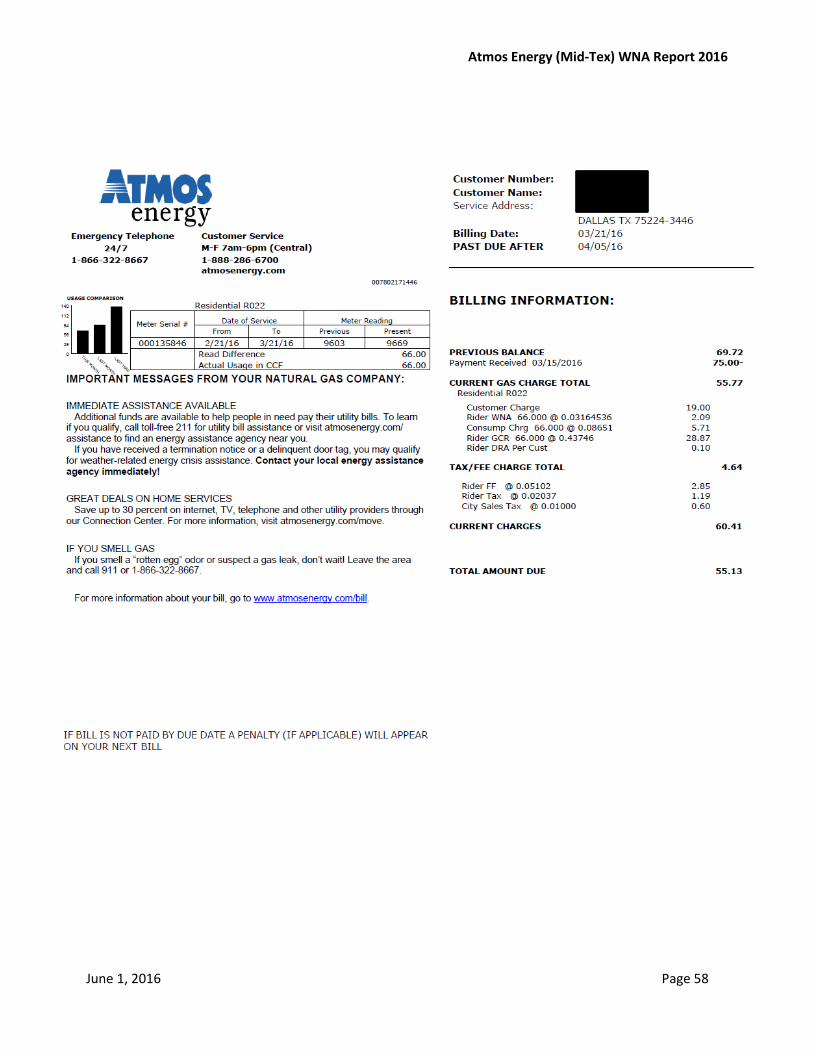
Step 1. Get copy of Atmos Energy bill in question
Before calculating your Rider WNA adjustment, you will need a copy of your Atmos Energy bill in question. If you don’t already have a copy of your bill, you can retrieve a copy from the Atmos Energy Account Center at atmosenergy.com. If you have already registered your account online, just click the login button in the upper left corner of the screen. If you have not registered your account online, now is a great time to do so. Just click register.
If the bill is for a residential or commercial customer and is from a billing period between November 2015 and April 2016, it should include a Rider WNA line under “Current Gas Charge Total”. This report will assist you in verifying this Rider WNA adjustment amount.
Step 2. Identify weather station
Next identify which weather station applies for the city where your gas meter is located. You can find this in Appendix A. Simply look for your city in the first column. Once you find your city, note the weather station listed in the second column. It will be one of the following: Abilene, Austin, DFW, Waco, or Wichita Falls.
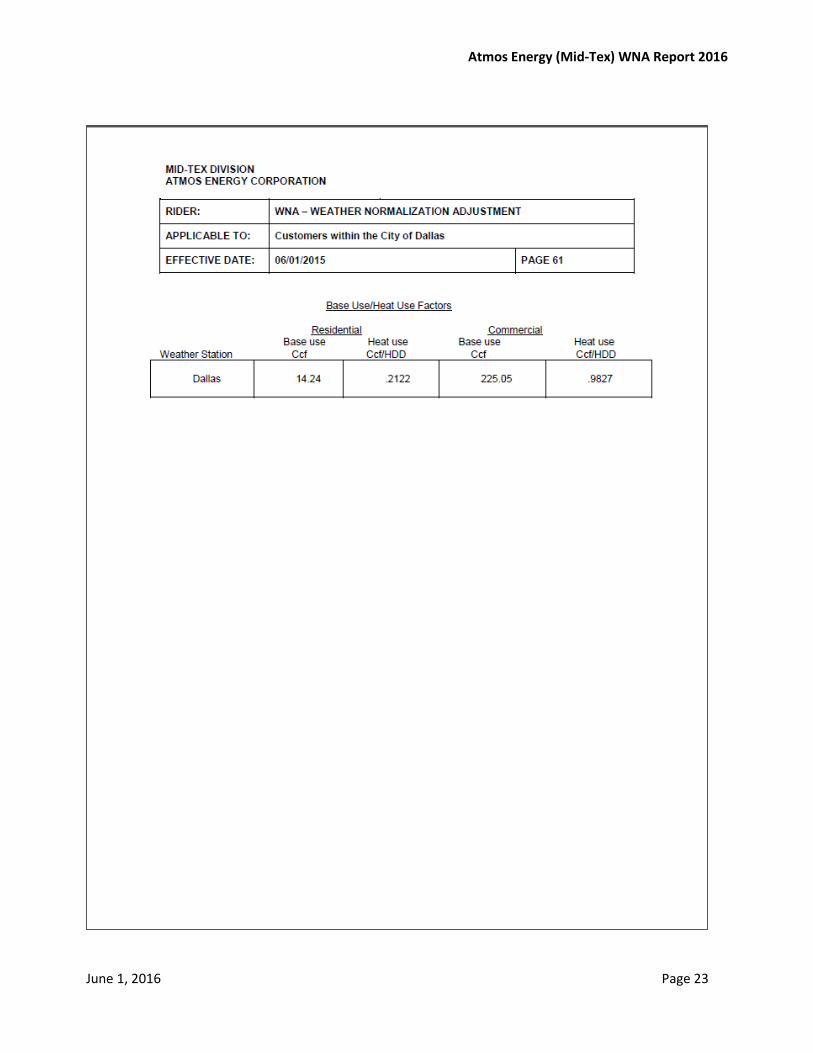
Step 3. Identify Base Load (BL) and Heat Sensitivity Factors (HSF)
Several of the factors in the WNA calculations are dependent on which tariff is applicable to you. If you are a customer in an incorporated city other than Dallas, you will use the tariff included in Appendix B. If you are a customer in the City of Dallas, you will use the tariff in Appendix C. If you are a customer in an unincorporated area, you will use the tariff in Appendix D.
Find the Base Use/Heat Use Factors table in the applicable tariff. Next, find the row that applies to the weather station you identified in step 2. If you are a residential customer, you will use the Base Use and Heat Use Factors in the first two columns, while commercial customers will use these factors from the last two columns.
Note the base use factor as BL and the heat use factor as HSF.
Step 4. Identify Base Rate (R)
Base rate information can be found in Appendix E. Identify the applicable base rate by referencing Table E-1 (incorporated cities except City of Dallas), Table E-2 (City of Dallas) and Table E-3 (unincorporated areas), for the correct billing period (month when bill was issued) and customer type (residential or commercial). For verification, this rate should match the rate on your bill under “CURRENT GAS CHARGE TOTAL” next to “CONSUMP CHRG”.
Note this base rate as R.
Atmos Energy (Mid-Tex) WNA Report 2016
June 1, 2016 Page 55
Step 5. Calculate heating degree days (NDD and ADD).
The heating degree days are based on the actual days included in your billing period. On your bill, note the ”from” and “to” service dates in the table in on the left side of the bill. Heating degree data can be found in Appendix E for customers in an incorporated city other than Dallas and unincorporated areas and Appendix F if you are a customer in the City of Dallas. Once you locate the correct appendix, add the Normal Heating Degree Days (NDD) from the day before the first date of the billing period (i.e., FROM) to the day before the last date of the billing period (i.e., TO).
Note this total Normal Heating Degree Days as NDD.
Then add the Actual Heating Degree Days (ADD) from the day before the first date of the billing period (i.e., FROM) to the day before the last date of the billing period (i.e., TO).
Note this total Actual Heating Degree Days as ADD.
Step 6. Calculate WNA Factor
The WNA Factor can be calculated using the formula in Section II using each of these factors (BL, HSF, R, NDD, ADD)
Step 7. Identify Sales Quantity of Natural Gas (q)
From your applicable bill, find the “ACTUAL USAGE IN CCF” number in the table on the left.
Note this relevant sales quantity as q.
Step 8. Calculate Rider WNA
The Rider WNA amount can be calculated by multiplying the WNA Factor calculated in Step 6 by the relevant sales quantity (q) identified in Step 7.
Atmos Energy (Mid-Tex) WNA Report 2016
June 1, 2016 Page 56
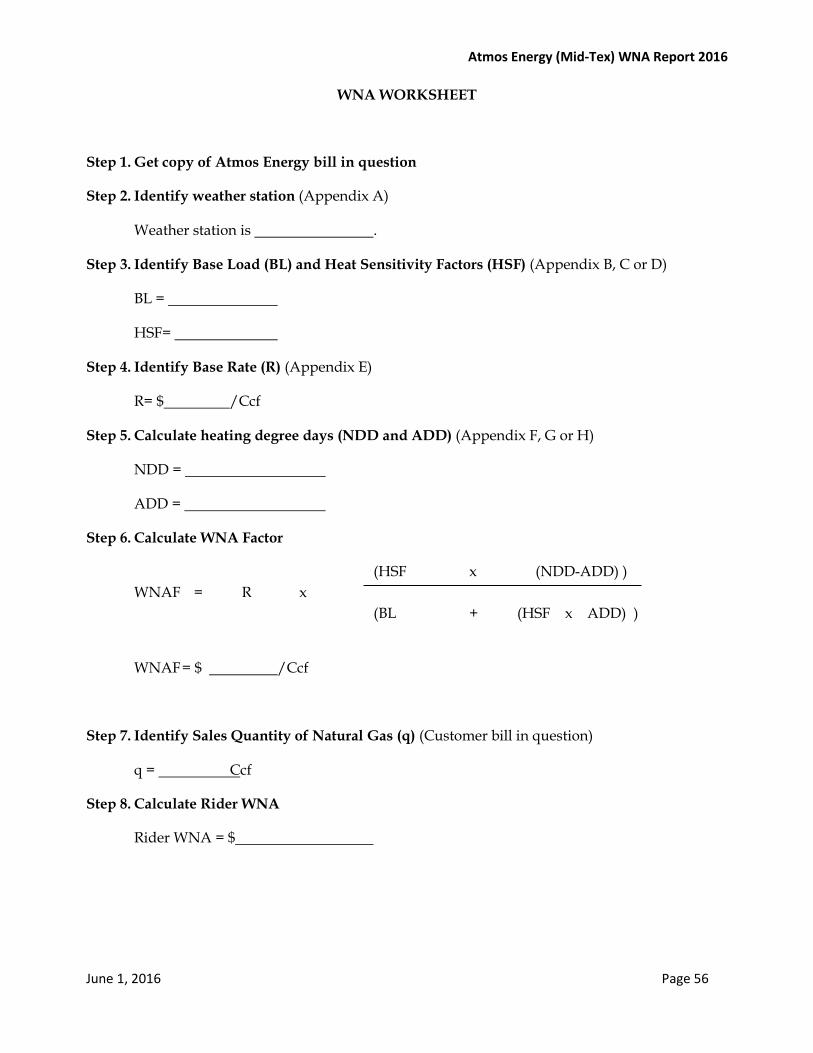
WNA WORKSHEET
Step 1. Get copy of Atmos Energy bill in question
Step 2. Identify weather station (Appendix A)
Weather station is .
Step 3. Identify Base Load (BL) and Heat Sensitivity Factors (HSF) (Appendix B, C or D)
BL =
HSF=
Step 4. Identify Base Rate (R) (Appendix E)
R= $ /Ccf
Step 5. Calculate heating degree days (NDD and ADD) (Appendix F, G or H)
NDD =
ADD =
Step 6. Calculate WNA Factor
(HSF x (NDD-ADD) ) WNAF = R x (BL + (HSF x ADD) )
WNAF = $ /Ccf
Step 7. Identify Sales Quantity of Natural Gas (q) (Customer bill in question)
q = Ccf
Step 8. Calculate Rider WNA
Rider WNA = $
Atmos Energy (Mid-Tex) WNA Report 2016
June 1, 2016 Page 57
Appendix J– Sample Bill Calculation and WNA Worksheet
Atmos Energy (Mid-Tex) WNA Report 2016
June 1, 2016 Page 58
Atmos Energy (Mid-Tex) WNA Report 2016
June 1, 2016 Page 59
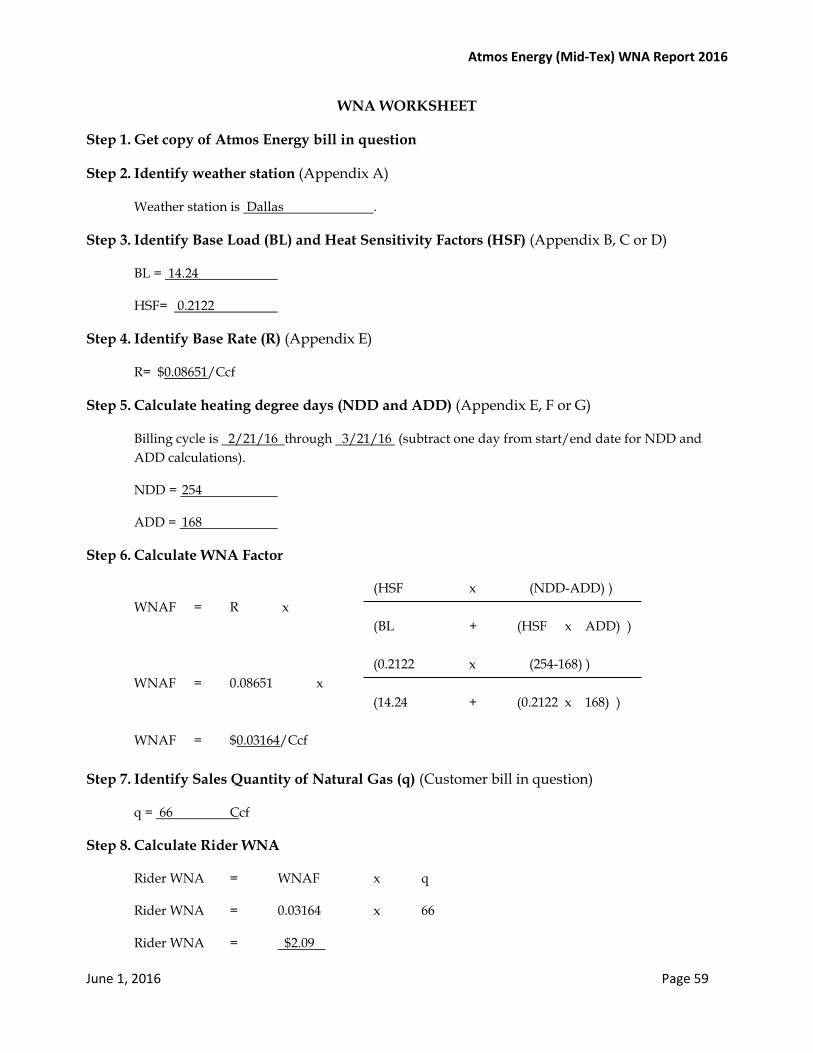
WNA WORKSHEET
Step 1. Get copy of Atmos Energy bill in question
Step 2. Identify weather station (Appendix A)
Weather station is Dallas .
Step 3. Identify Base Load (BL) and Heat Sensitivity Factors (HSF) (Appendix B, C or D)
BL = 14.24
HSF= 0.2122
Step 4. Identify Base Rate (R) (Appendix E)
R= $0.08651/Ccf
Step 5. Calculate heating degree days (NDD and ADD) (Appendix E, F or G)
Billing cycle is 2/21/16 through 3/21/16 (subtract one day from start/end date for NDD and ADD calculations).
NDD = 254
ADD = 168
Step 6. Calculate WNA Factor
(HSF x (NDD-ADD) ) WNAF = R x (BL + (HSF x ADD) ) (0.2122 x (254-168) ) WNAF = 0.08651 x (14.24 + (0.2122 x 168) ) WNAF = $0.03164/Ccf Step 7. Identify Sales Quantity of Natural Gas (q) (Customer bill in question)
q = 66 Ccf
Step 8. Calculate Rider WNA
Rider WNA = WNAF x q
Rider WNA = 0.03164 x 66
Rider WNA = $2.09