Embed Size (px)
Citation preview

1
Chapter 14 - Weather Forecasting
Weather Forecasting - Introduction• Weather affects nearly everyone nearly every day • Weather forecasts are issued:
– to save lives – reduce property damage – reduce crop damage – to let the general public know what to expect
• Forecasts are often utilized to make many important decisions on a daily basis
• So, how is it done, and how is it done correctly?

2
National Weather Service Mission
• The National Weather Service (NWS)provides weather, hydrologic, and climate forecasts and warnings for the United States, its territories, adjacent waters, and ocean areas for the protection of life and property and the enhancement of the national economy. NWS data and products form a national information data base and infrastructure which can be used by other governmental agencies, the private sector, the public, and the global community.
http://www.ncep.noaa.gov/

3
Forecasting Tools • Weather Observations:
– Surface data: – Soundings– Ship and buoy data– Satellite data – Radar data– Commercial aircraft data (ACARS) – Wind profilers
• Weather Analysis: from observations to weather patterns
• Numerical weather predication – using current and past observations to predicate weather in near future
Atmospheric Model• Mathematical model– equations describe how atmospheric
temperature, pressure, wind, and moisture change with time.
• The models are programmed into the computer. • Prognostic Chart (prog): the final forecast chart
representing the atmosphere at a specified future time.
The MRF model The ETA model

4
A forecaster uses the progs as a guide to predicting the weather.A good forecaster needs to know model limitations:
A personalized practical interpretation of model outputsLocal geographic features
Forecasting Tool• AWIPS: Advanced Weather Interactive
Processing System– Data communications, storage, processing, and
display
The AWIPS computer workstation provides various weather maps and overlays on different screens.

5
Doppler radar data from Melbourne, Florida, during the time of a severe hailstorm in the Orlando area. In the table near the top of the display, the hail algorithm determined that there was 100 percent probability that the storm was producing hail and severe hail. The algorithm also estimated the maximum size of the hailstones to be greater than 3 inches. A forecaster can project the movement of the storm and adequately warn those areas in the immediate path of severe weather.
• The Meteogram is a chart that show how one or more weather variables has changed at a station over a given period of time.
6
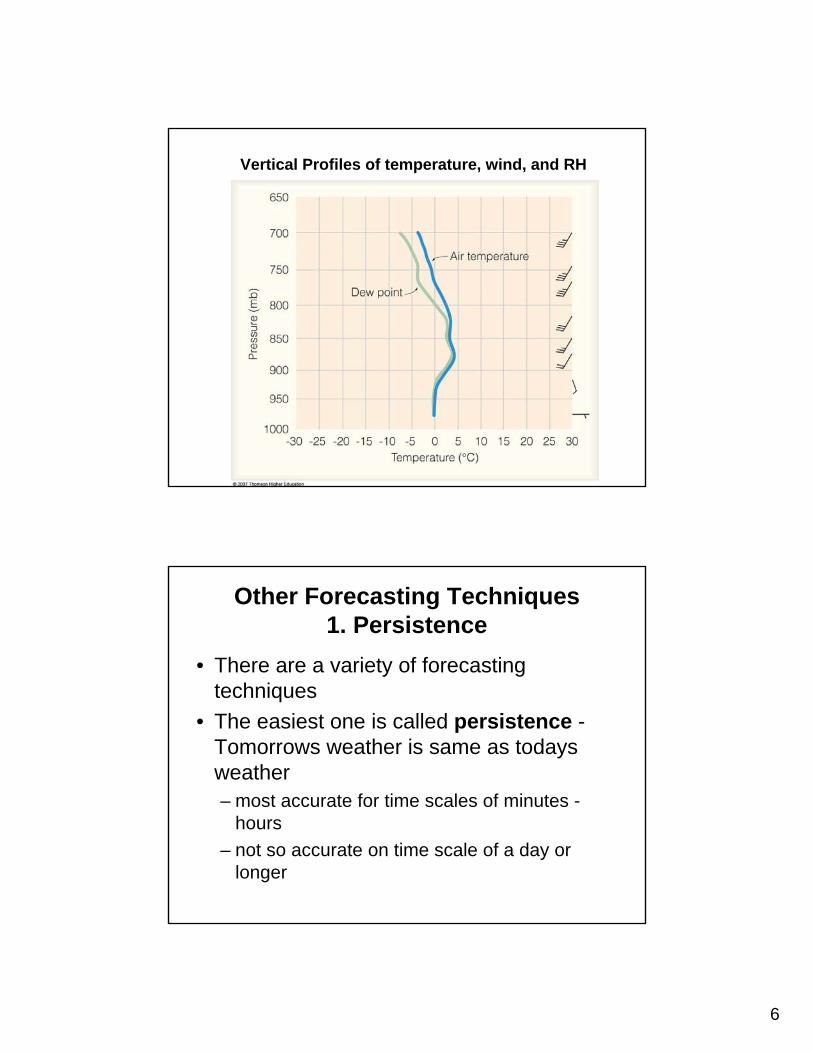
Vertical Profiles of temperature, wind, and RH
Other Forecasting Techniques 1. Persistence
• There are a variety of forecasting techniques
• The easiest one is called persistence -Tomorrows weather is same as todaysweather – most accurate for time scales of minutes -
hours – not so accurate on time scale of a day or
longer

7
2. The Trend Technique• If a phenomenon is in steady state, or is moving
at constant speed, the trend technique can be used.
• rate x time = distance• so if distance traverse by cold front is known
over a given time period, its position can be extrapolated in time.
• More accurate on shorter time scales (minutes to hours)
• A short term forecast is called a "nowcast"
3. The Analogue Technique
• Identify existing features on a weather chart that resemble those that occurred in the past
• Use previous weather events to guide forecast• "pattern recognition"• useful method for longer-term forecasts (3 days -
months) • NWS issues:
– 6-10 day extended forecasts – 30 day outlooks

8
Why Forecasts go awry and steps to improve them
• Model limitations:– Models represent a "simplified" atmosphere - not every real
process in atmosphere can be resolved in the models – The model equations compute quantities at grid points.
Currently, grid spacing ranges from 30-50 km apart. Any phenomena smaller in size that grid spacing will not be resolvedin models (e.g., thunderstorm)
– models can not resolve boundary layer very well. • Boundary condition errors
– Many are not global in coverage • Initial condition errors
– Initial atmospheric state is not well-known - want a dense, global network of observations
– Have many data-parse regions, particularly over the oceans. – The data may also have errors in it.
Why Forecasts go awry and steps to improve them
• Local impacts-not represent in model– small-scale terrain features will not be handled
properly • The chaotic nature of atmosphere
– small differences in the model initial conditions can produce radically different results later in time
• Each model can produce different predictions.... which do you believe?
• Solution:– Improve models and observations– Ensemble forecasting

9
Ensemble 500-mb forecast chart for July 21, 2005 (48 hours into the future). The chart is constructed by running the model 15 different times, each time beginning with a slightly different initial condition. The blue lines represent the 5790-meter contour line; the red lines, the 5940-meter contour line; and the green line, the 500-mb 25-year average, called climatology.
http://www.cdc.noaa.gov/map/images/ens/ens.html#ushttp://www.cdc.noaa.gov/map/images/ens/ens_desc.html
Statistical Forecast

10
Probability of a “White Christmas”—one inch or more of snow on the ground—based on a 30-year average. The
probabilities do not include the mountainous areas in the western United States. (NOAA)
Predicting the weather by weather types

11
Climatological Forecast• A forecast that is based on "climatology" or
average weather • Example:
– Lets say the climatological records show that it rains only 1 day out of 100 during the summer months in LA.
– Then, if you forecast "no rain" for any day in July and August, the probability you will be wrong is 1/100.
– Therefore, the probability you will be right is about 99%
• NOTE: precip forecasts are usually given as probabilities – ex: "there is a 60% chance of rain today"
• This means that there is a 60% chance of measurable precip at any random place in the forecast area
Accuracy and skill in forecasting• What is an accurate forecast?
– your forecast for tonights min temp is 0°F – if the actual min was 1°F, is in inaccurate? – if the actual min was 10°F, is in inaccurate? – Accuracy (in forecasting) is arbitrary and relative - it's
not clearly, objectively defined • How does a forecast show skill?
– must be more accurate than utilizing persistence or climatology
– persistence is "hard to beat" on a time frame of minutes to hours
– skill is often shown on time frame of hours to a few days
– Beyond 10 days, forecasts are generally no better than those generated by climatology

12
Types of Forecasts• A very short-range forecast: up to few hours• A short-range forecast: six hours to a few days• A medium-range forecast: from 3 to 8.5 days into
the future.• A long-range forecast: beyond about 8.5 days.
Forecasting from local signs and common sense
• You can forecast very short-range weather with local signs and common sense– Air masses– different features– Frontal systems: clouds, high pressure and low
pressure system changes• You need to learn some basics to local signs
with atmospheric processes– This class is building this for you

13
A halo around the sun (or moon) means that rain is on the way. A weather forecast made by
simply observing the sky.

14
The instant weather Forecast chart

15
Table E-1b, p. A-12
Forecasting temperature advection by watching clouds
• Winds that back with height (change counterclockwise) indicate cold advection
• Winds that veer with height (change clockwise) indicate warm advection.

16
Clouds, winds, and advection associated
with a cold and a warm front.
Weather Forecasting Using Surface Chart• Given that we know the weather associated with common
features on a surface weather chart, for example:– cold front - narrow band of showers – NE of warm front - light/moderate wide spread precip. – warm sector - hot, humid – etc.
• if we can predict the movement of these feature based on its previous motion, we can then make a forecast with this information.

17
Determining the Movement of Weather Systems1. For short-time intervals, storms and fronts tend to move in
the same direction and at approximately the same speed as they did during the previous six hours.
2. Low pressure areas tend to move in a direction that parallels the isobars in the warm air ahead of the cold front.
3. Lows tend to move toward the region of greatest pressure drop, while highs tend to move toward the region of greatest rise.
4. Surface pressure system tend to move in the same direction as the wind at 5500 m (18,000 ft)– the 500-mb level. The speed at which surface systems move is about half the speed of the winds at this level.
Forecasting weather system movement with pressure tendency
• Pressure tendency - The rate at which pressure is changing for a given period of time. (mb/hr)
• Lines of constant pressure change are called isallobars.
• Lows will tend to move to region of largest negative pressure tendencies
• Highs will tend to move to region of largest positive pressure tendencies

18
A 500-mb chart for 6:00 A.M. Tuesday, showing wind flow. The light red L represents the position of the surface low. The winds aloft tend to steer surface pressure systems along and, therefore, indicate that the surface low should move northeastward at about half the speed of the winds at this level, or 25 knots.
A Forecast for Six Cities
Projected 12- and 24-hour movement of fronts, pressure systems, and precipitation (shaded green area) from 6:00 A.M. Tuesday until 6:00 A.M. Wednesday.
Surface weather map for 6:00 A.M. Wednesday.

19
A Meteorologist makes a Prediction
Observations4:00 P.M. Sunday, March 25.
No weather front approach from westWeak low pressure center is developed !!
Omega high– blocking highHigh wind, warm and cold advection Baroclinic instability do exist !Favorable conditions for the surface low develop into a major storm
??
Computer Model outputs 500 mb
4:00AMMonday
4:00PMMonday
4:00AMTuesady
The forecaster has more confidence in Model A and C.

20
Forecast
• Increasing cloudiness Sunday night with rain beginning Monday morning. Periods of Rain likely through Tuesday Morning.
Observations4:00 A.M. (PST) Monday, March 26.
Low pressure center get lower Upper trough deepen

21
Satellite– allow you to see weather moving
9:00 A.M. (PST) Tuesday, March 276:45 A.M. (PST) Monday, March 26
Surface weather map for 4:00 P.M. (PST) Monday, March 26.