Embed Size (px)
Citation preview

ORIGINAL PAPER
Weather elements, chemical air pollutants and airborne polleninfluencing asthma emergency room visits in Szeged, Hungary:performance of two objective weather classifications
László Makra & János Puskás & István Matyasovszky &
Zoltán Csépe & Enikő Lelovics & Beatrix Bálint &Gábor Tusnády
Received: 8 February 2014 /Revised: 16 November 2014 /Accepted: 16 November 2014 /Published online: 10 December 2014# ISB 2014
Abstract Weather classification approaches may be usefultools in modelling the occurrence of respiratory diseases.The aim of the study is to compare the performance of anobjectively defined weather classification and the SpatialSynoptic Classification (SSC) in classifying emergency de-partment (ED) visits for acute asthma depending from weath-er, air pollutants, and airborne pollen variables for Szeged,
Hungary, for the 9-year period 1999–2007. The research isperformed for three different pollen-related periods of the yearand the annual data set. According to age and gender, ninepatient categories, eight meteorological variables, sevenchemical air pollutants, and two pollen categories were used.In general, partly dry and cold air and partly warm and humidair aggravate substantially the symptoms of asthmatics. Ourmajor findings are consistent with this establishment. Namely,for the objectively defined weather types favourable condi-tions for asthma ER visits occur when an anticyclonic ridgeweather situation happens with near extreme temperature andhumidity parameters. Accordingly, the SSC weather typesfacilitate aggravating asthmatic conditions if warm or coolweather occur with high humidity in both cases. Favourableconditions for asthma attacks are confirmed in the extremeseasons when atmospheric stability contributes to enrichmentof air pollutants. The total efficiency of the two classificationapproaches is similar in spite of the fact that the methodologyfor derivation of the individual types within the two classifi-cation approaches is completely different.
Keywords Objective weather types . Spatial SynopticClassification (SSC)weather types . Air pollution . Pollenallergy . Forecasting . Asthma emergency visits
Introduction
Since the last century, air pollution has become a majorenvironmental problem, mostly over large cities and industrialareas (Cassiani et al. 2013). For instance, the global mean percapita mortality caused by air pollution is about 0.1 % peryear. The highest premature mortality rates are found in theSoutheast Asia andWestern Pacific regions where more than a
L. Makra (*) : Z. Csépe : E. LelovicsDepartment of Climatology and Landscape Ecology, University ofSzeged, 6701 SzegedP.O.B. 653, Hungarye-mail: [email protected]
Z. Csépee-mail: [email protected]
E. Lelovicse-mail: [email protected]
J. PuskásInstitute of Geography and Environmental Sciences, SavariaCampus, University of West Hungary, 9700 SzombathelyKárolyiGáspár tér 4, Hungarye-mail: [email protected]
I. MatyasovszkyDepartment of Meteorology, Eötvös Loránd University,1117 BudapestPázmány Péter st. 1/A, Hungarye-mail: [email protected]
B. BálintHospital of Chest Diseases, Csongrád County,6772 DeszkAlkotmány u. 36, Hungarye-mail: [email protected]
G. TusnádyMathematical Institute of the Hungarian Academy of Sciences,1364 BudapestP.O.B. 127, Hungarye-mail: [email protected]
Int J Biometeorol (2015) 59:1269–1289DOI 10.1007/s00484-014-0938-x

dozen of the most highly polluted megacities are located(Lelieveld et al. 2013).
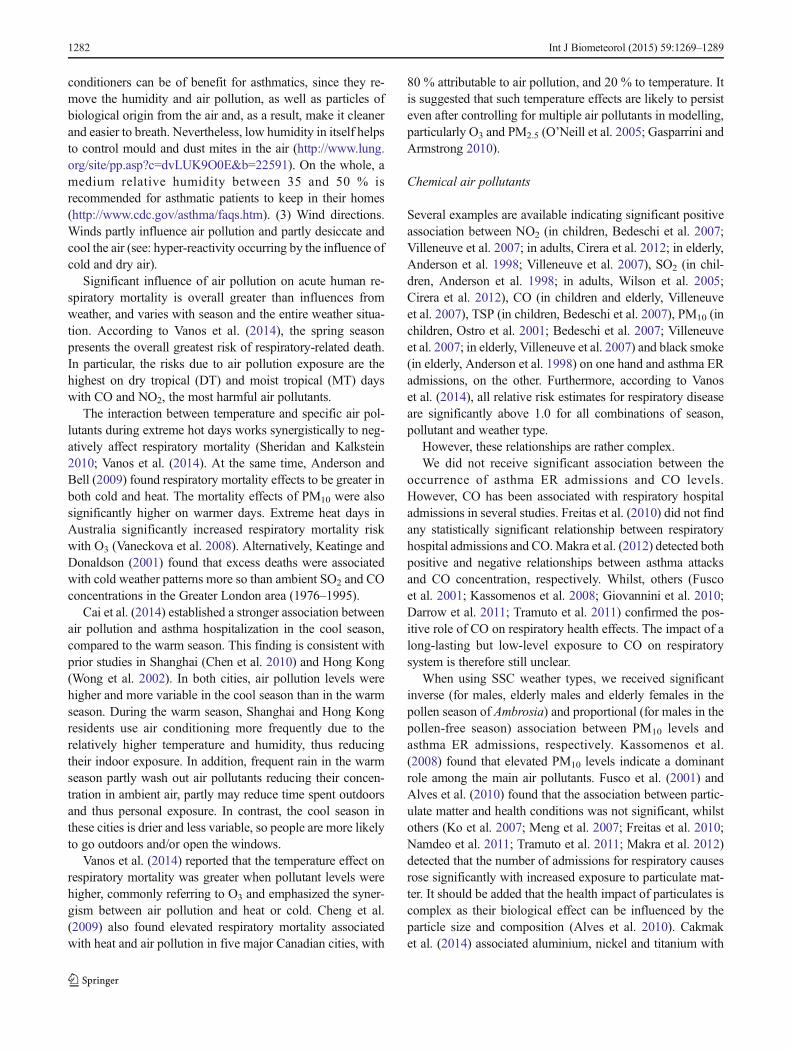
In Hungary, air pollution is one of the highest in Europe.Around 16,000 annual premature deaths attributable to expo-sure to ambient PM10 concentrations are estimated in thecountry (Barrett et al. 2008). Furthermore, the PannonianPlain involving Hungary (Fig. 1) is heavily polluted withairborne pollen and most polluted with airborne ragweed(Ambrosia) pollen in Europe (Makra et al. 2005). About30 % of the Hungarian population has some type of allergy,65 % of them have pollen sensitivity, and at least 60 % of thispollen sensitivity is caused by Ambrosia (Makra et al. 2004).
The substantial increase of respiratory diseases in industri-alized countries is partly attributable to a combination ofchemical air pollutants and allergenic airborne pollen in bigcities. Several papers have analysed separately the effects ofeither chemical air pollutants (Alves et al. 2010) or allergenicpollen (Díaz et al. 2007) to hospital admissions of respiratorydiseases. However, only very few studies have yet examinedthe effect of these two kinds of variables together (Andersenet al. 2007).
The impact of weather on asthma has been known forcenturies. For instance, prevalence of emergency department
(ED) visits for acute asthma significantly increases by lowminimum temperature (Abe et al. 2009), low temperatures(Abe et al. 2009) and by either a sudden and substantialdecrease (Makie et al. 2002) or increase of temperature(Anderson et al. 2013). It was found that in an urban popula-tion, the highest (smallest) number of acute asthma ED visitsoccurs in the fall (in the summer; Silverman et al. 2003).
Association between the number of ED visits for acuteasthma was examined for PM10 (Scarinzi et al. 2013), PM2.5
(Scarinzi et al. 2013), coarse PM (Qiu et al. 2012), NO2
(Scarinzi et al. 2013), SO2 (Sousa et al. 2012), CO (Sousaet al. 2012) and O3 (Yeh et al. 2011), as well as for pollengrains of different taxa (Makra et al. 2012). The importance ofthe area is stressed by the extreme high expenses of thetreatment of asthma ED patients.
Instead of using one or more meteorological variables inorder to detect relationships between weather and a given typeof morbidity as resultant variable, some researchers appliedindices or developed objective air mass types combiningseveral meteorological parameters to assess their effect inclassifying different diseases (Kassomenos 2003a, b;Kassomenos et al. 2003a). An objective classification ap-proach of air mass types developed by Makra et al. (2006a,b) was used to separate concentrations of chemical (Makraet al. 2006a) and biological (Makra et al. 2006b) air pollutantsand to determine their efficiency in separating the prevalenceof respiratory diseases (Makra et al. 2008). They found thatlow levels of pollutants occurred when zonal currents passedthrough Hungary. During the summer months, anticyclonesand anticyclone ridge weather situations were characteristicover the Carpathian Basin. Furthermore, secondary pollutantswere highly enriched due to high irradiance (Makra et al.2006a). Saaroni et al. (2010) found that not the cyclonic oranticyclonic synoptic systems were the key factor for thepollution potential in their study region, but rather the ambientatmospheric conditions they induce, static stability and weakeasterly offshore flow. Local processes were the direct cause ofthe pollution and the role of the synoptic conditions was tosupport meso-scale processes. Note that their (Saaroni et al.2010) study area was the eastern Mediterranean, a region withdifferent climate. Sindosi et al. (2003) defined characteristic airmass types in order to reveal the association of atmosphericcirculation with air pollution levels. McGregor and Bamzelis(1995) derived objective air mass types on surface meteorolog-ical data and analysed them in terms of their climatological,meteorological and air pollution characteristics. Further papersdeveloping objective air mass types and meteorological indicesin the subject are Kassomenos et al. (2003b, 2007, 2008, 2010)and Katsoulis and Kassomenos (2004).
Synoptic weather types characterizing the prevailingweather systems over an area have been associated withhuman health effects. Several papers have been publishedboth on the association of weather-types-related air pollution
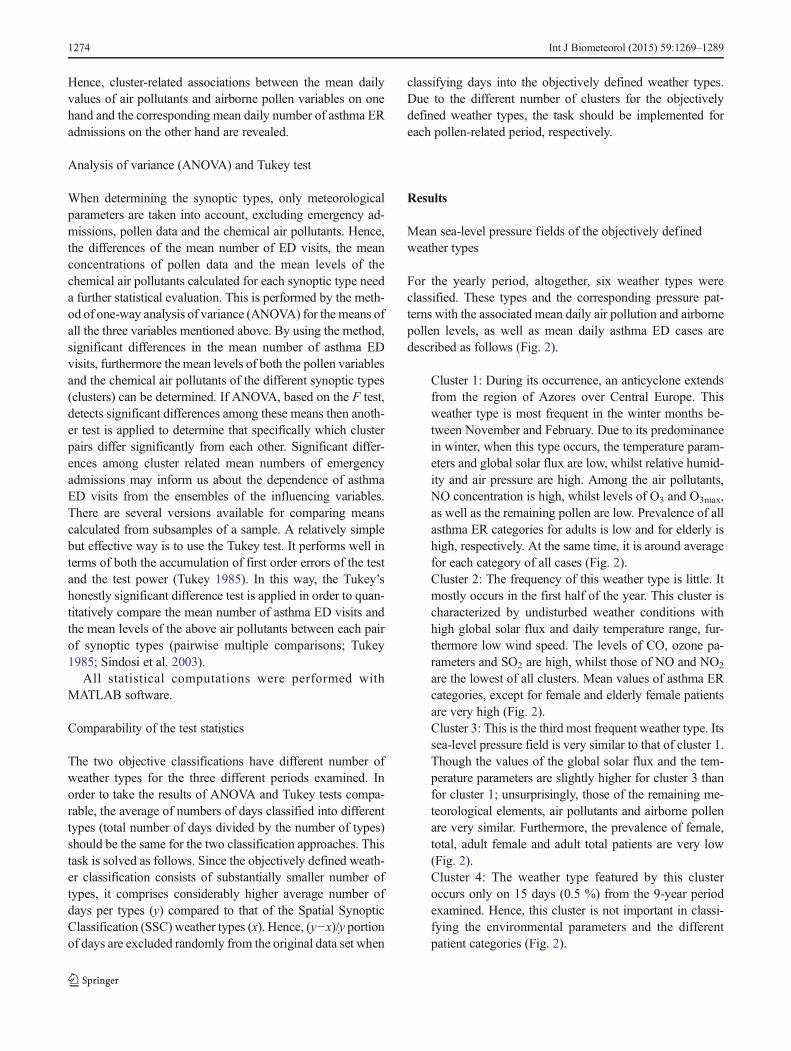
Fig. 1 Location of Europe with Hungary (upper panel) and the urbanweb of Szeged with the positions of the data sources (lower panel). 1: airquality and meteorological monitoring station; 2: aerobiological station;3: Hospital of Chest Diseases in Deszk
1270 Int J Biometeorol (2015) 59:1269–1289

on one hand and respiratory morbidity (Monsalve et al. 2013)and respiratory mortality (Rainham et al. 2005; Vanos et al.2013) on the other. Nevertheless, very few papers have beenappeared on asthma ED visits—weather-type dependence(Lee et al. 2013).
The daily number of ED visits for asthma by ambulancehas been studied by several authors. Atkinson and Strachan(2004) surveyed the special literature on the incidences ofasthma ED visits in conjunction with its environmental com-ponents, namely meteorological elements, aerobiological pa-rameters (pollen grains and spores), as well as chemical airpollutants. Some authors analysed the occurrence of asthmaED visits in the function of chemical air pollutants (Bedeschiet al. 2007; Stieb et al. 2009); others studied the interrelation-ship between the prevalence of emergency room (ER) visitsfor asthma on the one hand, as well as aeroallergen levels andthe concentrations of chemical air pollutants on the other(Stieb et al. 2000; Villeneuve et al. 2007); whilst, again othersexamined the incidence of asthma emergency room visits inthe function of meteorological elements and chemical airpollutants (Wilson et al. 2005; Abe et al. 2009). At the sametime, the remaining authors investigated the association of theoccurrence of asthma ED visits with airborne allergens (air-borne pollen grains and spores), meteorological elements andchemical air pollutants (Garty et al. 1998; Rosas et al. 1998;Orazzo et al. 2009).
Analysis of the environmental factors for asthma ED visitswere partly limited to either children (Garty et al. 1998;Bedeschi et al. 2007; Orazzo et al. 2009) or adults (Wilsonet al. 2005); however, it was jointly performed both for chil-dren and adults (Villeneuve et al. 2007; Abe et al. 2009) andfor children, adults and elderly (Rosas et al. 1998),respectively.
The purpose of the present study is to compare an objec-tively defined weather classification and the Spatial SynopticClassification (SSC; Kalkstein et al. 1996; Sheridan 2002,2003) for determining their performance in (1) classifyingthe prevalence of the different categories of asthma ER visits,(2) estimating the role of the weather elements, air pollutantsand airborne pollen in inducing the occurrence of asthmaattacks, (3) assessing the relative risks of ED visits withinthe weather types for clarifying as to which incoming weathertype presents the greatest asthma risk and the relative useful-ness of both classification approaches, furthermore (4)assessing and comparing the metrics (character, efficiency)of these weather classification approaches for Szeged,Hungary. The reason for using the possible dependence ofemergency department visits for acute asthma on meteorolog-ical variables, chemical air pollutants and airborne pollen isthat asthma emergency cases can alone be directly associatedto the given daily values of the influencing variables.Therefore, an objective weather classification approach isdeveloped and compared with the Spatial Synoptic
Classification (SSC) weather types (Kalkstein et al. 1996;Sheridan 2002, 2003) in regard to classifying weather vari-ables and air pollutant related emergency department visits foracute asthma for Szeged, Hungary, for the 9-year period1999–2007. The research is performed for three differentpollen-related periods of the year.
Materials and methods
The city of Szeged (46.25°N; 20.10°E) being the largest townin SE Hungary is located at the confluence of the Tisza andMaros Rivers characterized by an extensive flat landscape ofthe Hungarian Great Plain with the lowest elevation (79 mabove mean sea level) in the Carpathian Basin (Fig. 1). Thebuilt-up area covers a region of about 46 km2. The city is thecentre of the Szeged region with 203,000 inhabitants. Theclimate of Szeged belongs to Köppen’s Ca type (warm tem-perate climate) with relatively mild and short winters and hotsummers (Köppen 1931). According to the climate classifica-tion of Trewartha (1968), Szeged is associated with class D1(continental climate with a long warm season).
Data
Meteorological parameters, chemical and biological airpollutants
Daily values of the meteorological variables used are meantemperature (Tmean, in degree Celsius), maximum temperature(Tmax, in degree Celsius), minimum temperature (Tmin, indegree Celsius), temperature range (Tmax−Tmin=ΔT, in de-gree Celsius), mean global solar flux (GSF, in watts per squaremeter), mean relative humidity (RH, in percent), mean sea-level air pressure (P, in hectopascal) and mean wind speed(WS, in meter per second). Chemical air pollutants include thedaily average mass concentrations of CO (in milligram percubic meter), NO, NO2, SO2, O3, and PM10, furthermore dailyO3max (all in microgram per cubic meter).
When selecting biological air pollutants, special emphasisis put on Ambrosia due to extreme high concentrations of itsmost allergenic pollen during its pollen season in Hungary.Two pollen variables were formed for our analysis: dailypollen counts of Ambrosia and daily total pollen count (thepollen counts of each of the 24 taxa measured in Szeged)excluding the pollen of Ambrosia. The remaining 23 taxa withtheir Latin (English) names are as follows. Acer (maple),Alnus (alder), Artemisia (mugwort), Betula (birch),Cannabis (hemp), Carpinus (hornbeam), Chenopodium(goosefoot), Corylus (hazel), Fraxinus (ash), Juglans (wal-nut), Morus (mulberry), Pinus (pine), Plantago (plantain),Platanus (platan), Poaceae (grasses), Populus (poplar),
Int J Biometeorol (2015) 59:1269–1289 1271

Quercus (oak), Rumex (dock), Salix (willow), Taxus (yew),Tilia (linden), Ulmus (elm) and Urtica (nettle).
Meteorological variables and chemical air pollutants werecollected in a monitoring station located in the inner city areaof Szeged, at a distance of about 10 m from the busiest mainroad (Fig. 1). The pollen content of the air was measured usinga 7-day recording “Hirst-type” volumetric trap (Hirst 1952).The air sampler is located about 20 m above the ground(Fig. 1, lower panel).
Asthma ED visits
Daily number of ED visits registered with asthma comes fromthe Hospital of Chest Diseases, Deszk, Csongrád County,located about 10 km from the monitoring station in Szegeddowntown (Fig. 1, lower panel). Age, gender, date of admis-sion and disease type were available for each patient. AsthmaED diseases were categorized using the InternationalClassification of Diseases, Tenth Revision (ICD-10; WHO1999) as follows: allergic asthma (J4500), mixed asthma(J4580) and asthma without specification (J4590). Allergywas defined in all here-mentioned disease categories.Generally, three age groups can be considered in the research:young patients (0–14 years), adult patients (15–64 years) andelderly patients (equals to or older than 65 years) because thediagnostic category of asthma may include different syn-dromes in children, adults and elderly people (Ko et al.2007). Due to the very small patient number in younger agegroup, only categories of adults and the elderly people wereanalysed. For these latter two categories, ED visits of male andfemale patients were considered. Altogether, 936 ED visitswere recorded due to asthma consisting of 497 females and439 males, respectively.
Daily sea-level pressure fields
Daily sea-level pressure fields measured at 00 UTC(Coordinated Universal Time) come from the ECMWF(European Centre for Medium-Range Weather Forecasts)Re-Analysis ERA 40 project, in the frame of which daily datahave been re-analysed since September 1, 1957. The proce-dure has been performed with a uniformmethod from the databeing available in the investigated period. Data for theECMWF Re-Analysis ERA 40 project are verified, dynami-cally correct, the pressure field is real even over the AtlanticOcean and there is no lack of data. When using the method,the measured false input data are omitted. At the same time, iforiginal station data are used, false data can frequently beaccounted.
The investigated area is in the North-Atlantic–Europeanregion between 30°N–70.5°N latitudes and 30°W–45°E lon-gitudes. The grid network is selected with a density of 1.5°×1.5°, which indicates 28°×51=1428 grid points for the region.
Study periods
The analysis was performed for the 9-year period 1999–2007with two pollen variable data sets, namely the daily Ambrosiapollen counts for the pollen season of Ambrosia (July 15–October 16) and the daily total pollen counts excluding thepollen season of Ambrosia (January 14–July 14); furthermore,the pollen-free season (October 17–January 13) were consid-ered. Though the total pollen excluding the pollen season ofAmbrosia comprises several allergens, this separation permitsstudying asthma ED cases that can be originated in the twopollen variables separately as Ambrosia dominates the pollencounts during the main part of its pollen season.
The pollen season is defined by its start and end dates. Forthe start (end) of the season we used the first (last) date onwhich at least one pollen grain per cubic meter of air isrecorded and at least five consecutive (preceding) days alsoshow one or more pollen grains per cubic meter (Galán et al.2001). Evidently, the pollen season varies from year to year.Here, the longest pollen season observed during the 9-yearperiod was assigned to each year.
Methods
Spatial Synoptic Classification (SSC) weather types
The Spatial Synoptic Classification (SSC) system was origi-nally developed by Kalkstein et al. (1996) for USA and later itwas redeveloped (Sheridan 2002, 2003) and then expandedfor Canada andWestern Europe (Bower et al. 2007), as well asfor Asia. The SSC is based solely on four-time daily stationbased observations of temperature, dew point, wind speed, airpressure and cloud cover. Hence, the SSC is properly called aweather-type classification.
The SSC is a hybrid classification scheme. Initially,weather-type identification was made manually for eachweather type, based on climatological knowledge. Then, usingalgorithms, for each type hypothetical “seed days”, namelytypical days were determined for each day of the year. Oncethis process is complete, actual conditions on each day werecompared to the seed days, and the day was classified as theone it most closely resembles. Hence, when the process iscomplete, each day is classified into one of the weather types.SSC has a wide application in the area of climate–healthassociations (Sheridan et al. 2009; Sheridan and Kalkstein2010; Hondula et al. 2014).
The SSC calendar for Europe, including Budapest (http://sheridan.geog.kent.edu/ssc.html), is continuously prepared(recently it is available for the period 1974–2013) thatcomprise the study period (1999–2007). Since the distanceof Szeged from Budapest is 161 km as the crow flies, the
1272 Int J Biometeorol (2015) 59:1269–1289

weather types determined for Budapest can be consideredvalid for Szeged, as well.
The number codes of the weather types developed are asfollows: 1=dry moderate (DM), 2=dry polar (DP), 3=drytropical (DT), 4=moist moderate (MM), 5=moist polar(MP), 6=moist tropical (MT), 7=transition (T), 8=day ismissing, 66=moist tropical plus (MT+) and 67=moist tropicaldouble plus (MT++). Note that MT+ and MT++ (66 and 67)are subsets of the MTweather type. They were developed forthe assessment of heat-related mortality (Kalkstein et al. 1996;Sheridan 2002, 2003; Bower et al. 2007).
Objectively defined weather types
Classification of weather types objectively can be performedusing multivariate statistical methods such as factor analysis(FA) and cluster analysis (CA). Kalkstein and Corrigan (1986)used a combination of principal component analysis (PCA)and cluster analysis in order to demonstrate the application ofobjective synoptic climatological classification schemes to airpollution climatology. FA and PCA are similar methods sinceboth aim at reducing the dimensionality of a set of correlatedvariables to a smaller number of manageable and physicallyinterpretable new dimensions that can be referred to as com-ponents or factors, as well. However, the two procedures arenot identical (McGregor and Bamzelis 1995; Sindosi et al.2003).
Factor analysis
Factor analysis reduces the dimensionality of a large data setof p-correlated variables, expressing them in terms of m (m<p) new uncorrelated variables, the so-called components orfactors. Calculation was based on PCA combined withvarimax rotation keeping the factors uncorrelated (Sindosiet al. 2003). The number of components produced is equiva-lent to the number of original input variables and account for100% of the total variance of all original variables. Since onlya few components may account for the majority of the totalvariance, it may be unnecessary to retain all components.Several methods are available for determining the number ofcomponents to be retained (Jolliffe 1990, 1993; McGregorand Bamzelis 1995). One of the most known componentselection techniques selects components with eigenvalues>1. This is based on the idea that all new variables shouldhave greater explanatory power than the original variables,which have an eigenvalue of 1. Some papers have establishedthat selecting components with eigenvalues <1 can result in anincrease of the explanatory power and thus suggestedretaining the number of components with the largest explainedcumulative variance that account for at least 80 % of the totalvariance of the original variables that has to be explained bythe factors (Jolliffe 1990). Note that these methods are
considered subjective (McGregor and Bamzelis 1995). Weapplied the latter procedure, as perhaps the most commonmethod, for calculating the number of components to beretained (Sindosi et al. 2003; Liu 2009).
Cluster analysis
The relationship between the original variables and the com-ponents is expressed by component loadings. When squared,the loadings are equivalent to the correlation between thecomponent and the original variable. The component loadingsare therefore used to physically interpret the components.Calculation of the component scores is the next step of theclassification process in developing weather element catego-ries. The days involved are classified into groups of days withthe most similar component score structure, using a clusteringtechnique (McGregor and Bamzelis 1995). The aim of themethod is to maximize the homogeneity of objects within theclusters and also to maximize the heterogeneity between theclusters. Each day corresponds to a point in them-dimensionalspace and each cluster consists of those observations, whichare “close” to each other in this space. Here, a non-hierarchicalcluster analysis with the k-means method (Anderberg 1973)was applied using the Mahalanobis metric (Mahalanobis1936) available in MATLAB 7.5.0.
A further decision concerning cluster analysis is the selec-tion of the optimum number of clusters. Our decision onselecting the optimum cluster number is associated with thewithin cluster homogeneity. The homogeneity within clusterswas measured by RMSD defined as the sum of the root meansquare deviations of cluster elements from the correspondingcluster centre over clusters. As the RMSD will usually de-crease with an increasing number of clusters, this quantity isnot very useful for deciding about the optimal number ofclusters. However, the change of RMSD (CRMSD) versusthe change of cluster numbers, or rather the change ofCRMSD (CCRMSD) is much more informative. Here, work-ing with cluster numbers from 15 to 1, an optimal clusternumber was selected so as to maximize the change inCRMSD. The rationale behind this approach is that the num-ber of clusters producing the largest improvement in clusterperformance compared to that for a smaller number of clustersis considered optimal (Makra et al. 2010).
We stress that clustering of the days considered was basedexclusively on meteorological data. In order to characterisethe clusters retained, in terms of their meteorology, meanvalues of the original meteorological variables for the dayscomprising each cluster were calculated. In this way, eachgroup will represent a specific weather type.
After producing the meteorology based clusters of the daysconsidered, mean daily values of the air pollutants and air-borne pollen variables, as well as mean daily number ofasthma ED admissions are calculated for each cluster.
Int J Biometeorol (2015) 59:1269–1289 1273
Hence, cluster-related associations between the mean dailyvalues of air pollutants and airborne pollen variables on onehand and the corresponding mean daily number of asthma ERadmissions on the other hand are revealed.
Analysis of variance (ANOVA) and Tukey test
When determining the synoptic types, only meteorologicalparameters are taken into account, excluding emergency ad-missions, pollen data and the chemical air pollutants. Hence,the differences of the mean number of ED visits, the meanconcentrations of pollen data and the mean levels of thechemical air pollutants calculated for each synoptic type needa further statistical evaluation. This is performed by the meth-od of one-way analysis of variance (ANOVA) for the means ofall the three variables mentioned above. By using the method,significant differences in the mean number of asthma EDvisits, furthermore the mean levels of both the pollen variablesand the chemical air pollutants of the different synoptic types(clusters) can be determined. If ANOVA, based on the F test,detects significant differences among these means then anoth-er test is applied to determine that specifically which clusterpairs differ significantly from each other. Significant differ-ences among cluster related mean numbers of emergencyadmissions may inform us about the dependence of asthmaED visits from the ensembles of the influencing variables.There are several versions available for comparing meanscalculated from subsamples of a sample. A relatively simplebut effective way is to use the Tukey test. It performs well interms of both the accumulation of first order errors of the testand the test power (Tukey 1985). In this way, the Tukey’shonestly significant difference test is applied in order to quan-titatively compare the mean number of asthma ED visits andthe mean levels of the above air pollutants between each pairof synoptic types (pairwise multiple comparisons; Tukey1985; Sindosi et al. 2003).
All statistical computations were performed withMATLAB software.
Comparability of the test statistics
The two objective classifications have different number ofweather types for the three different periods examined. Inorder to take the results of ANOVA and Tukey tests compa-rable, the average of numbers of days classified into differenttypes (total number of days divided by the number of types)should be the same for the two classification approaches. Thistask is solved as follows. Since the objectively defined weath-er classification consists of substantially smaller number oftypes, it comprises considerably higher average number ofdays per types (y) compared to that of the Spatial SynopticClassification (SSC) weather types (x). Hence, (y−x)/y portionof days are excluded randomly from the original data set when
classifying days into the objectively defined weather types.Due to the different number of clusters for the objectivelydefined weather types, the task should be implemented foreach pollen-related period, respectively.
Results
Mean sea-level pressure fields of the objectively definedweather types
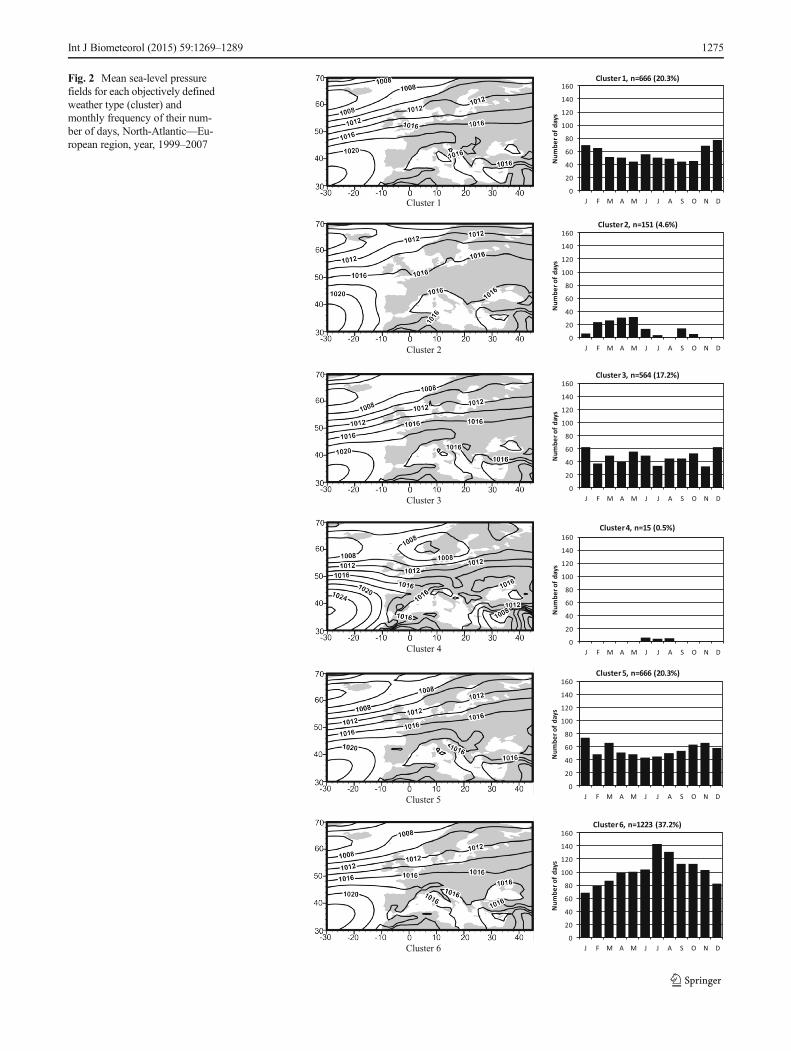
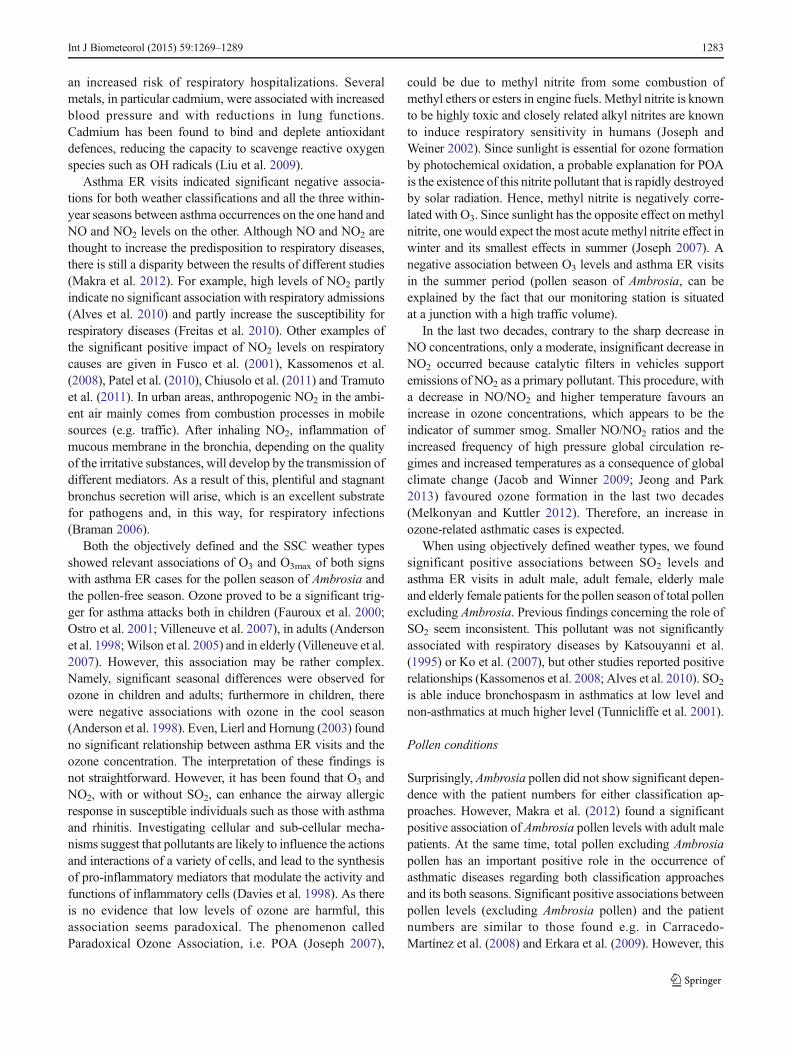
For the yearly period, altogether, six weather types wereclassified. These types and the corresponding pressure pat-terns with the associated mean daily air pollution and airbornepollen levels, as well as mean daily asthma ED cases aredescribed as follows (Fig. 2).
Cluster 1: During its occurrence, an anticyclone extendsfrom the region of Azores over Central Europe. Thisweather type is most frequent in the winter months be-tween November and February. Due to its predominancein winter, when this type occurs, the temperature param-eters and global solar flux are low, whilst relative humid-ity and air pressure are high. Among the air pollutants,NO concentration is high, whilst levels of O3 and O3max,as well as the remaining pollen are low. Prevalence of allasthma ER categories for adults is low and for elderly ishigh, respectively. At the same time, it is around averagefor each category of all cases (Fig. 2).Cluster 2: The frequency of this weather type is little. Itmostly occurs in the first half of the year. This cluster ischaracterized by undisturbed weather conditions withhigh global solar flux and daily temperature range, fur-thermore low wind speed. The levels of CO, ozone pa-rameters and SO2 are high, whilst those of NO and NO2
are the lowest of all clusters. Mean values of asthma ERcategories, except for female and elderly female patientsare very high (Fig. 2).Cluster 3: This is the third most frequent weather type. Itssea-level pressure field is very similar to that of cluster 1.Though the values of the global solar flux and the tem-perature parameters are slightly higher for cluster 3 thanfor cluster 1; unsurprisingly, those of the remaining me-teorological elements, air pollutants and airborne pollenare very similar. Furthermore, the prevalence of female,total, adult female and adult total patients are very low(Fig. 2).Cluster 4: The weather type featured by this clusteroccurs only on 15 days (0.5 %) from the 9-year periodexamined. Hence, this cluster is not important in classi-fying the environmental parameters and the differentpatient categories (Fig. 2).
1274 Int J Biometeorol (2015) 59:1269–1289
Cluster 1
0
20
40
60
80
100
120
140
160
J F M A M J J A S O N D
Num
ber o
f day
s
Cluster 1, n=666 (20.3%)
Cluster 2
0
20
40
60
80
100
120
140
160
J F M A M J J A S O N D
Num
ber o
f day
s
Cluster 2, n=151 (4.6%)
Cluster 3
0
20
40
60
80
100
120
140
160
J F M A M J J A S O N D
Num
ber o
f day
s
Cluster 3, n=564 (17.2%)
Cluster 40
20
40
60
80
100
120
140
160
J F M A M J J A S O N D
Num
ber o
f day
s
Cluster 4, n=15 (0.5%)
Cluster 5
0
20
40
60
80
100
120
140
160
J F M A M J J A S O N D
Num
ber o
f day
s
Cluster 5, n=666 (20.3%)
Cluster 6
0
20
40
60
80
100
120
140
160
J F M A M J J A S O N D
Num
ber o
f day
s
Cluster 6, n=1223 (37.2%)
Fig. 2 Mean sea-level pressurefields for each objectively definedweather type (cluster) andmonthly frequency of their num-ber of days, North-Atlantic—Eu-ropean region, year, 1999–2007
Int J Biometeorol (2015) 59:1269–1289 1275
Cluster 5: This type has an anticyclonic character with anundisturbed weather. It happens with almost equal fre-quency in each month of the year and is characterized bylow temperature parameters and low global solar flux.During its occurrence, CO and NO concentration are thehighest of all clusters, whilst ozone parameters are low.At the same time, the frequency of the asthma ED cate-gories are slightly above average (Fig. 2).Cluster 6: This is the equally most frequent weather typewith cluster 1. During its occurrence, global solar fluxand relative humidity are very low, whilst the wind speedis the highest. All chemical air pollutants indicate lowvalues except for NO. Since average concentrations ofNO in clusters 1 and 6 are the same, higher enrichment ofozone in cluster 6 compared to cluster 1 can be explainedwith the lower cloudiness (in this case advection is sup-posed to be neglected; Fig. 2).
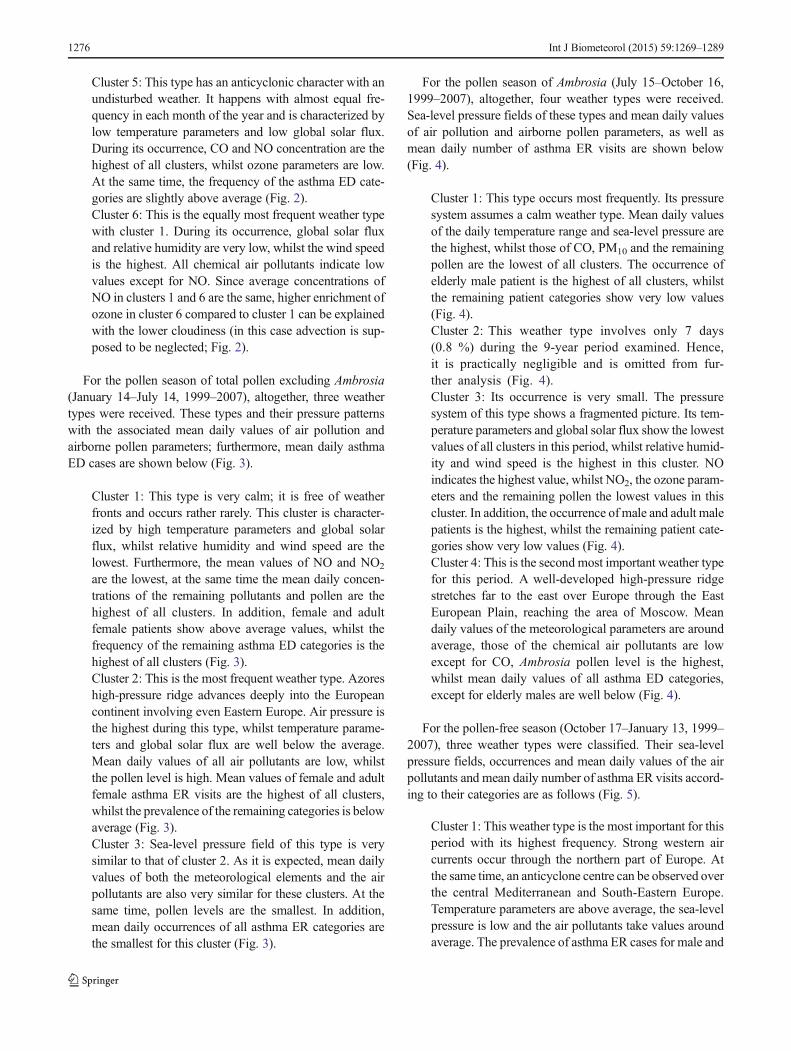
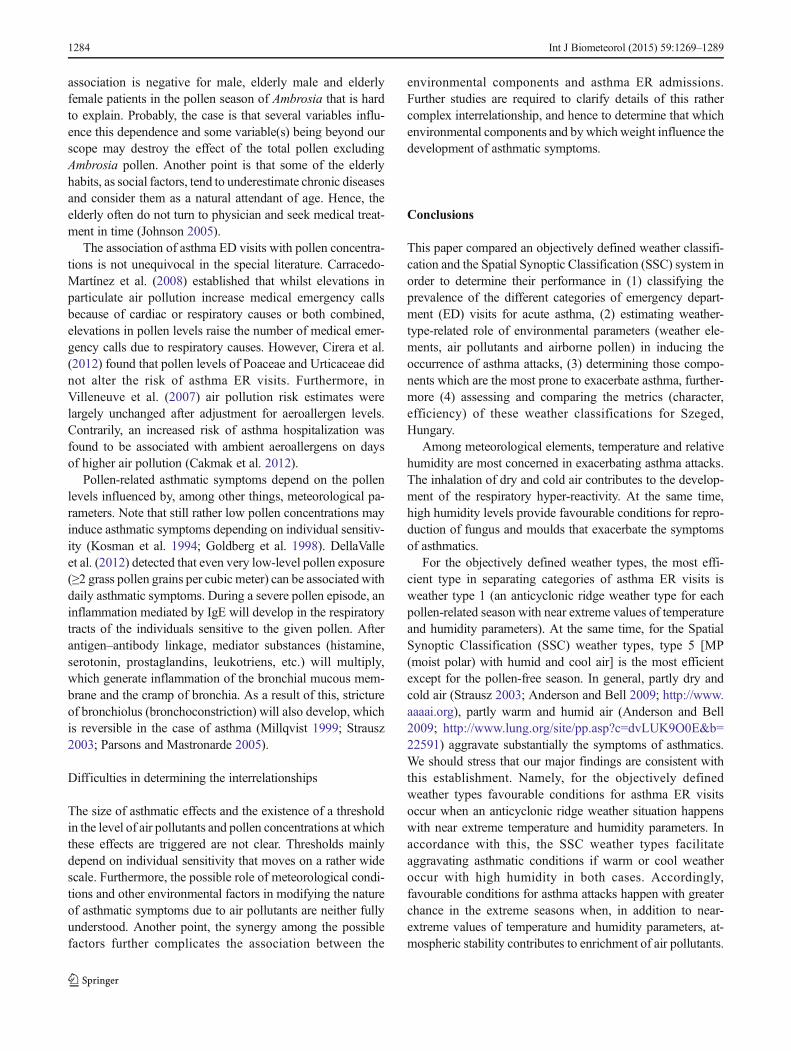
For the pollen season of total pollen excluding Ambrosia(January 14–July 14, 1999–2007), altogether, three weathertypes were received. These types and their pressure patternswith the associated mean daily values of air pollution andairborne pollen parameters; furthermore, mean daily asthmaED cases are shown below (Fig. 3).
Cluster 1: This type is very calm; it is free of weatherfronts and occurs rather rarely. This cluster is character-ized by high temperature parameters and global solarflux, whilst relative humidity and wind speed are thelowest. Furthermore, the mean values of NO and NO2
are the lowest, at the same time the mean daily concen-trations of the remaining pollutants and pollen are thehighest of all clusters. In addition, female and adultfemale patients show above average values, whilst thefrequency of the remaining asthma ED categories is thehighest of all clusters (Fig. 3).Cluster 2: This is the most frequent weather type. Azoreshigh-pressure ridge advances deeply into the Europeancontinent involving even Eastern Europe. Air pressure isthe highest during this type, whilst temperature parame-ters and global solar flux are well below the average.Mean daily values of all air pollutants are low, whilstthe pollen level is high. Mean values of female and adultfemale asthma ER visits are the highest of all clusters,whilst the prevalence of the remaining categories is belowaverage (Fig. 3).Cluster 3: Sea-level pressure field of this type is verysimilar to that of cluster 2. As it is expected, mean dailyvalues of both the meteorological elements and the airpollutants are also very similar for these clusters. At thesame time, pollen levels are the smallest. In addition,mean daily occurrences of all asthma ER categories arethe smallest for this cluster (Fig. 3).
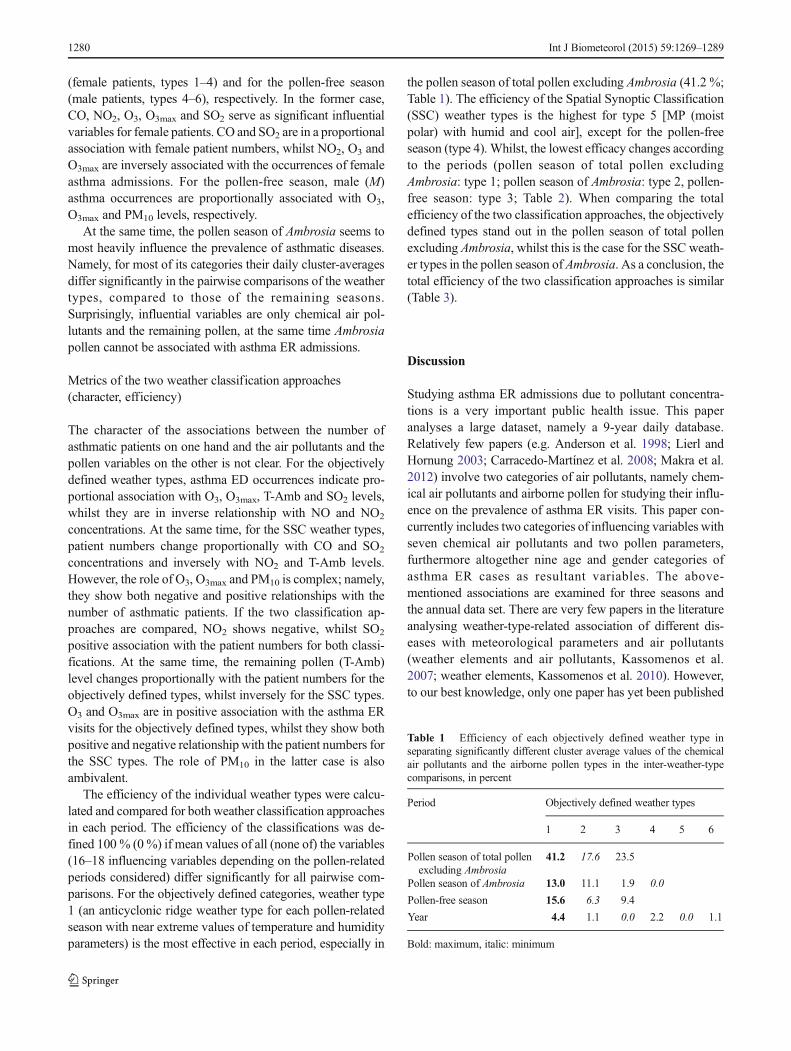
For the pollen season of Ambrosia (July 15–October 16,1999–2007), altogether, four weather types were received.Sea-level pressure fields of these types and mean daily valuesof air pollution and airborne pollen parameters, as well asmean daily number of asthma ER visits are shown below(Fig. 4).
Cluster 1: This type occurs most frequently. Its pressuresystem assumes a calm weather type. Mean daily valuesof the daily temperature range and sea-level pressure arethe highest, whilst those of CO, PM10 and the remainingpollen are the lowest of all clusters. The occurrence ofelderly male patient is the highest of all clusters, whilstthe remaining patient categories show very low values(Fig. 4).Cluster 2: This weather type involves only 7 days(0.8 %) during the 9-year period examined. Hence,it is practically negligible and is omitted from fur-ther analysis (Fig. 4).Cluster 3: Its occurrence is very small. The pressuresystem of this type shows a fragmented picture. Its tem-perature parameters and global solar flux show the lowestvalues of all clusters in this period, whilst relative humid-ity and wind speed is the highest in this cluster. NOindicates the highest value, whilst NO2, the ozone param-eters and the remaining pollen the lowest values in thiscluster. In addition, the occurrence of male and adult malepatients is the highest, whilst the remaining patient cate-gories show very low values (Fig. 4).Cluster 4: This is the second most important weather typefor this period. A well-developed high-pressure ridgestretches far to the east over Europe through the EastEuropean Plain, reaching the area of Moscow. Meandaily values of the meteorological parameters are aroundaverage, those of the chemical air pollutants are lowexcept for CO, Ambrosia pollen level is the highest,whilst mean daily values of all asthma ED categories,except for elderly males are well below (Fig. 4).
For the pollen-free season (October 17–January 13, 1999–2007), three weather types were classified. Their sea-levelpressure fields, occurrences and mean daily values of the airpollutants and mean daily number of asthma ER visits accord-ing to their categories are as follows (Fig. 5).
Cluster 1: This weather type is the most important for thisperiod with its highest frequency. Strong western aircurrents occur through the northern part of Europe. Atthe same time, an anticyclone centre can be observed overthe central Mediterranean and South-Eastern Europe.Temperature parameters are above average, the sea-levelpressure is low and the air pollutants take values aroundaverage. The prevalence of asthma ER cases for male and
1276 Int J Biometeorol (2015) 59:1269–1289

adult male patients is the highest, whilst for all the elderlycategories is the lowest (Fig. 5).Cluster 2: The sea-level pressure system of this type isvery similar to that of cluster 1. Accordingly, mean dailyvalues of the meteorological parameters are also verysimilar in these clusters, with their somewhat highervalues in cluster 2: Mean daily values of NO, NO2 andthe ozone parameters are the highest, whilst those of COand PM10 are the lowest in this cluster. Mean dailynumber of all asthma ER categories is the lowest in thiscluster, however, elderly male patients are the most fre-quent here (Fig. 5).Cluster 3: The similarity of this weather type is not soremarkable with clusters 1 or 2 than between clusters 1and 2. Definitely stronger western air currents can beobserved over northern Europe than for clusters 1 or 2.At the same time, the high-level pressure formation in thecentral Mediterranean migrates over Central Europe and,simultaneously, gets substantially stronger. Since this is awinter type with a highly developed anticyclone,
temperature parameters, global solar flux and wind speedshould be low, whilst relative humidity and sea-levelpressure should be high as they are in reality, as well.Among air pollutants only, CO level is the highest, whilstconcentrations of the remaining air pollutants are thelowest, except for PM10. Furthermore, according to ourexpectations, mean daily number of asthma ER patients isthe highest or above their average practically for eachpatient category (Fig. 5).
Inter-weather-type comparison of the air pollutants and pollenvariables for the two weather classification approaches
In order to determine the influence of the weather types on theconcentrations of the air pollutants (seven variables) and thepollen types (two variables), as well as the prevalence of acuteasthma ED visits (nine variables), ANOVAwas performed onthe here-mentioned variables (altogether 18 variables).Calculations were implemented for both weather
Cluster 1
0
20
40
60
80
100
120
140
160
J F M A M J J A S O N D
Num
ber o
f day
s
Cluster 1, n=127 (7.8%)
Cluster 2
0
20
40
60
80
100
120
140
160
J F M A M J J A S O N D
Num
ber o
f day
s
Cluster 2, n=863 (52.7%)
Cluster 3
0
20
40
60
80
100
120
140
160
J F M A M J J A S O N D
Num
ber o
f day
s
Cluster 3, n=648 (39.6%)
Fig. 3 Mean sea-level pressurefields for each objectively definedweather type (cluster) andmonthly frequency of their num-ber of days, North-Atlantic—Eu-ropean region, pollen season oftotal pollen excluding Ambrosia(January 14–July 14), 1999–2007
Int J Biometeorol (2015) 59:1269–1289 1277

classification approaches, as well as for all the three within-year periods and the annual data sets. It was found that clusteraveraged mean daily values of the above variables indicatedsignificant inter-weather-type differences at least at the 95 %probability level.
For the objectively defined weather types, no significantinter-weather-type differences can be observed in the meandaily number of the patient categories in the annual data set(six weather types, Fig. 2). Nevertheless, significant
differences for mean daily values of O3 between types 1 and2, furthermore for those of O3 and O3max between types 1, 2, 3and4, as well as O3max between types 1, 2, 3, 4, 5 and 6 can beobserved, respectively.
At the same time, in the pollen season of total pollenexcluding Ambrosia (three weather types, Fig. 3), total adult(Tad) and total elderly (Teld) patients show significant differ-ences in their cluster averaged prevalence between types 1 and2, furthermore mean daily values of these patient variables
Cluster 1
0
20
40
60
80
100
120
140
160
J F M A M J J A S O N D
Num
ber o
f day
s
Cluster 1, n=412 (48.7%)
Cluster 2
0
20
40
60
80
100
120
140
160
J F M A M J J A S O N D
Num
ber o
f day
s
Cluster 2, n=7 (0.8%)
Cluster 3
0
20
40
60
80
100
120
140
160
J F M A M J J A S O N D
Num
ber o
f day
s
Cluster 3, n=46 (5.4%)
Cluster 4
0
20
40
60
80
100
120
140
160
J F M A M J J A S O N D
Num
ber o
f day
s
Cluster 4, n=381 (45.0%)
Fig. 4 Mean sea-level pressurefields for each objectively definedweather type (cluster) andmonthly frequency of their num-ber of days, North-Atlantic—Eu-ropean region, pollen season ofAmbrosia (July 15–October 16),1999–2007
1278 Int J Biometeorol (2015) 59:1269–1289

completed with that of the female patients (F) also indicateremarkable differences between types 1, 2 and 3 (Fig. 3). Fortype 1, temperature parameters and global solar flux aresubstantially higher, whilst sea-level pressure and wind speedare lower than for types 2 and 3. Calmweather and high globalsolar flux in type 1 may contribute to enrichment of SO2 andthe remaining pollen (T-Amb) and, in this way, indirectly mayfacilitate to increase the patient numbers (Fig. 3). However,NO and NO2 affect inversely, whilst T-Amb values propor-tionally the number of asthmatic patients both for types 1 and2 and 1 and 3.
For the pollen season of Ambrosia (four weather types,Fig. 4), only types 1 and 2 indicate significant differences inpatient numbers, namely in the mean daily values of asthmaED occurrences of female (F), total (T) and female elderly(Feld) patients, respectively. In addition, O3, O3max and T-Ambshow significant differences in their daily means when com-pared types 1 and 2. All the three pollutants indicate signifi-cant positive association with the prevalence of the abovepatient categories, respectively. However, since altogether
7 days belong to type 2, the here-mentioned comparison oftypes 1 and 2 concerns very few cases (Fig. 4).
For the pollen-free season, mean daily prevalence of femaleelderly (Feld) and total elderly (Teld) patients differ significant-ly between types 1 and 2, and types 1 and 3. In addition, meandaily NO2 levels also show substantial difference betweentypes 1 and 3 (Fig. 5). For types 1 and 2 significant differencesin patient numbers cannot be associated with air pollutants andpollen variables. Concerning the meteorological elements,temperature parameters and global solar flux are substantiallyhigher in type 2 compared to type 1. However, possibly highwind speed in type 2 restricts enrichment of air pollutants.Significant difference of NO2 concentration between types 1and 3 is in an inverse connectionwith female elderly (Feld) andtotal elderly (Teld) patients.
For Spatial Synoptic Classification (SSC) weather types,no significant inter-weather-type differences occur in meandaily number of the patient categories in the pollen season oftotal pollen excluding Ambrosia. Whilst, only one patientvariable differs substantially both for the annual data set
Cluster 1
0
20
40
60
80
100
120
140
160
J F M A M J J A S O N D
Num
ber o
f day
s
Cluster 1, n=408 (50.9%)
Cluster 2
0
20
40
60
80
100
120
140
160
J F M A M J J A S O N D
Num
ber o
f day
s
Cluster 2, n=239 (29.8%)
Cluster 3
0
20
40
60
80
100
120
140
160
J F M A M J J A S O N D
Num
ber o
f day
s
Cluster 3, n=154 (19.2%)
Fig. 5 Mean sea-level pressurefields for each objectively definedweather type (cluster) andmonthly frequency of their num-ber of days, North-Atlantic–Eu-ropean region, pollen-free season(October 17–January 13), 1999–2007
Int J Biometeorol (2015) 59:1269–1289 1279
(female patients, types 1–4) and for the pollen-free season(male patients, types 4–6), respectively. In the former case,CO, NO2, O3, O3max and SO2 serve as significant influentialvariables for female patients. CO and SO2 are in a proportionalassociation with female patient numbers, whilst NO2, O3 andO3max are inversely associated with the occurrences of femaleasthma admissions. For the pollen-free season, male (M)asthma occurrences are proportionally associated with O3,O3max and PM10 levels, respectively.
At the same time, the pollen season of Ambrosia seems tomost heavily influence the prevalence of asthmatic diseases.Namely, for most of its categories their daily cluster-averagesdiffer significantly in the pairwise comparisons of the weathertypes, compared to those of the remaining seasons.Surprisingly, influential variables are only chemical air pol-lutants and the remaining pollen, at the same time Ambrosiapollen cannot be associated with asthma ER admissions.
Metrics of the two weather classification approaches(character, efficiency)
The character of the associations between the number ofasthmatic patients on one hand and the air pollutants and thepollen variables on the other is not clear. For the objectivelydefined weather types, asthma ED occurrences indicate pro-portional association with O3, O3max, T-Amb and SO2 levels,whilst they are in inverse relationship with NO and NO2
concentrations. At the same time, for the SSC weather types,patient numbers change proportionally with CO and SO2
concentrations and inversely with NO2 and T-Amb levels.However, the role of O3, O3max and PM10 is complex; namely,they show both negative and positive relationships with thenumber of asthmatic patients. If the two classification ap-proaches are compared, NO2 shows negative, whilst SO2
positive association with the patient numbers for both classi-fications. At the same time, the remaining pollen (T-Amb)level changes proportionally with the patient numbers for theobjectively defined types, whilst inversely for the SSC types.O3 and O3max are in positive association with the asthma ERvisits for the objectively defined types, whilst they show bothpositive and negative relationship with the patient numbers forthe SSC types. The role of PM10 in the latter case is alsoambivalent.
The efficiency of the individual weather types were calcu-lated and compared for both weather classification approachesin each period. The efficiency of the classifications was de-fined 100 % (0%) if mean values of all (none of) the variables(16–18 influencing variables depending on the pollen-relatedperiods considered) differ significantly for all pairwise com-parisons. For the objectively defined categories, weather type1 (an anticyclonic ridge weather type for each pollen-relatedseason with near extreme values of temperature and humidityparameters) is the most effective in each period, especially in
the pollen season of total pollen excluding Ambrosia (41.2 %;Table 1). The efficiency of the Spatial Synoptic Classification(SSC) weather types is the highest for type 5 [MP (moistpolar) with humid and cool air], except for the pollen-freeseason (type 4). Whilst, the lowest efficacy changes accordingto the periods (pollen season of total pollen excludingAmbrosia: type 1; pollen season of Ambrosia: type 2, pollen-free season: type 3; Table 2). When comparing the totalefficiency of the two classification approaches, the objectivelydefined types stand out in the pollen season of total pollenexcluding Ambrosia, whilst this is the case for the SSC weath-er types in the pollen season of Ambrosia. As a conclusion, thetotal efficiency of the two classification approaches is similar(Table 3).
Discussion
Studying asthma ER admissions due to pollutant concentra-tions is a very important public health issue. This paperanalyses a large dataset, namely a 9-year daily database.Relatively few papers (e.g. Anderson et al. 1998; Lierl andHornung 2003; Carracedo-Martínez et al. 2008; Makra et al.2012) involve two categories of air pollutants, namely chem-ical air pollutants and airborne pollen for studying their influ-ence on the prevalence of asthma ER visits. This paper con-currently includes two categories of influencing variables withseven chemical air pollutants and two pollen parameters,furthermore altogether nine age and gender categories ofasthma ER cases as resultant variables. The above-mentioned associations are examined for three seasons andthe annual data set. There are very few papers in the literatureanalysing weather-type-related association of different dis-eases with meteorological parameters and air pollutants(weather elements and air pollutants, Kassomenos et al.2007; weather elements, Kassomenos et al. 2010). However,to our best knowledge, only one paper has yet been published
Table 1 Efficiency of each objectively defined weather type inseparating significantly different cluster average values of the chemicalair pollutants and the airborne pollen types in the inter-weather-typecomparisons, in percent
Period Objectively defined weather types
1 2 3 4 5 6
Pollen season of total pollenexcluding Ambrosia
41.2 17.6 23.5
Pollen season of Ambrosia 13.0 11.1 1.9 0.0
Pollen-free season 15.6 6.3 9.4
Year 4.4 1.1 0.0 2.2 0.0 1.1
Bold: maximum, italic: minimum
1280 Int J Biometeorol (2015) 59:1269–1289

(Makra et al. 2008) studying the dependence of meteorolog-ical elements, air pollutants and pollen variables (13, 8 andagain 8 parameters, respectively) on nine symptom groups ofrespiratory diseases for different weather types. To our knowl-edge, the present paper can be considered the first studyanalysing weather-type-related association of two categoriesof pollutant variables (chemical air pollutants and pollenvariables) on the occurrence of a wide scale of age and gendercategories of asthmatic diseases.
Weather-type-related impact of environmental parameterson asthma occurrences
Meteorological conditions
Objectively defined weather types 1 for the pollen season oftotal pollen excluding Ambrosia and the pollen-free season arelow-pressure formations (Figs. 3 and 5). At the same time, theSSC weather type 5 is described as an MP (moist polar)formation with cloudy, humid and cool weather (Kalksteinet al. 1996; Sheridan 2002, 2003; Bower et al. 2007).Accordingly, favourable conditions for asthma ER visits occur
during low-pressure formations in both weather classificationapproaches.
Meteorological parameters influence asthma ER visits;however, this association is generally not clear. Namely, bothair temperature and relative humidity were found positivelycorrelated with acute pediatric (Fauroux et al. 2000) and adult(May et al. 2011; Hayes et al. 2013) asthma ED admissions.Kassomenos et al. (2010) also associated increased hospitaladmissions with high relative humidity. Furthermore, highestdaily mortality was observed on days with southerly flowconditions for the Athens Basin, indicating that high relativehumidity, though indirectly, may substantially influenceweather-related asthmatic diseases, as well (Kassomenoset al. 2007). At the same time, according to others, highasthma ED admissions occurred on days with low levels ofhumidity (Celenza et al. 1996; Dales et al. 2000).Furthermore, a significant negative association was reportedbetween minimum temperature and asthma exacerbation inadults (Celenza et al. 1996; Abe et al. 2009). The evidenceregarding the effect of rainfall is also mixed (Jamason et al.1997; Rosas et al. 1998). For instance, heavy rain during thepollen season was thought to have suppressed both the size ofthe pollen peaks and their duration. At the same time, thun-derstorms have been associated with asthma epidemics(Celenza et al. 1996; Marks et al. 2001). One possible expla-nation is that the humidity preceding a thunderstorm, or rain-fall during a thunderstorm, leads to the break up of pollengrains releasing starch granules comprising allergens that arethen circulated by the exceptional meteorological conditions(Atkinson and Strachan 2004).
Physiological effects of the meteorological elementsexplaining the above contradictory associations are as follows.(1) Temperature. Inhalation of cold air in hyper-reactivebronchia induces inflammation of the mucous membrane.Furthermore, the inhalation of dry and cold air also activatesthe so-called cold receptors on the nasal mucous membrane,which contributes to the development of the respiratory hyper-reactivity (Strausz 2003). (2) Relative humidity. (2a) Afterinhaling dry air, increased neutrofil, eosinophil and leukotriencontent of bronchial lavatory fluid was detected. In general, ifthe relative humidity is less than 15 %, this may trigger anexcessive cough for asthmatics (http://www.aaaai.org). Fromthe above, we can conclude that repeated exposition to dry airproduces inflammation, obstruction and hyper-reactivity ofthe small respiratory tracts. (2b) When breathing humid air,due to the fact that water vapour molecules displace a part ofoxygen molecules, asthmatics feel difficult inhaling it.Furthermore, high humidity levels provide favourable condi-tions for reproduction of fungus and moulds that exacerbatethe symptoms of asthmatics. In addition, when the humidity isgreater than 50 %, the amount of dust mites in the air isincreased. For these reasons, high relative humidity is contra-indicated for asthmatics by physicians. Note that air
Table 2 Efficiency of each SSC weather type in separatingsignificantly different cluster average values of the chemical airpollutants and the airborne pollen types in the inter-weather-type com-parisons, in percent
Period Spatial Synoptic Classification (SSC)weather types
1 2 3 4 5 6 7
Pollen season of total pollenexcluding Ambrosia
10.8 12.7 11.8 20.6 27.5 14.7 15.7
Pollen season of Ambrosia 20.4 10.2 23.1 20.4 25.0 20.4 12.0
Pollen-free season 15.6 10.4 3.1 16.7 11.5 11.5 8.3
Year 22.2 15.7 19.4 27.8 30.6 23.1 16.7
Bold: maximum, italic: minimum
Table 3 Total efficiency of the twoweather classifications in separatingsignificantly different cluster average values of the chemical air pollutantsand the airborne pollen types in the inter-weather type comparisons, inpercent
Period Weather types
Objectivelydefined types
SSC weathertypes
Pollen season of total pollenexcluding Ambrosia
27.4 16.3
Pollen season of Ambrosia 6.5 18.8
Pollen-free season 10.4 11.0
Mean performance 14.8 15.4
Int J Biometeorol (2015) 59:1269–1289 1281
conditioners can be of benefit for asthmatics, since they re-move the humidity and air pollution, as well as particles ofbiological origin from the air and, as a result, make it cleanerand easier to breath. Nevertheless, low humidity in itself helpsto control mould and dust mites in the air (http://www.lung.org/site/pp.asp?c=dvLUK9O0E&b=22591). On the whole, amedium relative humidity between 35 and 50 % isrecommended for asthmatic patients to keep in their homes(http://www.cdc.gov/asthma/faqs.htm). (3) Wind directions.Winds partly influence air pollution and partly desiccate andcool the air (see: hyper-reactivity occurring by the influence ofcold and dry air).
Significant influence of air pollution on acute human re-spiratory mortality is overall greater than influences fromweather, and varies with season and the entire weather situa-tion. According to Vanos et al. (2014), the spring seasonpresents the overall greatest risk of respiratory-related death.In particular, the risks due to air pollution exposure are thehighest on dry tropical (DT) and moist tropical (MT) dayswith CO and NO2, the most harmful air pollutants.
The interaction between temperature and specific air pol-lutants during extreme hot days works synergistically to neg-atively affect respiratory mortality (Sheridan and Kalkstein2010; Vanos et al. (2014). At the same time, Anderson andBell (2009) found respiratory mortality effects to be greater inboth cold and heat. The mortality effects of PM10 were alsosignificantly higher on warmer days. Extreme heat days inAustralia significantly increased respiratory mortality riskwith O3 (Vaneckova et al. 2008). Alternatively, Keatinge andDonaldson (2001) found that excess deaths were associatedwith cold weather patterns more so than ambient SO2 and COconcentrations in the Greater London area (1976–1995).
Cai et al. (2014) established a stronger association betweenair pollution and asthma hospitalization in the cool season,compared to the warm season. This finding is consistent withprior studies in Shanghai (Chen et al. 2010) and Hong Kong(Wong et al. 2002). In both cities, air pollution levels werehigher and more variable in the cool season than in the warmseason. During the warm season, Shanghai and Hong Kongresidents use air conditioning more frequently due to therelatively higher temperature and humidity, thus reducingtheir indoor exposure. In addition, frequent rain in the warmseason partly wash out air pollutants reducing their concen-tration in ambient air, partly may reduce time spent outdoorsand thus personal exposure. In contrast, the cool season inthese cities is drier and less variable, so people are more likelyto go outdoors and/or open the windows.
Vanos et al. (2014) reported that the temperature effect onrespiratory mortality was greater when pollutant levels werehigher, commonly referring to O3 and emphasized the syner-gism between air pollution and heat or cold. Cheng et al.(2009) also found elevated respiratory mortality associatedwith heat and air pollution in five major Canadian cities, with
80 % attributable to air pollution, and 20 % to temperature. Itis suggested that such temperature effects are likely to persisteven after controlling for multiple air pollutants in modelling,particularly O3 and PM2.5 (O’Neill et al. 2005; Gasparrini andArmstrong 2010).
Chemical air pollutants
Several examples are available indicating significant positiveassociation between NO2 (in children, Bedeschi et al. 2007;Villeneuve et al. 2007; in adults, Cirera et al. 2012; in elderly,Anderson et al. 1998; Villeneuve et al. 2007), SO2 (in chil-dren, Anderson et al. 1998; in adults, Wilson et al. 2005;Cirera et al. 2012), CO (in children and elderly, Villeneuveet al. 2007), TSP (in children, Bedeschi et al. 2007), PM10 (inchildren, Ostro et al. 2001; Bedeschi et al. 2007; Villeneuveet al. 2007; in elderly, Villeneuve et al. 2007) and black smoke(in elderly, Anderson et al. 1998) on one hand and asthma ERadmissions, on the other. Furthermore, according to Vanoset al. (2014), all relative risk estimates for respiratory diseaseare significantly above 1.0 for all combinations of season,pollutant and weather type.
However, these relationships are rather complex.We did not receive significant association between the
occurrence of asthma ER admissions and CO levels.However, CO has been associated with respiratory hospitaladmissions in several studies. Freitas et al. (2010) did not findany statistically significant relationship between respiratoryhospital admissions and CO.Makra et al. (2012) detected bothpositive and negative relationships between asthma attacksand CO concentration, respectively. Whilst, others (Fuscoet al. 2001; Kassomenos et al. 2008; Giovannini et al. 2010;Darrow et al. 2011; Tramuto et al. 2011) confirmed the pos-itive role of CO on respiratory health effects. The impact of along-lasting but low-level exposure to CO on respiratorysystem is therefore still unclear.
When using SSC weather types, we received significantinverse (for males, elderly males and elderly females in thepollen season of Ambrosia) and proportional (for males in thepollen-free season) association between PM10 levels andasthma ER admissions, respectively. Kassomenos et al.(2008) found that elevated PM10 levels indicate a dominantrole among the main air pollutants. Fusco et al. (2001) andAlves et al. (2010) found that the association between partic-ulate matter and health conditions was not significant, whilstothers (Ko et al. 2007; Meng et al. 2007; Freitas et al. 2010;Namdeo et al. 2011; Tramuto et al. 2011; Makra et al. 2012)detected that the number of admissions for respiratory causesrose significantly with increased exposure to particulate mat-ter. It should be added that the health impact of particulates iscomplex as their biological effect can be influenced by theparticle size and composition (Alves et al. 2010). Cakmaket al. (2014) associated aluminium, nickel and titanium with
1282 Int J Biometeorol (2015) 59:1269–1289
an increased risk of respiratory hospitalizations. Severalmetals, in particular cadmium, were associated with increasedblood pressure and with reductions in lung functions.Cadmium has been found to bind and deplete antioxidantdefences, reducing the capacity to scavenge reactive oxygenspecies such as OH radicals (Liu et al. 2009).
Asthma ER visits indicated significant negative associa-tions for both weather classifications and all the three within-year seasons between asthma occurrences on the one hand andNO and NO2 levels on the other. Although NO and NO2 arethought to increase the predisposition to respiratory diseases,there is still a disparity between the results of different studies(Makra et al. 2012). For example, high levels of NO2 partlyindicate no significant association with respiratory admissions(Alves et al. 2010) and partly increase the susceptibility forrespiratory diseases (Freitas et al. 2010). Other examples ofthe significant positive impact of NO2 levels on respiratorycauses are given in Fusco et al. (2001), Kassomenos et al.(2008), Patel et al. (2010), Chiusolo et al. (2011) and Tramutoet al. (2011). In urban areas, anthropogenic NO2 in the ambi-ent air mainly comes from combustion processes in mobilesources (e.g. traffic). After inhaling NO2, inflammation ofmucous membrane in the bronchia, depending on the qualityof the irritative substances, will develop by the transmission ofdifferent mediators. As a result of this, plentiful and stagnantbronchus secretion will arise, which is an excellent substratefor pathogens and, in this way, for respiratory infections(Braman 2006).
Both the objectively defined and the SSC weather typesshowed relevant associations of O3 and O3max of both signswith asthma ER cases for the pollen season of Ambrosia andthe pollen-free season. Ozone proved to be a significant trig-ger for asthma attacks both in children (Fauroux et al. 2000;Ostro et al. 2001; Villeneuve et al. 2007), in adults (Andersonet al. 1998;Wilson et al. 2005) and in elderly (Villeneuve et al.2007). However, this association may be rather complex.Namely, significant seasonal differences were observed forozone in children and adults; furthermore in children, therewere negative associations with ozone in the cool season(Anderson et al. 1998). Even, Lierl and Hornung (2003) foundno significant relationship between asthma ER visits and theozone concentration. The interpretation of these findings isnot straightforward. However, it has been found that O3 andNO2, with or without SO2, can enhance the airway allergicresponse in susceptible individuals such as those with asthmaand rhinitis. Investigating cellular and sub-cellular mecha-nisms suggest that pollutants are likely to influence the actionsand interactions of a variety of cells, and lead to the synthesisof pro-inflammatory mediators that modulate the activity andfunctions of inflammatory cells (Davies et al. 1998). As thereis no evidence that low levels of ozone are harmful, thisassociation seems paradoxical. The phenomenon calledParadoxical Ozone Association, i.e. POA (Joseph 2007),
could be due to methyl nitrite from some combustion ofmethyl ethers or esters in engine fuels. Methyl nitrite is knownto be highly toxic and closely related alkyl nitrites are knownto induce respiratory sensitivity in humans (Joseph andWeiner 2002). Since sunlight is essential for ozone formationby photochemical oxidation, a probable explanation for POAis the existence of this nitrite pollutant that is rapidly destroyedby solar radiation. Hence, methyl nitrite is negatively corre-lated with O3. Since sunlight has the opposite effect on methylnitrite, one would expect the most acute methyl nitrite effect inwinter and its smallest effects in summer (Joseph 2007). Anegative association between O3 levels and asthma ER visitsin the summer period (pollen season of Ambrosia, can beexplained by the fact that our monitoring station is situatedat a junction with a high traffic volume).
In the last two decades, contrary to the sharp decrease inNO concentrations, only a moderate, insignificant decrease inNO2 occurred because catalytic filters in vehicles supportemissions of NO2 as a primary pollutant. This procedure, witha decrease in NO/NO2 and higher temperature favours anincrease in ozone concentrations, which appears to be theindicator of summer smog. Smaller NO/NO2 ratios and theincreased frequency of high pressure global circulation re-gimes and increased temperatures as a consequence of globalclimate change (Jacob and Winner 2009; Jeong and Park2013) favoured ozone formation in the last two decades(Melkonyan and Kuttler 2012). Therefore, an increase inozone-related asthmatic cases is expected.
When using objectively defined weather types, we foundsignificant positive associations between SO2 levels andasthma ER visits in adult male, adult female, elderly maleand elderly female patients for the pollen season of total pollenexcluding Ambrosia. Previous findings concerning the role ofSO2 seem inconsistent. This pollutant was not significantlyassociated with respiratory diseases by Katsouyanni et al.(1995) or Ko et al. (2007), but other studies reported positiverelationships (Kassomenos et al. 2008; Alves et al. 2010). SO2
is able induce bronchospasm in asthmatics at low level andnon-asthmatics at much higher level (Tunnicliffe et al. 2001).
Pollen conditions
Surprisingly, Ambrosia pollen did not show significant depen-dence with the patient numbers for either classification ap-proaches. However, Makra et al. (2012) found a significantpositive association of Ambrosia pollen levels with adult malepatients. At the same time, total pollen excluding Ambrosiapollen has an important positive role in the occurrence ofasthmatic diseases regarding both classification approachesand its both seasons. Significant positive associations betweenpollen levels (excluding Ambrosia pollen) and the patientnumbers are similar to those found e.g. in Carracedo-Martínez et al. (2008) and Erkara et al. (2009). However, this
Int J Biometeorol (2015) 59:1269–1289 1283
association is negative for male, elderly male and elderlyfemale patients in the pollen season of Ambrosia that is hardto explain. Probably, the case is that several variables influ-ence this dependence and some variable(s) being beyond ourscope may destroy the effect of the total pollen excludingAmbrosia pollen. Another point is that some of the elderlyhabits, as social factors, tend to underestimate chronic diseasesand consider them as a natural attendant of age. Hence, theelderly often do not turn to physician and seek medical treat-ment in time (Johnson 2005).
The association of asthma ED visits with pollen concentra-tions is not unequivocal in the special literature. Carracedo-Martínez et al. (2008) established that whilst elevations inparticulate air pollution increase medical emergency callsbecause of cardiac or respiratory causes or both combined,elevations in pollen levels raise the number of medical emer-gency calls due to respiratory causes. However, Cirera et al.(2012) found that pollen levels of Poaceae and Urticaceae didnot alter the risk of asthma ER visits. Furthermore, inVilleneuve et al. (2007) air pollution risk estimates werelargely unchanged after adjustment for aeroallergen levels.Contrarily, an increased risk of asthma hospitalization wasfound to be associated with ambient aeroallergens on daysof higher air pollution (Cakmak et al. 2012).
Pollen-related asthmatic symptoms depend on the pollenlevels influenced by, among other things, meteorological pa-rameters. Note that still rather low pollen concentrations mayinduce asthmatic symptoms depending on individual sensitiv-ity (Kosman et al. 1994; Goldberg et al. 1998). DellaValleet al. (2012) detected that even very low-level pollen exposure(≥2 grass pollen grains per cubic meter) can be associated withdaily asthmatic symptoms. During a severe pollen episode, aninflammation mediated by IgE will develop in the respiratorytracts of the individuals sensitive to the given pollen. Afterantigen–antibody linkage, mediator substances (histamine,serotonin, prostaglandins, leukotriens, etc.) will multiply,which generate inflammation of the bronchial mucous mem-brane and the cramp of bronchia. As a result of this, strictureof bronchiolus (bronchoconstriction) will also develop, whichis reversible in the case of asthma (Millqvist 1999; Strausz2003; Parsons and Mastronarde 2005).
Difficulties in determining the interrelationships
The size of asthmatic effects and the existence of a thresholdin the level of air pollutants and pollen concentrations at whichthese effects are triggered are not clear. Thresholds mainlydepend on individual sensitivity that moves on a rather widescale. Furthermore, the possible role of meteorological condi-tions and other environmental factors in modifying the natureof asthmatic symptoms due to air pollutants are neither fullyunderstood. Another point, the synergy among the possiblefactors further complicates the association between the
environmental components and asthma ER admissions.Further studies are required to clarify details of this rathercomplex interrelationship, and hence to determine that whichenvironmental components and by which weight influence thedevelopment of asthmatic symptoms.
Conclusions
This paper compared an objectively defined weather classifi-cation and the Spatial Synoptic Classification (SSC) system inorder to determine their performance in (1) classifying theprevalence of the different categories of emergency depart-ment (ED) visits for acute asthma, (2) estimating weather-type-related role of environmental parameters (weather ele-ments, air pollutants and airborne pollen) in inducing theoccurrence of asthma attacks, (3) determining those compo-nents which are the most prone to exacerbate asthma, further-more (4) assessing and comparing the metrics (character,efficiency) of these weather classifications for Szeged,Hungary.
Among meteorological elements, temperature and relativehumidity are most concerned in exacerbating asthma attacks.The inhalation of dry and cold air contributes to the develop-ment of the respiratory hyper-reactivity. At the same time,high humidity levels provide favourable conditions for repro-duction of fungus and moulds that exacerbate the symptomsof asthmatics.
For the objectively defined weather types, the most effi-cient type in separating categories of asthma ER visits isweather type 1 (an anticyclonic ridge weather type for eachpollen-related season with near extreme values of temperatureand humidity parameters). At the same time, for the SpatialSynoptic Classification (SSC) weather types, type 5 [MP(moist polar) with humid and cool air] is the most efficientexcept for the pollen-free season. In general, partly dry andcold air (Strausz 2003; Anderson and Bell 2009; http://www.aaaai.org), partly warm and humid air (Anderson and Bell2009; http://www.lung.org/site/pp.asp?c=dvLUK9O0E&b=22591) aggravate substantially the symptoms of asthmatics.We should stress that our major findings are consistent withthis establishment. Namely, for the objectively definedweather types favourable conditions for asthma ER visitsoccur when an anticyclonic ridge weather situation happenswith near extreme temperature and humidity parameters. Inaccordance with this, the SSC weather types facilitateaggravating asthmatic conditions if warm or cool weatheroccur with high humidity in both cases. Accordingly,favourable conditions for asthma attacks happen with greaterchance in the extreme seasons when, in addition to near-extreme values of temperature and humidity parameters, at-mospheric stability contributes to enrichment of air pollutants.
1284 Int J Biometeorol (2015) 59:1269–1289

The character of the associations between the number ofasthmatic patients on one hand and the air pollutants and thepollen variables on the other is not clear. Namely, they can beassociated both proportionally (SO2 for both classifications)and inversely (NO and NO2 for both classifications) withasthma ER occurrences both for the objectively defined andthe SSC weather types. This result is not surprising, since therelationship of any individual pollutant with asthma ER casesis complex and beyond the rather different individual sensi-tivity, different degrees of synergisms, include also unknownenvironmental and social factors that make rather difficult toclarify real associations.
Efficiency analysis makes it possible to select the appropriateweather classification approaches for indirectly forecasting ofspecific environmental conditions for asthma exacerbation, pro-viding in this way more precise information on environmentalrisk factors of asthma conditions. For the objectively definedcategories, weather type 1 (an anticyclonic ridge weather typewith near extreme values of temperature and humidity parame-ters) is the most effective in each pollen-related season, especial-ly in the pollen season of total pollen excluding Ambrosia(41.2 %). The efficiency of the Spatial Synoptic Classification(SSC) weather types is the highest for type 5 [MP (moist polar)with humid and cool air], except for the pollen-free season.When comparing the total efficiency of the two classificationapproaches, the objectively defined types stand out in the pollenseason of total pollen excluding Ambrosia, whilst this is the casefor the SSCweather types in the pollen season ofAmbrosia. As aconclusion, the total efficiency of the two classification ap-proaches is similar in spite of the fact that the methodology forderivation of the individual types within the two classificationapproaches is completely different.
Note that considerable evidence is available to suggest thatrecent warming has already had impacts on pollen amount andall pollen-related characteristics, as well (Beggs 2004; Beggsand Bambrick 2005). Hence, pollen induced asthma attacksaggravated by the ever-increasing air pollution are of majorconcern, worldwide.
Prediction of weather types 2 or 3 days in advance can be auseful tool for providing valuable information to public healthauthorities. Improvement of the performance of weather clas-sification approaches may substantially refine the predictionand, hence, may prepare for and/or prevent from risk situa-tions concerning asthma ED visits.
Acknowledgements The authors would like to thank Gábor Motika(Environmental Conservancy Inspectorate, Szeged, Hungary) for provid-ing daily meteorological data of Szeged; Miklós Juhász (University ofSzeged) for providing daily pollen concentration data of Szeged; IstvánIhász for providing daily seal level pressure grid data using ECMWFERA Interim Database and Zoltán Sümeghy for the digital mapping inFig. 1. This research was supported by the European Union and the Stateof Hungary, co-financed by the European Social Fund in the frameworkof TÁMOP 4.2.4. A/2-11-1-2012-0001 National Excellence Program.
Appendix
Spatial Synoptic Classification (SSC) weather types
DP (dry polar; type 2) is synonymous with the traditional cPair mass classification. This air mass is generally advectedfrom polar regions around a cold-core anticyclone and isusually associated with the lowest temperatures observed ina region for a particular time of year, as well as clear, dryconditions.
DM (dry moderate; type 1) air is mild and dry. It has notraditional analogy, but is often found with zonal flow in themiddle latitudes, especially in the lee of mountain ranges. Italso arises when a traditional air mass such as cP or mT hasbeen advected far from its source region and has thus modifiedconsiderably.
The DT (dry tropical; type 3) weather type is similar to thecT air mass; it represents the hottest and driest conditionsfound at any location. There are two primary sources of DT:either it is advected from the desert regions, such as theSonoran or Sahara Desert, or it is produced by rapidly de-scending air, whether via orography (such as the chinook) orstrong subsidence.
MP (moist polar; type 5) air is a large subset of the mP airmass, weather conditions are typically cloudy, humid, andcool. MP air appears either by inland transport from a coolocean, or as a result of frontal overrunning well to the south ofthe region. It can also arise in situ as a modified cP air mass,especially downwind of the Great Lakes.
MM (moist moderate; type 4) is considerably warmer andmore humid thanMP. The MM air mass typically appears in azone south of MP air, still in an area of overrunning but withthe responsible front much nearer. It can also arise within anmT air mass on days when high cloud cover suppresses thetemperature.
MT (moist tropical; type 6), analogous to the tradi-tional mT air mass, is warm and very humid. It istypically found in warm sectors of mid-latitude cyclonesor in a return flow on the western side of an anticy-clone; as one approaches the tropics this weather typedominates. MT+ (moist tropical plus) is a subset of MTthat was derived after the initial classification, to ac-count for the lack of utility of a weather-type scheme inthe warm subtropics when one weather type dominatesmost of the year. It is defined as an MT day where bothmorning and afternoon temperatures are above seed daymeans, and thus captures the most “oppressive” subsetof MT days.
TR (transitional; type 7) days are defined as days inwhich one weather type yields to another, based onlarge shifts in air pressure, dew point, and wind speedover the course of the day (Kalkstein et al. 1996;Sheridan 2002, 2003; Bower et al. 2007).
Int J Biometeorol (2015) 59:1269–1289 1285

References
Abe T, Tokuda Y, Ohde S, Ishimatsu S, Nakamura T, Birrer RB (2009)The relationship of short-term air pollution and weather to ED visitsfor asthma in Japan. Am J Emerg Med 27:153–159. doi:10.1016/j.ajem.2008.01.013
Alves CA, Scotto MG, Freitas MC (2010) Air pollution and emergencyadmissions for cardiorespiratory diseases in Lisbon (Portugal).Quim Nova 33:337–344. doi:10.1590/S0100-40422010000200020
American Academy of Allergy, Asthma and Immunology (AAAAI),http://www.aaaai.org. Accessed 11 Aug 2014
American Lung Association, http://www.lung.org/site/pp.asp?c=dvLUK9O0E&b=22591. Accessed 12 Sept 2014
Anderberg MR (1973) Cluster analysis for applications. Academic, NewYork
Andersen ZJ, Wahlin P, Raaschou-Nielsen O, Scheike T, Loft S (2007)Ambient particle source apportionment and daily hospital admis-sions among children and the elderly in Copenhagen. J Expo SciEnv Epid 17:625–636. doi:10.1038/sj.jes.7500546
Anderson BG, Bell ML (2009)Weather-relatedmortality: how heat, cold,and heat waves affect mortality in the United States. Epidemiology20:205–213. doi:10.1097/EDE.0b013e318190ee08
Anderson HR, de Leon AP, Bland JM, Bower JS, Emberlin J, StrachanDP (1998) Air pollution, pollens, and daily admissions for asthma inLondon 1987–92. Thorax 53:842–848. doi:10.1136/thx.53.10.842
Anderson GB, Dominici F, Wang Y, McCormack MC, Bell ML, PengRD (2013) Heat-related emergency hospitalizations for respiratorydiseases in the Medicare population. Am J Resp Crit Care 187:1098–1103. doi:10.1164/rccm.201211-1969OC
Atkinson RW, Strachan DP (2004) Role of outdoor aeroallergens inasthma exacerbations: epidemiological evidence. Thorax 59:277–278. doi:10.1136/thx.2003.019133
Barrett K, de Leeuw F, Fiala J, Larssen S, Sundvor I, Fjellsbø L, DusinskaM, Ostatnická J, Horálek J, Černikovský L, Barmpas F,Moussipoulos N, Vlahocostas C (2008) Health impacts and airpollution—an exploration of factors influencing estimates of airpollution impact upon the health of European citizens. EuropeanTopic Centre on Air and Climate Change (ETC/ACC), TechnicalPaper, 2008:13, 48 p. http://acm.docs/docs/ETCACC_TP_2008_13_HealthImpact_AirPoll.pdf
Bedeschi E, Campari C, Candela S, Collini G, Caranci N, Frasca G,Galassi C, Francesca G, Vigotti MA (2007) Urban air pollution andrespiratory emergency visits at pediatric unit, Reggio Emilia, Italy. JToxicol EnvHeal A 70:261–265. doi:10.1080/15287390600884784
Beggs PJ (2004) Impacts of climate change on aeroallergens: past andfuture. Clin Exp Allergy 34:1507–1513. doi:10.1111/j.1365-2222.2004.02061.x
Beggs PJ, Bambrick HJ (2005) Is the global rise of asthma an earlyimpact of anthropogenic climate change? Environ Health Persp113:915–919. doi:10.1590/S1413-81232006000300022
Bower D, McGregor GR, Hannah D, Sheridan SC (2007) Developmentof a spatial synoptic classification scheme for western Europe. Int JClimatol 27:2017–2040. doi:10.1002/joc.1501
Braman SS (2006) The global burden of asthma. Chest 130:4S–12S. doi:10.1378/chest.130.1_suppl.4S
Cai J, Zhao A, Zhao JZ, Chen RJ, Wang WB, Ha SD, Xu XH, Kan HD(2014) Acute effects of air pollution on asthma hospitalization inShanghai, China. Environ Pollut 191:139–144. doi:10.1016/j.envpol.2014.04.028
Cakmak S, Dales RE, Coates F (2012) Does air pollution increase theeffect of aeroallergens on hospitalization for asthma? J Allergy ClinImmun 129:228–231. doi:10.1016/j.jaci.2011.09.025
Cakmak S, Dales R, Kauri LM,MahmudM,VanRyswykK, Vanos J, LiuL, Kumarathasan P, Thomson E, Vincent R, Weichenthal S (2014)Metal composition of fine particulate air pollution and acute changes
in cardiorespiratory physiology. Environ Pollut 189:208–214. doi:10.1016/j.envpol.2014.03.004
Carracedo-Martínez E, Sánchez C, TaracidoM, SáezM, Jato V, FigueirasA (2008) Effect of short-term exposure to air pollution and pollen onmedical emergency calls: a case-crossover study in Spain. Allergy63:347–353. doi:10.1111/j.1398-9995.2007.01574.x
Cassiani M, Stohl A, Eckhardt S (2013) The dispersion characteristics ofair pollution from the world’s megacities. Atmos Chem Phys 13:9975–9996. doi:10.5194/acp-13-9975-2013
Celenza A, Fothergill J, Kupek E, Shaw RJ (1996) Thunderstorm asso-ciated asthma: a detailed analysis of environmental factors. BMJ312:604–607. doi:10.1136/bmj.312.7031.604
Center for Disease Control and Prevention, http://www.cdc.gov/asthma/faqs.htm. Accessed 11 Apr 2014
Chen RJ, Chu C, Tan JG, Cao JS, Song WM, Xu XH, Jiang C, Ma WJ,Yang CX, Chen BC, Gui YH, Kan HD (2010) Ambient air pollutionand hospital admission in Shanghai, China. J Hazard Mater 181:234–240. doi:10.1016/j.jhazmat.2010.05.002
Cheng CSQ, Campbell M, Li Q, Li GL, Auld H, Day N, Pengelly D,Gingrich S, Klaassen J,MacIver D, Comer N,MaoY, ThompsonW,Lin H (2009) Differential and combined impacts of extreme tem-peratures and air pollution on human mortality in south-centralCanada. Part I: historical analysis. Air Qual Atmos Health 1:209–222. doi:10.1007/s11869-009-0027-1
Chiusolo M, Cadum E, Stafoggia M, Galassi C, Berti G, Faustini A,Bisanti L, Vigotti MA, Maria Patrizia Dessì MP, Cernigliaro A,Mallone S, Pacelli B, Minerba S, Simonato L, Forastiere F (2011)Short-term effects of nitrogen dioxide onmortality and susceptibilityfactors in 10 Italian cities: The EpiAir Study. Environ Health Persp119:1233–1238. doi:10.1289/ehp.1002904
Cirera L, García-Marcos L, Giménez J, Moreno-Grau S, Tobías A, Pérez-Fernández V, Elvira-Rendeles B, Guillén JJ, Navarro C (2012) Dailyeffects of air pollutants and pollen types on asthma and COPDhospital emergency visits in the industrial and MediterraneanSpanish city of Cartagena. Allergol Immunopathol 40:231–237.doi:10.1016/j.aller.2011.05.012
Dales RE, Cakmak S, Burnett RT, Judek S, Coates F, Brook JR (2000)Influence of ambient fungal spores on emergency visits for asthmato a regional children’s hospital. Am J Respir Crit Care Med 162:2087–2090. doi:10.1164/ajrccm.162.6.2001020
Darrow LA, Klein M, Sarnat JA, Mulholland JA, Strickland MJ, SarnatSE, Russell AG, Tolbert PE (2011) The use of alternative pollutantmetrics in time-series studies of ambient air pollution and respiratoryemergency department visits. J Expo Sci Env Epid 21:10–19. doi:10.1038/jes.2009.49
Davies RJ, Rusznak C, Devalia JL (1998) Why is allergy increasing?Environmental factors. Clin Exp Allergy 28:8–14. doi:10.1046/j.1365-2222.1998.0280s6008.x
DellaValle CT, Triche EW, Leaderer BP, Bell ML (2012) Effects ofambient pollen concentrations on frequency and severity of asthmasymptoms among asthmatic children. Epidemiology 23:55–63. doi:10.1097/EDE.0b013e31823b66b8
Díaz J, Linares C, Tobías A (2007) Short-term effects of pollen species onhospital admissions in the city of Madrid in terms of specific causesand age. Aerobiologia 23:231–238. doi:10.1007/s10453-007-9067-x
Erkara I, Cingi C, Ayranci U, Gurbuz K, Pehlivan S, Tokur S (2009) Skinprick test reactivity in allergic rhinitis patients to airborne pollens.Environ Monit Assess 151:401–412. doi:10.1007/s10661-008-0284-8
Fauroux B, Sampil M, Quenel P, Lemoullec Y (2000) Ozone: a trigger forhospital pediatric asthma emergency room visits. Pediatr Pul 30:41–46. doi:10.1002/1099-0496(200007)
FreitasMC, PachecoAMG, Verburg TG,Wolterbeek HT (2010) Effect ofparticulate matter, atmospheric gases, temperature, and humidity onrespiratory and circulatory diseases’ trends in Lisbon, Portugal.
1286 Int J Biometeorol (2015) 59:1269–1289

Environ Monit Assess 162:113–121. doi:10.1007/s10661-009-0780-5
Fusco D, Forastiere F, Michelozzi P, Spadea T, Ostro B, Arca M, PerucciCA (2001) Air pollution and hospital admissions for respiratoryconditions in Rome, Italy. Eur Respir J 17:1143–1150. doi:10.1183/09031936.01.00005501
Galán C, Cariňanos P, García-Mozo H, Alcázar P, Domínguez-Vilches E(2001) Model for forecasting Olea europaea L. airborne pollen inSouth-West Andalusia, Spain. Int J Biometeorol 45:59–63. doi:10.1007/s004840100089
Garty BZ, Kosman E, Ganor E, Berger V, Garty L, Wietzen T, WaismanY, Mimouni M, Waisel Y (1998) Emergency room visits of asth-matic children, relation to air pollution, weather and airborne aller-gens. Ann Allerg Asthma Im 81:563–570. doi:10.1016/S1081-1206(10)62707-X
Gasparrini A, Armstrong B (2010) Time series analysis on the healtheffects of temperature: advancements and limitations. Environ Res110:633–638. doi:10.1016/j.envres.2010.06.005
Giovannini M, Sala M, Riva E, Radaelli G (2010) Hospital admissionsfor respiratory conditions in children and outdoor air pollution inSouthwest Milan, Italy. Acta Paediatr 99:1180–1185. doi:10.1111/j.1651-2227.2010.01786.x
Goldberg A, Confino-Cohen R, Waisel Y (1998) Allergic responses topollen of ornamental plants: high incidence in the general atopicpopulation and especially among flower growers. J Allergy ClinImmun 102:210–214. doi:10.1016/S0091-6749(98)70088-0
Hayes D Jr, Jhaveri MA, Mannino DM, Strawbridge H, Temprano J(2013) The effect of mold sensitization and humidity upon allergicasthma. Clin Respir J 7:135–144. doi:10.1111/j.1752-699X.2012.00294.x
Hirst JM (1952) An automatic volumetric spore trap. Ann Appl Biol 39:257–265. doi:10.1111/j.1744-7348.1952.tb00904.x
Hondula DM, Vanos JK, Gosling SN (2014) The SSC: a decade ofclimate-health research and future directions. Int J Biometeorol 58:109–120. doi:10.1007/s00484-012-0619-
Jacob DJ, Winner DA (2009) Effect of climate change on air quality.Atmos Environ 43:51–63. doi:10.1016/j.atmosenv.2008.09.051
Jamason PF, Kalkstein LS, Gergen PJ (1997) A synoptic evaluation ofasthma hospital admissions in New York City. Am J Respir CritCare Med 156:1781–1788. doi:10.1164/ajrccm. 156.6.96-05028
Jeong JI, Park RJ (2013) Effects of the meteorological variability onregional air quality in East Asia. Atmos Environ 69:46–55. doi:10.1016/j.atmosenv.2012.11.061
Johnson ML (ed) (2005) The Cambridge handbook of age and ageing.Cambridge University Press, Cambridge
Jolliffe IT (1990) Principal component analysis: a beginner’s guide.Weather 45:375–382. doi:10.1002/j.1477-8696.1990.tb05558.x
Jolliffe IT (1993) Principal components analysis: a beginners guide II.Weather 48:246–253. doi:10.1002/j.1477-8696.1993.tb05899.x
Joseph PM (2007) Paradoxical ozone associations could be due to methylnitrite from combustion of methyl ethers or esters in engine fuels.Environ Int 33:1090–1106. doi:10.1016/j.envint.2007.07.001
Joseph PM, Weiner MG (2002) Visits to physicians after the oxygenationof gasoline in Philadelphia. Arch Environ Health 57:137–154. doi:10.1080/00039890209602929
Kalkstein LS, Corrigan PR (1986) A synoptical climatological approachfor geographic analysis: assessment of sulphur dioxide concentra-tions. Ann Assoc Amer Geogr 76:381–395. doi:10.1111/j.1467-8306.1986.tb00126.x
Kalkstein LS, Barthel CD, Nichols MC, Greene JS (1996) A new spatialsynoptic classification: application to air mass analysis. Int JClimatol 16:983–1004. doi:10.1002/(SICI)1097-0088(199609)
Kassomenos PA (2003a) Anatomy of the synoptic conditions occurringover southern Greece during the second half of the 20th century. PartI. Winter and summer. Theor Appl Climatol 75:65–77. doi:10.1007/s00704-003-0730-z
Kassomenos PA (2003b) Anatomy of the synoptic conditions occurringover southern Greece during the second half of the 20th century. PartII. Autumn and spring. Theor Appl Climatol 75:79–92. doi:10.1007/s00704-003-0727-7
Kassomenos PA, Sindosi OA, Lolis CJ (2003a) Seasonal variation of thecirculation types occurring over southern Greece: a 50 yr study.Clim Res 24(1):33–46. doi:10.3354/cr024033
Kassomenos P, Sindosi O, Lolis C, Chaloulakou A (2003b) On therelation between seasonal synoptic circulation types and spatial airquality characteristics in Athens, Greece. J Air Waste Manag Assoc53:309–324. doi:10.1080/10473289.2003.10466154
Kassomenos PA, Gryparis A, Katsouyanni K (2007) On the associationbetween daily mortality and air mass types in Athens, Greece duringwinter and summer. Int J Biometeorol 51:315–322. doi:10.1007/s00484-006-0062-7
Kassomenos P, Papaloukas C, Petrakis M, Karakitsios S (2008)Assessment and prediction of short term hospital admissions: thecase of Athens, Greece. Atmos Environ 42:7078–7086. doi:10.1016/j.atmosenv.2008.06.011
Kassomenos P, Mertzanos G, Petrakis M, Xylaggoura M, Psiloglou B(2010) Hospital admissions and air mass types in Athens, Greece.Int J Environ Pollut 40:236–247. doi:10.1504/IJEP.2010.030896
Katsoulis B, Kassomenos P (2004) Assessment of the air-quality overurban areas by means of biometeorological indices. The case ofAthens, Greece. Environ Technol 25:1293–1304. doi:10.1080/09593332508618375
Katsouyanni K, Zmirou D, Spix C, Sunyer J, Schouten JP, Pönkä A,Anderson HR, Le Moullec Y, Wojtyniak B, Vigotti MA, BacharovaL (1995) Short-term effects of air pollution on health: a Europeanapproach using epidemiological time-series data. The APHEA pro-ject: background, objectives, design. Eur Respir J 8:1030–1038. doi:10.1183/09031936.95.08061030
Keatinge W, Donaldson G (2001) Winter deaths: warm housing is notenough. Br Med J 323:166–167. doi:10.1136/bmj.317.7164.978
Ko FWS, Tam W, Wong TW, Lai CKW, Wong GWK, Leung TF, NgSSS, Hui DSC (2007) Effects of air pollution on asthmahospitalisation rates in different age groups in Hong Kong. ClinExpAllergy 37:1312–1319. doi:10.1111/j.1365-2222.2007.02791.x
KöppenW (1931) Grundriss Der Klimakunde. Walter De Gruyter & Co.,Berlin
Kosman E, Eshel A, Keynan N, Waisel Y (1994) Clustering of allergenicpollen on the basis of skin-responses of atopic patients by matrixanalysis. Allergy 49:502–507. doi:10.1111/j.1398-9995.1994.tb01120.x
Lee CC, Sheridan SC, Lin S (2013) Relating weather types to asthma-related hospital admissions in New York State. EcoHealth 9:424–439. doi:10.1007/s10393-012-0803-5
Lelieveld J, Barlas C, Giannadaki D, Pozzer A (2013) Model calculatedglobal, regional and megacity premature mortality due to air pollu-tion. Atmos Chem Phys 13:7023–7037. doi:10.5194/acp-13-7023-2013
Lierl MB, Hornung RW (2003) Relationship of outdoor air quality topediatric asthma exacerbations. Ann Allerg Asthma Im 90:28–33.doi:10.1016/S1081-1206(10)63610-1
Liu PWG (2009) Simulation of the daily average PM10 concentrations atTa-Liao with Box-Jenkins time series models and multivariate anal-ysis. Atmos Environ 43:2104–2113. doi:10.1016/j.atmosenv.2009.01.055
Liu J, Qu W, Kadiiska MB (2009) Role of oxidative stress in cadmiumtoxicity and carcinogenesis. Toxicol Appl Pharmacol 238:209–214.doi:10.1016/j.taap.2009.01.029
Mahalanobis PC (1936) On the generalized distance in statistics. ProcNatl Inst Sci India 12:49–55
Makie T, Harada M, Kinukawa N, Toyoshiba H, Yamanaka T, NakamuraT, Sakamoto M, Nose Y (2002) Association of meteorological andday-of-the-week factors with emergency hospital admissions in
Int J Biometeorol (2015) 59:1269–1289 1287
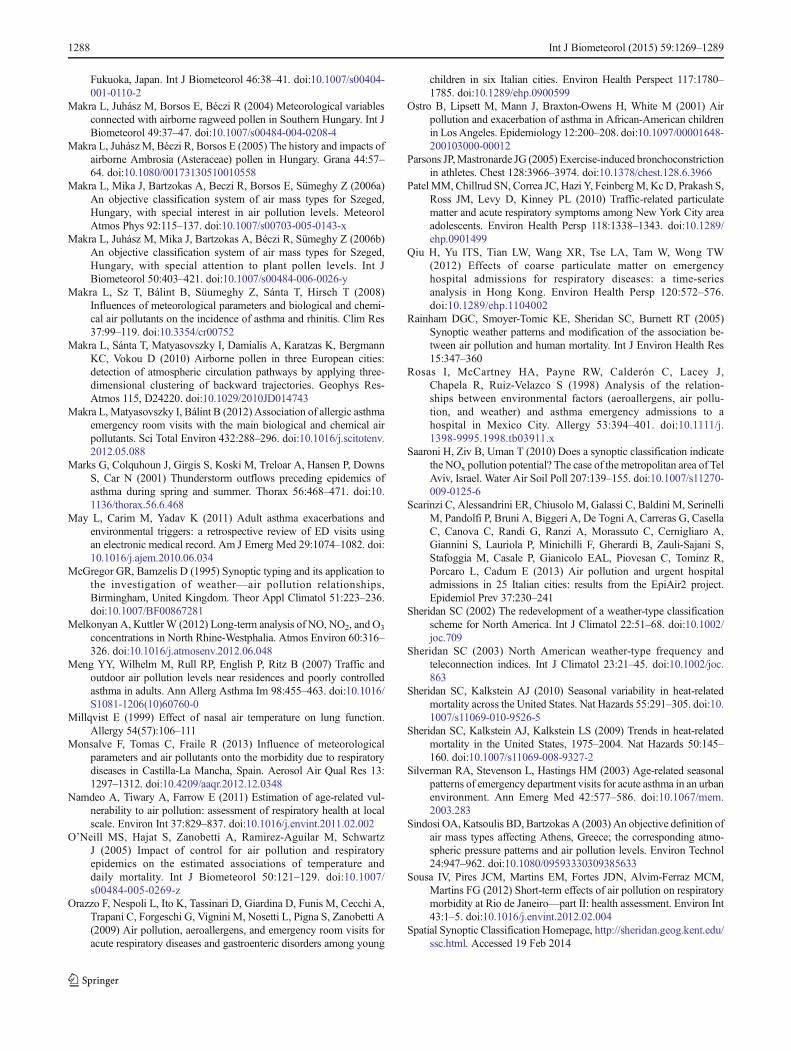
Fukuoka, Japan. Int J Biometeorol 46:38–41. doi:10.1007/s00404-001-0110-2
Makra L, Juhász M, Borsos E, Béczi R (2004) Meteorological variablesconnected with airborne ragweed pollen in Southern Hungary. Int JBiometeorol 49:37–47. doi:10.1007/s00484-004-0208-4
Makra L, JuhászM, Béczi R, Borsos E (2005) The history and impacts ofairborne Ambrosia (Asteraceae) pollen in Hungary. Grana 44:57–64. doi:10.1080/00173130510010558
Makra L, Mika J, Bartzokas A, Beczi R, Borsos E, Sümeghy Z (2006a)An objective classification system of air mass types for Szeged,Hungary, with special interest in air pollution levels. MeteorolAtmos Phys 92:115–137. doi:10.1007/s00703-005-0143-x
Makra L, Juhász M, Mika J, Bartzokas A, Béczi R, Sümeghy Z (2006b)An objective classification system of air mass types for Szeged,Hungary, with special attention to plant pollen levels. Int JBiometeorol 50:403–421. doi:10.1007/s00484-006-0026-y
Makra L, Sz T, Bálint B, Süumeghy Z, Sánta T, Hirsch T (2008)Influences of meteorological parameters and biological and chemi-cal air pollutants on the incidence of asthma and rhinitis. Clim Res37:99–119. doi:10.3354/cr00752
Makra L, Sánta T, Matyasovszky I, Damialis A, Karatzas K, BergmannKC, Vokou D (2010) Airborne pollen in three European cities:detection of atmospheric circulation pathways by applying three-dimensional clustering of backward trajectories. Geophys Res-Atmos 115, D24220. doi:10.1029/2010JD014743
Makra L, Matyasovszky I, Bálint B (2012) Association of allergic asthmaemergency room visits with the main biological and chemical airpollutants. Sci Total Environ 432:288–296. doi:10.1016/j.scitotenv.2012.05.088
Marks G, Colquhoun J, Girgis S, Koski M, Treloar A, Hansen P, DownsS, Car N (2001) Thunderstorm outflows preceding epidemics ofasthma during spring and summer. Thorax 56:468–471. doi:10.1136/thorax.56.6.468
May L, Carim M, Yadav K (2011) Adult asthma exacerbations andenvironmental triggers: a retrospective review of ED visits usingan electronic medical record. Am J Emerg Med 29:1074–1082. doi:10.1016/j.ajem.2010.06.034
McGregor GR, Bamzelis D (1995) Synoptic typing and its application tothe investigation of weather—air pollution relationships,Birmingham, United Kingdom. Theor Appl Climatol 51:223–236.doi:10.1007/BF00867281
Melkonyan A, KuttlerW (2012) Long-term analysis of NO, NO2, and O3
concentrations in North Rhine-Westphalia. Atmos Environ 60:316–326. doi:10.1016/j.atmosenv.2012.06.048
Meng YY, Wilhelm M, Rull RP, English P, Ritz B (2007) Traffic andoutdoor air pollution levels near residences and poorly controlledasthma in adults. Ann Allerg Asthma Im 98:455–463. doi:10.1016/S1081-1206(10)60760-0
Millqvist E (1999) Effect of nasal air temperature on lung function.Allergy 54(57):106–111
Monsalve F, Tomas C, Fraile R (2013) Influence of meteorologicalparameters and air pollutants onto the morbidity due to respiratorydiseases in Castilla-La Mancha, Spain. Aerosol Air Qual Res 13:1297–1312. doi:10.4209/aaqr.2012.12.0348
Namdeo A, Tiwary A, Farrow E (2011) Estimation of age-related vul-nerability to air pollution: assessment of respiratory health at localscale. Environ Int 37:829–837. doi:10.1016/j.envint.2011.02.002
O’Neill MS, Hajat S, Zanobetti A, Ramirez-Aguilar M, SchwartzJ (2005) Impact of control for air pollution and respiratoryepidemics on the estimated associations of temperature anddaily mortality. Int J Biometeorol 50:121–129. doi:10.1007/s00484-005-0269-z
Orazzo F, Nespoli L, Ito K, Tassinari D, Giardina D, Funis M, Cecchi A,Trapani C, Forgeschi G, Vignini M, Nosetti L, Pigna S, Zanobetti A(2009) Air pollution, aeroallergens, and emergency room visits foracute respiratory diseases and gastroenteric disorders among young
children in six Italian cities. Environ Health Perspect 117:1780–1785. doi:10.1289/ehp.0900599
Ostro B, Lipsett M, Mann J, Braxton-Owens H, White M (2001) Airpollution and exacerbation of asthma in African-American childrenin LosAngeles. Epidemiology 12:200–208. doi:10.1097/00001648-200103000-00012
Parsons JP,Mastronarde JG (2005) Exercise-induced bronchoconstrictionin athletes. Chest 128:3966–3974. doi:10.1378/chest.128.6.3966
Patel MM, Chillrud SN, Correa JC, Hazi Y, FeinbergM, KcD, Prakash S,Ross JM, Levy D, Kinney PL (2010) Traffic-related particulatematter and acute respiratory symptoms among New York City areaadolescents. Environ Health Persp 118:1338–1343. doi:10.1289/ehp.0901499
Qiu H, Yu ITS, Tian LW, Wang XR, Tse LA, Tam W, Wong TW(2012) Effects of coarse particulate matter on emergencyhospital admissions for respiratory diseases: a time-seriesanalysis in Hong Kong. Environ Health Persp 120:572–576.doi:10.1289/ehp.1104002
Rainham DGC, Smoyer-Tomic KE, Sheridan SC, Burnett RT (2005)Synoptic weather patterns and modification of the association be-tween air pollution and human mortality. Int J Environ Health Res15:347–360
Rosas I, McCartney HA, Payne RW, Calderón C, Lacey J,Chapela R, Ruiz-Velazco S (1998) Analysis of the relation-ships between environmental factors (aeroallergens, air pollu-tion, and weather) and asthma emergency admissions to ahospital in Mexico City. Allergy 53:394–401. doi:10.1111/j.1398-9995.1998.tb03911.x
Saaroni H, Ziv B, Uman T (2010) Does a synoptic classification indicatethe NOx pollution potential? The case of the metropolitan area of TelAviv, Israel. Water Air Soil Poll 207:139–155. doi:10.1007/s11270-009-0125-6
Scarinzi C, Alessandrini ER, Chiusolo M, Galassi C, Baldini M, SerinelliM, Pandolfi P, Bruni A, Biggeri A, De Togni A, Carreras G, CasellaC, Canova C, Randi G, Ranzi A, Morassuto C, Cernigliaro A,Giannini S, Lauriola P, Minichilli F, Gherardi B, Zauli-Sajani S,Stafoggia M, Casale P, Gianicolo EAL, Piovesan C, Tominz R,Porcaro L, Cadum E (2013) Air pollution and urgent hospitaladmissions in 25 Italian cities: results from the EpiAir2 project.Epidemiol Prev 37:230–241
Sheridan SC (2002) The redevelopment of a weather-type classificationscheme for North America. Int J Climatol 22:51–68. doi:10.1002/joc.709
Sheridan SC (2003) North American weather-type frequency andteleconnection indices. Int J Climatol 23:21–45. doi:10.1002/joc.863
Sheridan SC, Kalkstein AJ (2010) Seasonal variability in heat-relatedmortality across the United States. Nat Hazards 55:291–305. doi:10.1007/s11069-010-9526-5
Sheridan SC, Kalkstein AJ, Kalkstein LS (2009) Trends in heat-relatedmortality in the United States, 1975–2004. Nat Hazards 50:145–160. doi:10.1007/s11069-008-9327-2
Silverman RA, Stevenson L, Hastings HM (2003) Age-related seasonalpatterns of emergency department visits for acute asthma in an urbanenvironment. Ann Emerg Med 42:577–586. doi:10.1067/mem.2003.283
Sindosi OA, Katsoulis BD, Bartzokas A (2003) An objective definition ofair mass types affecting Athens, Greece; the corresponding atmo-spheric pressure patterns and air pollution levels. Environ Technol24:947–962. doi:10.1080/09593330309385633
Sousa IV, Pires JCM, Martins EM, Fortes JDN, Alvim-Ferraz MCM,Martins FG (2012) Short-term effects of air pollution on respiratorymorbidity at Rio de Janeiro—part II: health assessment. Environ Int43:1–5. doi:10.1016/j.envint.2012.02.004
Spatial Synoptic Classification Homepage, http://sheridan.geog.kent.edu/ssc.html. Accessed 19 Feb 2014
1288 Int J Biometeorol (2015) 59:1269–1289

Stieb DM, Beveridge RC, Brook JR, Smith-DoironM, Burnett RT, DalesRE, Beaulieu S, Judek S, Mamedov A (2000) Air pollution,aeroallergens and cardiorespiratory emergency department visits inSaint John, Canada. J Expo Anal Environ Epidemiol 10:461–477.doi:10.1038/sj.jea.7500112
Stieb DM, SzyszkowiczM, Rowe BH, Leech JA (2009) Air pollution andemergency department visits for cardiac and respiratory conditions:a multi-city time-series analysis. Environ Health 8:25. doi:10.1186/1476-069X-8-25
Strausz J (ed) (2003) Asthma bronchiale. Mediszter GlaxoSmithKline,Budapest
Tramuto F, Cusimano R, Cerame G, Vultaggio M, Calamusa G, MaidaCM, Vitale F (2011) Urban air pollution and emergency roomadmissions for respiratory symptoms: a case-crossover study inPalermo, Italy. Environ Health 10: Article No. 31, doi: 10.1186/1476-069X-10-31
Trewartha GT (1968) An introduction to climate. McGraw-Hill, NewYork
Tukey JW (1985) The problem of multiple comparisons, in Time Series,1965–1984, vol II. The Collected Works of John W. Tukey,Wadsworth, Monterey, California
Tunnicliffe WS, Hilton MF, Harrison RM, Ayres JG (2001) The effect ofsulphur dioxide exposure on indices of heart rate variability innormal and asthmatic adults. Eur Respir J 17:604–608
Vaneckova P, Beggs PJ, de Dear RJ, McCracken KWJ (2008) Effect oftemperature on mortality during the six warmer months in Sydney,Australia, between 1993 and 2004. Environ Res 108:361–369. doi:10.1016/j.envres.2008.07.015
Vanos JK, Cakmak S, Bristow C, Brion V, Tremblay N, Martin SL,Sheridan SS (2013) Synoptic weather typing applied to air pollutionmortality among the elderly in 10 Canadian cities. Environ Res 126:66–75. doi:10.1016/j.envres.2013.08.003
Vanos JK, Hebbern C, Cakmak S (2014) Risk assessment for cardiovas-cular and respiratory mortality due to air pollution and synopticmeteorology in 10 Canadian cities. Environ Pollut 185:322–332.doi:10.1016/j.envpol.2013.11.007
Villeneuve PJ, Chen L, Rowe BH, Coates F (2007) Outdoor air pollutionand emergency department visits for asthma among children andadults: a case-crossover study in northern Alberta, Canada. EnvironHealth 6:40. doi:10.1186/1476-069X-6-40
Wilson AM, Wake CP, Kelly T, Salloway JC (2005) Air pollution,weather, and respiratory emergency room visits in two northernNew England cities: an ecological time-series study. Environ Res97:312–321. doi:10.1016/j.envres.2004.07.010
Wong CM, Atkinson RW, Anderson HR, Hedley AJ, Ma S, Chau PYK,Lam TH (2002) A tale of two cities: effects of air pollution onhospital admissions in Hong Kong and London compared.Environ Health Perspect 110:67–77
World Health Organization (WHO) (1999) Manual of the internationalstatistical classification of diseases, injuries, and causes of death,10th revision. Geneva, Switzerland: World Health Organization(access on July 16, 2014)
Yeh KW, Chang CJ, Huang JL (2011) The association of seasonalvariations of asthma hospitalization with air pollution among chil-dren in Taiwan. Asian Pac J Allergy Immunol 29:34–41. doi:10.1016/S1081-1206(10)60244-X
Int J Biometeorol (2015) 59:1269–1289 1289


![DUST IN HISTORIC LIBRARIES - Fastly › documents › dust-in...fires, deposited in earlier centuries, and other more recent airborne pollutants [ 2]. Pollutants from historic and](https://img.pdfslide.us/doc/110x75/5f10889a7e708231d449948a/dust-in-historic-libraries-fastly-a-documents-a-dust-in-fires-deposited.jpg)