1
SKY CONDITION : Analysis performed using various sky conditions that occur at the specific location. Hourly values of solar radiation & meteorological elements for a one-year period are used. WEATHER CITY DATA : Weather files used in this analysis are based on data for this particular location. The closest city with available weather data is used. Weather data is supplied by the US Dept. of Energy. This data consists of hourly values of solar radiation & meteorological elements, derived over a period of several years. COLOR SCALE : Colors on the analysis grid correlate to this legend. The scale indicates what Lux values are represented by what color. Note: The NORTH ARROW : Indicates building orientation . DAYLIGHT AUTONOMY : Desired illuminance level. Daylight autonomy results are based on this target. MODEL DATE : Time period the analysis was performed. Typically, one full year is used. TITLE BLOCK : General project information AVERAGE VALUE : Average percentage value of 2D analysis grid at task height. MODEL TIME : Time of day analysis was performed. Daylight hours of 8 am to 5 pm are typically used. 2D ANALYSIS GRID : Daylight autonomy results at task height. Results are expressed as percentages of time when the target illuminance level is met or exceeded. Numbers on grid indicate specific percentages at the noted location. TASK HEIGHT : Height above the floor at which the analysis was performed. DAYLIGHT AUTONOMY REFLECTANCES : Average interior light reflectance value of the building walls, ceiling, & floor.

WEATHER CITY DATA: Weather files used ... - Daylight …daylightmodeling.com/reports/daylight-autonomy.pdf · DAYLIGHT AUTONOMY: Desired illuminance level. Daylight aut onmy results

Embed Size (px)

Citation preview

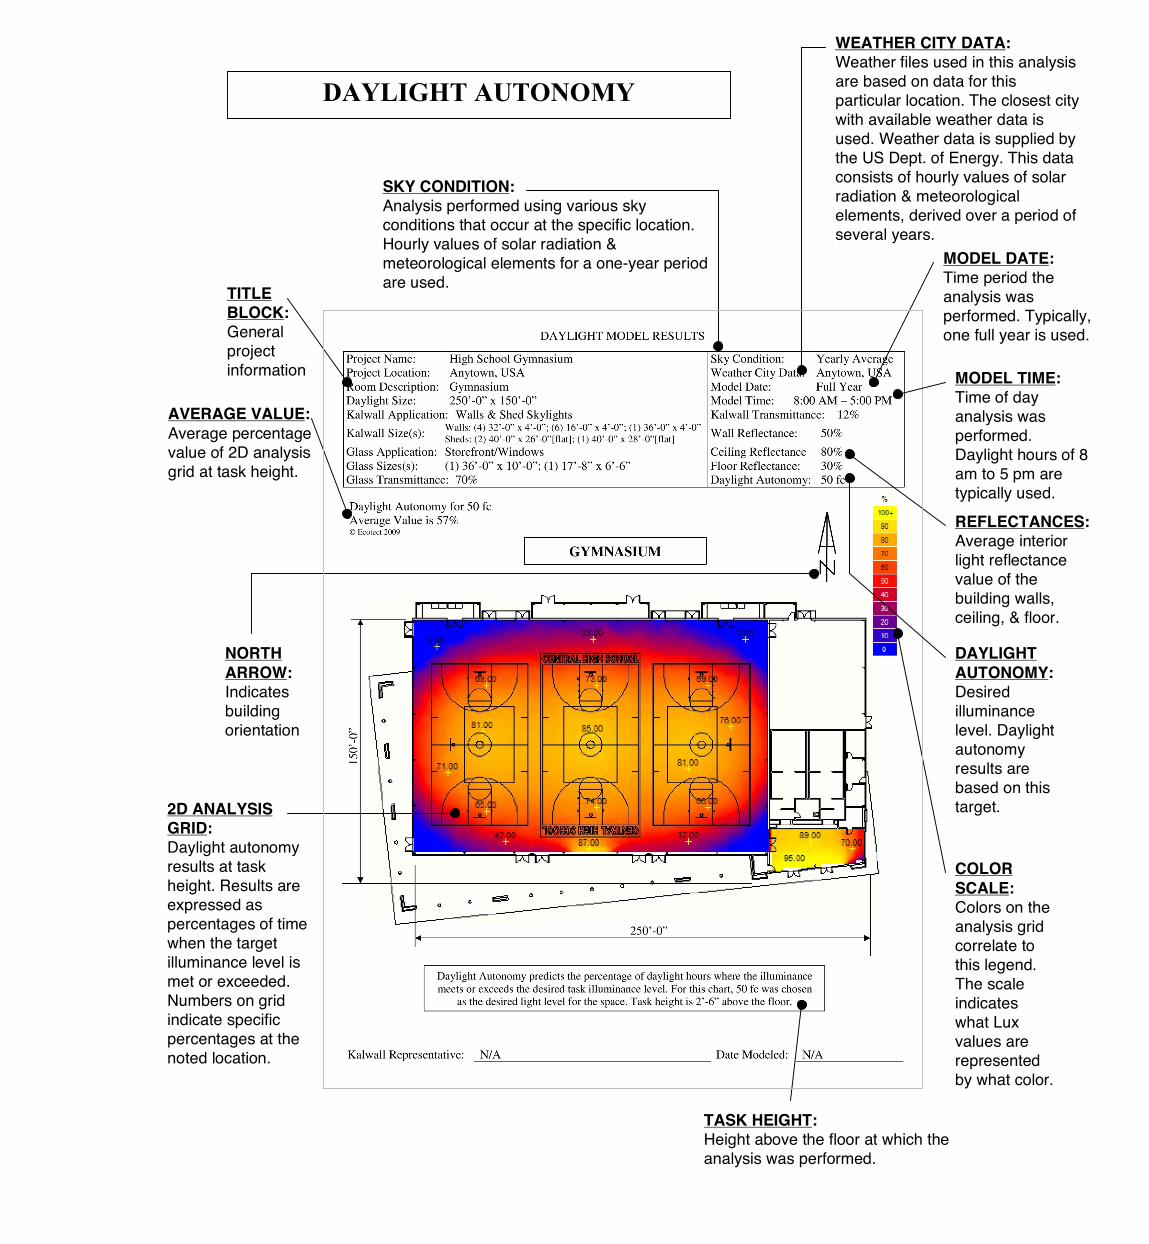
SKY CONDITION: Analysis performed using various sky conditions that occur at the specific location. Hourly values of solar radiation & meteorological elements for a one-year period are used.

WEATHER CITY DATA: Weather files used in this analysis are based on data for this particular location. The closest city with available weather data is used. Weather data is supplied by the US Dept. of Energy. This data consists of hourly values of solar radiation & meteorological elements, derived over a period of several years.

COLOR SCALE: Colors on the analysis grid correlate to this legend. The scale indicates what Lux values are represented by what color. Note: The scale may be different on any given page of the report.

NORTH ARROW: Indicates building orientation.

DAYLIGHT AUTONOMY: Desired illuminance level. Daylight autonomy results are based on this target.

MODEL DATE: Time period the analysis was performed. Typically, one full year is used.

TITLE BLOCK: General project information

AVERAGE VALUE: Average percentage value of 2D analysis grid at task height.

MODEL TIME: Time of day analysis was performed. Daylight hours of 8 am to 5 pm are typically used.

2D ANALYSIS GRID: Daylight autonomy results at task height. Results are expressed as percentages of time when the target illuminance level is met or exceeded. Numbers on grid indicate specific percentages at the noted location.

TASK HEIGHT: Height above the floor at which the analysis was performed.

DAYLIGHT AUTONOMY

REFLECTANCES: Average interior light reflectance value of the building walls, ceiling, & floor.