Embed Size (px)
Citation preview

Page 1
Weather and climate at TocalFarmers are governed by climate more than most people. The climate helps determine the type of agriculture that is viable and highlights the risks and uncertainty that are a feature of Australian agriculture. Those working in agriculture are vitally interested in both the climate (long term data) and the weather (day to day experience) that affect their activities.
A large part of reducing risk in agriculture and protecting natural resources comes from being aware of the climate record and seasonal fluctuations. Armed with this knowledge, landholders can set their production at levels that use the land according to its capabilities and generate profit from the land.
Since the establishment of the CB Alexander Agricultural College, Tocal in 1965, rainfall records have records have been kept. In 1971 a full weather station was established which has since recorded the usual range of weather events. The Paterson Post Office, three kilometres north of the College, has rainfall records dating from 1901. Record keeping in Paterson ceased in 1992 and Tocal became the official weather station for the Paterson locality. In 2002 the Tocal weather station became fully automated, taking measurements of temperature, humidity, wind direction, wind speed, wind gusts and rainfall every half hour.
While you may not have a weather station on your property, records are available from a number of sources including the Bureau of Meteorology, Climate Kelpie (www.climatekelpie.com.au) (published by the Queensland Department of Primary Industries), or you may find that your neighbours or someone in your area has kept these records - never underestimate local knowledge when it comes to weather and climate.
You can view the Bureau of Meteorology’s current readings from the Tocal weather station (www.bom.gov.au) or a current image from the Williamtown Weather Watch Radar (mirror.bom.gov.au).
In this section we will analyse the climate records for Tocal and give an indication of the way this information is useful for farm decision making. To do this we will look at:• Site statistics and records• Rainfall, evaporation and effective rainfall• Farming in a variable climate
Page 2
Site statistics and records
Site statisticsOfficial Name Paterson Tocal Agricultural College (from 1971 to present)
Altitude 30 m
Latitude 32° 38’ South
Longitude 151° 35’ East
Bureau of Meteorology station number 061250
Official Name Paterson Post Office (1901 to 1992)
Altitude 21 m
Latitude 32° 36’ South
Longitude 151° 37’ East
Bureau of Meteorology station number 061096
Climate and weather recordsRainfall Paterson Post Office readings from 1902 onwards have been used. Tocal readings started in 1965. All readings are on a daily basis at 0900 hours.
Rainfall probabilities are calculated on the basis of a composite of Tocal and Paterson rainfalls 1901-2002.
Evaporation A Class ‘A’ pan has been used with readings at 0900 hours each day and recorded against the day of reading.
Temperature Maximum and minimum temperatures up to mid-2002 are recorded in a Standard Stevenson Screen with a floor 1000 mm above the ground. Since August 1980 soil temperatures at 10 cm and 20 cm have been recorded using bent stem thermometers.
Wind Wind data is a result of estimates using the Beaufort wind scale. Since automation in mid-2002, wind data has been measure with an anemometer. Measurements for winds at sea are usually expressed in knots. Over land, the units will usually be in km/hr. (10knots = 18.5 km/hr, 10km/hr = 5.4 knots)
Frost The definition of a frost adapted for these records is terrestrial minimum temperature at or below 0.0°C or a minimum Screen temperature below 2.0°C.
Cloud Cloud data is a result of estimates of cloud cover (in oktas a scale of 1-8).
Humidity The data for wet bulb temperature has been derived from a standard wet bulb thermometer. Relative humidity has been found by use of a relative humidity chart (Sale and Sale, 1978, p. 97).
Sources of dataThe monthly rainfall data for Paterson Post Office has been supplied by the Bureau of Meteorology. The Tocal (1971-1984) records have been obtained from the Bureau of Meteorology. Data since 1984 has been compiled manually, and a manual system has been used in conjunction with the automatic recording station commissioned in 2002.
Page 3
Rainfall, evaporation and effective rainfall
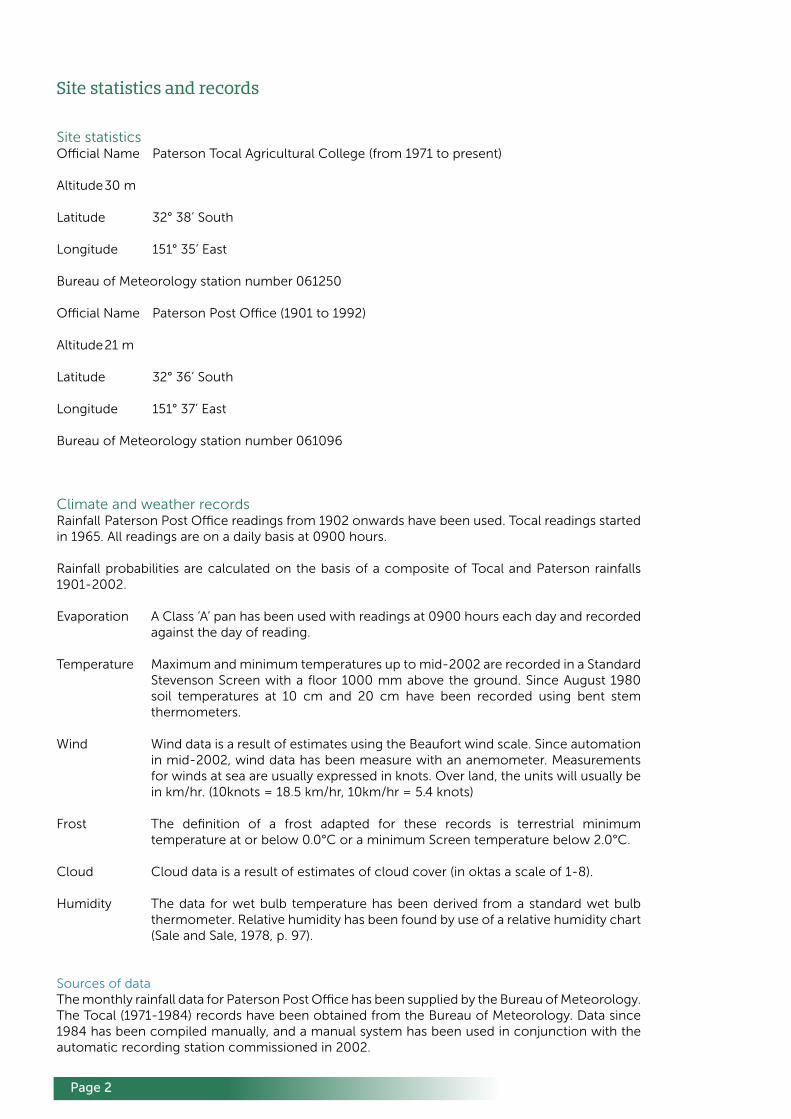
RainfallTocal receives more summer rainfall than winter. In January to March there is more than twice the rain of July to September. There are only slightly more rain days in the summer/autumn period, however there are more thunderstorms in summer, bringing heavier falls. Most summer rainfall comes from storms caused by moist air extending southwards from northern Australia and east from the Tasman Sea. Winter rainfall is mainly caused by cold fronts from the mid latitudes. The development of low pressure systems in the Tasman Sea in winter can also bring heavy rain and strong winds (see wind).
The lower monthly rainfall figures from July to September are made much worse by the incidence of strong westerly winds causing high evaporation rates. The district rarely receives really good rainfall in spring compared to southern New South Wales. Reliance on the ryegrasses and clovers as the main feed source is therefore difficult and explains the need for summer growing species such as kikuyu.
This graph shows both average monthly rainfall and the median at Paterson/Tocal. The average is calculated by adding rainfall totals for each month over the period from 1965 to 2006 and dividing by the number of years. This figure can be misleading, because a couple of very low or very high rainfall years can alter the average significantly. A more useful figure to use for farm planning is the median. Median rainfall is calculated by ranking totals from highest to lowest, the middle figure being the median. The median will often be lower than the average, and is a more realistic figure to use, although it is not often quoted in rainfall statistics.
When looking at long-term trends, it is more accurate to use figures from as far back as possible.
Graph of average and median monthly rainfall at Paterson/Tocal (1901-2017)
Page 4
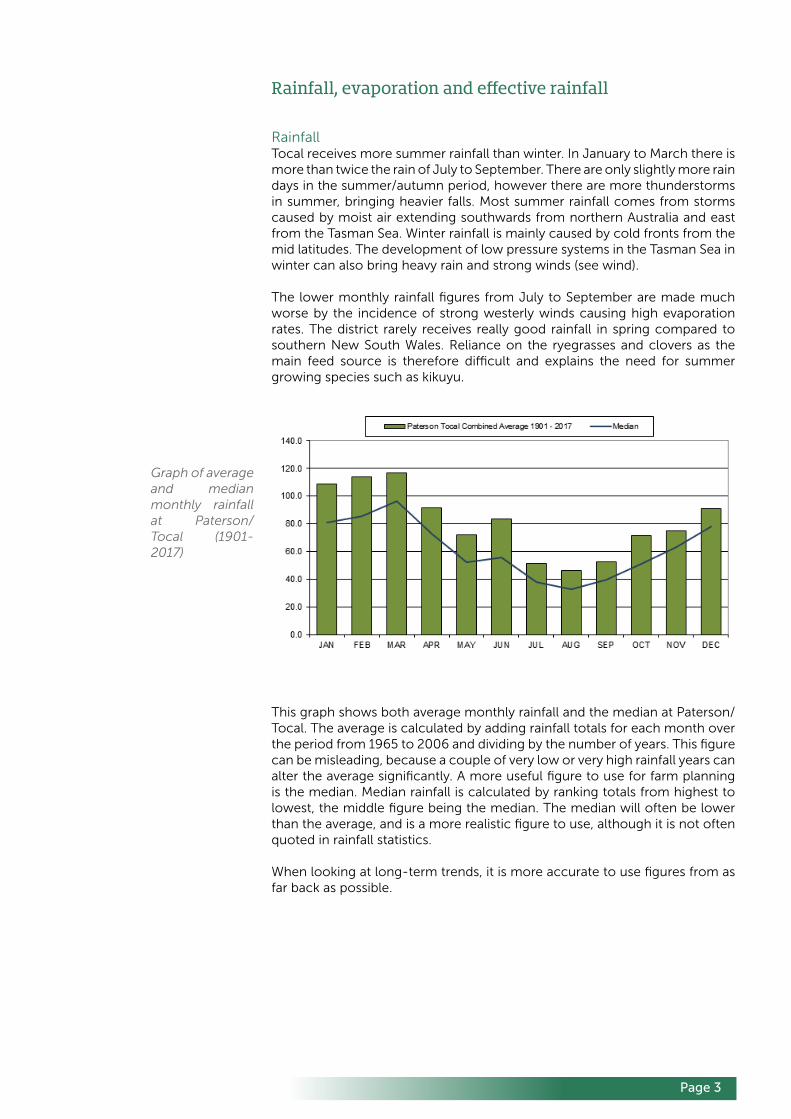
Rolling five-year rainfall averagesThe rolling five-year average is calculated by averaging the rainfall figures for the previous five years to get the figure for that year. For example, the 1970 figure is the average of 1966, 1967, 1968, 1969 and 1970. The rolling five-year average is useful because the effects of rainfall (either high or low) do not stop at the end of the calendar year, so a graph of annual rainfall for each year can be misleading. Importantly, the rolling five-year average is a better indicator of trends in rainfall.
The graph clearly shows above and below average periods, with three periods of lower than average rainfall and from 2006, a higher trend.
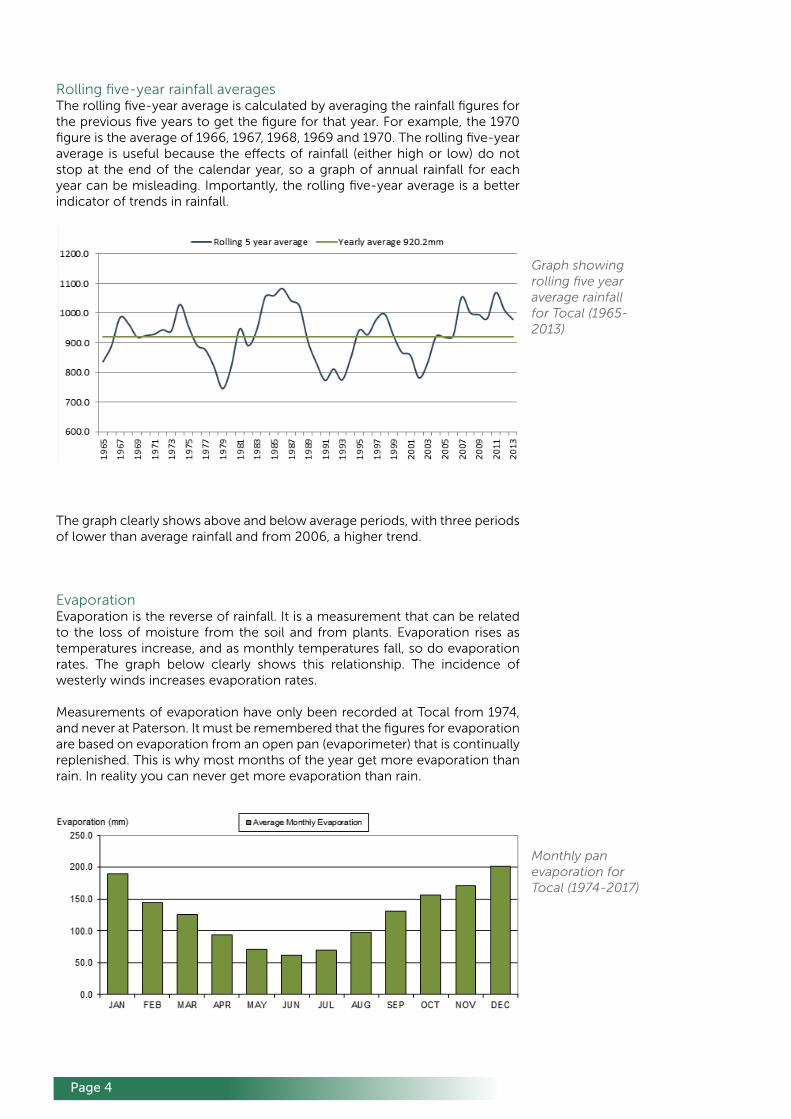
EvaporationEvaporation is the reverse of rainfall. It is a measurement that can be related to the loss of moisture from the soil and from plants. Evaporation rises as temperatures increase, and as monthly temperatures fall, so do evaporation rates. The graph below clearly shows this relationship. The incidence of westerly winds increases evaporation rates.
Measurements of evaporation have only been recorded at Tocal from 1974, and never at Paterson. It must be remembered that the figures for evaporation are based on evaporation from an open pan (evaporimeter) that is continually replenished. This is why most months of the year get more evaporation than rain. In reality you can never get more evaporation than rain.
Graph showing rolling five year average rainfall for Tocal (1965-2013)
Monthly pan evaporation for Tocal (1974-2017)

Page 5
Using Climate Data for Irrigation SchedulingIrrigation schedules are used to ensure efficient water use. Using moisture budgets a farmer can ensure that water is applied to a crop or pasture when it will be of most benefit. Moisture budgets are calculated using rainfall and evapotranspiration .
Evapotranspiration is used because while effective rainfall is a good indication of seasonal conditions, plant water use needs also to be considered. Evapotranspiration combines water used by plants as well as water lost from the soil through evaporation.
Plant water use is influenced by environmental conditions, including wind, temperature, humidity and solar radiation. If conditions are hot, dry and windy, crop water use and evaporation will be high. However, if the day is cool and overcast, water use will decrease. The chart below shows the evapotranspiration measurements and trends at Tocal in 2003.
A standard or reference crop, (usually a well-watered, actively-growing grass pasture), is used to calculate pasture evapotranspiration (ETo) (the maximum amount of water that such a pasture would use on a particular day). This reference evapotranspiration is calculated and published in tables by the Bureau of Meteorology (www.bom.gov.au). When pasture evapotranspiration is related to pan evaporation at Tocal (using figures from 2003), pasture evapotranspiration was 62% of pan evaporation which is close to the rule of thumb we gave in the graph ‘Average monthly moisture availability based on soil evaporation’.
Daily water use is also influenced by a crop factor (Kc) (also a published figure) and the stage of growth that the pasture is in.
Soil acts as a reservoir for moisture for growing plants. You can calculate how much water you need in the soil if you have the following information:• Effective root zone of the crop in the soil• Effective rainfall for the crop. This depends on the crop and soil texture• Readily available water (RAW). This depends on the soil texture and the
effective root zone of the crop. No matter how much water you add, the RAW value is the amount that the soil can hold for the crop can readily use without suffering yield loss.
Here is an example of how to calculate RAW from ‘The Soils of Tocal (www.tocal.com)’ in the All About Tocal series, Book 5.
Chart of the evapotranspiration
at Tocal.
Page 6
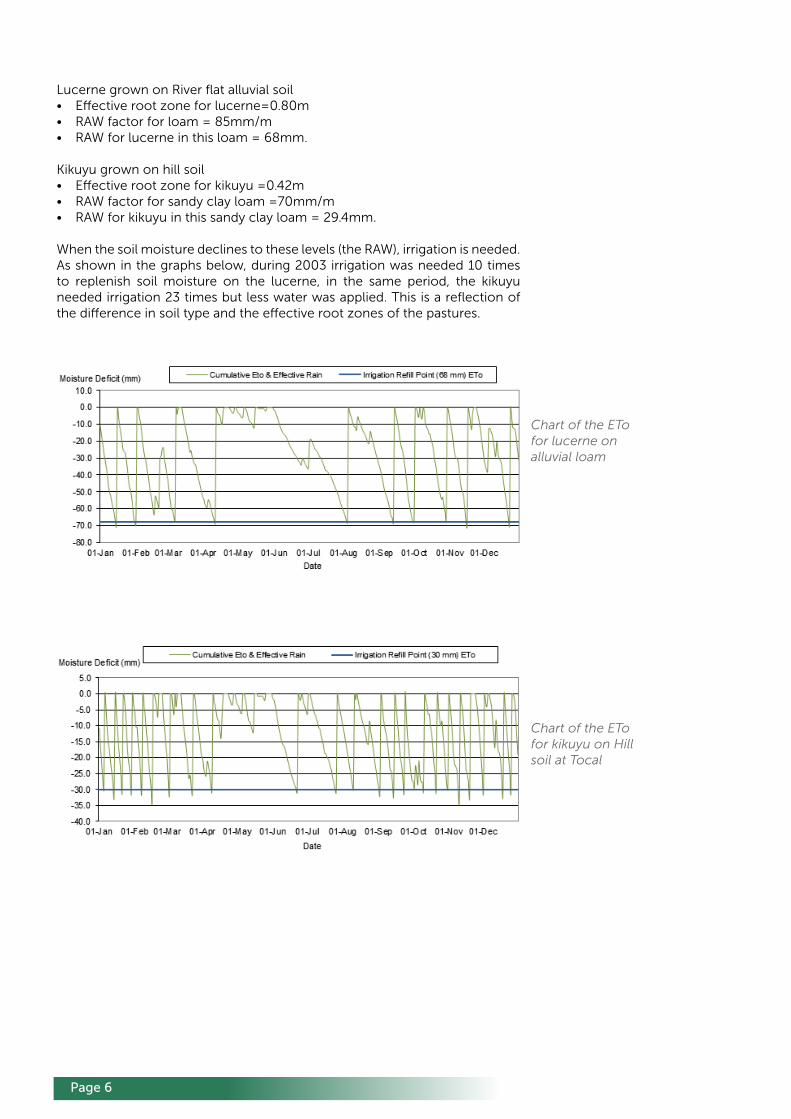
Lucerne grown on River flat alluvial soil• Effective root zone for lucerne=0.80m• RAW factor for loam = 85mm/m• RAW for lucerne in this loam = 68mm.
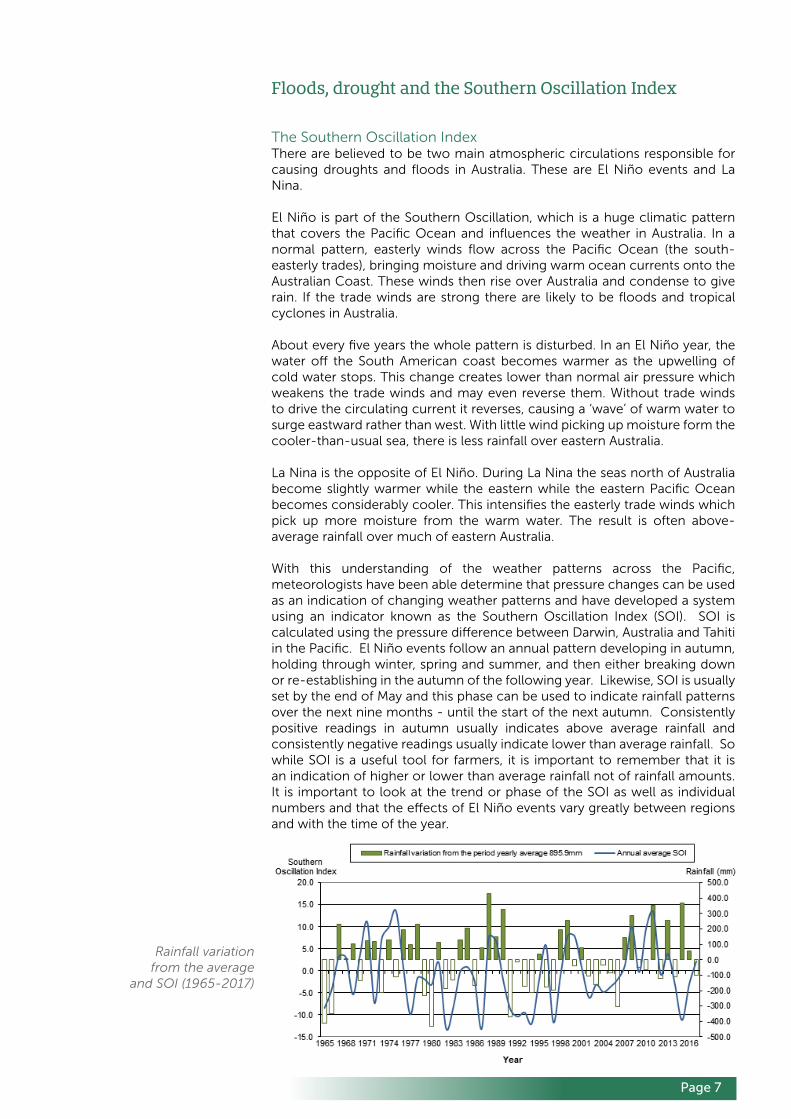
Kikuyu grown on hill soil• Effective root zone for kikuyu =0.42m• RAW factor for sandy clay loam =70mm/m• RAW for kikuyu in this sandy clay loam = 29.4mm.
When the soil moisture declines to these levels (the RAW), irrigation is needed. As shown in the graphs below, during 2003 irrigation was needed 10 times to replenish soil moisture on the lucerne, in the same period, the kikuyu needed irrigation 23 times but less water was applied. This is a reflection of the difference in soil type and the effective root zones of the pastures.
Chart of the ETo for lucerne on alluvial loam
Chart of the ETo for kikuyu on Hill soil at Tocal
Page 7
Floods, drought and the Southern Oscillation Index
The Southern Oscillation IndexThere are believed to be two main atmospheric circulations responsible for causing droughts and floods in Australia. These are El Niño events and La Nina.
El Niño is part of the Southern Oscillation, which is a huge climatic pattern that covers the Pacific Ocean and influences the weather in Australia. In a normal pattern, easterly winds flow across the Pacific Ocean (the south-easterly trades), bringing moisture and driving warm ocean currents onto the Australian Coast. These winds then rise over Australia and condense to give rain. If the trade winds are strong there are likely to be floods and tropical cyclones in Australia.
About every five years the whole pattern is disturbed. In an El Niño year, the water off the South American coast becomes warmer as the upwelling of cold water stops. This change creates lower than normal air pressure which weakens the trade winds and may even reverse them. Without trade winds to drive the circulating current it reverses, causing a ‘wave’ of warm water to surge eastward rather than west. With little wind picking up moisture form the cooler-than-usual sea, there is less rainfall over eastern Australia.
La Nina is the opposite of El Niño. During La Nina the seas north of Australia become slightly warmer while the eastern while the eastern Pacific Ocean becomes considerably cooler. This intensifies the easterly trade winds which pick up more moisture from the warm water. The result is often above-average rainfall over much of eastern Australia.
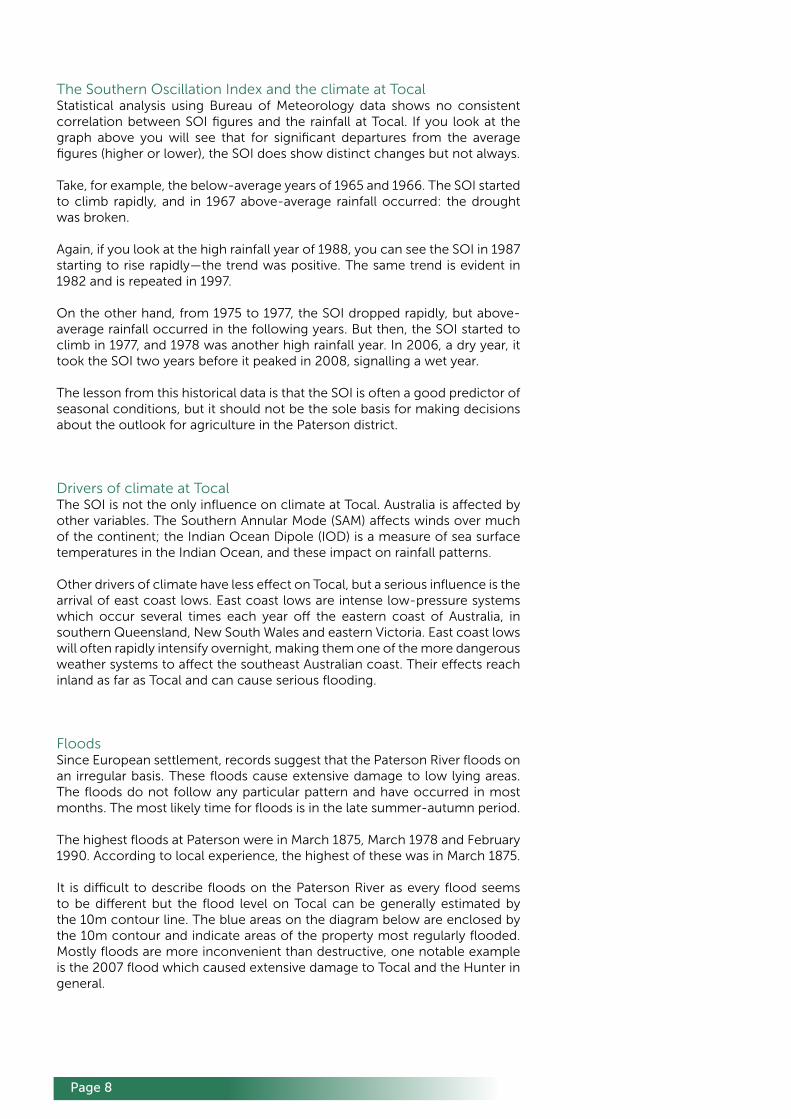
With this understanding of the weather patterns across the Pacific, meteorologists have been able determine that pressure changes can be used as an indication of changing weather patterns and have developed a system using an indicator known as the Southern Oscillation Index (SOI). SOI is calculated using the pressure difference between Darwin, Australia and Tahiti in the Pacific. El Niño events follow an annual pattern developing in autumn, holding through winter, spring and summer, and then either breaking down or re-establishing in the autumn of the following year. Likewise, SOI is usually set by the end of May and this phase can be used to indicate rainfall patterns over the next nine months - until the start of the next autumn. Consistently positive readings in autumn usually indicates above average rainfall and consistently negative readings usually indicate lower than average rainfall. So while SOI is a useful tool for farmers, it is important to remember that it is an indication of higher or lower than average rainfall not of rainfall amounts. It is important to look at the trend or phase of the SOI as well as individual numbers and that the effects of El Niño events vary greatly between regions and with the time of the year.
Rainfall variation from the average
and SOI (1965-2017)
Page 8
The Southern Oscillation Index and the climate at TocalStatistical analysis using Bureau of Meteorology data shows no consistent correlation between SOI figures and the rainfall at Tocal. If you look at the graph above you will see that for significant departures from the average figures (higher or lower), the SOI does show distinct changes but not always.
Take, for example, the below-average years of 1965 and 1966. The SOI started to climb rapidly, and in 1967 above-average rainfall occurred: the drought was broken.
Again, if you look at the high rainfall year of 1988, you can see the SOI in 1987 starting to rise rapidly—the trend was positive. The same trend is evident in 1982 and is repeated in 1997.
On the other hand, from 1975 to 1977, the SOI dropped rapidly, but above-average rainfall occurred in the following years. But then, the SOI started to climb in 1977, and 1978 was another high rainfall year. In 2006, a dry year, it took the SOI two years before it peaked in 2008, signalling a wet year.
The lesson from this historical data is that the SOI is often a good predictor of seasonal conditions, but it should not be the sole basis for making decisions about the outlook for agriculture in the Paterson district.
Drivers of climate at TocalThe SOI is not the only influence on climate at Tocal. Australia is affected by other variables. The Southern Annular Mode (SAM) affects winds over much of the continent; the Indian Ocean Dipole (IOD) is a measure of sea surface temperatures in the Indian Ocean, and these impact on rainfall patterns.
Other drivers of climate have less effect on Tocal, but a serious influence is the arrival of east coast lows. East coast lows are intense low-pressure systems which occur several times each year off the eastern coast of Australia, in southern Queensland, New South Wales and eastern Victoria. East coast lows will often rapidly intensify overnight, making them one of the more dangerous weather systems to affect the southeast Australian coast. Their effects reach inland as far as Tocal and can cause serious flooding.
FloodsSince European settlement, records suggest that the Paterson River floods on an irregular basis. These floods cause extensive damage to low lying areas. The floods do not follow any particular pattern and have occurred in most months. The most likely time for floods is in the late summer-autumn period.
The highest floods at Paterson were in March 1875, March 1978 and February 1990. According to local experience, the highest of these was in March 1875.
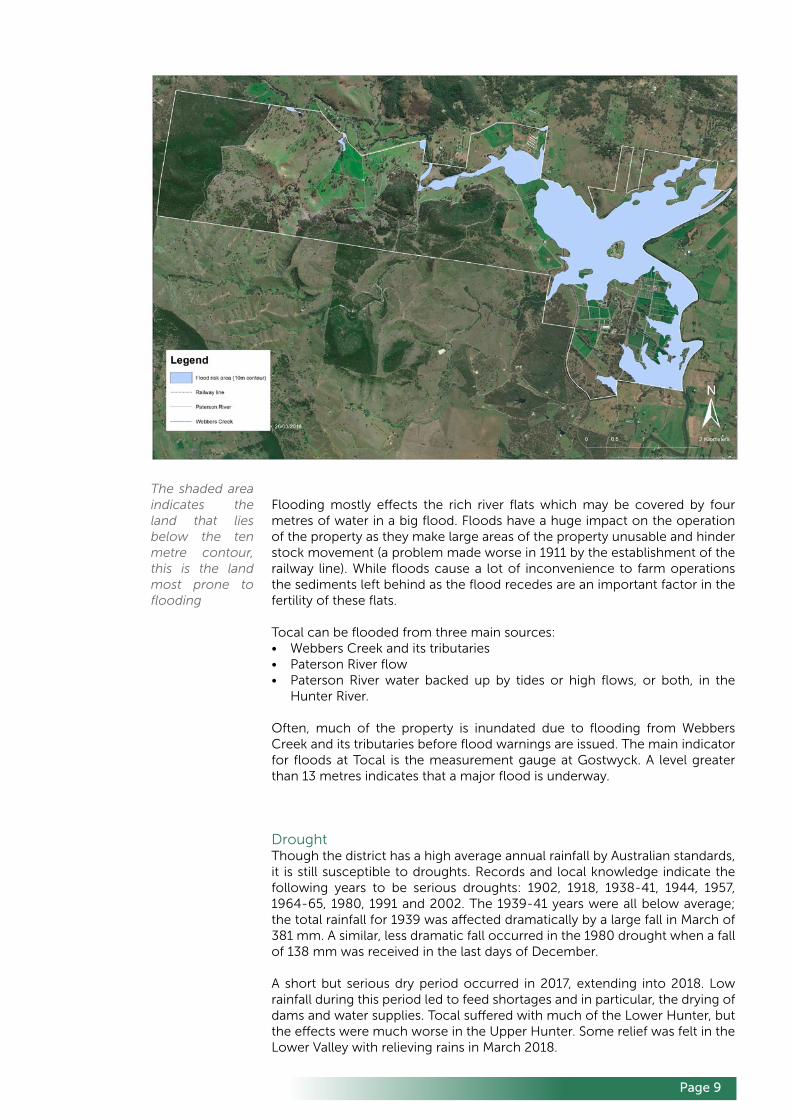
It is difficult to describe floods on the Paterson River as every flood seems to be different but the flood level on Tocal can be generally estimated by the 10m contour line. The blue areas on the diagram below are enclosed by the 10m contour and indicate areas of the property most regularly flooded. Mostly floods are more inconvenient than destructive, one notable example is the 2007 flood which caused extensive damage to Tocal and the Hunter in general.
Page 9
Flooding mostly effects the rich river flats which may be covered by four metres of water in a big flood. Floods have a huge impact on the operation of the property as they make large areas of the property unusable and hinder stock movement (a problem made worse in 1911 by the establishment of the railway line). While floods cause a lot of inconvenience to farm operations the sediments left behind as the flood recedes are an important factor in the fertility of these flats.
Tocal can be flooded from three main sources:• Webbers Creek and its tributaries• Paterson River flow• Paterson River water backed up by tides or high flows, or both, in the
Hunter River.
Often, much of the property is inundated due to flooding from Webbers Creek and its tributaries before flood warnings are issued. The main indicator for floods at Tocal is the measurement gauge at Gostwyck. A level greater than 13 metres indicates that a major flood is underway.
DroughtThough the district has a high average annual rainfall by Australian standards, it is still susceptible to droughts. Records and local knowledge indicate the following years to be serious droughts: 1902, 1918, 1938-41, 1944, 1957, 1964-65, 1980, 1991 and 2002. The 1939-41 years were all below average; the total rainfall for 1939 was affected dramatically by a large fall in March of 381 mm. A similar, less dramatic fall occurred in the 1980 drought when a fall of 138 mm was received in the last days of December.
A short but serious dry period occurred in 2017, extending into 2018. Low rainfall during this period led to feed shortages and in particular, the drying of dams and water supplies. Tocal suffered with much of the Lower Hunter, but the effects were much worse in the Upper Hunter. Some relief was felt in the Lower Valley with relieving rains in March 2018.
The shaded area indicates the land that lies below the ten metre contour, this is the land most prone to flooding
Page 10
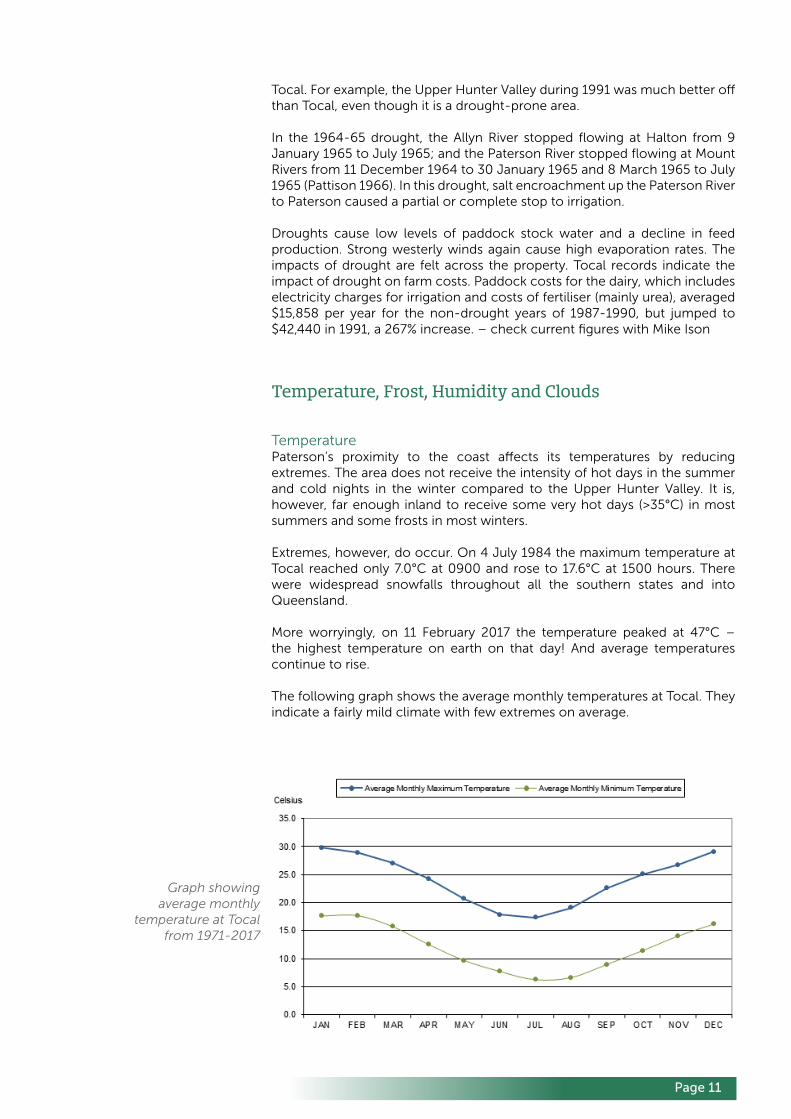
For these reasons it should be noted that droughts do not follow the calendar year and the figures should be looked at over a number of seasons to fully understand the trends. This will give an indication of how dam water, creeks, subsoil moisture levels and general paddock conditions would be. These are the conditions that affect farm production in a drought. In the Paterson district dry conditions are often exacerbated by hot westerly winds.
Droughts can be patchy in their effects. The calendar years of 1980 and 1991 at Tocal can be easily seen as droughts. Other parts of the state were not as badly affected at this time - their droughts did not coincide with droughts at
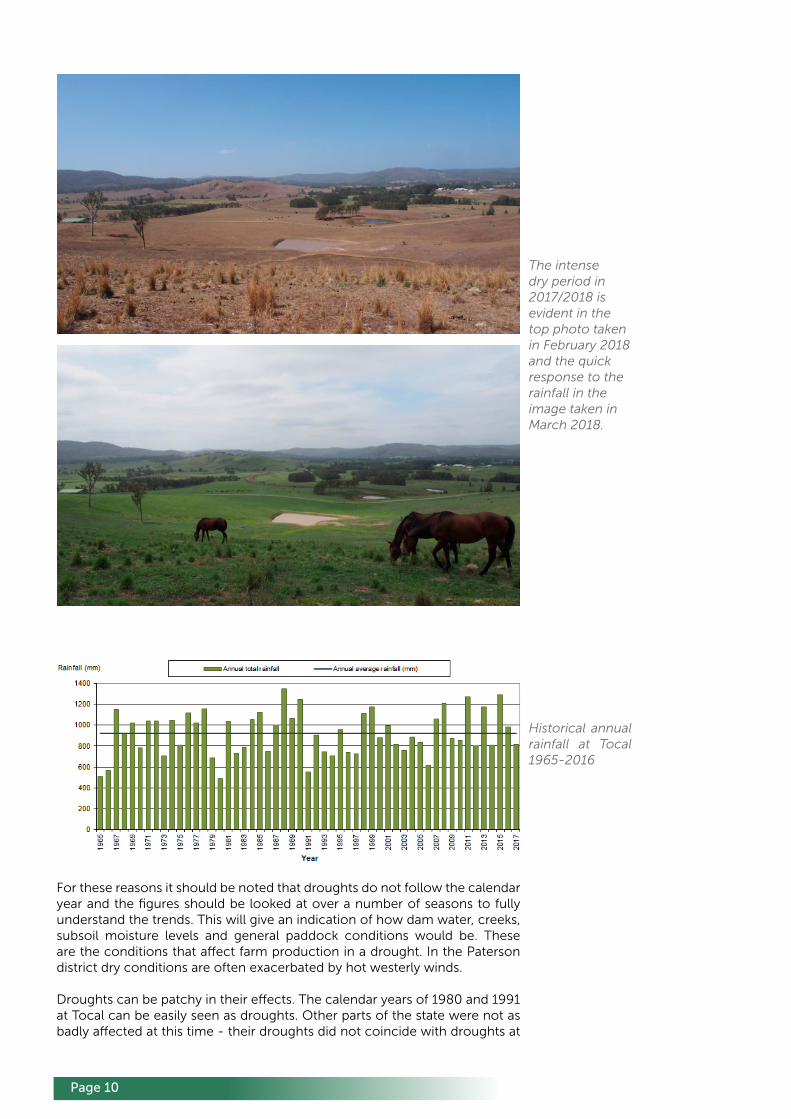
The intense dry period in 2017/2018 is evident in the top photo taken in February 2018 and the quick response to the rainfall in the image taken in March 2018.
Historical annual rainfall at Tocal 1965-2016
Page 11
Tocal. For example, the Upper Hunter Valley during 1991 was much better off than Tocal, even though it is a drought-prone area.
In the 1964-65 drought, the Allyn River stopped flowing at Halton from 9 January 1965 to July 1965; and the Paterson River stopped flowing at Mount Rivers from 11 December 1964 to 30 January 1965 and 8 March 1965 to July 1965 (Pattison 1966). In this drought, salt encroachment up the Paterson River to Paterson caused a partial or complete stop to irrigation.
Droughts cause low levels of paddock stock water and a decline in feed production. Strong westerly winds again cause high evaporation rates. The impacts of drought are felt across the property. Tocal records indicate the impact of drought on farm costs. Paddock costs for the dairy, which includes electricity charges for irrigation and costs of fertiliser (mainly urea), averaged $15,858 per year for the non-drought years of 1987-1990, but jumped to $42,440 in 1991, a 267% increase. – check current figures with Mike Ison
Temperature, Frost, Humidity and Clouds
TemperaturePaterson’s proximity to the coast affects its temperatures by reducing extremes. The area does not receive the intensity of hot days in the summer and cold nights in the winter compared to the Upper Hunter Valley. It is, however, far enough inland to receive some very hot days (>35°C) in most summers and some frosts in most winters.
Extremes, however, do occur. On 4 July 1984 the maximum temperature at Tocal reached only 7.0°C at 0900 and rose to 17.6°C at 1500 hours. There were widespread snowfalls throughout all the southern states and into Queensland.
More worryingly, on 11 February 2017 the temperature peaked at 47°C – the highest temperature on earth on that day! And average temperatures continue to rise.
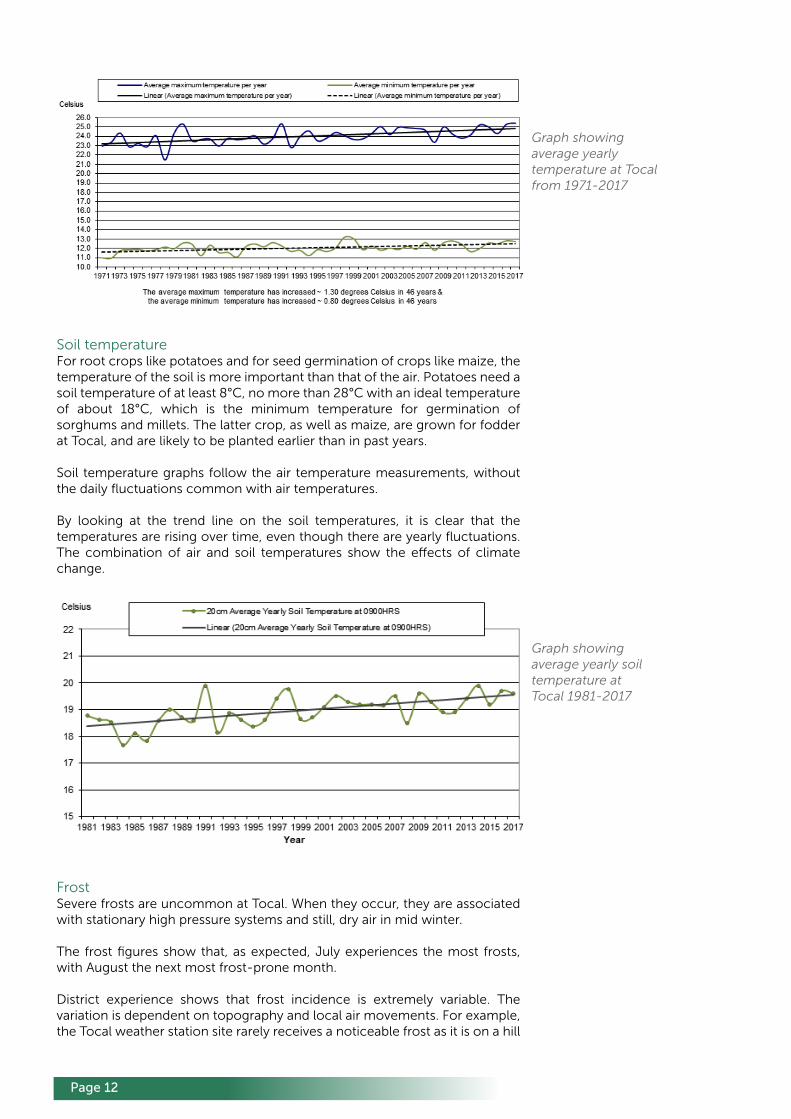
The following graph shows the average monthly temperatures at Tocal. They indicate a fairly mild climate with few extremes on average.
Graph showing average monthly
temperature at Tocal from 1971-2017
Page 12
Soil temperatureFor root crops like potatoes and for seed germination of crops like maize, the temperature of the soil is more important than that of the air. Potatoes need a soil temperature of at least 8°C, no more than 28°C with an ideal temperature of about 18°C, which is the minimum temperature for germination of sorghums and millets. The latter crop, as well as maize, are grown for fodder at Tocal, and are likely to be planted earlier than in past years.
Soil temperature graphs follow the air temperature measurements, without the daily fluctuations common with air temperatures.
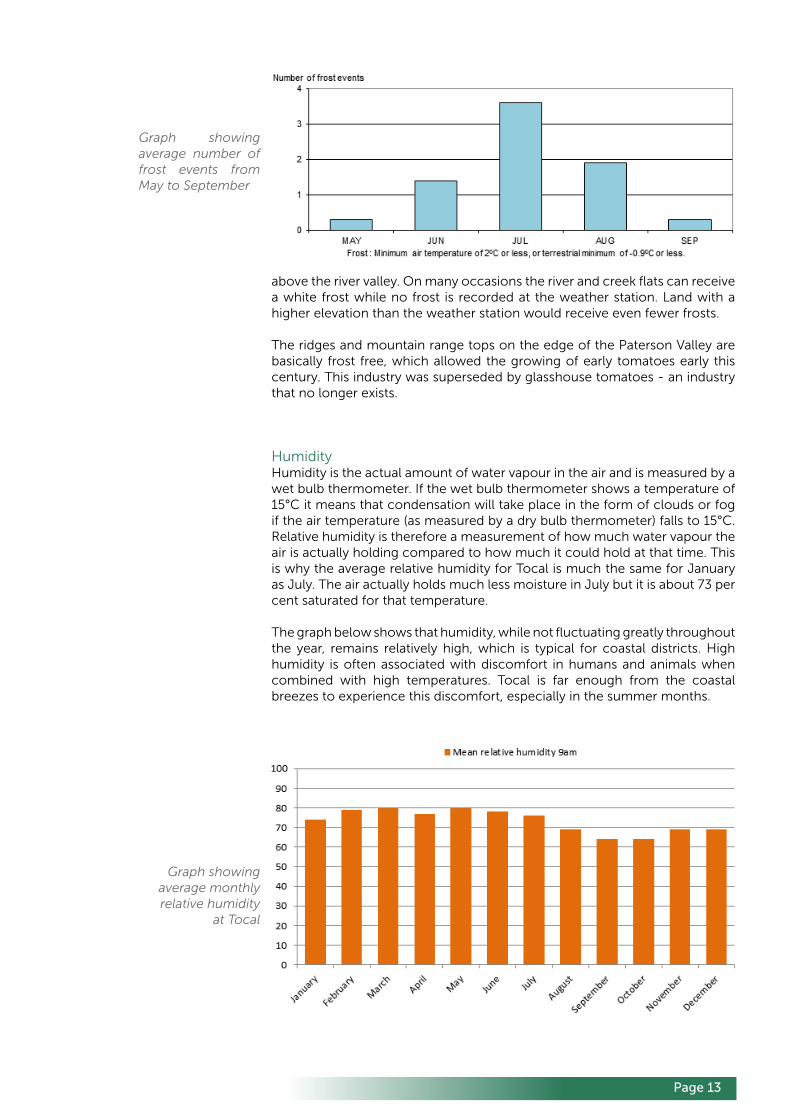
By looking at the trend line on the soil temperatures, it is clear that the temperatures are rising over time, even though there are yearly fluctuations. The combination of air and soil temperatures show the effects of climate change.
FrostSevere frosts are uncommon at Tocal. When they occur, they are associated with stationary high pressure systems and still, dry air in mid winter.
The frost figures show that, as expected, July experiences the most frosts, with August the next most frost-prone month.
District experience shows that frost incidence is extremely variable. The variation is dependent on topography and local air movements. For example, the Tocal weather station site rarely receives a noticeable frost as it is on a hill
Graph showing average yearly soil temperature at Tocal 1981-2017
Graph showing average yearly temperature at Tocal from 1971-2017
Page 13
above the river valley. On many occasions the river and creek flats can receive a white frost while no frost is recorded at the weather station. Land with a higher elevation than the weather station would receive even fewer frosts.
The ridges and mountain range tops on the edge of the Paterson Valley are basically frost free, which allowed the growing of early tomatoes early this century. This industry was superseded by glasshouse tomatoes - an industry that no longer exists.
HumidityHumidity is the actual amount of water vapour in the air and is measured by a wet bulb thermometer. If the wet bulb thermometer shows a temperature of 15°C it means that condensation will take place in the form of clouds or fog if the air temperature (as measured by a dry bulb thermometer) falls to 15°C. Relative humidity is therefore a measurement of how much water vapour the air is actually holding compared to how much it could hold at that time. This is why the average relative humidity for Tocal is much the same for January as July. The air actually holds much less moisture in July but it is about 73 per cent saturated for that temperature.
The graph below shows that humidity, while not fluctuating greatly throughout the year, remains relatively high, which is typical for coastal districts. High humidity is often associated with discomfort in humans and animals when combined with high temperatures. Tocal is far enough from the coastal breezes to experience this discomfort, especially in the summer months.
Graph showing average number of frost events from May to September
Graph showing average monthly relative humidity
at Tocal
Page 14
Wind, storms and fire
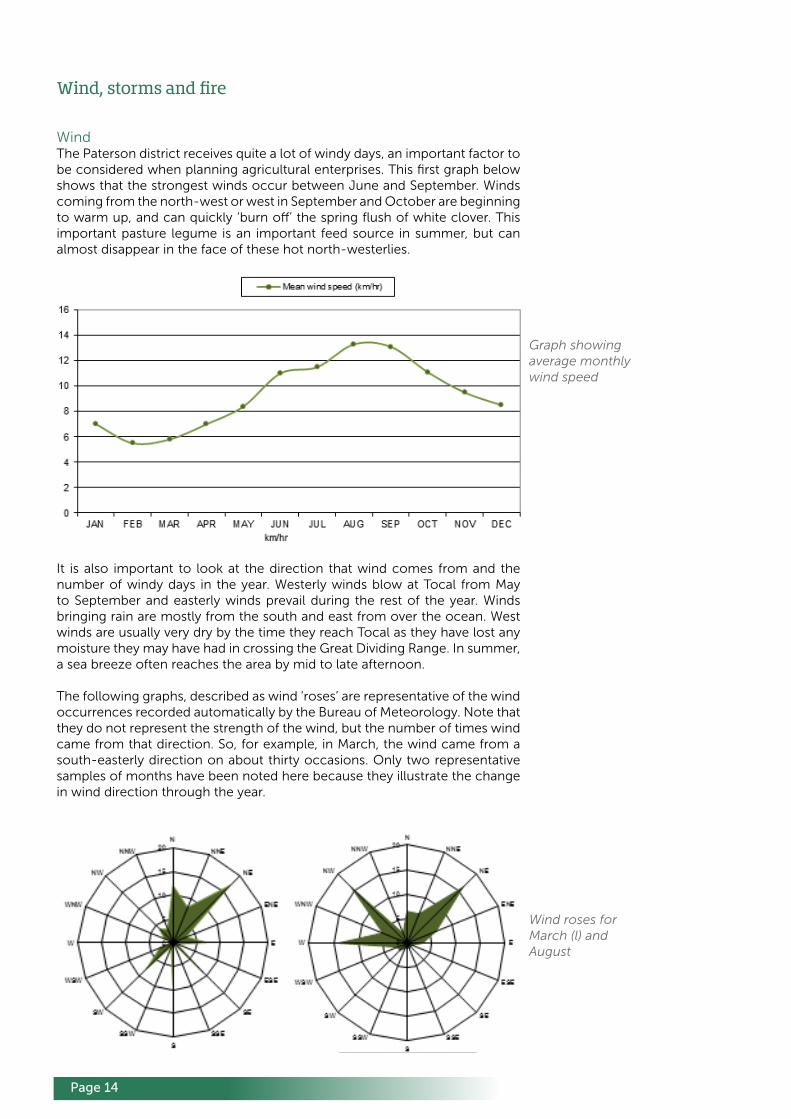
WindThe Paterson district receives quite a lot of windy days, an important factor to be considered when planning agricultural enterprises. This first graph below shows that the strongest winds occur between June and September. Winds coming from the north-west or west in September and October are beginning to warm up, and can quickly ‘burn off’ the spring flush of white clover. This important pasture legume is an important feed source in summer, but can almost disappear in the face of these hot north-westerlies.
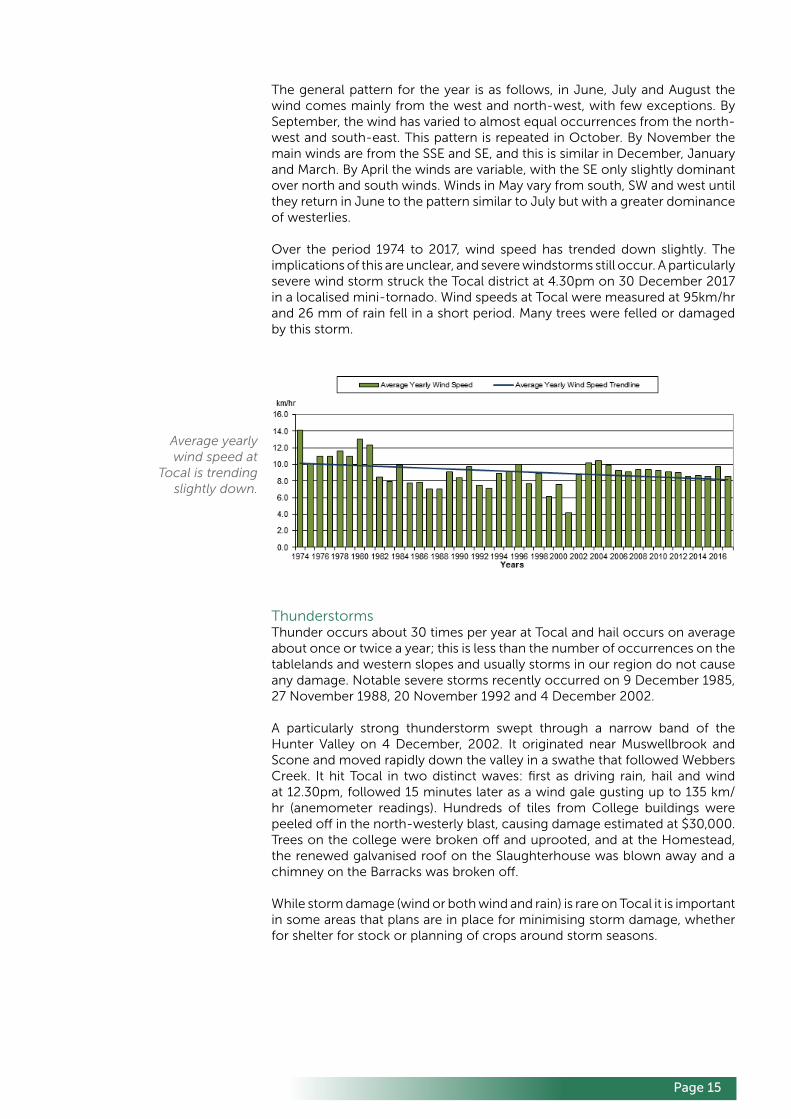
It is also important to look at the direction that wind comes from and the number of windy days in the year. Westerly winds blow at Tocal from May to September and easterly winds prevail during the rest of the year. Winds bringing rain are mostly from the south and east from over the ocean. West winds are usually very dry by the time they reach Tocal as they have lost any moisture they may have had in crossing the Great Dividing Range. In summer, a sea breeze often reaches the area by mid to late afternoon.
The following graphs, described as wind ‘roses’ are representative of the wind occurrences recorded automatically by the Bureau of Meteorology. Note that they do not represent the strength of the wind, but the number of times wind came from that direction. So, for example, in March, the wind came from a south-easterly direction on about thirty occasions. Only two representative samples of months have been noted here because they illustrate the change in wind direction through the year.
Graph showing average monthly wind speed
Wind roses for March (l) and August
Page 15
The general pattern for the year is as follows, in June, July and August the wind comes mainly from the west and north-west, with few exceptions. By September, the wind has varied to almost equal occurrences from the north-west and south-east. This pattern is repeated in October. By November the main winds are from the SSE and SE, and this is similar in December, January and March. By April the winds are variable, with the SE only slightly dominant over north and south winds. Winds in May vary from south, SW and west until they return in June to the pattern similar to July but with a greater dominance of westerlies.
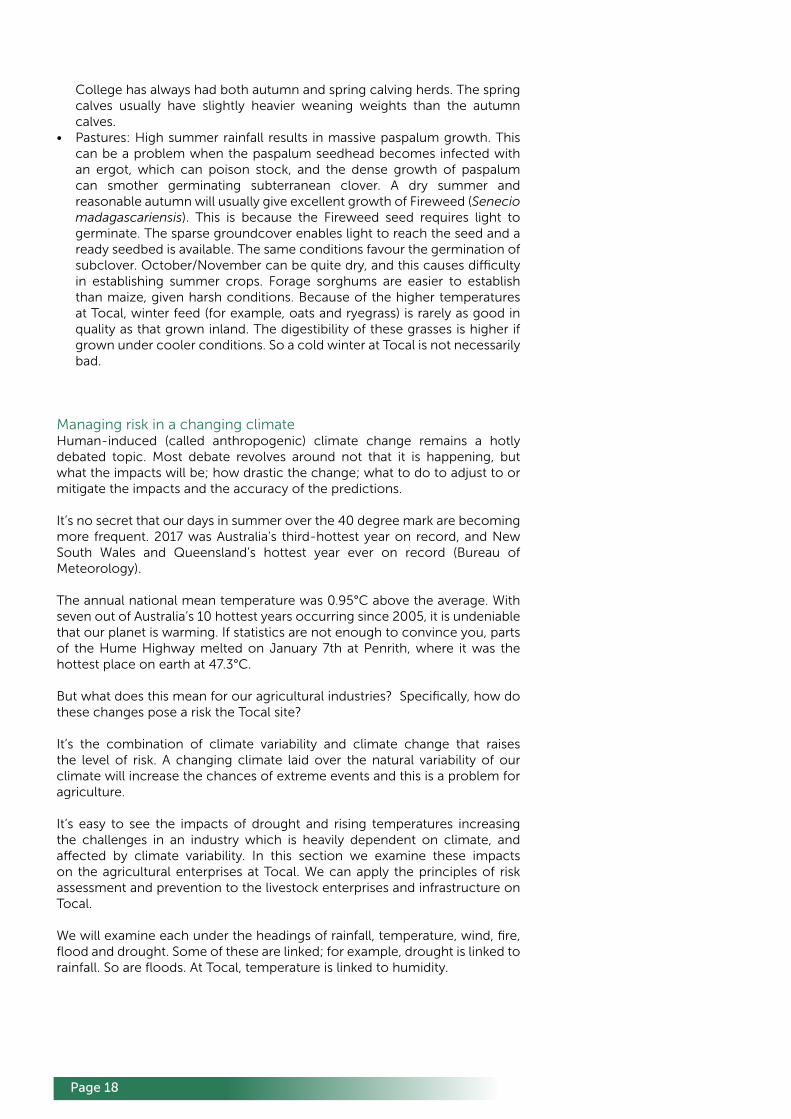
Over the period 1974 to 2017, wind speed has trended down slightly. The implications of this are unclear, and severe windstorms still occur. A particularly severe wind storm struck the Tocal district at 4.30pm on 30 December 2017 in a localised mini-tornado. Wind speeds at Tocal were measured at 95km/hr and 26 mm of rain fell in a short period. Many trees were felled or damaged by this storm.
ThunderstormsThunder occurs about 30 times per year at Tocal and hail occurs on average about once or twice a year; this is less than the number of occurrences on the tablelands and western slopes and usually storms in our region do not cause any damage. Notable severe storms recently occurred on 9 December 1985, 27 November 1988, 20 November 1992 and 4 December 2002.
A particularly strong thunderstorm swept through a narrow band of the Hunter Valley on 4 December, 2002. It originated near Muswellbrook and Scone and moved rapidly down the valley in a swathe that followed Webbers Creek. It hit Tocal in two distinct waves: first as driving rain, hail and wind at 12.30pm, followed 15 minutes later as a wind gale gusting up to 135 km/hr (anemometer readings). Hundreds of tiles from College buildings were peeled off in the north-westerly blast, causing damage estimated at $30,000. Trees on the college were broken off and uprooted, and at the Homestead, the renewed galvanised roof on the Slaughterhouse was blown away and a chimney on the Barracks was broken off.
While storm damage (wind or both wind and rain) is rare on Tocal it is important in some areas that plans are in place for minimising storm damage, whether for shelter for stock or planning of crops around storm seasons.
Average yearly wind speed at
Tocal is trending slightly down.

Page 16
BushfiresThe Australian bush is susceptible, and adapted, to fire. Humans and their structures are not. When high temperatures are combined with low humidity and strong winds, there is always a danger of bushfires if there is sufficient fuel-load to support the spread of fire.
Over the history of Tocal bushfires have ravaged the district on many occasions. Tocal has been seriously affected by fires on a number of occasions because much of the Tocal property is heavily timbered by dry eucalypt forest that is very exposed to bushfires. Most bushfires burn in the dry season, which at Tocal is in spring or early summer. The chance of a bushfire becoming established depends on the amount of fuel available, the number of days since previous rain, the humidity, the air temperature and the windspeed. Wind accelerates the drying of bushfire fuel, supplies the oxygen which promotes combustion, bends the flames over so that they radiate heat to nearby vegetation and carries burning embers away to set fire to timber ahead.
On Tocal fires generally come from the west, though a fire in 1905 also moved north towards Paterson and in 1939 and 1944 fires with narrow fronts
Storm damage to the campus and landscape on 4 December 2002

Page 17
kept going across the river to the east. While the property remains at risk through every hot dry summer period, the wetlands and lagoons around Tocal Homestead have provided some protection to the Homestead site from major devastation.
After a fire has started, its behaviour depends on the moisture and the amount of combustible vegetation, the slope of the land, the atmospheric humidity and the wind. Bushfires tend to burn uphill but the direction of the bushfire’s advance can change suddenly as the result of the onset of a sea breeze, or downdraughts from nearby thunderstorms. This can increase the risk to firefighters. Their task is often simply to protect particular places, leaving the main conflagration to be doused by the next rainfall or to burn out by consuming the available fuel.
The impacts of fire can be significant on farm operations. Apart from the potential for loss of infrastructure, stock or crops, it can be a costly and time consuming exercise to return the farm to a situation similar to that before the fire. Fences on Tocal have been burnt three times during the first half of the 20th century.
Farming in a variable climateThis section describes Australia’s extremely variable climate, and the impact on farming operations at Tocal. The major climatic influence on farming, rainfall, is very unreliable and averages don’t help to predict seasonal rainfall. So what is the likelihood of receiving this rainfall?
Probability tables can help to answer this question. Computer software packages, for example, Australian Rainman, can create probability tables for you. Using probability tables and the rainfall and evaporation rates, we can make the following observations for Tocal:• the chances of receiving effective rainfall is high in autumn and throughout
winter• the chances of receiving effective rainfall in spring and early summer is
only around 25-30 percent• plant growth is likely to be assured in most autumns and early winter• unless there is carry-over soil moisture, growth in spring will be less than
ideal due to low soil moisture levels.
It is also very useful to have experienced varying conditions on a property. Experience and farm records show us that on Tocal:• Dairy: A good year on the dairy is one which has a fairly dry January/
February so there is not too much growth of kikuyu in which to sow winter pasture. Success in establishing early winter feed ensures the winter feed gap is filled. A poor year on the dairy is a wet, late summer/autumn and wet winter, or both. The hill country bogs up and can’t be worked with machinery or grazed. The soil becomes waterlogged and nitrogen is lost. This results in less plant growth and the quality of plant material falls. The climate at Tocal makes haymaking difficult. It is said that if you live with the hay, that is, mow, rake, bale and cart at exactly the right time, you can make a fair amount of hay. Opportunities are missed if you put the hay second to other farm activities. This risk has made silage production a much more viable proposition for Tocal. The cut pasture or crop material doesn’t need to dry out as much before it is baled. Irrigation ensures the reliability of pasture growth for the dairy.
• Beef and Sheep: The biggest problem at Tocal is that of reliably finishing cattle. Late winter/spring westerlies can turn a reasonable spring into a poor one in a fortnight or three weeks. The flats and basalt country are less vulnerable, because the soil holds more moisture. Cold conditions are rarely a problem for lambs and ewes, compared to the Tablelands. Tocal
Page 18
College has always had both autumn and spring calving herds. The spring calves usually have slightly heavier weaning weights than the autumn calves.
• Pastures: High summer rainfall results in massive paspalum growth. This can be a problem when the paspalum seedhead becomes infected with an ergot, which can poison stock, and the dense growth of paspalum can smother germinating subterranean clover. A dry summer and reasonable autumn will usually give excellent growth of Fireweed (Senecio madagascariensis). This is because the Fireweed seed requires light to germinate. The sparse groundcover enables light to reach the seed and a ready seedbed is available. The same conditions favour the germination of subclover. October/November can be quite dry, and this causes difficulty in establishing summer crops. Forage sorghums are easier to establish than maize, given harsh conditions. Because of the higher temperatures at Tocal, winter feed (for example, oats and ryegrass) is rarely as good in quality as that grown inland. The digestibility of these grasses is higher if grown under cooler conditions. So a cold winter at Tocal is not necessarily bad.
Managing risk in a changing climateHuman-induced (called anthropogenic) climate change remains a hotly debated topic. Most debate revolves around not that it is happening, but what the impacts will be; how drastic the change; what to do to adjust to or mitigate the impacts and the accuracy of the predictions.
It’s no secret that our days in summer over the 40 degree mark are becoming more frequent. 2017 was Australia’s third-hottest year on record, and New South Wales and Queensland’s hottest year ever on record (Bureau of Meteorology).
The annual national mean temperature was 0.95°C above the average. With seven out of Australia’s 10 hottest years occurring since 2005, it is undeniable that our planet is warming. If statistics are not enough to convince you, parts of the Hume Highway melted on January 7th at Penrith, where it was the hottest place on earth at 47.3°C.
But what does this mean for our agricultural industries? Specifically, how do these changes pose a risk the Tocal site?
It’s the combination of climate variability and climate change that raises the level of risk. A changing climate laid over the natural variability of our climate will increase the chances of extreme events and this is a problem for agriculture.
It’s easy to see the impacts of drought and rising temperatures increasing the challenges in an industry which is heavily dependent on climate, and affected by climate variability. In this section we examine these impacts on the agricultural enterprises at Tocal. We can apply the principles of risk assessment and prevention to the livestock enterprises and infrastructure on Tocal.
We will examine each under the headings of rainfall, temperature, wind, fire, flood and drought. Some of these are linked; for example, drought is linked to rainfall. So are floods. At Tocal, temperature is linked to humidity.
Page 19
RainfallRain is one of the most valuable resources for farmers and graziers. Good rains will lead to good seasons and higher returns, while too much or too little rain at the wrong time of the year will reduce returns.
Little cropping occurs at Tocal, although fodder crops and silage production is important to the dairy. Many of these crops depend on rainfall. Crop yields are likely to be highly sensitive to any decreases in rainfall. Lack of rain at sowing can lead to delays in planting, as can too much rain at sowing. Both lead to reduced yields if you miss the optimum sowing time.
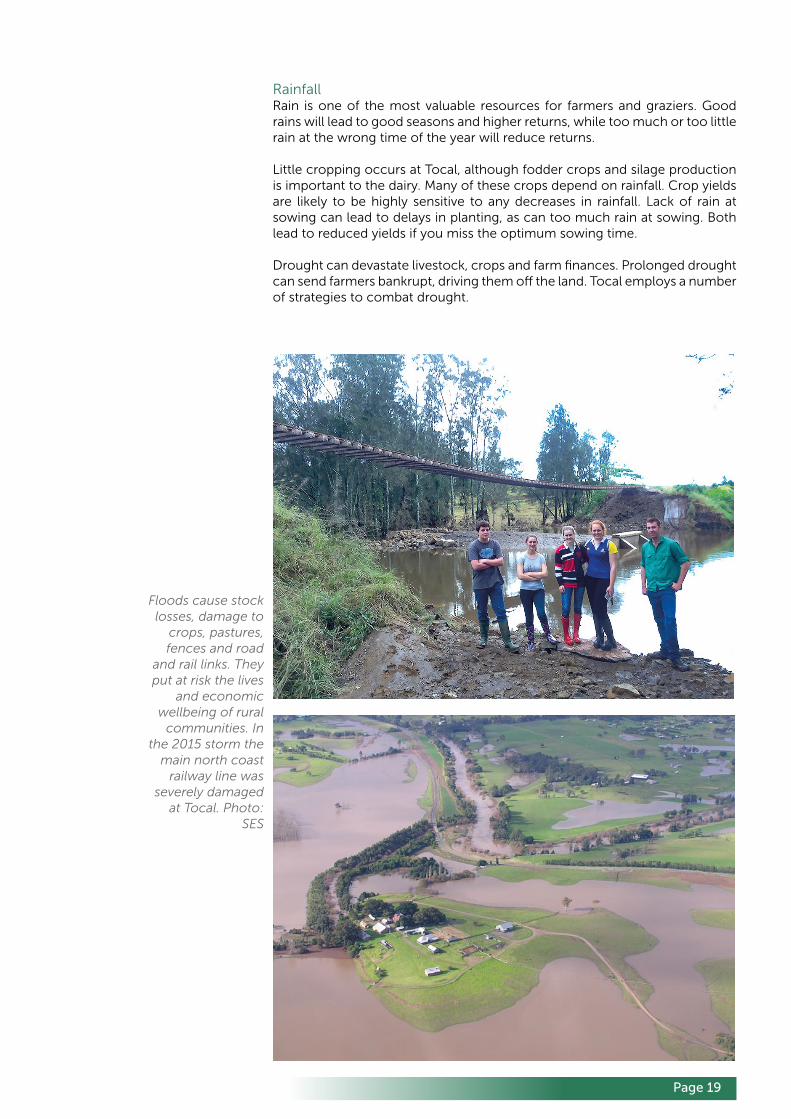
Drought can devastate livestock, crops and farm finances. Prolonged drought can send farmers bankrupt, driving them off the land. Tocal employs a number of strategies to combat drought.
Floods cause stock losses, damage to
crops, pastures, fences and road
and rail links. They put at risk the lives
and economic wellbeing of rural
communities. In the 2015 storm the
main north coast railway line was
severely damaged at Tocal. Photo:
SES
Page 20
Drought strategiesStrategies to address the impact of drought are well known. Property planning is the first major step in most strategies. ‘Drought proofing’ is usually impossible, but there are some concrete steps we can take. For example, managing a livestock enterprise through a dry time or drought starts with seasonal forecasts. We will work out a ‘trigger point’ for action: “If it doesn’t rain by the end of March I will cull 100 head.” That date will be your trigger. Actions may vary. The usual choices are to sell, feed or agist.
There are planning tools available to help work out your best option and when to apply it. Most of these use ‘what if’ budgets (or partial budgets) to help inform a drought strategy. At Tocal, the most common decision is to sell surplus stock while prices remain high.
Excessive rainToo much rain at the ‘wrong’ time, even if not a flood, can disrupt normal activities. Tocal has a long history of floods, as the property has frontages on the Paterson River and Webbers Creek. In any flood up to 150 hectares of land may be flooded, putting it out of production and causing infrastructure damage.
Major floods affecting the Tocal property have been recorded in March 1875, March 1978, April 1988 and February 1990.
Storms can have similar consequences as floods. In 2015 an intense east coast low brought severe storms and flooding to specific localities in the Lower Hunter Valley. Dungog and Tocal received new record daily rainfalls on 21 April of 233.4 and 242.6 mm respectively. Damage around and in the towns of Dungog and Stroud, as well as infrastructure damage, particularly to the north coast rail line at Tocal College, had major impacts, including the loss of lives.
Flood strategiesThe main risk management strategies for floods are mainly aimed at preserving the condition of the land. If land is worked up and bare, it is highly susceptible to erosion. Fences close to or cutting across waterways is likely to be destroyed. Banks of rivers, creeks and streams that are denuded of vegetation are likely to be degraded further in a flood, with slumping of the banks.
Tactical measures involve being able to quickly move stock to higher ground and move irrigation pumps out of danger. Flood warnings issued by authorities and even neighbours can prevent being caught off-guard.
TemperatureThe extremes of temperature are the biggest danger to our agricultural production. As the climate warms, temperatures are likely to increase. Extremely hot days above 35°C are increasing.
Higher temperatures may increase evapotranspiration, possibly leading to more rapid drying of the soil, particularly in spring, when grain is filling and ripening, leading to moisture stress in the crop. Extremely hot days can lead to ‘pollen blasting’ which reduces fertilisation in crops like maize.
Warmer temperatures will also influence the growth and spread of pests, diseases and weeds. Some will thrive, others will decrease in severity.

Page 21
High temperatures pose a risk to farm animals. Heat can kill or at least affect the growth rates of small animals such as chickens, bees, piglets and lambs. Intensively housed animals can suffer severe losses from heat stress. Grazing animals that can’t access shade or adequate water will suffer production losses in high temperatures and extremely hot days.
At Tocal it is the combination of high heat and high humidity that causes the most stress on animals (and humans). The combined effect can be measured as a heat index. As one moves further north along the coastal district, this heat index increases in severity. Tocal stands in the centre of this effect.
Heat strategiesIn cropping enterprises, warming conditions will change the sowing dates for some crops, and we look to choose varieties that will mature away from the most likely heat and water stress periods.
Grazing animals must have access to adequate shade at all times. This is a basic animal welfare issue. Again, providing shade in all paddocks is part of Tocal’s overall property plan.
For the dairy herd, the provision of shade can be a problem due to more intensive and strip grazing. In irrigated paddocks, shade trees have been removed for the centre pivot irrigation systems, so other measures must be put in place to keep cattle cool.
In this case, shelter over feed pads, sprinklers or misters in holding yards and the quiet movement of all stock reduce heat stress. Artificial shelters in paddocks or loafing areas are being constructed where natural tree cover isn’t adequate.
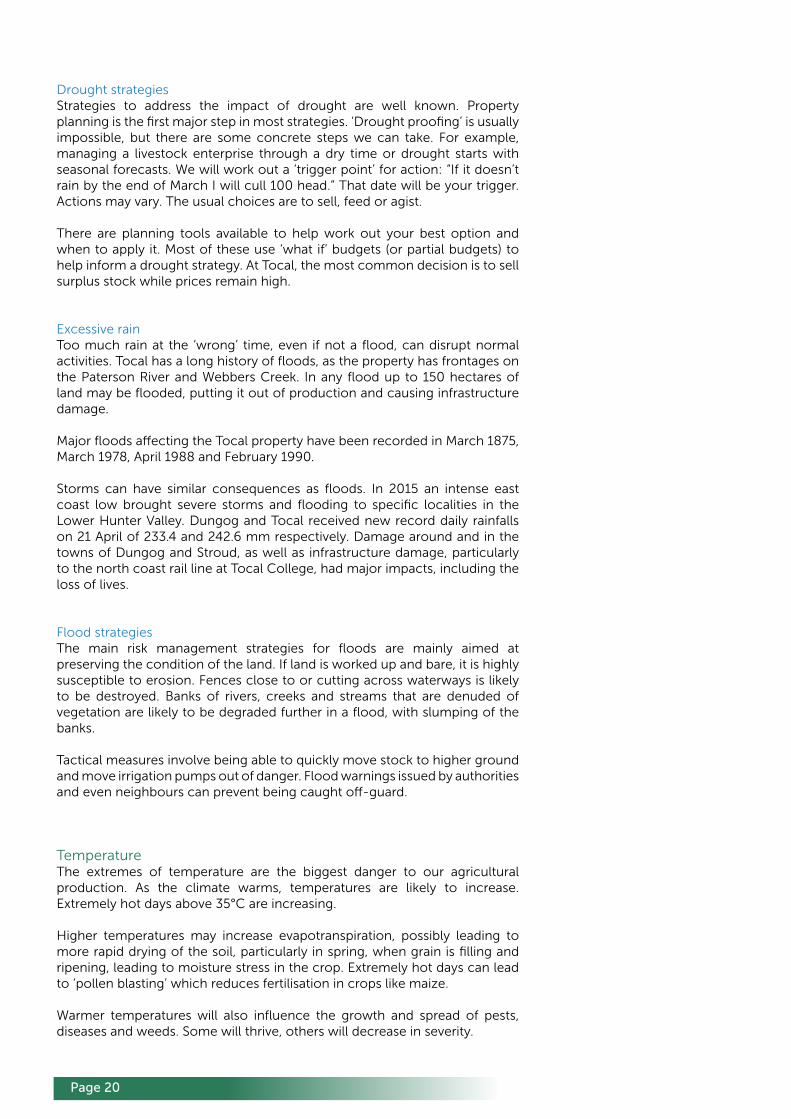
As part of the Tocal property plan, shade trees are specifically planted when paddocks are subdivided in the beef grazing areas. In many of the paddocks designated as horse paddocks, artificial shelters are provided, as horses are particularly destructive to trees.
Sprinklers in milking area.
Page 22
The free range chicken production unit must be on constant alert for extremes. High temperatures and, even worse, high humidity, are the real threats. Temperatures of over 35°C can cause mortalities. Consistent monitoring and adjusting of the sheds in the free range system is essential as the temperature and humidity rises. In extreme conditions the birds are confined to the sheds and cooling fans with evaporation cooling pads are turned on. Ceiling fans mix the air which is vented from the end of the sealed sheds. In summer, when the birds are free to range, paddock shade is provided by trees and shade cloth. This intensive livestock enterprise is well-versed in what is needed for the welfare of their animals, but when things go wrong, it can be catastrophic. Back-up power and water is an essential part of the plan to cope with climate extremes.
Cold snaps and frostsThe likelihood of cold snaps and frost are becoming less frequent. As the climate becomes more variable, seasonal norms will be disrupted and out-of-season frosts may in fact increase. With global warming, we would expect that the number and severity of frost will decrease, because there will be more hot days, and the climate generally is warming.
In some areas of the property structures are provided for shelter in order to protect tree lots from stock damage.
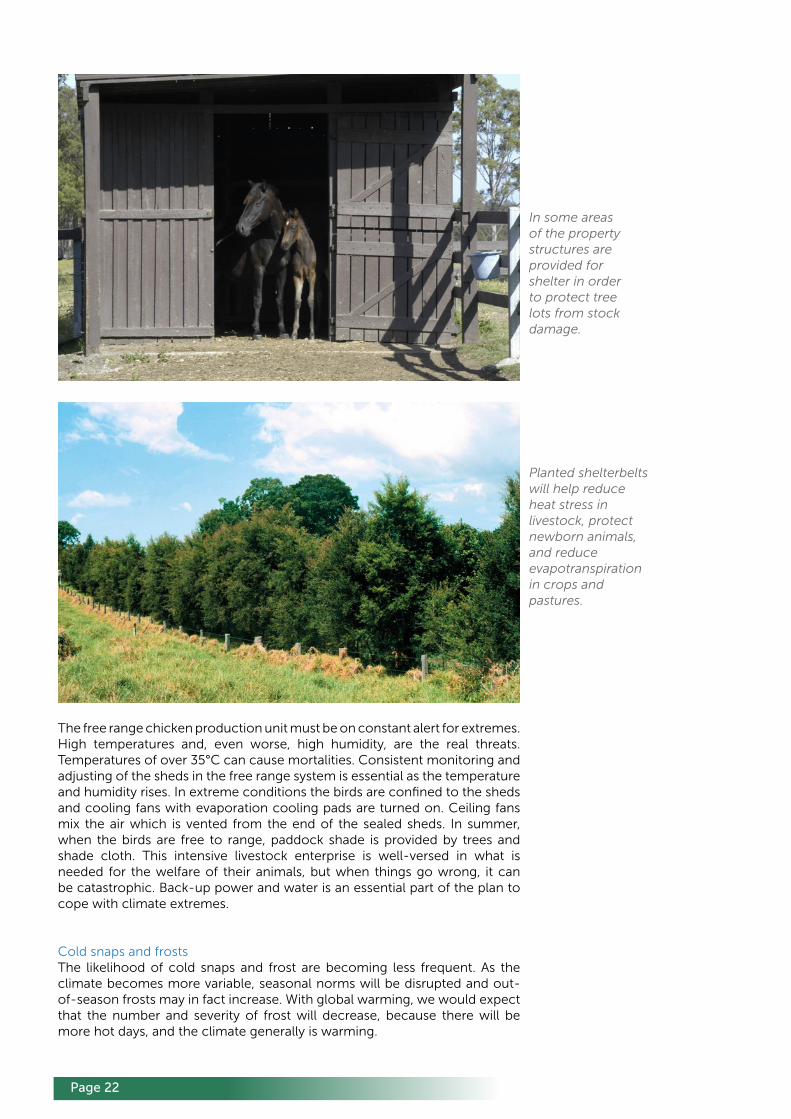
Planted shelterbelts will help reduce heat stress in livestock, protect newborn animals, and reduce evapotranspiration in crops and pastures.
Page 23
Cold strategiesCrop and pasture breeding is designed to adjust for change in the length of the growing season and time of flowering Varieties that will grow with lower moisture requirements are being developed. Planting times can be adjusted to compensate for warmer temperatures and to avoid heat stress and drought.
As for heat, insulating housed animals will allow their growth and production to withstand extremes of low temperatures.
Cold weather and unseasonal cold snaps, combined with wind and rain, is a risk for grazing animals. Severe weather warnings, ‘graziers’ alerts’ can inform growers of impending problems. Moving stock to more sheltered paddocks, with shelterbelts of trees or tall grass or shrubs, or moving them to paddocks on the lee side of severe winds are common strategies. This is particularly important for lambing ewes and sheep off-shears.
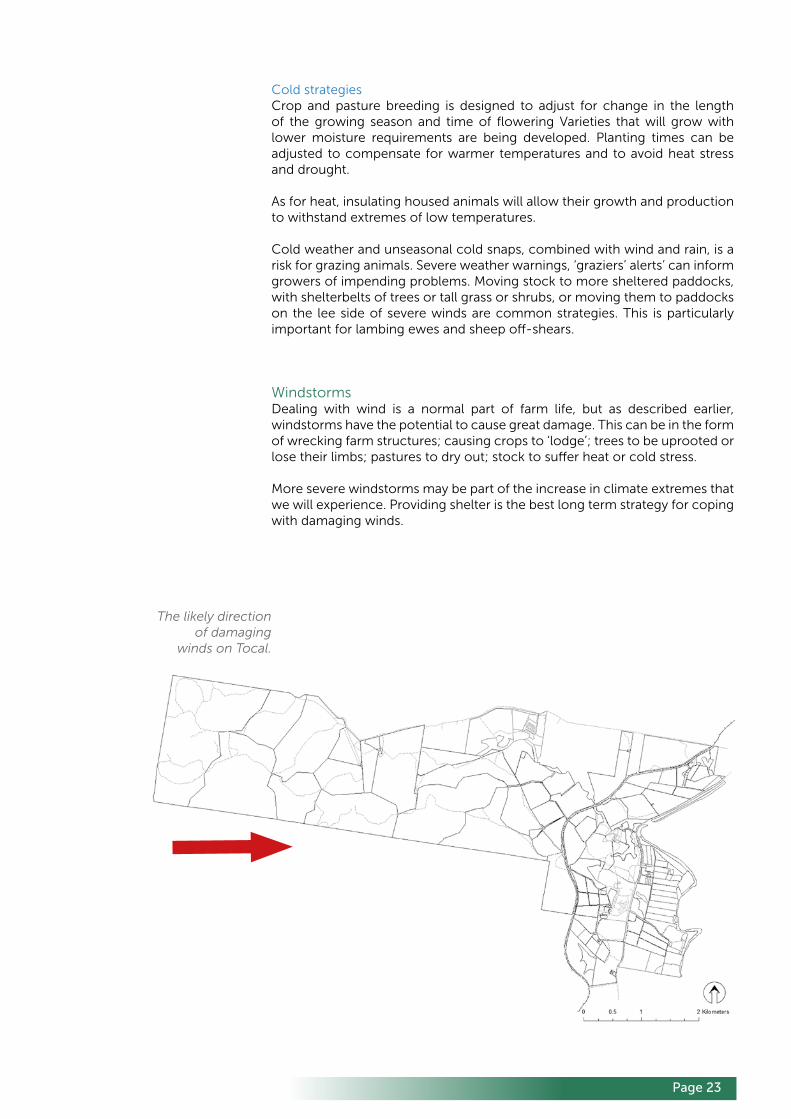
WindstormsDealing with wind is a normal part of farm life, but as described earlier, windstorms have the potential to cause great damage. This can be in the form of wrecking farm structures; causing crops to ‘lodge’; trees to be uprooted or lose their limbs; pastures to dry out; stock to suffer heat or cold stress.
More severe windstorms may be part of the increase in climate extremes that we will experience. Providing shelter is the best long term strategy for coping with damaging winds.
The likely direction of damaging
winds on Tocal.
Page 24
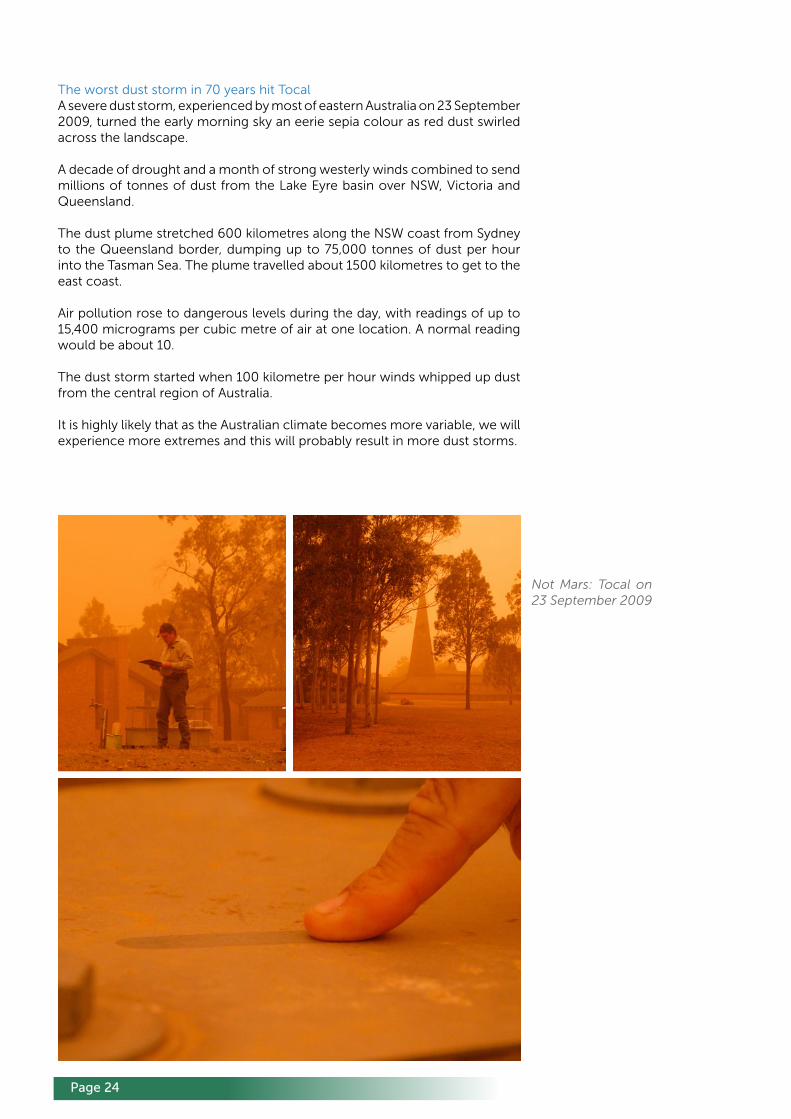
The worst dust storm in 70 years hit TocalA severe dust storm, experienced by most of eastern Australia on 23 September 2009, turned the early morning sky an eerie sepia colour as red dust swirled across the landscape.
A decade of drought and a month of strong westerly winds combined to send millions of tonnes of dust from the Lake Eyre basin over NSW, Victoria and Queensland.
The dust plume stretched 600 kilometres along the NSW coast from Sydney to the Queensland border, dumping up to 75,000 tonnes of dust per hour into the Tasman Sea. The plume travelled about 1500 kilometres to get to the east coast.
Air pollution rose to dangerous levels during the day, with readings of up to 15,400 micrograms per cubic metre of air at one location. A normal reading would be about 10.
The dust storm started when 100 kilometre per hour winds whipped up dust from the central region of Australia.
It is highly likely that as the Australian climate becomes more variable, we will experience more extremes and this will probably result in more dust storms.
Not Mars: Tocal on 23 September 2009
Page 25
HailHail can wreak random devastation to agricultural enterprises. Having said that, hail is not as random as it might be. There are certain districts and localities that experience more than their ‘fair share’ of hail. Hail is a condition that farmers can insure against, but Tocal is not known as a hail corridor.
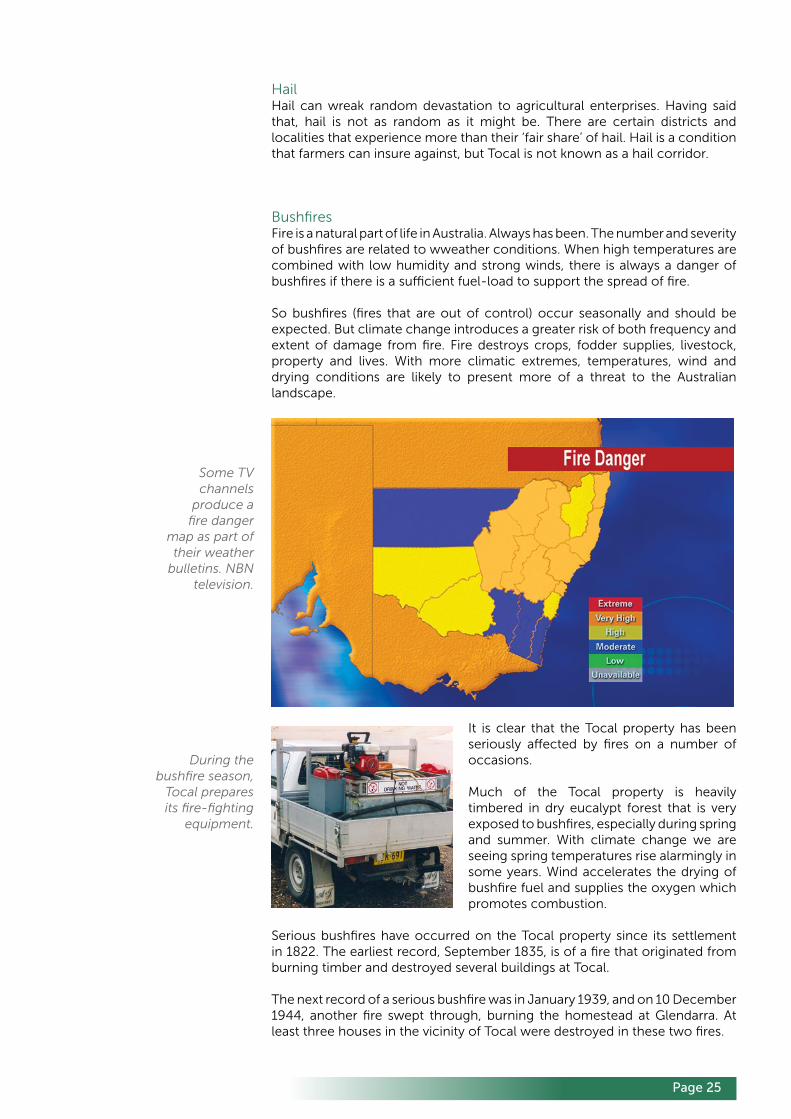
BushfiresFire is a natural part of life in Australia. Always has been. The number and severity of bushfires are related to wweather conditions. When high temperatures are combined with low humidity and strong winds, there is always a danger of bushfires if there is a sufficient fuel-load to support the spread of fire.
So bushfires (fires that are out of control) occur seasonally and should be expected. But climate change introduces a greater risk of both frequency and extent of damage from fire. Fire destroys crops, fodder supplies, livestock, property and lives. With more climatic extremes, temperatures, wind and drying conditions are likely to present more of a threat to the Australian landscape.
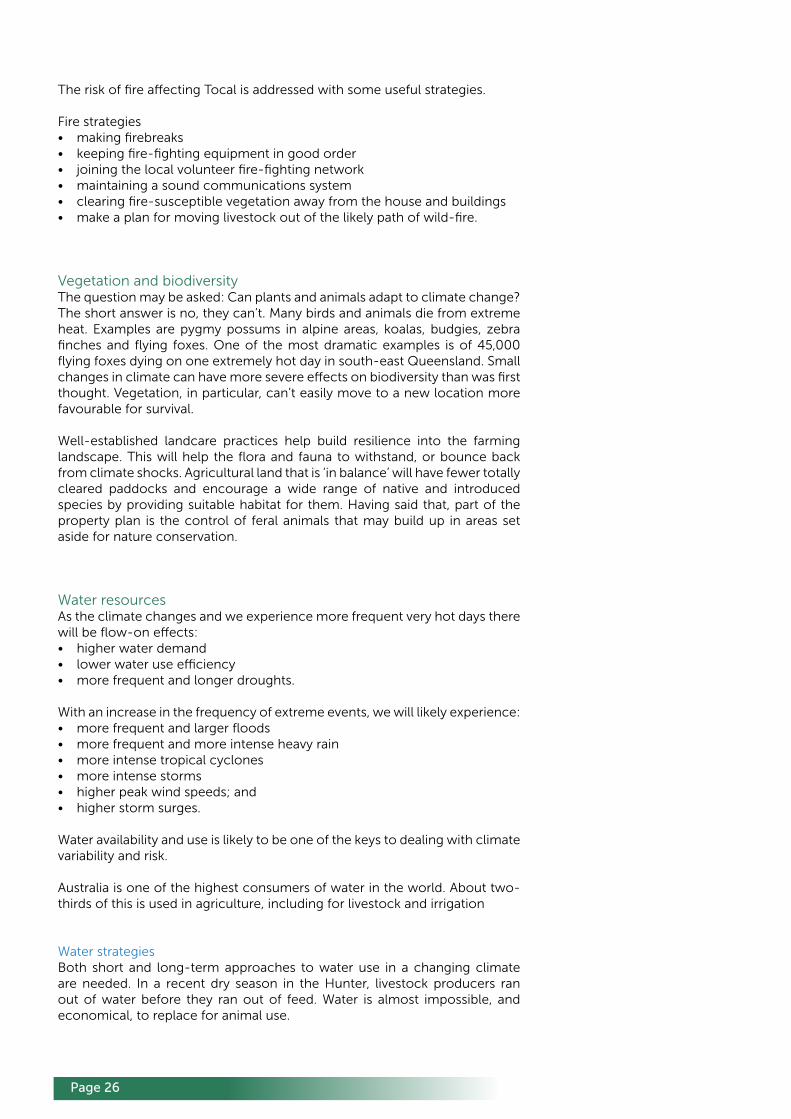
It is clear that the Tocal property has been seriously affected by fires on a number of occasions.
Much of the Tocal property is heavily timbered in dry eucalypt forest that is very exposed to bushfires, especially during spring and summer. With climate change we are seeing spring temperatures rise alarmingly in some years. Wind accelerates the drying of bushfire fuel and supplies the oxygen which promotes combustion.
Serious bushfires have occurred on the Tocal property since its settlement in 1822. The earliest record, September 1835, is of a fire that originated from burning timber and destroyed several buildings at Tocal.
The next record of a serious bushfire was in January 1939, and on 10 December 1944, another fire swept through, burning the homestead at Glendarra. At least three houses in the vicinity of Tocal were destroyed in these two fires.
Some TV channels
produce a fire danger
map as part of their weather
bulletins. NBN television.
During the bushfire season,
Tocal prepares its fire-fighting
equipment.
Page 26
The risk of fire affecting Tocal is addressed with some useful strategies.
Fire strategies• making firebreaks• keeping fire-fighting equipment in good order• joining the local volunteer fire-fighting network• maintaining a sound communications system• clearing fire-susceptible vegetation away from the house and buildings• make a plan for moving livestock out of the likely path of wild-fire.
Vegetation and biodiversityThe question may be asked: Can plants and animals adapt to climate change? The short answer is no, they can’t. Many birds and animals die from extreme heat. Examples are pygmy possums in alpine areas, koalas, budgies, zebra finches and flying foxes. One of the most dramatic examples is of 45,000 flying foxes dying on one extremely hot day in south-east Queensland. Small changes in climate can have more severe effects on biodiversity than was first thought. Vegetation, in particular, can’t easily move to a new location more favourable for survival.
Well-established landcare practices help build resilience into the farming landscape. This will help the flora and fauna to withstand, or bounce back from climate shocks. Agricultural land that is ‘in balance’ will have fewer totally cleared paddocks and encourage a wide range of native and introduced species by providing suitable habitat for them. Having said that, part of the property plan is the control of feral animals that may build up in areas set aside for nature conservation.
Water resourcesAs the climate changes and we experience more frequent very hot days there will be flow-on effects:• higher water demand• lower water use efficiency• more frequent and longer droughts.
With an increase in the frequency of extreme events, we will likely experience:• more frequent and larger floods• more frequent and more intense heavy rain• more intense tropical cyclones• more intense storms • higher peak wind speeds; and• higher storm surges.
Water availability and use is likely to be one of the keys to dealing with climate variability and risk.
Australia is one of the highest consumers of water in the world. About two-thirds of this is used in agriculture, including for livestock and irrigation
Water strategiesBoth short and long-term approaches to water use in a changing climate are needed. In a recent dry season in the Hunter, livestock producers ran out of water before they ran out of feed. Water is almost impossible, and economical, to replace for animal use.

Page 27
In the intensive livestock industries, there may be scope for water harvesting of rain water or capturing run-off water into dams or tanks or recycling and re-using water.
With a frontage to both the Paterson River for irrigation, and Webbers Creek for stock water, Tocal is well-provided for shortages, but there are no guarantees that water supplies will be totally secure. Dams in all paddocks supplement the creek water. Troughs in many paddocks also ensure a reliable supply for stock water. Clean drinking water for livestock will give production benefits, but careful monitoring of troughs is essential.
Irrigated pasture provides a great buffer to the vagaries of climate, but in very dry conditions salt encroaches into the Paterson River as far up as Tocal and in a drought, the salt levels become too toxic for irrigation. This is not a common phenomenon, but it is a real cause for concern. In the 1965 and 1980 droughts, water quality measurements exceeded safe levels. In 1980 this was only relieved when, brought on by pressure from local farmers, water was released from Lostock Dam.
Irrigation efficiency will be critical for
planning in the future.
NSW DPI publishes information on water
storage.
(https://www.dpi.nsw.gov.
au/agriculture/irrigation/storage)

Page 28