Embed Size (px)
Citation preview
Wealth Inequality, Conflict and Population Health in Sudan
Amel S Omer
A thesis
submitted in partial fulfillment of the
requirements for the degree of
Master of Public Health
University of Washington
2013
Committee:
Stephen Bezruchka
Amy Hagopian
Program Authorized to Offer Degree:
Global Health

©Copyright 2013
Amel S Omer
i
ABSTRACT
Background: Researchers have demonstrated an association between income inequality and
poor health outcomes over recent decades. We sought to understand the effects on health of
both inequality and political armed conflict in Sudan, a northeast African country with seven
international borders. Sudan’s 31 million people represent diverse cultures, both Arabic and
African. Sudan is a poor country, with a Human Development index of 0.41, ranking 171st of
187 countries. The country has suffered political instability since independence from Britain in
1956, with two revolutions and a 40-year civil war. Armed conflict in western Sudan and states
bordering South Sudan are ongoing.
Methods: Data on 13,282 under five children were derived from the Sudan household survey
round 2 (SHHS2), conducted between March and May 2010. The household assets index from
that study was used as the indicator of living standards inequality. We also used data from the
Sudan census conducted in 2008. We evaluated the role of both asset distribution and armed
conflict in six health-related outcomes: life expectancy, infant mortality, teenage birth, height
for age (stunting), vaccination coverage for children aged 12 to 23 months, and adequacy of
food consumption.
Results: For four of our six measures of health in Sudan (food consumption, life expectancy,
teen births and infant mortality), outcomes were significantly worse in the states with more
skewness of wealth distribution, with correlation coefficients above .70 in all cases. For the
two remaining health indicators, (height-for-age z scores or stunting, and vaccination
coverage), we found weaker correlations with wealth skewness until we removed the conflict-
affected states from the analysis. After removing those three states, the correlation coefficients
on the stunting was significantly high again of .82 however there was no big difference for
vaccination.
Conclusion: Wealth inequality and armed conflict are associated with poor population health
in Sudan. Policies and public health strategies are required to address the distribution of
resources and associated health problems. Wealth redistribution in the more unequal states, as
well as a political resolution of conflict, may improve population health.
ii
TABLE OF CONTENTS
ABSTRACT ......................................................................................................... i
LIST OF FIGURES ........................................................................................ iiiii
LIST OF TABLES .............................................................................................. v
ACKNOWLEGMENTS .................................................................................... vi
INTRODUCTION………………………………………………………………………………1
METHODS……………………………………………………………………………………...3
Data Sources ............................................................................................................................. 3
Sudan Household Health Survey-2....................................................................................... 3
Census ................................................................................................................................... 4
Measures of wealth and inequality ........................................................................................... 5
Measures of health ................................................................................................................... 5
Life expectancy ..................................................................................................................... 5
Infant Mortality Rate (IMR); Source (Census) ..................................................................... 5
Height for age ....................................................................................................................... 5
Food consumption ................................................................................................................ 6
Teen births ............................................................................................................................ 6
Vaccination ........................................................................................................................... 6
Confounders, effect modifiers and possible biases .................................................................. 6
Data analysis ............................................................................................................................ 7
RESULTS……………………………………………………………………………………….7
Skewness .................................................................................................................................. 8
Life expectancy ........................................................................................................................ 8
Infant mortality ......................................................................................................................... 8
Height for age (stunting) .......................................................................................................... 9
Food consumption .................................................................................................................... 9
Teen births ................................................................................................................................ 9
Proportion vaccinated ............................................................................................................... 9
DISCUSSION………………………………………………………………………………….10
TABLES AND FIGURES………………………………………………..……………………13
REFERENCES………………………………………………………………………………...28
iii
LIST OF FIGURES
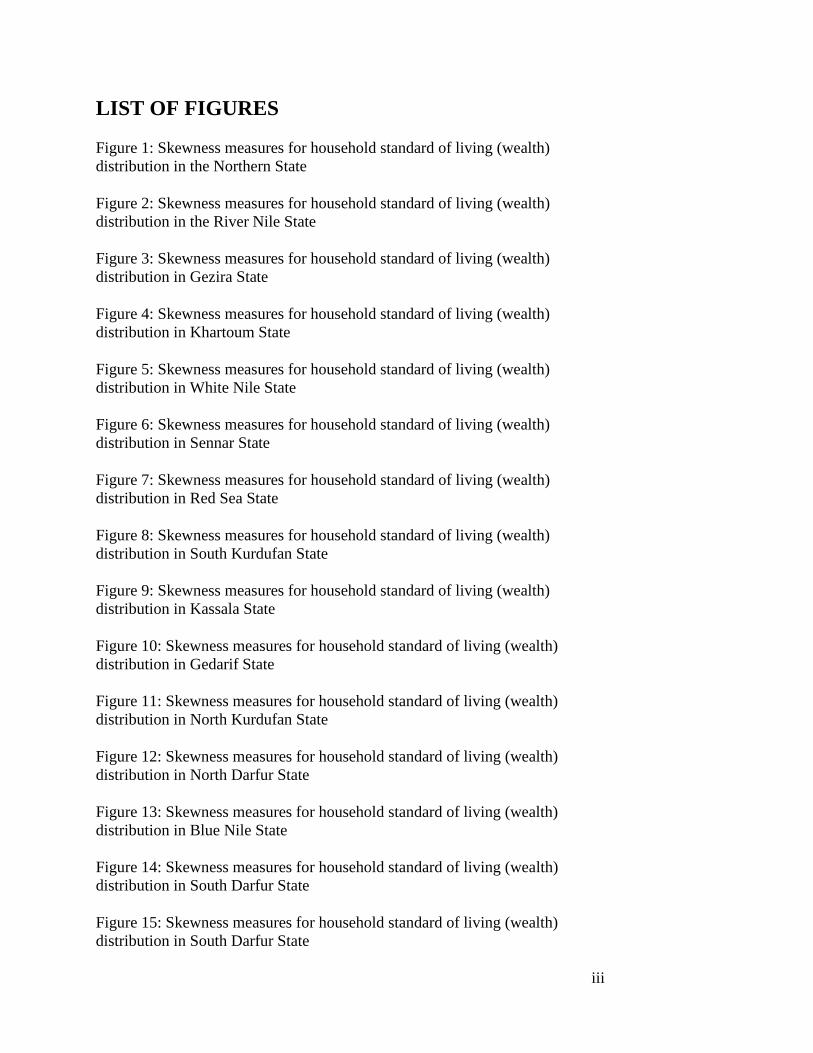
Figure 1: Skewness measures for household standard of living (wealth)
distribution in the Northern State
Figure 2: Skewness measures for household standard of living (wealth)
distribution in the River Nile State
Figure 3: Skewness measures for household standard of living (wealth)
distribution in Gezira State
Figure 4: Skewness measures for household standard of living (wealth)
distribution in Khartoum State
Figure 5: Skewness measures for household standard of living (wealth)
distribution in White Nile State
Figure 6: Skewness measures for household standard of living (wealth)
distribution in Sennar State
Figure 7: Skewness measures for household standard of living (wealth)
distribution in Red Sea State
Figure 8: Skewness measures for household standard of living (wealth)
distribution in South Kurdufan State
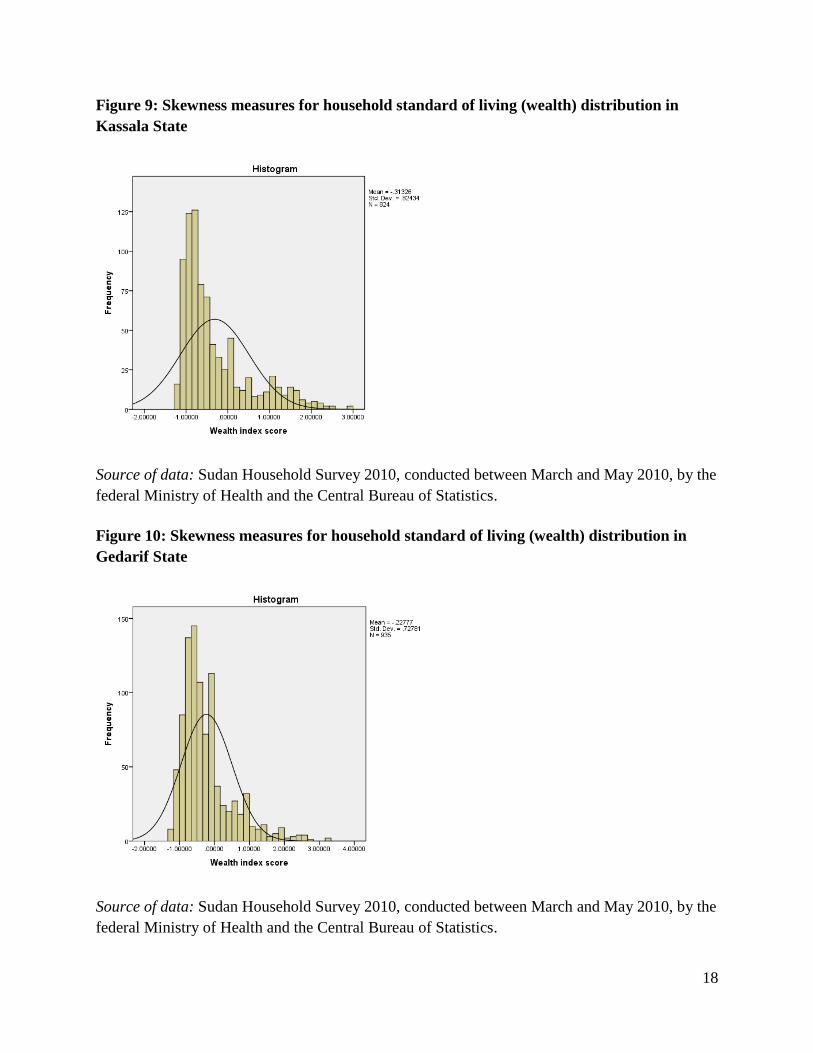
Figure 9: Skewness measures for household standard of living (wealth)
distribution in Kassala State
Figure 10: Skewness measures for household standard of living (wealth)
distribution in Gedarif State
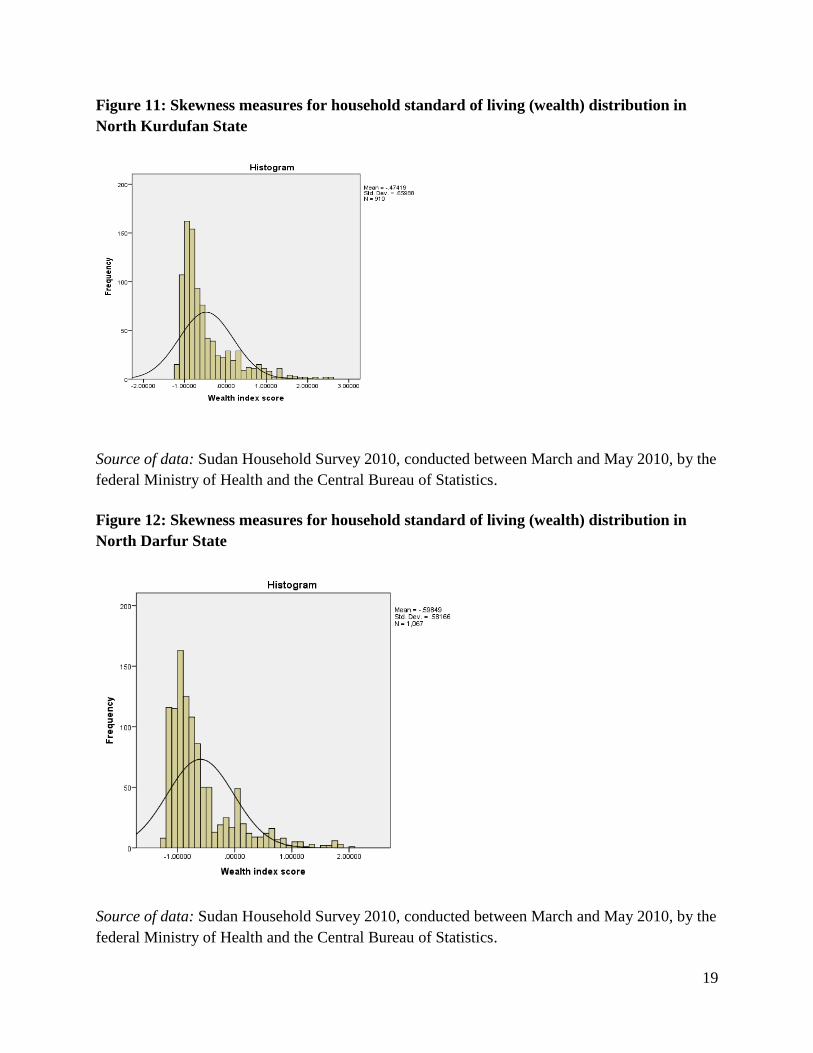
Figure 11: Skewness measures for household standard of living (wealth)
distribution in North Kurdufan State
Figure 12: Skewness measures for household standard of living (wealth)
distribution in North Darfur State
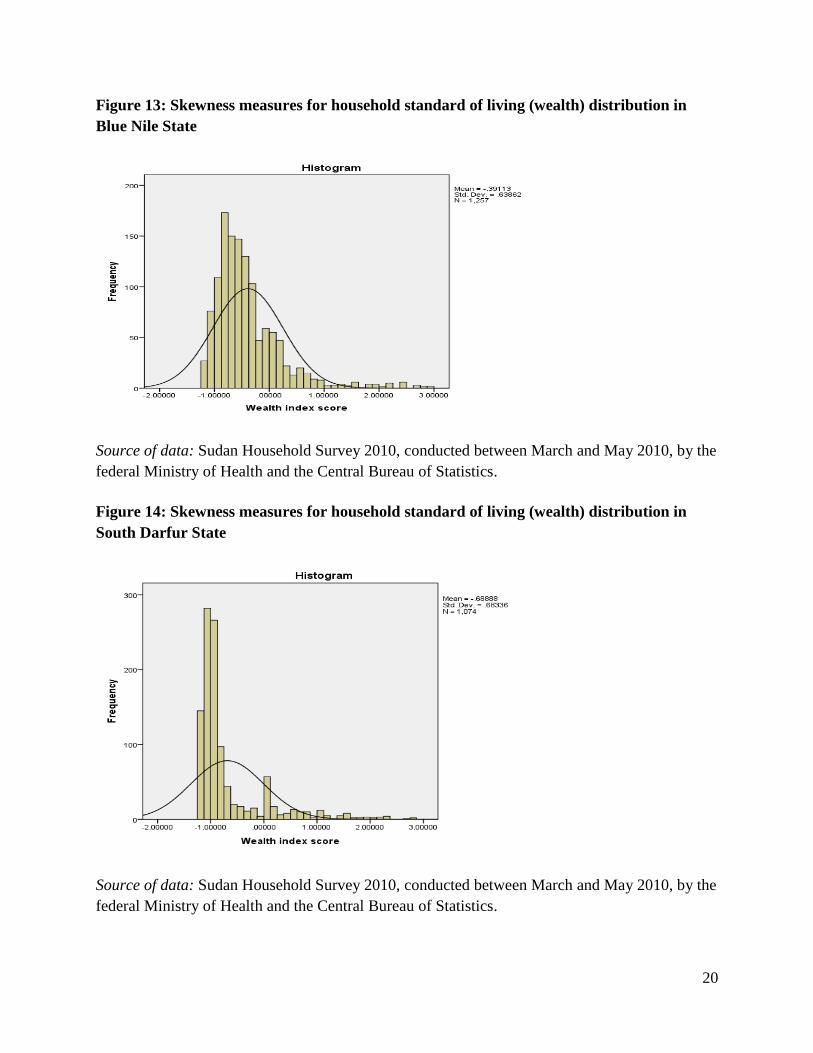
Figure 13: Skewness measures for household standard of living (wealth)
distribution in Blue Nile State
Figure 14: Skewness measures for household standard of living (wealth)
distribution in South Darfur State
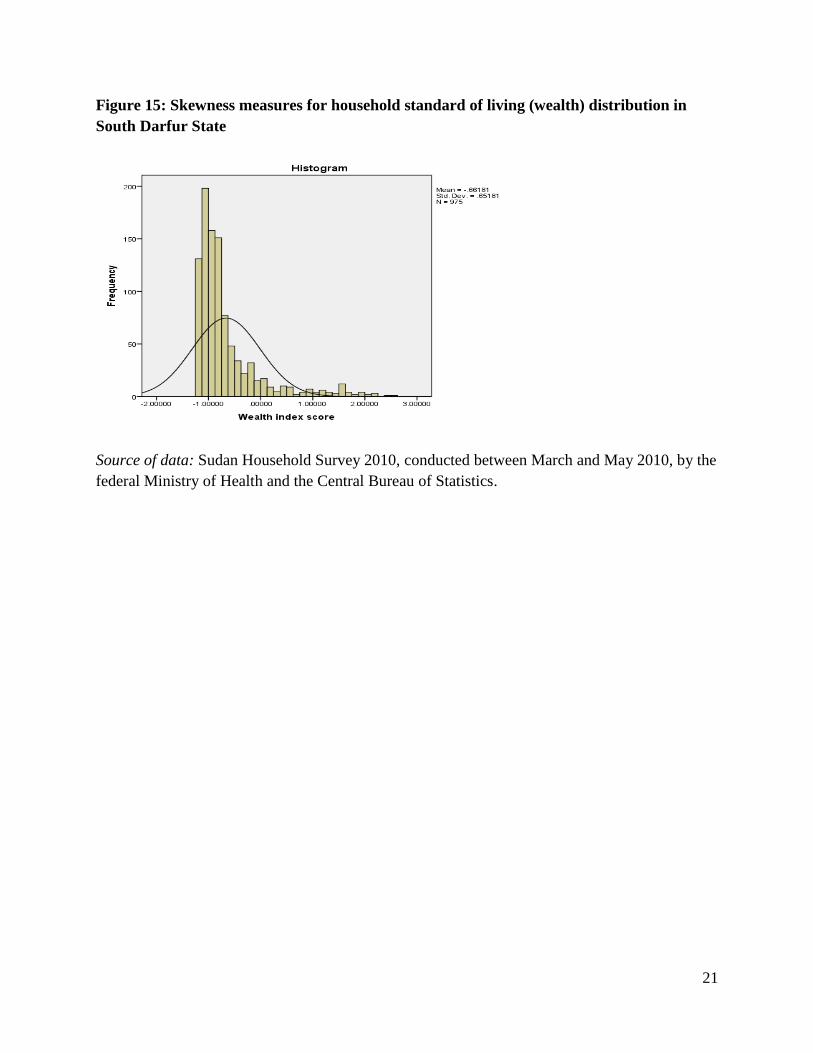
Figure 15: Skewness measures for household standard of living (wealth)
distribution in South Darfur State
iv
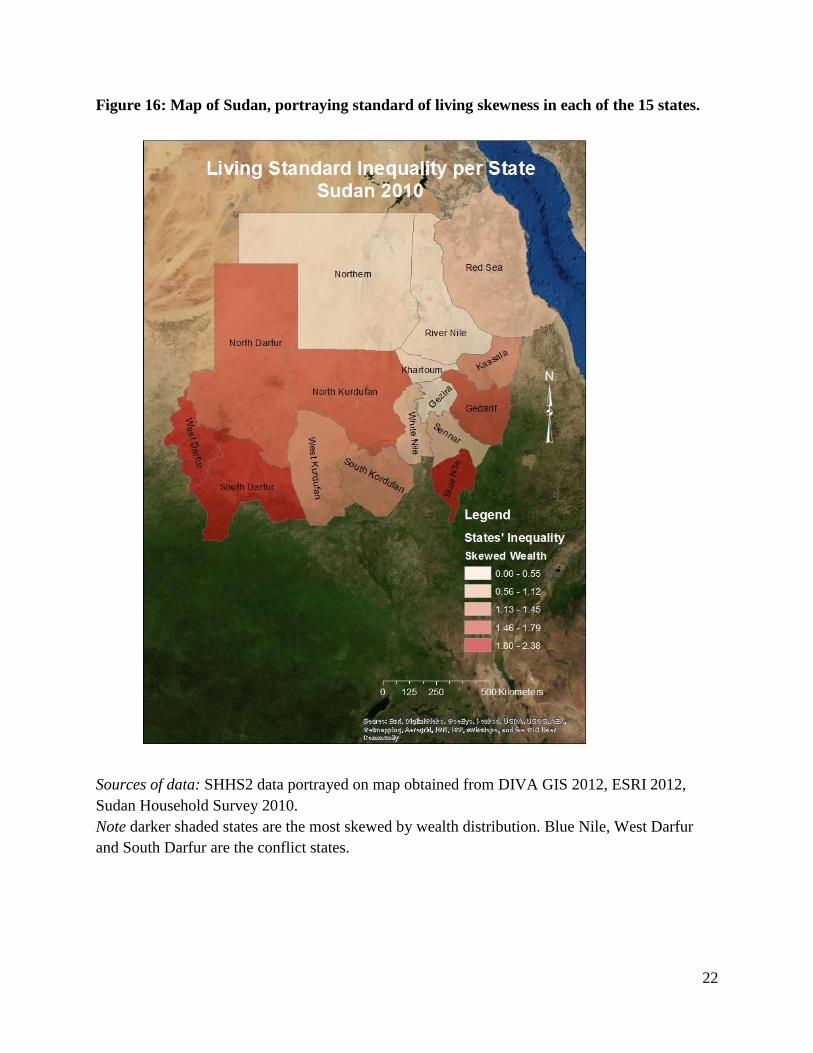
Figure 16: Map of Sudan, portraying standard of living skewness in each of the
15 states.
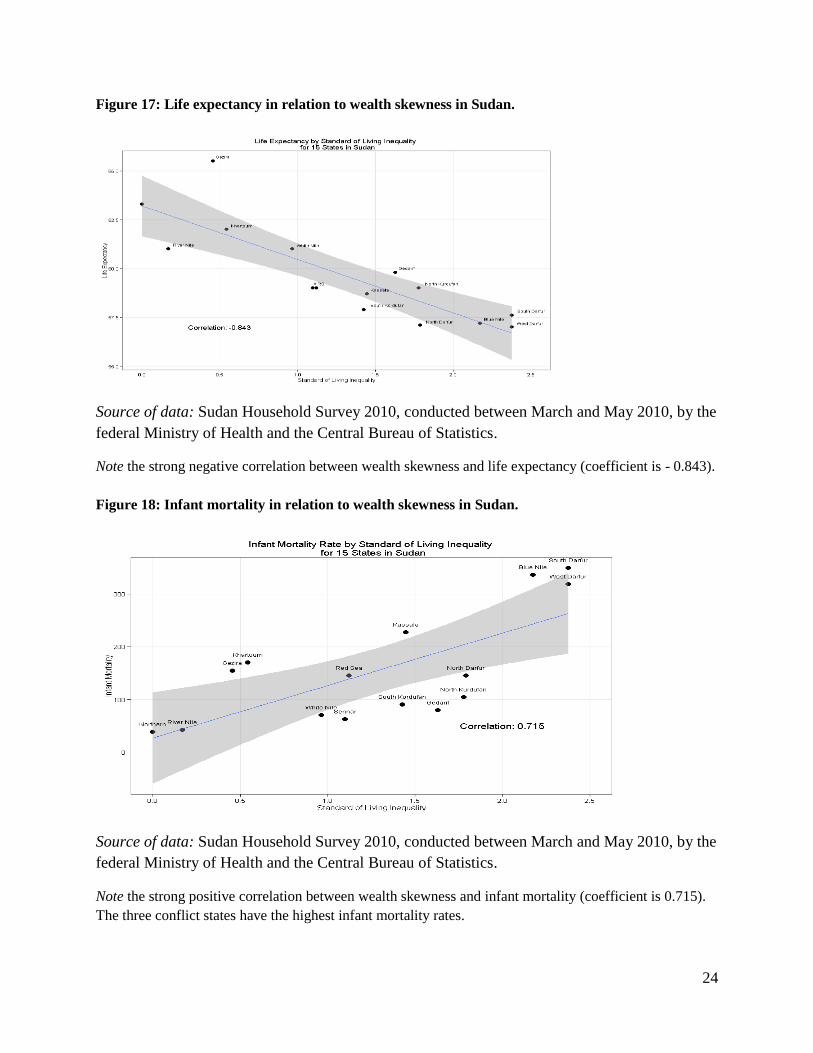
Figure 17: Life expectancy in relation to wealth skewness in Sudan.
Figure 18: Infant mortality in relation to wealth skewness in Sudan.
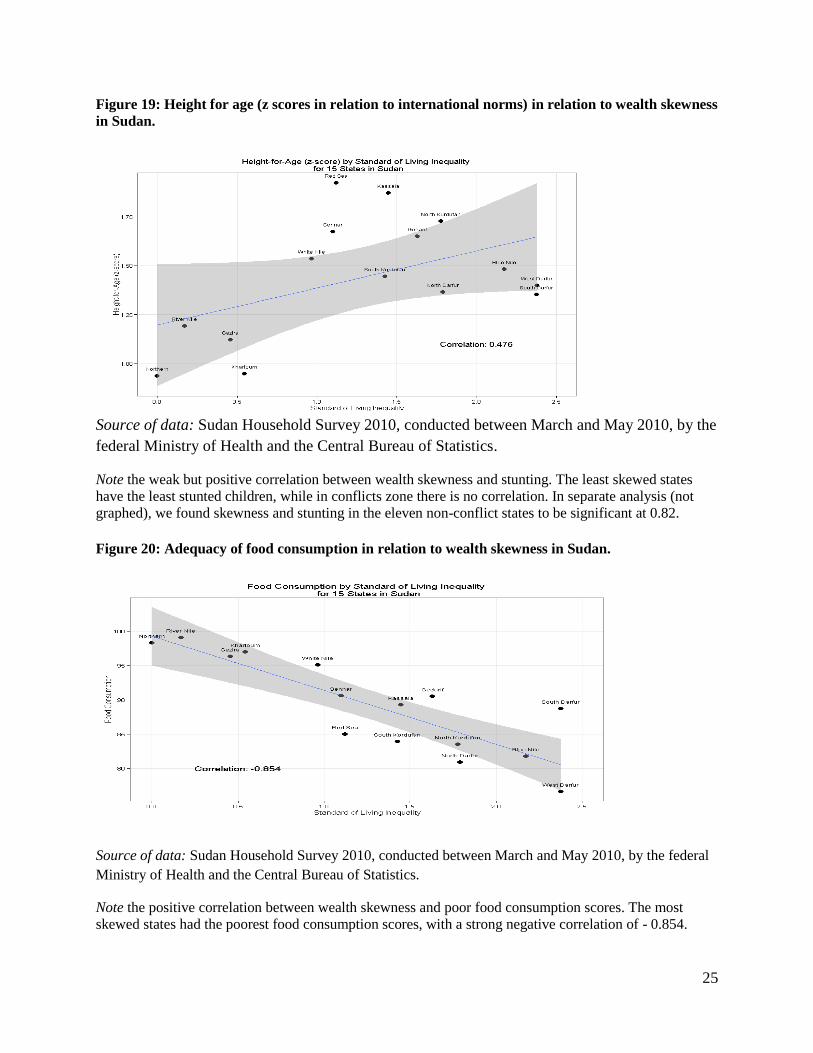
Figure 19: Height for age (z scores in relation to international norms) in
relation to wealth skewness in Sudan
Figure 20: Adequacy of food consumption in relation to wealth skewness in
Sudan.
Figure 21: Teen births in relation to wealth skewness in Sudan.
Figure 22: Vaccination rates in relation to wealth skewness in Sudan.
Figure 23: Map of Sudan, portraying infant mortality in each of the 15 states

v
LIST OF TABLES
Table 1: Sample sizes in each Sudanese state for data collected on children
under age five (Sudan Household Survey 2010), in relation to population
estimates from the 2010 Sudan Census.
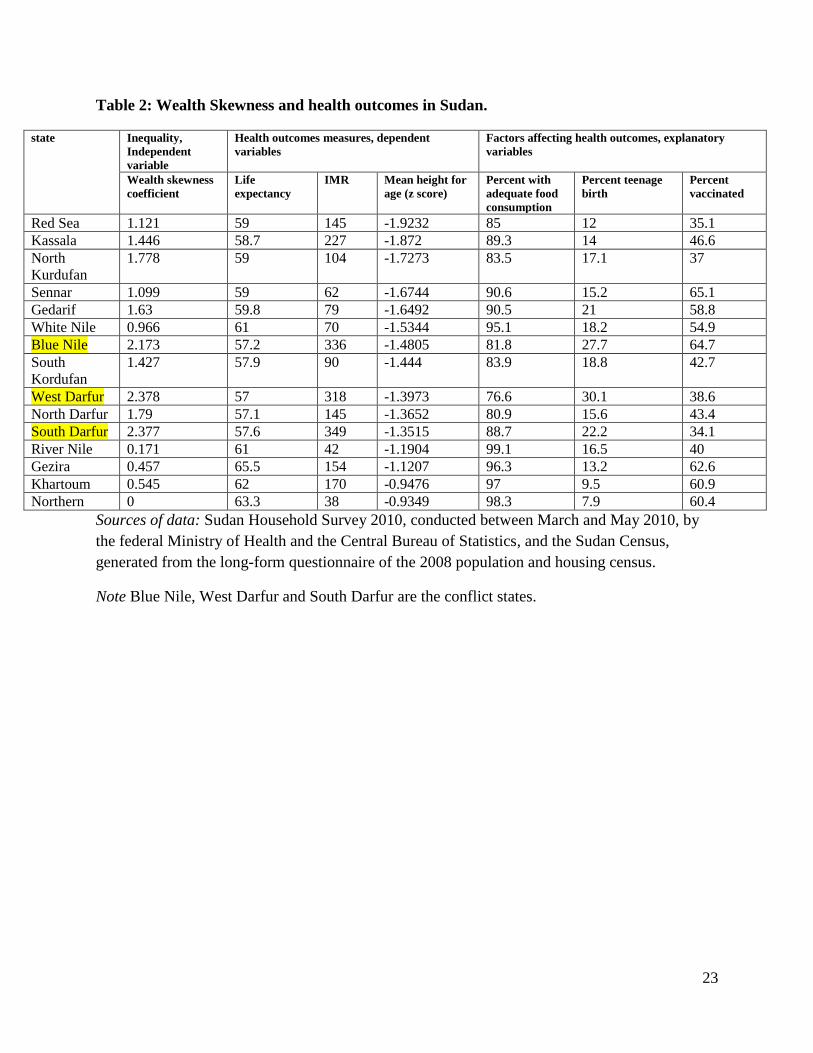
Table 2: Wealth Skewness and health outcomes in Sudan.
vi
ACKNOWLEGMENTS
I would like to express the deepest appreciation to all those who made this thesis possible. I
am extremely grateful to my thesis chair and advisor; Stephen Bezruchka for the
unlimited support, thoughtful ideas, guidance, and help provided throughout the MPH.
Special gratitude to Amy Hagopian, my thesis committee member, for the guidance,
encouragement, help and continuous support.
1 wish to express sincere appreciation to Marsha Brown, Dario Longhi, Zane Kelly for
their support and help in analysis, editing and guidance. A special thanks to Marsha and
Dario for being a second family in the US
Furthermore I would like to acknowledge with much appreciation Dr. Igbal A. Basheer,
Sudan Household Survey Executive Director, and Nahid Ali, Survey committee member,
who provided me and gave the permission to use the survey data.
Thanks to my friends Dr. Eltayeb A Elsayed for his unlimited support, Dr.Hanan Mukhtar
for her unconditional love and support. To Ienas, Sherien, Safa for their supports and
encouragements. To Nusieba, Shaza, Elsheikh , Fatima,Hamid, Mohamed Husein, Elsadiq,
Amira, Halley and Ezzan.
I am grateful to the Department of Global Health, University of Washington, faculty, and
staff, with great thanks to Julie Brunnett and 2011cohort.
Last but not the least, I would like to thank my family for their support , love and
encouragement, my mom Thuria, my brothers Amir, Imad, my sisters Haja,Habab, Lamia
and Esra, my nieces and nephews, my cousin Gamal.
vii
DEDICATION
To the soul of my father Salahelddin Abdlgader Omer who loved me, believed in me and
who taught me the meaning of life.
1
INTRODUCTION
This study hypothesizes a relationship between wealth inequalities and health outcomes
in Sudan as measured by life expectancy, infant mortality, height for age, food
consumption, teenage births and vaccination rates.
Inequality affects the health of millions of people globally, in both developed and
developing countries. Inequality has been linked to physical and mental health problems,
as well as broad social problems such as violence and crime. (1) The relationship
between inequality and health captured researchers’ interest decades ago. Rodgers
studied income inequality as a determinant of health in 1979, concluding countries with
more equal income distribution patterns enjoyed higher overall life expectancy. The
average difference in life expectancy between more equal countries and less equal
countries was as much as five to ten years. (2) Population health metrics, such as
mortality, have been linked to social cohesion, trust and community support. Richard
Wilkinson looked at British health during the two world wars and found British society
was more egalitarian during the war periods. Life expectancy improved dramatically, two
to three times greater than in other decades.(3, 4) Current researchers have built on this
early work. Wilkinson and Pickett published a book in 2009 arguing that gross inequality
undermines national life, kills trust, and generates a higher prevalence of frustration,
depression and crime(1). Persons living in unequal societies or countries are inhibited
from achieving their personal potential, which collectively inhibits their country’s
development and growth. Inequality also passes on health effects from one generation to
the next; new generations can inherit poor health from previous generations who lived
decades ago. Equality is a necessity for better life and better health outcomes. Emanuel et
al. studied the relationship between grand-maternal and maternal factors in relation to
maternal adult stature. Mother’s stature was predicted partially by her own mother’s
stature, and partly by her birth weight. The study concludes, “some birth outcomes are
already established before a prospective mother is conceived or born.”(5)
Some researchers are arguing that even high levels of personal wealth do not protect the
rich living in unequal societies. Biggs, et al, researched the effects of inequality and
poverty on public health in low, middle, and high-income countries. They studied 22
countries in Latin America between 1960 and 2007, finding that while an increase in
national gross domestic product (GDP) had a positive effect on population health, it was
not sufficient to counter the effects of inequality and widespread poverty. With rising
inequality, GDP had only modest effects on life expectancy and infant mortality rates.
However, GDP had a large effect on population health when inequality was reduced. The
authors concluded, “wealthier is indeed healthier, but how much healthier depends on
how the increases in wealth are distributed” (6)
2
Similarly, Pop et al studied income inequality in relation to economic growth.
Researchers studied life expectancy in 140 countries between 1987 and 2008. The study
showed countries with higher levels of income inequality have lower levels of life
expectancy in both low and middle-income countries. In high-income countries, the
relationship was not significant. Authors suggest economic growth has a weaker benefit
for population health in highly developed countries. (7)
The relationship between income and health is harder to study in low and middle-income
countries, where measures of income are more difficult to approximate. Nowatzki studied
the relationship between wealth inequality (rather than income inequality) and population
health in 14 wealthy countries. She was able to use a wealth indicator in place of
measures of monetary income, but still using the traditional “Gini coefficient,” a measure
of statistical dispersion of monetary income developed by the Italian statistician, Corrado
Gini. Nowatzki confirmed wealth inequality was associated with life expectancy and
infant mortality, and argued that relying on income instead of wealth is inadequate for
addressing economic and health circumstances of individual and families in lower-
income countries. (8)
Rasella et al studied income inequality on life expectancy in a highly unequal, but rapidly
changing, developing country, Brazil (2000 to 2009). Authors concluded reducing
income inequality in developing countries should be a first step towards increasing life
expectancy(9). Olson et al. found a relationship between inequality and infant mortality
rate in the US, highlighting the importance of the first 1,000 days of life and their effects
on adult health. (10). In the Philippines, Kraft et al. showed wealth equity-markers were
evident in relation to child mortality, and recent wealth-related inequalities were found to
be strongly associated with many social factors (11). Another study in Ghana showed a
strong association between childhood under-nutrition and inequality (12). “Stunting,” a
lower than expected body height for age, reflects childhood food insecurity and untreated
infection. Elshibly and Schmalisch found a significant association between maternal body
mass and newborn birth weight in Sudan. (13) Childhood growth failure is often used to
measure the effects of health policies and health planning interventions over the long
term.
Sudan, located in northeast Africa and covering 1.9 million square kilometers, borders
seven countries. According to the 2008 census, Sudan’s population was 31 million, with
an equal sex ratio. Nearly two-thirds (63%) of the population live in rural settings, while
7% are nomads. The country is administratively divided into 17 states. Khartoum state,
also the capitol of the country, has the largest population size, while the Northern state
has the smallest. One in four Sudanese residents is under the age of five(14), and the
adult literacy rate (population of 15 years and above) is 62%.(15) Sudan’s diverse
African and Arab cultures have clashed, with huge socio-economic differences between
geographic regions. Much of the population (40%) lives below the poverty line of
3
approximately one dollar per day. The agricultural sector employs 80% of the workforce
and contributes 33% to the GDP. Sudan faced a financial crisis in recent years, when the
inflation rate rose to 16%, accompanied by an unemployment rate of 19%, and a public
debt of 101% of the GDP. (16) In the context of rapid international gains in life
expectancy, Sudan saw only a slight improvement in life expectancy over the last 20
years, reaching 63 years at birth. Sudan ranks 185th globally, 27 years of life expectancy
behind Monaco and a nearly the same as Haiti (16) .
Sudan gained its independence from British colonizers in 1956, but political instability,
generated by two revolutions and a 40-year civil war between the north and the south,
have drained resources and compounded the economic and social effects of ethnic
differences. In the western Darfur region, a conflict has raged since 2003, leading to the
displacement of more than two million people and the killing of an estimated 400,000.
(16) In 2005, North and South Sudan signed a peace agreement, which eventually led to
South Sudan separating from the federal republic in July, 2011. Not long after
independence, conflict commenced again between the two countries over oil rights. (17)
The annual rate of reduction in under-five mortality rate in Sudan for the recent 20-year
period was only 1.7 %, a rate not on track to meet the Millennium Developmental Goals.
Infant mortality in Sudan was reduced from 77 to 57 per 1000 live births in the same
period (18), a number that is still unacceptably high. Sudan lags behind on Millennium
Development Goals, with a prevalence of malnutrition at 32%. (19)
In this study we explore the correlation between wealth inequality and population health,
using data from the nation’s second Sudan Household Survey (SHHS2) conducted in
2010, and Census data from 2008. The health outcomes we measured included life
expectancy, infant mortality, height for age, adequacy of food consumption, teenage birth
and vaccination coverage.
METHODS
We analyze the relationship between wealth inequality and health outcomes in Northern
Sudan, using data from a combination of Sudan’s recently-released cross-sectional
household health survey for most of our health outcomes data, as well as for our
measures of wealth and its distribution. We used census sampling data for mortality data.
Data Sources
Sudan Household Health Survey-2
Data from the SHHS2, essentially equivalent to the internationally-known Demographic
and Health Surveys (DHS), were released in early 2013. Carried out between March and
May 2010, the survey was conducted by the Federal Ministry of Health and the Central
4
Bureau of Statistics (CBS). The effort was supported by Sudan’s Government of National
Unity’s Ministry of Health and the Southern Sudan Commission for Census, Statistics
and Evaluation. Financial and technical support to the SHHS2 were provided by the
United Nations Children’s Fund (UNICEF), the World Health Organization (WHO), U.S.
and Japanese aid agencies, and several other United Nations agencies.
The SHHS2 was intended to generate representative data at the national and state levels
on population and health indicators, with an emphasis on child and maternal health
outcomes. The target population for the survey was children aged 0 to 59 months, women
aged 15 to 49 years and men aged 15 to 49 years (20). A two-stage cluster sampling
design was employed to draw the sample in each state. Using traditional sample size
calculations, it was determined 863 households per state would be representative at the
.05 level. Survey conductors therefore chose a sample of 1,000 households in each state,
structured as 40 clusters from each state, and 25 households in each cluster. Clusters were
selected with probability proportional to the population size, and with urban and rural
stratification. In cases where selected villages or quarters were not accessible for security
or other problems, they were replaced by neighboring ones in the sampling frame. Each
state sample was weighed so that collectively they are representative of the entire
national population (20). A total of 240 interviewers and 60 supervisors were trained to
collect data, and average field time (per state) was 33 days (20). Five questionnaires were
used for each household: 1) household characteristics, 2) individual women (age 15-49),
3) children under five, 4) men (age 15-49) and 5) food security (20).
Of the 15,000 households selected for the sample, 14,921 were occupied, and 14,778
were successfully interviewed (response rate 99%). In those households interviewed,
18,614 women (aged 15-49 years) were identified, and 92% (17,174) were interviewed.
In addition, 13,587 children under age five were found, and data were collected on 98%
of these. Although 16,448 men were identified, only 5,573 men could be interviewed
(34% response rate). Because of the low response rate, and likely resulting bias, data
relating to men are not presented. Rural areas showed higher response rates than urban
areas (20).
Census
The second source of data we used was Sudan’s fifth population and housing census,
generated from the long-form questionnaire of the 2008 population and housing census
covering social, economic, demographic and housing characteristics, household
ownership of durable goods, agricultural lands, livestock, and sources of livelihood of the
household. The Census was conducted by the Ministry of the Cabinet and Central Bureau
of Statistics, and serves the nation by providing population count and economic
development indicators for planning, monitoring and evaluation purposes. (15) The
census was conducted according to the United Nation standards, guaranteeing full
5
coverage and high accuracy. The de facto method was applied for the enumeration of the
population, the “quick count” methodology for mapping purposes, and detailed
questionnaires followed UN principles and recommendations for censuses. Data
collectors were teachers from the enumeration areas where they worked, supplemented
by qualified persons from the same tribes.
Measures of wealth and inequality The SHHS2 surveyed households for indicators of wealth, and analysts subsequently
used factor analysis to construct a consumption-based standard of living measure, also
known as a household assets indicator. Calculating wealth involved three steps: 1)
identify aggregate components of consumption, divided into durable goods and housing
indicators, (2) adjust for cost of living differences, and (3) adjust for household size and
composition (21). Durable goods elements include bicycle, motorcycle, car, animal
drawn cart, boat with motor, sewing machine, refrigerator, TV, radio, clock, fan, animals,
land phone, mobile phone, and farmland. Housing wealth indicators included type of
floor and roof, type of drinking water and sanitation, and type of cooking and lighting
fuel.(20). A similar study in Colombia, classified by the World Bank as another a lower-
middle income country (like Sudan) (http://data.worldbank.org/about/country-
classifications/country-and-lending-groups#MENA), used a similar household assets
indicator as a determinant of socioeconomic inequality for contraceptive use(22).
Measures of health
Life expectancy
Life expectancy was calculated at the state level by the CBS using Census data. It is
simply the average number of years a person can expect live from his or current age,
based on national average life tables.(15)
Infant Mortality Rate (IMR); Source (Census)
Sudan’s infant mortality rate was derived from Census data by the CBS. The probability
of a child dying before its first birthday was calculated by dividing the number of live
births in 2008 by the number of children who died that year.(15) We elected to use
Census data for this calculation, rather than SHHS2 data, believing Census data to be
more complete. (20)
Height for age
A standard international approach to measuring nutritional adequacy is to assess the
proportion of the child population that endures “stunting,” defined by UNICEF as
inadequate height for age (measured as lower than two standard deviations from median
height for age compared to a reference population). Height-for-age reflects chronic
malnutrition, as failure to receive adequate nutrition over time results in recurrent
infections that impair the body’s ability to absorb or assimilate food (21). SHHS2
6
surveyors measured children’s heights in each household and collected their age
information (20)
Food consumption
A household “food consumption score” was available in the SHHS2, calculated by
examining the number of times certain foods were eaten in the seven days preceding the
survey, weighted by approximate nutrient density values. The food categories were fruits
and vegetables (weighted 1), cereals and tubers (weighted as 2); beans, seeds and nuts
(weighted 3); meat and dairy (weighted as 4); and oils, fats and sugar (weighted 0.5). The
food consumption score was calculated by adding all the results of individual calculations
and then multiplying the frequency of consumption by the score of food type. The
number of times any particular item was eaten was capped at 7 per week. Household food
consumption scores ranged up to 112. Households were then categorized as poor,
borderline, or acceptable (below 21, 21 to 35, and more than 35.
Teen births
The SHHS2 data contained a measure of women in each household, aged 15-19, who
reported they gave birth before age 15.
Vaccination
Vaccination data were obtained from the SHHS2, and measured by either the provision of
a vaccine card or the mother’s recall. Children in each household (between age 12 and 23
months) were assessed to determine whether they were fully immunized according to the
national guidelines by their first birthday. The vaccine schedule includes protection from
polio, tuberculosis, diphtheria, tetanus, pertussis, hepatitis B, mumps and measles.
Confounders, effect modifiers and possible biases
The effects of income inequality on health outcomes could be modified by the rural/urban
status of households, as well as the location of the household in a conflict zone. Rural
communities may have more social cohesion, but are also more distant from health
services and opportunities for employment (1) While there are more deaths and injuries
as a result of conflict, conflict regions also capture political interest. This attention can
generate interventions that alter the natural distribution of human behaviors, health
outcomes and resources, especially in relation to nutrition and vaccination.(6) We
analyzed our results both with and without the four conflict states which are North
Darfur, West Darfur, South Darfur and Blue Nile.
Although the survey has a high response rate from households visited, the decision to
avoid sampling households in conflict zones was a source of possible bias. Further, all
cluster studies suffer from sampling errors in populations that are not evenly distributed
according to the characteristics of interest. Population enclaves can readily be missed.
7
(23) Cluster sampling can substantially increase standard errors. (21) Recall bias is
another source of possible error, as not everyone can readily recall meal consumption,
vaccination history, and other life events. Another source of bias stems from the time of
day or day of week the house was visited (because of who was home to report then).
Data analysis The variation in living standards across a population is an indicator of wealth inequality.
The literature on the relationship between inequality and health has more traditionally
used the “Gini coefficient.” The Gini is based the Lorenz curve, which plots the
proportion of the total income of a population against the cumulative earnings of the
bottom x% of the population. A Gini coefficient of zero expresses perfect equality
(everyone has an exactly equal income), and a value of 1 expresses maximal inequality
(where only one person has all the income). The Gini coefficient, which is sensitive to
small shifts in the mean, was of little practical use in ordering the equality of populations
in our study(24). We did not have income data on a linear scale, but rather only a handful
of asset indicators with a narrow range (-1.0 to 3.5) on the SHHS2 wealth index. Instead,
we employed a skewness measure to assess inequality. There is literature supporting the
use of asset measures as a better indicator of inequality, however, so we were convinced
this was a reasonable approach. (24)
A file was created to ensure consistency of variables definitions across states. Summary
descriptive statistics and frequencies were computed. The association between inequality
measures and health outcomes measures were drawn in all states. Means and correlation
statistics were estimated using SPSS 20, Excel and R program for analysis. All health
outcome variables were analyzed at state level. The wealth measure was analyzed at
household and state levels. Each state sample can be considered self-weighted. Sample
weights were calculated for each state-level sample and these were used in the
subsequent analyses of the survey data for national representativeness.(20)
Ethical review:
SHHS2 data collection procedures were approved by Sudan’s national institutional
review board. The University of Washington Human Subjects Institutional Review Board
(IRB) exempts from review those studies based on national level data sets that contain no
identifiable information on the subject participants.
RESULTS
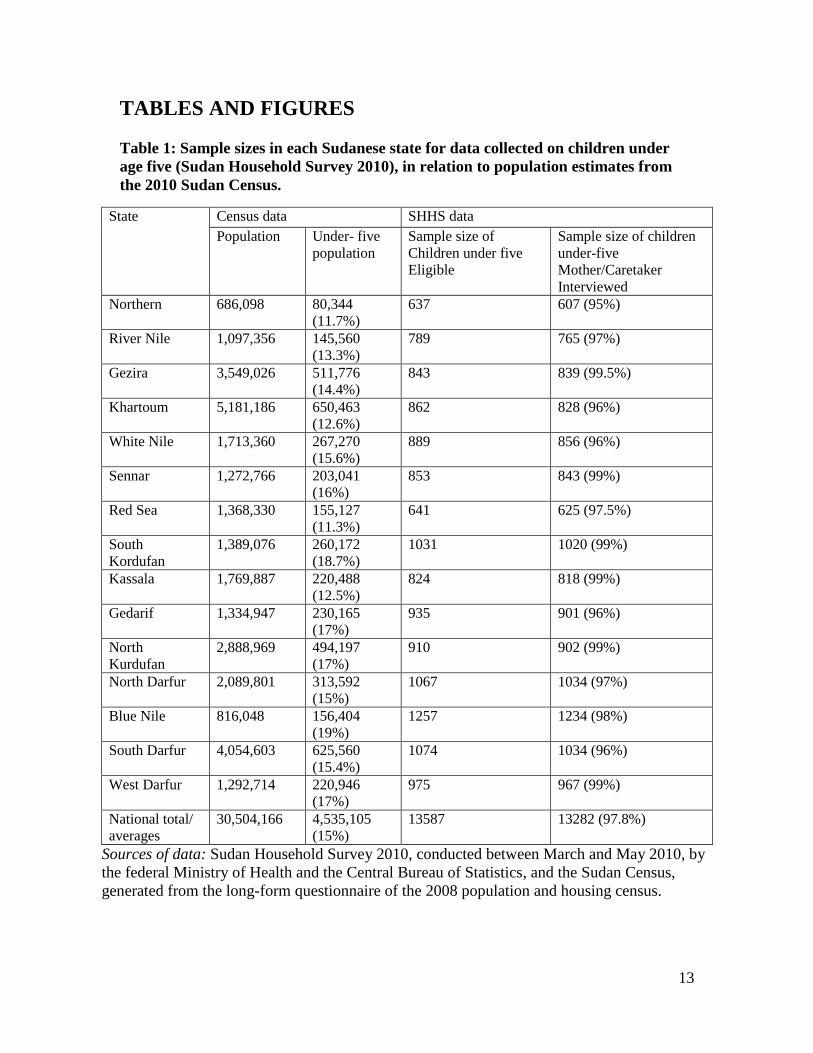
Table (1) shows the populations studied in each of our two data sources, with total
population in the census and total households in the SHHS2 survey. We present data on
children under five separately, as they are the focus of several of our health measures
(infant mortality, stunting, and proportion appropriately vaccinated). The SHHS2 was
8
able to obtain measurements on 13,587 children from 14,778 households in 15 states. The
three states with the largest number of children per household (resulting in 1000 or more
children in the sample for that state) were all in conflict regions.
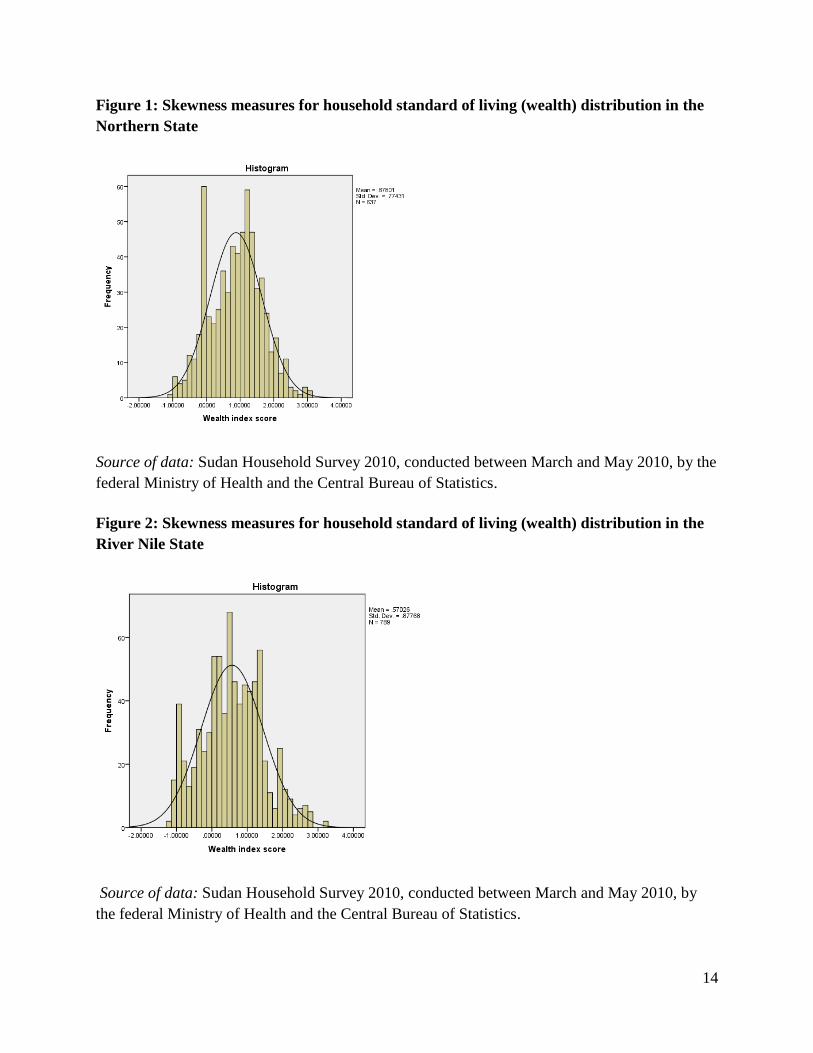
Skewness We calculated the wealth skewness in each state, and portray a histogram of the
distribution of wealth assets for each state in figures 1-15. Where wealth is fairly
symmetrically distributed, with a proportionally equal number of rich and poor, the
histogram will resemble a traditional bell curve, with skewness of zero, or close to it. In
Sudan, Northern State is our least skewed, and therefore the state where wealth is most
symmetrically distributed. The 637 households in Northern state had an average wealth
score of .88, with a standard deviation of .77. The skewness score was 0—that is, the
mean is equal to the median, implying relatively symmetric though uneven distribution of
assets across households. See Figure 1. By contrast, the 975 households in West Darfur
State had an average wealth index score of - 0.66, with a standard deviation of 0.65. The
histogram is skewed to the right, illustrating that most people are poor, while a few are
very rich. The skewness score is 2.4, implying a very asymmetric distribution of wealth
within the state. See Figure 15. Figures 2 through 14 illustrate the wealth distribution
skewness for each of the other 13 states.
Table (2) offers a compilation of all the skewness coefficients for each state, ranging
from 0 in Northern to 2.38 in West Darfur, and an average 1.095 for the nation.
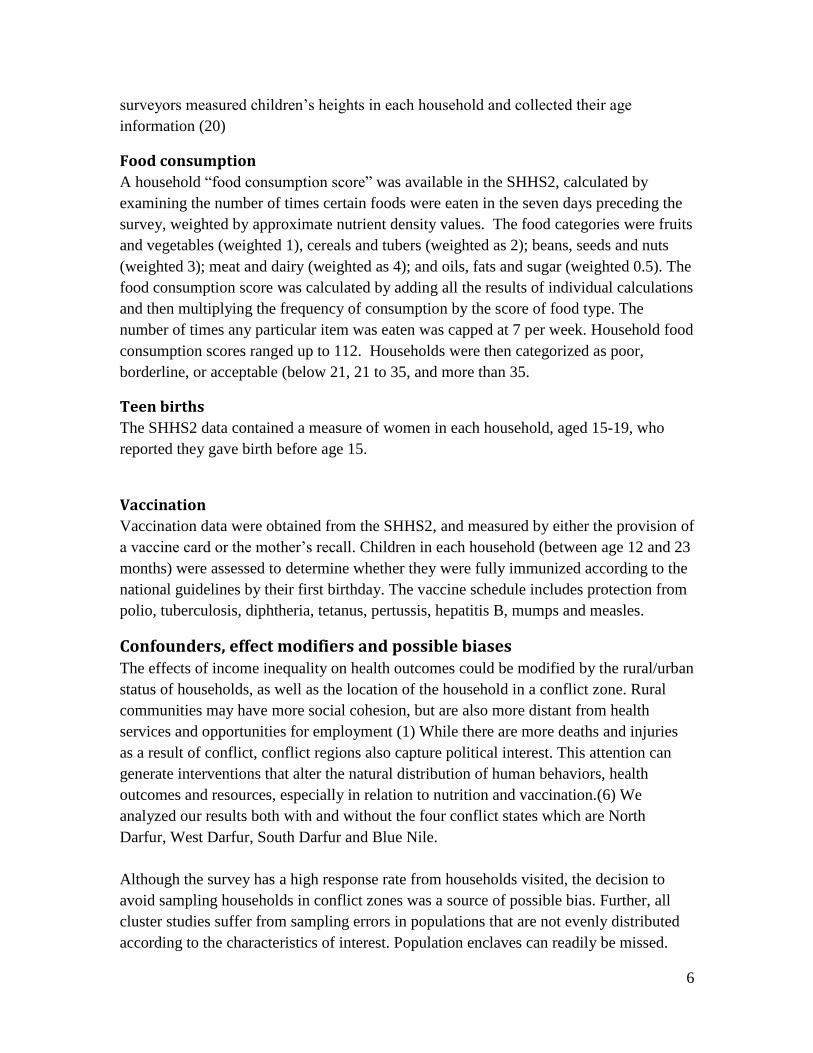
Life expectancy Life expectancy in Sudan is an average 60 years, with a range of 57 in West Darfur to
65.5 years in Gezira State. The four conflict states have the lowest life expectancy in the
country. See Table 2. We found states with skewed wealth distribution were more likely
to have lower life expectancy. Figure 17 illustrates life expectancy plotted on the y-axis
and skewness on the x-axis, with a correlation of -.84. The four conflict states (North
Darfur, South Darfur, Blue Nile, and West Darfur) portray the lowest life expectancy and
most skewed wealth index.
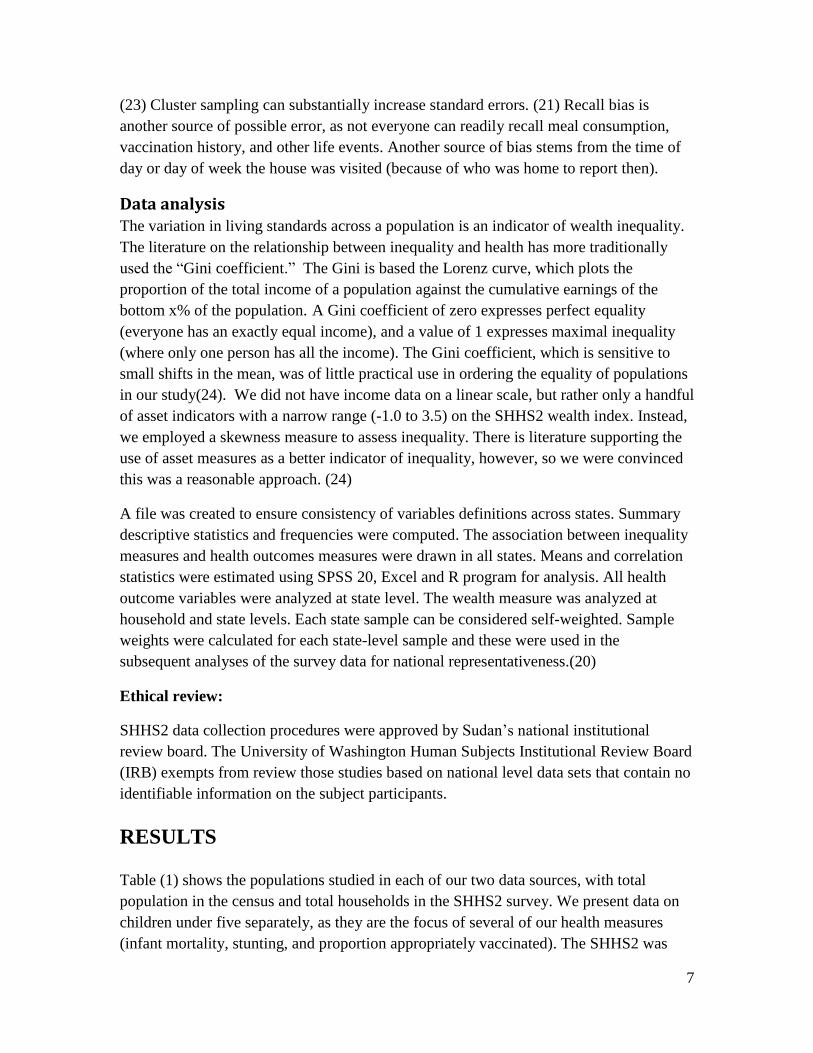
Infant mortality Sudan’s infant mortality rate is an average 79 per 1,000 live births, with a range of 38 per
1,000 live births in Northern State to 349 in South Darfur. There are six states with
double-digit infant mortality rates, and nine states with triple digit figures (the latter
ranging from 104 to 349). See Table 2. States with skewed wealth distribution were more
likely to have higher infant mortality rates, with a correlation coefficient of 0.715. The
three conflict states (South Darfur, Blue Nile, and West Darfur) suffer the highest infant
mortality and the most skewed wealth indices. See Figure 18.
9
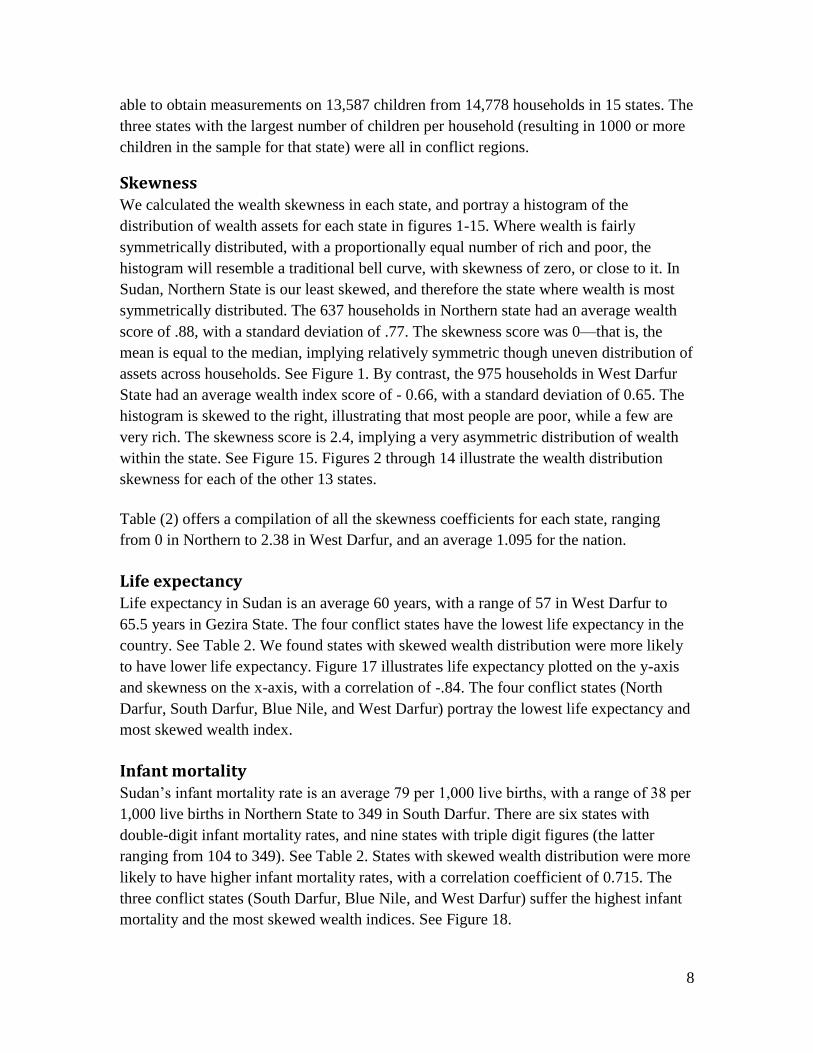
Height for age (stunting) International World Health Organization (WHO) norms for height-for-age z scores are
1.10 to 1.30 (25), but Sudan’s scores in 2010 ranged from -.93 in Northern State to -1.92
in Red Sea, according to the SHHS2. WHO has established that scores between -2 and -3
represent “moderate stunting.” The majority of children under age five in Sudan show
stunted growth (low height for age in comparison to the WHO reference population). The
correlation coefficient for the association between wealth skewness and stunting was only
0.476 (relatively weak). The conflict states had stunting scores in the middle of the
distribution of states, unlike other measures of health where the conflict states performed
relatively poorly. When we removed these states from the analysis, we found a strong
correlation (.82) between stunting and wealth index skewness in the remaining 11 states.
See Table 2 and Figure 19.
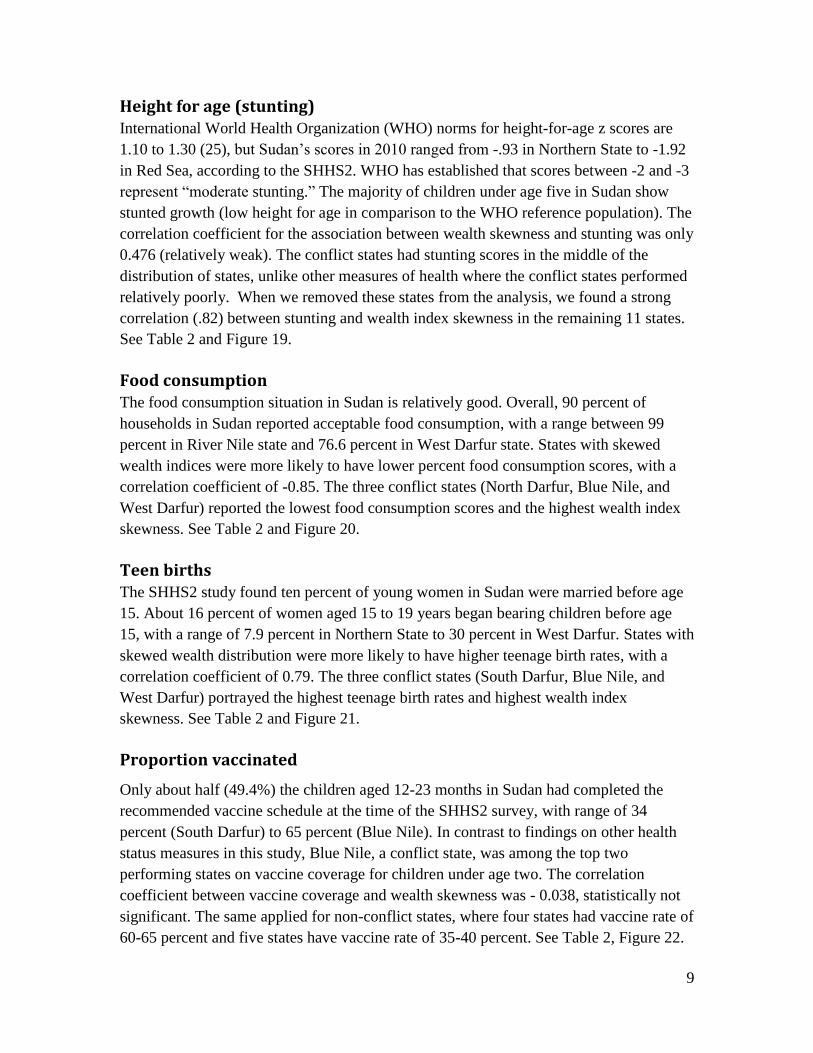
Food consumption The food consumption situation in Sudan is relatively good. Overall, 90 percent of
households in Sudan reported acceptable food consumption, with a range between 99
percent in River Nile state and 76.6 percent in West Darfur state. States with skewed
wealth indices were more likely to have lower percent food consumption scores, with a
correlation coefficient of -0.85. The three conflict states (North Darfur, Blue Nile, and
West Darfur) reported the lowest food consumption scores and the highest wealth index
skewness. See Table 2 and Figure 20.
Teen births The SHHS2 study found ten percent of young women in Sudan were married before age
15. About 16 percent of women aged 15 to 19 years began bearing children before age
15, with a range of 7.9 percent in Northern State to 30 percent in West Darfur. States with
skewed wealth distribution were more likely to have higher teenage birth rates, with a
correlation coefficient of 0.79. The three conflict states (South Darfur, Blue Nile, and
West Darfur) portrayed the highest teenage birth rates and highest wealth index
skewness. See Table 2 and Figure 21.
Proportion vaccinated
Only about half (49.4%) the children aged 12-23 months in Sudan had completed the
recommended vaccine schedule at the time of the SHHS2 survey, with range of 34
percent (South Darfur) to 65 percent (Blue Nile). In contrast to findings on other health
status measures in this study, Blue Nile, a conflict state, was among the top two
performing states on vaccine coverage for children under age two. The correlation
coefficient between vaccine coverage and wealth skewness was - 0.038, statistically not
significant. The same applied for non-conflict states, where four states had vaccine rate of
60-65 percent and five states have vaccine rate of 35-40 percent. See Table 2, Figure 22.
10
DISCUSSION
For four of our six measures of health in Sudan (food consumption, life expectancy, teen
births and infant mortality), outcomes were significantly worse in the states with more
skewness of wealth distribution, with correlation coefficients above .70 in all cases. For
the two remaining health indicators, (height-for-age z scores or stunting, and vaccination
coverage), we found weaker correlations with wealth skewness until we removed the
conflict-affected states from the analysis. After removing those three states, the
correlation coefficients on the stunting was significantly high again at .82 however there
was no big difference for vaccination.
Previous authors (Nowatzki and Rodgers) have reported life expectancy and infant
mortality to be associated with inequality. (8)(2) In relation to food consumption and
stunting, a study based on the Nigeria 2003 Demographic and Health Survey found
considerable pro-rich inequalities in the distribution of stunting, as well as malnutrition
associated with socioeconomic inequality generally.(26) Similar findings come from
other sub-Saharan countries, (27)(28)(29, 30) Vietnam (31) and China (32). Sudan’s
Ministry of Health and UN agencies, mainly UNICEF, have focused vaccine and food
supplementation interventions on conflict regions, leading to improvements in height for
age in children aged 18 to 24 months. This could explain the weaker correlation we found
between stunting and wealth skewness overall. After removing conflict states from the
analysis, though, stunting was again highly correlated with skewness of wealth. This is
consistent with findings from the Biggs paper (6).
Other researchers have also found income inequality to be associated with higher birth
rates among teens, as we did for wealth skewness. A possible explanation is that greater
income inequality undermines social capital (social cohesion, civic engagement, and
mutual trust in a community). In a U.S. study, teen birth rates were affected by both
poverty and income inequality, though income inequality appeared to affect teen birth
rate primarily through its affect on social capital (33).
The relationship between vaccine coverage and income inequality from other studies is
more nuanced. A 2012 study from Japan demonstrated that while higher income
inequality was associated with lower measles vaccine coverage rates in more rural areas,
larger municipalities could overcome this problem with social capital development (34).
In relation to vaccination during conflict, Parameswaran and Wijesinghe found no
differences in vaccination coverage in the war-affected Kilinochchi district of Sri Lanka.
(35)
We conclude from our findings, supported by research from others who have published in
this area, that an unequal distribution of wealth, as approximated by skewness in this
study, is associated with worse health outcomes. Our countervailing finding that vaccine
11
coverage in conflict-afflicted states is not predicted by skewness of wealth distribution is
consistent with observations that vaccine campaigns are typically conducted in war zones
by various authorities as a public health measure. (36) (37) A measles campaign in camps
for internally displaced persons and neighboring communities in Darfur aimed to
vaccinate all children aged 9 months-15 years, and resulted in a reduction in reported
measles cases.(38) Conflict areas are the focus of more political interest and health
interventions, which may mask some of the effects of inequality. Another confounder
could be that higher infant mortality rates in the three conflict states led to the deaths of
unvaccinated children, thus artificially elevating the vaccination rate because it was
inflated by survivors. Sample bias may also be a problem, because serious security issues
forced SHHS2 to replace clusters in war zones with those in safer areas to protect the
surveyors.
It’s possible that the mechanism by which income inequality undermines health is
through the erosion of social capital, since both teen births and vaccine coverage seem to
have demonstrated this association. The fact that the conflict states in Sudan have the
most wealth skewness supports this hypothesis. On the other hand, the conflict states also
share the characteristics of poor infrastructure and rugged geography with few roads.
Certain conflict state sites could be inaccessible for months during the rainy season. By
comparison, the most equal states are closer to the capital, with good infrastructure, as
well as more job and education opportunities. The chicken and egg are difficult to
differentiate here, as the more equal states have no history of conflict. Is it the inequality
that leads to conflict, or the conflict that leads to inequality?
Racism in Sudan is a significant problem that can also explain some portion of inequality.
Northern region people are known to discriminate against those from western Sudan in
term of color and tribal affiliation, also reflected in marriage choices (39). All these
issues relate to social capital, as well. The effect of conflict on health, regardless of
income inequality, is incontrovertible, however. It’s been reported that half a million
people may have died in the Darfur conflict, and 2 million people displaced.(6, 16)
Our study has limitations. Household wealth was estimated by the SHHS2 tallies of
cumulative quantity and quality of household assets. While this is an indicator of living
standards, it doesn’t produce results comparable to those obtained from direct measures
of income. Further, cross-sectional data allow calculations of association, but do not
provide evidence for causal inferences because of the lack of temporal sequence, among
other reasons. Vaccine measures and other variables based on respondent recall are
subject to bias. The SHHS2 avoidance of surveying in high-conflict zones certainly
undermines the measures of association with the affects of conflict.
12
We conclude skewed wealth distribution to be associated with poorer population health in
Sudan on four measures: food consumption, life expectancy, teen births and infant
mortality, where better outcomes favored the less skewed states. For vaccination and
stunting, conflict-zone interventions organized by public health organizations may have
masked the effects of inequality. The harms to social capital created by or through both
inequality and conflict may be the causes of the causes of poor health. Public health
officials may want to consider interventions to prevent both war and economic inequality
as equally important to vaccination and food supplementation.
Living in an equal society could be the best medicine for a healthier and better life.
13
TABLES AND FIGURES
Table 1: Sample sizes in each Sudanese state for data collected on children under
age five (Sudan Household Survey 2010), in relation to population estimates from
the 2010 Sudan Census.
State Census data SHHS data
Population Under- five
population
Sample size of
Children under five
Eligible
Sample size of children
under-five
Mother/Caretaker
Interviewed
Northern 686,098 80,344
(11.7%)
637 607 (95%)
River Nile 1,097,356 145,560
(13.3%)
789 765 (97%)
Gezira 3,549,026 511,776
(14.4%)
843 839 (99.5%)
Khartoum 5,181,186 650,463
(12.6%)
862 828 (96%)
White Nile 1,713,360 267,270
(15.6%)
889 856 (96%)
Sennar 1,272,766 203,041
(16%)
853 843 (99%)
Red Sea 1,368,330 155,127
(11.3%)
641 625 (97.5%)
South
Kordufan
1,389,076 260,172
(18.7%)
1031 1020 (99%)
Kassala 1,769,887 220,488
(12.5%)
824 818 (99%)
Gedarif 1,334,947 230,165
(17%)
935 901 (96%)
North
Kurdufan
2,888,969 494,197
(17%)
910 902 (99%)
North Darfur 2,089,801 313,592
(15%)
1067 1034 (97%)
Blue Nile 816,048 156,404
(19%)
1257 1234 (98%)
South Darfur 4,054,603 625,560
(15.4%)
1074 1034 (96%)
West Darfur 1,292,714 220,946
(17%)
975 967 (99%)
National total/
averages
30,504,166 4,535,105
(15%)
13587 13282 (97.8%)
Sources of data: Sudan Household Survey 2010, conducted between March and May 2010, by
the federal Ministry of Health and the Central Bureau of Statistics, and the Sudan Census,
generated from the long-form questionnaire of the 2008 population and housing census.
14
Figure 1: Skewness measures for household standard of living (wealth) distribution in the
Northern State
Source of data: Sudan Household Survey 2010, conducted between March and May 2010, by the
federal Ministry of Health and the Central Bureau of Statistics.
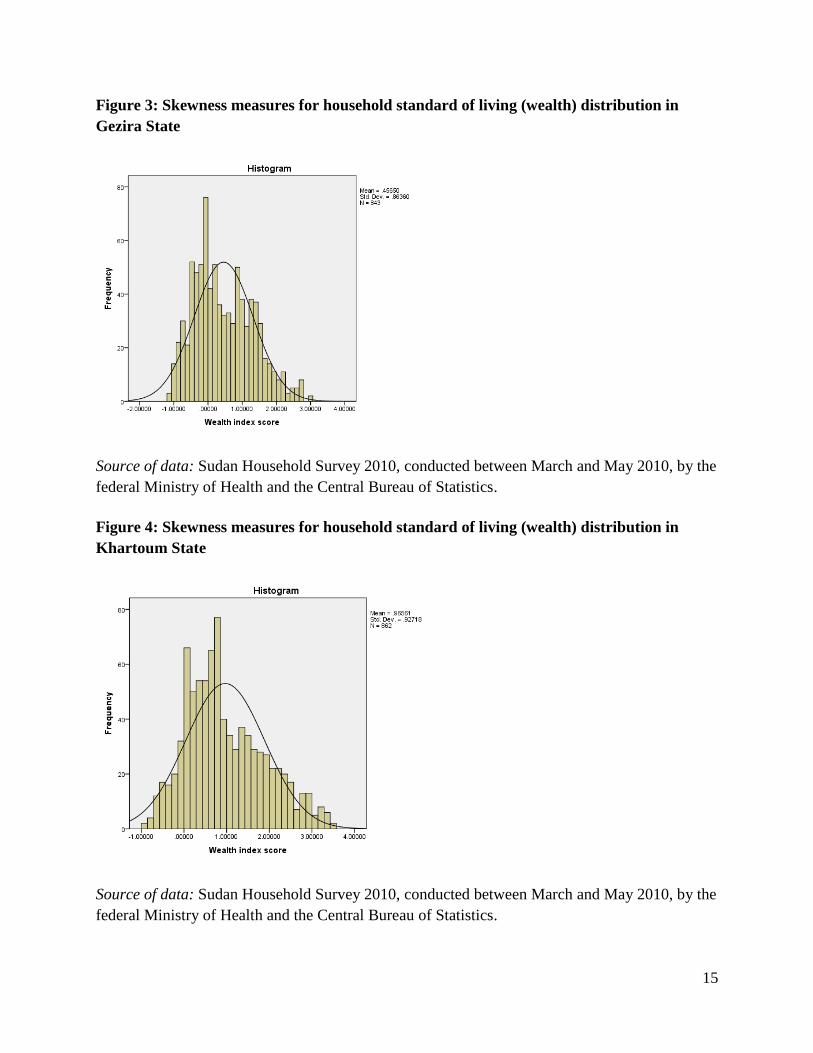
Figure 2: Skewness measures for household standard of living (wealth) distribution in the
River Nile State
Source of data: Sudan Household Survey 2010, conducted between March and May 2010, by
the federal Ministry of Health and the Central Bureau of Statistics.
15
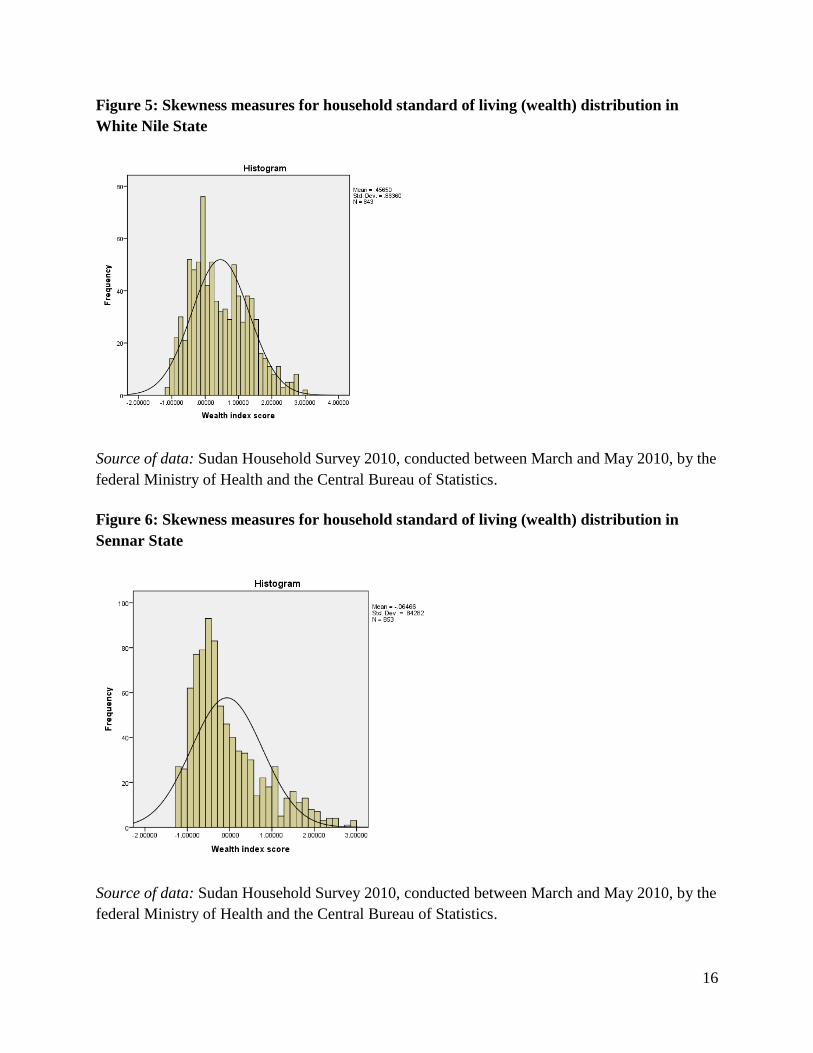
Figure 3: Skewness measures for household standard of living (wealth) distribution in
Gezira State
Source of data: Sudan Household Survey 2010, conducted between March and May 2010, by the
federal Ministry of Health and the Central Bureau of Statistics.
Figure 4: Skewness measures for household standard of living (wealth) distribution in
Khartoum State
Source of data: Sudan Household Survey 2010, conducted between March and May 2010, by the
federal Ministry of Health and the Central Bureau of Statistics.
16
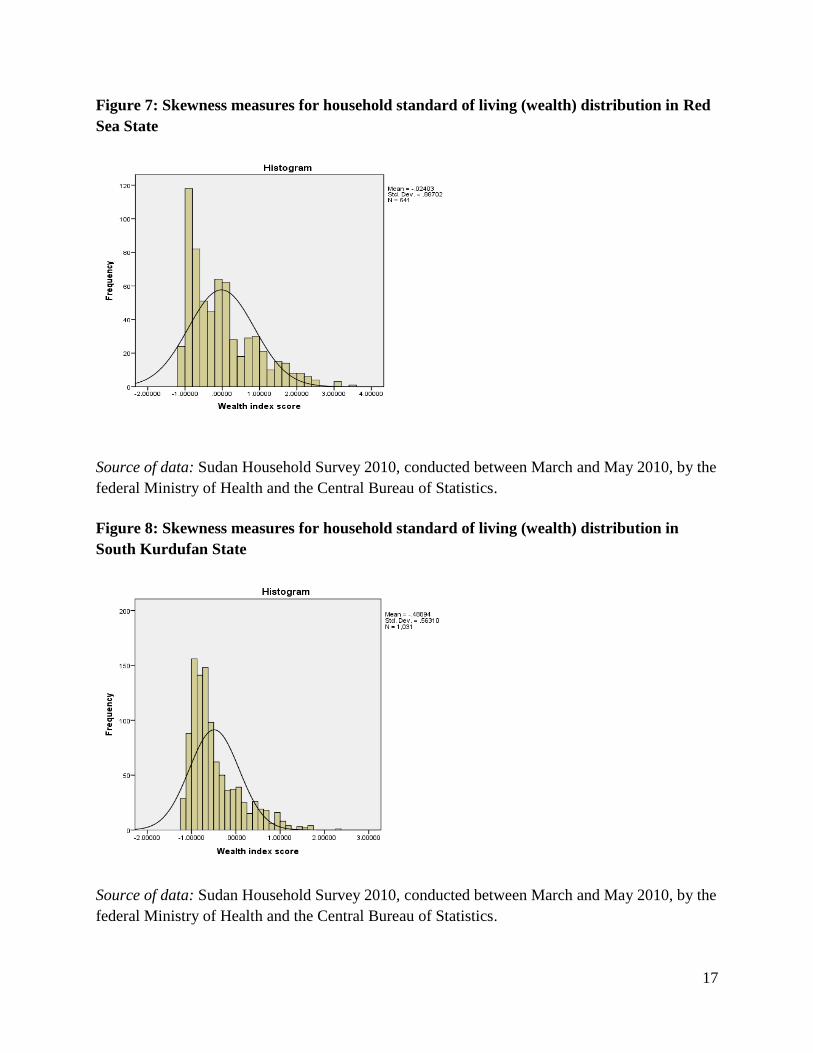
Figure 5: Skewness measures for household standard of living (wealth) distribution in
White Nile State
Source of data: Sudan Household Survey 2010, conducted between March and May 2010, by the
federal Ministry of Health and the Central Bureau of Statistics.
Figure 6: Skewness measures for household standard of living (wealth) distribution in
Sennar State
Source of data: Sudan Household Survey 2010, conducted between March and May 2010, by the
federal Ministry of Health and the Central Bureau of Statistics.
17
Figure 7: Skewness measures for household standard of living (wealth) distribution in Red
Sea State
Source of data: Sudan Household Survey 2010, conducted between March and May 2010, by the
federal Ministry of Health and the Central Bureau of Statistics.
Figure 8: Skewness measures for household standard of living (wealth) distribution in
South Kurdufan State
Source of data: Sudan Household Survey 2010, conducted between March and May 2010, by the
federal Ministry of Health and the Central Bureau of Statistics.
18
Figure 9: Skewness measures for household standard of living (wealth) distribution in
Kassala State
Source of data: Sudan Household Survey 2010, conducted between March and May 2010, by the
federal Ministry of Health and the Central Bureau of Statistics.
Figure 10: Skewness measures for household standard of living (wealth) distribution in
Gedarif State
Source of data: Sudan Household Survey 2010, conducted between March and May 2010, by the
federal Ministry of Health and the Central Bureau of Statistics.
19
Figure 11: Skewness measures for household standard of living (wealth) distribution in
North Kurdufan State
Source of data: Sudan Household Survey 2010, conducted between March and May 2010, by the
federal Ministry of Health and the Central Bureau of Statistics.
Figure 12: Skewness measures for household standard of living (wealth) distribution in
North Darfur State
Source of data: Sudan Household Survey 2010, conducted between March and May 2010, by the
federal Ministry of Health and the Central Bureau of Statistics.
20
Figure 13: Skewness measures for household standard of living (wealth) distribution in
Blue Nile State
Source of data: Sudan Household Survey 2010, conducted between March and May 2010, by the
federal Ministry of Health and the Central Bureau of Statistics.
Figure 14: Skewness measures for household standard of living (wealth) distribution in
South Darfur State
Source of data: Sudan Household Survey 2010, conducted between March and May 2010, by the
federal Ministry of Health and the Central Bureau of Statistics.
21
Figure 15: Skewness measures for household standard of living (wealth) distribution in
South Darfur State
Source of data: Sudan Household Survey 2010, conducted between March and May 2010, by the
federal Ministry of Health and the Central Bureau of Statistics.
22
Figure 16: Map of Sudan, portraying standard of living skewness in each of the 15 states.
Sources of data: SHHS2 data portrayed on map obtained from DIVA GIS 2012, ESRI 2012,
Sudan Household Survey 2010.
Note darker shaded states are the most skewed by wealth distribution. Blue Nile, West Darfur
and South Darfur are the conflict states.
23
Table 2: Wealth Skewness and health outcomes in Sudan.
state Inequality,
Independent
variable
Health outcomes measures, dependent
variables
Factors affecting health outcomes, explanatory
variables
Wealth skewness
coefficient
Life
expectancy
IMR Mean height for
age (z score)
Percent with
adequate food
consumption
Percent teenage
birth
Percent
vaccinated
Red Sea 1.121 59 145 -1.9232 85 12 35.1
Kassala 1.446 58.7 227 -1.872 89.3 14 46.6
North
Kurdufan
1.778 59 104 -1.7273 83.5 17.1 37
Sennar 1.099 59 62 -1.6744 90.6 15.2 65.1
Gedarif 1.63 59.8 79 -1.6492 90.5 21 58.8
White Nile 0.966 61 70 -1.5344 95.1 18.2 54.9
Blue Nile 2.173 57.2 336 -1.4805 81.8 27.7 64.7
South
Kordufan
1.427 57.9 90 -1.444 83.9 18.8 42.7
West Darfur 2.378 57 318 -1.3973 76.6 30.1 38.6
North Darfur 1.79 57.1 145 -1.3652 80.9 15.6 43.4
South Darfur 2.377 57.6 349 -1.3515 88.7 22.2 34.1
River Nile 0.171 61 42 -1.1904 99.1 16.5 40
Gezira 0.457 65.5 154 -1.1207 96.3 13.2 62.6
Khartoum 0.545 62 170 -0.9476 97 9.5 60.9
Northern 0 63.3 38 -0.9349 98.3 7.9 60.4
Sources of data: Sudan Household Survey 2010, conducted between March and May 2010, by
the federal Ministry of Health and the Central Bureau of Statistics, and the Sudan Census,
generated from the long-form questionnaire of the 2008 population and housing census.
Note Blue Nile, West Darfur and South Darfur are the conflict states.
24
Figure 17: Life expectancy in relation to wealth skewness in Sudan.
Source of data: Sudan Household Survey 2010, conducted between March and May 2010, by the
federal Ministry of Health and the Central Bureau of Statistics.
Note the strong negative correlation between wealth skewness and life expectancy (coefficient is - 0.843).
Figure 18: Infant mortality in relation to wealth skewness in Sudan.
Source of data: Sudan Household Survey 2010, conducted between March and May 2010, by the
federal Ministry of Health and the Central Bureau of Statistics.
Note the strong positive correlation between wealth skewness and infant mortality (coefficient is 0.715).
The three conflict states have the highest infant mortality rates.
25
Figure 19: Height for age (z scores in relation to international norms) in relation to wealth skewness
in Sudan.
Source of data: Sudan Household Survey 2010, conducted between March and May 2010, by the
federal Ministry of Health and the Central Bureau of Statistics.
Note the weak but positive correlation between wealth skewness and stunting. The least skewed states
have the least stunted children, while in conflicts zone there is no correlation. In separate analysis (not
graphed), we found skewness and stunting in the eleven non-conflict states to be significant at 0.82.
Figure 20: Adequacy of food consumption in relation to wealth skewness in Sudan.
Source of data: Sudan Household Survey 2010, conducted between March and May 2010, by the federal
Ministry of Health and the Central Bureau of Statistics.
Note the positive correlation between wealth skewness and poor food consumption scores. The most
skewed states had the poorest food consumption scores, with a strong negative correlation of - 0.854.
26
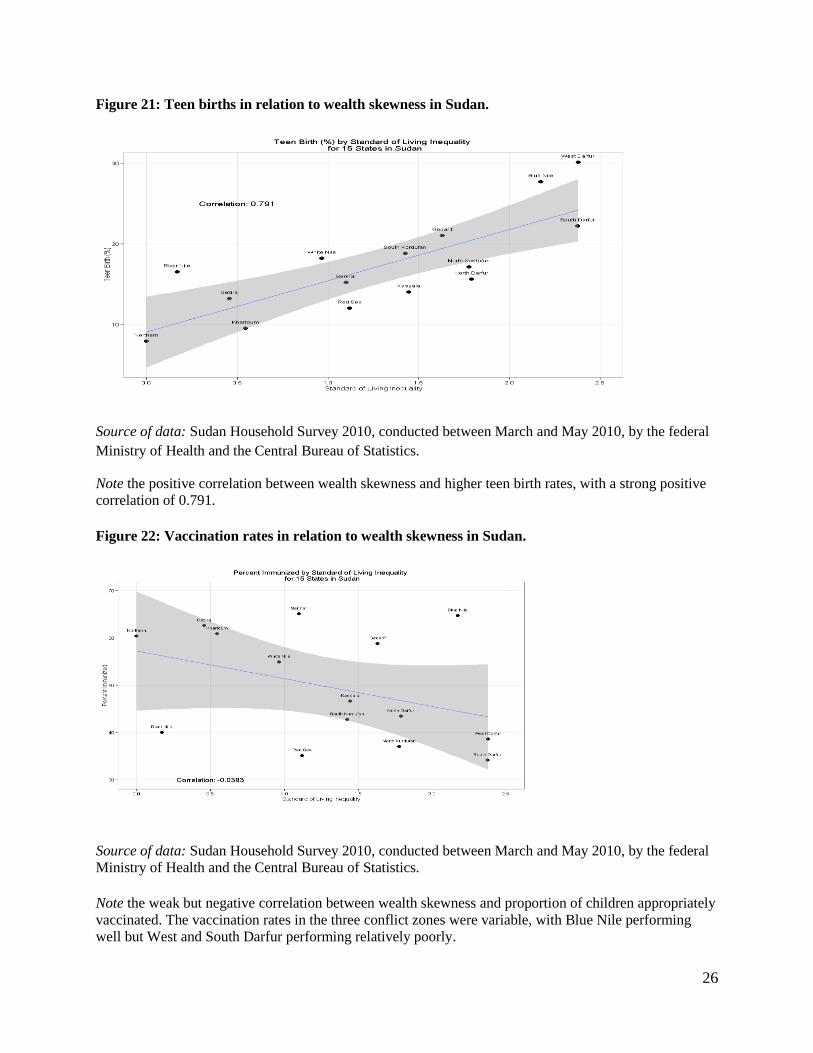
Figure 21: Teen births in relation to wealth skewness in Sudan.
Source of data: Sudan Household Survey 2010, conducted between March and May 2010, by the federal
Ministry of Health and the Central Bureau of Statistics.
Note the positive correlation between wealth skewness and higher teen birth rates, with a strong positive
correlation of 0.791.
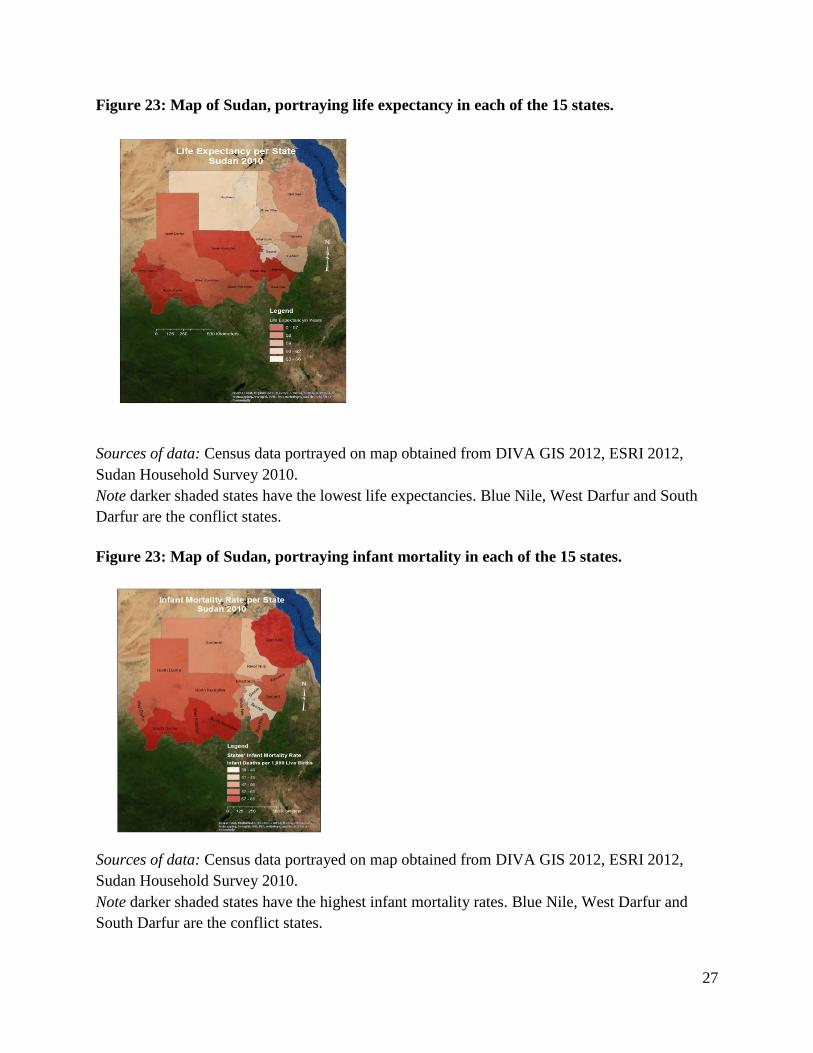
Figure 22: Vaccination rates in relation to wealth skewness in Sudan.
Source of data: Sudan Household Survey 2010, conducted between March and May 2010, by the federal
Ministry of Health and the Central Bureau of Statistics.
Note the weak but negative correlation between wealth skewness and proportion of children appropriately
vaccinated. The vaccination rates in the three conflict zones were variable, with Blue Nile performing
well but West and South Darfur performing relatively poorly.
27
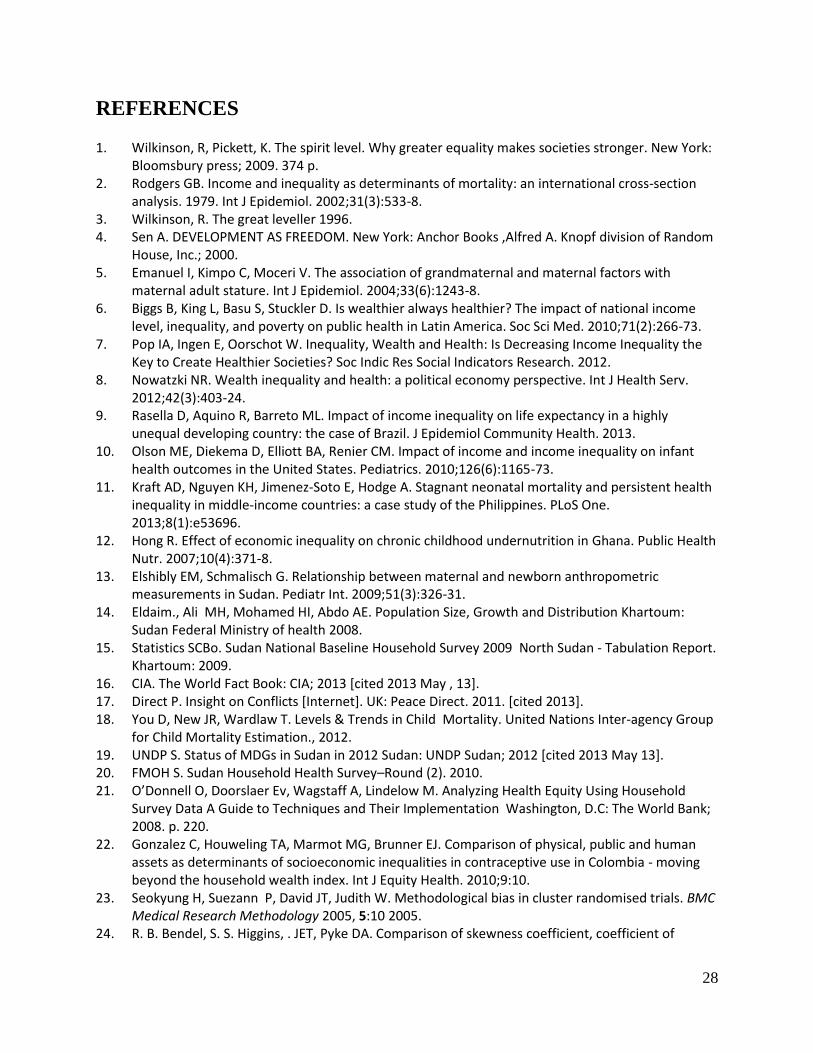
Figure 23: Map of Sudan, portraying life expectancy in each of the 15 states.
Sources of data: Census data portrayed on map obtained from DIVA GIS 2012, ESRI 2012,
Sudan Household Survey 2010.
Note darker shaded states have the lowest life expectancies. Blue Nile, West Darfur and South
Darfur are the conflict states.
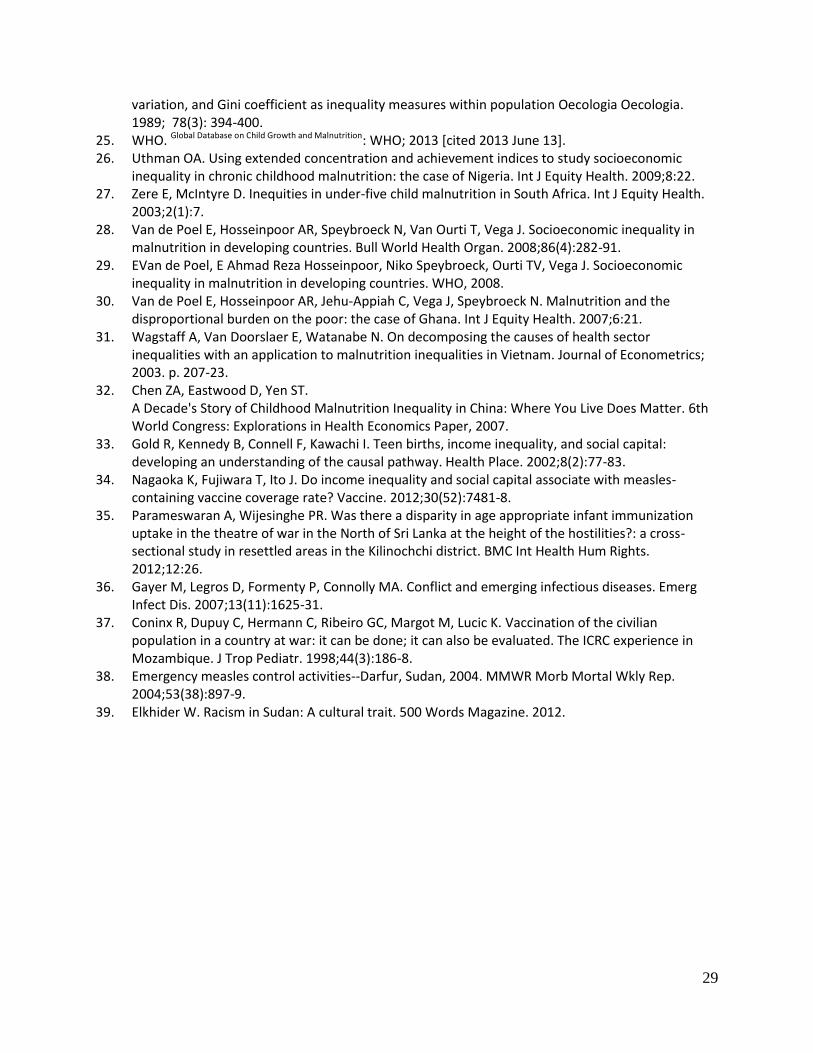
Figure 23: Map of Sudan, portraying infant mortality in each of the 15 states.
Sources of data: Census data portrayed on map obtained from DIVA GIS 2012, ESRI 2012,
Sudan Household Survey 2010.
Note darker shaded states have the highest infant mortality rates. Blue Nile, West Darfur and
South Darfur are the conflict states.
28
REFERENCES
1. Wilkinson, R, Pickett, K. The spirit level. Why greater equality makes societies stronger. New York: Bloomsbury press; 2009. 374 p.
2. Rodgers GB. Income and inequality as determinants of mortality: an international cross-section analysis. 1979. Int J Epidemiol. 2002;31(3):533-8.
3. Wilkinson, R. The great leveller 1996. 4. Sen A. DEVELOPMENT AS FREEDOM. New York: Anchor Books ,Alfred A. Knopf division of Random
House, Inc.; 2000. 5. Emanuel I, Kimpo C, Moceri V. The association of grandmaternal and maternal factors with
maternal adult stature. Int J Epidemiol. 2004;33(6):1243-8. 6. Biggs B, King L, Basu S, Stuckler D. Is wealthier always healthier? The impact of national income
level, inequality, and poverty on public health in Latin America. Soc Sci Med. 2010;71(2):266-73. 7. Pop IA, Ingen E, Oorschot W. Inequality, Wealth and Health: Is Decreasing Income Inequality the
Key to Create Healthier Societies? Soc Indic Res Social Indicators Research. 2012. 8. Nowatzki NR. Wealth inequality and health: a political economy perspective. Int J Health Serv.
2012;42(3):403-24. 9. Rasella D, Aquino R, Barreto ML. Impact of income inequality on life expectancy in a highly
unequal developing country: the case of Brazil. J Epidemiol Community Health. 2013. 10. Olson ME, Diekema D, Elliott BA, Renier CM. Impact of income and income inequality on infant
health outcomes in the United States. Pediatrics. 2010;126(6):1165-73. 11. Kraft AD, Nguyen KH, Jimenez-Soto E, Hodge A. Stagnant neonatal mortality and persistent health
inequality in middle-income countries: a case study of the Philippines. PLoS One. 2013;8(1):e53696.
12. Hong R. Effect of economic inequality on chronic childhood undernutrition in Ghana. Public Health Nutr. 2007;10(4):371-8.
13. Elshibly EM, Schmalisch G. Relationship between maternal and newborn anthropometric measurements in Sudan. Pediatr Int. 2009;51(3):326-31.
14. Eldaim., Ali MH, Mohamed HI, Abdo AE. Population Size, Growth and Distribution Khartoum: Sudan Federal Ministry of health 2008.
15. Statistics SCBo. Sudan National Baseline Household Survey 2009 North Sudan - Tabulation Report. Khartoum: 2009.
16. CIA. The World Fact Book: CIA; 2013 [cited 2013 May , 13]. 17. Direct P. Insight on Conflicts [Internet]. UK: Peace Direct. 2011. [cited 2013]. 18. You D, New JR, Wardlaw T. Levels & Trends in Child Mortality. United Nations Inter-agency Group
for Child Mortality Estimation., 2012. 19. UNDP S. Status of MDGs in Sudan in 2012 Sudan: UNDP Sudan; 2012 [cited 2013 May 13]. 20. FMOH S. Sudan Household Health Survey–Round (2). 2010. 21. O’Donnell O, Doorslaer Ev, Wagstaff A, Lindelow M. Analyzing Health Equity Using Household
Survey Data A Guide to Techniques and Their Implementation Washington, D.C: The World Bank; 2008. p. 220.
22. Gonzalez C, Houweling TA, Marmot MG, Brunner EJ. Comparison of physical, public and human assets as determinants of socioeconomic inequalities in contraceptive use in Colombia - moving beyond the household wealth index. Int J Equity Health. 2010;9:10.
23. Seokyung H, Suezann P, David JT, Judith W. Methodological bias in cluster randomised trials. BMC Medical Research Methodology 2005, 5:10 2005.
24. R. B. Bendel, S. S. Higgins, . JET, Pyke DA. Comparison of skewness coefficient, coefficient of
29
variation, and Gini coefficient as inequality measures within population Oecologia Oecologia. 1989; 78(3): 394-400.
25. WHO. Global Database on Child Growth and Malnutrition: WHO; 2013 [cited 2013 June 13]. 26. Uthman OA. Using extended concentration and achievement indices to study socioeconomic
inequality in chronic childhood malnutrition: the case of Nigeria. Int J Equity Health. 2009;8:22. 27. Zere E, McIntyre D. Inequities in under-five child malnutrition in South Africa. Int J Equity Health.
2003;2(1):7. 28. Van de Poel E, Hosseinpoor AR, Speybroeck N, Van Ourti T, Vega J. Socioeconomic inequality in
malnutrition in developing countries. Bull World Health Organ. 2008;86(4):282-91. 29. EVan de Poel, E Ahmad Reza Hosseinpoor, Niko Speybroeck, Ourti TV, Vega J. Socioeconomic
inequality in malnutrition in developing countries. WHO, 2008. 30. Van de Poel E, Hosseinpoor AR, Jehu-Appiah C, Vega J, Speybroeck N. Malnutrition and the
disproportional burden on the poor: the case of Ghana. Int J Equity Health. 2007;6:21. 31. Wagstaff A, Van Doorslaer E, Watanabe N. On decomposing the causes of health sector
inequalities with an application to malnutrition inequalities in Vietnam. Journal of Econometrics; 2003. p. 207-23.
32. Chen ZA, Eastwood D, Yen ST. A Decade's Story of Childhood Malnutrition Inequality in China: Where You Live Does Matter. 6th World Congress: Explorations in Health Economics Paper, 2007.
33. Gold R, Kennedy B, Connell F, Kawachi I. Teen births, income inequality, and social capital: developing an understanding of the causal pathway. Health Place. 2002;8(2):77-83.
34. Nagaoka K, Fujiwara T, Ito J. Do income inequality and social capital associate with measles-containing vaccine coverage rate? Vaccine. 2012;30(52):7481-8.
35. Parameswaran A, Wijesinghe PR. Was there a disparity in age appropriate infant immunization uptake in the theatre of war in the North of Sri Lanka at the height of the hostilities?: a cross-sectional study in resettled areas in the Kilinochchi district. BMC Int Health Hum Rights. 2012;12:26.
36. Gayer M, Legros D, Formenty P, Connolly MA. Conflict and emerging infectious diseases. Emerg Infect Dis. 2007;13(11):1625-31.
37. Coninx R, Dupuy C, Hermann C, Ribeiro GC, Margot M, Lucic K. Vaccination of the civilian population in a country at war: it can be done; it can also be evaluated. The ICRC experience in Mozambique. J Trop Pediatr. 1998;44(3):186-8.
38. Emergency measles control activities--Darfur, Sudan, 2004. MMWR Morb Mortal Wkly Rep. 2004;53(38):897-9.
39. Elkhider W. Racism in Sudan: A cultural trait. 500 Words Magazine. 2012.