Embed Size (px)
Citation preview

Wealth from the Oceans USE, STEWARDSHIP, AND SECURITY
Jesse H. AusubelKeynote Address
8th Future of the Ocean Symposium
Urban Coast Institute, Monmouth University
26 October 2012

2 Wealth from the Oceans
Cover photo. North Atlantic deep-sea octopod Stauroteuthis syrtensis. This grapefruit-sized specimen was photographed in 2004 during the G.O. Sars expedition. Source: Census of Marine Life, Patterns and Processes of the Ecosystems of the Northern Mid-Atlantic. Photo by David Shale.
Golden V kelp, Aureophycus aleuticus, was discovered in 2008 near shore in the Aleutian Islands. Its V-shaped blades can grow as long as 3 meters. Source: Census of Marine Life. Photo by Max K. Hoberg.
Acknowledgment
This booklet presents the keynote address for the 8th Future of the Ocean Symposium organized by the Urban Coast Institute of Monmouth University held Friday, 26 October 2012, on the campus of the university in West Long Branch, New Jersey, in conjunction with the Champions of the Ocean Awards. Thanks to President Paul Gaffney and Institute Director Tony MacDonald for the opportunity to present the address. Their leadership has moved Monmouth to the forefront of institutions in the New York-New Jersey region, and increasingly the nation, addressing the challenges of the oceans.
This 8th chapter in Monmouth’s serial about
the future of the oceans focuses on wealth from the oceans. Pages 21–23 present more information about the symposium and related events. Thanks to Robert Bryce, Alan Curry, Howard Hayden, Vaclav Smil, and especially Paul Waggoner for help with the address, to Lorraine Jordan and her colleagues for excellent organization of the symposium, and to H. Dale Langford for editorial assistance in producing this booklet.
Jesse H. AusubelDirector, Program for the Human EnvironmentThe Rockefeller Universityhttp://phe.rockefeller.edu
SUGGESTED CITATION:Ausubel, Jesse H. 2013. “Wealth from the Oceans: Use, Steward-
ship, and Security.” Keynote address, 8th Annual Future of the Ocean Symposium, Monmouth University, West Long Branch, N.J., 26 October 2012. http://phe.rockefeller.edu/docs/Wealth from the Oceans.pdf.

Use, Stewardship, and Security 3
In earlier centuries, wealth from the oceans con-jured images of gold doubloons pirated on their way to Spain, pearls retrieved by divers holding
their breath as deep as 100 feet in the Red Sea, and cod harvested by fisherman on the Grand Banks for Friday dinners in France. And before kerosene, wealth conjured Yankees harpooning sperm whales and rendering lamp oil.
My remarks about the future of oceans span the themes of use, stewardship, and security, begin-ning with use, which typically converts wealth into cash. Use is the business not only of pirates, divers, and fishermen but stevedores, chandlers, and oil-men, too. Time has changed the relative magnitude of uses greatly since doubloons, pearls, cod, and whales dominated marine wealth and uses.
My address continues with stewardship, the careful and responsible management of the oceans entrusted to humanity. Both the practical desire for wealth in the long run and ethical obligation to nature encourage our stewardship of the seas.
After the use and stewardship of marine wealth, I must tend to their safety, making our lives, har-bors, ships, pipes, and cables secure. Good sense requires defending ourselves and the trillions of dollars in infrastructure that we invested to use the oceans, defending it against sudden natural hazards like tsunamis and storms and slow ones like ero-sion and silt. We must also secure against enemies and crime. Finally, if the oceans are not to end dependent on the kindness of strangers, a steadfast system must cycle wealth from oceanic uses to its stewardship and defense.
As I wrestle to find the scale of some recently preeminent uses of the oceans, I will integrate the evolving uses into three master trends, namely, crowding, decreasing anonymity, and increasing transparency of the ocean itself. The three trends of use affect stewardship and security, profoundly.
Although I will refer often to the United States, the story is global.
First let’s establish the magnitudes of uses for the case of the U.S. with estimates of annual wealth created by the oceans as markets measure them.
Following the 2004 report of the U.S. Com-mission on Ocean Policy chaired by the late Admi-ral Watkins, I suggest dividing the ocean economy into five broad market sectors or industries:
• Harvesting living marine wealth, like catch-ing, farming, and processing of fish
• Building boats, piers and wharves, dredging channels, and reconstructing beaches
• Shipping goods, information, and people• Pumping oil and gas and mining minerals,
and• Feeding and lodging tourists and visitors
plus their boats.The Commission added two nonmarket uses:• Conducting scientific research, and• Defending and managing the oceans by
government. Some of these sectors or industries relate to the
ocean by what they do, such as build boats. Almost all relate because of where they are. Tourism and recreation such as hotels are ocean-related when located in a near-shore area. Stimulated by the Commission, a National Ocean Economics Pro-gram (NOEP) at the Monterey Institute of Stra-tegic Studies now tracks the U.S. ocean economy annually.
Admiral Watkins’s Commission and the Mon-terey program distinguish between the ocean econ-omy, the portion of the economy that relies directly on ocean attributes, and the much larger coastal economy, which includes all economic activity on or near the coast, whether or not that activity has a direct link to the sea. I focus on the ocean economy.
The Commission estimated that in 2000, the private ocean economy employed about 2 million workers and contributed more than $117 billion to American prosperity, one-third the present annual global sales of Walmart but more than twice the economic output of the farm sector at that time. The scale surprised me, and I repeat: The private ocean economy was smaller than Walmart’s sales but bigger than farms.
A broadly comparable Columbia University study published in 1980, on which I served as a research assistant while a student, provides the first column in Table 1, which reveals changes with time, some large.
Table 1. Estimated percent of ocean economy by sector
Sector 1972 2002 2010
Feeding and lodging >50 51 28
Shipping goods, information, people
12 23 19
Pumping and mining 11 13 42
Building and construction ? 9 9
Harvesting marine life <5 4 2.5
Sources: Pontecorvo et al., 1980; Commission on Ocean Policy, 2004; NOEP, 2012.

4 Wealth from the Oceans
Columbia estimated that within the mar-ket economy in 1972, the majority of value came from feeding and lodging, that is, for recreation and desirable residences. In 1972, shipping earned 13 percent of the market-measured wealth, and pumping and mining earned a weak third place at 11 percent.
Thirty years later in 2002, the Watkins Commission found that feeding and lodging still held the top ranking. Fully half the ocean economy related to tourism and recreation. And roughly three-quarters of the jobs were in ocean-related tourism and recreation. Shipping grew to win 23 percent, pumping and mining 13 percent, and boat building and construction 9 percent. Harvesting living resources accounted for only 4 percent.1
From 2002 to 2010, according to Mon-terey, the ocean sector as a whole grew more than 25 percent in real terms. Pumping and mining, especially offshore oil and gas, accounted for most of the growth and seized the number one rank for wealth from the oceans with a surprising 42 percent of the market activity and displaced feeding and lodging as the largest activity. Feed-ing and lodging receded only a little absolutely but dropped to 28 percent of the share. Shipping grew but lost share, sinking to 19 percent. Boat building and construction retained 9 percent, of which more was due to oil and gas platforms and terminals and less to vessels. Harvesting living resources dwindled to 2.5 percent.
While the private ocean economy of the U.S. represented in the table grew by a quarter from 2002 to 2010, government ocean expenditure shrank, absolutely, during the recent decade. In fact, a comparison with the Columbia report shows the government’s share of the ocean economy has fallen in 40 years from one-third to one-tenth. Federal government spending allocated to ocean and coast-al support in fiscal year 2011 was about $12 billion, while in 2011 dollars the government expenditure in 1972 would have exceeded $50 billion.
The overall trends are growth in the private sector, where energy and tourism are foremost, and lessening absolute and relative government activity.
1 These estimates are not the total final value of a sector, which can be much larger. In 2002 already the nation’s ports handled more than $700 billion in goods, the cruise industry and its passengers accounted for $12 billion in spending, and the commercial fishing industry’s total value exceeded $28 billion annually, while the recre-ational saltwater fishing industry was valued at around $20 billion. Even the annual U.S. retail trade in ornamental fish was worth $3 billion. Source: Commission on Ocean Policy, 2004.
With this orientation, let’s begin with the most dynamic sector, pumping, to grasp the state of the global oceans that offer humanity use, and call for stewardship and security.
Because pumping exploded from third to first place from 2002 to 2010, images of offshore plat-forms have become quite familiar. About 4,000 platforms salt the U.S. sector of the Gulf of Mexico alone, operating as deep as 2,500 meters, and it seems reasonable to estimate 8,000 to 12,000 plat-forms salt global oceans, or two to three times as many as in the Gulf.
The Thunder Horse platform that began pumping in 2008 in the Gulf of Mexico 150 miles southeast of New Orleans in 6,000 feet of water cost around $5 billion to construct (Figure 1). To appreciate the scale of $5 billion in residential terms, it would buy 10,000 homes each selling for $500,000. BP and Exxon expect to operate the plat-form for 25 years. Repaying a 25-year mortgage on your $500,000 home requires 25 years of mainte-nance and security. Recouping a ten thousandfold larger investment in an oil rig demands at least as much maintenance and security.
The captain of the Titanic learned that most of an iceberg is underwater. Just so, the platforms of offshore oil and gas wells are only the proverbial tip of the iceberg for seafloor structures. The crowd of pipes and machines underwater around a well explains why an expensive infrastructure accompa-nies oil and gas production (Figure 2).
Figure 1. Thunder Horse Platform in the Gulf of Mexico is the largest offshore installation of its kind. Its hull was built by Daewoo Shipbuilding in South Korea, loaded aboard the heavy lift ship MV Blue Marlin, and transported more than 15,000 nautical miles to Ingleside, Texas, where Kiewit Offshore Services integrated the hull with topside modules built in Morgan City, Louisiana. Source: Wikimedia Commons, Andyminicoper.

Use, Stewardship, and Security 5
Figure 2. Oil and gas have become the largest ocean industry. Its infrastructure off U.S. coasts exceeds $10 trillion, including ships and production platforms, seafloor field facilities, subsea tiebacks and pipelines, remotely operated vehicles, as well as landside ports and terminals. Sources: BP, Schlumberger, Graham Roberts/The New York Times.

6 Wealth from the Oceans
Superimposing a map of the Gulf of Mexico Independence Hub and its connected colonies on a map of the Washington, D.C., area suggests the large scale of the under-water structures, which can span tens of kilo-meters (Figure 3).
In turn, the total dense network of sea-floor structures and pipelines connecting them evokes a railroad map of Britain (Figure 4). The pipelines in the Gulf stretch about 700 miles from Corpus Christi, Texas, to Mobile, Alabama, about the distance from New York to Chicago.
In 2009, operators pumped about 570 million barrels of oil and 2.4 trillion cubic feet of natural gas from the wells in the U.S. portion of the Gulf of Mexico, worth about $60 billion, almost equal to the value of all of the ocean tourism and recreation of the U.S. in every ocean.
The distance from Corpus Christi to Mobile doesn’t change, but the oil networks keep extending, farther offshore. A railroad
crossing America starts at sea level and climbs through mountain passes more than a mile high. Similarly, oil infrastructures dive from the shallow continental shelf about 200 meters deep down the continental margins to about 2,400 meters, or a mile and a half, and are heading even deeper (Fig-ure 5).
Globally, discoveries of oil and especially natural gas on the continental margins keep com-ing with demands for their use, stewardship, and defense. Brazil has made huge finds and its top oil and gas firm, Petrobras, aims to rival Exxon, Shell,
Figure 4. In the Gulf of Mexico thousands of kilometers of seafloor infrastructure link offshore oil production to land facilities and other offshore hubs. Source: Thomas Fry, National Ocean Industries Association.
Figure 5. As the “easy” oil and gas are exhausted from terrestrial and shallow-water fields, the push to deeper water (shown in darker gray) on the continental margins follows. In general, the continental margins appear rich with natural gas. The question may not be whether a nation has deep offshore gas, but whether it has the expertise and capital to exploit it. Source: Census of Marine Life Continental Margins project, exaggerated bathymetry.
Figure 3. Gulf of Mexico Independence Hub’s subsea reach superimposed on a map of Washington, D.C. Red circles indicate linked seafloor colonies of the square mother hub with a surface platform. These subsea tiebacks to a central control hub can be 40 miles long. Source: Thomas Fry, National Ocean Industries Association.

Use, Stewardship, and Security 7
and other industry leaders in revenue and technical skill. Meanwhile, discoveries extend from Ghana and Mozambique to the Arctic. I believe oil and especially natural gas pervade Earth’s continental margins, the gray areas on the map.
During the next decades, structures for gas extraction will spread around all the continents. The single instance of Israel’s discovery of natural gas in the Mediterranean exemplifies the meaning of use, stewardship, and security (Figure 6).
Meanwhile, the wind industry, another form of
pumping and mining, aims for the same marine span as oil and gas and will enlarge the meanings of use, stewardship, and security (Figure 7).
Let’s compare the scale of hoped-for wind-mills to the estimated 4,000 oil and gas wells in the U.S. sector of the Gulf of Mexico. In 2011 these wells produced about 500 million bar-rels of oil and 2 trillion cubic feet of natural gas, about 5 exajoules of energy or an average thermal power exceeding 150 gigawatts (GW). How many windmills would contribute as much energy as the wells? To convert the oil and gas to the com-mon currency of electricity, assume a utilization rate of 35 percent, the average of all U.S. fossil fuel-to-electricity conversion efficiency, including coal.2 The 150+ GW would then provide 53 GW electric.
For wind, assume a basic all-electric system of large 3-megawatt (MW) turbines with a gen-erous load factor of 33 percent.3 To generate 53 GW electric would then require about 160 GW of installed nameplate capacity, which could be fulfilled by 53,000 wind turbines with 3 MW nameplate capacity. Allowing for more efficient oil and gas plants, less efficient wind farms, and trans-mission losses from collecting the wind electricity and cabling it to cities would add tens of thou-sands more turbines.
To generate watts of electricity to match the watts of fuel from Gulf of Mexico wells, 50,000
2 New gas turbines top 50 percent. And, it would be a little crazy to burn so much oil for electricity, but let’s proceed with the thought experiment.3 Many wind farms average 20 percent.
Figure 7. Existing offshore wind farms in Europe. The European Union aims offshore wind for 20 percent of renewable energy and 4 percent of total power consumption by 2020. Source: European Wind Energy Association, 2009.
Huge gas reserves discovered off HaifaJan. 18, 2009JPost.com Staff, THE JERUSALEM POST
Three massive gas reservoirs have been discovered 80 kilometers off the Haifa coast, at the Tamar prospect, Noble Energy Inc. announced on Sunday.
The Tamar-1 well, located in approximately 5,500 feet of water, was drilled to a total depth of 16,076 feet.
Speaking on Army Radio Sunday morning, an exhilarated Yitzhak Tshuva, called the discovery “one of the biggest in the world,” promising that the find would present a historic landmark in the economic independence of Israel. “We will no longer be dependent [on foreign sources] for our gas, and will even export. We are dealing with inconceivably huge quantities,” Tshuva added.
An ecstatic Infrastructures Minister Binyamin Ben-Eliezer said before the weekly….
Figure 6. Excerpt from news clipping announcing discovery of natural gas reservoirs off the coast of Israel (emphasis added). Source: The Jerusalem Post, 18 January 2009.

8 Wealth from the Oceans
to perhaps 100,000 windmills would have to tower over the water. That many turbines would out-number the oil and gas platforms 12- to 25-fold. Although 100,000 wind turbines is surely unat-tainable, this order of magnitude warns how the cables to convey the electricity to shore would lace the seafloor, and the towers would transform and bristle in the seascape.
As just hinted, after hubs gather energy from windmills, cables must carry it to users. In 2010 Google helped propose one of the most ambitious plans for the Jersey coast (Figure 8). Like the $5 billion oil rig, the $5 billion cable for New Jersey would demand maintenance and security along its 350 miles.
Pipelines, like cables, may deliver energy
over moderate distances. The deliverability of oil and gas over intercontinental distance confers an advantage on fossil fuel. Petroleum and liquefied natural gas, like grain and autos, as well as coal and iron ore, travel on ships.4 The number of large ships has roughly tripled in the past 40 years and the billions of ton-miles traveled by the ships have more than quadrupled (Figure 9).
Although some waters like the southern seas remain uncrowded, the tracks of heavy ships criss-cross the routes among many ports (Figure 10).
As goods travel by sea, so does informa-tion, which once upon a time traveled as let-ters and books. The transoceanic game of
4 Shipping rum, another fossil fuel, once helped a transatlantic shipping boom.
Figure 8. Google and a New York financial firm have proposed building a 350-mile underwater transmission line that could carry as much as 6,000 megawatts of electricity from wind farms off the mid-Atlantic coast. Source: New York Times, 12 October 2010.
Figure 9. Since the 1960s the amount of cargo being transported on the oceans has increased more than 3.5 times. The number of ships has increased by about 2.7 times, indicating that ships have also become larger and more powerful. Source: http://www.ics-shipping.org/shippingfacts/worldtrade/volume-world-trade-sea.php.
Figure 10. Shipping generally follows a few well-established and predictable lanes determined by geography and the desire to minimize fuel use and time at sea. This compilation of Automatic Identification System (AIS) signals from vessels larger than 300 gross tons was taken over about 100 days in 2009. The low-density shipping traffic and lack of scientific observations of the southern and eastern Pacific are not coincidental. Source: S. Neill, U.S. Coast Guard.

Use, Stewardship, and Security 9
telecommunications started with copper wires between Newfoundland and Ireland in 1858 for telegraph and later telephone. In the 1980s fiber optic cables entered the ocean, and their debut attracted even the science fiction writer Isaac Asimov (Figure 11).
Now Asimov’s cable is one of more than 200. Displacing hard copy letters and not yet overtaken by satellites, seafloor cables carry most messages and data between continents, and indeed scallop along the coasts to network coastal nations as well.
In contrast to the now-preeminent pumping and transoceanic shipping of oil and gas or the cabling of messages across the seafloor, fishermen have been harvesting sea life for a long time. The Romans were already very good fishers 2,000 years ago, removing 100,000 tons per year. Tuna was their favorite seafood (Figure 12).
Nevertheless fishermen earn little or even lose money and depend on subsidies. Despite their relatively small economic impact, their impact on marine life is large. The sheer number of small, relatively light wild catches, not price per catch, diminishes the economic value of capture fisheries.
Fishing may be a small and subsidized ocean sector, but consumers love it. In the 21st century tuna remains super popular, as the auction that takes place each morning in the Tokyo fish market shows. The top tuna in 2012 sold for more than $700,000 (Figure 13).
In fact, sea life is too tasty for its own safety. Refrigeration and fast transport have gathered sea-food from all over the world in the Tokyo market, including not only Mediterranean tuna but Maure-tanian octopus (Figure 14).
Figure 11. Since the first subsea fiber-optic telecommunications cable was laid in 1987 (left), the capacity of a single cable has increased by a factor of 100,000 from 20 million bits per second to 3.2 trillion bits per second (right).
Figure 12. This detail from a 5th century Carthaginian mosaic is one of the earliest depictions of trawling. Source: Yacoub, M., Splendors of Tunisian Mosaics, Tunis, 1995, Fig. 115.
Figure 13. Bidders gather at the Tokyo fish market at 5 a.m. daily to buy tuna. In January 2012 a bluefin tuna sold here for $733,000. Photo by S. Mitani.
Figure 14. Mauretanian octopus for sale at the Tokyo fish market. Photo by S. Mitani.

10 Wealth from the Oceans
Survival to become a big fish has been hard, and is getting harder (Figure 15).
In fact, while humans have been getting larger, fish have been getting smaller for more than a century. Young men with harpoons fishing off the northeast coast of America reduced the average size of a swordfish caught here from above 500 pounds in 1860 to about 200 pounds in 1920 (Figure 16).
It is not just Americans and Japanese who have been harvesting sea life. Look at the catch by nation of the small shrimp-like krill around Antarc-tica (Figure 17).
In 1994, along with Japan, Ukraine and Poland harvested most of it. Since 2006, along with Japan, the top fishers are South Korea and Norway, which feeds the krill to fatten its salmon. And in 2011, China began harvesting krill, too.
The Food and Agriculture Organization of the UN reports that the total tonnage of wild sea life captured by all nations has been almost flat for the past 20 years. Within the flat catch, however, spe-cific populations have fallen and been replaced, part of a longer-term pattern of new groups becoming commercial while others collapse or even become locally extinct. These include not only fish such as cod but whales, turtles, seabirds, and oysters (Fig-ure 18).
To get more living wealth from the sea, we are turning to aquaculture, as hunters became farmers millennia ago. Beware, however, that fish farming will also deplete marine life—unless the farmer provides vegetarian feed rather than other marine
animals captured wild. We need to farm herbivorous forms of sea life, such as oysters and tilapia, or fool the salmon into eating tofu.
The loss of wild sea life is a problem not only for commercial fishing, a tiny industry when mea-sured against the scale, say, of Walmart sales. It ampli-fies into a problem for the much larger industry of tourism, including rec-reational fishing. People want clean beaches and clean water. They want to eat seafood by the sea-shore, and they also like
Figure 15. The fate of fish that grow large. Photo by S. Mitani.
Figure 16. From 1860 to the present, the average weight of swordfish, Xiphias gladius, caught off the North American coast by either harpoons or lines declined from as much as 270 kilograms to near or less than 100 kilograms. A big drop occurred from 1860 to 1930. Source: Karen Alexander, Brian R. MacKenzie, and William Leavensworth, History of Marine Animal Populations project, Census of Marine Life.
Figure 17. Changing shares of Antarctic krill harvest, 1994-2010. Source: Einar Svendsen, Institute of Marine Research, Bergen, Norway.

Use, Stewardship, and Security 11
at least a reasonable chance of catching a fish, a trophy, or seeing diverse life when they snorkel or scuba. Many regions have suffered terrible losses of sea life, owing to overfishing, coastal pollution, and other abuses and failed maintenance (Figure 19).
In the end, the overarching question is whether the taste for wild sea life but the small total economic return of commercial fishing, despite the sometimes high price per pound, justifies the cost to marine life.
Although declining size and popula-tion of fish may be blamed on failed stew-ardship, the value of the fish taken partial-ly explains and compensates. Other abuses and failed steward-ship lack such clear compensations by use. Sheer crowd-ing of the sea and coast spreads trash. Crowds carelessly allow waste to wash off shores and over-board. An expedi-tion of the Census of Marine Life to the Mediterra-nean found more trash than life near Greece (Figure 20). Another expedition to the northwest of the Hawaiian Islands found a crueler instance, an albatross swal-lowing quantities of debris it could not regurgitate (Figure 21).
Noise shows another lack of stewardship
and consequence of crowding. The oceans have lots of natural noise, from falling rain, breaking waves, and cracking ice to singing whales and snap-ping shrimp. Seafloor eruptions or quakes shatter the quiet. But during the past decade, for the first time, humans have made noise that rivals natural
Figure 18. Long-term trend to local extinction and collapse of sea life. Source: Worm et al., 2006, Science 314:787-790.
Figure 19. This poignant comparison of the catch from a recreational fishing boat company, Greyhound, in the Florida Keys in 1958 and 2007, shows decline in the size of the catch and change in the mix of species. Source: Census of Marine Life, History of Marine Animal Populations.
Figure 20. Looking for marine life, researchers instead collected more garbage than life in the Eastern Mediterranean 13,000 feet deep southeast of Crete. Photo by Michael Turkay.
Figure 21. Photographer Susan Middletown memorialized one albatross and its stomach contents.

12 Wealth from the Oceans
noise, and our cacophony keeps rising. Pile driving for windmills and piers, oil and gas rushing from the seafloor into pipes, navigational beacons and sonars, and shipping make noise.
The profile of a large ship passing through the Santa Barbara channel shows that for about 10-12 minutes, it makes a lot of noise over a range of frequencies, and up to about 100 decibels (Figure 22). Consider the vessel a passing rock concert. While evidence may be inconclusive about harm to animals so far, stewardship counsels that humans have to learn to operate more quietly in the oceans. And we can, for example, with fuel cells and super-conducting motors for propulsion.
Despite examples of undisciplined use and poor stewardship, much marine wealth remains, even remains to be discovered. The remaining and still to be discovered wealth presents an opportunity for stewardship that can sustain and even increase wealth. More than 6,000 potentially new marine species were discovered during the Census of Marine Life conducted worldwide between 2000 and 20105. Among them was an octopus discovered in the deep North Atlantic, living unbeknownst to the humanity making countless surface crossings of the North Atlantic during the past 500 years (cover photo).
5 We must say “potentially” new species, because in many in-stances taxonomists were unable to keep up with and evaluate the discovery of unidentified specimens.
From shallow water in Aus-tralia another octopus announced itself to the Census by crawling into a kind of empty dollhouse that marine biologists placed on the Great Barrier Reef (Figure 23).
A new type of worm, or poly-chaete, was found in Indonesian waters (Figure 24).
In America’s own Gulf of Alaska in shallow water, the beau-tiful Golden V kelp lived undis-covered though easily accessible to snorkelers and scuba divers (inside cover photo).
The final example shows the animal that became the icon of the Census of Marine Life, the yeti crab, discovered in the deep sea near Easter Island in the Eastern Pacific. Its hairy appearance sug-gests the abominable snowman,
the yeti (Figure 25). Remembering that not all values pass through markets, we understand that such diversity and the thrill of exploration are also wealth.
Figure 22. Noise of a 90,000-ton container ship. Source: Megan F. McKenna, Scripps Insitution of Oceanography.
Figure 23. New octopus collected at a depth of about 10 meters on a reef off northeastern Australia. Source: Census of Marine Life Census of Coral Reef Ecosystems. Photo by Julian Finn.

Use, Stewardship, and Security 13
Figure 24 (above). This 10-centimeter “squidworm” is a new species of polychaete in the class of annelid worms. It was discovered in the Celebes Sea in deep water. Source: Census of Marine Life Census of Marine Zooplankton. Photo by Laurence P. Madin.
Figure 25 (below). Kiwa hirsuta, named for the Polynesian goddess of shellfish, was discovered near hydrothermal vents in the Pacific-Antarctic Ridge. Nicknamed “Yeti,” this species represents a newly discovered family of crabs. Source: Census of Marine Life. Photo by Alexis Fifis, French Research Institute for Exploration of the Sea.
14 Wealth from the Oceans
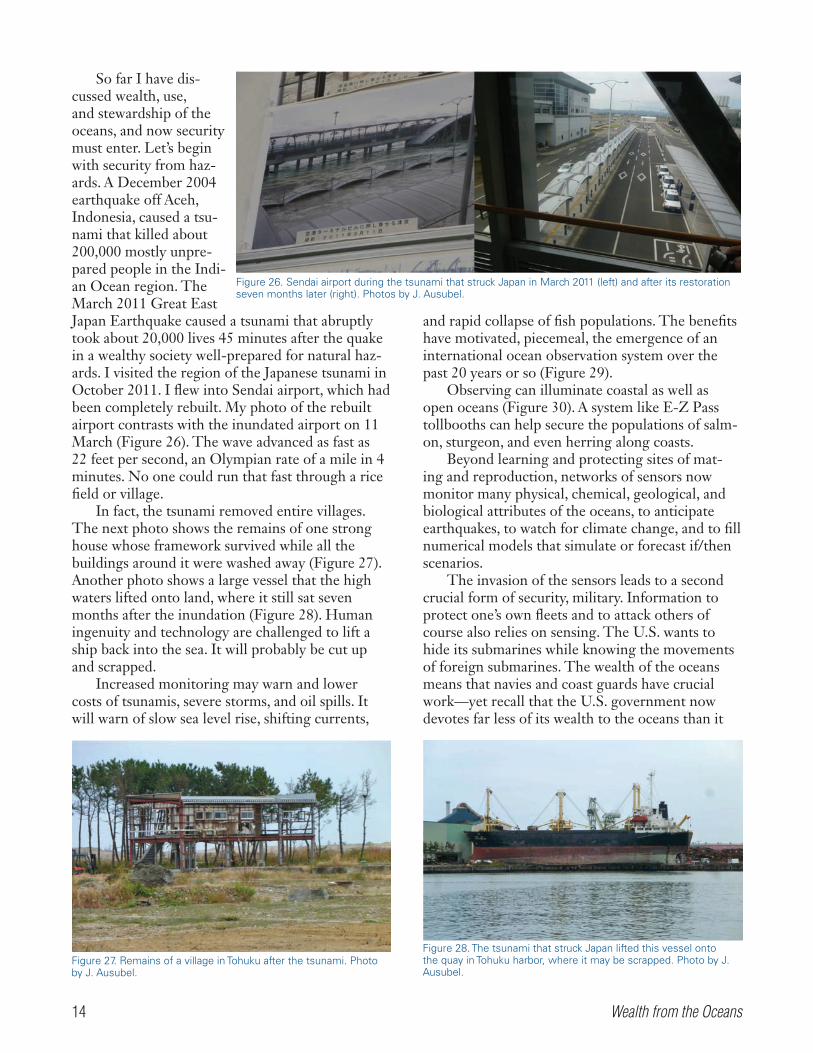
So far I have dis-cussed wealth, use, and stewardship of the oceans, and now security must enter. Let’s begin with security from haz-ards. A December 2004 earthquake off Aceh, Indonesia, caused a tsu-nami that killed about 200,000 mostly unpre-pared people in the Indi-an Ocean region. The March 2011 Great East Japan Earthquake caused a tsunami that abruptly took about 20,000 lives 45 minutes after the quake in a wealthy society well-prepared for natural haz-ards. I visited the region of the Japanese tsunami in October 2011. I flew into Sendai airport, which had been completely rebuilt. My photo of the rebuilt airport contrasts with the inundated airport on 11 March (Figure 26). The wave advanced as fast as 22 feet per second, an Olympian rate of a mile in 4 minutes. No one could run that fast through a rice field or village.
In fact, the tsunami removed entire villages. The next photo shows the remains of one strong house whose framework survived while all the buildings around it were washed away (Figure 27). Another photo shows a large vessel that the high waters lifted onto land, where it still sat seven months after the inundation (Figure 28). Human ingenuity and technology are challenged to lift a ship back into the sea. It will probably be cut up and scrapped.
Increased monitoring may warn and lower costs of tsunamis, severe storms, and oil spills. It will warn of slow sea level rise, shifting currents,
and rapid collapse of fish populations. The benefits have motivated, piecemeal, the emergence of an international ocean observation system over the past 20 years or so (Figure 29).
Observing can illuminate coastal as well as open oceans (Figure 30). A system like E-Z Pass tollbooths can help secure the populations of salm-on, sturgeon, and even herring along coasts.
Beyond learning and protecting sites of mat-ing and reproduction, networks of sensors now monitor many physical, chemical, geological, and biological attributes of the oceans, to anticipate earthquakes, to watch for climate change, and to fill numerical models that simulate or forecast if/then scenarios.
The invasion of the sensors leads to a second crucial form of security, military. Information to protect one’s own fleets and to attack others of course also relies on sensing. The U.S. wants to hide its submarines while knowing the movements of foreign submarines. The wealth of the oceans means that navies and coast guards have crucial work—yet recall that the U.S. government now devotes far less of its wealth to the oceans than it
Figure 26. Sendai airport during the tsunami that struck Japan in March 2011 (left) and after its restoration seven months later (right). Photos by J. Ausubel.
Figure 27. Remains of a village in Tohuku after the tsunami. Photo by J. Ausubel.
Figure 28. The tsunami that struck Japan lifted this vessel onto the quay in Tohuku harbor, where it may be scrapped. Photo by J. Ausubel.

Use, Stewardship, and Security 15
Figure 29. The Global Ocean Observing System (GOOS) has increased in capacity in the past decade, but is not fully complete. GOOS is an example of how the oceans are becoming more transparent and more crowded with sensors. Source: David Meldrum, Intergovernmental Oceanographic Commission.
Figure 30. The Census of Marine Life Pacific Ocean Shelf Tracking (POST) project demonstrated the use of tiny coded acoustic tags to monitor movements of marine animals from juvenile salmon to herring, sturgeon, and sharks using listening curtains across continental shelves. The technology can be used on a wide range of species and a large number of individuals with over 200,000 tag codes. Source: Census of Marine Life.

16 Wealth from the Oceans
did 40 years ago, $12 billion versus $50 billion in current dollars, as mentioned earlier.
A much-contested region at present is the South China Sea, which abounds in oil and gas and other resources. In this transition zone between the Pacific and Indian oceans, the sea’s extremely com-plex borders and topography make it hard to moni-tor (Figure 31).
A second region of heightened attention is the Arctic, rich again in oil and gas, and contested by Russia and other bordering nations (Figure 32).
Earlier I stressed the likely abundance of natu-ral gas on the continental margins. Thus, the third
Figure 31. The tear-shaped region within the fuchsia border is based on a 200-mile limit and contrasts with the area enclosed in dashed yellow lines, all of which China claims. China’s claim actually encompasses some oil platforms that currently lie well within the exclusive economic zones of Malaysia and Vietnam. Source: http://www.southchinasea.org/files/2011/08/map_big.jpg.
Figure 32. An ice-free summer in more parts of the Arctic is likely to prompt commercial development for oil and gas exploitation, destination traffic (e.g., cruise ships, tankers), and potentially even new shipping routes. Anticipating increased financial and strategic value, nations are already intensifying their claims to Arctic territory. Source: University of Durham, UN, Marum.

Use, Stewardship, and Security 17
ocean domain I will high-light for security includes the extended continental shelves and continental margins, whose ownership is not yet defined by international law (Figure 33).
While multibillion-dollar gas platforms exemplify a need for security and nuclear submarines illustrate defense, security can also mean catch-ing low-cost drug smuggling. Recently, drug smugglers have turned to submarines, inex-pensive but all their own and more elusive than surface ves-sels (Figure 34).
And the ultimate cargo for smugglers is not drugs but people themselves. A route of escape is also part of the wealth of the oceans. Every day vessels try to reach European nations, Australia, and America with illegal immigrants. Business is booming for coast guards (Fig-ure 35).
For the future of the oceans, let me integrate my views of use, stewardship, and security into the three master trends: crowding, decreased
anonymity, and increasing transparency.The first master trend, crowding, follows more
offshore platforms, more ships, and more cables.
Figure 33. The blue areas on this map potentially fall under the Extended Continental Shelf provisions of the UN Conference on the Law of the Sea. Countries that have recognized claims to the extended continental shelf have exclusive rights to the resources and minerals on or under the seafloor. Several areas with unsure sovereignty, for example off Angola and Namibia and indeed off the U.S. East Coast, are likely rich in natural gas. Source: Wikimedia Commons, chenyenren.pixnet.net.
Figure 34. This semi-submersible, built in South America, has been fitted to transport up to 10 tons of illegal drugs to the United States. The virtually nonexistent freeboard makes them difficult to detect with radar and visually. The next step is complete submersion. Sources: Wikimedia Commons, globalsecurity.org.
Figure 35. Coast guards face increasing challenges to limit smuggling and illegal immigration. A coast guard must be able to observe, sense, and influence activities both on and beneath the surface. Source: Wikimedia Commons.
18 Wealth from the Oceans
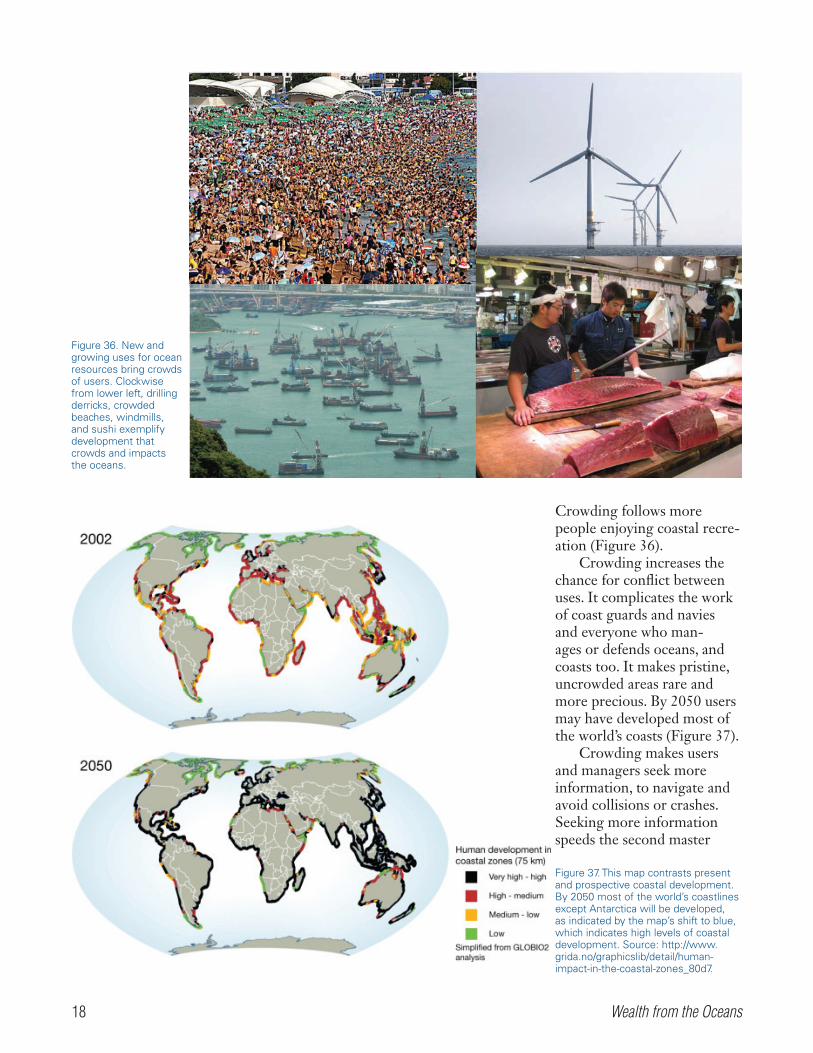
Crowding follows more people enjoying coastal recre-ation (Figure 36).
Crowding increases the chance for conflict between uses. It complicates the work of coast guards and navies and everyone who man-ages or defends oceans, and coasts too. It makes pristine, uncrowded areas rare and more precious. By 2050 users may have developed most of the world’s coasts (Figure 37).
Crowding makes users and managers seek more information, to navigate and avoid collisions or crashes. Seeking more information speeds the second master
Figure 36. New and growing uses for ocean resources bring crowds of users. Clockwise from lower left, drilling derricks, crowded beaches, windmills, and sushi exemplify development that crowds and impacts the oceans.
Figure 37. This map contrasts present and prospective coastal development. By 2050 most of the world’s coastlines except Antarctica will be developed, as indicated by the map’s shift to blue, which indicates high levels of coastal development. Source: http://www.grida.no/graphicslib/detail/human-impact-in-the-coastal-zones_80d7.

Use, Stewardship, and Security 19
trend, decreasing anonymity and privacy. Consider ship traffic in the English Channel; safety demands detailed knowledge of even small vessels, and for security even a kayaker may choose to be tagged and monitored (Figure 38).
Once upon a time, freedom of the seas shone as a goal and stood as a policy. And until recently that freedom encompassed freedom from prying eyes. Now systems of vessel identification, satellites,
and other surveillance render privacy at sea largely a thing of the past, except perhaps for submarines operating stealthily and deep. It is hard even to get lost in the shuffle. And information extends not just to the location and trajectory of a vessel, but to its ownership, safety record, crew, and passengers (Figure 39). The phrase “freedom of the seas” now sounds quaint.
Figure 38. The Automatic Identification System (AIS) vessel tracking is semi-voluntary and freely available online. AIS identifies and tracks commercial vessels larger than 300 gross tons and provides detailed data in real time on the Internet. Source: http://marinetraffic.com/ais/.
Figure 39. Once identification of a vessel is achieved, the Internet in turn opens a flood of more information about the history of a vessel, its ownership, and even its crew members. Source: http://www.marinetraffic.com.

20 Wealth from the Oceans
Finally, beyond human activities emerging from the fog, the oceans themselves are becoming more transparent, the third master trend. We can see a school of fish 100 kilometers away, feel an earth-quake miles deep, and hear a sound across an ocean basin. Figure 40 pictures the ocean with the tech-nologies the Census of Marine Life used to carry out its work.
In conclusion, I return to the theme of wealth from the ocean and its use, stewardship, and secu-rity. While old uses such as fishing, shipping, war, and tourism continue, newer ones such as energy extraction and science expand. The trends of more crowds, more transparency, and less privacy have changed, surprisingly, the 2012 ocean presented to humanity for use, stewardship, and security. We can safely bet that the same trends of crowding, transparency, and less privacy will surprise users, stewards, and defenders of the future ocean (back cover photo).
The wealth from traditional uses added to the wealth from new treasures to be discovered in the deep will attract their use. Their stewardship and defense will depend on a multitude. Begin with fishermen and bathers, sailors, and stevedores. Then more and more, add oilmen and scientists plus landlubbers who govern from the land.
If a steadfast system cycles oceanic wealth from use into oceanic stewardship and defense, the future oceans can continue yielding wealth. Above all, the immense wealth from offshore oil and gas could propel the cycle. Government’s declining share of the ocean economy, during the most recent decade and a longer span of four decades, however, testifies that wealth from ocean use is not cycling into stewardship and defense, steadfastly. If too much wealth leaks away, future oceans will be left to the kindness of strangers. Let’s not allow that to happen.
ReferencesNational Ocean Economics Program. http://www.
oceaneconomics.org/ (accessed October 2012).Pontecorvo, Giulio, et al. 1980. Contribution of
the ocean sector to the United States economy. Science 30 May 1980: Vol. 208 no. 4447 pp. 1000-1006, May 30, 1980. DOI: 10.1126/science.208.4447.1000.
U.S. Commission on Ocean Policy. 2004. An Ocean Blueprint for the 21st Century: Final Report. Washington, D.C.: U.S. Commission on Ocean Policy.
Figure 40. Biological observing technologies like those used in the Census of Marine Life make the oceans increasingly transparent. Image: E. Paul Oberlander.

Use, Stewardship, and Security 21
8th AnnualFuture of the Ocean Symposium
andChampions of the Ocean Awards Luncheon
Friday, October 26, 2012
Each year, in association with the Future of the Ocean Symposium, Monmouth University recognizes individuals for their contributions to knowledge and
management of the oceans. For 2012 the University named Jesse H. Ausubel Champion of the Ocean and recognized Rear Admiral Richard M. Larrabee, USCG
(Ret), Lawrence R. Dickerson, and Christopher Koch with Ocean Leadership awards.
SCHEDULE OF EVENTSWealth from the Oceans: Use, Stewardship, and Security
Wilson Hall
9:30 a.m. - Registration
10 a.m. - WelcomePaul G. Gaffney IIPresident, Monmouth University
10:15 a.m. - Symposium CommencesTony MacDonaldDirector, Urban Coast Institute
10:30 a.m. - Keynote AddressWealth from the Oceans: Use, Stewardship, and SecurityProfessor Jesse H. AusubelDirector of the Program for the Human Environment at
The Rockefeller University and Science Advisor to the Alfred P. Sloan Foundation in New York City
Paul G. Gaffney II
Jesse H. Ausubel Symposium audience in Wilson Hall.

22 Wealth from the Oceans
11:30 a.m. - Panelist DiscussionDistinguished Panelists
Rear Admiral Richard M. Larrabee, USCG (Ret)Port Commerce, Director, Port Authority of NY/NJ
Lawrence R. DickersonPresident & CEO, Diamond Offshore Drilling, Inc.Christopher KochPresident & CEO, World Shipping Council
12 p.m. - Adjourn Symposium
AWARDS PROGRAMVersailles and Pompeii Rooms
12 p.m. - Champions of the Ocean Awards Luncheon
Introduction: Paul G. Gaffney II, President, Monmouth University
CHAMPION OF THE OCEAN AWARDProfessor Jesse H. Ausubel
OCEAN LEADERSHIP AWARDSRear Admiral Richard M. Larrabee, USCG (Ret)Lawrence R. DickersonChristopher Koch
From left: Paul G. Gaffney II, Jesse H. Ausubel, and panelists Lawrence R. Dickerson, Christopher Koch, and Richard M. Larrabee.
From left: Paul G. Gaffney II, Jesse H. Ausubel, and Tony MacDonald.
From left: Paul G. Gaffney II, Richard M. Larrabee, Christopher Koch, Lawrence R. Dickerson, and Tony MacDonald.
Jesse H. Ausubel and reception following awards presentation.

Use, Stewardship, and Security 23
Jesse Huntley Ausubel is Director of the Program for the Human Environment at The Rockefeller University in New York. Mr. Ausubel spent the first decade of his career in Washington, D.C., working for the National Academy of Sciences (NAS) and National Academy of Engineering (NAE). On behalf of the Academies, he was a main organizer of the first UN World Climate Conference in Geneva in 1979. He authored much of the 1983 NAS report Changing Climate, the first comprehensive review of global warming.
Since 1989 Mr. Ausubel has served on the faculty of The Rockefeller University, where he leads a research program to elaborate the technical vision of a large, prosperous society that emits little harmful and spares large amounts of land and sea for nature. Since 1994 Mr. Ausubel has concurrently served as a program manager or advisor in basic research for the Alfred P. Sloan Foundation. In the late 1990s Mr. Ausubel helped initiate the Census of Marine Life, an international observational program to assess and explain the diversity, distribution, and abundance of life in the oceans.
Author or editor of more than 150 publications, Mr. Ausubel is an adjunct scientist of the Woods Hole Oceanographic Institution and a University Fellow of Resources for the Future. Has led several activities of the Council on Foreign Relations about environment and resources, and is a trustee of the Richard Lounsbery Foundation, noted for supporting scientific cooperation as a means to bridge nations in conflict.
In 2009 Dalhousie University (Canada) and in 2012 St. Andrews University (Scotland) awarded Mr. Ausubel honorary doctorates for his contributions to environmental science. In 2010 he received the Blue Frontier/Peter Benchley prize for ocean science. For leadership of the Census of Marine Life, in 2011 he shared in the International Cosmos Prize.

The future ocean will be more crowded, less private, and more transparent. Source: Intergovernmental Oceanographic Commission, Global Ocean Observing System.
Monmouth UniversityUrban Coast Institute
Rockefeller UniversityProgram for the Human
Environment2013