Embed Size (px)
Citation preview

Wealth and Investment
Management (WIM)
David Carroll
Senior Executive Vice President
May 11, 2017
© 2017 Wells Fargo & Company. All rights reserved.

-
-
-
WIM is poised for continued growth
Client-Driven Approach
Relationships focus on client goals and outcomes
Plan-based offerings expand as client needs evolve
Services satisfy a full range of individual/institutional needs
Internal partnerships unlock greater value for clients through access to Wells Fargo’s breadth of products and solutions
90% of clients
believe their financial
plan/advice aligns with
their needs (1)
Strong Financials
Consistent financial results have continued over the long term
Diversified revenue mix drives stable returns
Large deposit base provides funding source for Wells Fargo
26% Long term earnings
CAGR
Foundation of Risk Management
WIM has a long history of strong Risk Management
Independent oversight functions provide credible challenge to leadership and strong governance of business practices
Enhanced alignment, capabilities, and controls mitigate cross-functional risk and facilitate regulatory compliance
Operating losses 83 bps of revenue (avg. 2013
2016)
Key Investments for Growth
Focused investment in technology, talent, and efficiency is advancing the business and long-term growth opportunities
Early wins provide Asset Management a strong start on its path towards expansion and innovation
Invested over
$800MM in strategic initiatives in 2013 2016
Data as of 12/31/16. (1) WIM Internal Data, Jan 2016 – Dec 2016.
Wells Fargo 2017 Investor Day Wealth and Investment Management 2

Business Overview

Diversified model meets a broad spectrum of needs
Pensions
Insurance
Endowments
Sovereigns
Corporates
Intermediaries
Mass/ Mass Affluent
Affluent High Net Worth
Ultra High Net Worth
Family Offices
Wells Fargo Advisors
The Private Bank
Abbot Downing
Wells Fargo Investment Institute Delivering the highest quality investment expertise and advice
Individuals Institutions
Institutional Retirement
&Trust
Comprehensive wealth management solutions
Advisory, brokerage, and financial services
Services for ultra-high-net-worth families and individuals
Wells Fargo Asset
Management (WFAM)
Investment solutions managed by specialized investment teams
Administration of 401(k), pension, other retirement plans, and custody assets
Wealth and Investment Management 4Wells Fargo 2017 Investor Day

Serve over 7MM individuals and institutions
Client Assets Client Counts Industry Rankings
$1.5T 3.1MM
households
#3 U.S. Retail Brokerage firm (1)
#3 Managed account provider (2)
$190B 80,000
relationships #4 Wealth Management firm (3)
$41B Over 600
relationships “Best National Private Asset Manager” (4)
$482B assets under
management (AUM)
Over 1,000 institutional clients
#20 U.S. asset manager (5)
#16 Fund complex group, including 3rd
largest bank-sponsored mutual fund company (6)
#2 Largest manager of proprietary stable value assets (Galliard) (7)
Institutional Retirement and Trust
$351B institutional
retirement assets
4.1MM institutional
plan participants
#8 Institutional Retirement Plan Recordkeeper (8)
Client assets and counts as of 12/31/16. Retail Brokerage, Wealth Management, Abbot Downing and Institutional Retirement assets include deposits and Wells Fargo Fund holdings. Households (HHs) defined as an address-based account grouping with WIM product ownership. Relationships represent clients grouped by relationship manager and may include multiple households. (1) Company and peer data; based on financial advisors (December 2016). (2) Cerulli Associates (December 2016). (3) Barron’s 2016 Wealth Manager survey (based on Retail Brokerage and Wealth Management assets in accounts >$5MM). (4) Family Wealth Report Awards (2016). (5) Institutional Investor 300 rankings (July 2016). (6) Strategic Insight (December 2016). (7) Pension & Investments 2016 survey. (8) PLANSPONSOR magazine (June 2016).
Wells Fargo 2017 Investor Day Wealth and Investment Management 5

Results in 2016 build on strong performance
($ in billions) Net Income
$0.5
$1.0
$1.4 $1.4
$1.8$2.1
$2.3 $2.4
2009 2010 2011 2012 2013 2014 2015 2016
CAGR = 26%
Revenue Noninterest Expense
CAGR = 4%
$15.8 $15.9 $15.3 $14.3 $13.3 $13.3 $12.8 $11.8 $10.5 $10.9 $10.9 $10.9 $11.5 $12.0 $12.1 $12.1
2009 2010 2011 2012 2013 2014 2015 2016
CAGR = 2%
2009-2016 CAGR for Non-Commission Expense: +1.0% 2009-2016 CAGR for Broker Commissions: +5.2%
2009 2010 2011 2012 2013 2014 2015 2016
Wells Fargo 2017 Investor Day Wealth and Investment Management 6

-
-
Plan-based solutions have grown recurring revenue
Asset Based Fees 54%
Transaction Based Revenue 13%
Other Non-Recurring Revenue 7%
Net Interest Income 25%
Other Recurring Revenue 1%
25%
54%
1%
13%
7%
2016 Revenue Mix
Recurring Revenue
80%
Asset Based Fees 41%
Transaction Based Revenue 24%
Other Non-Recurring Revenue 13%
Net Interest Income 20%
Other Recurring Revenue 2%
20%
41%2%
24%
13%
2009 Revenue Mix
Recurring Revenue
63%
Wells Fargo 2017 Investor Day Wealth and Investment Management 7

-
Risk management continues to be a focus for WIM
Leadership Governance Oversight
Proactive risk management has always been a priority
Key risk appetite metrics and “Raise Your Hand” team member training originally developed by WIM are used enterprise-wide
Enhanced risk indicators monitor cross-functional risk
Client-facing teams adhere to Know Your Customer, and engage in client listening and response
Chief Compliance Officer role established in 2009
Compliance/Risk committees provide credible challenge to leadership and ensure strong governance of business practices
Centralized Wells Fargo Risk in 2016 has strengthened risk emphasis, alignment and controls
All controls undergo in-depth testing and monitoring
Transparency is maintained with regulators and industry groups
Brokerage sales practices are examined annually by FINRA, with continued satisfactory results
Internal and external auditing provide independent lines of sight
Compensation and partnership structures undergo strict review
Risk capabilities are thoroughly assessed and enhanced regularly
Resulting in solid performance
Net Charge-Off’s Operating Loss (% of Outstanding Loan Balances) (% of Revenue)
3.1%
0.59% 0.3%
2009
2009 2016
2016
Wealth and Investment Management 8 Wells Fargo 2017 Investor Day
-0.01%

Deepening Relationships

-
WIM partnership with the Community Bank is strong
Customer focused
Discussion starts with the customer WIM
Referral-only model for investments Branch & Hub Financial
All sales are reviewed and approved by Advisors
supervisory principals
Community Bank
Premier & Licensed Bankers
Connecting teams across WF to assist customers with all of their
retirement, banking and investing needs
Strong results
Averaged ~$1B/month in closed referred investment assets in 2016, driving growth towards capturing a $2.2T affluent away opportunity(1)
59% of referred investment assets in 2016 were from customers investing with Wells Fargo for first time(2)
95% retention(3) for shared Community Bank/WIM households
Profitability (4)
CB/WIM vs. CB-only
5x higher profit
growth
Brokerage Asset Growth (5)
6% 16%
WIM-Only CB/WIM
Looking ahead
Continue focus on expanding dedicated FA/banker affluent teams
Launch of Intuitive Investor will offer an
Goal: Achieve $2B/month in closed Referred Investment Assets
additional entry point for new investors (1) Affluent away are Retail Banking households with total deposit and investment balances greater than $100,000 but less than $100,000 of deposits and investments with Wells Fargo, as of December 2016. Total deposit and investment balances based on external data sourced from IXI, a division of Equifax, as of December 2015. Affluent away opportunity considers affluent away households acquiring the same level of penetration and average asset balances with Wells Fargo as our current affluent households. (2) Based on all assets referred in 2016. (3) CB/WIM households at December 2015 that were retained in the Community Bank at December 2016. (4) Annual profit growth impacts of adding WIM relationship to retained Retail Bank-only households from December 2015 through December 2016. (5) Growth in brokerage assets from 4Q13 to 4Q16.
Wells Fargo 2017 Investor Day Wealth and Investment Management 10

-
-
Planning helps meet the unique needs of WIM clients
Ultra High Net Worth ($50MM+)
High Net Worth ($5MM - $50MM)
Affluent ($250K - $5MM)
Mass/ Mass Affluent
(< $250K)
$184B
$360B
$876B
$143B
WIM Household
Assets by Client
Segment (1)
Intuitive Investor (coming 3Q17) • Investments • Advice by phone
My Retirement Plan • Retirement savings calculator
• Investments • Goals based cash flow • Full balance sheet (i.e., credit)
• Family office • Financial administration • Trust and administrative • Family dynamics and education • Foundations and endowments
• Estate, tax, insurance • Executive compensation • Multi generational planning • Business succession • Real estate strategies • Philanthropy • Complex liability planning
Envi
sio
n®
(1) Roll up of all WIM client accounts with same address into single entity. Assets include all balances in investments and deposits; including retail retirement and excluding Institutional Retirement Assets and First Clearing.
Wells Fargo 2017 Investor Day Wealth and Investment Management 11

Planning leads to better outcomes for clients and WIM
Benefits for Clients (4)
2016 Best Practices Results
75% of affluent
households have a plan (1)
31% increase in the
number of “well-aligned”
client portfolios to their
plans year-over-year (2)
35% of plans contain full
balance sheet
information; liability
planning has doubled
since 2012 (3)
Greater asset growth
Households with a plan had 5.6% asset growth
vs. 3.1% for households without a plan (5)
Distribution of returns closer to benchmark
72% of accounts in “aligned” plans performed within 3% of their
benchmark vs. only 64% of accounts without a plan (2)
Benefits for WIM/Wells Fargo
Greater client loyalty and likelihood to recommend
Clients who report having an up-to-date plan are 21% more loyal
to FA than other clients and 15% more likely to recommend (6)
Higher client retention
– Households with a plan had 41% better client retention (5)
– Households with a plan stay 6 years longer on average (5)
Revenue lift
Households with a plan had 53% faster revenue growth (5)
(1) WIM HHs with >$250k in investible assets; excludes IPCS, FCCS, and WellsTrade. (2) The definition of “well-aligned” is a measure of how closely a client’s actual asset allocation aligns with his/her strategic asset allocation; a higher degree of portfolio alignment increases the probability of a client achieving his/her investment goals. Based on 3 years of performance through the end of 1Q17. (3) Source: WFA Innovation & Strategy Analytics. (4) Benefits for clients with a plan compared to clients without a plan. (5) Asset and revenue growth rate is the compound annual growth rate between Jan 2012 and Dec 2016. (6) Fall 2016 Client Listening Program (proprietary client satisfaction survey).
Wealth and Investment Management 12 Wells Fargo 2017 Investor Day

Revitalizing Our Asset
Management Business

2016 Long Term & Stable Value AUM (1) $378B
2016 Money Market AUM $104B
-
Wells Fargo Asset Management has a strong foundation
Established Scale Business
WFAM AUM ($B) (1999-2016)
1999 2004 2009 2014
Money Markets
Long-Term Mutual Funds & Stable Value
- =
=
Diversified Client Base
$482B AUM 68% Institutional
17% Defined Contribution 15% Intermediary
Diversified Investment Capabilities
Strong Performance
Long-Term Mutual Fund strategies vs. peers on a 10-year basis (2)
Consistent Growth
15-Yr. Long-Term & Stable Value AUM (3)
Core Strengths
2016 AUM
Money Market=$104B
Long-Term & Stable Value=$378B
Fundamental Systematic(1) Multi Asset Solutions
Liquidity
49% 6% 6% 38%
CAGR= 19%
Top
36% ranking
Data as of 12/31/16. (1) Systematic defined as quantitative factor-based strategies. (2) Asset-weighted 10-year percentile ranking; Morningstar Direct. (3) Includes acquisitions.
Wells Fargo 2017 Investor Day Wealth and Investment Management 14
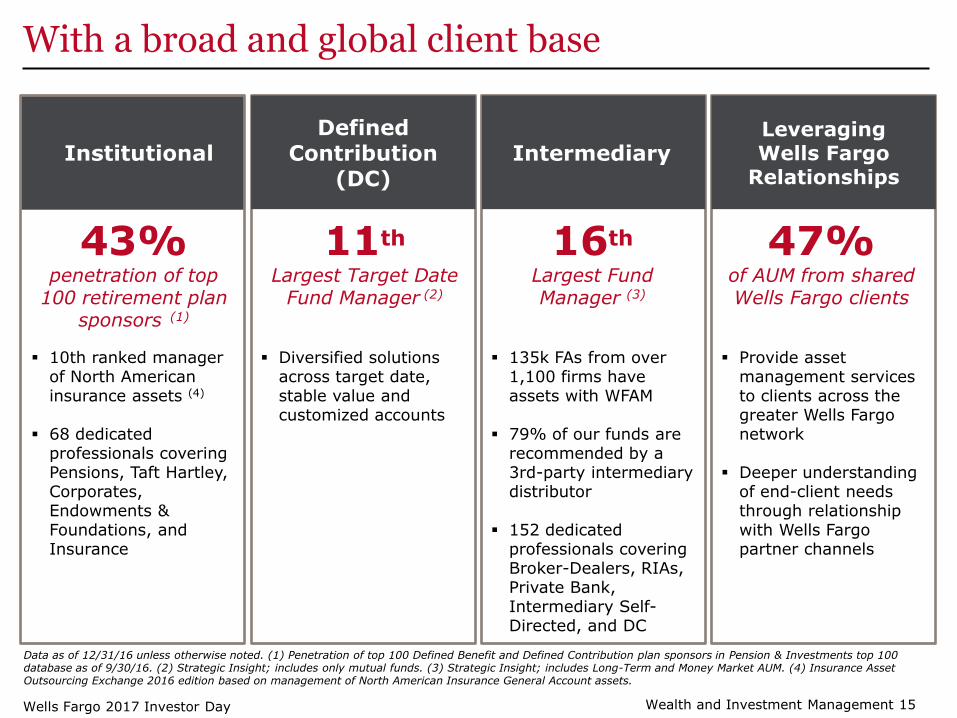
With a broad and global client base
Institutional Defined
Contribution (DC)
Intermediary Leveraging Wells Fargo
Relationships
43% penetration of top
100 retirement plan sponsors (1)
10th ranked manager of North American insurance assets (4)
68 dedicated professionals covering Pensions, Taft Hartley, Corporates, Endowments & Foundations, and Insurance
Diversified solutions across target date, stable value and customized accounts
11th
Largest Target Date Fund Manager (2)
135k FAs from over 1,100 firms have assets with WFAM
79% of our funds are recommended by a 3rd-party intermediary distributor
152 dedicated professionals covering Broker-Dealers, RIAs, Private Bank, Intermediary Self-Directed, and DC
16th
Largest Fund Manager (3)
47% of AUM from shared Wells Fargo clients
Provide asset management services to clients across the greater Wells Fargo network
Deeper understanding of end-client needs through relationship with Wells Fargo partner channels
Data as of 12/31/16 unless otherwise noted. (1) Penetration of top 100 Defined Benefit and Defined Contribution plan sponsors in Pension & Investments top 100 database as of 9/30/16. (2) Strategic Insight; includes only mutual funds. (3) Strategic Insight; includes Long-Term and Money Market AUM. (4) Insurance Asset Outsourcing Exchange 2016 edition based on management of North American Insurance General Account assets.
Wealth and Investment Management 15 Wells Fargo 2017 Investor Day

-
- -
- -
2016
Our investment platform is robust and diversified
Fundamental ($237B)
Systematic (1)
Quantitative factor based ($30B)
Multi-Asset Solutions
($31B)
Liquidity ($184B)
Equity Fixed Alternatives Equity Fixed Alternatives Allocation Stable Value
Annualized excess returns (Asset weighted 10 year % where available) (2)
1.82 0.94 3.02 0.88 1.17 3.80 (3) 0.52 (4)
Ranking by peer category (Asset weighted 10 year percentile) (5)
Top 29% 26% 27% 38% 52% 39%(3) 50% (6)
#1 in US stable value AUM
Money Markets
Awards and recognition largest 10th money
1 Lipper 7th largest Rock Creek Two-time winner of Graham & Dodd 6 Lipper market award in muni fund founder awards in 2017
Three-time winner of Fabozzi/ Levy fund provider awarded family Awards for research and whitepapers
Institutional 2 Lipper
Investor awards in Lifetime 2017 Achievement
6 Lipper Award in
awards in 2016
2016 Data as of 12/31/16 unless otherwise noted. (1) Systematic defined as quantitative factor-based strategies. (2) eVestment Alliance. Asset weighted excess return calculated gross of fees versus stated benchmark on an annualized 10-year basis for separate accounts unless otherwise stated. (3) Calculated based on 5-year performance; Analytic Investors Covered Call strategy is classified as an alternative and its excess return is calculated versus the CBOE S&P BuyWrite Index, and it is ranked within the eVestment Covered Call category. (4) Morningstar Direct. Calculated based on mutual fund vehicles. (5) eVestment Alliance. Based on category ranking versus separate account peers on a 10-year basis unless otherwise stated. (6) Morningstar Direct. Calculated based on net returns of mutual fund vehicles.
Wealth and Investment Management 16 Wells Fargo 2017 Investor Day

-
Building a winning active management business...
Two Asset Manager Archetypes
Creators must adapt
Replicator Creator
Description
Size
Competitive Advantage
Value Proposition
Focus on providing Focus on Delivers alpha and efficient betas,
beta exposures by generating alpha priced to reflect amount and type of
replicating common or creating more expected return
indices efficient betas
Typically smaller Strategy size varies based on Almost always
by strategy than orientation (Sharpe ratio vs. large in total and
the replicator but information ratio-focused) and firm size by strategy
varies in total size dependent on mix and breadth
Top talent to Top talent to deliver investment Efficiency through
deliver acumen supported by scale; value chain
investment data/technology; disciplined optimization
acumen capacity management
Low Fees Performance Value for fees
Wells Fargo 2017 Investor Day Wealth and Investment Management 17
Next-Gen Creator

...by focusing our efforts
WFAM Strategic Priorities
Description Progress to Date
Systematic Capabilities
Multi-Asset Solutions
Fundamental Investment Capabilities
Strategic Segments
Build-out systematic factor-based Acquired Analytic Investors ($18B
investment capabilities to generate more AUM, 20+ year track record) efficient betas
Acquired Golden Capital ($7B AUM, 20+ Provides an offering that is cost-competitive
year track record) with plain vanilla passive
Hired Nico Marais, former head of Multi- Enhance existing multi-asset capabilities and
Asset Investment and Portfolio Solutions solutions/advisory expertise
at Schroders
Continue relentless focus on performance and value for fees
Employ rigorous analytics to focus managers in areas where they have skill, and in constructing better portfolios
Complement fundamental insights with signals derived from new data sources and quantitative techniques
Strengthen overall value proposition in Defined Contribution
Build out Environmental, Social, and Corporate Governance (ESG) capabilities
Strengthen internal Wells Fargo partnerships
Building out scientific research team and enhancing portfolio risk management and analytics team
Hired Fredrik Axsater, former global head of Defined Contribution and ESG at SSgA
Wells Fargo 2017 Investor Day Wealth and Investment Management 18

We are charting a course to propel WFAM forward
Key hire
Capability expansion
Strategy & organization
Kristi Mitchem hired as WFAM CEO
LEGEND
Established unified WFAM organization and brand
2016 2Q 3Q 4Q
Acquired Analytic Investors
Defined WFAM’s growth strategy
Nico Marais hired as Head of Multi-Asset Solutions
2017
Fredrik Axsater hired as Head of Strategic Business Segments
Acquired 100% stake in Golden Capital
Wealth and Investment Management 19 Wells Fargo 2017 Investor Day

Looking Ahead

-
Continued progress towards WIM long-term targets
24%
1% Revenue Growth
Pretax Margin
80%Recurring Revenue
30%
4 6%
80%+
2016 Results
Long-Term Targets
23%
4%
79%
2014-2016 Average Results
Wells Fargo 2017 Investor Day Wealth and Investment Management 21

Biography

David M. Carroll Senior Executive Vice President
Head of Wealth and Investment Management
David Carroll leads Wealth and Investment Management (WIM) at Wells Fargo.
Approximately 36,000 team members in this unit provide a full range of
personalized wealth management, investment, and retirement products and
services to clients across U.S.-based businesses.
A financial services veteran with more than 35 years in the industry, David
joined Wachovia Bank & Trust Company in 1979 and then First Union National
Bank (Wachovia’s predecessor) in 1981. From 2005 until the merger with Wells
Fargo, Mr. Carroll served as senior executive vice president and head of
Wachovia’s Capital Management Group, which included retail brokerage
(Wachovia Securities), asset management (Evergreen Investments), and
Retirement and Investment Products. Previously, he was head of corporate
services and merger integration, chief of eCommerce and technology, and head
of First Union’s General Banking Group region in Florida and earlier in Georgia.
David earned his bachelor’s degree in business administration from the
University of North Carolina at Chapel Hill. He is a board member of Trees
Charlotte, the UNC Chapel Hill Foundation, and the Chapel Hill Investment
Fund. He also serves on the Board of Visitors at the Kenan-Flagler Business
School at the University of North Carolina.
Wells Fargo 2017 Investor Day Wealth and Investment Management 23