Embed Size (px)
Citation preview
2
We would like to express our sincere thanks to
IEITI team, for supporting and assisting us in
meeting arrangements with major governments
officials, and reporting entities and its various
organizations and agencies, and for sending and
receiving official confirmation letters to/from
these parties
Acknowledgemnet
3
Iraqi Extractive Industries Transparency Initiative
Content Page Number
Term & Abbreviations …………………………………................. 4
Executive Summary ………………………………...................... 8
Introduction ……………………………………………………....... 22
1. Transparency Initiative in Iraq …………….………………...... 24
2. Legal framework ………………………………........................ 29
3. Exploration & Production ……………………………………… 46
4. Revenue Collection .……...……………………....................... 89
5. Revenue Allocation ……………………………....................... 110
6. Social & Economic Spending …………………...................... 118
7. Impacts ………………………………………………………….. 128
Kurdistan Region …....……………………………..….….…..…... 137
Annexes ……………………………………………...................... 148
4
Iraqi Extractive Industries Transparency Initiative
Term & Abbreviations
5
Iraqi Extractive Industries Transparency Initiative
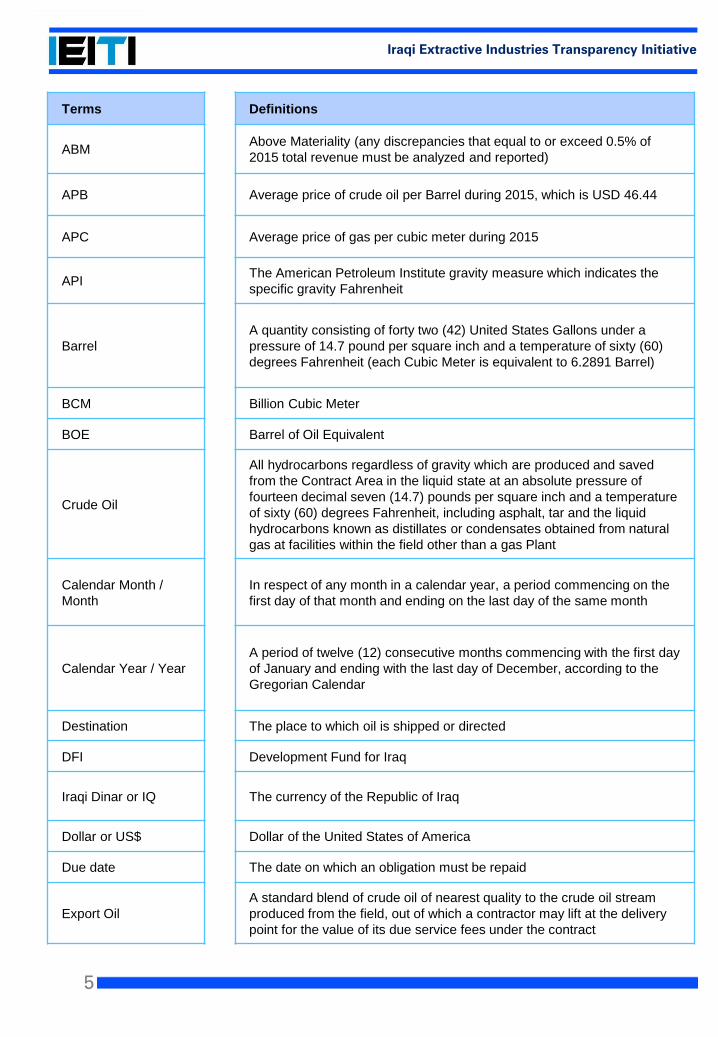
Terms Definitions
ABMAbove Materiality (any discrepancies that equal to or exceed 0.5% of
2015 total revenue must be analyzed and reported)
APB Average price of crude oil per Barrel during 2015, which is USD 46.44
APC Average price of gas per cubic meter during 2015
APIThe American Petroleum Institute gravity measure which indicates the
specific gravity Fahrenheit
Barrel
A quantity consisting of forty two (42) United States Gallons under a
pressure of 14.7 pound per square inch and a temperature of sixty (60)
degrees Fahrenheit (each Cubic Meter is equivalent to 6.2891 Barrel)
BCM Billion Cubic Meter
BOE Barrel of Oil Equivalent
Crude Oil
All hydrocarbons regardless of gravity which are produced and saved
from the Contract Area in the liquid state at an absolute pressure of
fourteen decimal seven (14.7) pounds per square inch and a temperature
of sixty (60) degrees Fahrenheit, including asphalt, tar and the liquid
hydrocarbons known as distillates or condensates obtained from natural
gas at facilities within the field other than a gas Plant
Calendar Month /
Month
In respect of any month in a calendar year, a period commencing on the
first day of that month and ending on the last day of the same month
Calendar Year / Year
A period of twelve (12) consecutive months commencing with the first day
of January and ending with the last day of December, according to the
Gregorian Calendar
Destination The place to which oil is shipped or directed
DFI Development Fund for Iraq
Iraqi Dinar or IQ The currency of the Republic of Iraq
Dollar or US$ Dollar of the United States of America
Due date The date on which an obligation must be repaid
Export Oil
A standard blend of crude oil of nearest quality to the crude oil stream
produced from the field, out of which a contractor may lift at the delivery
point for the value of its due service fees under the contract
6
Iraqi Extractive Industries Transparency Initiative
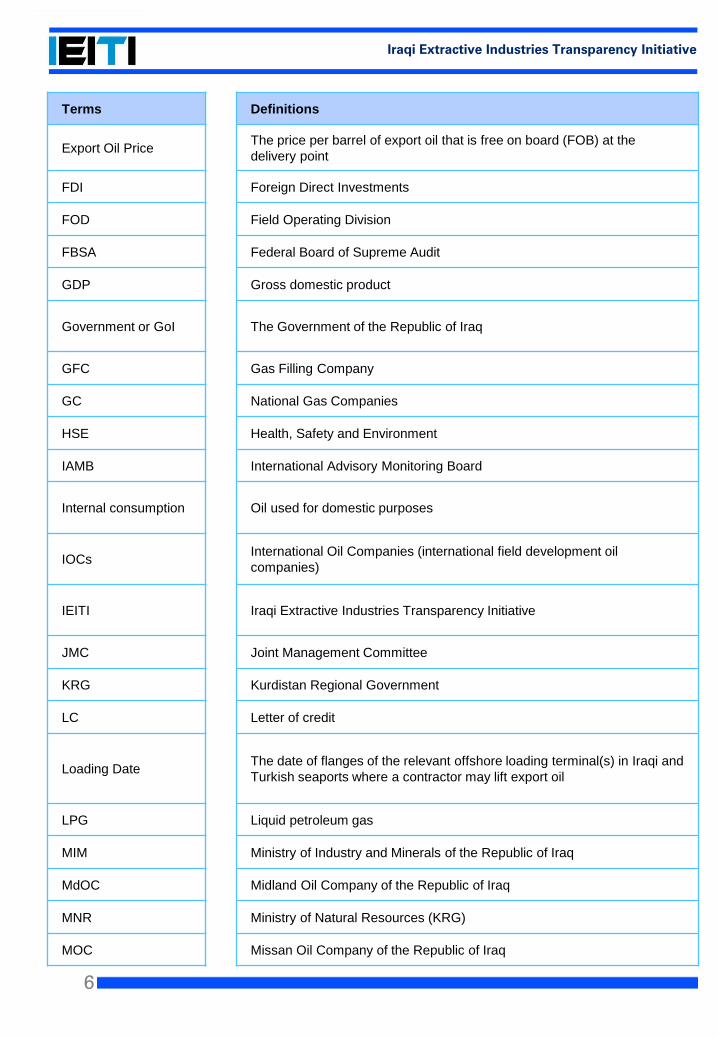
Terms Definitions
Export Oil PriceThe price per barrel of export oil that is free on board (FOB) at the
delivery point
FDI Foreign Direct Investments
FOD Field Operating Division
FBSA Federal Board of Supreme Audit
GDP Gross domestic product
Government or GoI The Government of the Republic of Iraq
GFC Gas Filling Company
GC National Gas Companies
HSE Health, Safety and Environment
IAMB International Advisory Monitoring Board
Internal consumption Oil used for domestic purposes
IOCsInternational Oil Companies (international field development oil
companies)
IEITI Iraqi Extractive Industries Transparency Initiative
JMC Joint Management Committee
KRG Kurdistan Regional Government
LC Letter of credit
Loading DateThe date of flanges of the relevant offshore loading terminal(s) in Iraqi and
Turkish seaports where a contractor may lift export oil
LPG Liquid petroleum gas
MIM Ministry of Industry and Minerals of the Republic of Iraq
MdOC Midland Oil Company of the Republic of Iraq
MNR Ministry of Natural Resources (KRG)
MOC Missan Oil Company of the Republic of Iraq
7
Iraqi Extractive Industries Transparency Initiative
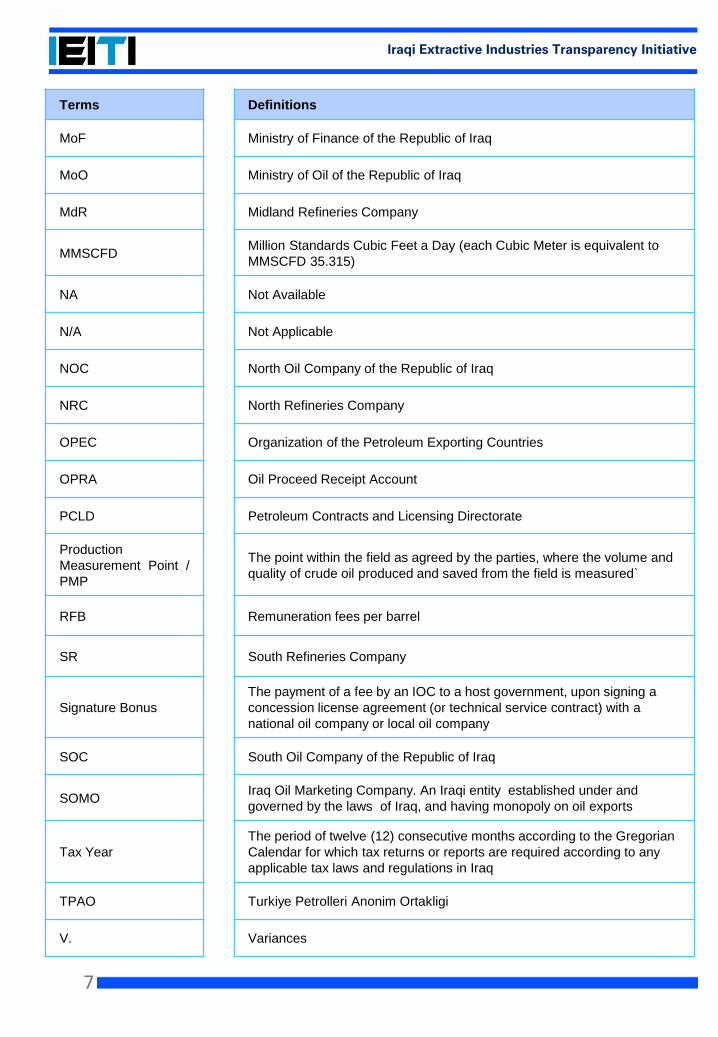
Terms Definitions
MoF Ministry of Finance of the Republic of Iraq
MoO Ministry of Oil of the Republic of Iraq
MdR Midland Refineries Company
MMSCFDMillion Standards Cubic Feet a Day (each Cubic Meter is equivalent to
MMSCFD 35.315)
NA Not Available
N/A Not Applicable
NOC North Oil Company of the Republic of Iraq
NRC North Refineries Company
OPEC Organization of the Petroleum Exporting Countries
OPRA Oil Proceed Receipt Account
PCLD Petroleum Contracts and Licensing Directorate
Production
Measurement Point /
PMP
The point within the field as agreed by the parties, where the volume and
quality of crude oil produced and saved from the field is measured`
RFB Remuneration fees per barrel
SR South Refineries Company
Signature Bonus
The payment of a fee by an IOC to a host government, upon signing a
concession license agreement (or technical service contract) with a
national oil company or local oil company
SOC South Oil Company of the Republic of Iraq
SOMOIraq Oil Marketing Company. An Iraqi entity established under and
governed by the laws of Iraq, and having monopoly on oil exports
Tax Year
The period of twelve (12) consecutive months according to the Gregorian
Calendar for which tax returns or reports are required according to any
applicable tax laws and regulations in Iraq
TPAO Turkiye Petrolleri Anonim Ortakligi
V. Variances
8
Iraqi Extractive Industries Transparency Initiative
Executive summary
9
Iraqi Extractive Industries Transparency Initiative
Back in May 2008, the Government of Iraq made a commitment to implement EITI
standards. In January 2010, the Prime Minister of Iraq declared Iraq's commitment to EITI,
and EITI Board announced that Iraq became an EITI candidate country in March 2010. In
December 2012, Iraq became a compliant member of EITI after meeting all the standards
and the requirements, including verification.
The objective of the IEITI report is to collect, review and reconcile the payments and
revenues from the extractive industries during the year of 2015 in accordance with EITI
standards, agreed scope in the Terms of Reference (ToRs) and the approved inception
report dated June 8th 2016, which included the tools and tables approved by the MSG to
be used for data collection.
This report summarizes the results of reconciliation for the year 2015, in addition to,
information pertaining to the Oil and Gas Sector and the Extractive Industries in Iraq,
including Mining. However, it does not include the reconciliations of data related to the
Extractive Industries (including oil and gas) in Kurdistan Region. Such data was requested
from Kurdistan Regional Government, but it was not provided at the date of this report, and
therefore, IEITI MSG requested the inclusion and use of publicly available information on
the Extractive Industries in KRG. Accordingly, information pertaining to KRG were not
subject to data collection and reporting approach adopted for producing the rest of the IEITI
2015 report.
The project approach is in line with the 2016 EITI Standards and with the MSG’s agreed
objectives and expectations regarding the IEITI process. The project approach consists of
the following:
• Preliminary Analysis to produce an inception report in accordance with EITI
requirements;
• Data collection;
• Initial reconciliation and investigation of discrepancies;
• Producing the draft report;
• Drafting the Final report and executive summary. The work must be independent and
performed in a manner consistent with the criteria specified in the 2016 EITI Standards
and other detailed requirements as outlined in the ToRs specified in the following
inception report link: http://ieiti.org.iq/ArticleShow.aspx?ID=112.
1. Scope and Objectives
10
Iraqi Extractive Industries Transparency Initiative
2. Institutional Framework for the oil and gas Sector in Iraq
2.1 Government
• Ministry of Finance
• Ministry of Industry and Minerals
• General Commission for Taxes
• Ministry of Electricity
• Ministry of Oil, which includes (for example, but not limited to):
- Oil Pipelines Company
- Iraqi Drilling Company
- Oil Exploration Company
- Oil Product Distribution Company
- Petroleum Contracts & Licensing Directorate.
2.2 Oil Marketing Company (SOMO)
SOMO is considered to be one of the most important companies in the Iraqi oil sector. It is
an official company legally authorized to negotiate Iraqi crude oil sales contracts as well
as oil products’ contracts in accordance with international standards.
SOMO is specialized in the marketing of Iraqi crude oil through the export terminals, such
as (Basrah Port by SPM, Khor Al-Amaya Port and SPMs, and Ceyhan Port).
SOMO also manages the import of some refined oil products for Internal consumption
needs, and it provides its consumers with Kerosene, Gasoline, LPG and Gas oil according
to the local market needs.
2.3 Oil Refineries
There are three major refining companies operating in Iraq as following:
2.3.1 South Refineries Company
South Refineries Company was founded in 1969 through the establishment of Basra
refinery, which actually began production in 1974. It is one of the major manufacturing units
in the country where it uses the latest scientific methods and advanced technology in the
production of oil derivatives . (1)
(1) http://www.src.gov.iq/en/about_us
11
Iraqi Extractive Industries Transparency Initiative
2.3.2 North Refineries Company
North Refineries Company is the biggest refining company among other ministry of oil
companies. The company has the capability of refining a total of (402,000) barrels of
crude oil per day. It was established according to law no. 101 for year 1976.
Refineries operating under North Refineries Company are: (2)
- NORTH Refinery, with a capacity of 170,000 barrels per day (BPD).
- SALAHUDIN I, with a capacity of 70,000 barrels per day.
- SALAHUDIN II, with a capacity of 70,000 barrels per day.
- LUBE PLANT (two trains): 125,000 tons of different lube stocks per train.
The company produces different types of products, such as: unleaded gasoline,
illuminating kerosene, ATK, diesel, lube oil products, spindle oil ,transformer oil,
Asphalt, sulfur, LPG, RT, etc.
The company also has small packages units, powered by the NRC administration as
following:
- Kirkuk Refinery (30,000 BPD).
- KASAK Refinery (10,000 BPD).
- Siniya Refinery (20,000 BPD).
- Hadeetha Refinery (16 000 BPD).
- Qayara Refinery (16,000 BPD).
It is worth mentioning that (salahudin I, salahudin II, Qayara, Hadeetha, siniya, North
refinery) refining capacities have been damaged significantly since 2014 due to threats
and attacks.
2.3.3 Midland Refineries Company
Midland Refineries Company is one of the major refining companies operating in Iraq. It is
governed by the Iraqi Ministry of Oil and consists of Daura Refinery and other Refineries.
The Daura refinery was built in 1953 and began operations in 1955. At full capacity, it can
process 210,000 barrels per day. Other Refineries operating under Midland Refineries
Company are: (3)
- Najaf Refinery, with a refining capacity of 30,000 barrels per day.
- Samawah Refinery, with a refining capacity of 30,000 barrels per day.
- Diwaniya Refinery, with a refining capacity of 20,000 barrels per day.
(2) http://www.nrc.oil.gov.iq/english/home.htm
(3) http://iraqministryofoil.com/midland-refineries-company-tenders-iraq/
12
Iraqi Extractive Industries Transparency Initiative
2.4. National Oil Companies
2.4.1 North Oil Company (NOC) is a state company within the Ministry of Oil of Iraq. It
operates in the upstream function of oil and gas. The company’s geographical operation
area spans in the following governorates: Kirkuk, Nineveh, Erbil, Diyala. (4)
(4) http://www.noc.oil.gov.iq/english_ver/homepage_en.htm
(5) https://en.wikipedia.org/wiki/South_Oil_Company
(6) https://en.wikipedia.org/wiki/Missan_Oil_Company
http://moc.oil.gov.iq/index.php/2015-05-06-05-54-50
(7) https://en.wikipedia.org/wiki/Midland_Oil_Company
http://mdoc.oil.gov.iq/index.php?name=Pages&op=page&pid=96
2.4.2 South Oil Company (SOC) South oil company is one of the major fundamental
formations of Iraqi national oil company (INOC), It was the basis of national direct
investment projects in the 1970s, where the SOC used to be a subsidiary to the national
oil company. (5)
2.4.3 Missan Oil Company (MOC) is a state-owned oil company located in the Missan
Governorate. It was dissociated from South Oil Company in 2008 to expand oil activities
in Missan and to set up joint ventures with international companies to develop the
provinces’ oil fields. MOC is responsible for the fields in Missan province, which includes
many producing fields such as Bazergan, Abu-Gharb, Fakka and Halfaya. (6)
2.4.4 Midland Oil Company (MdOC) is a state-owned oil company, and it is the fourth
Iraqi upstream oil company. East Baghdad field is considered as the most important fields
under Midland Oil Company. There are more than 30 oil and gas fields that are located
within the area of operations of the company, in addition to about 60 geological blocks
which have not been explored yet. (7)
2.5. International Oil Companies (IOC’s)
2.5.1 International Oil Companies (IOCs) operating in Iraq under licenses granted by the
Iraqi Ministry of Oil are:
• BP
• Japex
• ExxonMobil
• TPAO
• Pakistan Petroleum
Ltd
• JsocBashneft
• Petrochina
• Eni
• Sonangol
• Gasprom
• Kuwait Energy Co.
• Inpex Corp.
• Dragon Oil Holding Ltd
• CNOOCI
• Premier Oil Pic
• Total
• Lukoil
• Kogas
• Lukoil overseas
exploration Iraq
• PetronasShell West
Qurna B.V Shell Iraq
Petroleum
13
Iraqi Extractive Industries Transparency Initiative
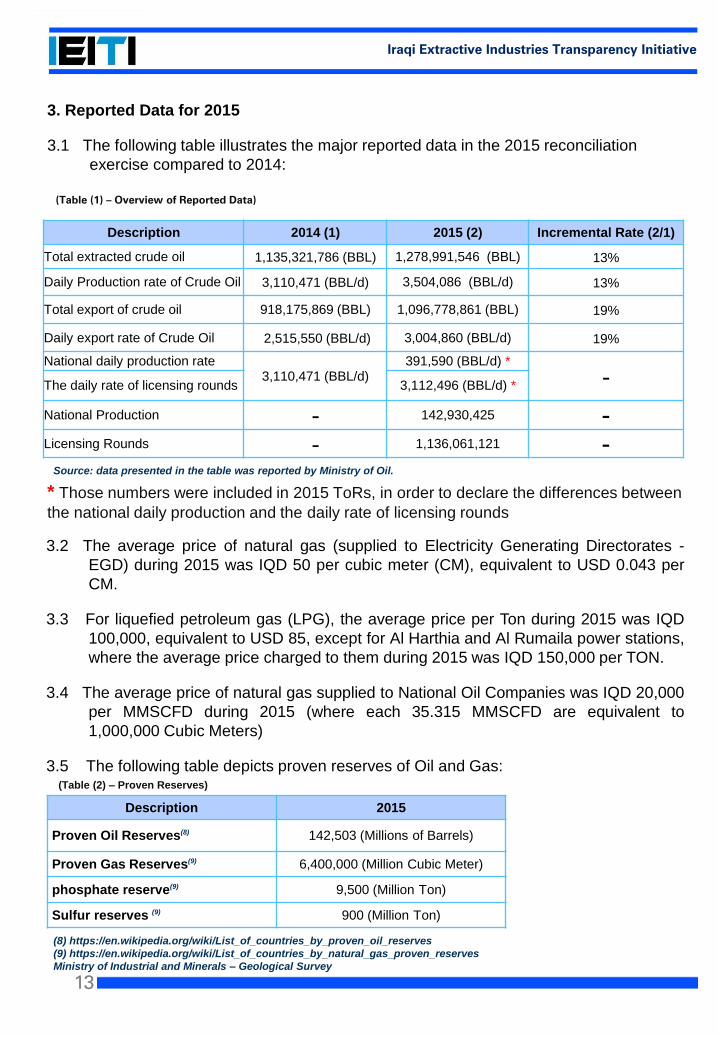
Description 2015
Proven Oil Reserves(8) 142,503 (Millions of Barrels)
Proven Gas Reserves(9) 6,400,000 (Million Cubic Meter)
phosphate reserve(9) 9,500 (Million Ton)
Sulfur reserves (9) 900 (Million Ton)
3. Reported Data for 2015
3.1 The following table illustrates the major reported data in the 2015 reconciliation
exercise compared to 2014:
* Those numbers were included in 2015 ToRs, in order to declare the differences between
the national daily production and the daily rate of licensing rounds
Description 2014 (1) 2015 (2) Incremental Rate (2/1)
Total extracted crude oil 1,135,321,786 (BBL) 1,278,991,546 (BBL) 13%
Daily Production rate of Crude Oil 3,110,471 (BBL/d) 3,504,086 (BBL/d) 13%
Total export of crude oil 918,175,869 (BBL) 1,096,778,861 (BBL) 19%
Daily export rate of Crude Oil 2,515,550 (BBL/d) 3,004,860 (BBL/d) 19%
National daily production rate3,110,471 (BBL/d)
391,590 (BBL/d) *
-The daily rate of licensing rounds 3,112,496 (BBL/d) *
National Production - 142,930,425 -Licensing Rounds - 1,136,061,121 -
(Table (1) – Overview of Reported Data)
Source: data presented in the table was reported by Ministry of Oil.
3.2 The average price of natural gas (supplied to Electricity Generating Directorates -
EGD) during 2015 was IQD 50 per cubic meter (CM), equivalent to USD 0.043 per
CM.
3.3 For liquefied petroleum gas (LPG), the average price per Ton during 2015 was IQD
100,000, equivalent to USD 85, except for Al Harthia and Al Rumaila power stations,
where the average price charged to them during 2015 was IQD 150,000 per TON.
3.4 The average price of natural gas supplied to National Oil Companies was IQD 20,000
per MMSCFD during 2015 (where each 35.315 MMSCFD are equivalent to
1,000,000 Cubic Meters)
3.5 The following table depicts proven reserves of Oil and Gas:(Table (2) – Proven Reserves)
(8) https://en.wikipedia.org/wiki/List_of_countries_by_proven_oil_reserves
(9) https://en.wikipedia.org/wiki/List_of_countries_by_natural_gas_proven_reserves
Ministry of Industrial and Minerals – Geological Survey
14
Iraqi Extractive Industries Transparency Initiative
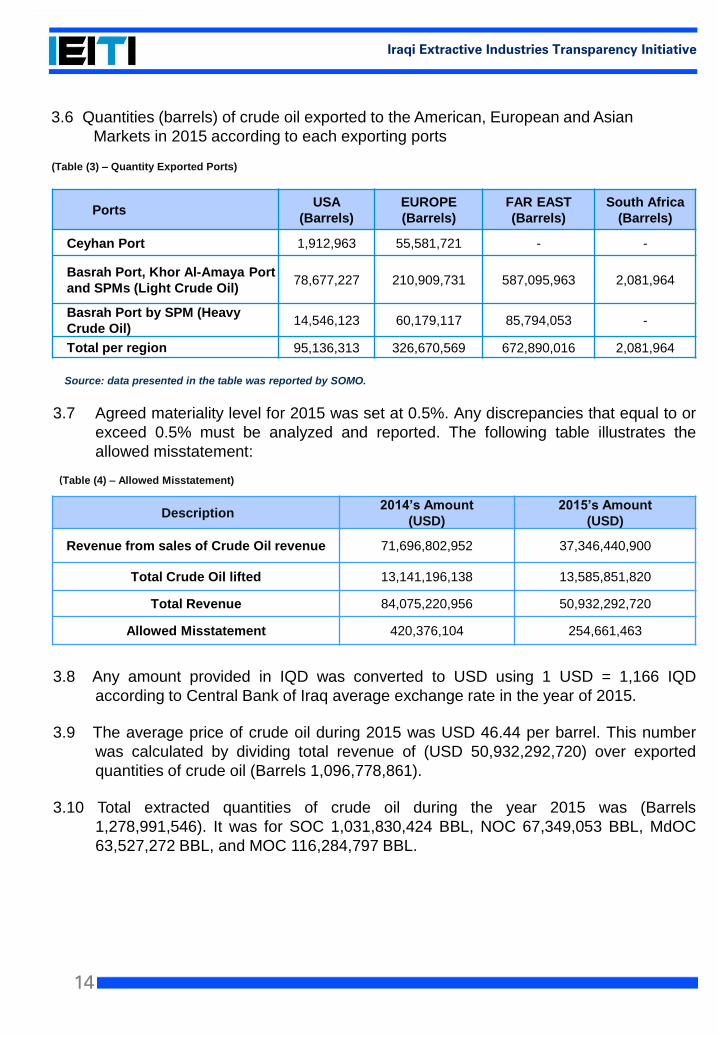
3.6 Quantities (barrels) of crude oil exported to the American, European and Asian
Markets in 2015 according to each exporting ports
Ports USA
(Barrels)
EUROPE
(Barrels)
FAR EAST
(Barrels)
South Africa
(Barrels)
Ceyhan Port 1,912,963 55,581,721 - -
Basrah Port, Khor Al-Amaya Port
and SPMs (Light Crude Oil)78,677,227 210,909,731 587,095,963 2,081,964
Basrah Port by SPM (Heavy
Crude Oil)14,546,123 60,179,117 85,794,053 -
Total per region 95,136,313 326,670,569 672,890,016 2,081,964
(Table (3) – Quantity Exported Ports)
Source: data presented in the table was reported by SOMO.
3.7 Agreed materiality level for 2015 was set at 0.5%. Any discrepancies that equal to or
exceed 0.5% must be analyzed and reported. The following table illustrates the
allowed misstatement:
3.8 Any amount provided in IQD was converted to USD using 1 USD = 1,166 IQD
according to Central Bank of Iraq average exchange rate in the year of 2015.
3.9 The average price of crude oil during 2015 was USD 46.44 per barrel. This number
was calculated by dividing total revenue of (USD 50,932,292,720) over exported
quantities of crude oil (Barrels 1,096,778,861).
3.10 Total extracted quantities of crude oil during the year 2015 was (Barrels
1,278,991,546). It was for SOC 1,031,830,424 BBL, NOC 67,349,053 BBL, MdOC
63,527,272 BBL, and MOC 116,284,797 BBL.
Description2014’s Amount
(USD)
2015’s Amount
(USD)
Revenue from sales of Crude Oil revenue 71,696,802,952 37,346,440,900
Total Crude Oil lifted 13,141,196,138 13,585,851,820
Total Revenue 84,075,220,956 50,932,292,720
Allowed Misstatement 420,376,104 254,661,463
(Table (4) – Allowed Misstatement)
15
Iraqi Extractive Industries Transparency Initiative
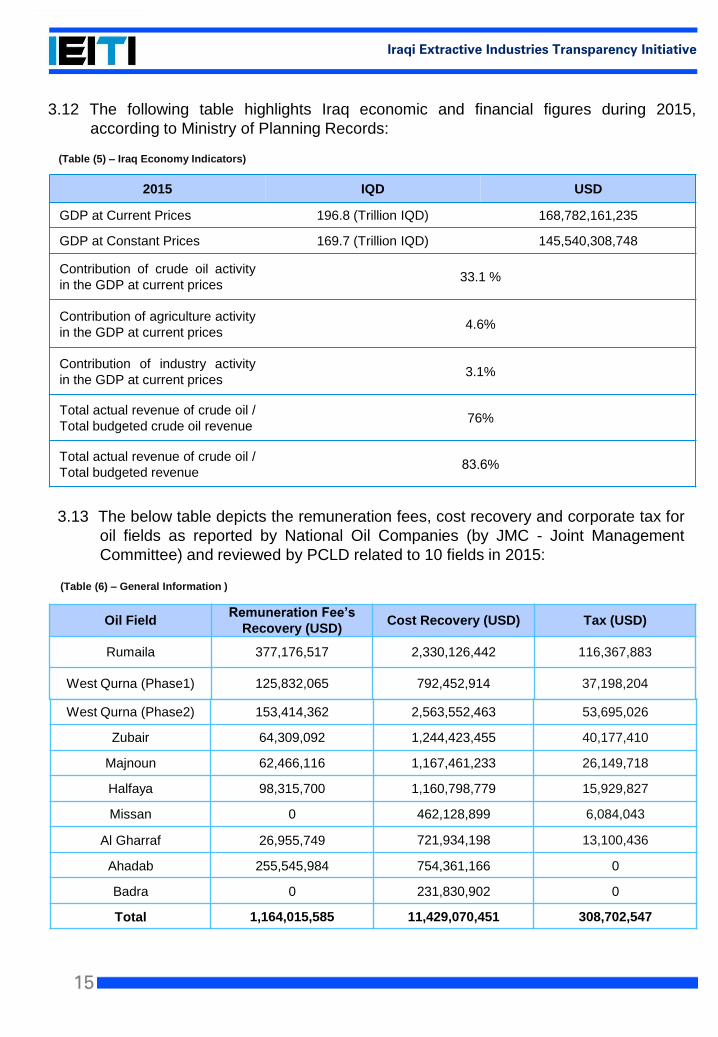
3.12 The following table highlights Iraq economic and financial figures during 2015,
according to Ministry of Planning Records:
2015 IQD USD
GDP at Current Prices 196.8 (Trillion IQD) 168,782,161,235
GDP at Constant Prices 169.7 (Trillion IQD) 145,540,308,748
Contribution of crude oil activity
in the GDP at current prices33.1 %
Contribution of agriculture activity
in the GDP at current prices4.6%
Contribution of industry activity
in the GDP at current prices3.1%
Total actual revenue of crude oil /
Total budgeted crude oil revenue76%
Total actual revenue of crude oil /
Total budgeted revenue83.6%
(Table (5) – Iraq Economy Indicators)
3.13 The below table depicts the remuneration fees, cost recovery and corporate tax for
oil fields as reported by National Oil Companies (by JMC - Joint Management
Committee) and reviewed by PCLD related to 10 fields in 2015:
(Table (6) – General Information )
Oil FieldRemuneration Fee’s
Recovery (USD)Cost Recovery (USD) Tax (USD)
Rumaila 377,176,517 2,330,126,442 116,367,883
West Qurna (Phase1) 125,832,065 792,452,914 37,198,204
West Qurna (Phase2) 153,414,362 2,563,552,463 53,695,026
Zubair 64,309,092 1,244,423,455 40,177,410
Majnoun 62,466,116 1,167,461,233 26,149,718
Halfaya 98,315,700 1,160,798,779 15,929,827
Missan 0 462,128,899 6,084,043
Al Gharraf 26,955,749 721,934,198 13,100,436
Ahadab 255,545,984 754,361,166 0
Badra 0 231,830,902 0
Total 1,164,015,585 11,429,070,451 308,702,547
16
Iraqi Extractive Industries Transparency Initiative
Oil FieldsNumber of Iraqi
Employees (1)
Number of Foreign
Employees (2)
Total Number of
Employees (1+2)
Ratio (1 / Total
Employees)
Total 16,914 6,913 23,827 71%
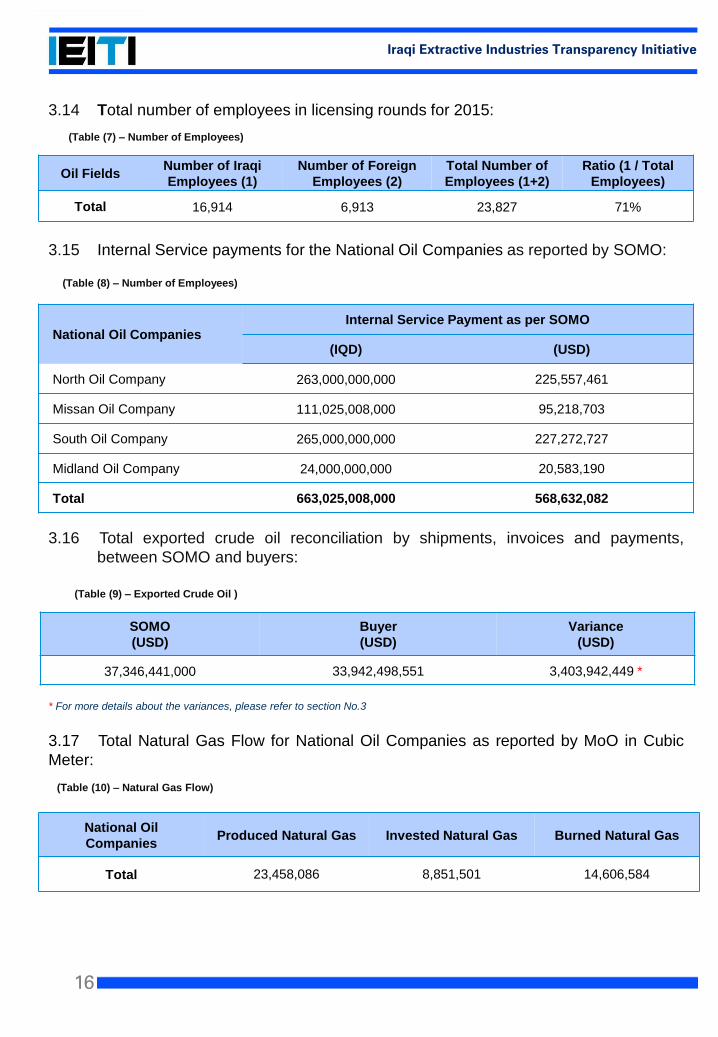
3.14 Total number of employees in licensing rounds for 2015:
(Table (7) – Number of Employees)
3.15 Internal Service payments for the National Oil Companies as reported by SOMO:
3.16 Total exported crude oil reconciliation by shipments, invoices and payments,
between SOMO and buyers:
* For more details about the variances, please refer to section No.3
3.17 Total Natural Gas Flow for National Oil Companies as reported by MoO in Cubic
Meter:
National Oil CompaniesInternal Service Payment as per SOMO
(IQD) (USD)
North Oil Company 263,000,000,000 225,557,461
Missan Oil Company 111,025,008,000 95,218,703
South Oil Company 265,000,000,000 227,272,727
Midland Oil Company 24,000,000,000 20,583,190
Total 663,025,008,000 568,632,082
(Table (8) – Number of Employees)
SOMO
(USD)
Buyer
(USD)
Variance
(USD)
37,346,441,000 33,942,498,551 3,403,942,449 *
(Table (9) – Exported Crude Oil )
National Oil
Companies Produced Natural Gas Invested Natural Gas Burned Natural Gas
Total 23,458,086 8,851,501 14,606,584
(Table (10) – Natural Gas Flow)
17
Iraqi Extractive Industries Transparency Initiative
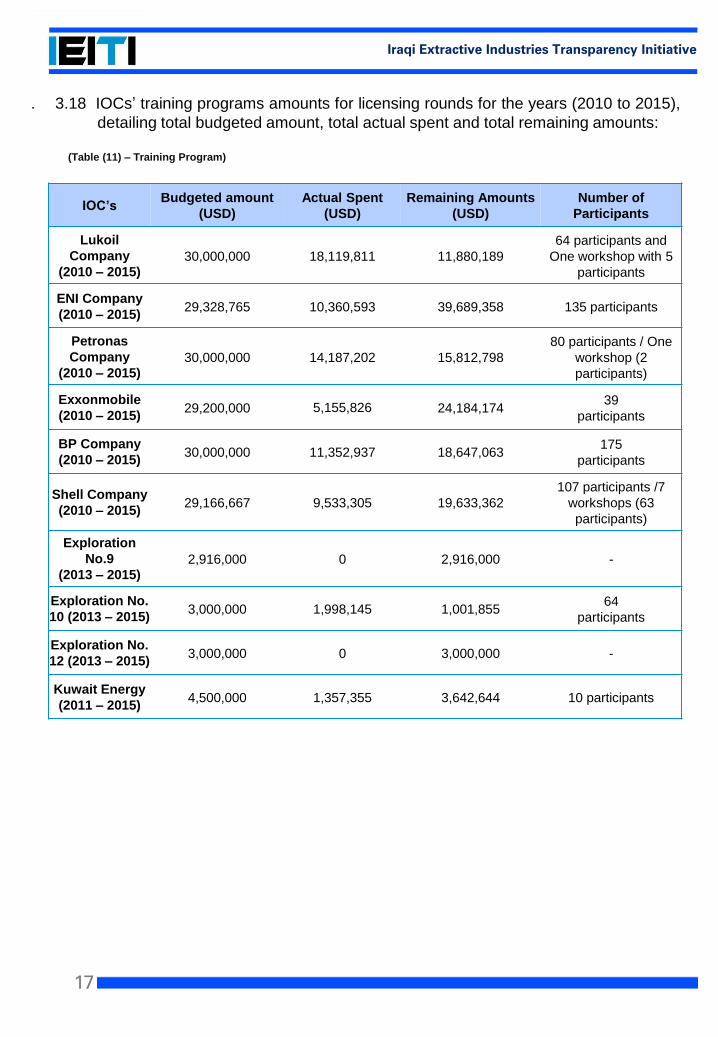
. 3.18 IOCs’ training programs amounts for licensing rounds for the years (2010 to 2015),
detailing total budgeted amount, total actual spent and total remaining amounts:
IOC’sBudgeted amount
(USD)
Actual Spent
(USD)
Remaining Amounts
(USD)
Number of
Participants
Lukoil
Company
(2010 – 2015) 30,000,000 18,119,811 11,880,189
64 participants and
One workshop with 5
participants
ENI Company
(2010 – 2015) 29,328,765 10,360,593 39,689,358 135 participants
Petronas
Company
(2010 – 2015) 30,000,000 14,187,202 15,812,798
80 participants / One
workshop (2
participants)
Exxonmobile
(2010 – 2015)29,200,000 5,155,826 24,184,174
39
participants
BP Company
(2010 – 2015)30,000,000 11,352,937 18,647,063
175
participants
Shell Company
(2010 – 2015) 29,166,667 9,533,305 19,633,362
107 participants /7
workshops (63
participants)
Exploration
No.9
(2013 – 2015) 2,916,000 0 2,916,000 -
Exploration No.
10 (2013 – 2015)3,000,000 1,998,145 1,001,855
64
participants
Exploration No.
12 (2013 – 2015)3,000,000 0 3,000,000 -
Kuwait Energy
(2011 – 2015) 4,500,000 1,357,355 3,642,644 10 participants
(Table (11) – Training Program)
18
Iraqi Extractive Industries Transparency Initiative
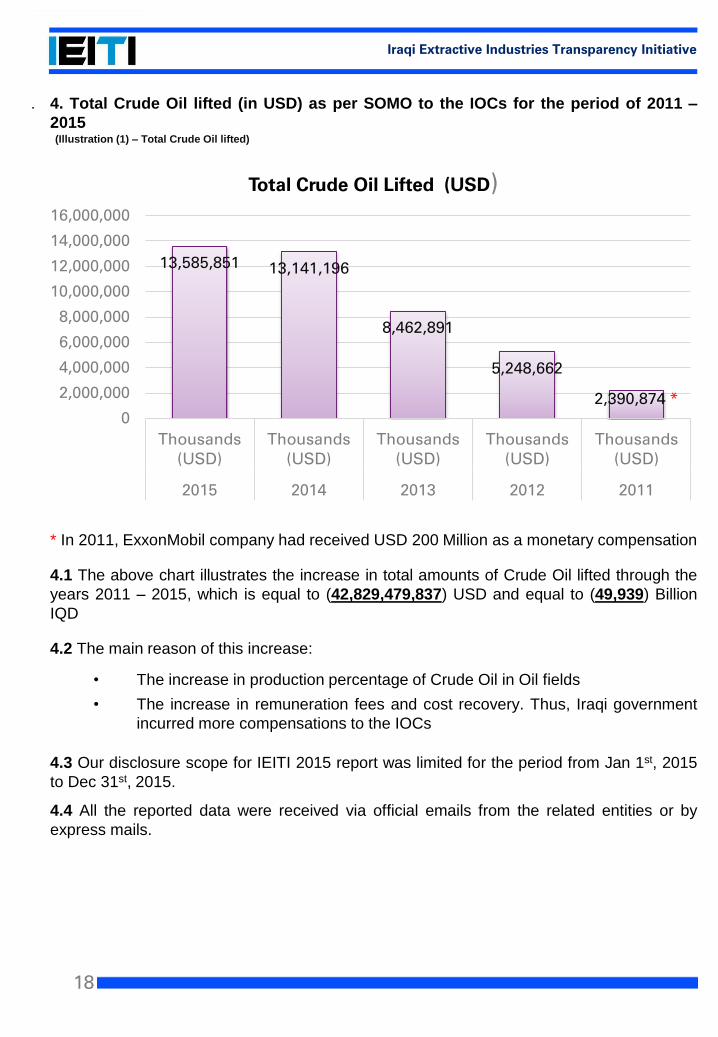
. 4. Total Crude Oil lifted (in USD) as per SOMO to the IOCs for the period of 2011 –
2015
* In 2011, ExxonMobil company had received USD 200 Million as a monetary compensation
4.1 The above chart illustrates the increase in total amounts of Crude Oil lifted through the
years 2011 – 2015, which is equal to (42,829,479,837) USD and equal to (49,939) Billion
IQD
4.2 The main reason of this increase:
• The increase in production percentage of Crude Oil in Oil fields
• The increase in remuneration fees and cost recovery. Thus, Iraqi government
incurred more compensations to the IOCs
4.3 Our disclosure scope for IEITI 2015 report was limited for the period from Jan 1st, 2015
to Dec 31st, 2015.
4.4 All the reported data were received via official emails from the related entities or by
express mails.
13,585,851 13,141,196
8,462,891
5,248,662
2,390,874 *0
2,000,000
4,000,000
6,000,000
8,000,000
10,000,000
12,000,000
14,000,000
16,000,000
Thousands(USD)
Thousands(USD)
Thousands(USD)
Thousands(USD)
Thousands(USD)
2015 2014 2013 2012 2011
Total Crude Oil Lifted (USD)
(Illustration (1) – Total Crude Oil lifted)
19
Iraqi Extractive Industries Transparency Initiative
5. Mining Industries in Iraq
In addition to Iraq’s oil and gas resources, Iraq possesses substantial mineral resources
and some of the world’s richest reserves, including sulfur and phosphate. Exploration for
mineral resources and industrial rocks started in Iraq as early as in year 1930 and was
proceeded by foreign companies until 1965, then the Geological Survey of Iraq
commenced a comprehensive systematic program of geological mapping and mineral
exploration that covered all the Iraqi territories and was based on actual field mapping,
exploratory drilling, geophysical and geochemical surveys.
Up until recently, Iraq’s Civil Society was not informed of, nor could it participate in
debates regarding oil, gas and mineral production. The Iraqi public was not able to set
production, exploitation and marketing policies with regard to Iraq’s mineral resources,
since sector-specific information was not public knowledge, and private participation to
invest in such sectors was not open to Iraqi Nationals. After 2003, it became imperative
to develop such policies, in order to regulate the exploitation of such resources in a
manner that guarantees transparency and hence attracts investment that could further
develop the industry through improving the image of Iraq in terms of being a reliable
business partner and a safe destination for Foreign Direct Investments.
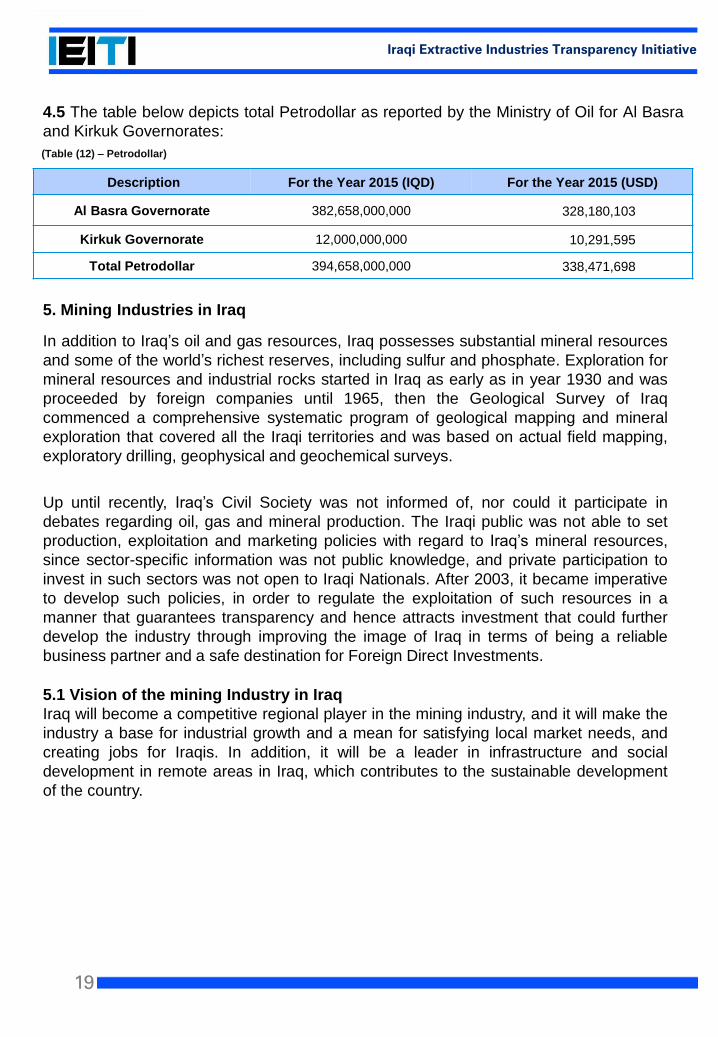
4.5 The table below depicts total Petrodollar as reported by the Ministry of Oil for Al Basra
and Kirkuk Governorates:
Description For the Year 2015 (IQD) For the Year 2015 (USD)
Al Basra Governorate 382,658,000,000 328,180,103
Kirkuk Governorate 12,000,000,000 10,291,595
Total Petrodollar 394,658,000,000 338,471,698
(Table (12) – Petrodollar)
5.1 Vision of the mining Industry in Iraq
Iraq will become a competitive regional player in the mining industry, and it will make the
industry a base for industrial growth and a mean for satisfying local market needs, and
creating jobs for Iraqis. In addition, it will be a leader in infrastructure and social
development in remote areas in Iraq, which contributes to the sustainable development
of the country.
20
Iraqi Extractive Industries Transparency Initiative
Adopting legislations, policies and regulations that encourage and support mineral
Investments;
Establishing Iraqi Minerals Board and drafting a law stipulating its responsibilities
Integrating the role of the central government with the local governments of mineral
producing provinces with regards to mineral investments and allocating the greater
portion of investment returns to those provinces;
Initiating communications with mining economic entities across the world, and updating
standards and frameworks based on international experiences that are in compliance
with the Iraqi regulations.
5.2.2 Medium Term - Expand the Investment of Mineral Resources
Reinforcing the role of the Iraqi Geological Survey and Mining Company in leading
mineral exploration and drilling operations, with the involvement of the private sector in
mineral investment;
Support the role of the Iraqi Geological Survey and Mining Company’s branches in the
provinces to strengthen relations with local governments, the private sector, and the
society as a whole. This in turn increases awareness regarding the economic
significance of mineral investments and its impact on the society;
Adopting clear business frameworks for dealing with investors in the mining industry
which guarantees the preservation of national interests, routine minimization, and the
creation of a dependable and sustainable investment environment.
5.2.3 Long Term - Sustainable and Competitive Growth
Achieving sustainable and environment-friendly growth in Iraqi mineral resources in
which the private sector has an influential role;
Accomplishing a significant contribution of the Minerals Sector’s in the GDP and
improving the standards of living, especially in remote areas through the creation of job
opportunities and developing the infrastructure;
Creating an accurate scientific database specialized in the field of mining.
5.2 Strategy of the mining Industry
5.2.1 Short Term - Institutional Development
21
Iraqi Extractive Industries Transparency Initiative
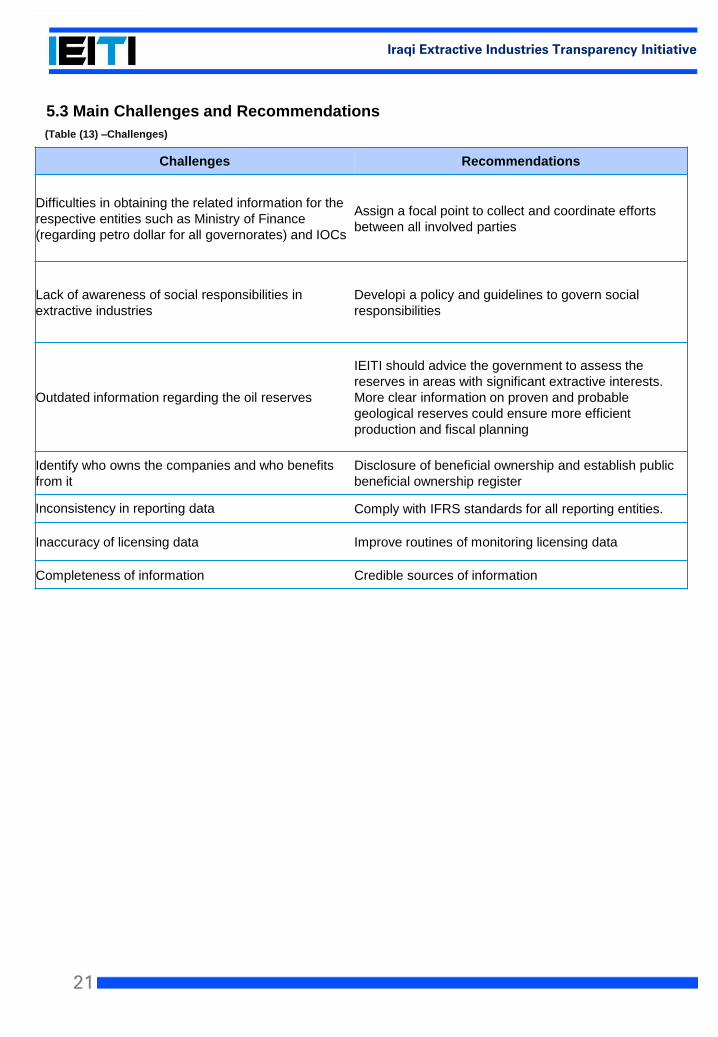
5.3 Main Challenges and Recommendations
Challenges Recommendations
Difficulties in obtaining the related information for the
respective entities such as Ministry of Finance
(regarding petro dollar for all governorates) and IOCs
Assign a focal point to collect and coordinate efforts
between all involved parties
Lack of awareness of social responsibilities in
extractive industries
Developi a policy and guidelines to govern social
responsibilities
Outdated information regarding the oil reserves
IEITI should advice the government to assess the
reserves in areas with significant extractive interests.
More clear information on proven and probable
geological reserves could ensure more efficient
production and fiscal planning
Identify who owns the companies and who benefits
from it
Disclosure of beneficial ownership and establish public
beneficial ownership register
Inconsistency in reporting data Comply with IFRS standards for all reporting entities.
Inaccuracy of licensing data Improve routines of monitoring licensing data
Completeness of information Credible sources of information
(Table (13) –Challenges)
22
Iraqi Extractive Industries Transparency Initiative
Introduction
23
Iraqi Extractive Industries Transparency Initiative
The EITI is a global coalition of governments, companies, and civil society working together
to improve openness and accountable management of revenues from natural resources.
The EITI was established with the belief that natural resources, such as oil, gas, metals, and
minerals, belong to country’s citizens, and that the appropriately managed revenues from
these resources can lead to economic growth and social development. The core belief
behind EITI is that transparency and openness on how a country manages its natural
resource wealth is necessary to insure that these resources can benefit all citizens.
The principles and criteria for EITI were designed with the objective of promoting and
supporting transparency and accountability in resource-rich countries through the full
publication of company payments, government revenues, and other information related to
countries’ extractive sectors.
Countries which implement EITI Standard, have to confirm a full disclosure of payments
made by extractive companies to governments.
These payments are disclosed in EITI Reports that are published to allow citizens to verify
how much revenues (amounts) their government is receiving from their country’s natural
resources.
The EITI was first established in 2003, and the organization initially agreed upon 12
principles to increase transparency over payments and revenues in the extractive sector.
These principles remain the cornerstone of the EITI. Several years later, the EITI
established 23 requirements known as the EITI Rules. In 2013, the EITI published EITI
Standard that replaced the EITI Rules, and on 23 February 2016, the EITI board approved
the 2016 EITI Standard coming into immediate effect.
24
Iraqi Extractive Industries Transparency Initiative
1Transparency Initiative In Iraq
EITI Requirement: 1- Oversight by the multi-stakeholder group
25
Iraqi Extractive Industries Transparency Initiative
1.1 Government Engagement
In May 2008, the Government of Iraq made a request to implement EITI.
As part of its implementation of the IEITI, the Government of Iraq committed itself to
publish all revenues from its export sales from the Oil Sector. In addition, international
companies buying oil from Iraq shared the same commitment of publishing what they have
paid to the Government. The first IEITI report was published in December 2011. EITI Board
had reviewed the report and on 12 December 2012, it announced Iraq as an EITI compliant
country. Moreover, 2015 report will be the 7th issued report by Iraq.
1.2 Company Engagement
Extractive sectors in Iraq consist of a number of operating national and international
companies represented by the multi-stakeholder group, where the Iraq government has
provided a suitable environment by giving the opportunity to participate and nominate their
representatives in the multi-stakeholder group. (10)
(10) http://ieiti.org.iq/uploads/2014%20Report/IEITI%202014%20Final%20Report%20-%20English.pdf
1.3 Civil Society Engagement
Civil Society Organization (CSO), is the community-based organization, non-governmental
organizations, and institutions outside the government, representing the diversity of citizens
and their views, seeking to speak on behalf of or for the “public interest” and for the citizens
themselves.
More specifically, civil society might include, but not be limited to:
Non profits or not for profits.
Media, trade unions.
Academic and research institutions.
Faith‐based groups.
Investors and individuals.
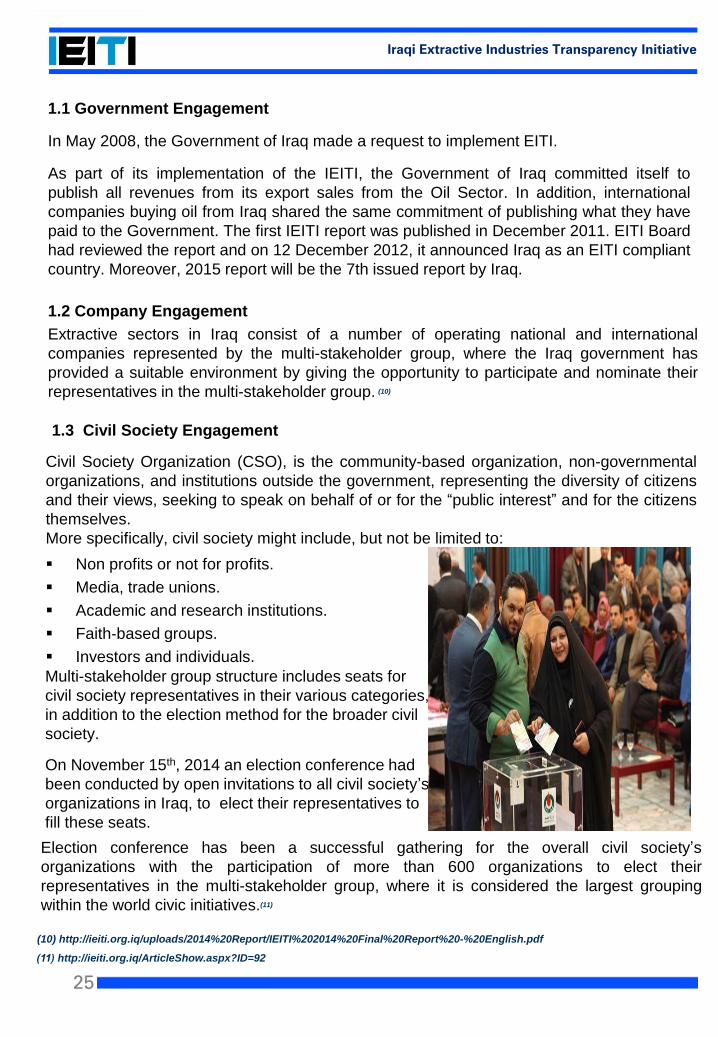
Multi-stakeholder group structure includes seats for
civil society representatives in their various categories,
in addition to the election method for the broader civil
society.
On November 15th, 2014 an election conference had
been conducted by open invitations to all civil society’s
organizations in Iraq, to elect their representatives to
fill these seats.
Election conference has been a successful gathering for the overall civil society’s
organizations with the participation of more than 600 organizations to elect their
representatives in the multi-stakeholder group, where it is considered the largest grouping
within the world civic initiatives.(11)
(11) http://ieiti.org.iq/ArticleShow.aspx?ID=92
26
Iraqi Extractive Industries Transparency Initiative
1.4 Multi-Stakeholder Group
1.4.1 The Iraqi multi-stakeholder Group “MSG” oversees the implementation of the EITI in
Iraq, it consists of:
1) The IEITI Chair
2) The Secretary of the IEITI
3) Three government representatives
4) Three international oil company representatives
5) Three national oil company representatives
6) Four civil society organizations representatives
7) Two ‘monitoring’ agencies
8) Two trade union representatives.
The representatives from the multi-stakeholder group communicate with the stakeholders,
through different activities to discuss and analyze the initiative's reports, and define the
path of the initiative in Iraq and its importance to the community, the government and
companies.
These activities have been contributed to achieve recommendations to improve
the performance of the initiative and to enrich the community dialogue. These activities
were published on the official website of IEITI.
1.4.2 The main activates of MSG members are mentioned in the following link:
http://ieiti.org.iq/uploads/2015%20Report/Annual%20Activity%20Report.pdf
27
Iraqi Extractive Industries Transparency Initiative
1.4.3 IEITI conducted many activities during 2015 to enhance the public awareness of
IEITI, major activities included but not limited to the following:(12)
Expanding the social debate in Al Basrah province about the extractive industries in
Iraq, through participating in a workshop held at Al Basrah University on 18/Apr/2015.
Increasing public awareness to the role of IEITI through participating in a workshop
titled “Returning the Stolen Money Due to Corruption” on 5/Sep/2015 at the Oil
Cultural Center.
Participating in a Workshop in Beirut, Lebanon from 8-11/Jun/2015, regarding the
mechanisms of analyzing IEITI reports, and connecting them to a wider sector.
Participating in EITI Community of Practice (CoP) Webinar on EITI Validation
Consultation on 11/Aug/2015.
Participating in (The First Economic Forum of Baghdad). This workshop was held in
Baghdad at Babylon Hotel on 10/Oct/ 2015.
Participating in the Regional EITI training for MSG & NC from Eastern Europe, Central
Asia and MENA, 13-15/Oct/2015 in Istanbul, Turkey.
Participating in a workshop titled “social benefits of IOCs for the sake of Iraqi citizen”
on 10/Dec/2015.
Contribution to the IEITI reports, by supporting the researches and studies and
providing qualitative data.
Contribution in raising social and public discussion that helped CSI in Iraq to follow up
and analyze IEITI reports, that submitted recommendations to improve the
management of the extractive industries’ resources.
(12) http://ieiti.org.iq/uploads/2015%20Report/Annual%20Activity%20Report.pdf
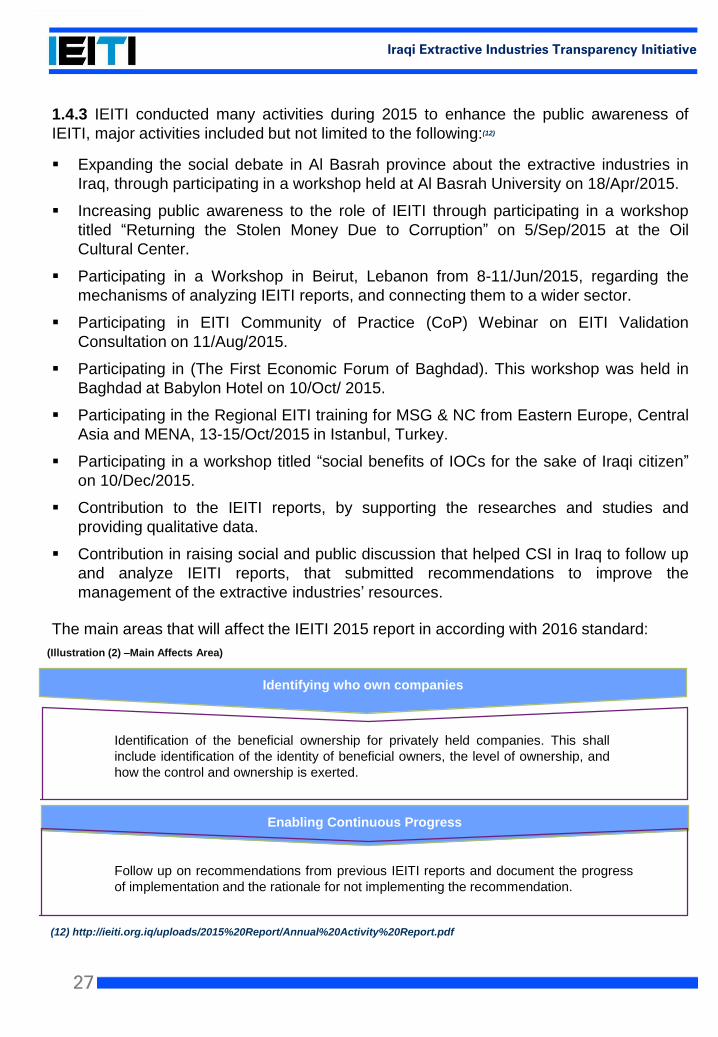
The main areas that will affect the IEITI 2015 report in according with 2016 standard:
Identifying who own companies
Identification of the beneficial ownership for privately held companies. This shall
include identification of the identity of beneficial owners, the level of ownership, and
how the control and ownership is exerted.
Enabling Continuous Progress
Follow up on recommendations from previous IEITI reports and document the progress
of implementation and the rationale for not implementing the recommendation.
(Illustration (2) –Main Affects Area)
28
Iraqi Extractive Industries Transparency Initiative
1.5 Work Plan
IEITI work plan is a structure used for planning IEITI objectives, identifying challenges and
adopting ways to surpass them, through a designated time and budget. This plan is
updated periodically to meet EITI standards and correspond to both Iraqi situations and
the allocated funding. The MSG sets out during its meetings the main visions later
interpreted into the work plan objectives, discusses the challenges, and suggests serious
steps and solutions according to the available potentials, taking advantage of previous
lessons learned and previous work plans outcomes.
Beside the Council, the work plan is discussed broadly with EITI International Secretariat
and the World Bank. IEITI objectives such as IEITI impact, IEITI annual reports, raising
public awareness, bringing IEITI process to the media and so on; are meant to be
achieved through activities set out in the work plan, where the responsible party for
carrying out these activities is IEITI National Secretariat. The following link depicts the
IEITI work plan.(13)
(13) http://ieiti.org.iq/ArticleShow.aspx?ID=104
29
Iraqi Extractive Industries Transparency Initiative
2Legal framework
EITI Requirement:2- Legal framework and Procedural Laws Controlling the Extractive Industries sector in Iraq, Including Contracting Mechanisms
30
Iraqi Extractive Industries Transparency Initiative
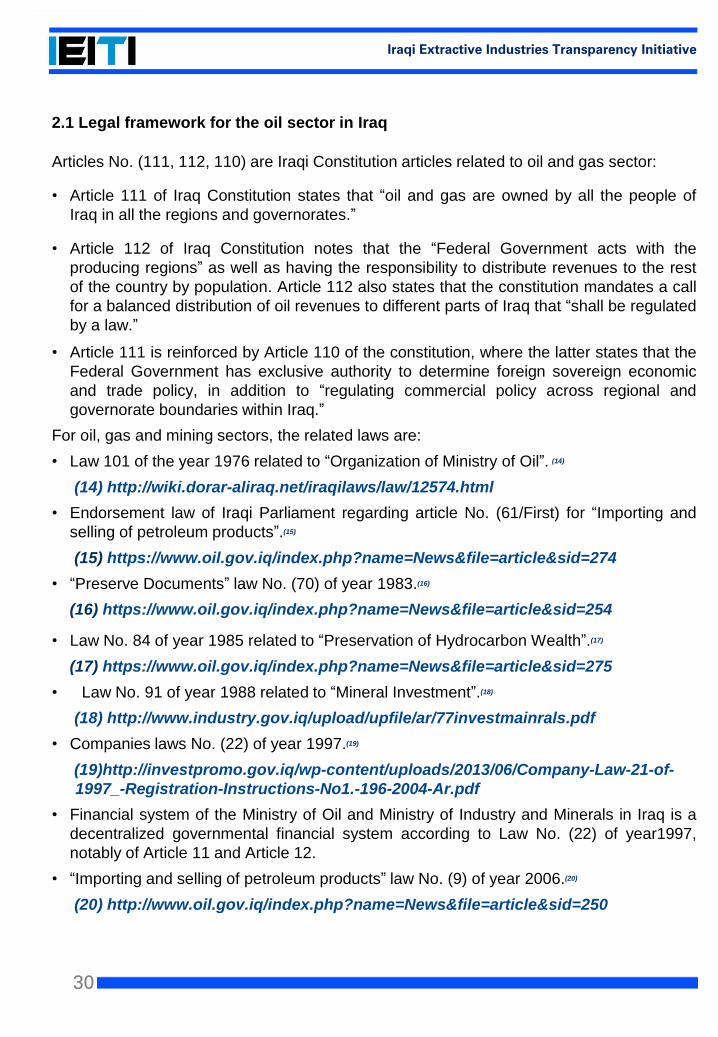
2.1 Legal framework for the oil sector in Iraq
Articles No. (111, 112, 110) are Iraqi Constitution articles related to oil and gas sector:
• Article 111 of Iraq Constitution states that “oil and gas are owned by all the people of
Iraq in all the regions and governorates.”
• Article 112 of Iraq Constitution notes that the “Federal Government acts with the
producing regions” as well as having the responsibility to distribute revenues to the rest
of the country by population. Article 112 also states that the constitution mandates a call
for a balanced distribution of oil revenues to different parts of Iraq that “shall be regulated
by a law.”
• Article 111 is reinforced by Article 110 of the constitution, where the latter states that the
Federal Government has exclusive authority to determine foreign sovereign economic
and trade policy, in addition to “regulating commercial policy across regional and
governorate boundaries within Iraq.”
For oil, gas and mining sectors, the related laws are:
• Law 101 of the year 1976 related to “Organization of Ministry of Oil”. (14)
(14) http://wiki.dorar-aliraq.net/iraqilaws/law/12574.html
• Endorsement law of Iraqi Parliament regarding article No. (61/First) for “Importing and
selling of petroleum products”.(15)
(15) https://www.oil.gov.iq/index.php?name=News&file=article&sid=274
• “Preserve Documents” law No. (70) of year 1983.(16)
(16) https://www.oil.gov.iq/index.php?name=News&file=article&sid=254
• Law No. 84 of year 1985 related to “Preservation of Hydrocarbon Wealth”.(17)
(17) https://www.oil.gov.iq/index.php?name=News&file=article&sid=275
• Law No. 91 of year 1988 related to “Mineral Investment”.(18)
(18) http://www.industry.gov.iq/upload/upfile/ar/77investmainrals.pdf
• Companies laws No. (22) of year 1997.(19)
(19)http://investpromo.gov.iq/wp-content/uploads/2013/06/Company-Law-21-of-
1997_-Registration-Instructions-No1.-196-2004-Ar.pdf
• Financial system of the Ministry of Oil and Ministry of Industry and Minerals in Iraq is a
decentralized governmental financial system according to Law No. (22) of year1997,
notably of Article 11 and Article 12.
• “Importing and selling of petroleum products” law No. (9) of year 2006.(20)
(20) http://www.oil.gov.iq/index.php?name=News&file=article&sid=250
31
Iraqi Extractive Industries Transparency Initiative
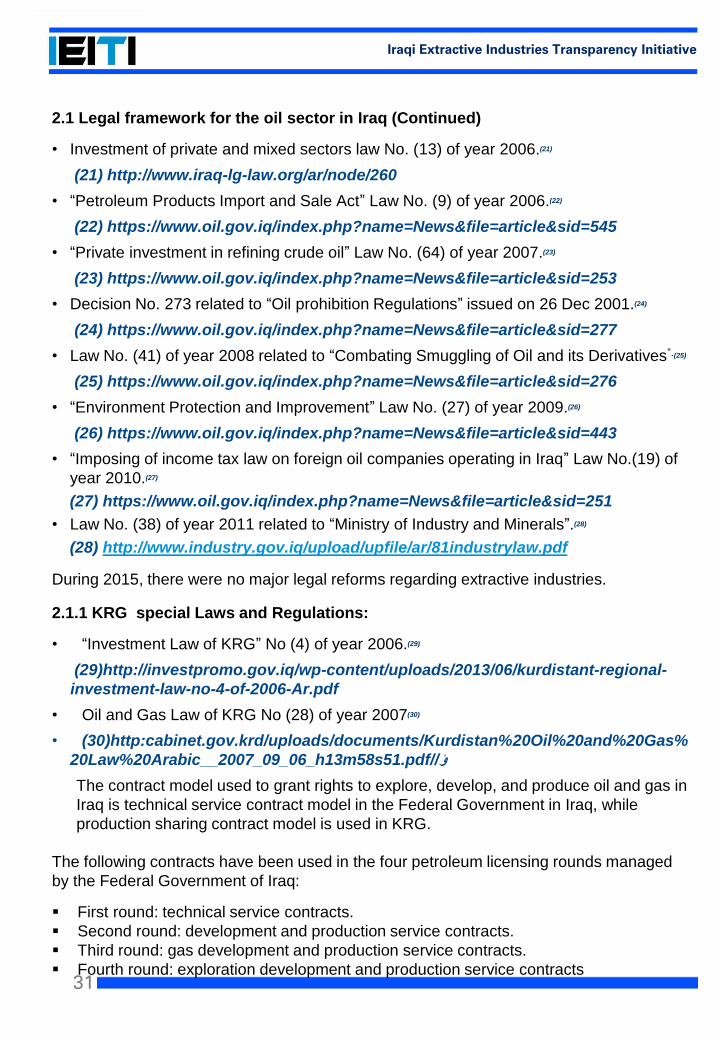
2.1 Legal framework for the oil sector in Iraq (Continued)
• Investment of private and mixed sectors law No. (13) of year 2006.(21)
(21) http://www.iraq-lg-law.org/ar/node/260
• “Petroleum Products Import and Sale Act” Law No. (9) of year 2006.(22)
(22) https://www.oil.gov.iq/index.php?name=News&file=article&sid=545
• “Private investment in refining crude oil” Law No. (64) of year 2007.(23)
(23) https://www.oil.gov.iq/index.php?name=News&file=article&sid=253
• Decision No. 273 related to “Oil prohibition Regulations” issued on 26 Dec 2001.(24)
(24) https://www.oil.gov.iq/index.php?name=News&file=article&sid=277
• Law No. (41) of year 2008 related to “Combating Smuggling of Oil and its Derivatives”.(25)
(25) https://www.oil.gov.iq/index.php?name=News&file=article&sid=276
• “Environment Protection and Improvement” Law No. (27) of year 2009.(26)
(26) https://www.oil.gov.iq/index.php?name=News&file=article&sid=443
• “Imposing of income tax law on foreign oil companies operating in Iraq” Law No.(19) of
year 2010.(27)
(27) https://www.oil.gov.iq/index.php?name=News&file=article&sid=251
• Law No. (38) of year 2011 related to “Ministry of Industry and Minerals”.(28)
(28) http://www.industry.gov.iq/upload/upfile/ar/81industrylaw.pdf
During 2015, there were no major legal reforms regarding extractive industries.
2.1.1 KRG special Laws and Regulations:
• “Investment Law of KRG” No (4) of year 2006.(29)
(29)http://investpromo.gov.iq/wp-content/uploads/2013/06/kurdistant-regional-
investment-law-no-4-of-2006-Ar.pdf
• Oil and Gas Law of KRG No (28) of year 2007(30)
• (30)http:cabinet.gov.krd/uploads/documents/Kurdistan%20Oil%20and%20Gas%
20Law%20Arabic__2007_09_06_h13m58s51.pdf//ؤ
The contract model used to grant rights to explore, develop, and produce oil and gas in
Iraq is technical service contract model in the Federal Government in Iraq, while
production sharing contract model is used in KRG.
The following contracts have been used in the four petroleum licensing rounds managed
by the Federal Government of Iraq:
First round: technical service contracts.
Second round: development and production service contracts.
Third round: gas development and production service contracts.
Fourth round: exploration development and production service contracts
32
Iraqi Extractive Industries Transparency Initiative
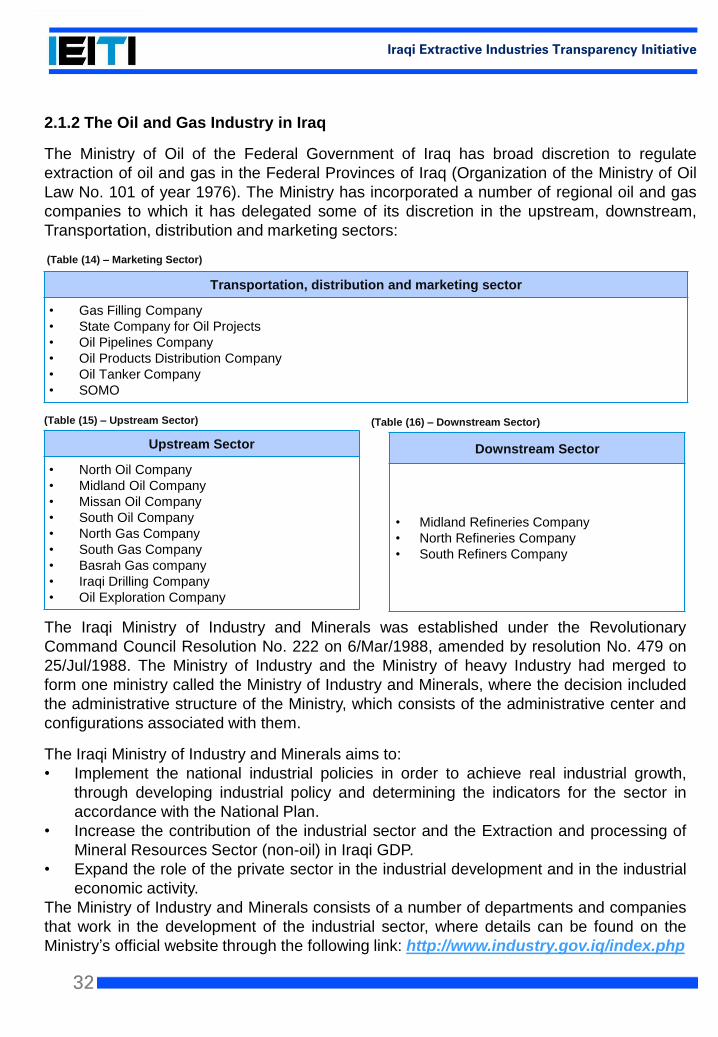
2.1.2 The Oil and Gas Industry in Iraq
The Ministry of Oil of the Federal Government of Iraq has broad discretion to regulate
extraction of oil and gas in the Federal Provinces of Iraq (Organization of the Ministry of Oil
Law No. 101 of year 1976). The Ministry has incorporated a number of regional oil and gas
companies to which it has delegated some of its discretion in the upstream, downstream,
Transportation, distribution and marketing sectors:
Downstream Sector
• Midland Refineries Company
• North Refineries Company
• South Refiners Company
Transportation, distribution and marketing sector
• Gas Filling Company
• State Company for Oil Projects
• Oil Pipelines Company
• Oil Products Distribution Company
• Oil Tanker Company
• SOMO
(Table (14) – Marketing Sector)
Upstream Sector
• North Oil Company
• Midland Oil Company
• Missan Oil Company
• South Oil Company
• North Gas Company
• South Gas Company
• Basrah Gas company
• Iraqi Drilling Company
• Oil Exploration Company
(Table (16) – Downstream Sector)(Table (15) – Upstream Sector)
The Iraqi Ministry of Industry and Minerals was established under the Revolutionary
Command Council Resolution No. 222 on 6/Mar/1988, amended by resolution No. 479 on
25/Jul/1988. The Ministry of Industry and the Ministry of heavy Industry had merged to
form one ministry called the Ministry of Industry and Minerals, where the decision included
the administrative structure of the Ministry, which consists of the administrative center and
configurations associated with them.
The Iraqi Ministry of Industry and Minerals aims to:
• Implement the national industrial policies in order to achieve real industrial growth,
through developing industrial policy and determining the indicators for the sector in
accordance with the National Plan.
• Increase the contribution of the industrial sector and the Extraction and processing of
Mineral Resources Sector (non-oil) in Iraqi GDP.
• Expand the role of the private sector in the industrial development and in the industrial
economic activity.
The Ministry of Industry and Minerals consists of a number of departments and companies
that work in the development of the industrial sector, where details can be found on the
Ministry’s official website through the following link: http://www.industry.gov.iq/index.php
33
Iraqi Extractive Industries Transparency Initiative
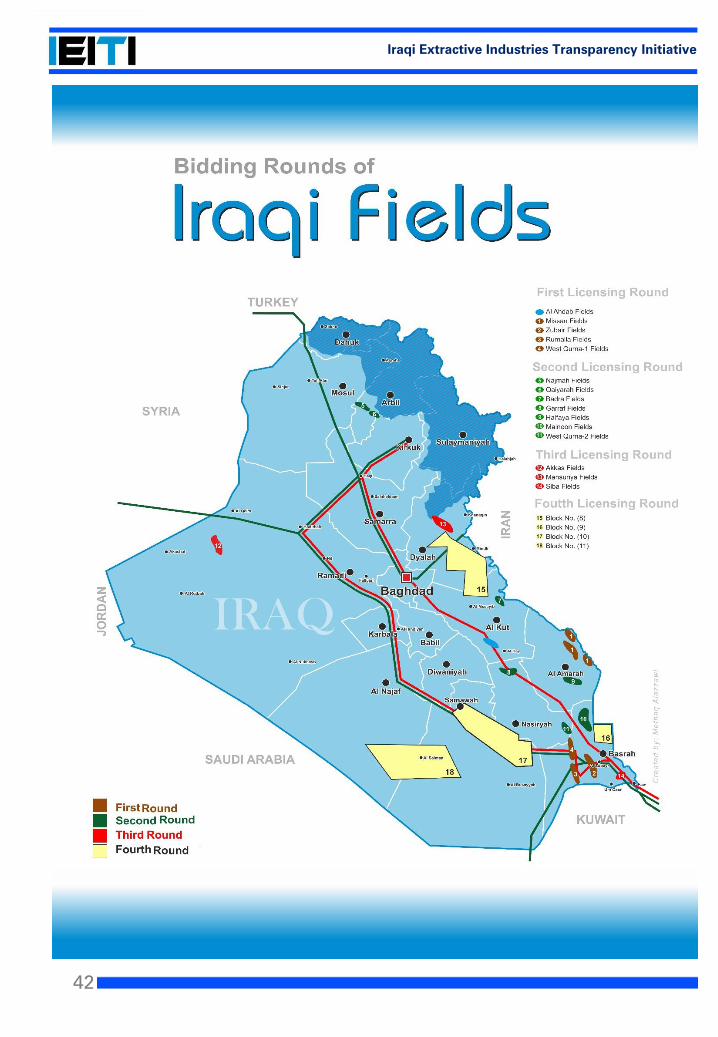
2.2.1 Introduction of Oil Allocation
Crude oil and gas production is the main extractive industry in the country, where it is
regarded as the country’s key source of funding and the driver of the economy and
national development. The Iraqi Government had launched licensing rounds for certain oil
and gas fields as well as exploration blocks to obtain the assistance of international oil
companies in the redevelopment of certain fields.
The following link illustrates the Oil fields under the licensing rounds:
http://ieiti.org.iq/ArticleShow.aspx?ID=111
There are many studies on licensing rounds, including the study of Mr. “Asri Musa – Iraqi
Licensing Contracts”. Mr. Asri is considered an Oil expert and consultant that conducted
several studies and researches.
According to his study, the licensing contracts represent a new model in the oil field
development agreements between the governments and the international oil companies,
as these contracts provide benefits in all aspects for the national economy and the oil
industry in Iraq, and any attempt to change these contracts from Technical Service
Contract model to production sharing contract model may cause serious damage to Iraq
and its oil industry. For more details, please follow the below link:
http://ieiti.org.iq/ArticleShow.aspx?ID=122
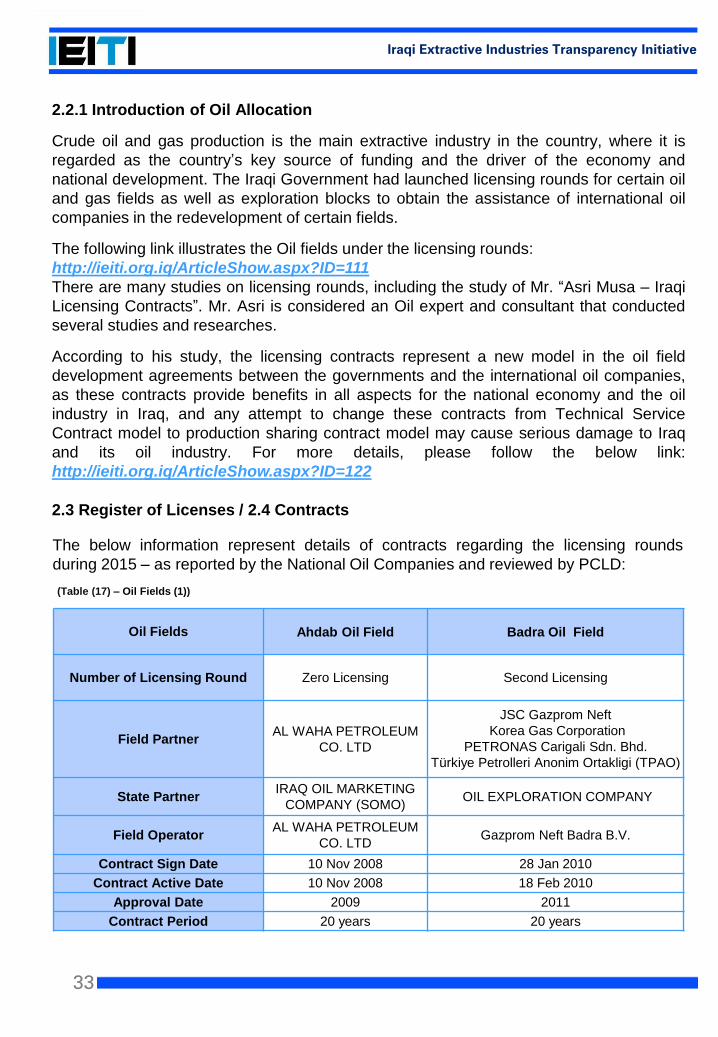
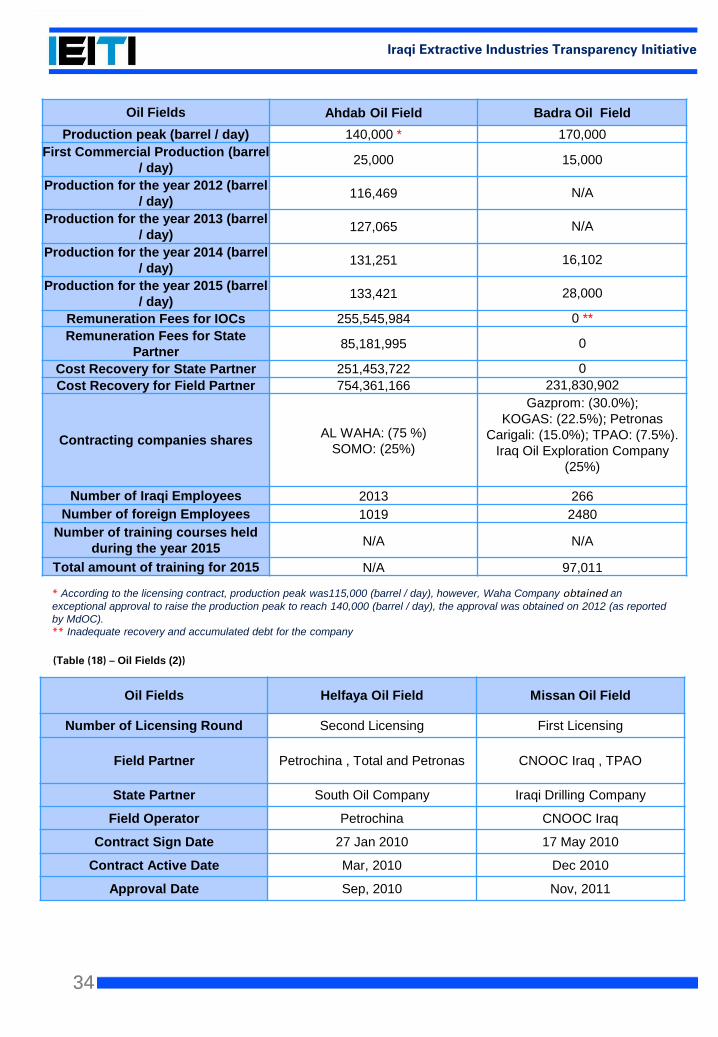
2.3 Register of Licenses / 2.4 Contracts
The below information represent details of contracts regarding the licensing rounds
during 2015 – as reported by the National Oil Companies and reviewed by PCLD:
Oil Fields Ahdab Oil Field Badra Oil Field
Number of Licensing Round Zero Licensing Second Licensing
Field Partner AL WAHA PETROLEUM
CO. LTD
JSC Gazprom Neft
Korea Gas Corporation
PETRONAS Carigali Sdn. Bhd.
Türkiye Petrolleri Anonim Ortakligi (TPAO)
State PartnerIRAQ OIL MARKETING
COMPANY (SOMO)OIL EXPLORATION COMPANY
Field OperatorAL WAHA PETROLEUM
CO. LTDGazprom Neft Badra B.V.
Contract Sign Date 10 Nov 2008 28 Jan 2010
Contract Active Date 10 Nov 2008 18 Feb 2010
Approval Date 2009 2011
Contract Period 20 years 20 years
(Table (17) – Oil Fields (1))
34
Iraqi Extractive Industries Transparency Initiative
Oil Fields Ahdab Oil Field Badra Oil Field
Production peak (barrel / day) 140,000 * 170,000
First Commercial Production (barrel
/ day) 25,000 15,000
Production for the year 2012 (barrel
/ day) 116,469 N/A
Production for the year 2013 (barrel
/ day) 127,065 N/A
Production for the year 2014 (barrel
/ day) 131,251 16,102
Production for the year 2015 (barrel
/ day) 133,421 28,000
Remuneration Fees for IOCs 255,545,984 0 **
Remuneration Fees for State
Partner85,181,995 0
Cost Recovery for State Partner 251,453,722 0
Cost Recovery for Field Partner 754,361,166 231,830,902
Contracting companies sharesAL WAHA: (75 %)
SOMO: (25%)
Gazprom: (30.0%);
KOGAS: (22.5%); Petronas
Carigali: (15.0%); TPAO: (7.5%).
Iraq Oil Exploration Company
(25%)
Number of Iraqi Employees 2013 266
Number of foreign Employees 1019 2480
Number of training courses held
during the year 2015N/A N/A
Total amount of training for 2015 N/A 97,011
Oil Fields Helfaya Oil Field Missan Oil Field
Number of Licensing Round Second Licensing First Licensing
Field Partner Petrochina , Total and Petronas CNOOC Iraq , TPAO
State Partner South Oil Company Iraqi Drilling Company
Field Operator Petrochina CNOOC Iraq
Contract Sign Date 27 Jan 2010 17 May 2010
Contract Active Date Mar, 2010 Dec 2010
Approval Date Sep, 2010 Nov, 2011
* According to the licensing contract, production peak was115,000 (barrel / day), however, Waha Company obtained an
exceptional approval to raise the production peak to reach 140,000 (barrel / day), the approval was obtained on 2012 (as reported
by MdOC).
** Inadequate recovery and accumulated debt for the company
(Table (18) – Oil Fields (2))
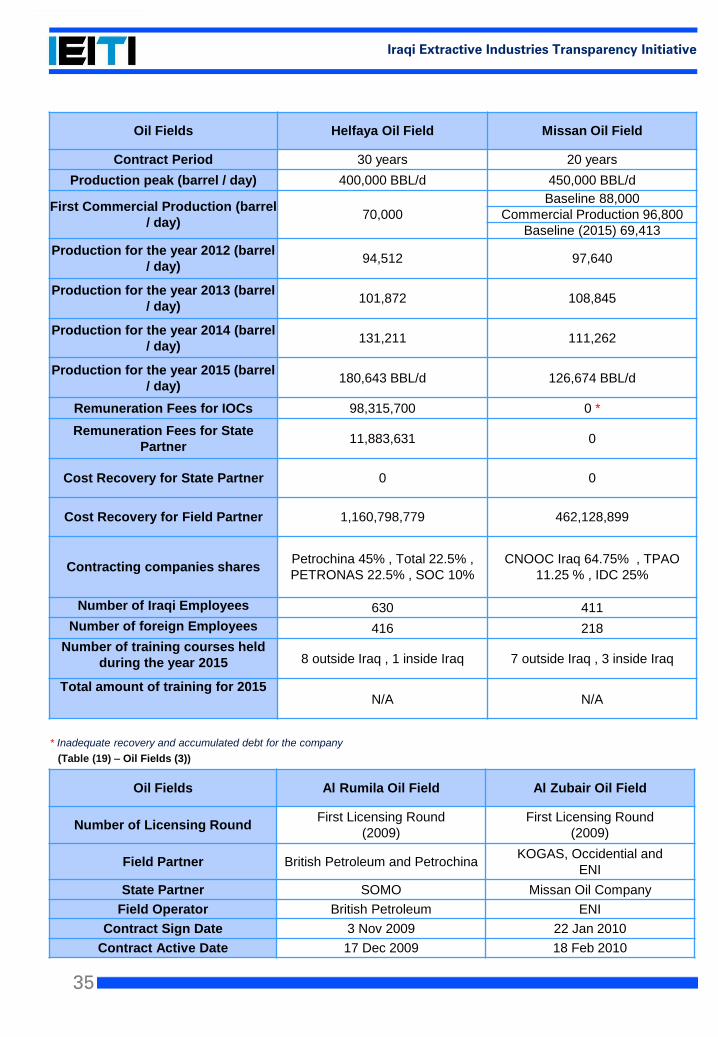
35
Iraqi Extractive Industries Transparency Initiative
Oil Fields Helfaya Oil Field Missan Oil Field
Contract Period 30 years 20 years
Production peak (barrel / day) 400,000 BBL/d 450,000 BBL/d
First Commercial Production (barrel
/ day) 70,000
Baseline 88,000
Commercial Production 96,800
Baseline (2015) 69,413
Production for the year 2012 (barrel
/ day) 94,512 97,640
Production for the year 2013 (barrel
/ day) 101,872 108,845
Production for the year 2014 (barrel
/ day) 131,211 111,262
Production for the year 2015 (barrel
/ day) 180,643 BBL/d 126,674 BBL/d
Remuneration Fees for IOCs 98,315,700 0 *
Remuneration Fees for State
Partner11,883,631 0
Cost Recovery for State Partner 0 0
Cost Recovery for Field Partner 1,160,798,779 462,128,899
Contracting companies sharesPetrochina 45% , Total 22.5% ,
PETRONAS 22.5% , SOC 10%
CNOOC Iraq 64.75% , TPAO
11.25 % , IDC 25%
Number of Iraqi Employees 630 411
Number of foreign Employees 416 218
Number of training courses held
during the year 2015 8 outside Iraq , 1 inside Iraq 7 outside Iraq , 3 inside Iraq
Total amount of training for 2015N/A N/A
Oil Fields Al Rumila Oil Field Al Zubair Oil Field
Number of Licensing RoundFirst Licensing Round
(2009)
First Licensing Round
(2009)
Field Partner British Petroleum and PetrochinaKOGAS, Occidential and
ENI
State Partner SOMO Missan Oil Company
Field Operator British Petroleum ENI
Contract Sign Date 3 Nov 2009 22 Jan 2010
Contract Active Date 17 Dec 2009 18 Feb 2010
* Inadequate recovery and accumulated debt for the company
(Table (19) – Oil Fields (3))
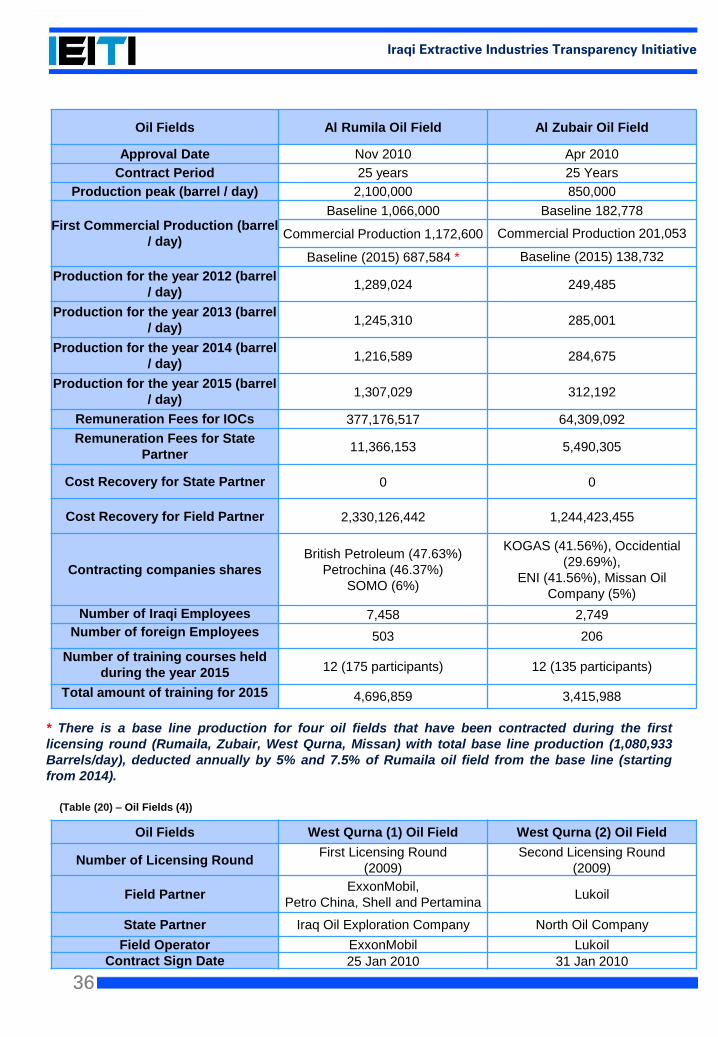
36
Iraqi Extractive Industries Transparency Initiative
* There is a base line production for four oil fields that have been contracted during the first
licensing round (Rumaila, Zubair, West Qurna, Missan) with total base line production (1,080,933
Barrels/day), deducted annually by 5% and 7.5% of Rumaila oil field from the base line (starting
from 2014).
Oil Fields Al Rumila Oil Field Al Zubair Oil Field
Approval Date Nov 2010 Apr 2010
Contract Period 25 years 25 Years
Production peak (barrel / day) 2,100,000 850,000
First Commercial Production (barrel
/ day)
Baseline 1,066,000 Baseline 182,778
Commercial Production 1,172,600 Commercial Production 201,053
Baseline (2015) 687,584 * Baseline (2015) 138,732
Production for the year 2012 (barrel
/ day) 1,289,024 249,485
Production for the year 2013 (barrel
/ day) 1,245,310 285,001
Production for the year 2014 (barrel
/ day) 1,216,589 284,675
Production for the year 2015 (barrel
/ day) 1,307,029 312,192
Remuneration Fees for IOCs 377,176,517 64,309,092
Remuneration Fees for State
Partner11,366,153 5,490,305
Cost Recovery for State Partner 0 0
Cost Recovery for Field Partner 2,330,126,442 1,244,423,455
Contracting companies shares
British Petroleum (47.63%)
Petrochina (46.37%)
SOMO (6%)
KOGAS (41.56%), Occidential
(29.69%),
ENI (41.56%), Missan Oil
Company (5%)
Number of Iraqi Employees 7,458 2,749
Number of foreign Employees 503 206
Number of training courses held
during the year 2015 12 (175 participants) 12 (135 participants)
Total amount of training for 2015 4,696,859 3,415,988
Oil Fields West Qurna (1) Oil Field West Qurna (2) Oil Field
Number of Licensing RoundFirst Licensing Round
(2009)
Second Licensing Round
(2009)
Field Partner ExxonMobil,
Petro China, Shell and PertaminaLukoil
State Partner Iraq Oil Exploration Company North Oil Company
Field Operator ExxonMobil Lukoil
Contract Sign Date 25 Jan 2010 31 Jan 2010
(Table (20) – Oil Fields (4))
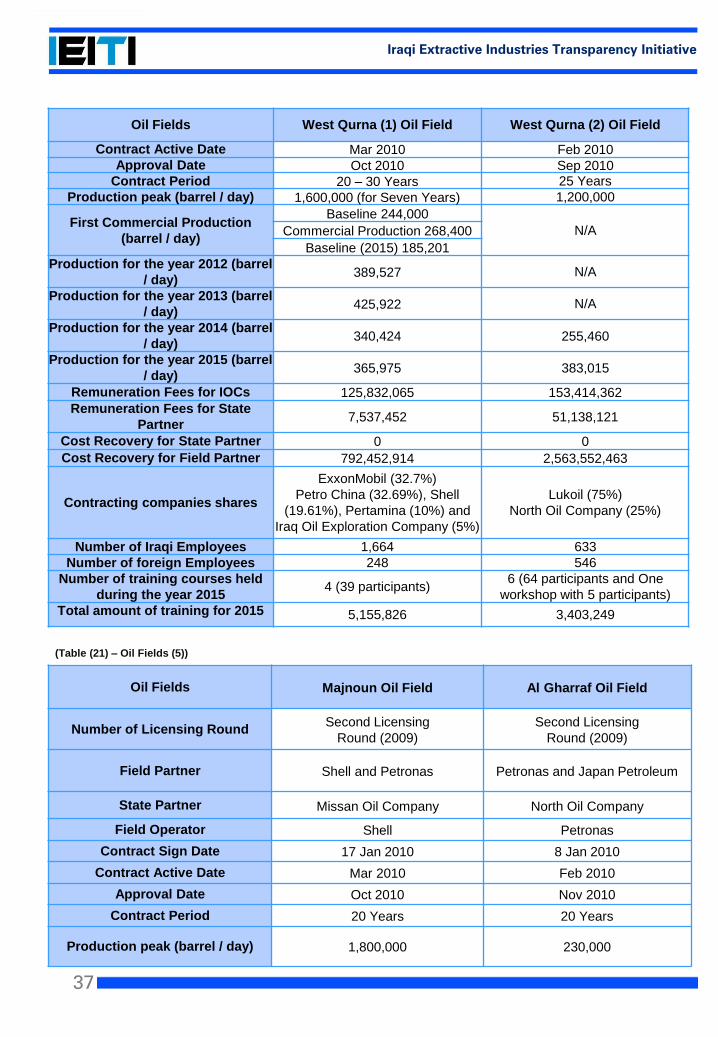
37
Iraqi Extractive Industries Transparency Initiative
Oil Fields West Qurna (1) Oil Field West Qurna (2) Oil Field
Contract Active Date Mar 2010 Feb 2010Approval Date Oct 2010 Sep 2010
Contract Period 20 – 30 Years 25 Years
Production peak (barrel / day) 1,600,000 (for Seven Years) 1,200,000
First Commercial Production
(barrel / day)
Baseline 244,000
N/ACommercial Production 268,400
Baseline (2015) 185,201
Production for the year 2012 (barrel
/ day) 389,527 N/A
Production for the year 2013 (barrel
/ day) 425,922 N/A
Production for the year 2014 (barrel
/ day) 340,424 255,460
Production for the year 2015 (barrel
/ day) 365,975 383,015
Remuneration Fees for IOCs 125,832,065 153,414,362
Remuneration Fees for State
Partner7,537,452 51,138,121
Cost Recovery for State Partner 0 0
Cost Recovery for Field Partner 792,452,914 2,563,552,463
Contracting companies shares
ExxonMobil (32.7%)
Petro China (32.69%), Shell
(19.61%), Pertamina (10%) and
Iraq Oil Exploration Company (5%)
Lukoil (75%)
North Oil Company (25%)
Number of Iraqi Employees 1,664 633
Number of foreign Employees 248 546
Number of training courses held
during the year 20154 (39 participants)
6 (64 participants and One
workshop with 5 participants)
Total amount of training for 2015 5,155,826 3,403,249
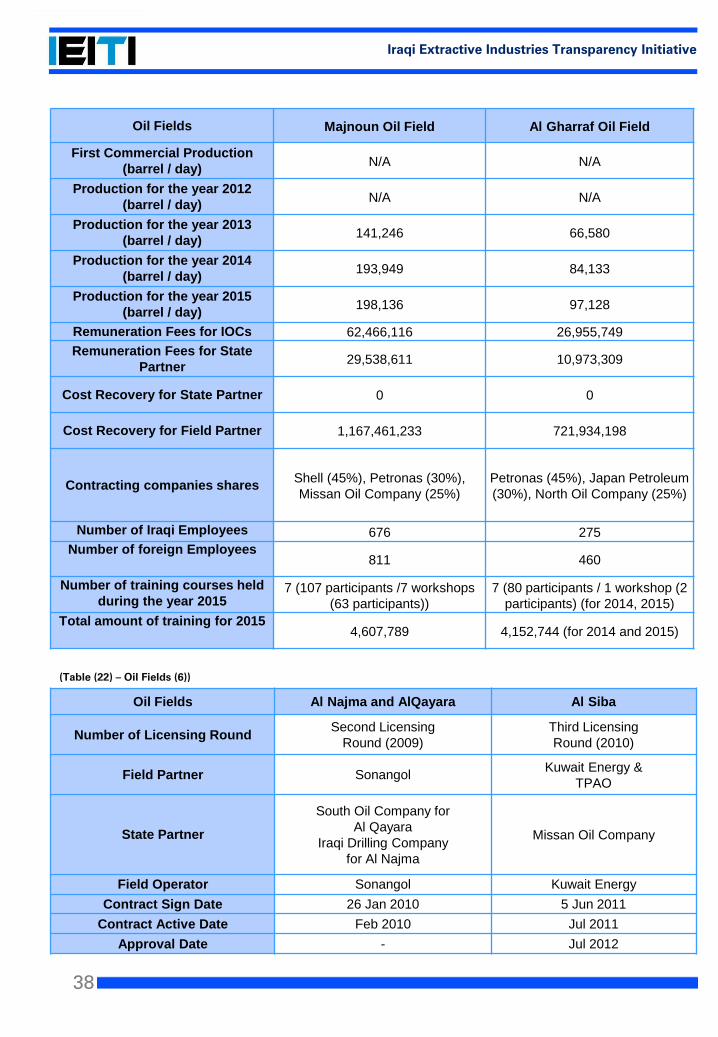
Oil Fields Majnoun Oil Field Al Gharraf Oil Field
Number of Licensing RoundSecond Licensing
Round (2009)
Second Licensing
Round (2009)
Field Partner Shell and Petronas Petronas and Japan Petroleum
State Partner Missan Oil Company North Oil Company
Field Operator Shell Petronas
Contract Sign Date 17 Jan 2010 8 Jan 2010
Contract Active Date Mar 2010 Feb 2010
Approval Date Oct 2010 Nov 2010
Contract Period 20 Years 20 Years
Production peak (barrel / day) 1,800,000 230,000
(Table (21) – Oil Fields (5))
38
Iraqi Extractive Industries Transparency Initiative
Oil Fields Majnoun Oil Field Al Gharraf Oil Field
First Commercial Production
(barrel / day) N/A N/A
Production for the year 2012
(barrel / day) N/A N/A
Production for the year 2013
(barrel / day) 141,246 66,580
Production for the year 2014
(barrel / day) 193,949 84,133
Production for the year 2015
(barrel / day) 198,136 97,128
Remuneration Fees for IOCs 62,466,116 26,955,749
Remuneration Fees for State
Partner29,538,611 10,973,309
Cost Recovery for State Partner 0 0
Cost Recovery for Field Partner 1,167,461,233 721,934,198
Contracting companies sharesShell (45%), Petronas (30%),
Missan Oil Company (25%)
Petronas (45%), Japan Petroleum
(30%), North Oil Company (25%)
Number of Iraqi Employees 676 275
Number of foreign Employees811 460
Number of training courses held
during the year 20157 (107 participants /7 workshops
(63 participants))
7 (80 participants / 1 workshop (2
participants) (for 2014, 2015)
Total amount of training for 20154,607,789 4,152,744 (for 2014 and 2015)
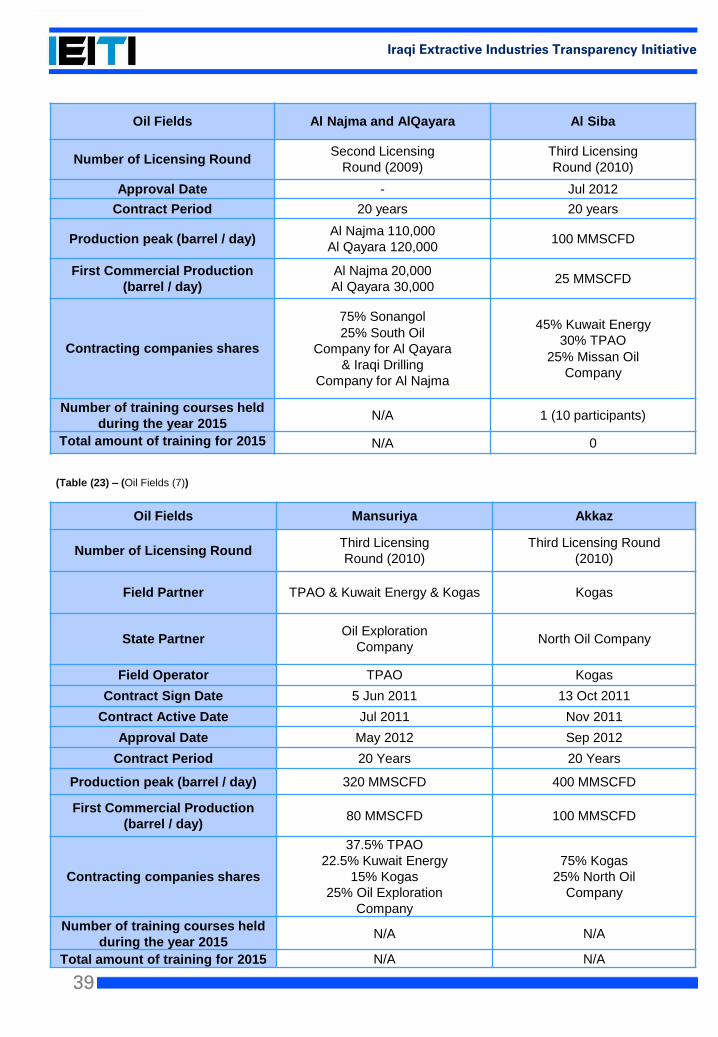
Oil Fields Al Najma and AlQayara Al Siba
Number of Licensing RoundSecond Licensing
Round (2009)
Third Licensing
Round (2010)
Field Partner SonangolKuwait Energy &
TPAO
State Partner
South Oil Company for
Al Qayara
Iraqi Drilling Company
for Al Najma
Missan Oil Company
Field Operator Sonangol Kuwait Energy
Contract Sign Date 26 Jan 2010 5 Jun 2011
Contract Active Date Feb 2010 Jul 2011
Approval Date - Jul 2012
(Table (22) – Oil Fields (6))
39
Iraqi Extractive Industries Transparency Initiative
Oil Fields Al Najma and AlQayara Al Siba
Number of Licensing RoundSecond Licensing
Round (2009)
Third Licensing
Round (2010)
Approval Date - Jul 2012
Contract Period 20 years 20 years
Production peak (barrel / day)Al Najma 110,000
Al Qayara 120,000100 MMSCFD
First Commercial Production
(barrel / day)
Al Najma 20,000
Al Qayara 30,00025 MMSCFD
Contracting companies shares
75% Sonangol
25% South Oil
Company for Al Qayara
& Iraqi Drilling
Company for Al Najma
45% Kuwait Energy
30% TPAO
25% Missan Oil
Company
Number of training courses held
during the year 2015N/A 1 (10 participants)
Total amount of training for 2015 N/A 0
Oil Fields Mansuriya Akkaz
Number of Licensing RoundThird Licensing
Round (2010)
Third Licensing Round
(2010)
Field Partner TPAO & Kuwait Energy & Kogas Kogas
State PartnerOil Exploration
CompanyNorth Oil Company
Field Operator TPAO Kogas
Contract Sign Date 5 Jun 2011 13 Oct 2011
Contract Active Date Jul 2011 Nov 2011
Approval Date May 2012 Sep 2012
Contract Period 20 Years 20 Years
Production peak (barrel / day) 320 MMSCFD 400 MMSCFD
First Commercial Production
(barrel / day) 80 MMSCFD 100 MMSCFD
Contracting companies shares
37.5% TPAO
22.5% Kuwait Energy
15% Kogas
25% Oil Exploration
Company
75% Kogas
25% North Oil
Company
Number of training courses held
during the year 2015N/A N/A
Total amount of training for 2015 N/A N/A
(Table (23) – (Oil Fields (7))
40
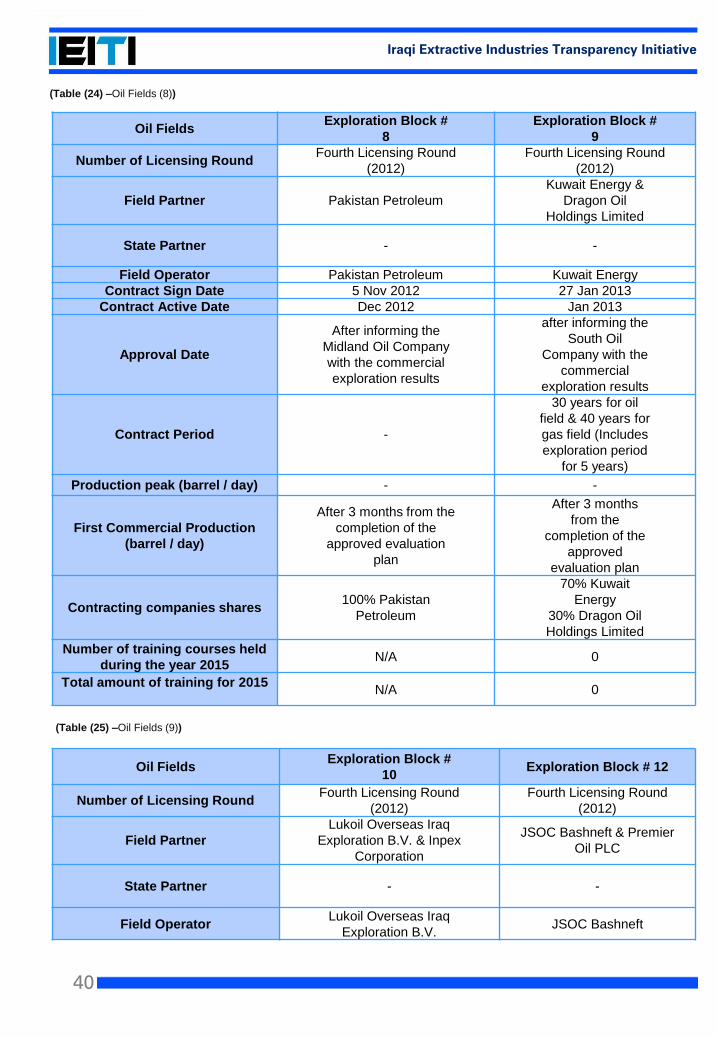
Iraqi Extractive Industries Transparency Initiative
Oil FieldsExploration Block #
8
Exploration Block #
9
Number of Licensing RoundFourth Licensing Round
(2012)
Fourth Licensing Round
(2012)
Field Partner Pakistan Petroleum
Kuwait Energy &
Dragon Oil
Holdings Limited
State Partner - -
Field Operator Pakistan Petroleum Kuwait Energy
Contract Sign Date 5 Nov 2012 27 Jan 2013
Contract Active Date Dec 2012 Jan 2013
Approval Date
After informing the
Midland Oil Company
with the commercial
exploration results
after informing the
South Oil
Company with the
commercial
exploration results
Contract Period -
30 years for oil
field & 40 years for
gas field (Includes
exploration period
for 5 years)
Production peak (barrel / day) - -
First Commercial Production
(barrel / day)
After 3 months from the
completion of the
approved evaluation
plan
After 3 months
from the
completion of the
approved
evaluation plan
Contracting companies shares100% Pakistan
Petroleum
70% Kuwait
Energy
30% Dragon Oil
Holdings Limited
Number of training courses held
during the year 2015N/A 0
Total amount of training for 2015N/A 0
(Table (24) –Oil Fields (8))
Oil FieldsExploration Block #
10Exploration Block # 12
Number of Licensing RoundFourth Licensing Round
(2012)
Fourth Licensing Round
(2012)
Field Partner
Lukoil Overseas Iraq
Exploration B.V. & Inpex
Corporation
JSOC Bashneft & Premier
Oil PLC
State Partner - -
Field OperatorLukoil Overseas Iraq
Exploration B.V.JSOC Bashneft
(Table (25) –Oil Fields (9))
41
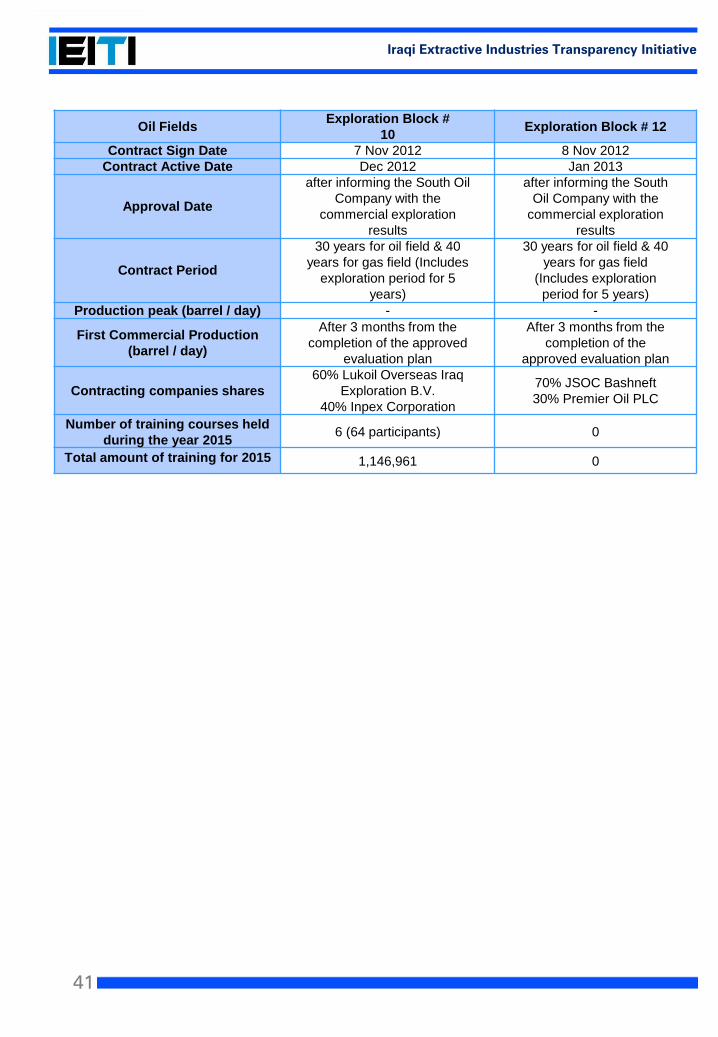
Iraqi Extractive Industries Transparency Initiative
Oil FieldsExploration Block #
10Exploration Block # 12
Contract Sign Date 7 Nov 2012 8 Nov 2012
Contract Active Date Dec 2012 Jan 2013
Approval Date
after informing the South Oil
Company with the
commercial exploration
results
after informing the South
Oil Company with the
commercial exploration
results
Contract Period
30 years for oil field & 40
years for gas field (Includes
exploration period for 5
years)
30 years for oil field & 40
years for gas field
(Includes exploration
period for 5 years)
Production peak (barrel / day) - -
First Commercial Production
(barrel / day)
After 3 months from the
completion of the approved
evaluation plan
After 3 months from the
completion of the
approved evaluation plan
Contracting companies shares
60% Lukoil Overseas Iraq
Exploration B.V.
40% Inpex Corporation
70% JSOC Bashneft
30% Premier Oil PLC
Number of training courses held
during the year 20156 (64 participants) 0
Total amount of training for 2015 1,146,961 0
42
Iraqi Extractive Industries Transparency Initiative
43
Iraqi Extractive Industries Transparency Initiative
2.3.1.1 Pipelines
BGC operates a network of around 1,800 kilometers of natural gas, hydrocarbon liquids
and industrial water pipelines. Natural gas and liquids are transported through these
pipelines from where it is produced to the processing plants. BGC inspects and
rehabilitates these pipelines, and its building 300 kilometers of new pipelines to expand
its capacity further.
2.3.1.2 Gas Compressing stations
BGC has nine compressor stations, which are distributed at intervals along its pipeline
network. Their purpose is to compress the natural gas, thereby providing an increase in
pressure for the natural gas to continue flowing towards BGC processing plants. BGC is
currently building nine new compressor stations, and whilst this work is being finalised, it
has installed three temporary compressors to increase gas flow and start to meet the
needs of the people of southern Iraq for power as quickly as possible.
2.3.1.3 Gas processing plants
BGC operates two gas processing plants. At these facilities BGC removes contaminants
from the natural gas and separate it into dry gas to supply power generators and to
produce valuable natural gas liquids. At the Khor Al Zubair gas processing plant, BGC
also processes natural gas liquids to produce LPG and condensate
2.3.1 Basrah Gas Company
BGC is an Iraqi company established by the Iraqi Government in May 2013 to meet the
Iraqi challenge to turn Basrah Province’s abundant endowment of natural gas into a
blessing for the current and future generations.(31)
The major shareholder is South Gas Company. Other shareholders are Shell and
Mitsubishi.
BGC’s employs workforce of over 5,500, supported by hundreds of engineers and
workers either employed in or deployed to Basrah Province by these contractors to work
on BGC projects.
BGC inspects and repairs around 1,800 kilometers of pipelines, and nine compressor
stations in Rumaila field. In addition, it is currently repairing the 40-inch West Qurna 1
pipeline. This will enable BGC to process associated gas from West Qurna for the first
time by connecting the field to the North Rumaila processing plant. West Qurna 1 today
flares around 150 million standard cubic feet per day, enough to power one million homes
and produce 16 million LPG cylinders per annum.
BGC does not produce and capture raw natural gas. A public-private partnership between
the three giant oil fields of southern Iraq - Rumaila, Zubair and West Qurna 1 – to deliver
untreated natural gas to BGC from their wells.
BGC role is to transport and treat natural gas, turning it into valuable products. BGC
delivers these finished products to South Gas Company, which is responsible for
distributing them in the local market. BGC infrastructure consists of:
(31) http://www.basrahgas.com/
44
Iraqi Extractive Industries Transparency Initiative
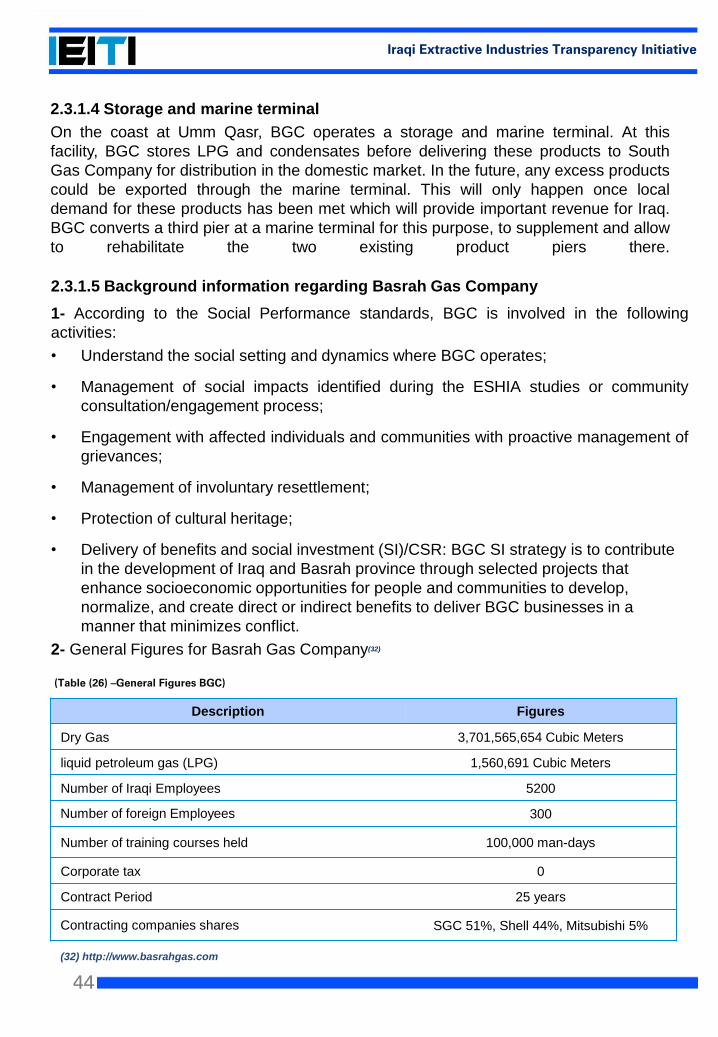
Description Figures
Dry Gas 3,701,565,654 Cubic Meters
liquid petroleum gas (LPG) 1,560,691 Cubic Meters
Number of Iraqi Employees 5200
Number of foreign Employees 300
Number of training courses held 100,000 man-days
Corporate tax 0
Contract Period 25 years
Contracting companies shares SGC 51%, Shell 44%, Mitsubishi 5%
2.3.1.4 Storage and marine terminal
On the coast at Umm Qasr, BGC operates a storage and marine terminal. At this
facility, BGC stores LPG and condensates before delivering these products to South
Gas Company for distribution in the domestic market. In the future, any excess products
could be exported through the marine terminal. This will only happen once local
demand for these products has been met which will provide important revenue for Iraq.
BGC converts a third pier at a marine terminal for this purpose, to supplement and allow
to rehabilitate the two existing product piers there.
2.3.1.5 Background information regarding Basrah Gas Company
1- According to the Social Performance standards, BGC is involved in the following
activities:
• Understand the social setting and dynamics where BGC operates;
• Management of social impacts identified during the ESHIA studies or community
consultation/engagement process;
• Engagement with affected individuals and communities with proactive management of
grievances;
• Management of involuntary resettlement;
• Protection of cultural heritage;
• Delivery of benefits and social investment (SI)/CSR: BGC SI strategy is to contribute
in the development of Iraq and Basrah province through selected projects that
enhance socioeconomic opportunities for people and communities to develop,
normalize, and create direct or indirect benefits to deliver BGC businesses in a
manner that minimizes conflict.
2- General Figures for Basrah Gas Company(32)
(32) http://www.basrahgas.com
(Table (26) –General Figures BGC)
45
Iraqi Extractive Industries Transparency Initiative
2.5 Beneficial Ownership (Road Map)
IEITI maintained a public register related to beneficial owners of the entities that bid for,
operate or invest in extractive assets, which define the beneficial owners, the level of
ownership and details about how ownership or control is exerted. MSG had published a
roadmap for disclosing beneficial ownership information as depicted in the following link:
http://ieiti.org.iq/uploads/beneficial%20ownership/Road%20Map%20of%20beneficial-
ownership%20of%20Iraq.pdf
46
Iraqi Extractive Industries Transparency Initiative
3Exploration & Production
EITI Requirement: 3- Exploration and production
47
Iraqi Extractive Industries Transparency Initiative
3.1 Exploration and Drilling Activities
3.1.1 Oil Exploration Company
Law No. (80) was established in year 1961, in accordance with the restored control over
Iraqi land. The foreign oil companies granted the control only over the productive fields,
where Iraq established (Iraqi national oil company) in year 1964 in order to manage oil
fortune.
In 1987, the state establishment had been changed to be an administratively, financially
and technically Independent state company, and it was named Oil Exploration Company
(OEC).
The main task of the company is to discover and evaluate, the new hydrocarbon
structures, by expert staff who use the latest version of technologies in the fields of
geology, seismic acquisition, interpretation, processing and laboratory researches and
analyses, supported by engineers, legal, administrative and finance staff. (33)
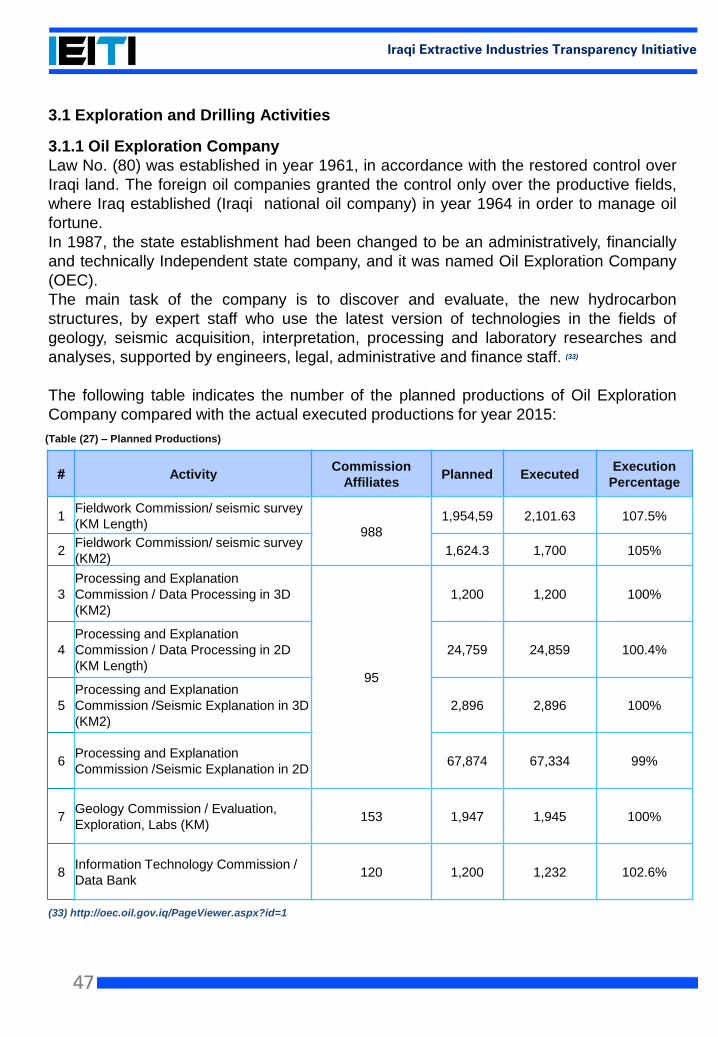
The following table indicates the number of the planned productions of Oil Exploration
Company compared with the actual executed productions for year 2015:
(33) http://oec.oil.gov.iq/PageViewer.aspx?id=1
# ActivityCommission
AffiliatesPlanned Executed
Execution
Percentage
1Fieldwork Commission/ seismic survey
(KM Length)988
1,954,59 2,101.63 107.5%
2Fieldwork Commission/ seismic survey
(KM2)1,624.3 1,700 105%
3
Processing and Explanation
Commission / Data Processing in 3D
(KM2)
95
1,200 1,200 100%
4
Processing and Explanation
Commission / Data Processing in 2D
(KM Length)
24,759 24,859 100.4%
5
Processing and Explanation
Commission /Seismic Explanation in 3D
(KM2)
2,896 2,896 100%
6Processing and Explanation
Commission /Seismic Explanation in 2D67,874 67,334 99%
7Geology Commission / Evaluation,
Exploration, Labs (KM)153 1,947 1,945 100%
8Information Technology Commission /
Data Bank120 1,200 1,232 102.6%
(Table (27) – Planned Productions)
48
Iraqi Extractive Industries Transparency Initiative
# ActivityCommission
AffiliatesPlanned Executed
Execution
Percentage
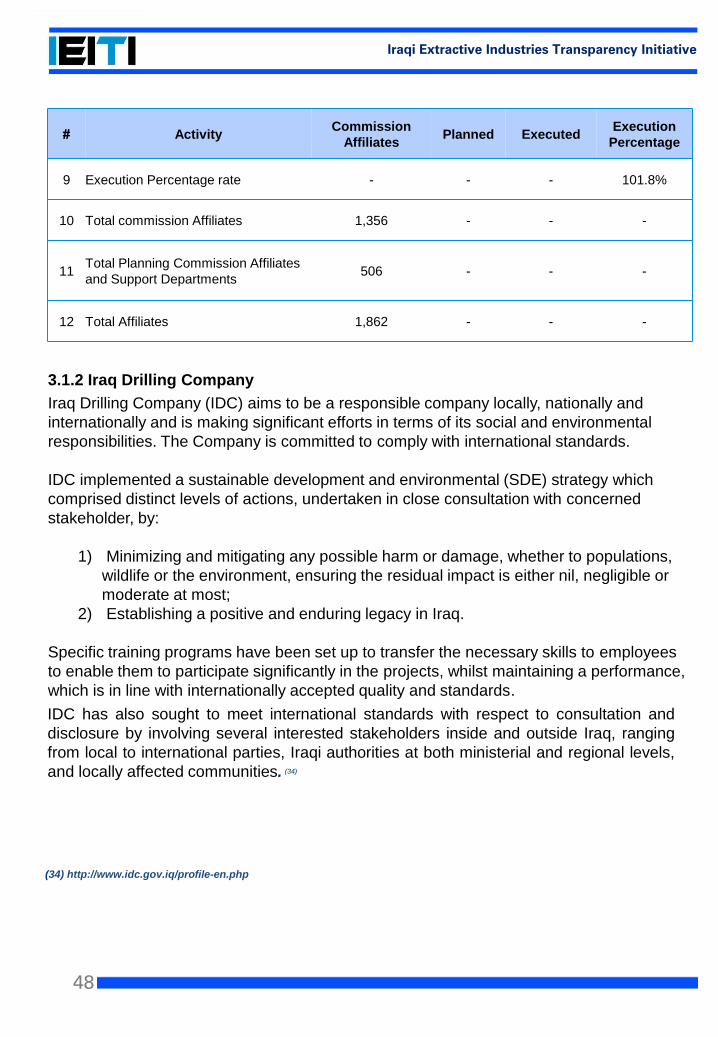
9 Execution Percentage rate - - - 101.8%
10 Total commission Affiliates 1,356 - - -
11Total Planning Commission Affiliates
and Support Departments506 - - -
12 Total Affiliates 1,862 - - -
3.1.2 Iraq Drilling Company
Iraq Drilling Company (IDC) aims to be a responsible company locally, nationally and
internationally and is making significant efforts in terms of its social and environmental
responsibilities. The Company is committed to comply with international standards.
IDC implemented a sustainable development and environmental (SDE) strategy which
comprised distinct levels of actions, undertaken in close consultation with concerned
stakeholder, by:
1) Minimizing and mitigating any possible harm or damage, whether to populations,
wildlife or the environment, ensuring the residual impact is either nil, negligible or
moderate at most;
2) Establishing a positive and enduring legacy in Iraq.
Specific training programs have been set up to transfer the necessary skills to employees
to enable them to participate significantly in the projects, whilst maintaining a performance,
which is in line with internationally accepted quality and standards.
IDC has also sought to meet international standards with respect to consultation and
disclosure by involving several interested stakeholders inside and outside Iraq, ranging
from local to international parties, Iraqi authorities at both ministerial and regional levels,
and locally affected communities. (34)
(34) http://www.idc.gov.iq/profile-en.php
49
Iraqi Extractive Industries Transparency Initiative
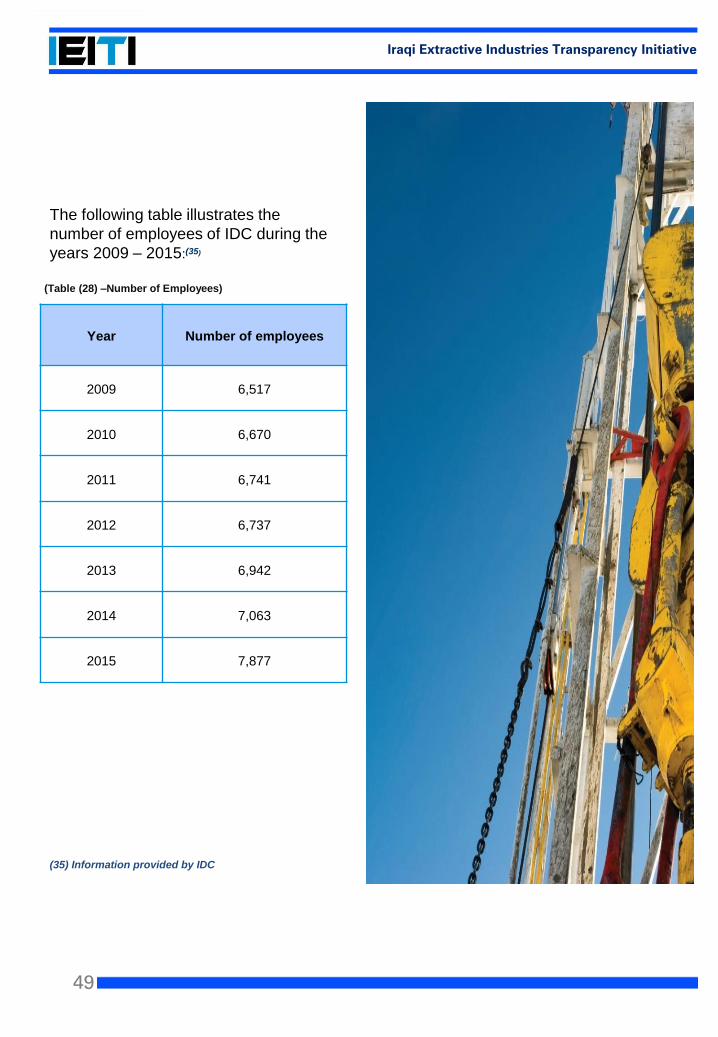
Year Number of employees
2009 6,517
2010 6,670
2011 6,741
2012 6,737
2013 6,942
2014 7,063
2015 7,877
(Table (28) –Number of Employees)
The following table illustrates the
number of employees of IDC during the
years 2009 – 2015:(35)
(35) Information provided by IDC
50
Iraqi Extractive Industries Transparency Initiative
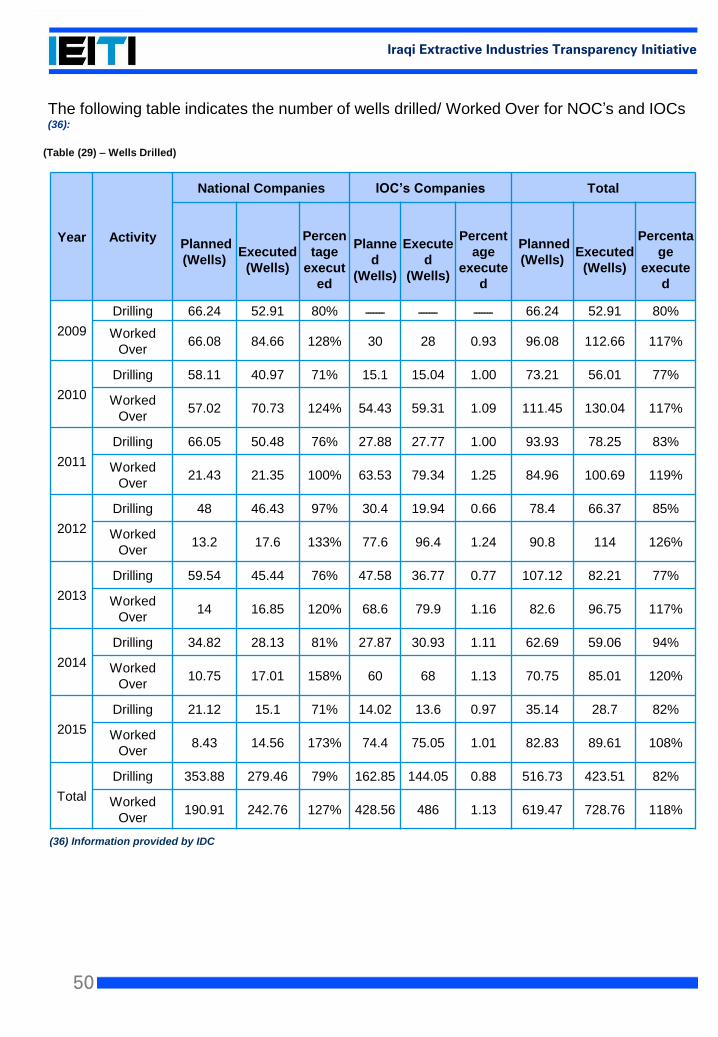
The following table indicates the number of wells drilled/ Worked Over for NOC’s and IOCs (36):
Year Activity
National Companies IOC’s Companies Total
Planned
(Wells)Executed
(Wells)
Percen
tage
execut
ed
Planne
d
(Wells)
Execute
d
(Wells)
Percent
age
execute
d
Planned
(Wells)Executed
(Wells)
Percenta
ge
execute
d
2009
Drilling 66.24 52.91 80% ـــــــ ـــــــ ـــــــ 66.24 52.91 80%
Worked
Over 66.08 84.66 128% 30 28 0.93 96.08 112.66 117%
2010
Drilling 58.11 40.97 71% 15.1 15.04 1.00 73.21 56.01 77%
Worked
Over57.02 70.73 124% 54.43 59.31 1.09 111.45 130.04 117%
2011
Drilling 66.05 50.48 76% 27.88 27.77 1.00 93.93 78.25 83%
Worked
Over21.43 21.35 100% 63.53 79.34 1.25 84.96 100.69 119%
2012
Drilling 48 46.43 97% 30.4 19.94 0.66 78.4 66.37 85%
Worked
Over13.2 17.6 133% 77.6 96.4 1.24 90.8 114 126%
2013
Drilling 59.54 45.44 76% 47.58 36.77 0.77 107.12 82.21 77%
Worked
Over14 16.85 120% 68.6 79.9 1.16 82.6 96.75 117%
2014
Drilling 34.82 28.13 81% 27.87 30.93 1.11 62.69 59.06 94%
Worked
Over10.75 17.01 158% 60 68 1.13 70.75 85.01 120%
2015
Drilling 21.12 15.1 71% 14.02 13.6 0.97 35.14 28.7 82%
Worked
Over8.43 14.56 173% 74.4 75.05 1.01 82.83 89.61 108%
Total
Drilling 353.88 279.46 79% 162.85 144.05 0.88 516.73 423.51 82%
Worked
Over190.91 242.76 127% 428.56 486 1.13 619.47 728.76 118%
(36) Information provided by IDC
(Table (29) – Wells Drilled)
51
Iraqi Extractive Industries Transparency Initiative
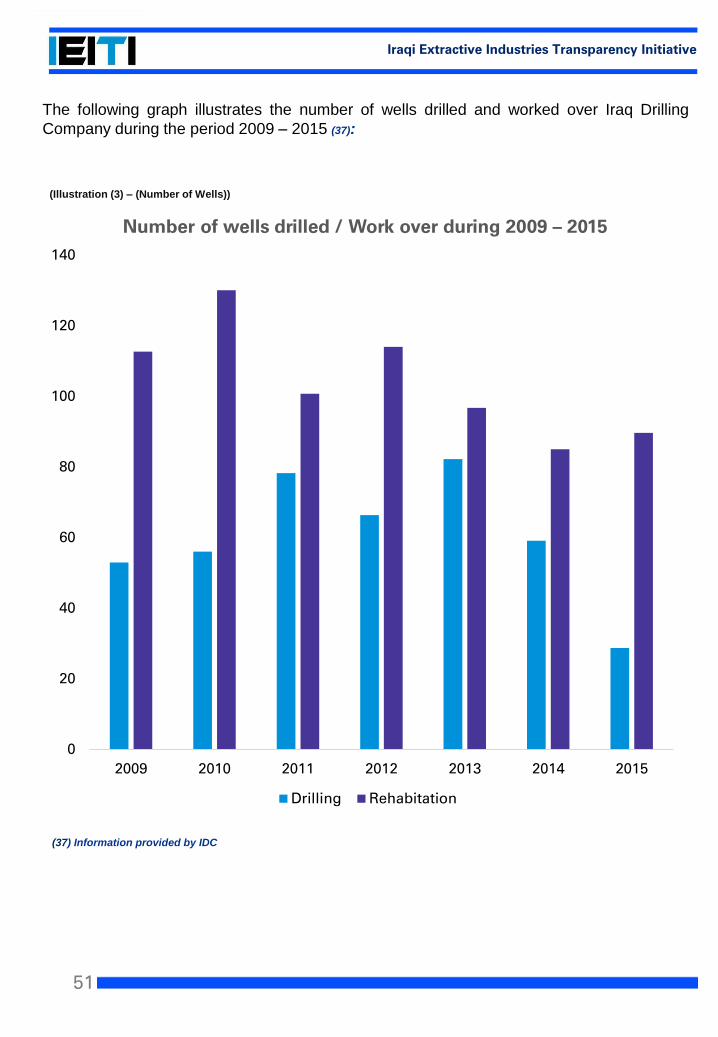
The following graph illustrates the number of wells drilled and worked over Iraq Drilling
Company during the period 2009 – 2015 (37):
0
20
40
60
80
100
120
140
2009 2010 2011 2012 2013 2014 2015
Number of wells drilled / Work over during 2009 – 2015
Drilling Rehabitation
(Illustration (3) – (Number of Wells))
(37) Information provided by IDC
52
Iraqi Extractive Industries Transparency Initiative
3.1.3 International Companies
There are four exploration contracts signed between Ministry of Oil and the International
Companies within the fourth licensing round, related to four geographic blocks:
1. Exploration block No. 8; which extends between Diyali and Wasit area of 4,000 square
kilometers. The contract was signed with “Pakistan Petroleum” as the field operator
over a period of 30 years for oil field and 40 years for gas field.
2. Exploration block No. 9; the block is located in Basra, and covers an area of 900
square kilometers and is adjacent to the Iranian border. The contract was signed with
“Kuwait Energy” as the field operator over a period 30 years for oil field and 40 years
for gas field as well.
3. Exploration block No. 10; a block of 500 square kilometers on the territory of the
governorate of Dhi Qar, and Muthanna, about 120 kilometers west of Basra
governorate. The contract was signed with “Lukoil Overseas Iraq Exploration” as the
field operator over a period of 30 years for oil field and 40 years for gas field.
4. Exploration block No. 12; an area of 9,020 square kilometers on the territory of the
governorates of Muthanna and Najaf. The contract was signed with “JSOC Bashneft”
as the field operator over a period of 30 years for oil field and 40 years for gas field.
For more details, please refer to section 2.3 Register of Licenses / 2.4 Contracts
3.2 Productions
3.2.1 Reconciliation of extracted crude oil quantities between Ministry of Oil and
South Oil Company and no variances were noted
Source: data presented in the table was reported by the respective entities (SOC and MoO)
SOC
(Barrels)MoO (Barrels) Variances (Barrels)
1,031,830,424 1,031,830,424 -
(Table (30) – Extracted Crude Oil (1))
3.2.2 Reconciliation of extracted crude oil quantities between Ministry of Oil and
North Oil Company, a material variance of USD 377,185,680 was identified
Source: data presented in the table was reported by the respective entities (NOC and MoO)
* The above materiality variance was due to the fact that 8,122,000 barrels of extracted crude oil are
from fields controlled by KRG, and were not reported in North Oil Company figures (as reported from
MoO and NOC)
NOC (Barrels) MoO (Barrels) Variances (Barrels)
59,227,053 67,349,053 8,122,000*
(Table (31) – Extracted Crude Oil (2))
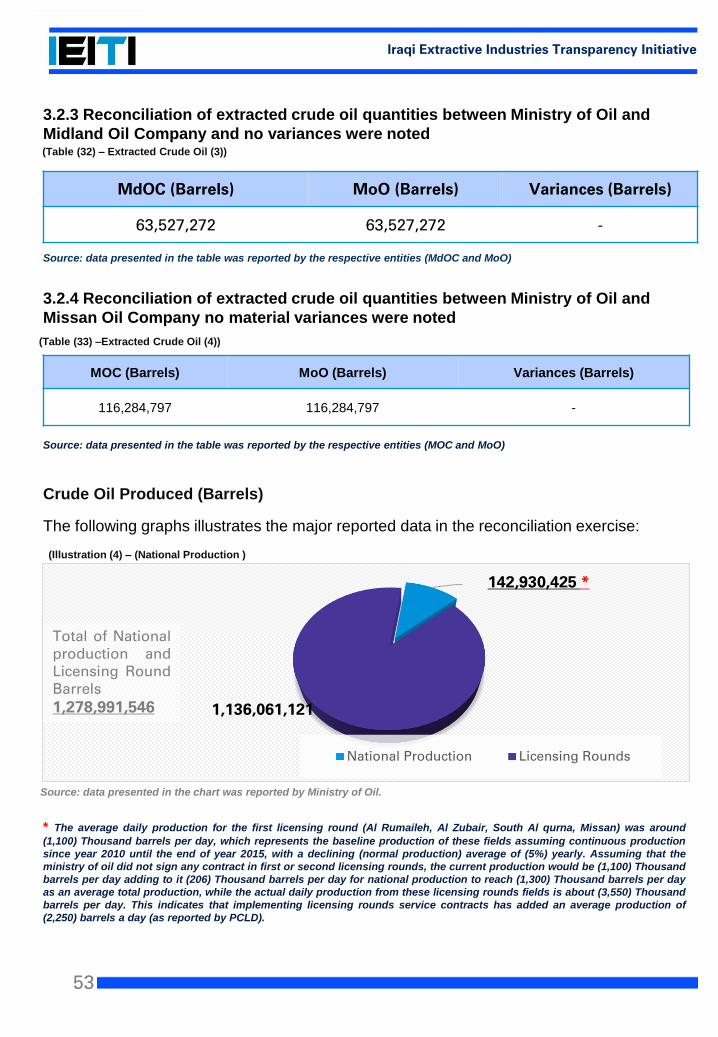
53
Iraqi Extractive Industries Transparency Initiative
3.2.3 Reconciliation of extracted crude oil quantities between Ministry of Oil and
Midland Oil Company and no variances were noted
Source: data presented in the table was reported by the respective entities (MdOC and MoO)
MdOC (Barrels) MoO (Barrels) Variances (Barrels)
63,527,272 63,527,272 -
(Table (32) – Extracted Crude Oil (3))
3.2.4 Reconciliation of extracted crude oil quantities between Ministry of Oil and
Missan Oil Company no material variances were noted
Source: data presented in the table was reported by the respective entities (MOC and MoO)
Crude Oil Produced (Barrels)
MOC (Barrels) MoO (Barrels) Variances (Barrels)
116,284,797 116,284,797 -
The following graphs illustrates the major reported data in the reconciliation exercise:
* The average daily production for the first licensing round (Al Rumaileh, Al Zubair, South Al qurna, Missan) was around
(1,100) Thousand barrels per day, which represents the baseline production of these fields assuming continuous production
since year 2010 until the end of year 2015, with a declining (normal production) average of (5%) yearly. Assuming that the
ministry of oil did not sign any contract in first or second licensing rounds, the current production would be (1,100) Thousand
barrels per day adding to it (206) Thousand barrels per day for national production to reach (1,300) Thousand barrels per day
as an average total production, while the actual daily production from these licensing rounds fields is about (3,550) Thousand
barrels per day. This indicates that implementing licensing rounds service contracts has added an average production of
(2,250) barrels a day (as reported by PCLD).
142,930,425 *
1,136,061,121
National Production Licensing Rounds
Total of Nationalproduction andLicensing RoundBarrels
1,278,991,546
Source: data presented in the chart was reported by Ministry of Oil.
(Illustration (4) – (National Production )
(Table (33) –Extracted Crude Oil (4))
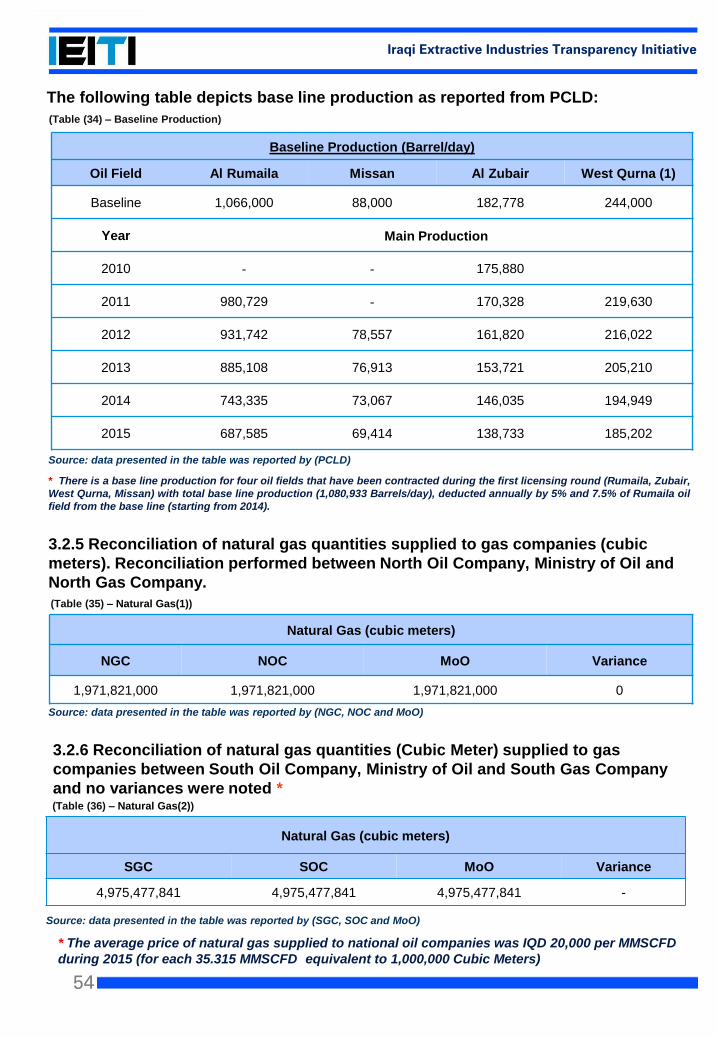
54
Iraqi Extractive Industries Transparency Initiative
Source: data presented in the table was reported by (PCLD)
* There is a base line production for four oil fields that have been contracted during the first licensing round (Rumaila, Zubair,
West Qurna, Missan) with total base line production (1,080,933 Barrels/day), deducted annually by 5% and 7.5% of Rumaila oil
field from the base line (starting from 2014).
3.2.5 Reconciliation of natural gas quantities supplied to gas companies (cubic
meters). Reconciliation performed between North Oil Company, Ministry of Oil and
North Gas Company.
Source: data presented in the table was reported by (NGC, NOC and MoO)
Natural Gas (cubic meters)
NGC NOC MoO Variance
1,971,821,000 1,971,821,000 1,971,821,000 0
(Table (35) – Natural Gas(1))
Baseline Production (Barrel/day)
West Qurna (1)Al ZubairMissan Al RumailaOil Field
244,000 182,778 88,000 1,066,000 Baseline
Main ProductionYear
175,880 --2010
219,630 170,328 -980,729 2011
216,022 161,820 78,557 931,742 2012
205,210 153,721 76,913 885,108 2013
194,949 146,035 73,067 743,335 2014
185,202 138,733 69,414 687,585 2015
(Table (34) – Baseline Production)
3.2.6 Reconciliation of natural gas quantities (Cubic Meter) supplied to gas
companies between South Oil Company, Ministry of Oil and South Gas Company
and no variances were noted *
Source: data presented in the table was reported by (SGC, SOC and MoO)
* The average price of natural gas supplied to national oil companies was IQD 20,000 per MMSCFD
during 2015 (for each 35.315 MMSCFD equivalent to 1,000,000 Cubic Meters)
Natural Gas (cubic meters)
SGC SOC MoO Variance
4,975,477,841 4,975,477,841 4,975,477,841 -
(Table (36) – Natural Gas(2))
The following table depicts base line production as reported from PCLD:
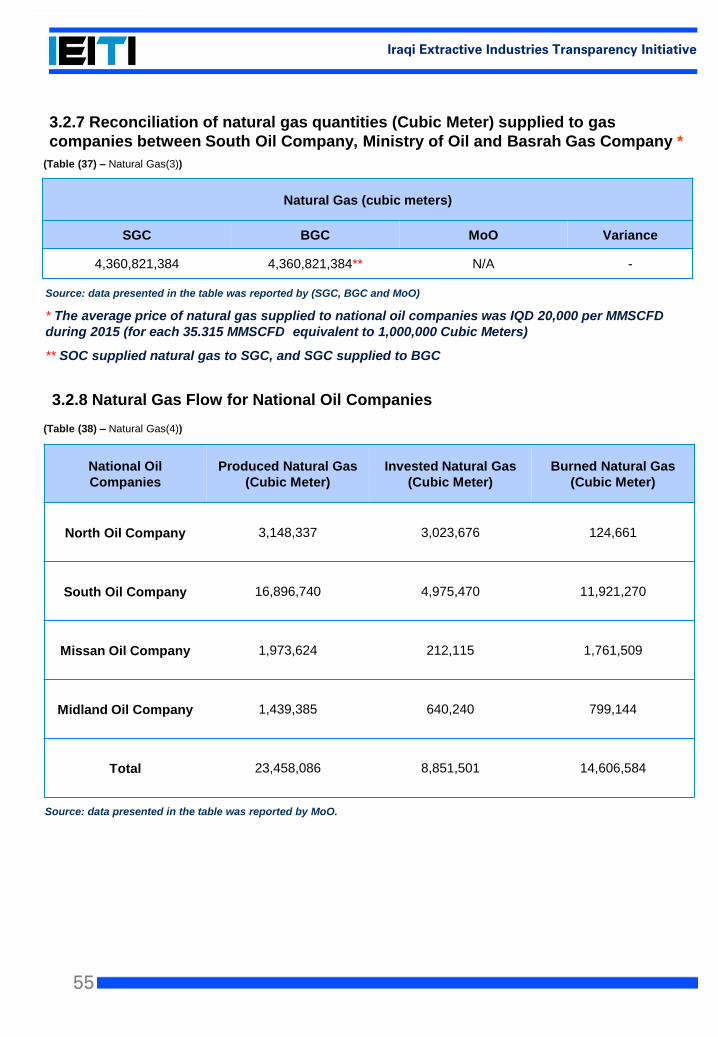
55
Iraqi Extractive Industries Transparency Initiative
3.2.7 Reconciliation of natural gas quantities (Cubic Meter) supplied to gas
companies between South Oil Company, Ministry of Oil and Basrah Gas Company *
Natural Gas (cubic meters)
SGC BGC MoO Variance
4,360,821,384 4,360,821,384** N/A -
Source: data presented in the table was reported by (SGC, BGC and MoO)
* The average price of natural gas supplied to national oil companies was IQD 20,000 per MMSCFD
during 2015 (for each 35.315 MMSCFD equivalent to 1,000,000 Cubic Meters)
** SOC supplied natural gas to SGC, and SGC supplied to BGC
(Table (37) – Natural Gas(3))
3.2.8 Natural Gas Flow for National Oil Companies
National Oil
Companies
Produced Natural Gas
(Cubic Meter)
Invested Natural Gas
(Cubic Meter)
Burned Natural Gas
(Cubic Meter)
North Oil Company 3,148,337 3,023,676 124,661
South Oil Company 16,896,740 4,975,470 11,921,270
Missan Oil Company 1,973,624 212,115 1,761,509
Midland Oil Company 1,439,385 640,240 799,144
Total 23,458,086 8,851,501 14,606,584
Source: data presented in the table was reported by MoO.
(Table (38) – Natural Gas(4))
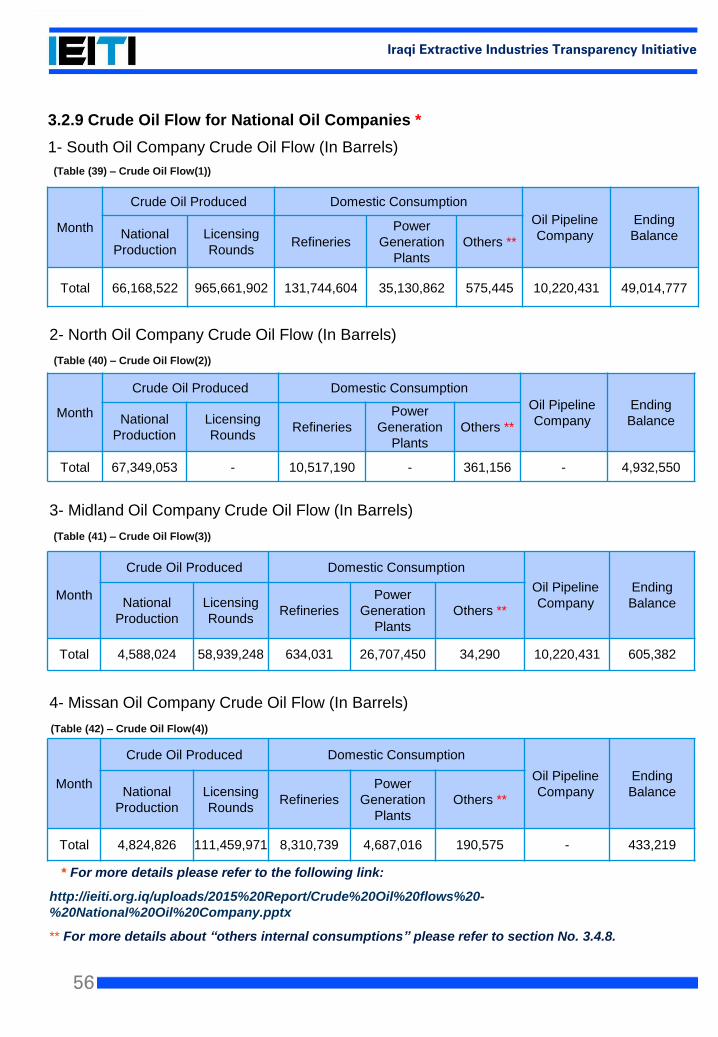
56
Iraqi Extractive Industries Transparency Initiative
3.2.9 Crude Oil Flow for National Oil Companies *
1- South Oil Company Crude Oil Flow (In Barrels)
Month
Crude Oil Produced Domestic Consumption
Oil Pipeline
Company
Ending
BalanceNational
Production
Licensing
RoundsRefineries
Power
Generation
Plants
Others **
Total 66,168,522 965,661,902 131,744,604 35,130,862 575,445 10,220,431 49,014,777
(Table (39) – Crude Oil Flow(1))
2- North Oil Company Crude Oil Flow (In Barrels)
3- Midland Oil Company Crude Oil Flow (In Barrels)
4- Missan Oil Company Crude Oil Flow (In Barrels)
* For more details please refer to the following link:
http://ieiti.org.iq/uploads/2015%20Report/Crude%20Oil%20flows%20-
%20National%20Oil%20Company.pptx
** For more details about “others internal consumptions” please refer to section No. 3.4.8.
Month
Crude Oil Produced Domestic Consumption
Oil Pipeline
Company
Ending
BalanceNational
Production
Licensing
RoundsRefineries
Power
Generation
Plants
Others **
Total 67,349,053 - 10,517,190 - 361,156 - 4,932,550
Month
Crude Oil Produced Domestic Consumption
Oil Pipeline
Company
Ending
BalanceNational
Production
Licensing
RoundsRefineries
Power
Generation
Plants
Others **
Total 4,588,024 58,939,248 634,031 26,707,450 34,290 10,220,431 605,382
Month
Crude Oil Produced Domestic Consumption
Oil Pipeline
Company
Ending
BalanceNational
Production
Licensing
RoundsRefineries
Power
Generation
Plants
Others **
Total 4,824,826 111,459,971 8,310,739 4,687,016 190,575 - 433,219
(Table (40) – Crude Oil Flow(2))
(Table (41) – Crude Oil Flow(3))
(Table (42) – Crude Oil Flow(4))
57
Iraqi Extractive Industries Transparency Initiative
3.2.10 Estimated Iraq Reserves of Mining
The Ministry of Industry and Minerals (MIM) of Iraq estimated the proven phosphate
reserves in the country to be 9,529,090,000 metric tons (MT), placing Iraq in global top
ten for phosphate rock reserves.(38)
A 2014 report on global phosphate reserves described the rock as “the foundation of
modern agriculture” and noted its price volatility, with a 900% price spike occurring in
2008.(39)
The US Geological Survey had placed Iraq’s limestone reserves at over 4.2 billion metric
tons (Gt), while MIM estimate it at 8 Gt. This is an important resource for a country that
was predicted in early 2014 to consume 21 million tons of cement for the year, with both
production and consumption forecast to rise rapidly by 2020.(40)
For Kaolinitic clays, mostly found in the western desert in Al Anbar, MIM estimated the
reserves at 1.2 Gt. Mining operations in Anbar were seriously disrupted in late 2013 and
2014 by ISIS.
In addition to large reserves of phosphate and limestone, Iraq also has significant
reserves of native sulfur, estimated at 600 MT, where these reserves are located in
Ninewa governorate. Iraq also has a number of other mineral reserves where production
figures are not listed by MIM such as dolomite, gypsum, glauberite, montmorillonite clays
and porcelanite. Iraq is still assessing its reserves of copper, lead, marble and zinc.
(38) http://minerals.usgs.gov/minerals/pubs/commodity/phosphate_rock/mcs-2015-phosp.pdf
(39) https://www.ifw-members.ifw-kiel.de/publications/global-availability-of-phosphorus-anditsimplications-for-global-food-
supply-aneconomic-overview/KWP%201897.pdf
(40) https://www.worldcement.com/africa-middle-east/02072014/cement_global_viewpoint_middle_east_426/
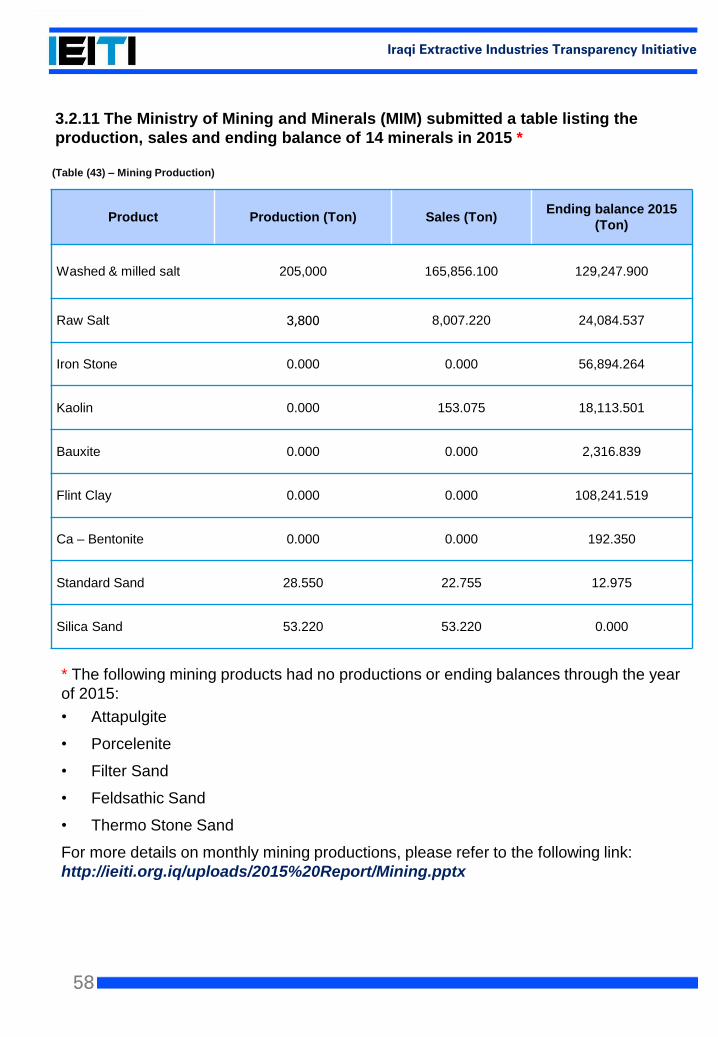
58
Iraqi Extractive Industries Transparency Initiative
3.2.11 The Ministry of Mining and Minerals (MIM) submitted a table listing the
production, sales and ending balance of 14 minerals in 2015 *
Product Production (Ton) Sales (Ton)Ending balance 2015
(Ton)
Washed & milled salt 205,000 165,856.100 129,247.900
Raw Salt 3,800 8,007.220 24,084.537
Iron Stone 0.000 0.000 56,894.264
Kaolin 0.000 153.075 18,113.501
Bauxite 0.000 0.000 2,316.839
Flint Clay 0.000 0.000 108,241.519
Ca – Bentonite 0.000 0.000 192.350
Standard Sand 28.550 22.755 12.975
Silica Sand 53.220 53.220 0.000
(Table (43) – Mining Production)
* The following mining products had no productions or ending balances through the year
of 2015:
• Attapulgite
• Porcelenite
• Filter Sand
• Feldsathic Sand
• Thermo Stone Sand
For more details on monthly mining productions, please refer to the following link:
http://ieiti.org.iq/uploads/2015%20Report/Mining.pptx
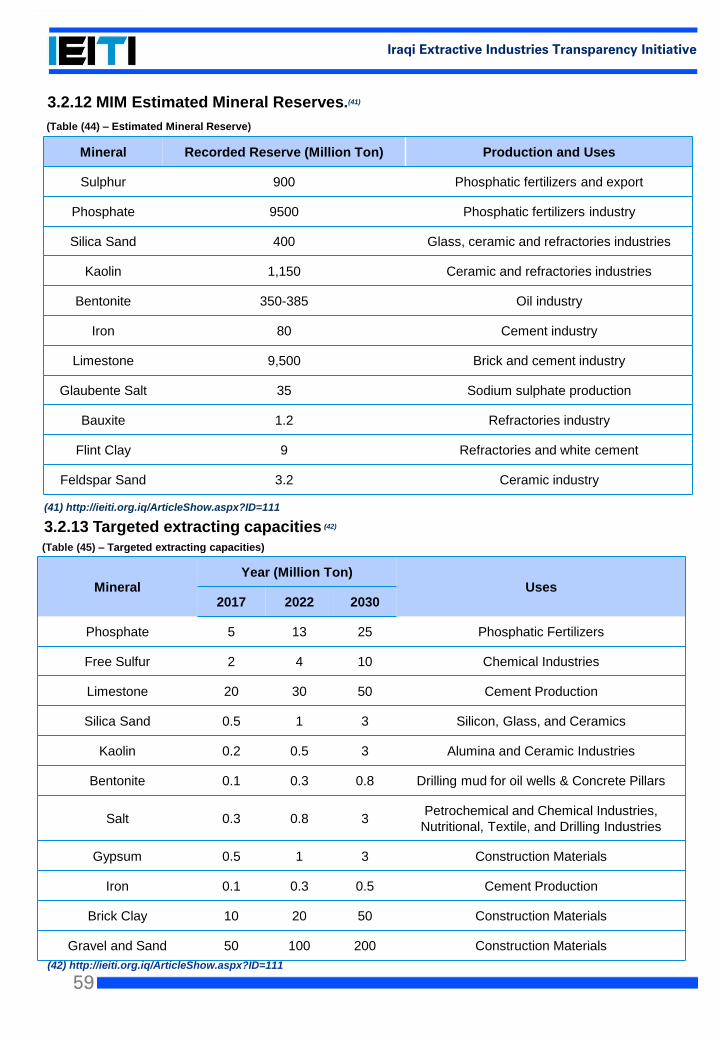
59
Iraqi Extractive Industries Transparency Initiative
MineralYear (Million Ton)
Uses2017 2022 2030
Phosphate 5 13 25 Phosphatic Fertilizers
Free Sulfur 2 4 10 Chemical Industries
Limestone 20 30 50 Cement Production
Silica Sand 0.5 1 3 Silicon, Glass, and Ceramics
Kaolin 0.2 0.5 3 Alumina and Ceramic Industries
Bentonite 0.1 0.3 0.8 Drilling mud for oil wells & Concrete Pillars
Salt 0.3 0.8 3Petrochemical and Chemical Industries,
Nutritional, Textile, and Drilling Industries
Gypsum 0.5 1 3 Construction Materials
Iron 0.1 0.3 0.5 Cement Production
Brick Clay 10 20 50 Construction Materials
Gravel and Sand 50 100 200 Construction Materials
3.2.12 MIM Estimated Mineral Reserves.(41)
Mineral Recorded Reserve (Million Ton) Production and Uses
Sulphur 900 Phosphatic fertilizers and export
Phosphate 9500 Phosphatic fertilizers industry
Silica Sand 400 Glass, ceramic and refractories industries
Kaolin 1,150 Ceramic and refractories industries
Bentonite 350-385 Oil industry
Iron 80 Cement industry
Limestone 9,500 Brick and cement industry
Glaubente Salt 35 Sodium sulphate production
Bauxite 1.2 Refractories industry
Flint Clay 9 Refractories and white cement
Feldspar Sand 3.2 Ceramic industry
(41) http://ieiti.org.iq/ArticleShow.aspx?ID=111
(Table (44) – Estimated Mineral Reserve)
3.2.13 Targeted extracting capacities (42)
(42) http://ieiti.org.iq/ArticleShow.aspx?ID=111
(Table (45) – Targeted extracting capacities)
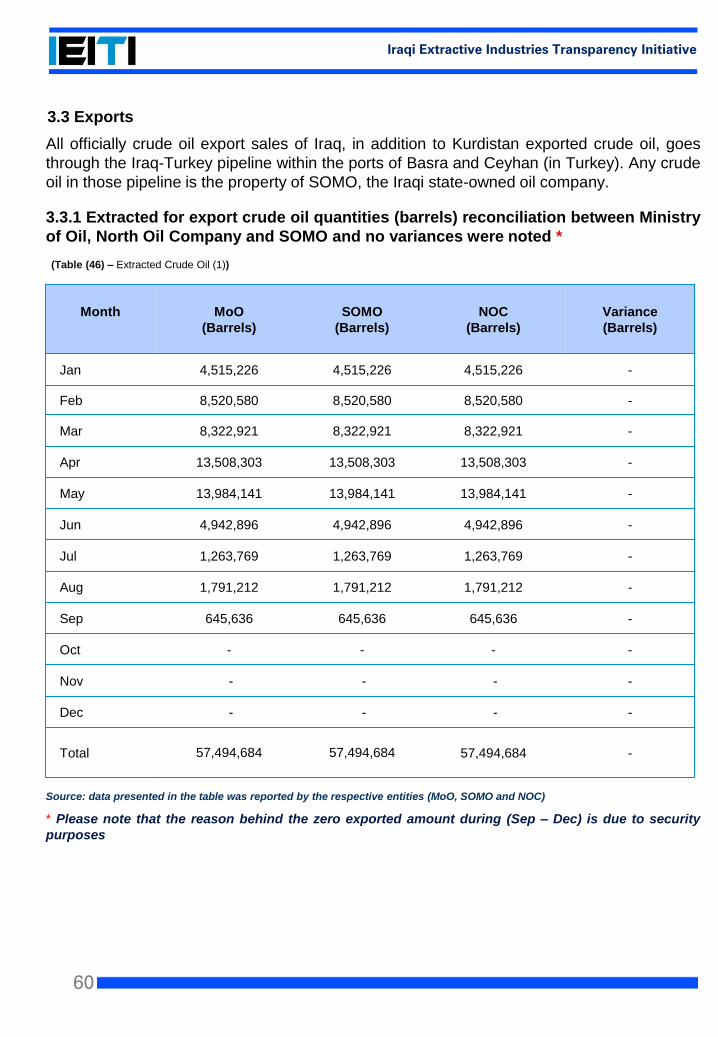
60
Iraqi Extractive Industries Transparency Initiative
All officially crude oil export sales of Iraq, in addition to Kurdistan exported crude oil, goes
through the Iraq-Turkey pipeline within the ports of Basra and Ceyhan (in Turkey). Any crude
oil in those pipeline is the property of SOMO, the Iraqi state-owned oil company.
3.3.1 Extracted for export crude oil quantities (barrels) reconciliation between Ministry
of Oil, North Oil Company and SOMO and no variances were noted *
Source: data presented in the table was reported by the respective entities (MoO, SOMO and NOC)
* Please note that the reason behind the zero exported amount during (Sep – Dec) is due to security
purposes
3.3 Exports
Month MoO
(Barrels)
SOMO
(Barrels)
NOC
(Barrels)
Variance
(Barrels)
Jan 4,515,226 4,515,226 4,515,226 -
Feb 8,520,580 8,520,580 8,520,580 -
Mar 8,322,921 8,322,921 8,322,921 -
Apr 13,508,303 13,508,303 13,508,303 -
May 13,984,141 13,984,141 13,984,141 -
Jun 4,942,896 4,942,896 4,942,896 -
Jul 1,263,769 1,263,769 1,263,769 -
Aug 1,791,212 1,791,212 1,791,212 -
Sep 645,636 645,636 645,636 -
Oct - - - -
Nov - - - -
Dec - - - -
Total 57,494,684 57,494,684 57,494,684 -
(Table (46) – Extracted Crude Oil (1))
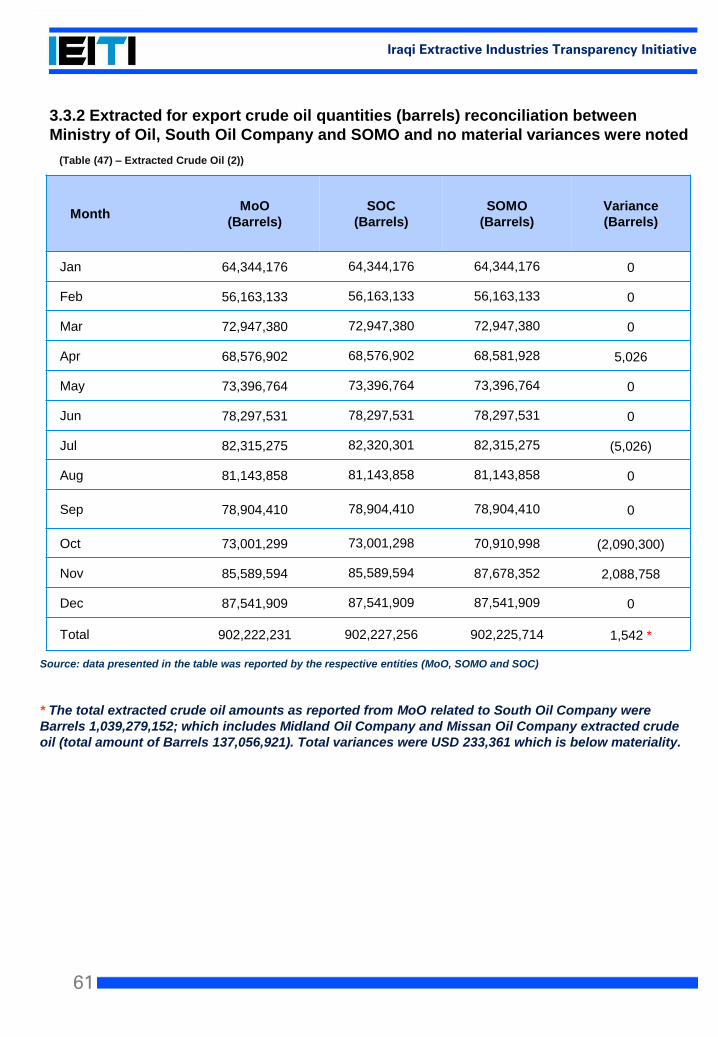
61
Iraqi Extractive Industries Transparency Initiative
Source: data presented in the table was reported by the respective entities (MoO, SOMO and SOC)
* The total extracted crude oil amounts as reported from MoO related to South Oil Company were
Barrels 1,039,279,152; which includes Midland Oil Company and Missan Oil Company extracted crude
oil (total amount of Barrels 137,056,921). Total variances were USD 233,361 which is below materiality.
Month MoO
(Barrels)
SOC
(Barrels)
SOMO
(Barrels)
Variance
(Barrels)
Jan 64,344,176 64,344,176 64,344,176 0
Feb 56,163,133 56,163,133 56,163,133 0
Mar 72,947,380 72,947,380 72,947,380 0
Apr 68,576,902 68,576,902 68,581,928 5,026
May 73,396,764 73,396,764 73,396,764 0
Jun 78,297,531 78,297,531 78,297,531 0
Jul 82,315,275 82,320,301 82,315,275 (5,026)
Aug 81,143,858 81,143,858 81,143,858 0
Sep 78,904,410 78,904,410 78,904,410 0
Oct 73,001,299 73,001,298 70,910,998 (2,090,300)
Nov 85,589,594 85,589,594 87,678,352 2,088,758
Dec 87,541,909 87,541,909 87,541,909 0
Total 902,222,231 902,227,256 902,225,714 1,542 *
(Table (47) – Extracted Crude Oil (2))
3.3.2 Extracted for export crude oil quantities (barrels) reconciliation between
Ministry of Oil, South Oil Company and SOMO and no material variances were noted
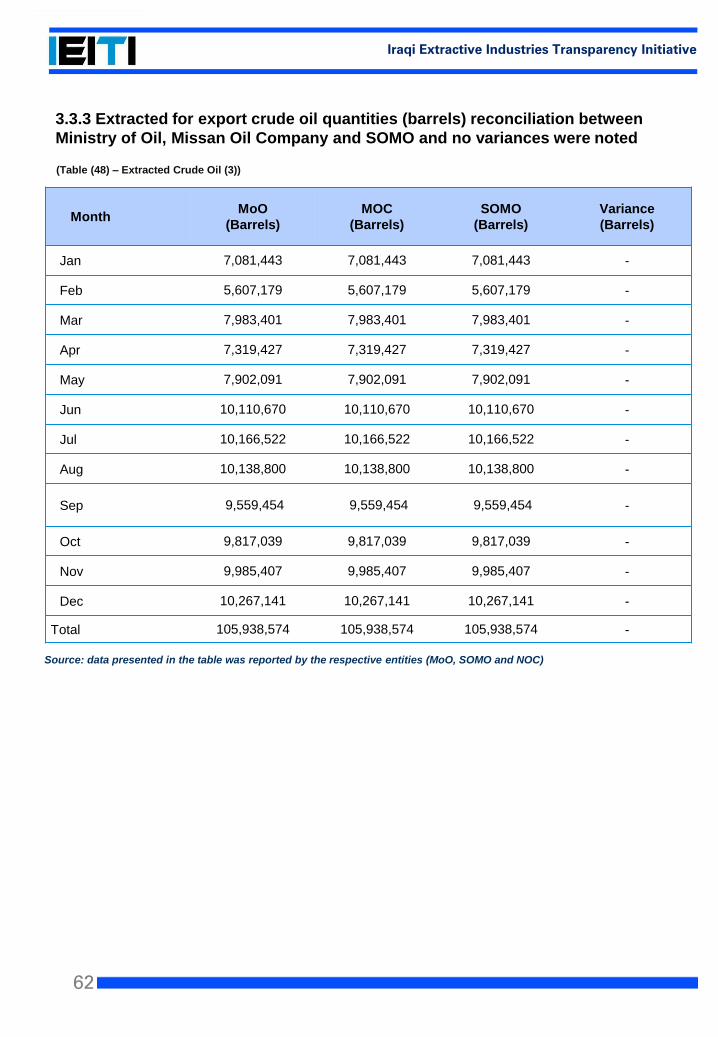
62
Iraqi Extractive Industries Transparency Initiative
Source: data presented in the table was reported by the respective entities (MoO, SOMO and NOC)
Month MoO
(Barrels)
MOC
(Barrels)
SOMO
(Barrels)
Variance
(Barrels)
Jan 7,081,443 7,081,443 7,081,443 -
Feb 5,607,179 5,607,179 5,607,179 -
Mar 7,983,401 7,983,401 7,983,401 -
Apr 7,319,427 7,319,427 7,319,427 -
May 7,902,091 7,902,091 7,902,091 -
Jun 10,110,670 10,110,670 10,110,670 -
Jul 10,166,522 10,166,522 10,166,522 -
Aug 10,138,800 10,138,800 10,138,800 -
Sep 9,559,454 9,559,454 9,559,454 -
Oct 9,817,039 9,817,039 9,817,039 -
Nov 9,985,407 9,985,407 9,985,407 -
Dec 10,267,141 10,267,141 10,267,141 -
Total 105,938,574 105,938,574 105,938,574 -
(Table (48) – Extracted Crude Oil (3))
3.3.3 Extracted for export crude oil quantities (barrels) reconciliation between
Ministry of Oil, Missan Oil Company and SOMO and no variances were noted
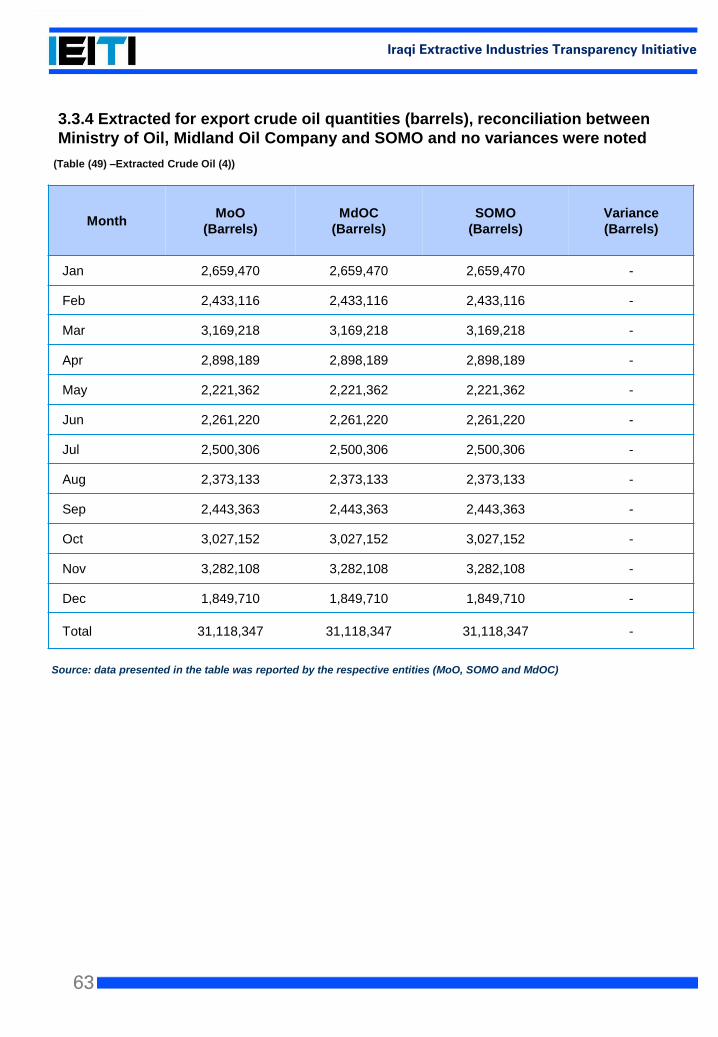
63
Iraqi Extractive Industries Transparency Initiative
Source: data presented in the table was reported by the respective entities (MoO, SOMO and MdOC)
Month MoO
(Barrels)
MdOC
(Barrels)
SOMO
(Barrels)
Variance
(Barrels)
Jan 2,659,470 2,659,470 2,659,470 -
Feb 2,433,116 2,433,116 2,433,116 -
Mar 3,169,218 3,169,218 3,169,218 -
Apr 2,898,189 2,898,189 2,898,189 -
May 2,221,362 2,221,362 2,221,362 -
Jun 2,261,220 2,261,220 2,261,220 -
Jul 2,500,306 2,500,306 2,500,306 -
Aug 2,373,133 2,373,133 2,373,133 -
Sep 2,443,363 2,443,363 2,443,363 -
Oct 3,027,152 3,027,152 3,027,152 -
Nov 3,282,108 3,282,108 3,282,108 -
Dec 1,849,710 1,849,710 1,849,710 -
Total 31,118,347 31,118,347 31,118,347 -
(Table (49) –Extracted Crude Oil (4))
3.3.4 Extracted for export crude oil quantities (barrels), reconciliation between
Ministry of Oil, Midland Oil Company and SOMO and no variances were noted
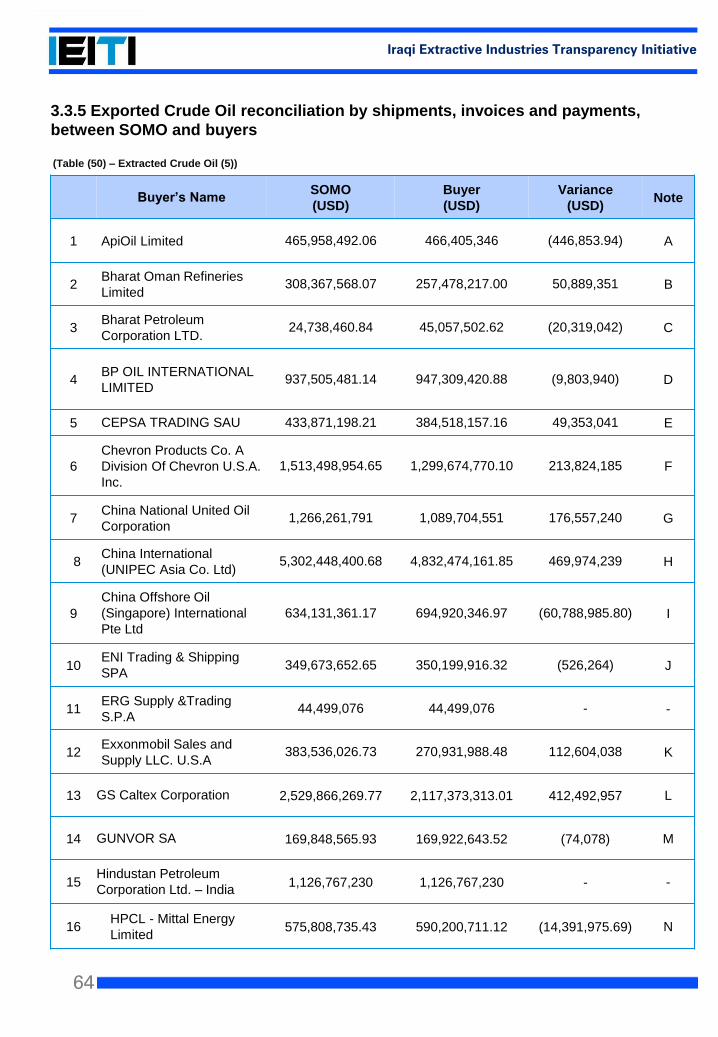
64
Iraqi Extractive Industries Transparency Initiative
3.3.5 Exported Crude Oil reconciliation by shipments, invoices and payments,
between SOMO and buyers
Buyer’s Name SOMO
(USD)
Buyer
(USD)
Variance
(USD)Note
1 ApiOil Limited 465,958,492.06 466,405,346 (446,853.94) A
2Bharat Oman Refineries
Limited308,367,568.07 257,478,217.00 50,889,351 B
3Bharat Petroleum
Corporation LTD.24,738,460.84 45,057,502.62 (20,319,042) C
4BP OIL INTERNATIONAL
LIMITED 937,505,481.14 947,309,420.88 (9,803,940) D
5 CEPSA TRADING SAU 433,871,198.21 384,518,157.16 49,353,041 E
6
Chevron Products Co. A
Division Of Chevron U.S.A.
Inc.
1,513,498,954.65 1,299,674,770.10 213,824,185 F
7China National United Oil
Corporation 1,266,261,791 1,089,704,551 176,557,240 G
8China International
(UNIPEC Asia Co. Ltd)5,302,448,400.68 4,832,474,161.85 469,974,239 H
9
China Offshore Oil
(Singapore) International
Pte Ltd
634,131,361.17 694,920,346.97 (60,788,985.80) I
10ENI Trading & Shipping
SPA 349,673,652.65 350,199,916.32 (526,264) J
11ERG Supply &Trading
S.P.A 44,499,076 44,499,076 - -
12Exxonmobil Sales and
Supply LLC. U.S.A383,536,026.73 270,931,988.48 112,604,038 K
13 GS Caltex Corporation 2,529,866,269.77 2,117,373,313.01 412,492,957 L
14 GUNVOR SA 169,848,565.93 169,922,643.52 (74,078) M
15Hindustan Petroleum
Corporation Ltd. – India 1,126,767,230 1,126,767,230 - -
16HPCL - Mittal Energy
Limited 575,808,735.43 590,200,711.12 (14,391,975.69) N
(Table (50) – Extracted Crude Oil (5))

65
Iraqi Extractive Industries Transparency Initiative
Buyer’s Name SOMO
(USD)
Buyer
(USD)
Variance
(USD)Note
17IPLOM INTERNATIONAL
SA 212,625,363.45 213,181,726.00 (556,363) O
18JX Nippon Oil & Energy
Corporation 792,385,231.95 575,828,083.81 216,557,148 P
19Koch Supply & Trading, LP
****178,737,822.70 To be provided - -
20LITASCO MIDDLE
EAST DMCC 290,507,090.47 258,423,909.88 32,083,181 Q
21MOTOR OIL HELLAS
CORINTH REFINERIES S.A 688,534,690.93 665,261,034.09 23,273,657 R
22China ZhenHua Oil Co.Ltd.-
Main/ (North Petroleum) 1,136,803,277 1,083,332,386 53,470,891 S
23
Petro Diamond Company
limited / Care of Mitsubishi
Corporation 606,886,912.31 494,774,042.00 112,112,870 T
24
PETCO Trading Labuan
Company Limited
(PTLCL) / Petronas
413,443,623.13 340,028,673.05 73,414,950 U
25Petrobras Global Trading
B.V.292,774,733.19 196,772,356.69 96,002,376.50 V
26 PETROGAL S. 97,558,291.17 123,740,596.39 (26,182,305) W
27Phillips 66 International
Trading Pte. Ltd. 1,322,708,713.70 1,327,496,242.66 (4,787,529) X
28 REPSOL TRADING, S. 734,041,171.20 651,732,358.16 82,308,813 Y
29RELIANCE INDUSTRIES
LIMITED(RIL)107,041,507.02 205,299,288.00 (98,257,780.98) Z
30 SARAS S.P.A. 307,776,080.98 308,597,442.99 (821,362) AA
31
SOCIETE ANONYME
MAROCAINE DE
L’INDUSTRIE DU
RAFFINAGE (SAMIR)
81,873,686 81,873,686 - -
32
SHELL INTERNATIONAL
EASTERN TRADING
COMPANY 678,608,552.86 527,592,627.22 151,015,925 AB
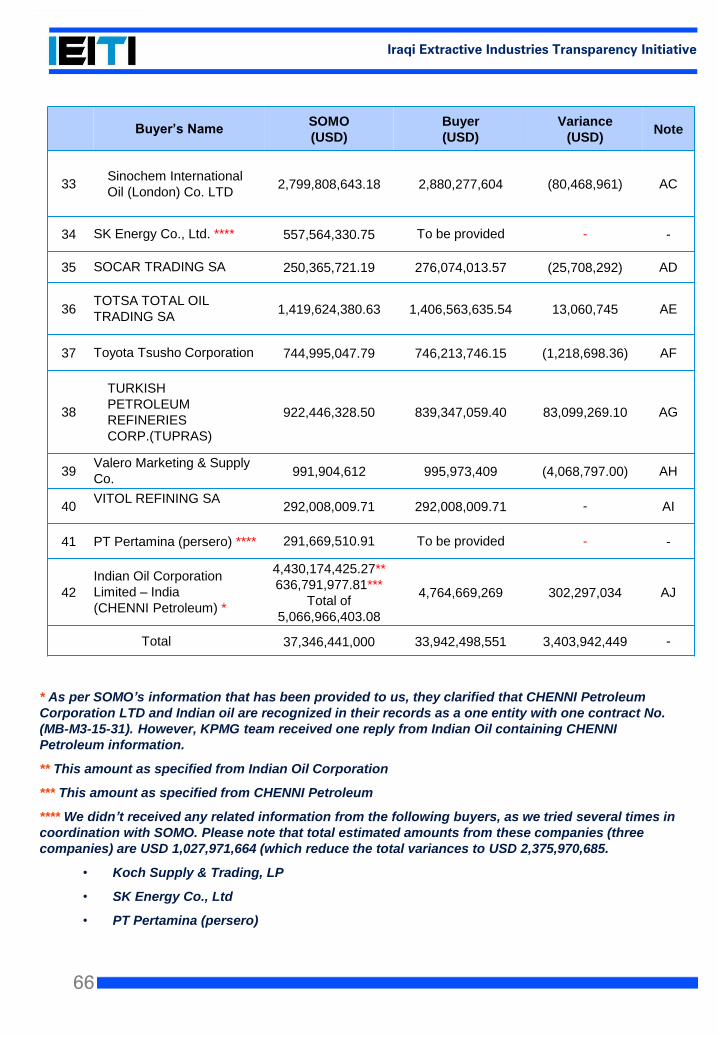
66
Iraqi Extractive Industries Transparency Initiative
Buyer’s Name SOMO
(USD)
Buyer
(USD)
Variance
(USD)Note
33Sinochem International
Oil (London) Co. LTD2,799,808,643.18 2,880,277,604 (80,468,961) AC
34 SK Energy Co., Ltd. **** 557,564,330.75 To be provided - -
35 SOCAR TRADING SA 250,365,721.19 276,074,013.57 (25,708,292) AD
36TOTSA TOTAL OIL
TRADING SA 1,419,624,380.63 1,406,563,635.54 13,060,745 AE
37 Toyota Tsusho Corporation 744,995,047.79 746,213,746.15 (1,218,698.36) AF
38
TURKISH
PETROLEUM
REFINERIES
CORP.(TUPRAS)
922,446,328.50 839,347,059.40 83,099,269.10 AG
39Valero Marketing & Supply
Co. 991,904,612 995,973,409 (4,068,797.00) AH
40VITOL REFINING SA
292,008,009.71 292,008,009.71 - AI
41 PT Pertamina (persero) **** 291,669,510.91 To be provided - -
42
Indian Oil Corporation
Limited – India
(CHENNI Petroleum) *
4,430,174,425.27**
636,791,977.81***
Total of
5,066,966,403.08
4,764,669,269 302,297,034 AJ
Total 37,346,441,000 33,942,498,551 3,403,942,449 -
* As per SOMO’s information that has been provided to us, they clarified that CHENNI Petroleum
Corporation LTD and Indian oil are recognized in their records as a one entity with one contract No.
(MB-M3-15-31). However, KPMG team received one reply from Indian Oil containing CHENNI
Petroleum information.
** This amount as specified from Indian Oil Corporation
*** This amount as specified from CHENNI Petroleum
**** We didn’t received any related information from the following buyers, as we tried several times in
coordination with SOMO. Please note that total estimated amounts from these companies (three
companies) are USD 1,027,971,664 (which reduce the total variances to USD 2,375,970,685.
• Koch Supply & Trading, LP
• SK Energy Co., Ltd
• PT Pertamina (persero)
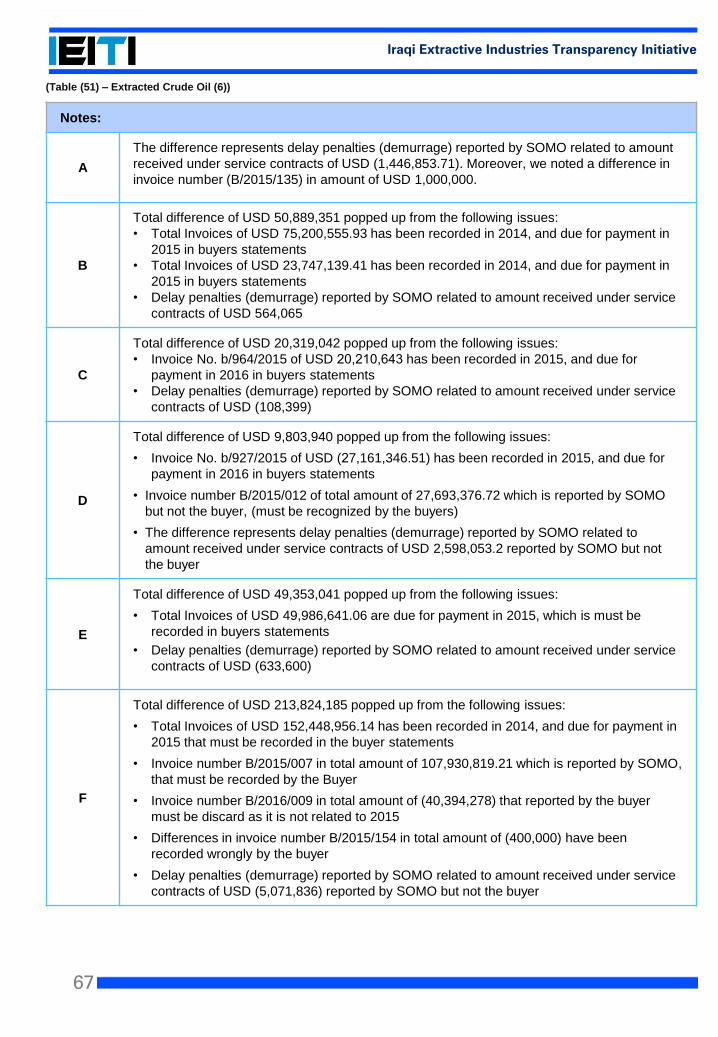
67
Iraqi Extractive Industries Transparency Initiative
Notes:
A
The difference represents delay penalties (demurrage) reported by SOMO related to amount
received under service contracts of USD (1,446,853.71). Moreover, we noted a difference in
invoice number (B/2015/135) in amount of USD 1,000,000.
B
Total difference of USD 50,889,351 popped up from the following issues:
• Total Invoices of USD 75,200,555.93 has been recorded in 2014, and due for payment in
2015 in buyers statements
• Total Invoices of USD 23,747,139.41 has been recorded in 2014, and due for payment in
2015 in buyers statements
• Delay penalties (demurrage) reported by SOMO related to amount received under service
contracts of USD 564,065
C
Total difference of USD 20,319,042 popped up from the following issues:
• Invoice No. b/964/2015 of USD 20,210,643 has been recorded in 2015, and due for
payment in 2016 in buyers statements
• Delay penalties (demurrage) reported by SOMO related to amount received under service
contracts of USD (108,399)
D
Total difference of USD 9,803,940 popped up from the following issues:
• Invoice No. b/927/2015 of USD (27,161,346.51) has been recorded in 2015, and due for
payment in 2016 in buyers statements
• Invoice number B/2015/012 of total amount of 27,693,376.72 which is reported by SOMO
but not the buyer, (must be recognized by the buyers)
• The difference represents delay penalties (demurrage) reported by SOMO related to
amount received under service contracts of USD 2,598,053.2 reported by SOMO but not
the buyer
E
Total difference of USD 49,353,041 popped up from the following issues:
• Total Invoices of USD 49,986,641.06 are due for payment in 2015, which is must be
recorded in buyers statements
• Delay penalties (demurrage) reported by SOMO related to amount received under service
contracts of USD (633,600)
F
Total difference of USD 213,824,185 popped up from the following issues:
• Total Invoices of USD 152,448,956.14 has been recorded in 2014, and due for payment in
2015 that must be recorded in the buyer statements
• Invoice number B/2015/007 in total amount of 107,930,819.21 which is reported by SOMO,
that must be recorded by the Buyer
• Invoice number B/2016/009 in total amount of (40,394,278) that reported by the buyer
must be discard as it is not related to 2015
• Differences in invoice number B/2015/154 in total amount of (400,000) have been
recorded wrongly by the buyer
• Delay penalties (demurrage) reported by SOMO related to amount received under service
contracts of USD (5,071,836) reported by SOMO but not the buyer
(Table (51) – Extracted Crude Oil (6))
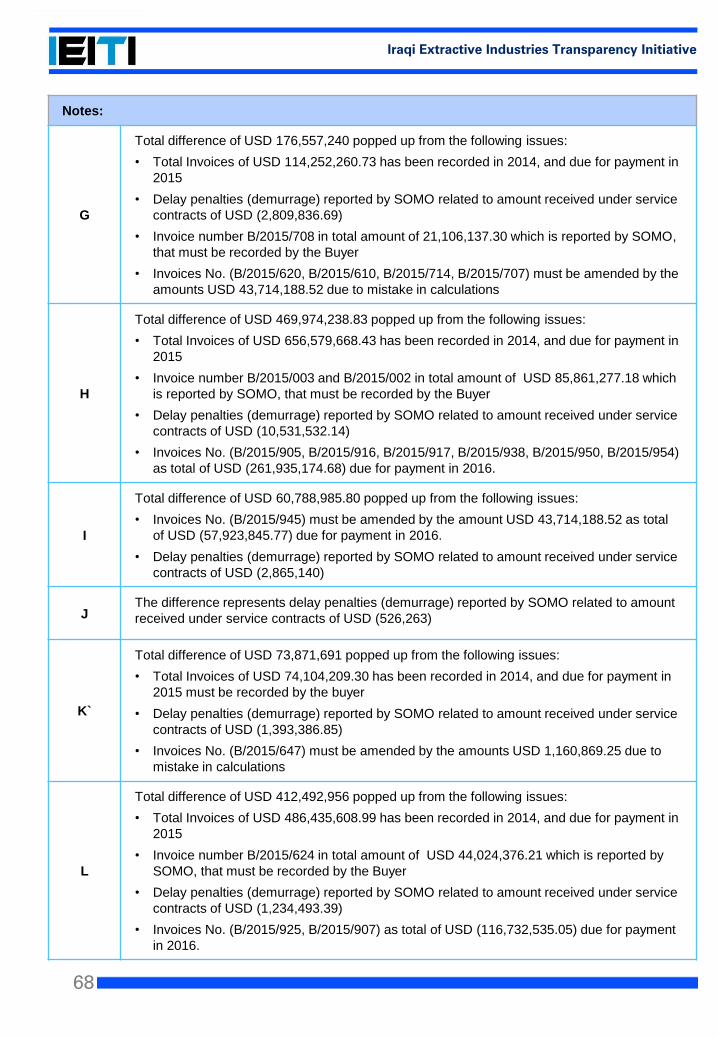
68
Iraqi Extractive Industries Transparency Initiative
Notes:
G
Total difference of USD 176,557,240 popped up from the following issues:
• Total Invoices of USD 114,252,260.73 has been recorded in 2014, and due for payment in
2015
• Delay penalties (demurrage) reported by SOMO related to amount received under service
contracts of USD (2,809,836.69)
• Invoice number B/2015/708 in total amount of 21,106,137.30 which is reported by SOMO,
that must be recorded by the Buyer
• Invoices No. (B/2015/620, B/2015/610, B/2015/714, B/2015/707) must be amended by the
amounts USD 43,714,188.52 due to mistake in calculations
H
Total difference of USD 469,974,238.83 popped up from the following issues:
• Total Invoices of USD 656,579,668.43 has been recorded in 2014, and due for payment in
2015
• Invoice number B/2015/003 and B/2015/002 in total amount of USD 85,861,277.18 which
is reported by SOMO, that must be recorded by the Buyer
• Delay penalties (demurrage) reported by SOMO related to amount received under service
contracts of USD (10,531,532.14)
• Invoices No. (B/2015/905, B/2015/916, B/2015/917, B/2015/938, B/2015/950, B/2015/954)
as total of USD (261,935,174.68) due for payment in 2016.
I
Total difference of USD 60,788,985.80 popped up from the following issues:
• Invoices No. (B/2015/945) must be amended by the amount USD 43,714,188.52 as total
of USD (57,923,845.77) due for payment in 2016.
• Delay penalties (demurrage) reported by SOMO related to amount received under service
contracts of USD (2,865,140)
JThe difference represents delay penalties (demurrage) reported by SOMO related to amount
received under service contracts of USD (526,263)
K`
Total difference of USD 73,871,691 popped up from the following issues:
• Total Invoices of USD 74,104,209.30 has been recorded in 2014, and due for payment in
2015 must be recorded by the buyer
• Delay penalties (demurrage) reported by SOMO related to amount received under service
contracts of USD (1,393,386.85)
• Invoices No. (B/2015/647) must be amended by the amounts USD 1,160,869.25 due to
mistake in calculations
L
Total difference of USD 412,492,956 popped up from the following issues:
• Total Invoices of USD 486,435,608.99 has been recorded in 2014, and due for payment in
2015
• Invoice number B/2015/624 in total amount of USD 44,024,376.21 which is reported by
SOMO, that must be recorded by the Buyer
• Delay penalties (demurrage) reported by SOMO related to amount received under service
contracts of USD (1,234,493.39)
• Invoices No. (B/2015/925, B/2015/907) as total of USD (116,732,535.05) due for payment
in 2016.
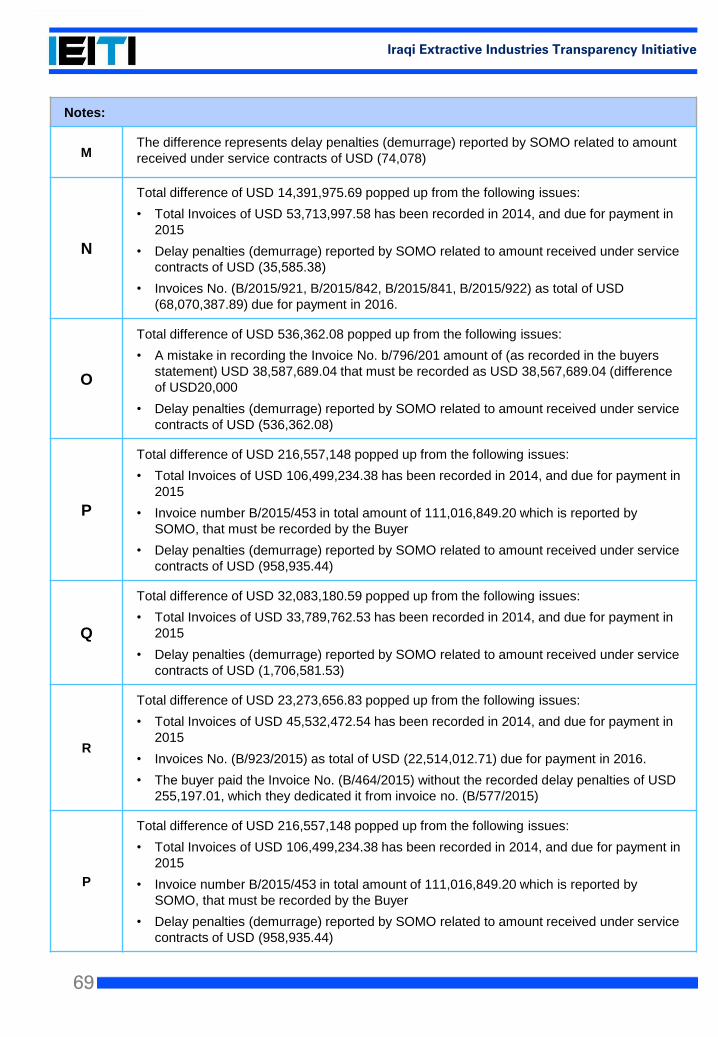
69
Iraqi Extractive Industries Transparency Initiative
Notes:
MThe difference represents delay penalties (demurrage) reported by SOMO related to amount
received under service contracts of USD (74,078)
N
Total difference of USD 14,391,975.69 popped up from the following issues:
• Total Invoices of USD 53,713,997.58 has been recorded in 2014, and due for payment in
2015
• Delay penalties (demurrage) reported by SOMO related to amount received under service
contracts of USD (35,585.38)
• Invoices No. (B/2015/921, B/2015/842, B/2015/841, B/2015/922) as total of USD
(68,070,387.89) due for payment in 2016.
O
Total difference of USD 536,362.08 popped up from the following issues:
• A mistake in recording the Invoice No. b/796/201 amount of (as recorded in the buyers
statement) USD 38,587,689.04 that must be recorded as USD 38,567,689.04 (difference
of USD20,000
• Delay penalties (demurrage) reported by SOMO related to amount received under service
contracts of USD (536,362.08)
P
Total difference of USD 216,557,148 popped up from the following issues:
• Total Invoices of USD 106,499,234.38 has been recorded in 2014, and due for payment in
2015
• Invoice number B/2015/453 in total amount of 111,016,849.20 which is reported by
SOMO, that must be recorded by the Buyer
• Delay penalties (demurrage) reported by SOMO related to amount received under service
contracts of USD (958,935.44)
Q
Total difference of USD 32,083,180.59 popped up from the following issues:
• Total Invoices of USD 33,789,762.53 has been recorded in 2014, and due for payment in
2015
• Delay penalties (demurrage) reported by SOMO related to amount received under service
contracts of USD (1,706,581.53)
R
Total difference of USD 23,273,656.83 popped up from the following issues:
• Total Invoices of USD 45,532,472.54 has been recorded in 2014, and due for payment in
2015
• Invoices No. (B/923/2015) as total of USD (22,514,012.71) due for payment in 2016.
• The buyer paid the Invoice No. (B/464/2015) without the recorded delay penalties of USD
255,197.01, which they dedicated it from invoice no. (B/577/2015)
P
Total difference of USD 216,557,148 popped up from the following issues:
• Total Invoices of USD 106,499,234.38 has been recorded in 2014, and due for payment in
2015
• Invoice number B/2015/453 in total amount of 111,016,849.20 which is reported by
SOMO, that must be recorded by the Buyer
• Delay penalties (demurrage) reported by SOMO related to amount received under service
contracts of USD (958,935.44)
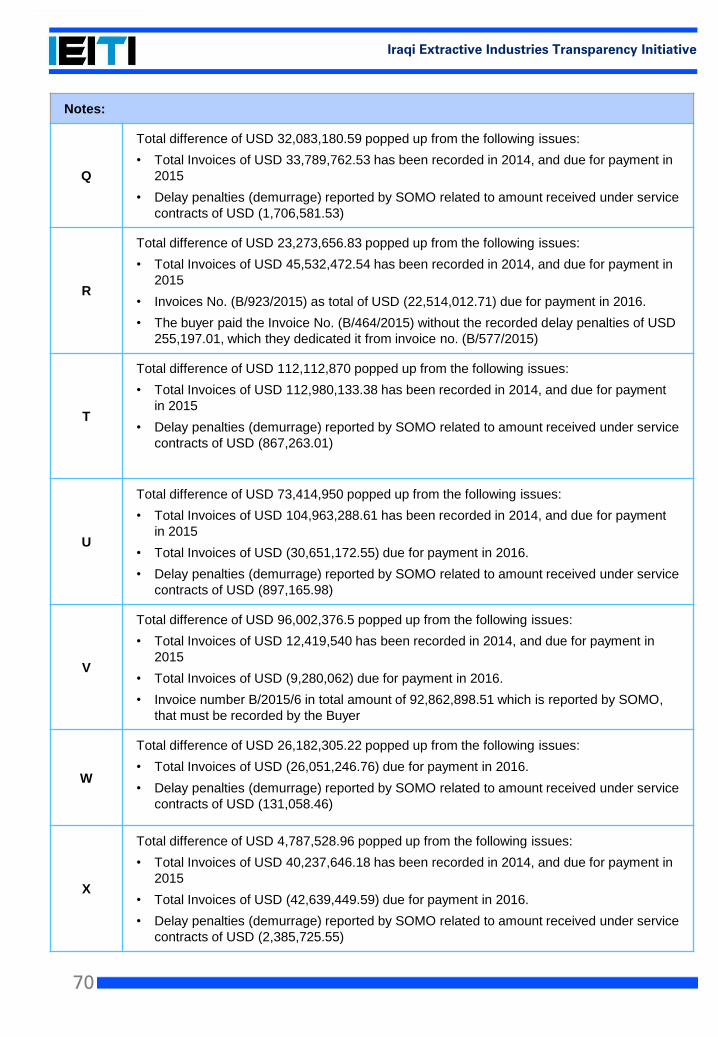
70
Iraqi Extractive Industries Transparency Initiative
Notes:
Q
Total difference of USD 32,083,180.59 popped up from the following issues:
• Total Invoices of USD 33,789,762.53 has been recorded in 2014, and due for payment in
2015
• Delay penalties (demurrage) reported by SOMO related to amount received under service
contracts of USD (1,706,581.53)
R
Total difference of USD 23,273,656.83 popped up from the following issues:
• Total Invoices of USD 45,532,472.54 has been recorded in 2014, and due for payment in
2015
• Invoices No. (B/923/2015) as total of USD (22,514,012.71) due for payment in 2016.
• The buyer paid the Invoice No. (B/464/2015) without the recorded delay penalties of USD
255,197.01, which they dedicated it from invoice no. (B/577/2015)
T
Total difference of USD 112,112,870 popped up from the following issues:
• Total Invoices of USD 112,980,133.38 has been recorded in 2014, and due for payment
in 2015
• Delay penalties (demurrage) reported by SOMO related to amount received under service
contracts of USD (867,263.01)
U
Total difference of USD 73,414,950 popped up from the following issues:
• Total Invoices of USD 104,963,288.61 has been recorded in 2014, and due for payment
in 2015
• Total Invoices of USD (30,651,172.55) due for payment in 2016.
• Delay penalties (demurrage) reported by SOMO related to amount received under service
contracts of USD (897,165.98)
V
Total difference of USD 96,002,376.5 popped up from the following issues:
• Total Invoices of USD 12,419,540 has been recorded in 2014, and due for payment in
2015
• Total Invoices of USD (9,280,062) due for payment in 2016.
• Invoice number B/2015/6 in total amount of 92,862,898.51 which is reported by SOMO,
that must be recorded by the Buyer
W
Total difference of USD 26,182,305.22 popped up from the following issues:
• Total Invoices of USD (26,051,246.76) due for payment in 2016.
• Delay penalties (demurrage) reported by SOMO related to amount received under service
contracts of USD (131,058.46)
X
Total difference of USD 4,787,528.96 popped up from the following issues:
• Total Invoices of USD 40,237,646.18 has been recorded in 2014, and due for payment in
2015
• Total Invoices of USD (42,639,449.59) due for payment in 2016.
• Delay penalties (demurrage) reported by SOMO related to amount received under service
contracts of USD (2,385,725.55)
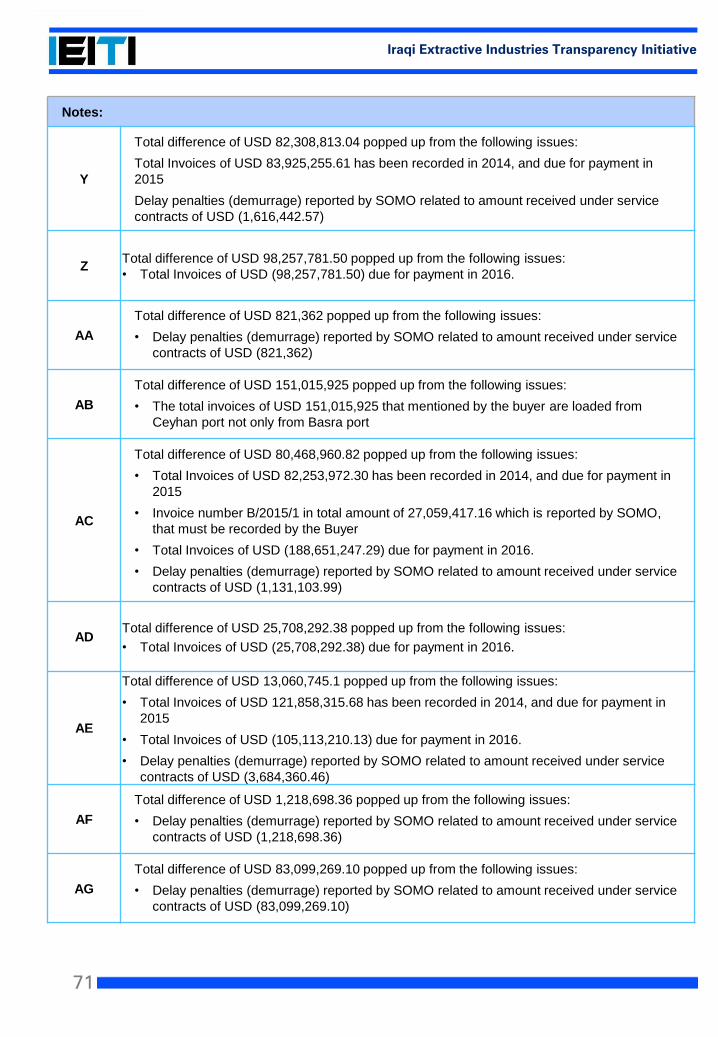
71
Iraqi Extractive Industries Transparency Initiative
Notes:
Y
Total difference of USD 82,308,813.04 popped up from the following issues:
Total Invoices of USD 83,925,255.61 has been recorded in 2014, and due for payment in
2015
Delay penalties (demurrage) reported by SOMO related to amount received under service
contracts of USD (1,616,442.57)
ZTotal difference of USD 98,257,781.50 popped up from the following issues:
• Total Invoices of USD (98,257,781.50) due for payment in 2016.
AA
Total difference of USD 821,362 popped up from the following issues:
• Delay penalties (demurrage) reported by SOMO related to amount received under service
contracts of USD (821,362)
AB
Total difference of USD 151,015,925 popped up from the following issues:
• The total invoices of USD 151,015,925 that mentioned by the buyer are loaded from
Ceyhan port not only from Basra port
AC
Total difference of USD 80,468,960.82 popped up from the following issues:
• Total Invoices of USD 82,253,972.30 has been recorded in 2014, and due for payment in
2015
• Invoice number B/2015/1 in total amount of 27,059,417.16 which is reported by SOMO,
that must be recorded by the Buyer
• Total Invoices of USD (188,651,247.29) due for payment in 2016.
• Delay penalties (demurrage) reported by SOMO related to amount received under service
contracts of USD (1,131,103.99)
ADTotal difference of USD 25,708,292.38 popped up from the following issues:
• Total Invoices of USD (25,708,292.38) due for payment in 2016.
AE
Total difference of USD 13,060,745.1 popped up from the following issues:
• Total Invoices of USD 121,858,315.68 has been recorded in 2014, and due for payment in
2015
• Total Invoices of USD (105,113,210.13) due for payment in 2016.
• Delay penalties (demurrage) reported by SOMO related to amount received under service
contracts of USD (3,684,360.46)
AF
Total difference of USD 1,218,698.36 popped up from the following issues:
• Delay penalties (demurrage) reported by SOMO related to amount received under service
contracts of USD (1,218,698.36)
AG
Total difference of USD 83,099,269.10 popped up from the following issues:
• Delay penalties (demurrage) reported by SOMO related to amount received under service
contracts of USD (83,099,269.10)
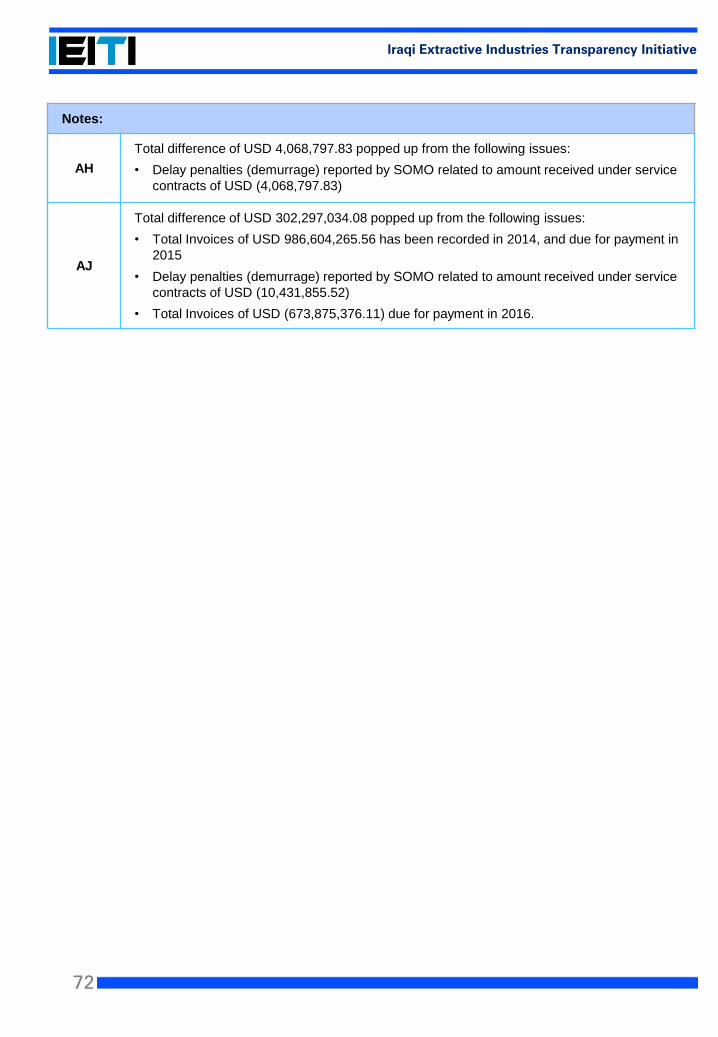
72
Iraqi Extractive Industries Transparency Initiative
Notes:
AH
Total difference of USD 4,068,797.83 popped up from the following issues:
• Delay penalties (demurrage) reported by SOMO related to amount received under service
contracts of USD (4,068,797.83)
AJ
Total difference of USD 302,297,034.08 popped up from the following issues:
• Total Invoices of USD 986,604,265.56 has been recorded in 2014, and due for payment in
2015
• Delay penalties (demurrage) reported by SOMO related to amount received under service
contracts of USD (10,431,855.52)
• Total Invoices of USD (673,875,376.11) due for payment in 2016.
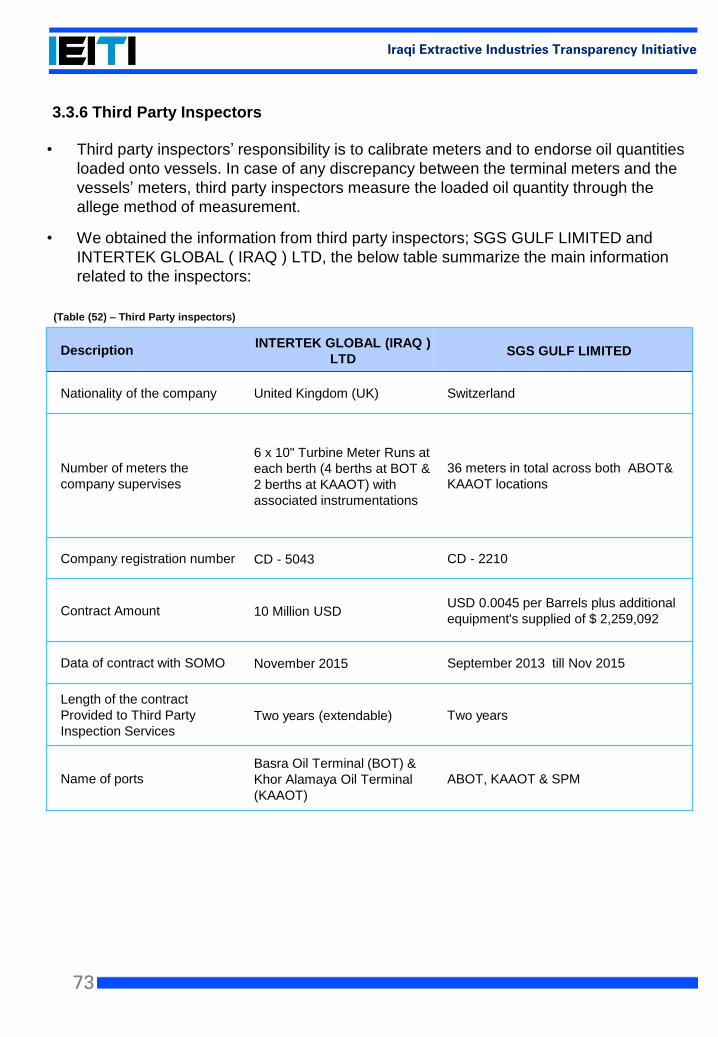
73
Iraqi Extractive Industries Transparency Initiative
• Third party inspectors’ responsibility is to calibrate meters and to endorse oil quantities
loaded onto vessels. In case of any discrepancy between the terminal meters and the
vessels’ meters, third party inspectors measure the loaded oil quantity through the
allege method of measurement.
• We obtained the information from third party inspectors; SGS GULF LIMITED and
INTERTEK GLOBAL ( IRAQ ) LTD, the below table summarize the main information
related to the inspectors:
DescriptionINTERTEK GLOBAL (IRAQ )
LTDSGS GULF LIMITED
Nationality of the company United Kingdom (UK) Switzerland
Number of meters the
company supervises
6 x 10" Turbine Meter Runs at
each berth (4 berths at BOT &
2 berths at KAAOT) with
associated instrumentations
36 meters in total across both ABOT&
KAAOT locations
Company registration number CD - 5043 CD - 2210
Contract Amount 10 Million USDUSD 0.0045 per Barrels plus additional
equipment's supplied of $ 2,259,092
Data of contract with SOMO November 2015 September 2013 till Nov 2015
Length of the contract
Provided to Third Party
Inspection Services Two years (extendable) Two years
Name of ports Basra Oil Terminal (BOT) &
Khor Alamaya Oil Terminal
(KAAOT)
ABOT, KAAOT & SPM
3.3.6 Third Party Inspectors
(Table (52) – Third Party inspectors)
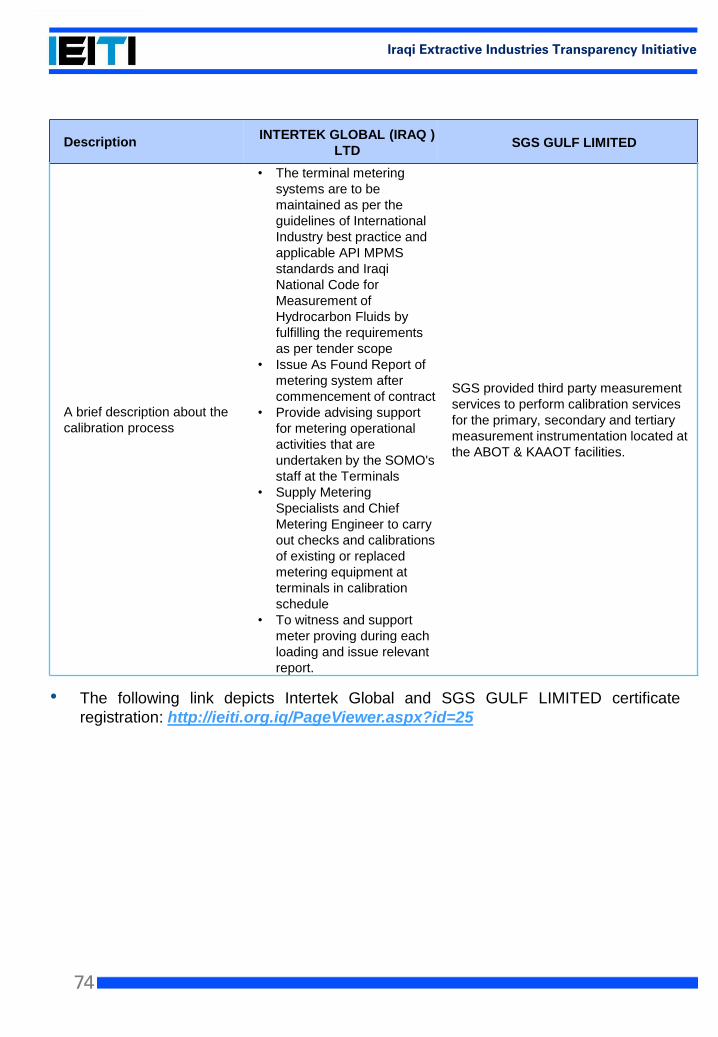
74
Iraqi Extractive Industries Transparency Initiative
• The following link depicts Intertek Global and SGS GULF LIMITED certificate
registration: http://ieiti.org.iq/PageViewer.aspx?id=25
DescriptionINTERTEK GLOBAL (IRAQ )
LTDSGS GULF LIMITED
A brief description about the
calibration process
• The terminal metering
systems are to be
maintained as per the
guidelines of International
Industry best practice and
applicable API MPMS
standards and Iraqi
National Code for
Measurement of
Hydrocarbon Fluids by
fulfilling the requirements
as per tender scope
• Issue As Found Report of
metering system after
commencement of contract
• Provide advising support
for metering operational
activities that are
undertaken by the SOMO's
staff at the Terminals
• Supply Metering
Specialists and Chief
Metering Engineer to carry
out checks and calibrations
of existing or replaced
metering equipment at
terminals in calibration
schedule
• To witness and support
meter proving during each
loading and issue relevant
report.
SGS provided third party measurement
services to perform calibration services
for the primary, secondary and tertiary
measurement instrumentation located at
the ABOT & KAAOT facilities.
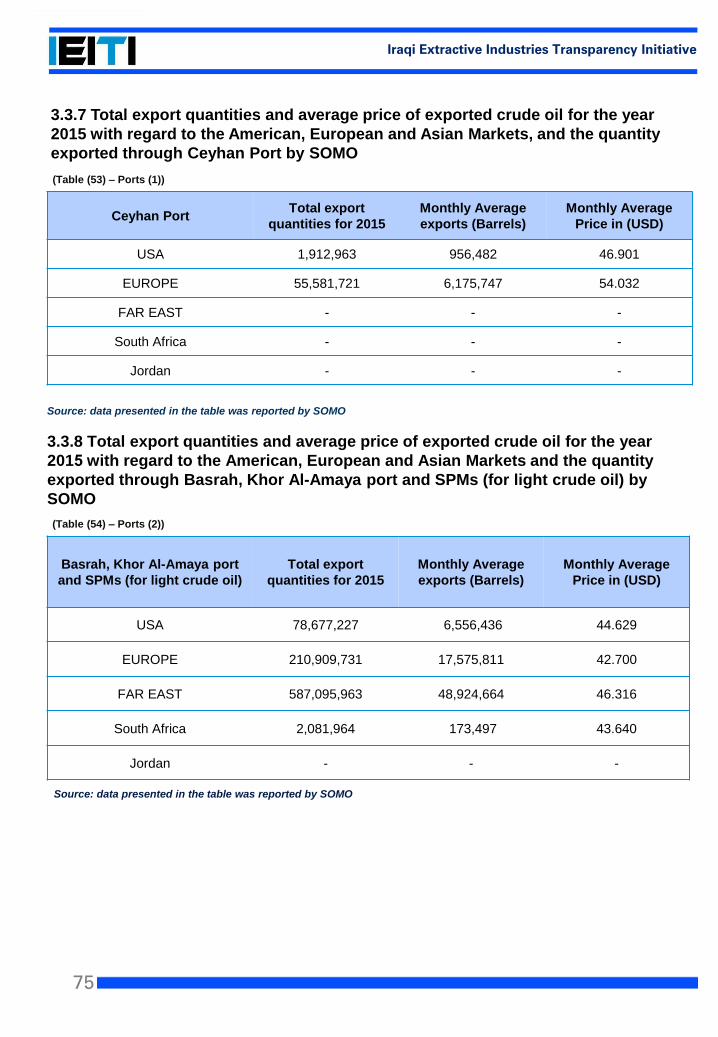
75
Iraqi Extractive Industries Transparency Initiative
3.3.7 Total export quantities and average price of exported crude oil for the year
2015 with regard to the American, European and Asian Markets, and the quantity
exported through Ceyhan Port by SOMO
Source: data presented in the table was reported by SOMO
Ceyhan Port Total export
quantities for 2015
Monthly Average
exports (Barrels)
Monthly Average
Price in (USD)
USA 1,912,963 956,482 46.901
EUROPE 55,581,721 6,175,747 54.032
FAR EAST - - -
South Africa - - -
Jordan - - -
3.3.8 Total export quantities and average price of exported crude oil for the year
2015 with regard to the American, European and Asian Markets and the quantity
exported through Basrah, Khor Al-Amaya port and SPMs (for light crude oil) by
SOMO
Source: data presented in the table was reported by SOMO
Basrah, Khor Al-Amaya port
and SPMs (for light crude oil)
Total export
quantities for 2015
Monthly Average
exports (Barrels)
Monthly Average
Price in (USD)
USA 78,677,227 6,556,436 44.629
EUROPE 210,909,731 17,575,811 42.700
FAR EAST 587,095,963 48,924,664 46.316
South Africa 2,081,964 173,497 43.640
Jordan - - -
(Table (53) – Ports (1))
(Table (54) – Ports (2))
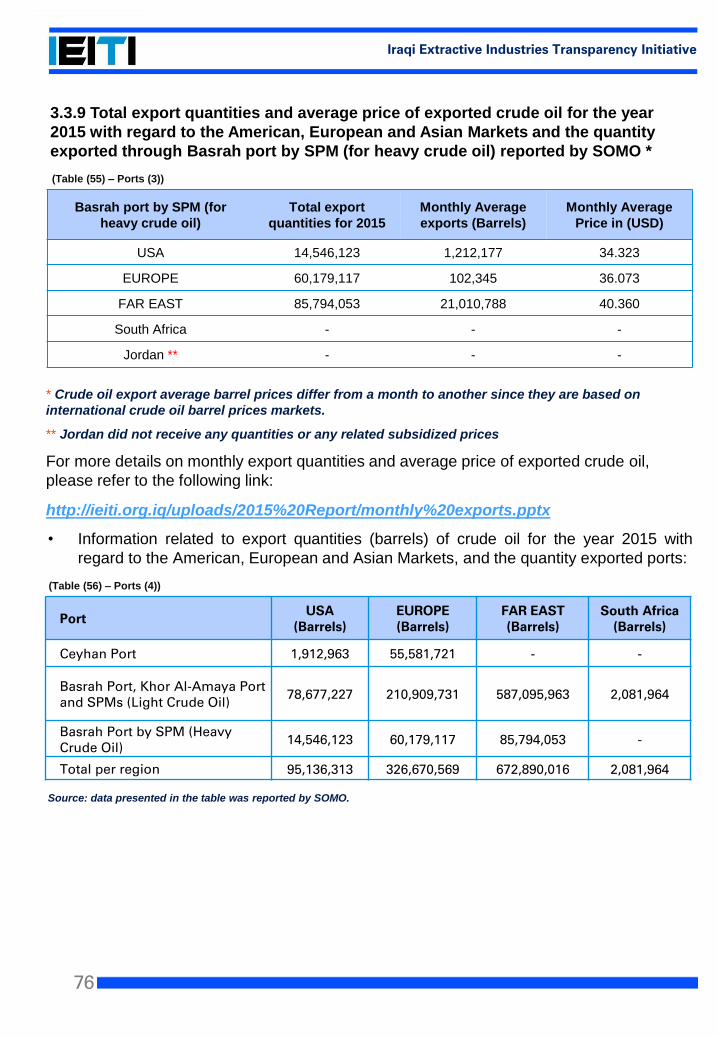
76
Iraqi Extractive Industries Transparency Initiative
* Crude oil export average barrel prices differ from a month to another since they are based on
international crude oil barrel prices markets.
** Jordan did not receive any quantities or any related subsidized prices
For more details on monthly export quantities and average price of exported crude oil,
please refer to the following link:
http://ieiti.org.iq/uploads/2015%20Report/monthly%20exports.pptx
• Information related to export quantities (barrels) of crude oil for the year 2015 with
regard to the American, European and Asian Markets, and the quantity exported ports:
Source: data presented in the table was reported by SOMO.
PortUSA
(Barrels)EUROPE(Barrels)
FAR EAST(Barrels)
South Africa(Barrels)
Ceyhan Port 1,912,963 55,581,721 - -
Basrah Port, Khor Al-Amaya Port and SPMs (Light Crude Oil)
78,677,227 210,909,731 587,095,963 2,081,964
Basrah Port by SPM (Heavy Crude Oil)
14,546,123 60,179,117 85,794,053 -
Total per region 95,136,313 326,670,569 672,890,016 2,081,964
3.3.9 Total export quantities and average price of exported crude oil for the year
2015 with regard to the American, European and Asian Markets and the quantity
exported through Basrah port by SPM (for heavy crude oil) reported by SOMO *
Basrah port by SPM (for
heavy crude oil)
Total export
quantities for 2015
Monthly Average
exports (Barrels)
Monthly Average
Price in (USD)
USA 14,546,123 1,212,177 34.323
EUROPE 60,179,117 102,345 36.073
FAR EAST 85,794,053 21,010,788 40.360
South Africa - - -
Jordan ** - - -
(Table (55) – Ports (3))
(Table (56) – Ports (4))
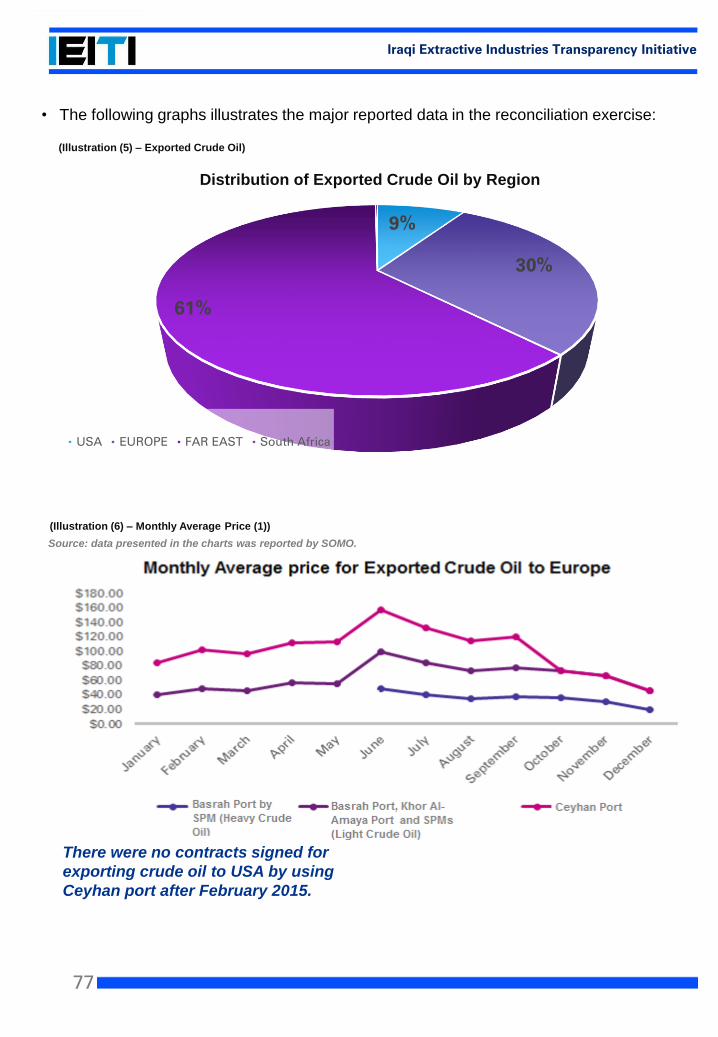
77
Iraqi Extractive Industries Transparency Initiative
• The following graphs illustrates the major reported data in the reconciliation exercise:
9%
30%
61%
Distribution of Exported Crude Oil by Region
USA EUROPE FAR EAST South Africa
Source: data presented in the charts was reported by SOMO.
(Illustration (6) – Monthly Average Price (1))
There were no contracts signed for
exporting crude oil to USA by using
Ceyhan port after February 2015.
(Illustration (5) – Exported Crude Oil)
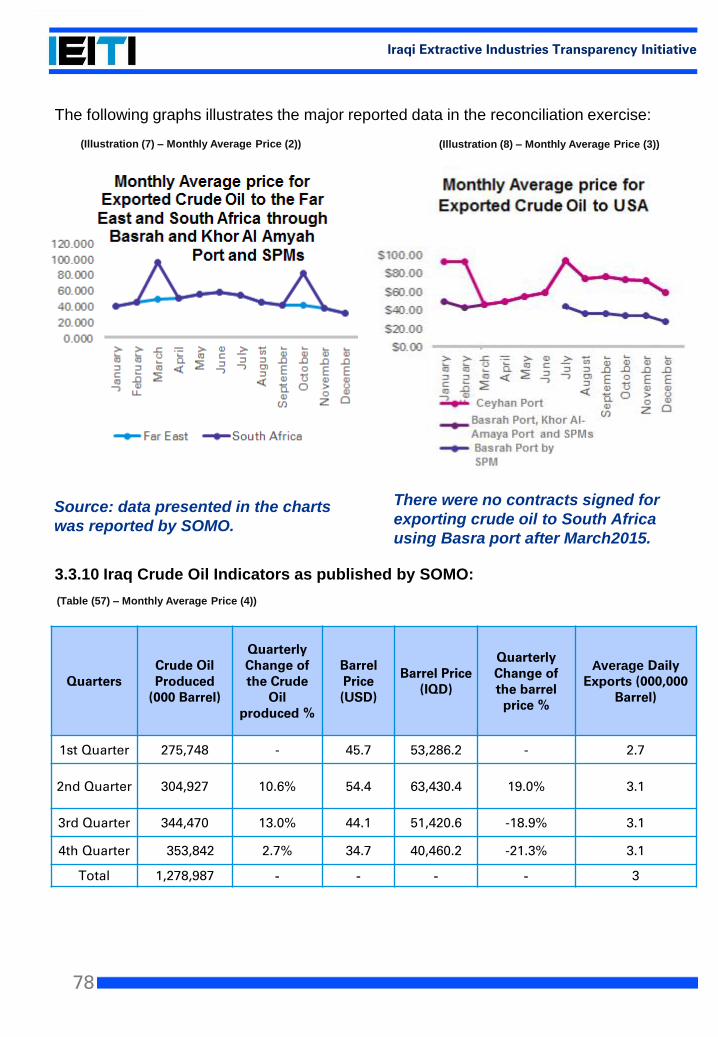
78
Iraqi Extractive Industries Transparency Initiative
The following graphs illustrates the major reported data in the reconciliation exercise:
3.3.10 Iraq Crude Oil Indicators as published by SOMO:
QuartersCrude Oil Produced
(000 Barrel)
Quarterly Change of the Crude
Oil produced %
Barrel Price (USD)
Barrel Price (IQD)
Quarterly Change of the barrelprice %
Average Daily Exports (000,000
Barrel)
1st Quarter 275,748 - 45.7 53,286.2 - 2.7
2nd Quarter 304,927 10.6% 54.4 63,430.4 19.0% 3.1
3rd Quarter 344,470 13.0% 44.1 51,420.6 -18.9% 3.1
4th Quarter 353,842 2.7% 34.7 40,460.2 -21.3% 3.1
Total 1,278,987 - - - - 3
(Table (57) – Monthly Average Price (4))
(Illustration (8) – Monthly Average Price (3))
There were no contracts signed for
exporting crude oil to South Africa
using Basra port after March2015.
(Illustration (7) – Monthly Average Price (2))
Source: data presented in the charts
was reported by SOMO.
79
Iraqi Extractive Industries Transparency Initiative
SOMO sells Iraqi crude oil through loading ports as follow:
1. Long term sales contracts:
- Direct invitation to contracting companies.
- Purchase requests for new companies (receipt, study and analysis).
2. Reimbursement contracts:
- Pay service contractors dues related to licensing rounds.
3.3.10.2 Adopted Basis in Allocation
Number of criteria are taken into consideration when defining the allocated crude oil
quantities to qualified companies (previously contracted and new ones) as follows:
- Marketing of all available quantities of Iraqi crude oil for export in the international
markets using the international pricing modules.
- Give priority in the allocation of quantities to companies that hold large refining capacity.
- Expansion of Iraqi crude oil penetration in key global markets.
- Give priority to the Asian market.
3.3.10.3 Allocation Categorization Standards
Number of standards are adopted when allocating contractual quantities to different
qualified companies as follows:
1. First Standard – Reputed International Oil Companies: It includes well known
international oil companies (big and medium size), independent, governmental, well
structured companies and has refining capabilities and distribution network in many
countries.
2. Second Standard – Refining Companies: It includes companies majoring in refining
industry and distribution of oil products.
3. Third Standard – Authorized Companies: Companies classified as main providers to
refining companies in their country, such as the case in Japan.
3.3.10.1 Sales Technique
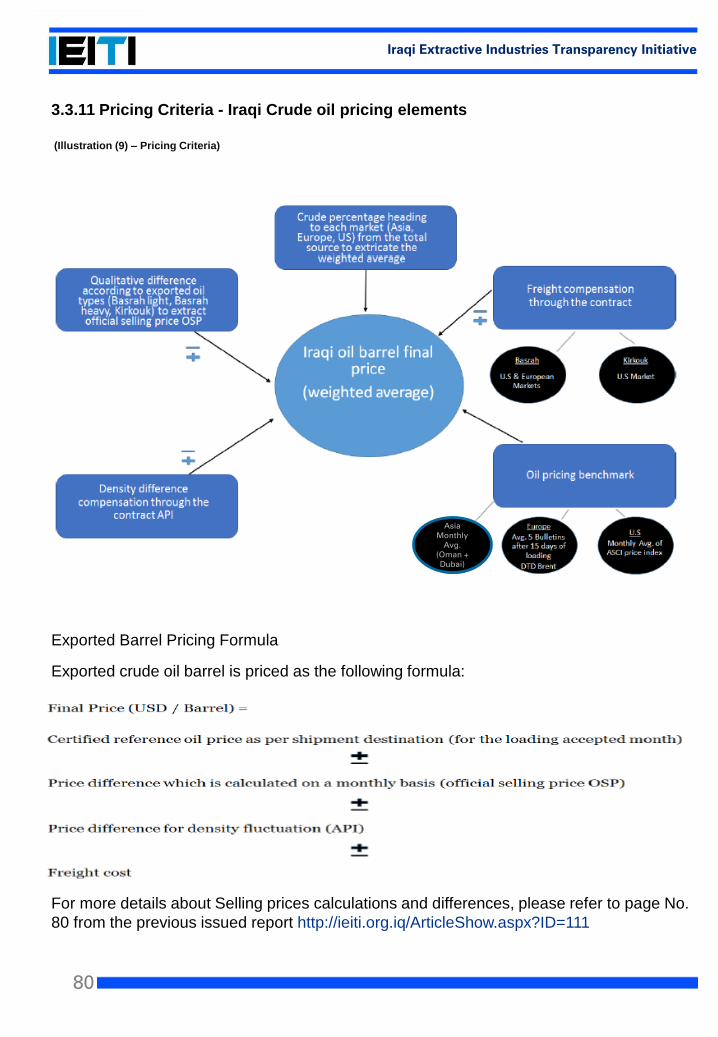
80
Iraqi Extractive Industries Transparency Initiative
3.3.11 Pricing Criteria - Iraqi Crude oil pricing elements
Exported Barrel Pricing Formula
Exported crude oil barrel is priced as the following formula:
For more details about Selling prices calculations and differences, please refer to page No.
80 from the previous issued report http://ieiti.org.iq/ArticleShow.aspx?ID=111
(Illustration (9) – Pricing Criteria)
Asia Monthly
Avg.(Oman + Dubai)
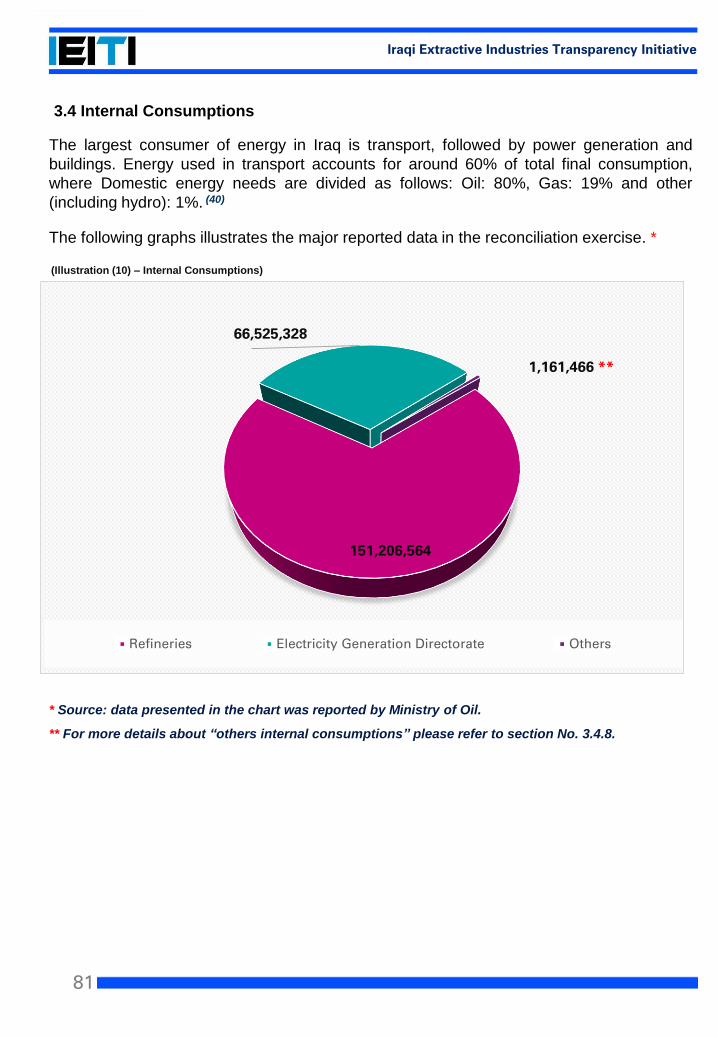
81
Iraqi Extractive Industries Transparency Initiative
The largest consumer of energy in Iraq is transport, followed by power generation and
buildings. Energy used in transport accounts for around 60% of total final consumption,
where Domestic energy needs are divided as follows: Oil: 80%, Gas: 19% and other
(including hydro): 1%. (40)
The following graphs illustrates the major reported data in the reconciliation exercise. *
(42) http://us.practicallaw.com/9-581-2725
* Source: data presented in the chart was reported by Ministry of Oil.
** For more details about “others internal consumptions” please refer to section No. 3.4.8.
151,206,564
66,525,328
1,161,466 **
Refineries Electricity Generation Directorate Others
(Illustration (10) – Internal Consumptions)
3.4 Internal Consumptions
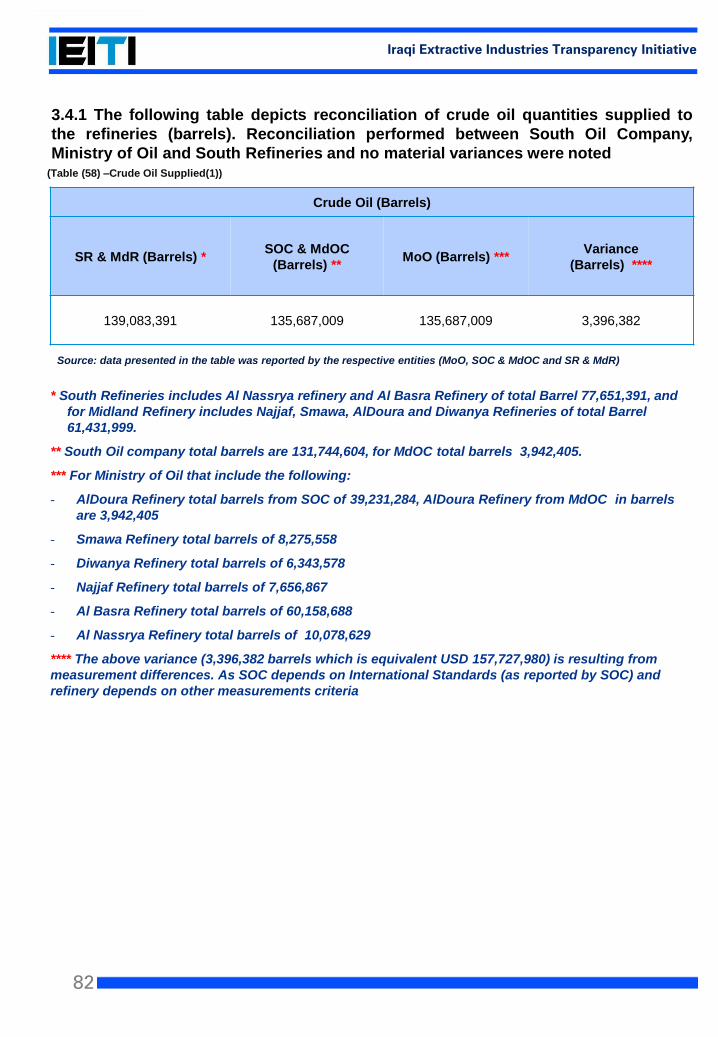
82
Iraqi Extractive Industries Transparency Initiative
Source: data presented in the table was reported by the respective entities (MoO, SOC & MdOC and SR & MdR)
* South Refineries includes Al Nassrya refinery and Al Basra Refinery of total Barrel 77,651,391, and
for Midland Refinery includes Najjaf, Smawa, AlDoura and Diwanya Refineries of total Barrel
61,431,999.
** South Oil company total barrels are 131,744,604, for MdOC total barrels 3,942,405.
*** For Ministry of Oil that include the following:
- AlDoura Refinery total barrels from SOC of 39,231,284, AlDoura Refinery from MdOC in barrels
are 3,942,405
- Smawa Refinery total barrels of 8,275,558
- Diwanya Refinery total barrels of 6,343,578
- Najjaf Refinery total barrels of 7,656,867
- Al Basra Refinery total barrels of 60,158,688
- Al Nassrya Refinery total barrels of 10,078,629
**** The above variance (3,396,382 barrels which is equivalent USD 157,727,980) is resulting from
measurement differences. As SOC depends on International Standards (as reported by SOC) and
refinery depends on other measurements criteria
3.4.1 The following table depicts reconciliation of crude oil quantities supplied to
the refineries (barrels). Reconciliation performed between South Oil Company,
Ministry of Oil and South Refineries and no material variances were noted
Crude Oil (Barrels)
SR & MdR (Barrels) *SOC & MdOC
(Barrels) **MoO (Barrels) ***
Variance
(Barrels) ****
139,083,391 135,687,009 135,687,009 3,396,382
(Table (58) –Crude Oil Supplied(1))
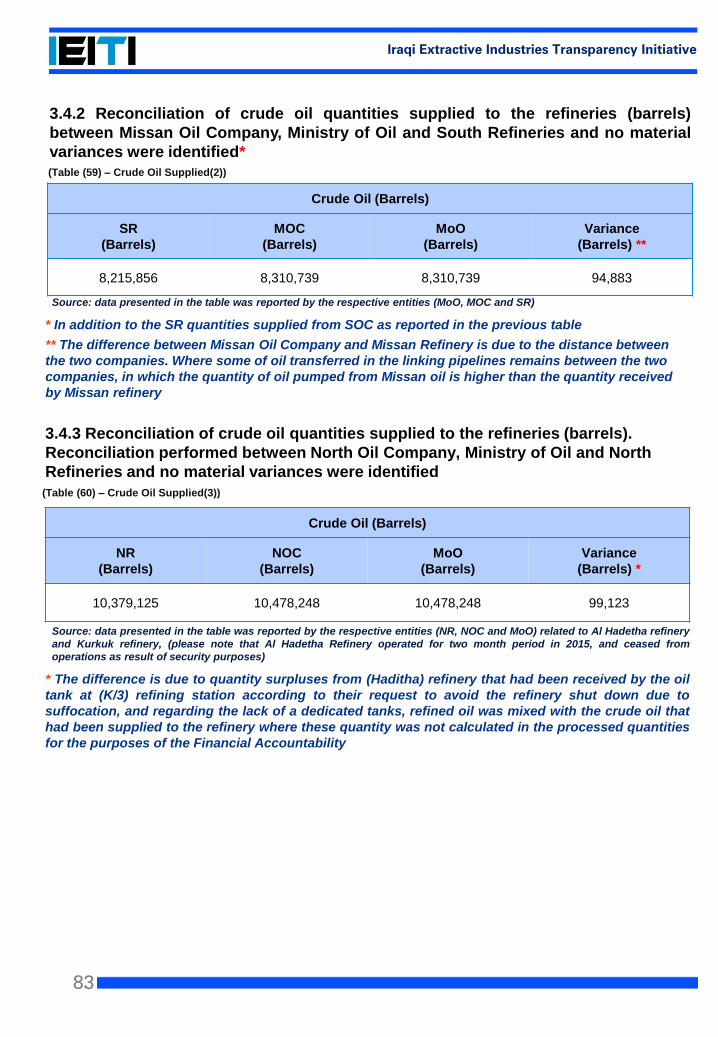
83
Iraqi Extractive Industries Transparency Initiative
Source: data presented in the table was reported by the respective entities (MoO, MOC and SR)
* In addition to the SR quantities supplied from SOC as reported in the previous table
** The difference between Missan Oil Company and Missan Refinery is due to the distance between
the two companies. Where some of oil transferred in the linking pipelines remains between the two
companies, in which the quantity of oil pumped from Missan oil is higher than the quantity received
by Missan refinery
3.4.3 Reconciliation of crude oil quantities supplied to the refineries (barrels).
Reconciliation performed between North Oil Company, Ministry of Oil and North
Refineries and no material variances were identified
Source: data presented in the table was reported by the respective entities (NR, NOC and MoO) related to Al Hadetha refinery
and Kurkuk refinery, (please note that Al Hadetha Refinery operated for two month period in 2015, and ceased from
operations as result of security purposes)
* The difference is due to quantity surpluses from (Haditha) refinery that had been received by the oil
tank at (K/3) refining station according to their request to avoid the refinery shut down due to
suffocation, and regarding the lack of a dedicated tanks, refined oil was mixed with the crude oil that
had been supplied to the refinery where these quantity was not calculated in the processed quantities
for the purposes of the Financial Accountability
3.4.2 Reconciliation of crude oil quantities supplied to the refineries (barrels)
between Missan Oil Company, Ministry of Oil and South Refineries and no material
variances were identified*
Crude Oil (Barrels)
SR
(Barrels)
MOC
(Barrels)
MoO
(Barrels)
Variance
(Barrels) **
8,215,856 8,310,739 8,310,739 94,883
Crude Oil (Barrels)
NR
(Barrels)
NOC
(Barrels)
MoO
(Barrels)
Variance
(Barrels) *
10,379,125 10,478,248 10,478,248 99,123
(Table (59) – Crude Oil Supplied(2))
(Table (60) – Crude Oil Supplied(3))
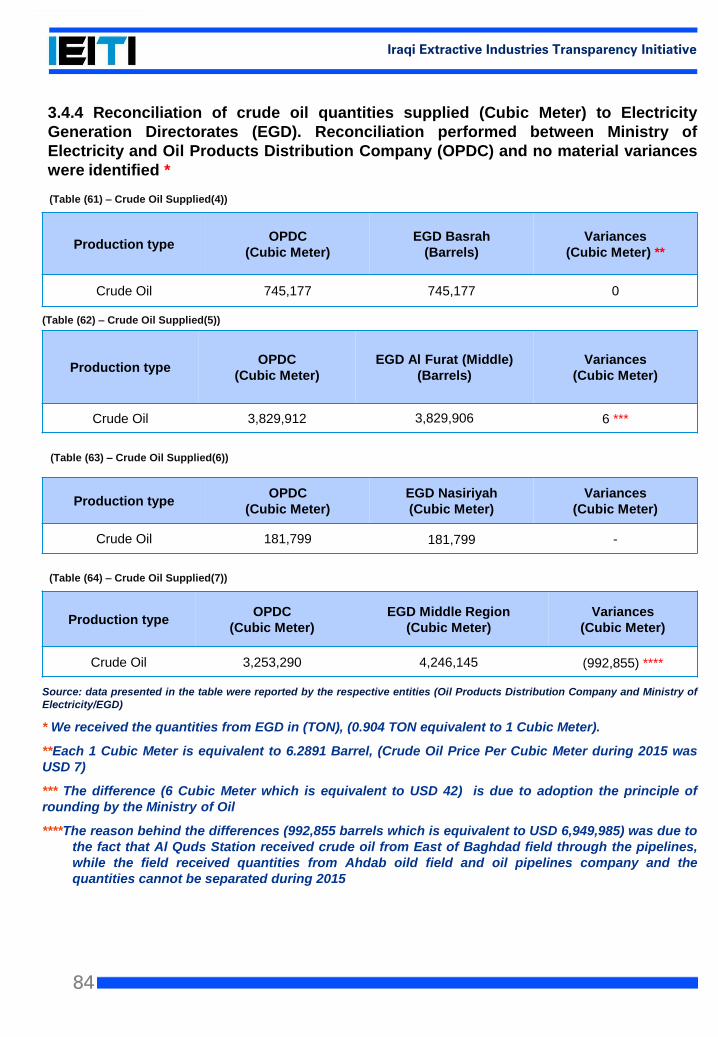
84
Iraqi Extractive Industries Transparency Initiative
Production typeOPDC
(Cubic Meter)
EGD Nasiriyah
(Cubic Meter)
Variances
(Cubic Meter)
Crude Oil 181,799 181,799 -
Source: data presented in the table were reported by the respective entities (Oil Products Distribution Company and Ministry of
Electricity/EGD)
* We received the quantities from EGD in (TON), (0.904 TON equivalent to 1 Cubic Meter).
**Each 1 Cubic Meter is equivalent to 6.2891 Barrel, (Crude Oil Price Per Cubic Meter during 2015 was
USD 7)
*** The difference (6 Cubic Meter which is equivalent to USD 42) is due to adoption the principle of
rounding by the Ministry of Oil
****The reason behind the differences (992,855 barrels which is equivalent to USD 6,949,985) was due to
the fact that Al Quds Station received crude oil from East of Baghdad field through the pipelines,
while the field received quantities from Ahdab oild field and oil pipelines company and the
quantities cannot be separated during 2015
Production typeOPDC
(Cubic Meter)
EGD Al Furat (Middle)
(Barrels)
Variances
(Cubic Meter)
Crude Oil 3,829,912 3,829,906 6 ***
Production typeOPDC
(Cubic Meter)
EGD Basrah
(Barrels)
Variances
(Cubic Meter) **
Crude Oil 745,177 745,177 0
Production typeOPDC
(Cubic Meter)
EGD Middle Region
(Cubic Meter)
Variances
(Cubic Meter)
Crude Oil 3,253,290 4,246,145 (992,855) ****
(Table (61) – Crude Oil Supplied(4))
(Table (62) – Crude Oil Supplied(5))
(Table (63) – Crude Oil Supplied(6))
(Table (64) – Crude Oil Supplied(7))
3.4.4 Reconciliation of crude oil quantities supplied (Cubic Meter) to Electricity
Generation Directorates (EGD). Reconciliation performed between Ministry of
Electricity and Oil Products Distribution Company (OPDC) and no material variances
were identified *
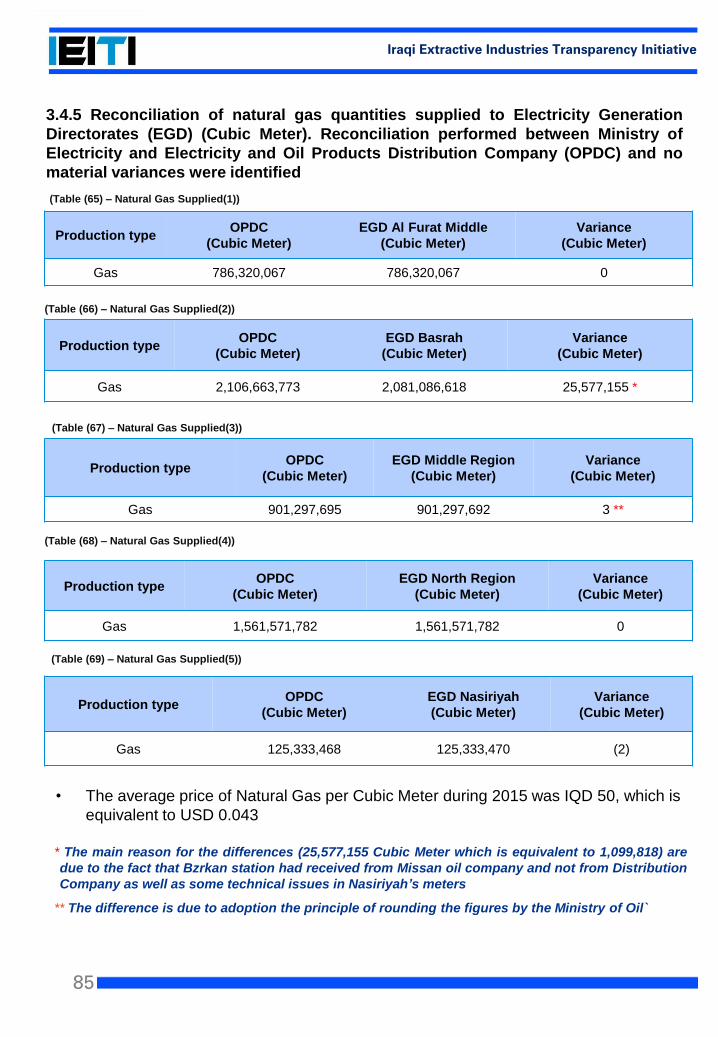
85
Iraqi Extractive Industries Transparency Initiative
Production typeOPDC
(Cubic Meter)
EGD Al Furat Middle
(Cubic Meter)
Variance
(Cubic Meter)
Gas 786,320,067 786,320,067 0
Production typeOPDC
(Cubic Meter)
EGD Basrah
(Cubic Meter)
Variance
(Cubic Meter)
Gas 2,106,663,773 2,081,086,618 25,577,155 *
Production typeOPDC
(Cubic Meter)
EGD Middle Region
(Cubic Meter)
Variance
(Cubic Meter)
Gas 901,297,695 901,297,692 3 **
Production typeOPDC
(Cubic Meter)
EGD North Region
(Cubic Meter)
Variance
(Cubic Meter)
Gas 1,561,571,782 1,561,571,782 0
Production typeOPDC
(Cubic Meter)
EGD Nasiriyah
(Cubic Meter)
Variance
(Cubic Meter)
Gas 125,333,468 125,333,470 (2)
(Table (65) – Natural Gas Supplied(1))
(Table (66) – Natural Gas Supplied(2))
(Table (67) – Natural Gas Supplied(3))
(Table (68) – Natural Gas Supplied(4))
(Table (69) – Natural Gas Supplied(5))
3.4.5 Reconciliation of natural gas quantities supplied to Electricity Generation
Directorates (EGD) (Cubic Meter). Reconciliation performed between Ministry of
Electricity and Electricity and Oil Products Distribution Company (OPDC) and no
material variances were identified
• The average price of Natural Gas per Cubic Meter during 2015 was IQD 50, which is
equivalent to USD 0.043
* The main reason for the differences (25,577,155 Cubic Meter which is equivalent to 1,099,818) are
due to the fact that Bzrkan station had received from Missan oil company and not from Distribution
Company as well as some technical issues in Nasiriyah’s meters
** The difference is due to adoption the principle of rounding the figures by the Ministry of Oil`
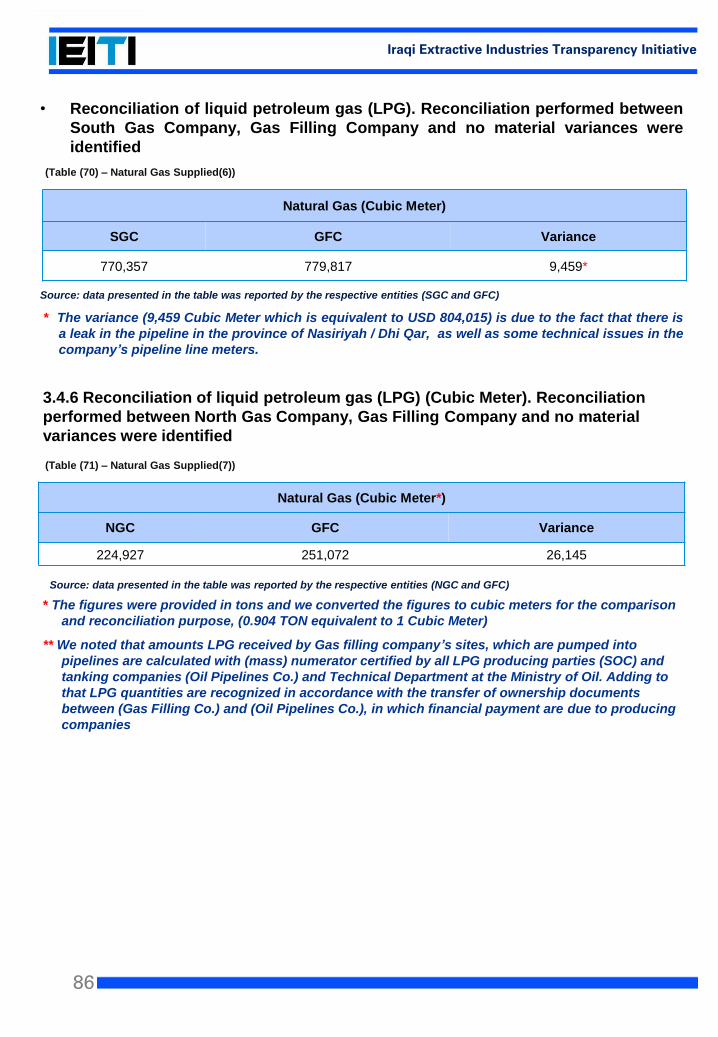
86
Iraqi Extractive Industries Transparency Initiative
• Reconciliation of liquid petroleum gas (LPG). Reconciliation performed between
South Gas Company, Gas Filling Company and no material variances were
identified
Source: data presented in the table was reported by the respective entities (SGC and GFC)
* The variance (9,459 Cubic Meter which is equivalent to USD 804,015) is due to the fact that there is
a leak in the pipeline in the province of Nasiriyah / Dhi Qar, as well as some technical issues in the
company’s pipeline line meters.
Natural Gas (Cubic Meter)
SGC GFC Variance
770,357 779,817 9,459*
(Table (70) – Natural Gas Supplied(6))
3.4.6 Reconciliation of liquid petroleum gas (LPG) (Cubic Meter). Reconciliation
performed between North Gas Company, Gas Filling Company and no material
variances were identified
* The figures were provided in tons and we converted the figures to cubic meters for the comparison
and reconciliation purpose, (0.904 TON equivalent to 1 Cubic Meter)
** We noted that amounts LPG received by Gas filling company’s sites, which are pumped into
pipelines are calculated with (mass) numerator certified by all LPG producing parties (SOC) and
tanking companies (Oil Pipelines Co.) and Technical Department at the Ministry of Oil. Adding to
that LPG quantities are recognized in accordance with the transfer of ownership documents
between (Gas Filling Co.) and (Oil Pipelines Co.), in which financial payment are due to producing
companies
Natural Gas (Cubic Meter*)
NGC GFC Variance
224,927 251,072 26,145
Source: data presented in the table was reported by the respective entities (NGC and GFC)
(Table (71) – Natural Gas Supplied(7))
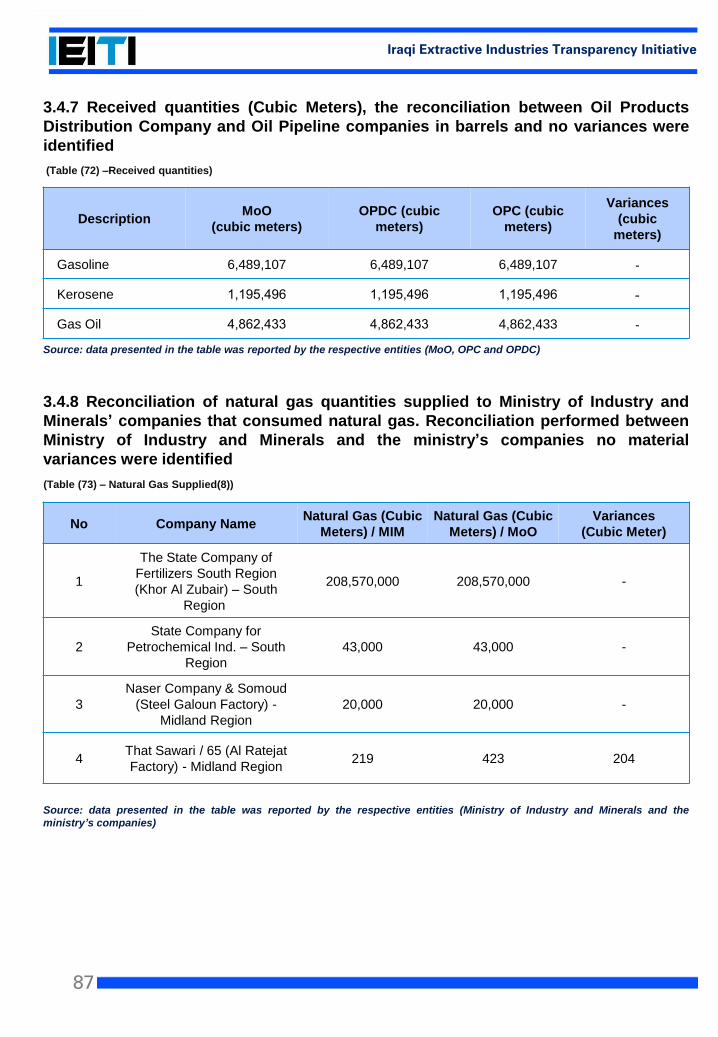
87
Iraqi Extractive Industries Transparency Initiative
3.4.7 Received quantities (Cubic Meters), the reconciliation between Oil Products
Distribution Company and Oil Pipeline companies in barrels and no variances were
identified
Source: data presented in the table was reported by the respective entities (MoO, OPC and OPDC)
DescriptionMoO
(cubic meters)
OPDC (cubic
meters)
OPC (cubic
meters)
Variances
(cubic
meters)
Gasoline 6,489,107 6,489,107 6,489,107 -
Kerosene 1,195,496 1,195,496 1,195,496 -
Gas Oil 4,862,433 4,862,433 4,862,433 -
(Table (72) –Received quantities)
3.4.8 Reconciliation of natural gas quantities supplied to Ministry of Industry and
Minerals’ companies that consumed natural gas. Reconciliation performed between
Ministry of Industry and Minerals and the ministry’s companies no material
variances were identified
Source: data presented in the table was reported by the respective entities (Ministry of Industry and Minerals and the
ministry’s companies)
(Table (73) – Natural Gas Supplied(8))
No Company NameNatural Gas (Cubic
Meters) / MIM
Natural Gas (Cubic
Meters) / MoO
Variances
(Cubic Meter)
1
The State Company of
Fertilizers South Region
(Khor Al Zubair) – South
Region
208,570,000 208,570,000 -
2
State Company for
Petrochemical Ind. – South
Region
43,000 43,000 -
3
Naser Company & Somoud
(Steel Galoun Factory) -
Midland Region
20,000 20,000 -
4That Sawari / 65 (Al Ratejat
Factory) - Midland Region219 423 204
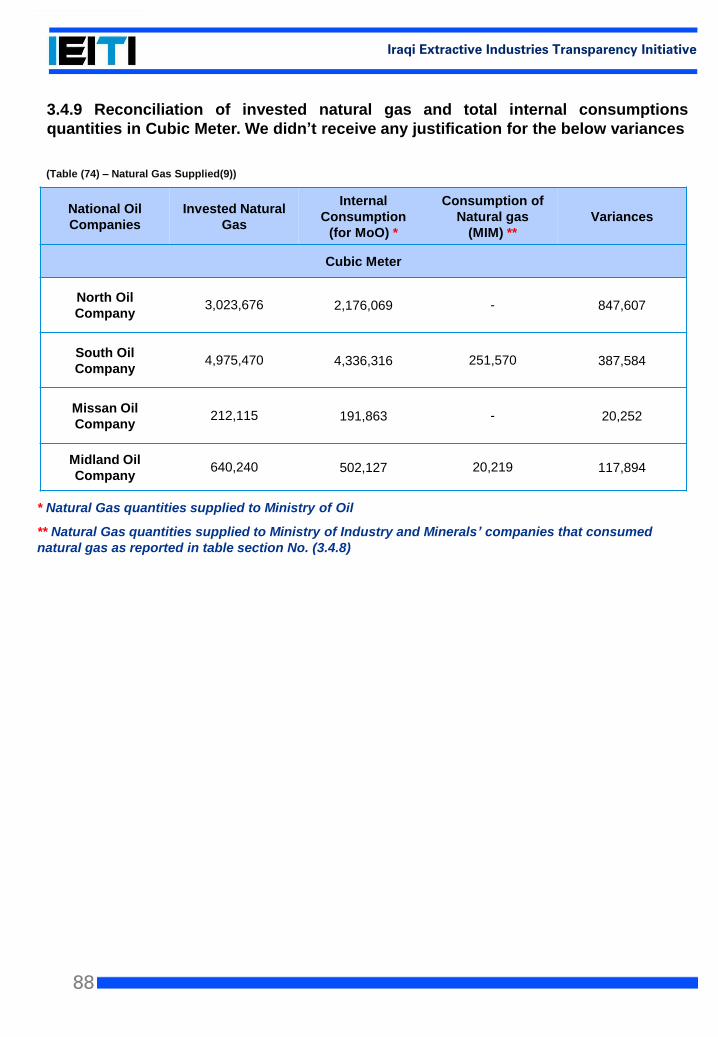
88
Iraqi Extractive Industries Transparency Initiative
* Natural Gas quantities supplied to Ministry of Oil
** Natural Gas quantities supplied to Ministry of Industry and Minerals’ companies that consumed
natural gas as reported in table section No. (3.4.8)
National Oil
Companies
Invested Natural
Gas
Internal
Consumption
(for MoO) *
Consumption of
Natural gas
(MIM) **
Variances
Cubic Meter
North Oil
Company 3,023,676 2,176,069 - 847,607
South Oil
Company4,975,470 4,336,316 251,570 387,584
Missan Oil
Company 212,115 191,863 - 20,252
Midland Oil
Company 640,240 502,127 20,219 117,894
(Table (74) – Natural Gas Supplied(9))
3.4.9 Reconciliation of invested natural gas and total internal consumptions
quantities in Cubic Meter. We didn’t receive any justification for the below variances
89
Iraqi Extractive Industries Transparency Initiative
4Revenue Collection
EITI Requirement:4- Revenue collection
90
Iraqi Extractive Industries Transparency Initiative
4.1 Comprehensive disclosure of taxes and revenues
4.1.1 Materiality
A fundamental element of the EITI is the disclosure and reconciliation of payments and
revenue from oil, gas and mining.
The multi-stakeholder group is required to define which payments and revenue are material
and therefore, must be disclosed, including appropriate materiality definitions and
thresholds. Payments and revenue are considered material if their omission or
misstatement could significantly affect the comprehensiveness of the EITI report. In
establishing the materiality definitions and thresholds, the multi-stakeholder group should
consider the size of the revenue streams relative to total revenue.
The agreed materiality level for 2015 will be 0.5%. Any discrepancies that equal to or
exceed 0.5% must be analyzed and reported as agreed in MSG meeting No. 39 dated on 8
June 2016.
As part of the continuous implementation of the Extractive Industries Transparency
Initiative (EITI) in Iraq, reconciliation would need to include the following:
Revenues and payments reported by Iraqi governmental entities, international crude oil
buying Companies and international oil field developing extractive companies operating
in central and southern Iraq (excluding KRG);
oil production and oil export quantities reported by Iraqi governmental entities, national
and international oil companies operating in Central and Southern Iraq (excluding KRG),
in addition to third party verification companies;
oil and gas quantities for local consumption reported by Iraqi governmental entities,
national gas companies, national oil companies, electricity generation directorates and
refineries;
Net revenue from sale of oil products to the local market as reported by Ministry of
Finance and Oil Products Distribution Company.
All companies included in materiality had been reconciled, and the discrepancies had been
justified.
All income revenues related to the extractive industry that were included in the Iraqi
government federal budget had been reconciled, except for the revenues that were
generated from Kurdistan region’s crude oil export sales through the borders and ports,
where those revenues were not included in the federal budget (as there is an agreement on
adaptive implementation between National Secretary and the International Secretary of the
EITI).
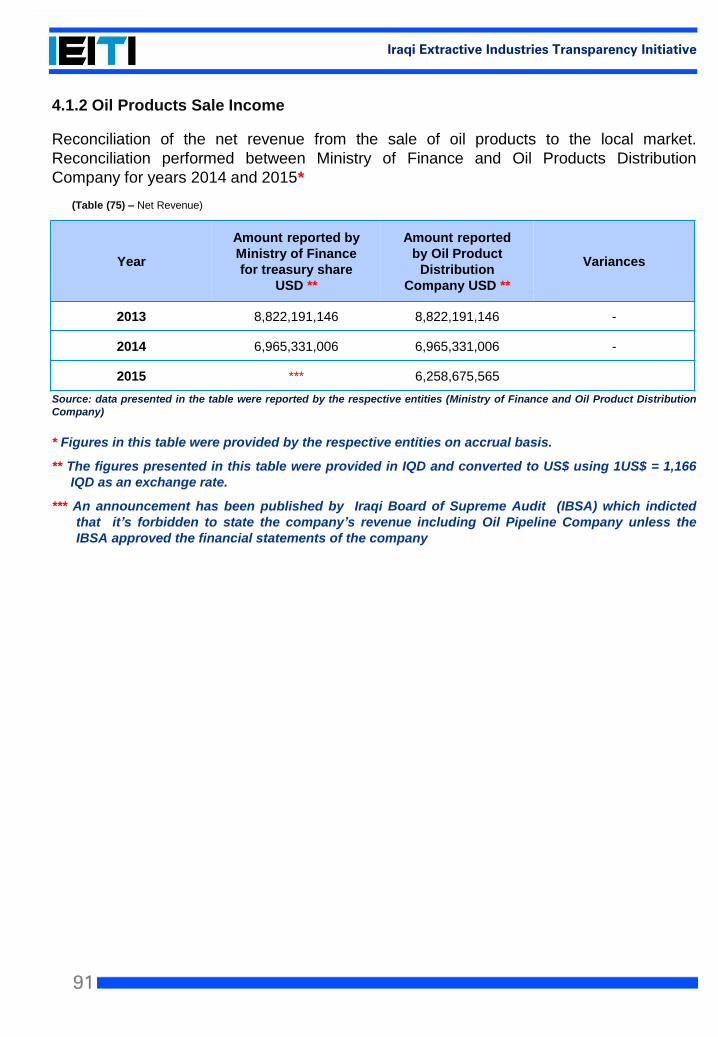
91
Iraqi Extractive Industries Transparency Initiative
4.1.2 Oil Products Sale Income
Reconciliation of the net revenue from the sale of oil products to the local market.
Reconciliation performed between Ministry of Finance and Oil Products Distribution
Company for years 2014 and 2015*
Source: data presented in the table were reported by the respective entities (Ministry of Finance and Oil Product Distribution
Company)
* Figures in this table were provided by the respective entities on accrual basis.
** The figures presented in this table were provided in IQD and converted to US$ using 1US$ = 1,166
IQD as an exchange rate.
*** An announcement has been published by Iraqi Board of Supreme Audit (IBSA) which indicted
that it’s forbidden to state the company’s revenue including Oil Pipeline Company unless the
IBSA approved the financial statements of the company
Year
Amount reported by
Ministry of Finance
for treasury share
USD **
Amount reported
by Oil Product
Distribution
Company USD **
Variances
2013 8,822,191,146 8,822,191,146 -
2014 6,965,331,006 6,965,331,006 -
2015 *** 6,258,675,565
(Table (75) – Net Revenue)
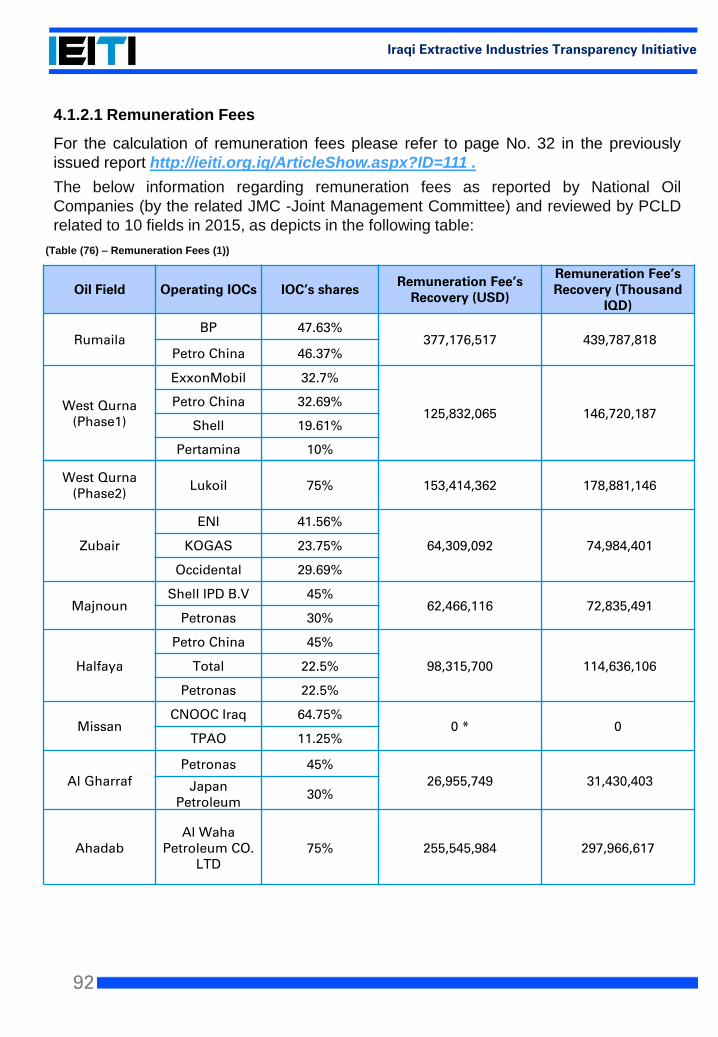
92
Iraqi Extractive Industries Transparency Initiative
Oil Field Operating IOCs IOC’s sharesRemuneration Fee’s
Recovery (USD)
Remuneration Fee’sRecovery (Thousand
IQD)
RumailaBP 47.63%
377,176,517 439,787,818Petro China 46.37%
West Qurna(Phase1)
ExxonMobil 32.7%
125,832,065 146,720,187Petro China 32.69%
Shell 19.61%
Pertamina 10%
West Qurna(Phase2)
Lukoil 75% 153,414,362 178,881,146
Zubair
ENI 41.56%
64,309,092 74,984,401KOGAS 23.75%
Occidental 29.69%
MajnounShell IPD B.V 45%
62,466,116 72,835,491Petronas 30%
Halfaya
Petro China 45%
98,315,700 114,636,106Total 22.5%
Petronas 22.5%
MissanCNOOC Iraq 64.75%
0 * 0TPAO 11.25%
Al Gharraf
Petronas 45%
26,955,749 31,430,403Japan Petroleum
30%
AhadabAl Waha
Petroleum CO. LTD
75% 255,545,984 297,966,617
4.1.2.1 Remuneration Fees
For the calculation of remuneration fees please refer to page No. 32 in the previously
issued report http://ieiti.org.iq/ArticleShow.aspx?ID=111 .
The below information regarding remuneration fees as reported by National Oil
Companies (by the related JMC -Joint Management Committee) and reviewed by PCLD
related to 10 fields in 2015, as depicts in the following table:
(Table (76) – Remuneration Fees (1))
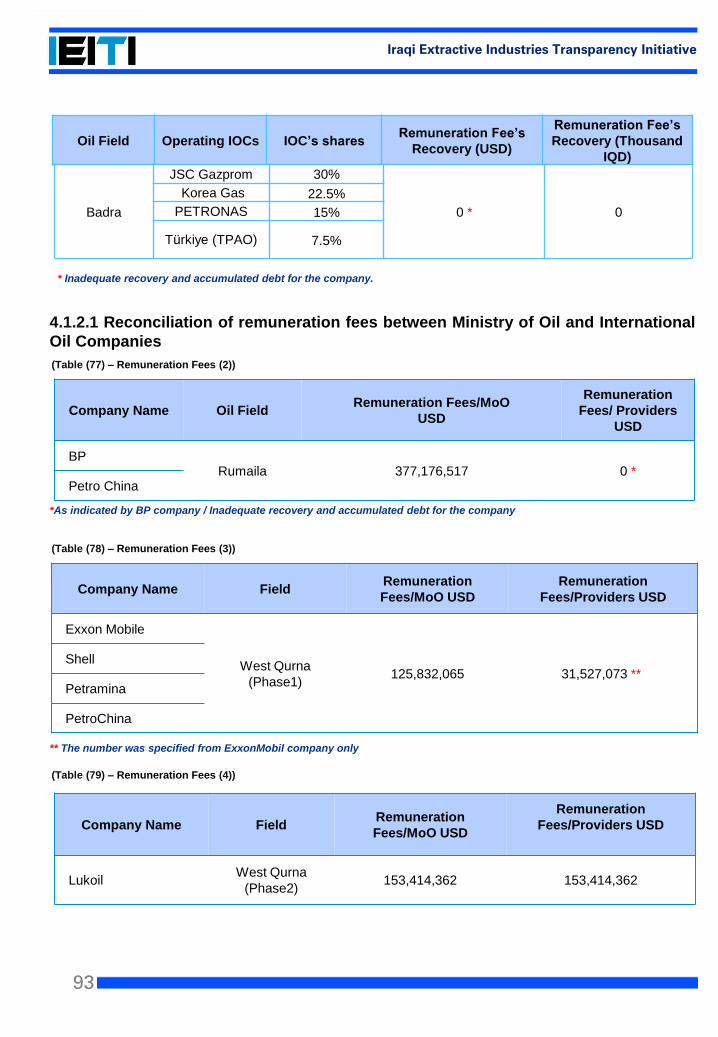
93
Iraqi Extractive Industries Transparency Initiative
4.1.2.1 Reconciliation of remuneration fees between Ministry of Oil and International
Oil Companies
*As indicated by BP company / Inadequate recovery and accumulated debt for the company
** The number was specified from ExxonMobil company only
Company Name FieldRemuneration
Fees/MoO USD
Remuneration
Fees/Providers USD
LukoilWest Qurna
(Phase2)153,414,362 153,414,362
Oil Field Operating IOCs IOC’s sharesRemuneration Fee’s
Recovery (USD)
Remuneration Fee’s
Recovery (Thousand
IQD)
Badra
JSC Gazprom 30%
0 * 0
Korea Gas 22.5%
PETRONAS 15%
Türkiye (TPAO) 7.5%
Company Name Oil FieldRemuneration Fees/MoO
USD
Remuneration
Fees/ Providers
USD
BPRumaila 377,176,517 0 *
Petro China
(Table (77) – Remuneration Fees (2))
Company Name FieldRemuneration
Fees/MoO USD
Remuneration
Fees/Providers USD
Exxon Mobile
West Qurna
(Phase1)125,832,065 31,527,073 **
Shell
Petramina
PetroChina
(Table (78) – Remuneration Fees (3))
(Table (79) – Remuneration Fees (4))
* Inadequate recovery and accumulated debt for the company.
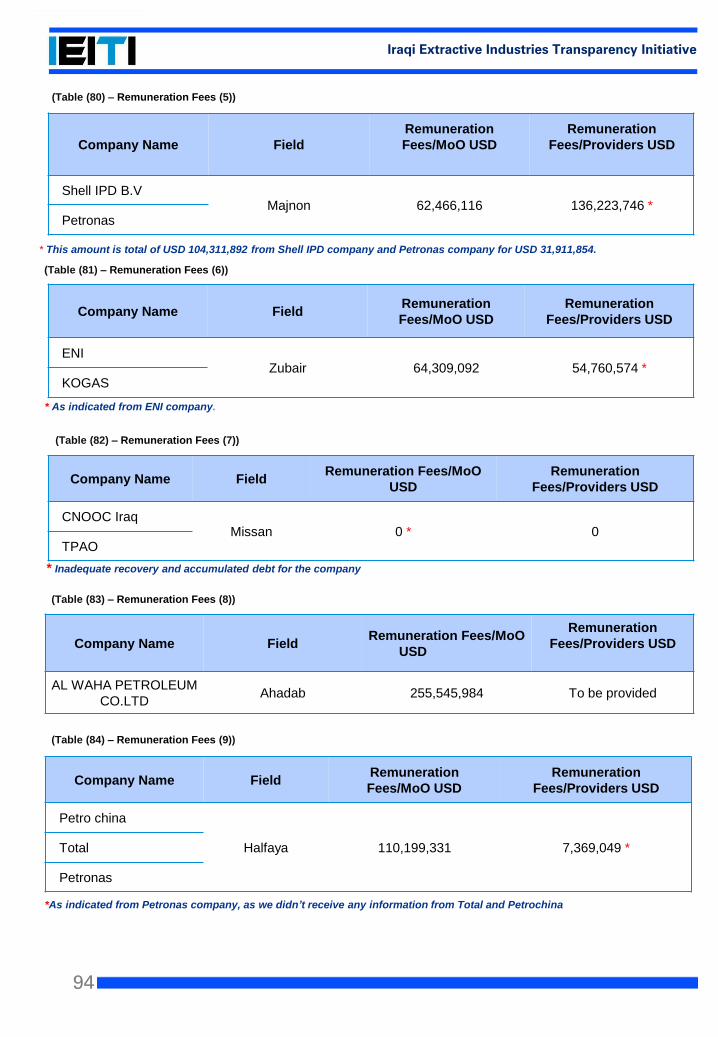
94
Iraqi Extractive Industries Transparency Initiative
* As indicated from ENI company.
* Inadequate recovery and accumulated debt for the company
*As indicated from Petronas company, as we didn’t receive any information from Total and Petrochina
Company Name FieldRemuneration
Fees/MoO USD
Remuneration
Fees/Providers USD
ENIZubair 64,309,092 54,760,574 *
KOGAS
Company Name Field
Remuneration
Fees/MoO USD
Remuneration
Fees/Providers USD
Shell IPD B.VMajnon 62,466,116 136,223,746 *
Petronas
(Table (81) – Remuneration Fees (6))
(Table (80) – Remuneration Fees (5))
Company Name FieldRemuneration Fees/MoO
USD
Remuneration
Fees/Providers USD
CNOOC IraqMissan 0 * 0
TPAO
(Table (82) – Remuneration Fees (7))
Company Name FieldRemuneration Fees/MoO
USD
Remuneration
Fees/Providers USD
AL WAHA PETROLEUM
CO.LTDAhadab 255,545,984 To be provided
(Table (83) – Remuneration Fees (8))
Company Name FieldRemuneration
Fees/MoO USD
Remuneration
Fees/Providers USD
Petro china
Halfaya 110,199,331 7,369,049 *Total
Petronas
(Table (84) – Remuneration Fees (9))
* This amount is total of USD 104,311,892 from Shell IPD company and Petronas company for USD 31,911,854.
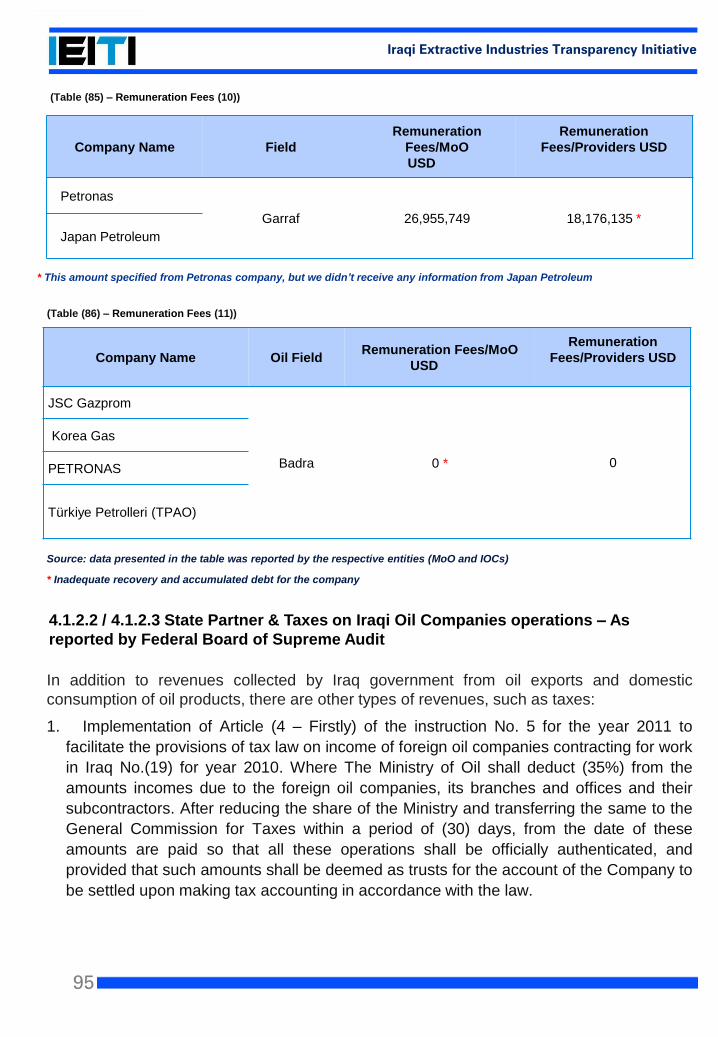
95
Iraqi Extractive Industries Transparency Initiative
* This amount specified from Petronas company, but we didn’t receive any information from Japan Petroleum
Company Name Field
Remuneration
Fees/MoO
USD
Remuneration
Fees/Providers USD
Petronas
Garraf 26,955,749 18,176,135 *
Japan Petroleum
(Table (85) – Remuneration Fees (10))
Company Name Oil FieldRemuneration Fees/MoO
USD
Remuneration
Fees/Providers USD
JSC Gazprom
Badra 0 * 0
Korea Gas
PETRONAS
Türkiye Petrolleri (TPAO)
Source: data presented in the table was reported by the respective entities (MoO and IOCs)
* Inadequate recovery and accumulated debt for the company
(Table (86) – Remuneration Fees (11))
4.1.2.2 / 4.1.2.3 State Partner & Taxes on Iraqi Oil Companies operations – As
reported by Federal Board of Supreme Audit
In addition to revenues collected by Iraq government from oil exports and domestic
consumption of oil products, there are other types of revenues, such as taxes:
1. Implementation of Article (4 – Firstly) of the instruction No. 5 for the year 2011 to
facilitate the provisions of tax law on income of foreign oil companies contracting for work
in Iraq No.(19) for year 2010. Where The Ministry of Oil shall deduct (35%) from the
amounts incomes due to the foreign oil companies, its branches and offices and their
subcontractors. After reducing the share of the Ministry and transferring the same to the
General Commission for Taxes within a period of (30) days, from the date of these
amounts are paid so that all these operations shall be officially authenticated, and
provided that such amounts shall be deemed as trusts for the account of the Company to
be settled upon making tax accounting in accordance with the law.
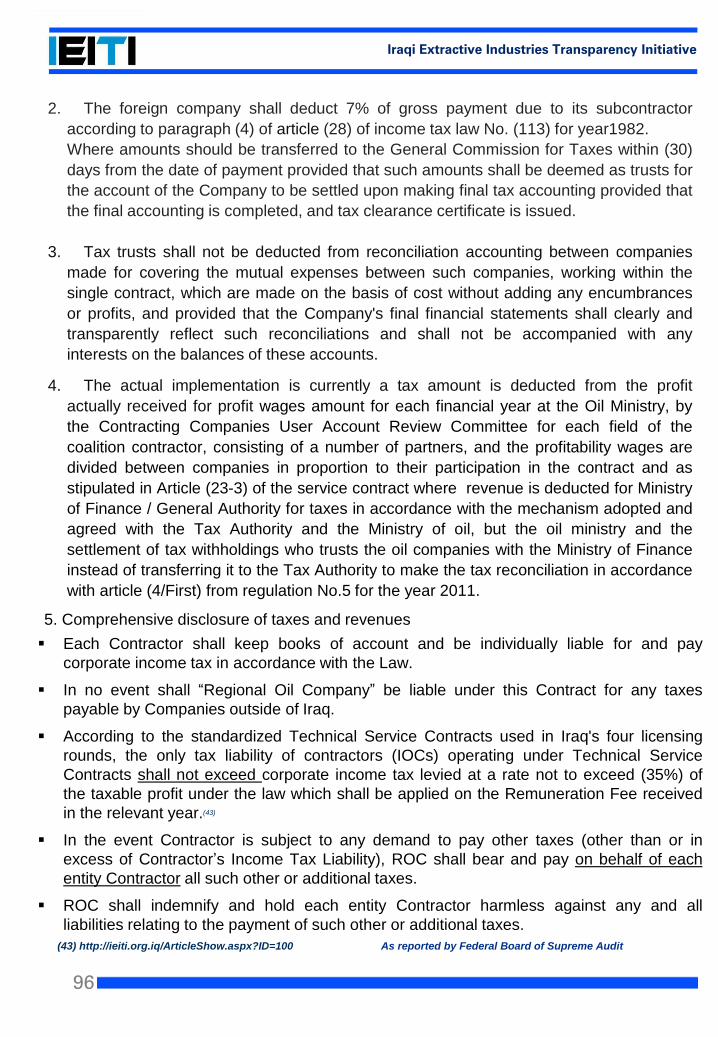
96
Iraqi Extractive Industries Transparency Initiative
2. The foreign company shall deduct 7% of gross payment due to its subcontractor
according to paragraph (4) of article (28) of income tax law No. (113) for year1982.
Where amounts should be transferred to the General Commission for Taxes within (30)
days from the date of payment provided that such amounts shall be deemed as trusts for
the account of the Company to be settled upon making final tax accounting provided that
the final accounting is completed, and tax clearance certificate is issued.
3. Tax trusts shall not be deducted from reconciliation accounting between companies
made for covering the mutual expenses between such companies, working within the
single contract, which are made on the basis of cost without adding any encumbrances
or profits, and provided that the Company's final financial statements shall clearly and
transparently reflect such reconciliations and shall not be accompanied with any
interests on the balances of these accounts.
4. The actual implementation is currently a tax amount is deducted from the profit
actually received for profit wages amount for each financial year at the Oil Ministry, by
the Contracting Companies User Account Review Committee for each field of the
coalition contractor, consisting of a number of partners, and the profitability wages are
divided between companies in proportion to their participation in the contract and as
stipulated in Article (23-3) of the service contract where revenue is deducted for Ministry
of Finance / General Authority for taxes in accordance with the mechanism adopted and
agreed with the Tax Authority and the Ministry of oil, but the oil ministry and the
settlement of tax withholdings who trusts the oil companies with the Ministry of Finance
instead of transferring it to the Tax Authority to make the tax reconciliation in accordance
with article (4/First) from regulation No.5 for the year 2011.
Each Contractor shall keep books of account and be individually liable for and pay
corporate income tax in accordance with the Law.
In no event shall “Regional Oil Company” be liable under this Contract for any taxes
payable by Companies outside of Iraq.
According to the standardized Technical Service Contracts used in Iraq's four licensing
rounds, the only tax liability of contractors (IOCs) operating under Technical Service
Contracts shall not exceed corporate income tax levied at a rate not to exceed (35%) of
the taxable profit under the law which shall be applied on the Remuneration Fee received
in the relevant year.(43)
In the event Contractor is subject to any demand to pay other taxes (other than or in
excess of Contractor’s Income Tax Liability), ROC shall bear and pay on behalf of each
entity Contractor all such other or additional taxes.
ROC shall indemnify and hold each entity Contractor harmless against any and all
liabilities relating to the payment of such other or additional taxes.
As reported by Federal Board of Supreme Audit
5. Comprehensive disclosure of taxes and revenues
(43) http://ieiti.org.iq/ArticleShow.aspx?ID=100
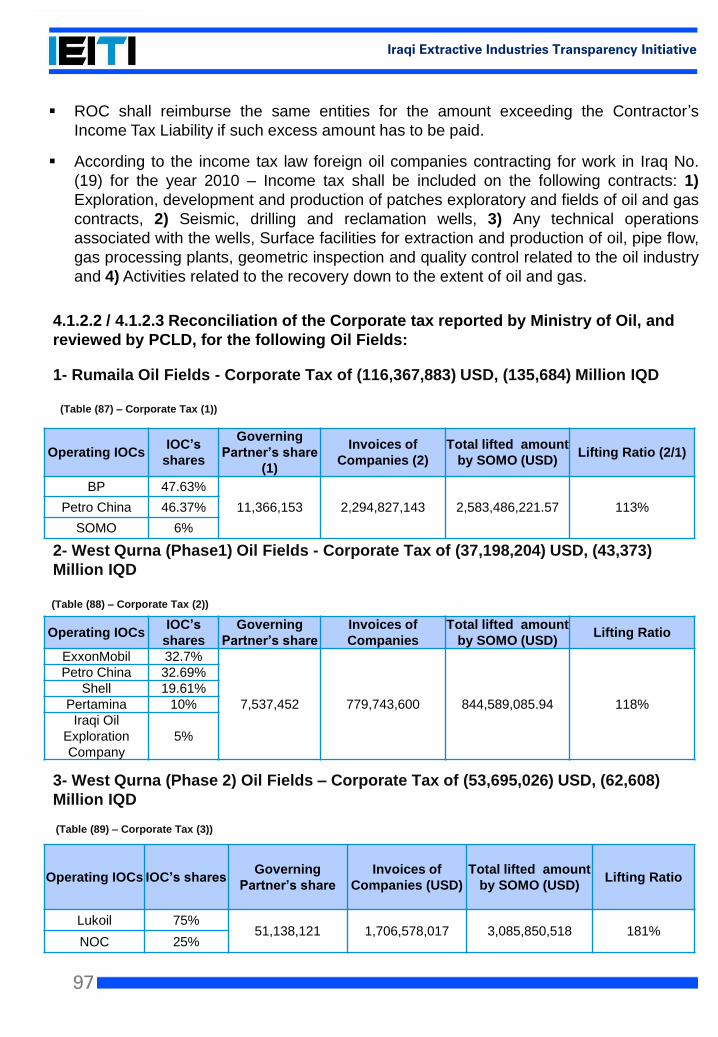
97
Iraqi Extractive Industries Transparency Initiative
ROC shall reimburse the same entities for the amount exceeding the Contractor’s
Income Tax Liability if such excess amount has to be paid.
According to the income tax law foreign oil companies contracting for work in Iraq No.
(19) for the year 2010 – Income tax shall be included on the following contracts: 1)
Exploration, development and production of patches exploratory and fields of oil and gas
contracts, 2) Seismic, drilling and reclamation wells, 3) Any technical operations
associated with the wells, Surface facilities for extraction and production of oil, pipe flow,
gas processing plants, geometric inspection and quality control related to the oil industry
and 4) Activities related to the recovery down to the extent of oil and gas.
4.1.2.2 / 4.1.2.3 Reconciliation of the Corporate tax reported by Ministry of Oil, and
reviewed by PCLD, for the following Oil Fields:
1- Rumaila Oil Fields - Corporate Tax of (116,367,883) USD, (135,684) Million IQD
2- West Qurna (Phase1) Oil Fields - Corporate Tax of (37,198,204) USD, (43,373)
Million IQD
3- West Qurna (Phase 2) Oil Fields – Corporate Tax of (53,695,026) USD, (62,608)
Million IQD
Operating IOCsIOC’s
shares
Governing
Partner’s share
(1)
Invoices of
Companies (2)
Total lifted amount
by SOMO (USD)Lifting Ratio (2/1)
BP 47.63%
11,366,153 2,294,827,143 2,583,486,221.57 113%Petro China 46.37%
SOMO 6%
Operating IOCsIOC’s
shares
Governing
Partner’s share
Invoices of
Companies
Total lifted amount
by SOMO (USD)Lifting Ratio
ExxonMobil 32.7%
7,537,452 779,743,600 844,589,085.94 118%
Petro China 32.69%
Shell 19.61%
Pertamina 10%
Iraqi Oil
Exploration
Company
5%
(Table (87) – Corporate Tax (1))
(Table (88) – Corporate Tax (2))
Operating IOCs IOC’s sharesGoverning
Partner’s share
Invoices of
Companies (USD)
Total lifted amount
by SOMO (USD)Lifting Ratio
Lukoil 75%51,138,121 1,706,578,017 3,085,850,518 181%
NOC 25%
(Table (89) – Corporate Tax (3))
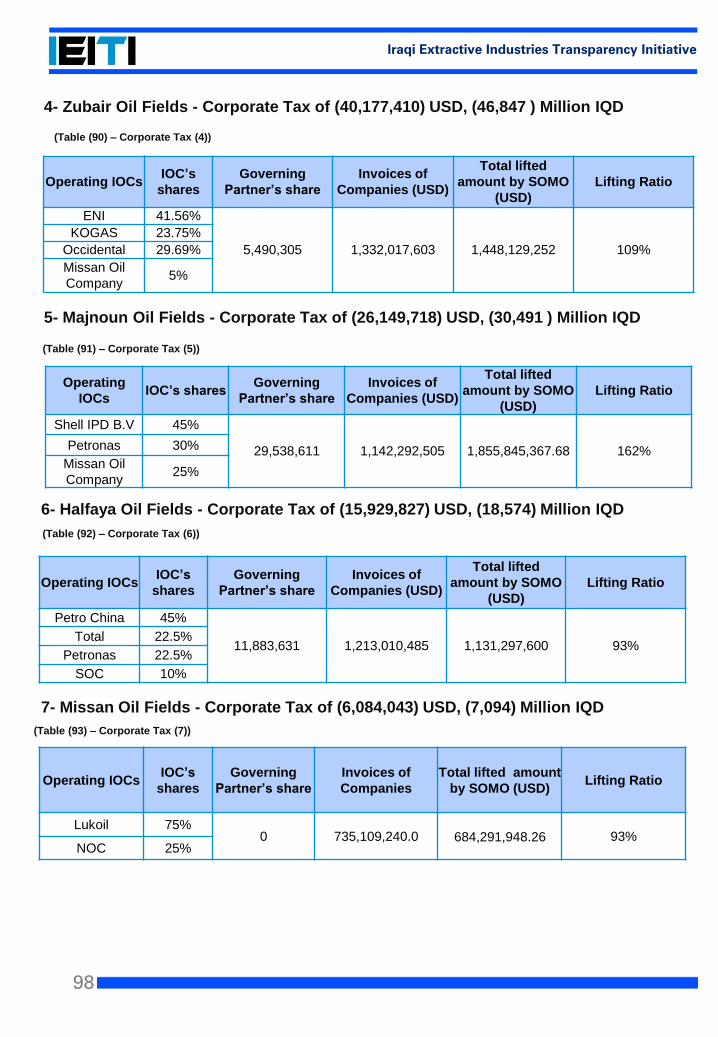
98
Iraqi Extractive Industries Transparency Initiative
4- Zubair Oil Fields - Corporate Tax of (40,177,410) USD, (46,847 ) Million IQD
5- Majnoun Oil Fields - Corporate Tax of (26,149,718) USD, (30,491 ) Million IQD
Operating IOCsIOC’s
shares
Governing
Partner’s share
Invoices of
Companies (USD)
Total lifted
amount by SOMO
(USD)
Lifting Ratio
ENI 41.56%
5,490,305 1,332,017,603 1,448,129,252 109%
KOGAS 23.75%
Occidental 29.69%
Missan Oil
Company 5%
Operating
IOCsIOC’s shares
Governing
Partner’s share
Invoices of
Companies (USD)
Total lifted
amount by SOMO
(USD)
Lifting Ratio
Shell IPD B.V 45%
29,538,611 1,142,292,505 1,855,845,367.68 162%Petronas 30%
Missan Oil
Company 25%
(Table (90) – Corporate Tax (4))
(Table (91) – Corporate Tax (5))
6- Halfaya Oil Fields - Corporate Tax of (15,929,827) USD, (18,574) Million IQD
7- Missan Oil Fields - Corporate Tax of (6,084,043) USD, (7,094) Million IQD
Operating IOCsIOC’s
shares
Governing
Partner’s share
Invoices of
Companies (USD)
Total lifted
amount by SOMO
(USD)
Lifting Ratio
Petro China 45%
11,883,631 1,213,010,485 1,131,297,600 93%Total 22.5%
Petronas 22.5%
SOC 10%
(Table (92) – Corporate Tax (6))
Operating IOCsIOC’s
shares
Governing
Partner’s share
Invoices of
Companies
Total lifted amount
by SOMO (USD)Lifting Ratio
Lukoil 75%0 735,109,240.0 684,291,948.26 93%
NOC 25%
(Table (93) – Corporate Tax (7))
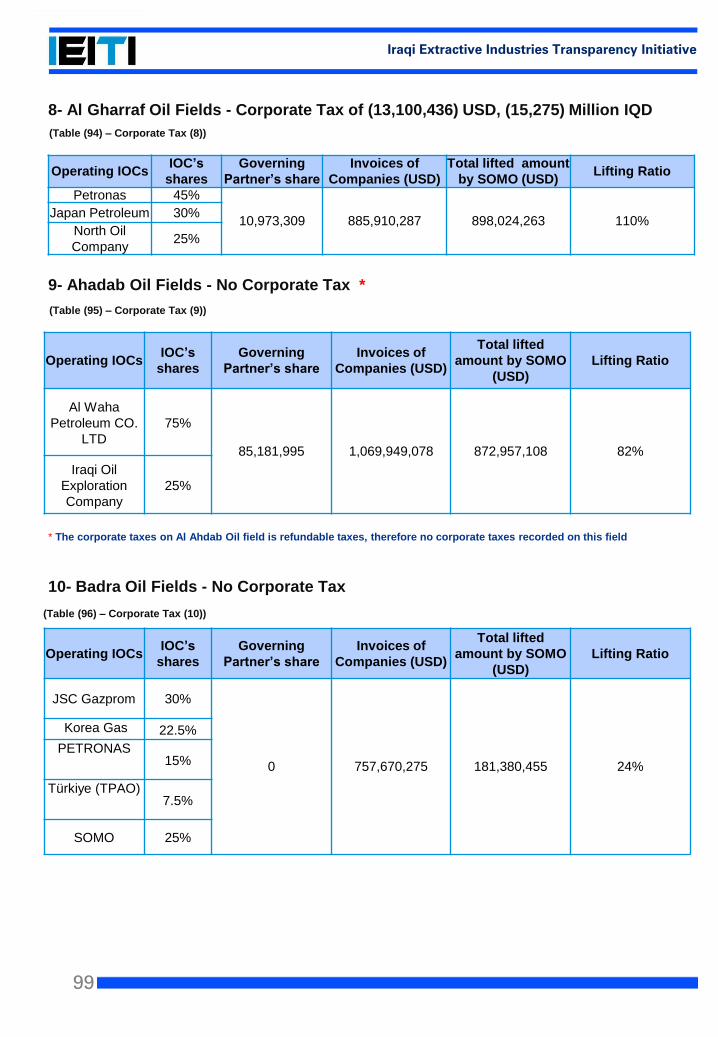
99
Iraqi Extractive Industries Transparency Initiative
8- Al Gharraf Oil Fields - Corporate Tax of (13,100,436) USD, (15,275) Million IQD
9- Ahadab Oil Fields - No Corporate Tax *
* The corporate taxes on Al Ahdab Oil field is refundable taxes, therefore no corporate taxes recorded on this field
10- Badra Oil Fields - No Corporate Tax
Operating IOCsIOC’s
shares
Governing
Partner’s share
Invoices of
Companies (USD)
Total lifted
amount by SOMO
(USD)
Lifting Ratio
Al Waha
Petroleum CO.
LTD
75%
85,181,995 1,069,949,078 872,957,108 82%
Iraqi Oil
Exploration
Company
25%
Operating IOCsIOC’s
shares
Governing
Partner’s share
Invoices of
Companies (USD)
Total lifted amount
by SOMO (USD)Lifting Ratio
Petronas 45%
10,973,309 885,910,287 898,024,263 110%Japan Petroleum 30%
North Oil
Company 25%
(Table (94) – Corporate Tax (8))
Operating IOCsIOC’s
shares
Governing
Partner’s share
Invoices of
Companies (USD)
Total lifted
amount by SOMO
(USD)
Lifting Ratio
JSC Gazprom 30%
0 757,670,275 181,380,455 24%
Korea Gas 22.5%
PETRONAS 15%
Türkiye (TPAO)7.5%
SOMO 25%
(Table (96) – Corporate Tax (10))
(Table (95) – Corporate Tax (9))
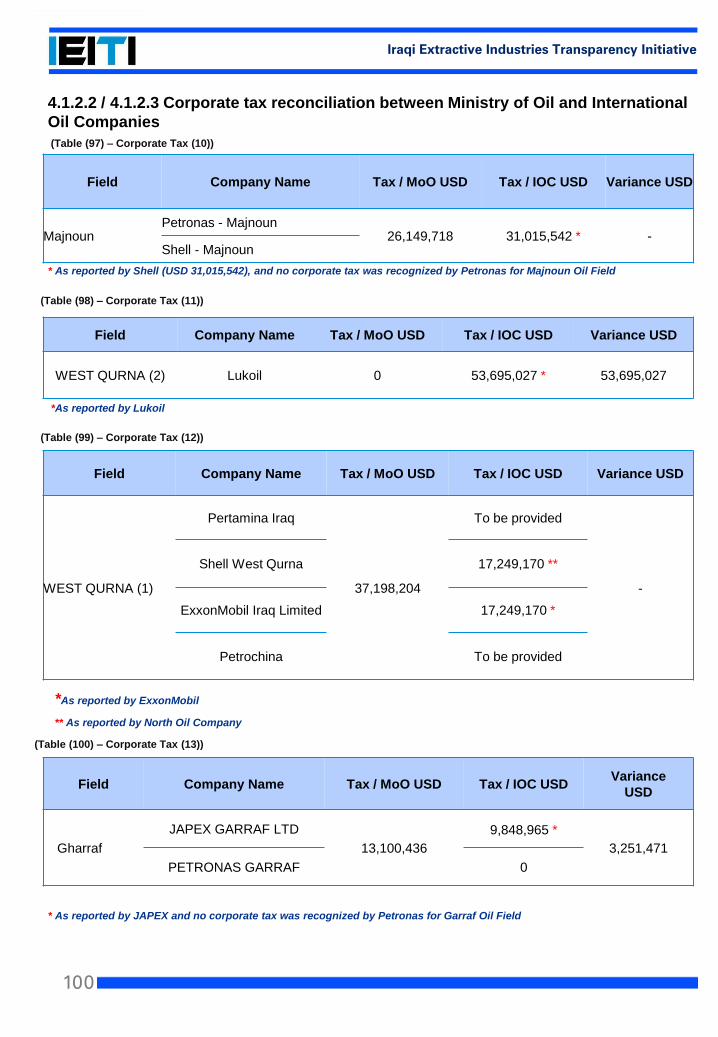
100
Iraqi Extractive Industries Transparency Initiative
4.1.2.2 / 4.1.2.3 Corporate tax reconciliation between Ministry of Oil and International
Oil Companies
* As reported by Shell (USD 31,015,542), and no corporate tax was recognized by Petronas for Majnoun Oil Field
*As reported by Lukoil
*As reported by ExxonMobil
** As reported by North Oil Company
* As reported by JAPEX and no corporate tax was recognized by Petronas for Garraf Oil Field
Field Company Name Tax / MoO USD Tax / IOC USD Variance USD
WEST QURNA (2) Lukoil 0 53,695,027 * 53,695,027
Field Company Name Tax / MoO USD Tax / IOC USD Variance USD
MajnounPetronas - Majnoun
26,149,718 31,015,542 * -Shell - Majnoun
Field Company Name Tax / MoO USD Tax / IOC USD Variance USD
WEST QURNA (1)
Pertamina Iraq
37,198,204
To be provided
-
Shell West Qurna 17,249,170 **
ExxonMobil Iraq Limited 17,249,170 *
Petrochina To be provided
Field Company Name Tax / MoO USD Tax / IOC USDVariance
USD
Gharraf
JAPEX GARRAF LTD
13,100,436
9,848,965 *
3,251,471
PETRONAS GARRAF 0
(Table (97) – Corporate Tax (10))
(Table (98) – Corporate Tax (11))
(Table (99) – Corporate Tax (12))
(Table (100) – Corporate Tax (13))
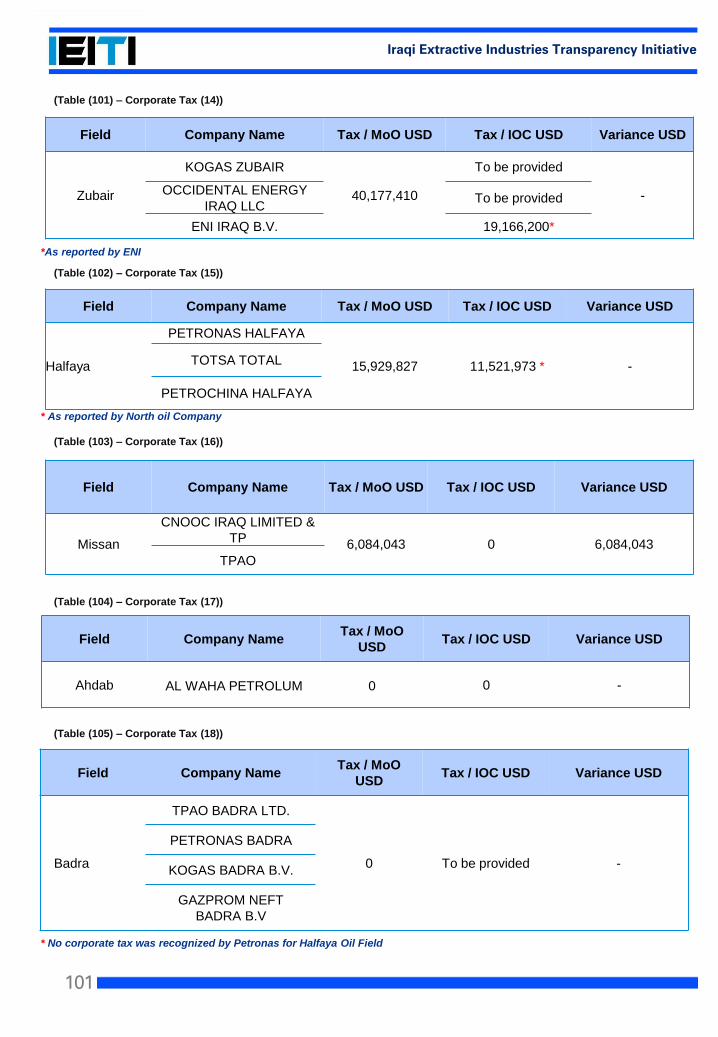
101
Iraqi Extractive Industries Transparency Initiative
*As reported by ENI
* As reported by North oil Company
* No corporate tax was recognized by Petronas for Halfaya Oil Field
Field Company NameTax / MoO
USDTax / IOC USD Variance USD
Badra
TPAO BADRA LTD.
0 To be provided -
PETRONAS BADRA
KOGAS BADRA B.V.
GAZPROM NEFT
BADRA B.V
Field Company Name Tax / MoO USD Tax / IOC USD Variance USD
Halfaya
PETRONAS HALFAYA
15,929,827 11,521,973 * -TOTSA TOTAL
PETROCHINA HALFAYA
Field Company Name Tax / MoO USD Tax / IOC USD Variance USD
Zubair
KOGAS ZUBAIR
40,177,410
To be provided
-OCCIDENTAL ENERGY
IRAQ LLCTo be provided
ENI IRAQ B.V. 19,166,200*
Field Company Name Tax / MoO USD Tax / IOC USD Variance USD
Missan
CNOOC IRAQ LIMITED &
TP6,084,043 0 6,084,043
TPAO
Field Company NameTax / MoO
USDTax / IOC USD Variance USD
Ahdab AL WAHA PETROLUM 0 0 -
(Table (101) – Corporate Tax (14))
(Table (102) – Corporate Tax (15))
(Table (103) – Corporate Tax (16))
(Table (104) – Corporate Tax (17))
(Table (105) – Corporate Tax (18))
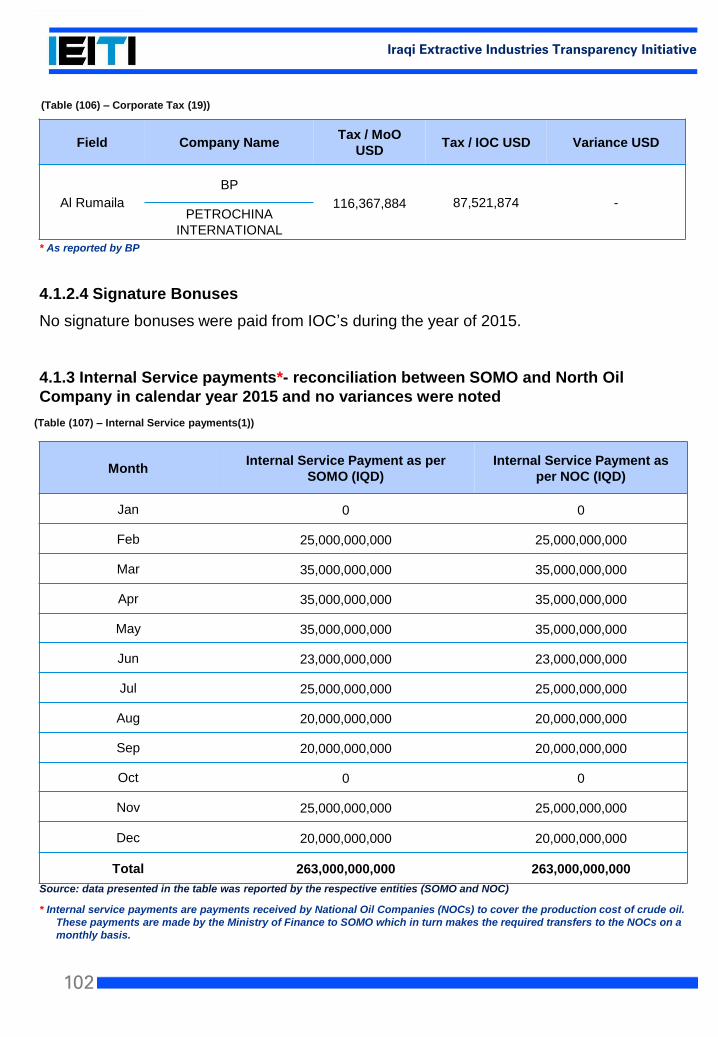
102
Iraqi Extractive Industries Transparency Initiative
Field Company NameTax / MoO
USDTax / IOC USD Variance USD
Al Rumaila
BP
116,367,884 87,521,874 -PETROCHINA
INTERNATIONAL
* As reported by BP
4.1.2.4 Signature Bonuses
No signature bonuses were paid from IOC’s during the year of 2015.
(Table (106) – Corporate Tax (19))
4.1.3 Internal Service payments*- reconciliation between SOMO and North Oil
Company in calendar year 2015 and no variances were noted
Source: data presented in the table was reported by the respective entities (SOMO and NOC)
* Internal service payments are payments received by National Oil Companies (NOCs) to cover the production cost of crude oil.
These payments are made by the Ministry of Finance to SOMO which in turn makes the required transfers to the NOCs on a
monthly basis.
MonthInternal Service Payment as per
SOMO (IQD)
Internal Service Payment as
per NOC (IQD)
Jan 0 0
Feb 25,000,000,000 25,000,000,000
Mar 35,000,000,000 35,000,000,000
Apr 35,000,000,000 35,000,000,000
May 35,000,000,000 35,000,000,000
Jun 23,000,000,000 23,000,000,000
Jul 25,000,000,000 25,000,000,000
Aug 20,000,000,000 20,000,000,000
Sep 20,000,000,000 20,000,000,000
Oct 0 0
Nov 25,000,000,000 25,000,000,000
Dec 20,000,000,000 20,000,000,000
Total 263,000,000,000 263,000,000,000
(Table (107) – Internal Service payments(1))
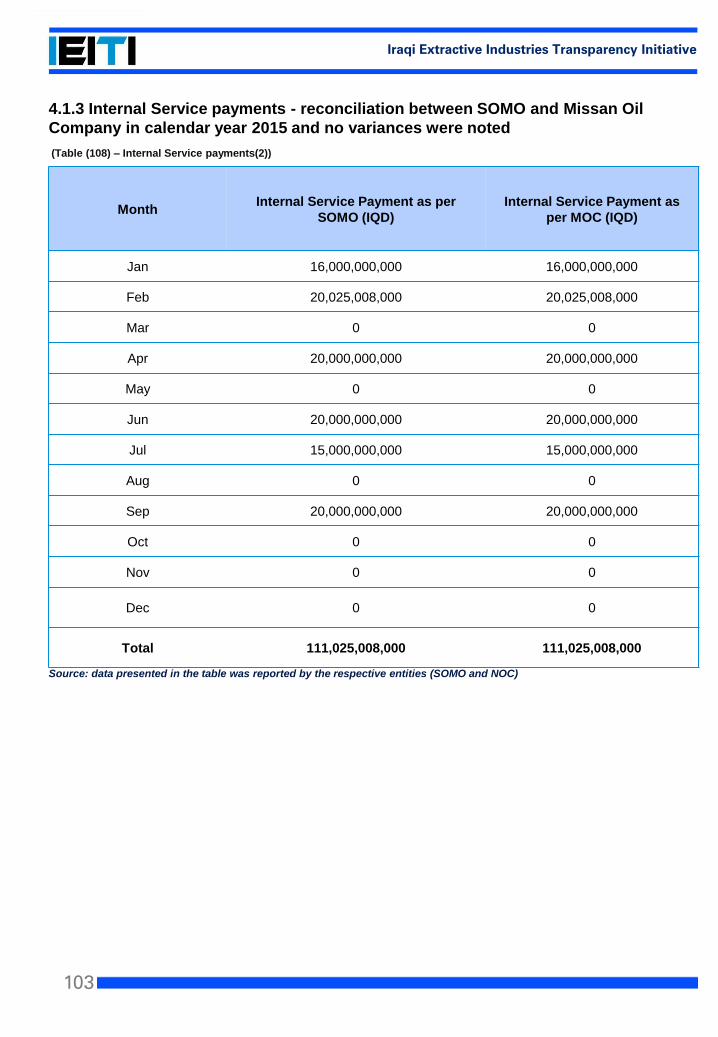
103
Iraqi Extractive Industries Transparency Initiative
4.1.3 Internal Service payments - reconciliation between SOMO and Missan Oil
Company in calendar year 2015 and no variances were noted
Source: data presented in the table was reported by the respective entities (SOMO and NOC)
MonthInternal Service Payment as per
SOMO (IQD)
Internal Service Payment as
per MOC (IQD)
Jan 16,000,000,000 16,000,000,000
Feb 20,025,008,000 20,025,008,000
Mar 0 0
Apr 20,000,000,000 20,000,000,000
May 0 0
Jun 20,000,000,000 20,000,000,000
Jul 15,000,000,000 15,000,000,000
Aug 0 0
Sep 20,000,000,000 20,000,000,000
Oct 0 0
Nov 0 0
Dec 0 0
Total 111,025,008,000 111,025,008,000
(Table (108) – Internal Service payments(2))
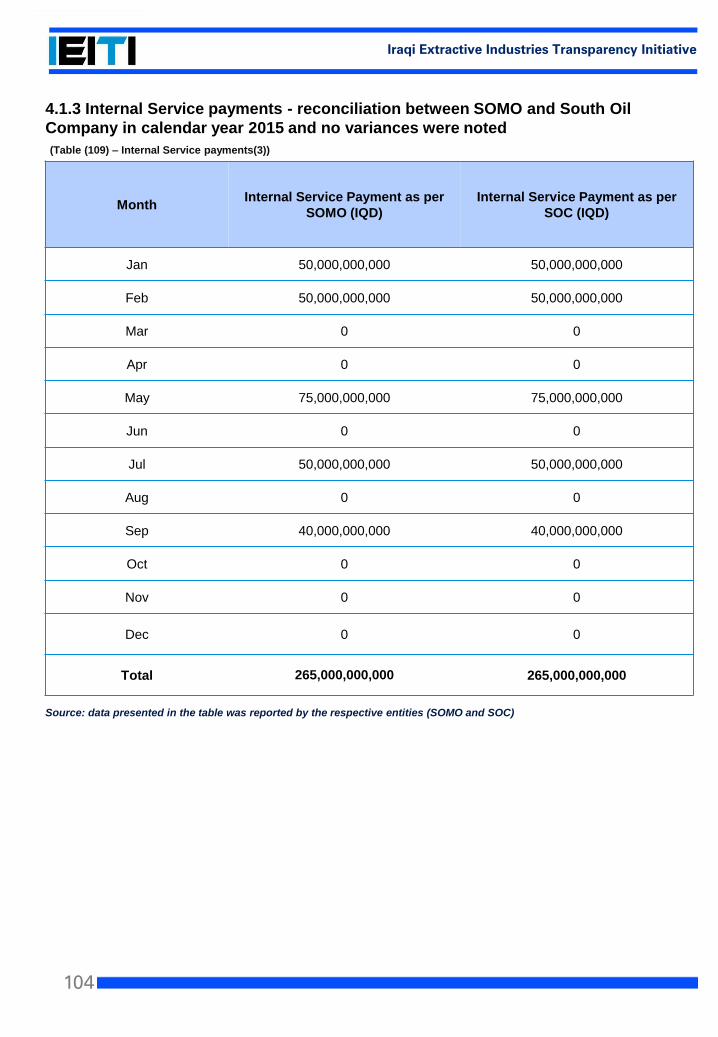
104
Iraqi Extractive Industries Transparency Initiative
4.1.3 Internal Service payments - reconciliation between SOMO and South Oil
Company in calendar year 2015 and no variances were noted
Source: data presented in the table was reported by the respective entities (SOMO and SOC)
MonthInternal Service Payment as per
SOMO (IQD)
Internal Service Payment as per
SOC (IQD)
Jan 50,000,000,000 50,000,000,000
Feb 50,000,000,000 50,000,000,000
Mar 0 0
Apr 0 0
May 75,000,000,000 75,000,000,000
Jun 0 0
Jul 50,000,000,000 50,000,000,000
Aug 0 0
Sep 40,000,000,000 40,000,000,000
Oct 0 0
Nov 0 0
Dec 0 0
Total 265,000,000,000 265,000,000,000
(Table (109) – Internal Service payments(3))
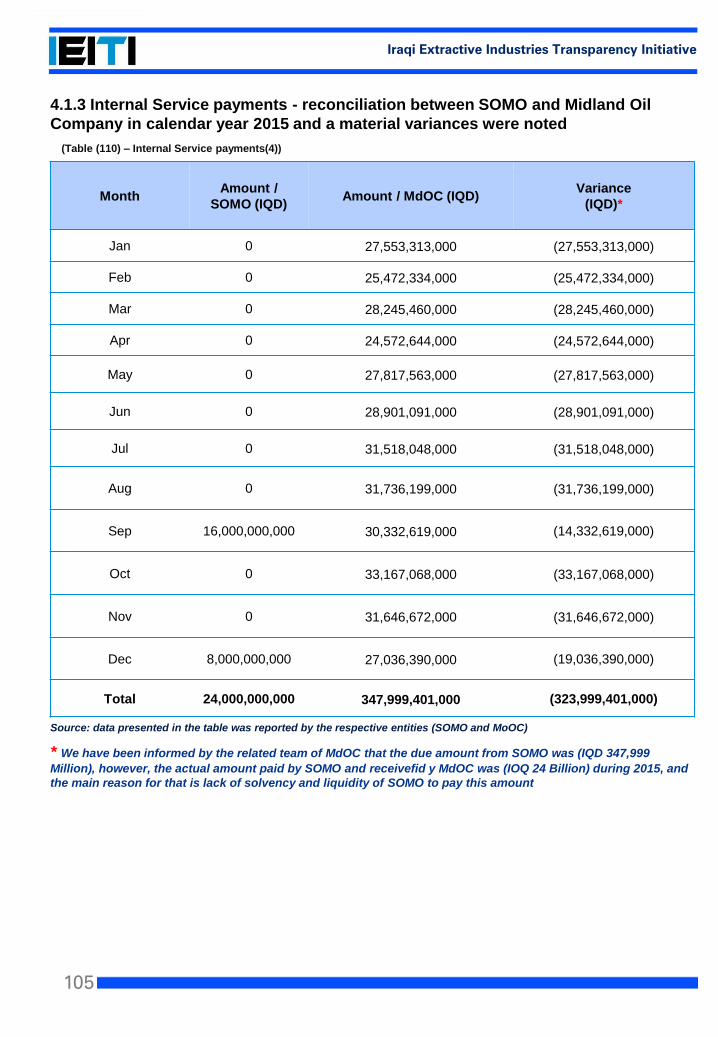
105
Iraqi Extractive Industries Transparency Initiative
4.1.3 Internal Service payments - reconciliation between SOMO and Midland Oil
Company in calendar year 2015 and a material variances were noted
Source: data presented in the table was reported by the respective entities (SOMO and MoOC)
* We have been informed by the related team of MdOC that the due amount from SOMO was (IQD 347,999
Million), however, the actual amount paid by SOMO and receivefid y MdOC was (IOQ 24 Billion) during 2015, and
the main reason for that is lack of solvency and liquidity of SOMO to pay this amount
MonthAmount /
SOMO (IQD)Amount / MdOC (IQD)
Variance
(IQD)*
Jan 0 27,553,313,000 (27,553,313,000)
Feb 0 25,472,334,000 (25,472,334,000)
Mar 0 28,245,460,000 (28,245,460,000)
Apr 0 24,572,644,000 (24,572,644,000)
May 0 27,817,563,000 (27,817,563,000)
Jun 0 28,901,091,000 (28,901,091,000)
Jul 0 31,518,048,000 (31,518,048,000)
Aug 0 31,736,199,000 (31,736,199,000)
Sep 16,000,000,000 30,332,619,000 (14,332,619,000)
Oct 0 33,167,068,000 (33,167,068,000)
Nov 0 31,646,672,000 (31,646,672,000)
Dec 8,000,000,000 27,036,390,000 (19,036,390,000)
Total 24,000,000,000 347,999,401,000 (323,999,401,000)
(Table (110) – Internal Service payments(4))
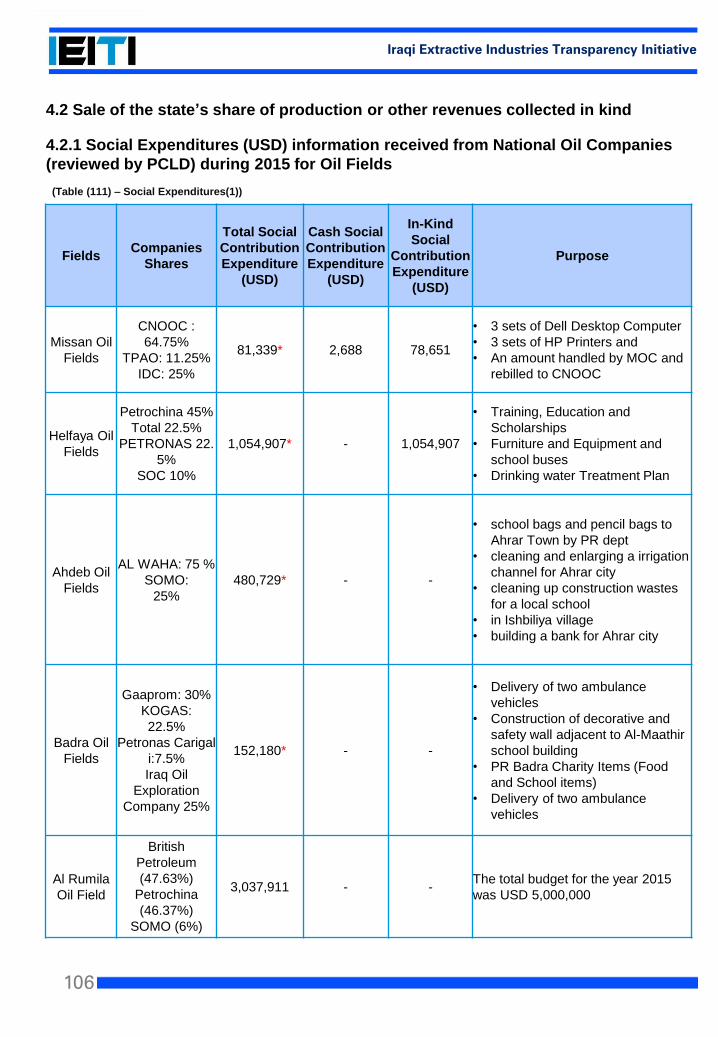
106
Iraqi Extractive Industries Transparency Initiative
4.2 Sale of the state’s share of production or other revenues collected in kind
4.2.1 Social Expenditures (USD) information received from National Oil Companies
(reviewed by PCLD) during 2015 for Oil Fields
FieldsCompanies
Shares
Total Social
Contribution
Expenditure
(USD)
Cash Social
Contribution
Expenditure
(USD)
In-Kind
Social
Contribution
Expenditure
(USD)
Purpose
Missan Oil
Fields
CNOOC :
64.75%
TPAO: 11.25%
IDC: 25%
81,339* 2,688 78,651
• 3 sets of Dell Desktop Computer
• 3 sets of HP Printers and
• An amount handled by MOC and
rebilled to CNOOC
Helfaya Oil
Fields
Petrochina 45%
Total 22.5%
PETRONAS 22.
5%
SOC 10%
1,054,907* - 1,054,907
• Training, Education and
Scholarships
• Furniture and Equipment and
school buses
• Drinking water Treatment Plan
Ahdeb Oil
Fields
AL WAHA: 75 %
SOMO:
25%
480,729* - -
• school bags and pencil bags to
Ahrar Town by PR dept
• cleaning and enlarging a irrigation
channel for Ahrar city
• cleaning up construction wastes
for a local school
• in Ishbiliya village
• building a bank for Ahrar city
Badra Oil
Fields
Gaaprom: 30%
KOGAS:
22.5%
Petronas Carigal
i:7.5%
Iraq Oil
Exploration
Company 25%
152,180* - -
• Delivery of two ambulance
vehicles
• Construction of decorative and
safety wall adjacent to Al-Maathir
school building
• PR Badra Charity Items (Food
and School items)
• Delivery of two ambulance
vehicles
Al Rumila
Oil Field
British
Petroleum
(47.63%)
Petrochina
(46.37%)
SOMO (6%)
3,037,911 - -The total budget for the year 2015
was USD 5,000,000
(Table (111) – Social Expenditures(1))
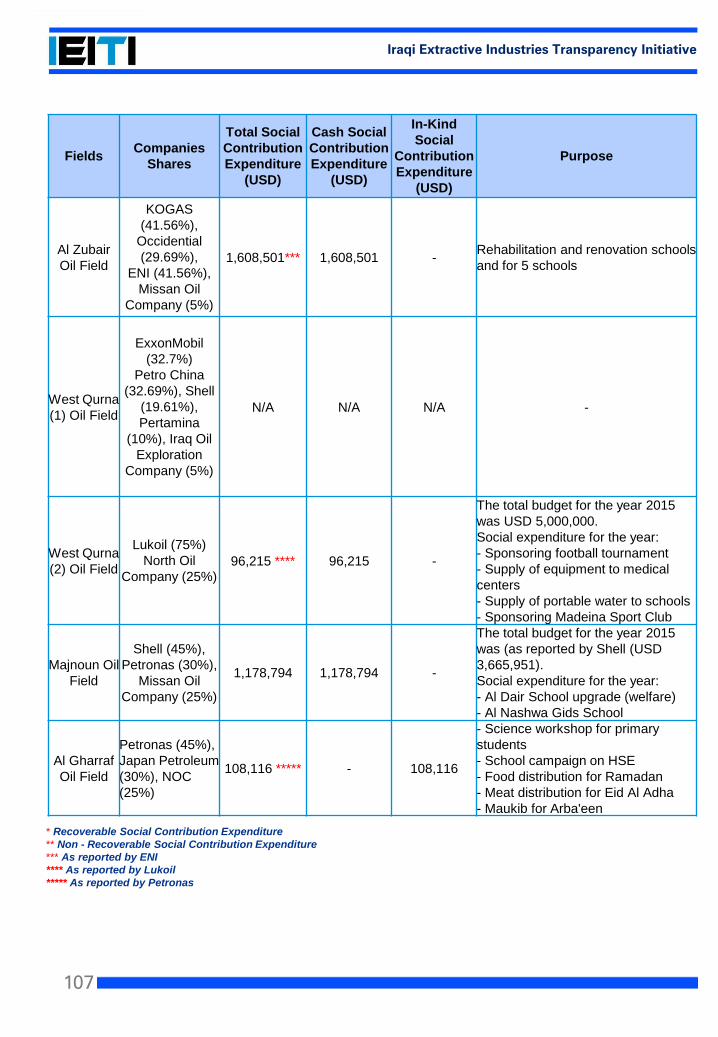
107
Iraqi Extractive Industries Transparency Initiative
FieldsCompanies
Shares
Total Social
Contribution
Expenditure
(USD)
Cash Social
Contribution
Expenditure
(USD)
In-Kind
Social
Contribution
Expenditure
(USD)
Purpose
Al Zubair
Oil Field
KOGAS
(41.56%),
Occidential
(29.69%),
ENI (41.56%),
Missan Oil
Company (5%)
1,608,501*** 1,608,501 -Rehabilitation and renovation schools
and for 5 schools
West Qurna
(1) Oil Field
ExxonMobil
(32.7%)
Petro China
(32.69%), Shell
(19.61%),
Pertamina
(10%), Iraq Oil
Exploration
Company (5%)
N/A N/A N/A -
West Qurna
(2) Oil Field
Lukoil (75%)
North Oil
Company (25%)96,215 **** 96,215 -
The total budget for the year 2015
was USD 5,000,000.
Social expenditure for the year:
- Sponsoring football tournament
- Supply of equipment to medical
centers
- Supply of portable water to schools
- Sponsoring Madeina Sport Club
Majnoun Oil
Field
Shell (45%),
Petronas (30%),
Missan Oil
Company (25%)
1,178,794 1,178,794 -
The total budget for the year 2015
was (as reported by Shell (USD
3,665,951).
Social expenditure for the year:
- Al Dair School upgrade (welfare)
- Al Nashwa Gids School
Al Gharraf
Oil Field
Petronas (45%),
Japan Petroleum
(30%), NOC
(25%)
108,116 ***** - 108,116
- Science workshop for primary
students
- School campaign on HSE
- Food distribution for Ramadan
- Meat distribution for Eid Al Adha
- Maukib for Arba'een
* Recoverable Social Contribution Expenditure
** Non - Recoverable Social Contribution Expenditure
*** As reported by ENI
**** As reported by Lukoil
***** As reported by Petronas
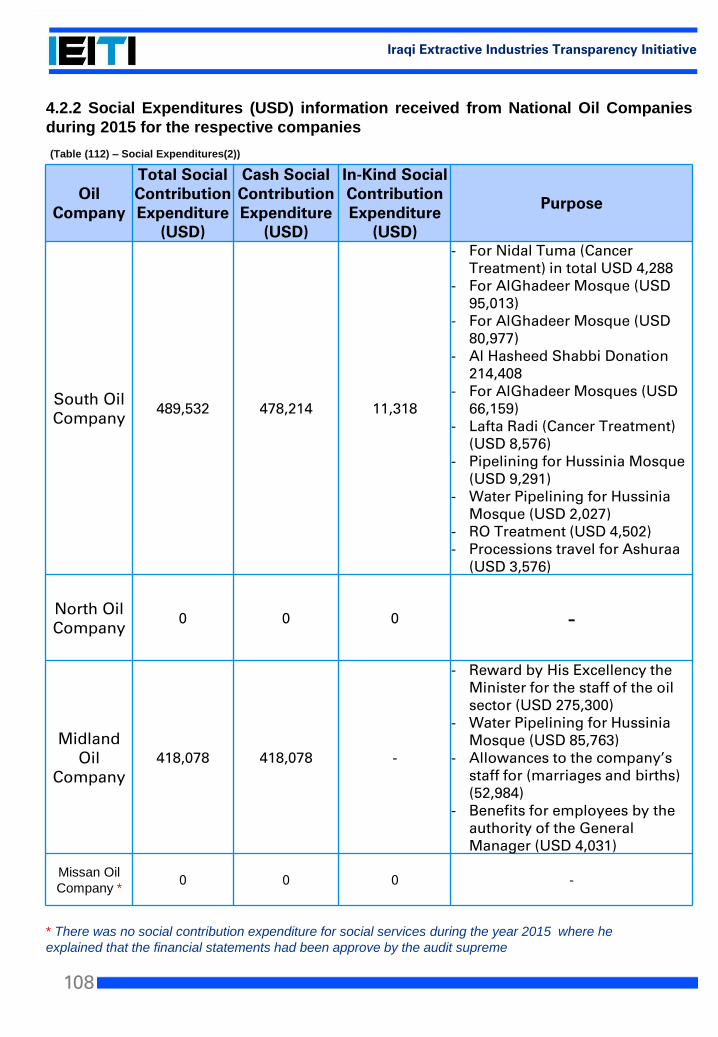
108
Iraqi Extractive Industries Transparency Initiative
4.2.2 Social Expenditures (USD) information received from National Oil Companies
during 2015 for the respective companies
* There was no social contribution expenditure for social services during the year 2015 where he
explained that the financial statements had been approve by the audit supreme
Oil Company
Total Social Contribution Expenditure
(USD)
Cash Social Contribution Expenditure
(USD)
In-Kind Social Contribution Expenditure
(USD)
Purpose
South Oil Company
489,532 478,214 11,318
- For Nidal Tuma (Cancer Treatment) in total USD 4,288
- For AlGhadeer Mosque (USD 95,013)
- For AlGhadeer Mosque (USD 80,977)
- Al Hasheed Shabbi Donation 214,408
- For AlGhadeer Mosques (USD 66,159)
- Lafta Radi (Cancer Treatment) (USD 8,576)
- Pipelining for Hussinia Mosque (USD 9,291)
- Water Pipelining for HussiniaMosque (USD 2,027)
- RO Treatment (USD 4,502)- Processions travel for Ashuraa
(USD 3,576)
North Oil Company
0 0 0 -
Midland Oil
Company418,078 418,078 -
- Reward by His Excellency the Minister for the staff of the oil sector (USD 275,300)
- Water Pipelining for HussiniaMosque (USD 85,763)
- Allowances to the company’s staff for (marriages and births) (52,984)
- Benefits for employees by the authority of the General Manager (USD 4,031)
Missan Oil
Company *0 0 0 -
(Table (112) – Social Expenditures(2))
109
Iraqi Extractive Industries Transparency Initiative
4.3 Infrastructure provisions and barter arrangements
There are no items within oil licensing contracts for barter arrangements as its not applying
with any paragraph of dealing with the oil companies in Iraq.
4.4 Transportation revenues
There are no transportation revenues since it is not implemented.
4.5 Transactions related to State-owned enterprises
Cost of producing an oil barrel at national production companies is calculated under the
approved budget law for year 2015, where the Ministry of Finance calculates it and transfer
those amounts in IQD to SOMO, where subsequently SOMO transfers them as internal
service payments to the national companies which have been mentioned earlier in point
(No. 4.1.3).
4.6 Sub-national payments – Not Applicable4.7 Level of disaggregation
Data were submitted by National Oil Companies, Technical Department and Petroleum
Contracts and Licensing Directorate at the Ministry of Oil, and International Oil Companies
operating under licensing rounds, and Iraqi crude oil International customers. In addition to
data submitted by Ministry of Industry and Minerals, and other entities that have contributed
to submit data for IEITI report using the provided templates.
4.8 Data timeliness
This IEITI Report covers the period starting from January 1st 2015 until December 31st
2015.
4.9.1 Data quality and assurance
KPMG Kawasmy and Partners( KPMG) was appointed by The Iraqi Extractive Industries
Transparency Initiative (IEITI) as the Independent Administrator (IA) to produce the annual
IEITI report for the year 2015, according to the service contract number IEITI-CI-QCBS-03
dated 14 May 2015 in MSG minutes of meeting No. 38 dated 27 April 2016.
4.9.2 The work of the IA is to develop the year 2015 IEITI report that will occur in five
phases, as defined by the MSG, with specific timelines and deliverables for each phase.
this is explained in details under the methodology and approach section, as depicts in IEITI
2015 Inception Report http://ieiti.org.iq/ArticleShow.aspx?ID=112.
4.9.3 We have considered various sources for 2015 IEITI report, including:
• 2016 TORs and EITI standards;
• EITI website(s) and resources;
• EITI annual reports issued by other countries;
• Other publicly available sources of information.
110
Iraqi Extractive Industries Transparency Initiative
5Revenue Allocations
EITI Requirement: 5- Revenue allocations
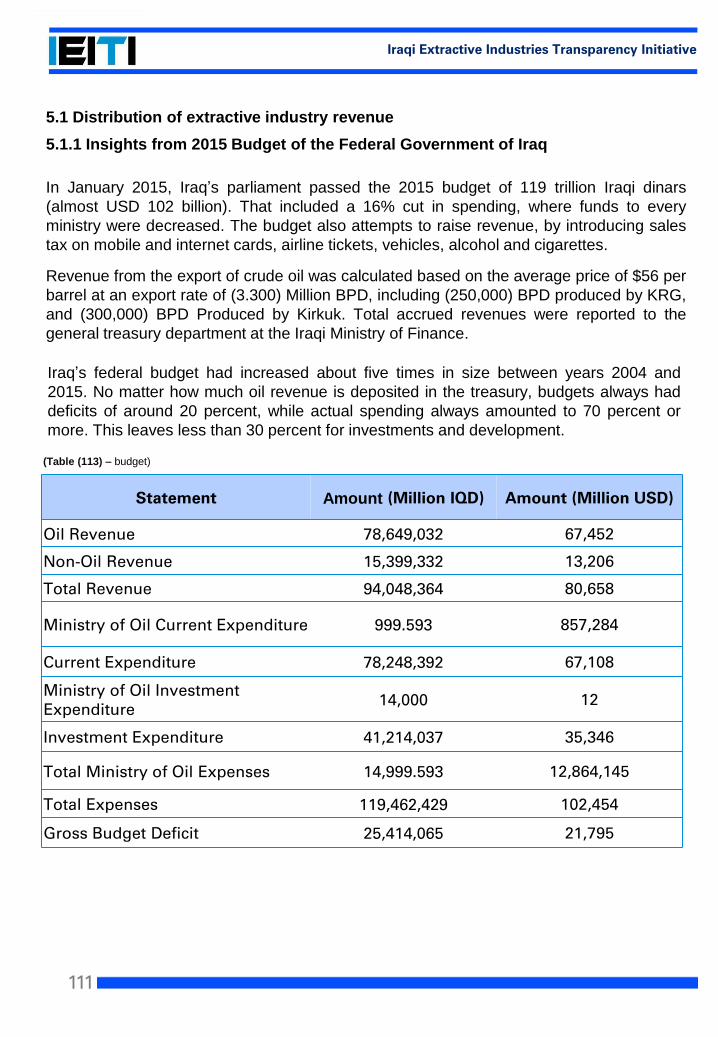
111
Iraqi Extractive Industries Transparency Initiative
In January 2015, Iraq’s parliament passed the 2015 budget of 119 trillion Iraqi dinars
(almost USD 102 billion). That included a 16% cut in spending, where funds to every
ministry were decreased. The budget also attempts to raise revenue, by introducing sales
tax on mobile and internet cards, airline tickets, vehicles, alcohol and cigarettes.
Revenue from the export of crude oil was calculated based on the average price of $56 per
barrel at an export rate of (3.300) Million BPD, including (250,000) BPD produced by KRG,
and (300,000) BPD Produced by Kirkuk. Total accrued revenues were reported to the
general treasury department at the Iraqi Ministry of Finance.
5.1 Distribution of extractive industry revenue
5.1.1 Insights from 2015 Budget of the Federal Government of Iraq
Iraq’s federal budget had increased about five times in size between years 2004 and
2015. No matter how much oil revenue is deposited in the treasury, budgets always had
deficits of around 20 percent, while actual spending always amounted to 70 percent or
more. This leaves less than 30 percent for investments and development.
Statement Amount (Million IQD) Amount (Million USD)
Oil Revenue 78,649,032 67,452
Non-Oil Revenue 15,399,332 13,206
Total Revenue 94,048,364 80,658
Ministry of Oil Current Expenditure 999.593 857,284
Current Expenditure 78,248,392 67,108
Ministry of Oil Investment Expenditure
14,000 12
Investment Expenditure 41,214,037 35,346
Total Ministry of Oil Expenses 14,999.593 12,864,145
Total Expenses 119,462,429 102,454
Gross Budget Deficit 25,414,065 21,795
(Table (113) – budget)
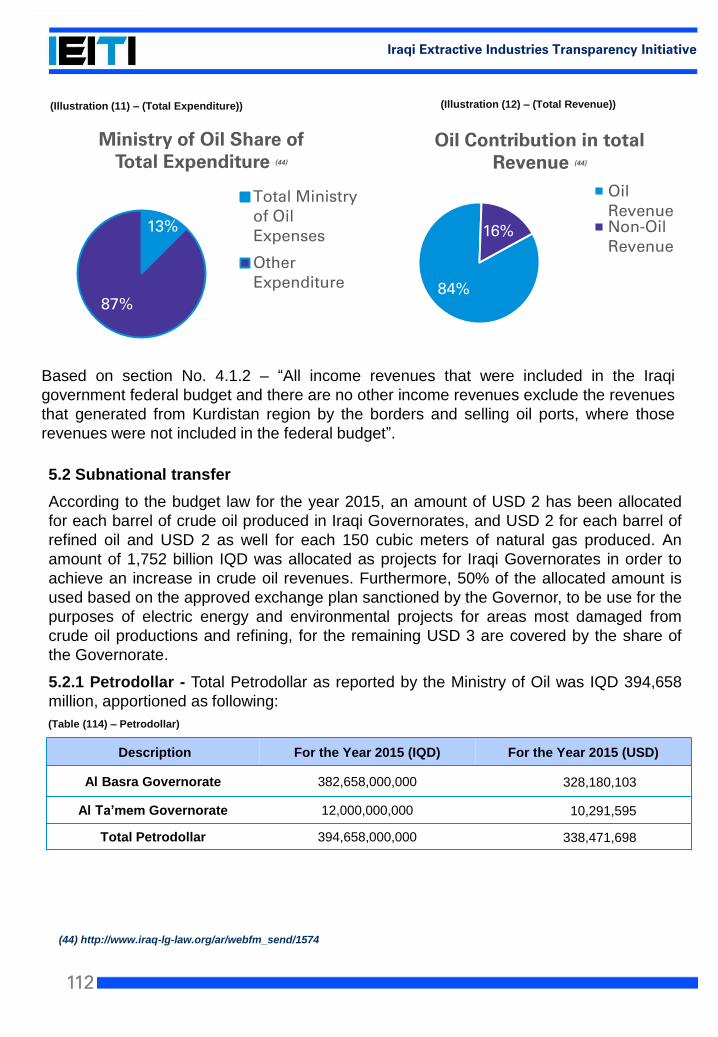
112
Iraqi Extractive Industries Transparency Initiative
13%
87%
Ministry of Oil Share of Total Expenditure (44)
Total Ministryof OilExpenses
OtherExpenditure 84%
16%
Oil Contribution in total Revenue (44)
OilRevenueNon-OilRevenue
(44) http://www.iraq-lg-law.org/ar/webfm_send/1574
5.2 Subnational transfer
According to the budget law for the year 2015, an amount of USD 2 has been allocated
for each barrel of crude oil produced in Iraqi Governorates, and USD 2 for each barrel of
refined oil and USD 2 as well for each 150 cubic meters of natural gas produced. An
amount of 1,752 billion IQD was allocated as projects for Iraqi Governorates in order to
achieve an increase in crude oil revenues. Furthermore, 50% of the allocated amount is
used based on the approved exchange plan sanctioned by the Governor, to be use for the
purposes of electric energy and environmental projects for areas most damaged from
crude oil productions and refining, for the remaining USD 3 are covered by the share of
the Governorate.
5.2.1 Petrodollar - Total Petrodollar as reported by the Ministry of Oil was IQD 394,658
million, apportioned as following:
Description For the Year 2015 (IQD) For the Year 2015 (USD)
Al Basra Governorate 382,658,000,000 328,180,103
Al Ta’mem Governorate 12,000,000,000 10,291,595
Total Petrodollar 394,658,000,000 338,471,698
(Illustration (12) – (Total Revenue))(Illustration (11) – (Total Expenditure))
(Table (114) – Petrodollar)
Based on section No. 4.1.2 – “All income revenues that were included in the Iraqi
government federal budget and there are no other income revenues exclude the revenues
that generated from Kurdistan region by the borders and selling oil ports, where those
revenues were not included in the federal budget”.
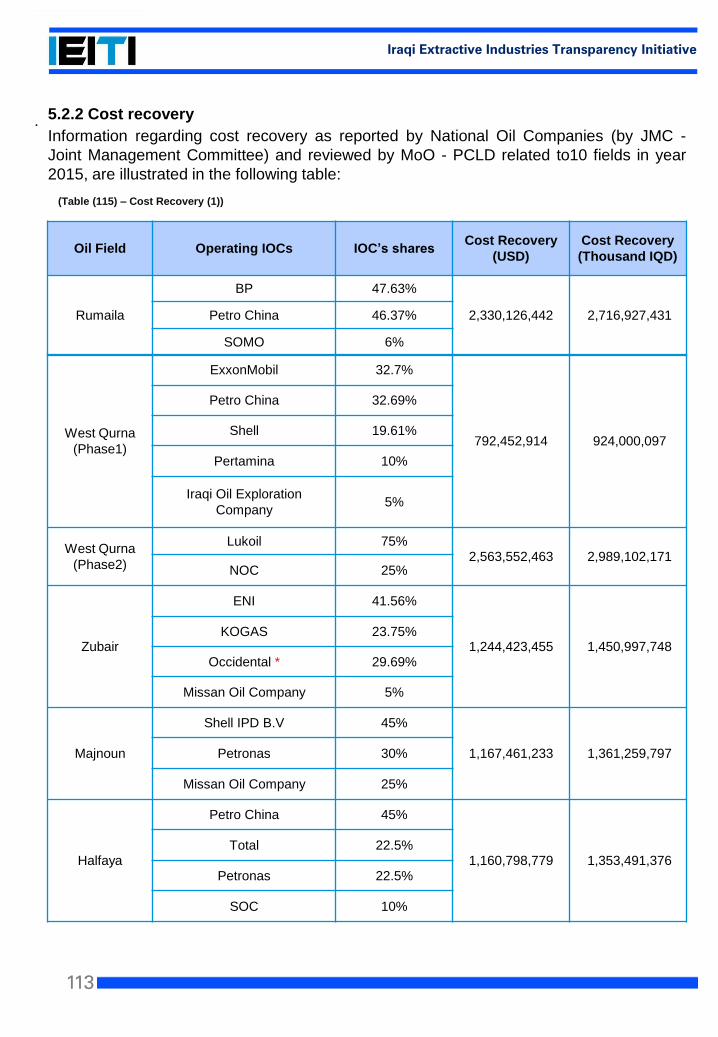
113
Iraqi Extractive Industries Transparency Initiative
. 5.2.2 Cost recovery
Information regarding cost recovery as reported by National Oil Companies (by JMC -
Joint Management Committee) and reviewed by MoO - PCLD related to10 fields in year
2015, are illustrated in the following table:
Oil Field Operating IOCs IOC’s sharesCost Recovery
(USD)
Cost Recovery
(Thousand IQD)
Rumaila
BP 47.63%
2,330,126,442 2,716,927,431Petro China 46.37%
SOMO 6%
West Qurna
(Phase1)
ExxonMobil 32.7%
792,452,914 924,000,097
Petro China 32.69%
Shell 19.61%
Pertamina 10%
Iraqi Oil Exploration
Company 5%
West Qurna
(Phase2)
Lukoil 75%2,563,552,463 2,989,102,171
NOC 25%
Zubair
ENI 41.56%
1,244,423,455 1,450,997,748KOGAS 23.75%
Occidental * 29.69%
Missan Oil Company 5%
Majnoun
Shell IPD B.V 45%
1,167,461,233 1,361,259,797Petronas 30%
Missan Oil Company 25%
Halfaya
Petro China 45%
1,160,798,779 1,353,491,376Total 22.5%
Petronas 22.5%
SOC 10%
(Table (115) – Cost Recovery (1))

114
Iraqi Extractive Industries Transparency Initiative
* Please note that Occidentail company has withdrawn from Al Zubair Field, as they didn’t get the authentication yet from Al
Zubair Field.
For the calculation of cost recovery, please refer to page No. 32 of the previous issued
report http://ieiti.org.iq/ArticleShow.aspx?ID=111
Oil Field Operating IOCs IOC’s sharesCost Recovery
(USD)
Cost Recovery
(Thousand IQD)
Missan
CNOOC Iraq 64.75%
462,128,899 538,842,296TPAO 11.25%
IDC 25%
Al Gharraf
Petronas 45%
721,934,198 841,775,274Japan Petroleum 30%
North Oil Company 25%
Ahadab
Al Waha Petroleum
CO. LTD75%
754,361,166 879,585,119Iraqi Oil Exploration
Company 25%
Badra
JSC Gazprom 30%
231,830,902 270,314,831
Korea Gas 22.5%
PETRONAS 15%
Türkiye (TPAO) 7.5%
SOMO 25%
5.2.3 Reconciliation of cost recovery between Ministry of Oil and International Oil
Companies
* The number was specified the cost recovery from BP company only as we didn’t receive the relevant information from Petro
China company yet.
Company Name Oil FieldCost Recovery /MoO
USD
Cost Recovery / Providers
USD
BPRumaila 2,330,126,442 1,279,023,445 *
PetroChina
(Table (116) – Cost Recovery (2))
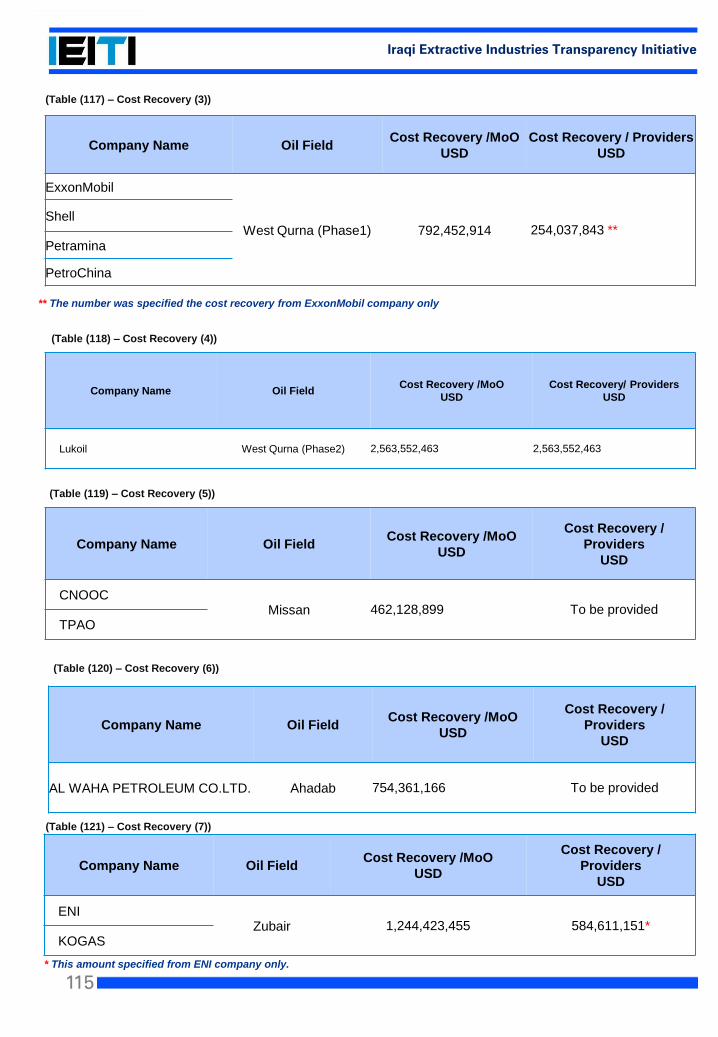
115
Iraqi Extractive Industries Transparency Initiative
** The number was specified the cost recovery from ExxonMobil company only
* This amount specified from ENI company only.
Company Name Oil FieldCost Recovery /MoO
USD
Cost Recovery /
Providers
USD
AL WAHA PETROLEUM CO.LTD. Ahadab 754,361,166 To be provided
Company Name Oil FieldCost Recovery /MoO
USD
Cost Recovery / Providers
USD
ExxonMobil
West Qurna (Phase1) 792,452,914 254,037,843 **Shell
Petramina
PetroChina
Company Name Oil FieldCost Recovery /MoO
USD
Cost Recovery/ Providers
USD
Lukoil West Qurna (Phase2) 2,563,552,463 2,563,552,463
Company Name Oil FieldCost Recovery /MoO
USD
Cost Recovery /
Providers
USD
CNOOCMissan 462,128,899 To be provided
TPAO
(Table (117) – Cost Recovery (3))
(Table (118) – Cost Recovery (4))
(Table (119) – Cost Recovery (5))
(Table (120) – Cost Recovery (6))
Company Name Oil FieldCost Recovery /MoO
USD
Cost Recovery /
Providers
USD
ENIZubair 1,244,423,455 584,611,151*
KOGAS
(Table (121) – Cost Recovery (7))
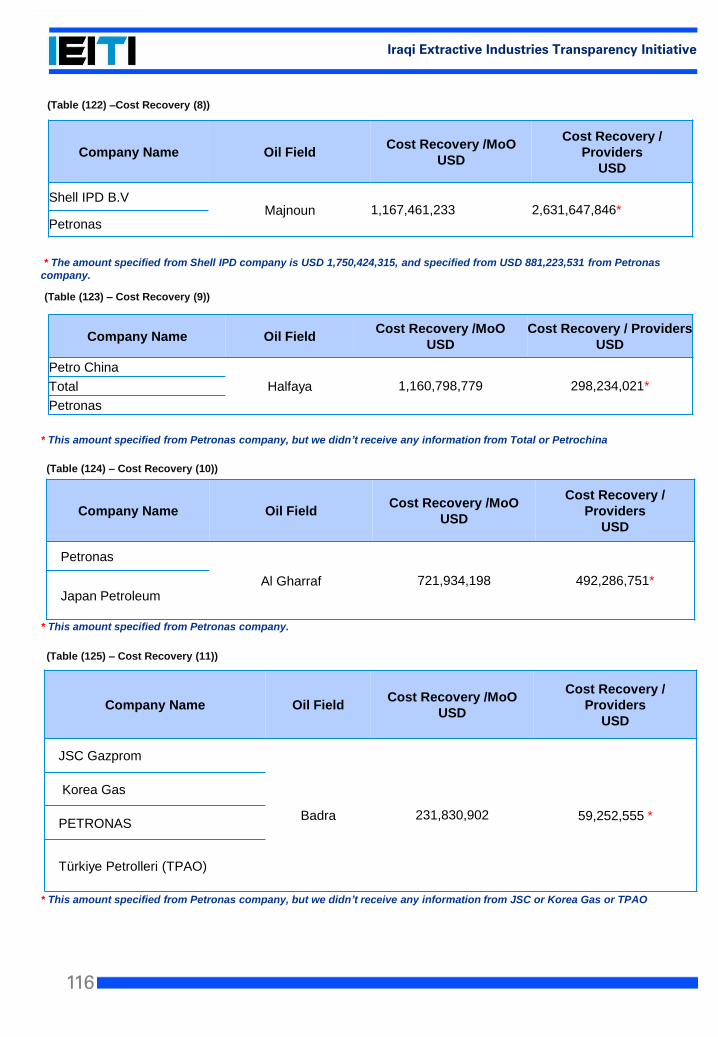
116
Iraqi Extractive Industries Transparency Initiative
* The amount specified from Shell IPD company is USD 1,750,424,315, and specified from USD 881,223,531 from Petronas
company.
* This amount specified from Petronas company, but we didn’t receive any information from Total or Petrochina
* This amount specified from Petronas company.
* This amount specified from Petronas company, but we didn’t receive any information from JSC or Korea Gas or TPAO
Company Name Oil FieldCost Recovery /MoO
USD
Cost Recovery /
Providers
USD
Petronas
Al Gharraf 721,934,198 492,286,751*Japan Petroleum
Company Name Oil FieldCost Recovery /MoO
USD
Cost Recovery /
Providers
USD
Shell IPD B.VMajnoun 1,167,461,233 2,631,647,846*
Petronas
Company Name Oil FieldCost Recovery /MoO
USD
Cost Recovery / Providers
USD
Petro China
Halfaya 1,160,798,779 298,234,021*Total
Petronas
(Table (123) – Cost Recovery (9))
(Table (122) –Cost Recovery (8))
(Table (124) – Cost Recovery (10))
Company Name Oil FieldCost Recovery /MoO
USD
Cost Recovery /
Providers
USD
JSC Gazprom
Badra 231,830,902 59,252,555 *
Korea Gas
PETRONAS
Türkiye Petrolleri (TPAO)
(Table (125) – Cost Recovery (11))
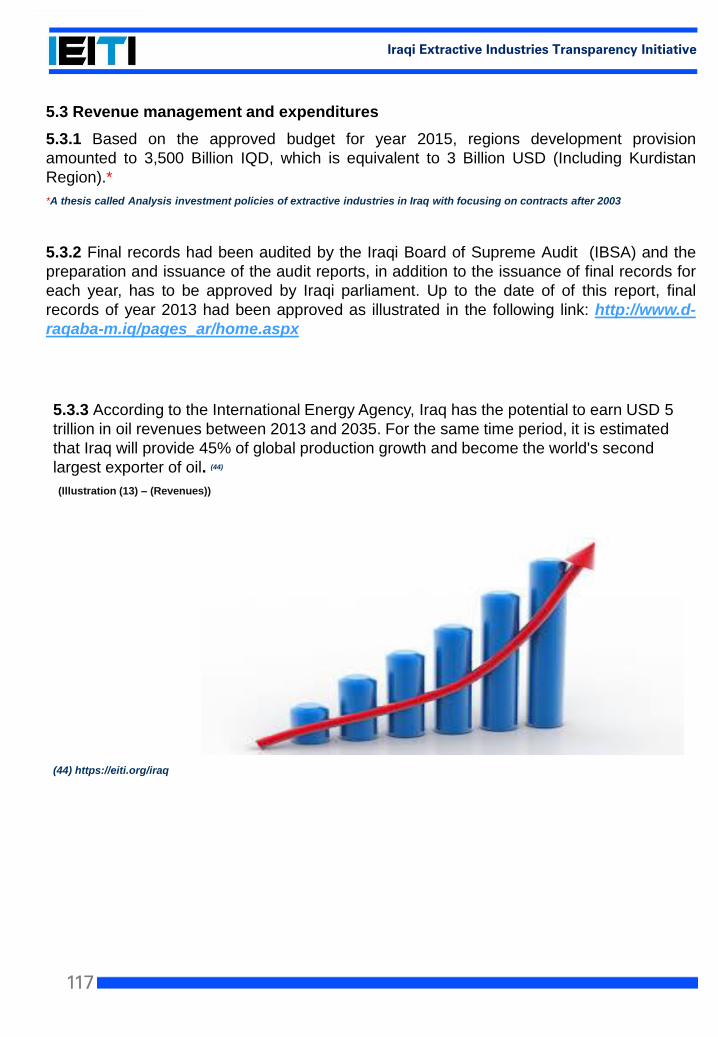
117
Iraqi Extractive Industries Transparency Initiative
5.3.3 According to the International Energy Agency, Iraq has the potential to earn USD 5
trillion in oil revenues between 2013 and 2035. For the same time period, it is estimated
that Iraq will provide 45% of global production growth and become the world's second
largest exporter of oil. (44)
(44) https://eiti.org/iraq
5.3 Revenue management and expenditures
5.3.1 Based on the approved budget for year 2015, regions development provision
amounted to 3,500 Billion IQD, which is equivalent to 3 Billion USD (Including Kurdistan
Region).*
*A thesis called Analysis investment policies of extractive industries in Iraq with focusing on contracts after 2003
5.3.2 Final records had been audited by the Iraqi Board of Supreme Audit (IBSA) and the
preparation and issuance of the audit reports, in addition to the issuance of final records for
each year, has to be approved by Iraqi parliament. Up to the date of of this report, final
records of year 2013 had been approved as illustrated in the following link: http://www.d-
raqaba-m.iq/pages_ar/home.aspx
(Illustration (13) – (Revenues))
118
Iraqi Extractive Industries Transparency Initiative
6Social & Economic Spending
EITI Requirement: 6- Social and economic spending.
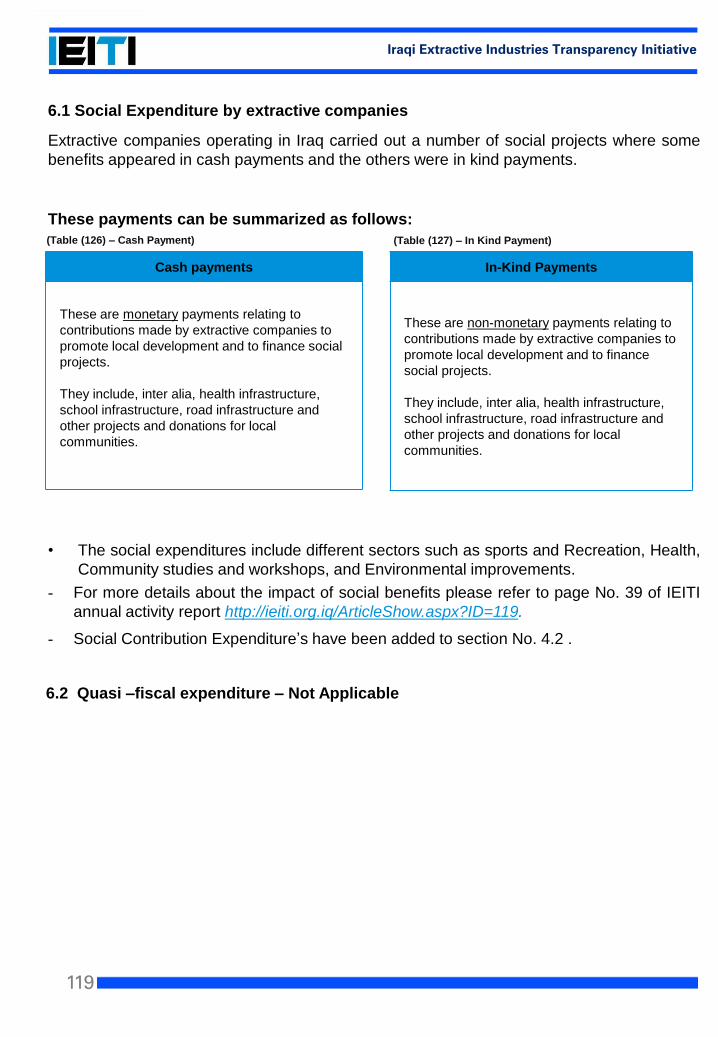
119
Iraqi Extractive Industries Transparency Initiative
6.1 Social Expenditure by extractive companies
Extractive companies operating in Iraq carried out a number of social projects where some
benefits appeared in cash payments and the others were in kind payments.
These payments can be summarized as follows:
• The social expenditures include different sectors such as sports and Recreation, Health,
Community studies and workshops, and Environmental improvements.
- For more details about the impact of social benefits please refer to page No. 39 of IEITI
annual activity report http://ieiti.org.iq/ArticleShow.aspx?ID=119.
- Social Contribution Expenditure’s have been added to section No. 4.2 .
Cash payments
These are monetary payments relating to
contributions made by extractive companies to
promote local development and to finance social
projects.
They include, inter alia, health infrastructure,
school infrastructure, road infrastructure and
other projects and donations for local
communities.
In-Kind Payments
These are non-monetary payments relating to
contributions made by extractive companies to
promote local development and to finance
social projects.
They include, inter alia, health infrastructure,
school infrastructure, road infrastructure and
other projects and donations for local
communities.
(Table (127) – In Kind Payment) (Table (126) – Cash Payment)
6.2 Quasi –fiscal expenditure – Not Applicable
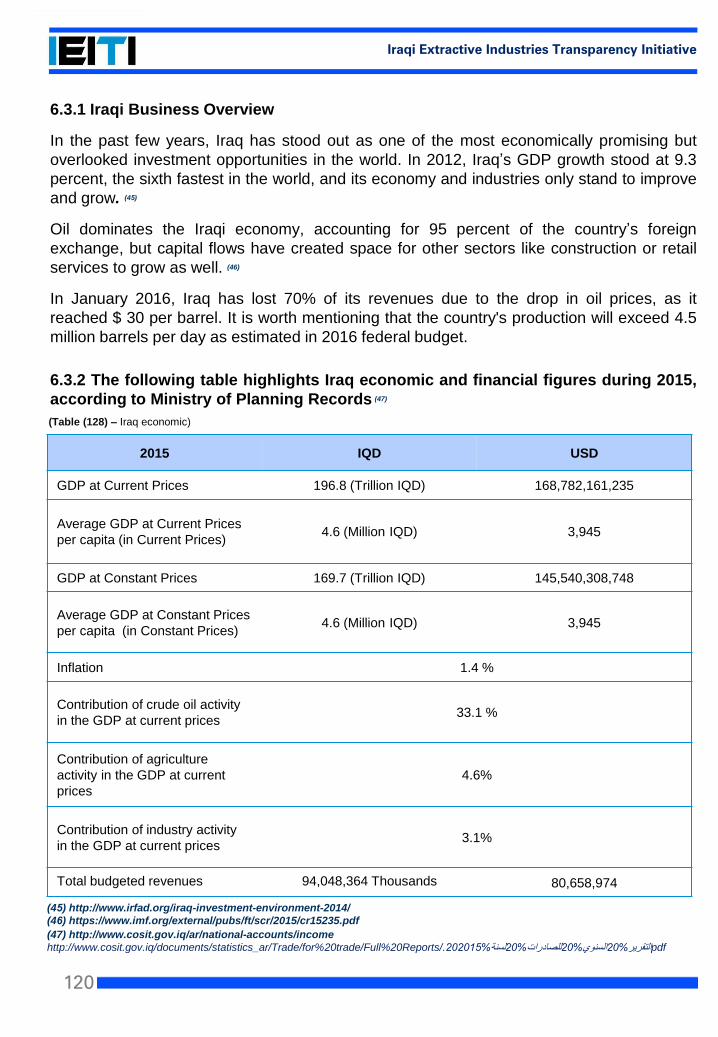
120
Iraqi Extractive Industries Transparency Initiative
6.3.1 Iraqi Business Overview
In the past few years, Iraq has stood out as one of the most economically promising but
overlooked investment opportunities in the world. In 2012, Iraq’s GDP growth stood at 9.3
percent, the sixth fastest in the world, and its economy and industries only stand to improve
and grow. (45)
Oil dominates the Iraqi economy, accounting for 95 percent of the country’s foreign
exchange, but capital flows have created space for other sectors like construction or retail
services to grow as well. (46)
In January 2016, Iraq has lost 70% of its revenues due to the drop in oil prices, as it
reached $ 30 per barrel. It is worth mentioning that the country's production will exceed 4.5
million barrels per day as estimated in 2016 federal budget.
6.3.2 The following table highlights Iraq economic and financial figures during 2015,
according to Ministry of Planning Records (47)
(45) http://www.irfad.org/iraq-investment-environment-2014/
(46) https://www.imf.org/external/pubs/ft/scr/2015/cr15235.pdf
2015 IQD USD
GDP at Current Prices 196.8 (Trillion IQD) 168,782,161,235
Average GDP at Current Prices
per capita (in Current Prices)4.6 (Million IQD) 3,945
GDP at Constant Prices 169.7 (Trillion IQD) 145,540,308,748
Average GDP at Constant Prices
per capita (in Constant Prices)4.6 (Million IQD) 3,945
Inflation 1.4 %
Contribution of crude oil activity
in the GDP at current prices33.1 %
Contribution of agriculture
activity in the GDP at current
prices
4.6%
Contribution of industry activity
in the GDP at current prices3.1%
Total budgeted revenues 94,048,364 Thousands 80,658,974
(47) http://www.cosit.gov.iq/ar/national-accounts/income
http://www.cosit.gov.iq/documents/statistics_ar/Trade/for%20trade/Full%20Reports/ .202015%لسنة20%للصادرات20%السنوي20%التقرير pdf
(Table (128) – Iraq economic)
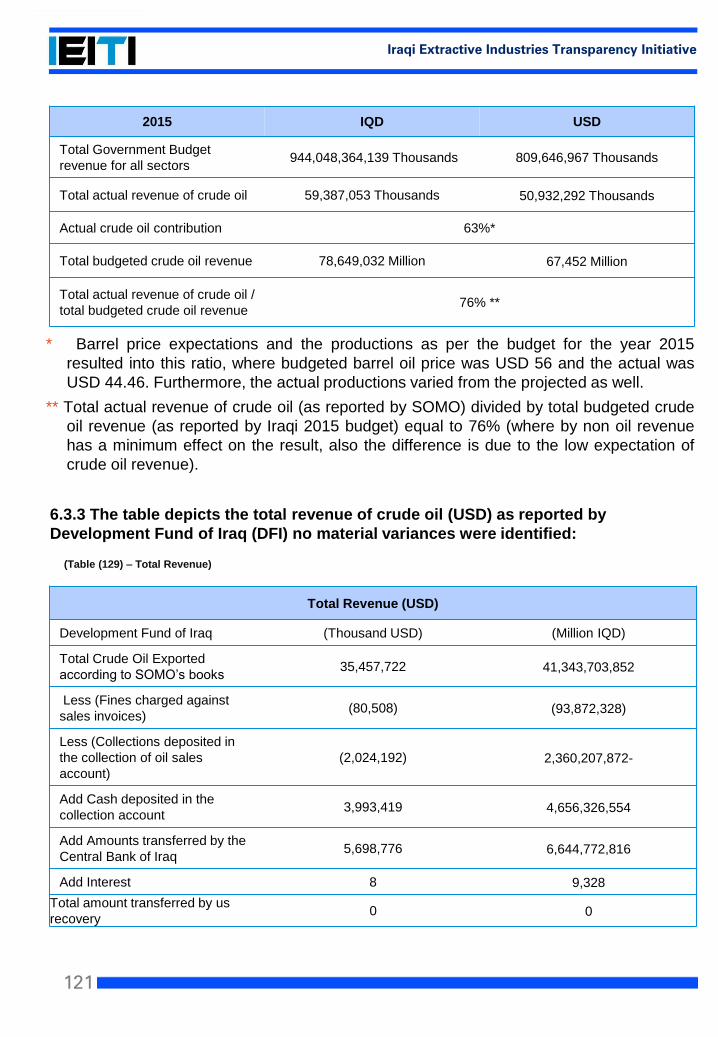
121
Iraqi Extractive Industries Transparency Initiative
2015 IQD USD
Total Government Budget
revenue for all sectors944,048,364,139 Thousands 809,646,967 Thousands
Total actual revenue of crude oil 59,387,053 Thousands 50,932,292 Thousands
Actual crude oil contribution 63%*
Total budgeted crude oil revenue 78,649,032 Million 67,452 Million
Total actual revenue of crude oil /
total budgeted crude oil revenue 76% **
* Barrel price expectations and the productions as per the budget for the year 2015
resulted into this ratio, where budgeted barrel oil price was USD 56 and the actual was
USD 44.46. Furthermore, the actual productions varied from the projected as well.
** Total actual revenue of crude oil (as reported by SOMO) divided by total budgeted crude
oil revenue (as reported by Iraqi 2015 budget) equal to 76% (where by non oil revenue
has a minimum effect on the result, also the difference is due to the low expectation of
crude oil revenue).
6.3.3 The table depicts the total revenue of crude oil (USD) as reported by
Development Fund of Iraq (DFI) no material variances were identified:
Total Revenue (USD)
Development Fund of Iraq (Thousand USD) (Million IQD)
Total Crude Oil Exported
according to SOMO’s books 35,457,722 41,343,703,852
Less (Fines charged against
sales invoices)(80,508) (93,872,328)
Less (Collections deposited in
the collection of oil sales
account)
(2,024,192) 2,360,207,872-
Add Cash deposited in the
collection account3,993,419 4,656,326,554
Add Amounts transferred by the
Central Bank of Iraq5,698,776 6,644,772,816
Add Interest 8 9,328
Total amount transferred by us
recovery0 0
(Table (129) – Total Revenue)
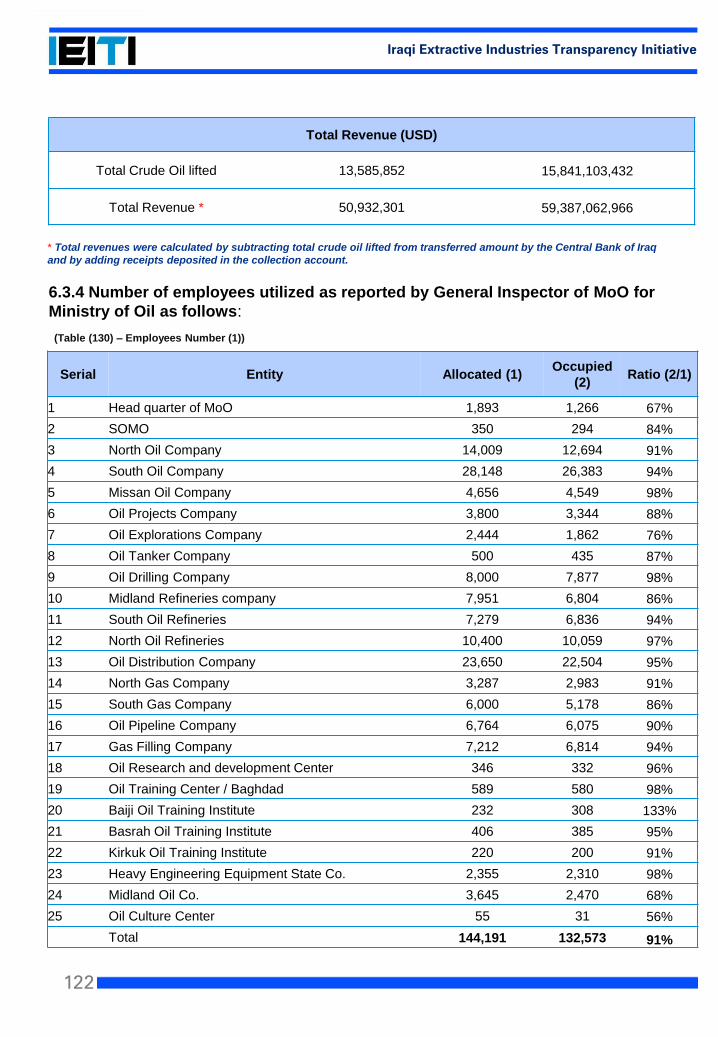
122
Iraqi Extractive Industries Transparency Initiative
Total Revenue (USD)
Total Crude Oil lifted 13,585,852 15,841,103,432
Total Revenue * 50,932,301 59,387,062,966
* Total revenues were calculated by subtracting total crude oil lifted from transferred amount by the Central Bank of Iraq
and by adding receipts deposited in the collection account.
6.3.4 Number of employees utilized as reported by General Inspector of MoO for
Ministry of Oil as follows:
Serial Entity Allocated (1)Occupied
(2) Ratio (2/1)
1 Head quarter of MoO 1,893 1,266 67%
2 SOMO 350 294 84%
3 North Oil Company 14,009 12,694 91%
4 South Oil Company 28,148 26,383 94%
5 Missan Oil Company 4,656 4,549 98%
6 Oil Projects Company 3,800 3,344 88%
7 Oil Explorations Company 2,444 1,862 76%
8 Oil Tanker Company 500 435 87%
9 Oil Drilling Company 8,000 7,877 98%
10 Midland Refineries company 7,951 6,804 86%
11 South Oil Refineries 7,279 6,836 94%
12 North Oil Refineries 10,400 10,059 97%
13 Oil Distribution Company 23,650 22,504 95%
14 North Gas Company 3,287 2,983 91%
15 South Gas Company 6,000 5,178 86%
16 Oil Pipeline Company 6,764 6,075 90%
17 Gas Filling Company 7,212 6,814 94%
18 Oil Research and development Center 346 332 96%
19 Oil Training Center / Baghdad 589 580 98%
20 Baiji Oil Training Institute 232 308 133%
21 Basrah Oil Training Institute 406 385 95%
22 Kirkuk Oil Training Institute 220 200 91%
23 Heavy Engineering Equipment State Co. 2,355 2,310 98%
24 Midland Oil Co. 3,645 2,470 68%
25 Oil Culture Center 55 31 56%
Total 144,191 132,573 91%
(Table (130) – Employees Number (1))
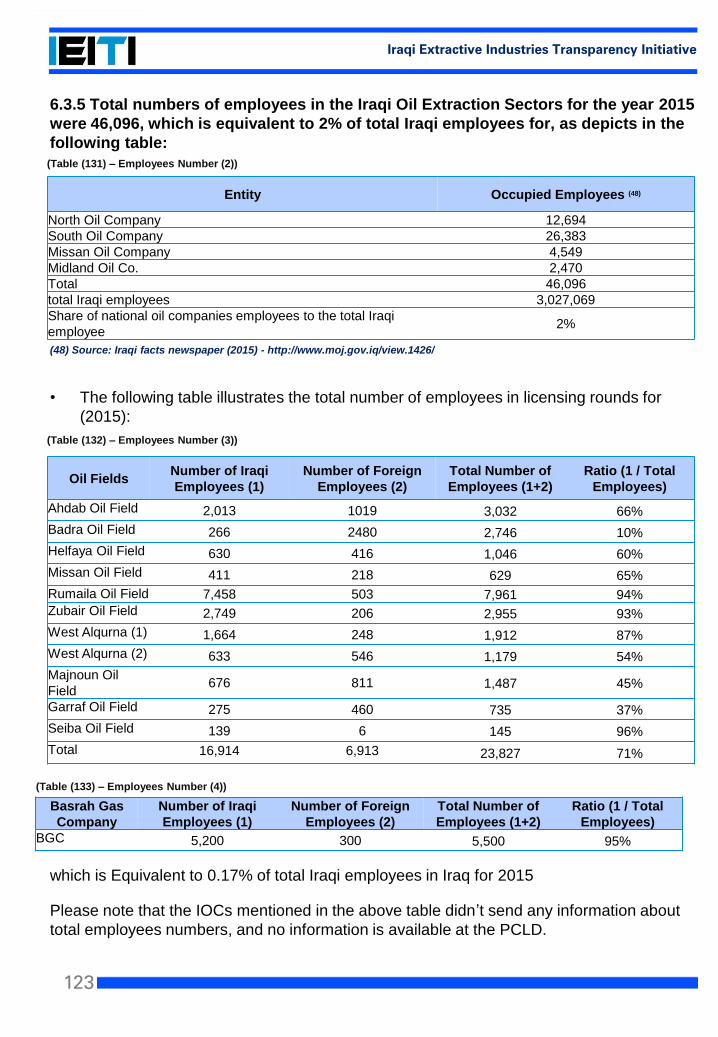
123
Iraqi Extractive Industries Transparency Initiative
Basrah Gas
Company
Number of Iraqi
Employees (1)
Number of Foreign
Employees (2)
Total Number of
Employees (1+2)
Ratio (1 / Total
Employees)
BGC 5,200 300 5,500 95%
6.3.5 Total numbers of employees in the Iraqi Oil Extraction Sectors for the year 2015
were 46,096, which is equivalent to 2% of total Iraqi employees for, as depicts in the
following table:
(48) Source: Iraqi facts newspaper (2015) - http://www.moj.gov.iq/view.1426/
• The following table illustrates the total number of employees in licensing rounds for
(2015):
which is Equivalent to 0.17% of total Iraqi employees in Iraq for 2015
Please note that the IOCs mentioned in the above table didn’t send any information about
total employees numbers, and no information is available at the PCLD.
Entity Occupied Employees (48)
North Oil Company 12,694
South Oil Company 26,383
Missan Oil Company 4,549
Midland Oil Co. 2,470
Total 46,096
total Iraqi employees 3,027,069
Share of national oil companies employees to the total Iraqi
employee2%
Oil FieldsNumber of Iraqi
Employees (1)
Number of Foreign
Employees (2)
Total Number of
Employees (1+2)
Ratio (1 / Total
Employees)
Ahdab Oil Field 2,013 1019 3,032 66%
Badra Oil Field 266 2480 2,746 10%
Helfaya Oil Field 630 416 1,046 60%
Missan Oil Field 411 218 629 65%
Rumaila Oil Field 7,458 503 7,961 94%
Zubair Oil Field 2,749 206 2,955 93%
West Alqurna (1) 1,664 248 1,912 87%
West Alqurna (2) 633 546 1,179 54%
Majnoun Oil
Field676 811 1,487 45%
Garraf Oil Field 275 460 735 37%
Seiba Oil Field 139 6 145 96%
Total 16,914 6,913 23,827 71%
(Table (131) – Employees Number (2))
(Table (132) – Employees Number (3))
(Table (133) – Employees Number (4))
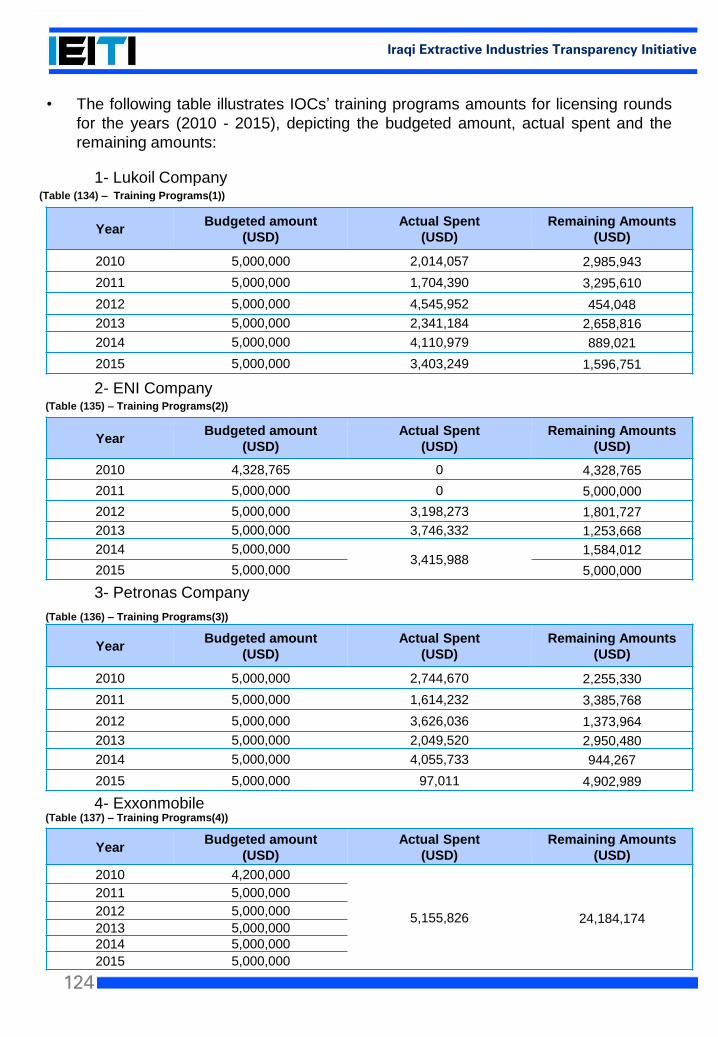
124
Iraqi Extractive Industries Transparency Initiative
• The following table illustrates IOCs’ training programs amounts for licensing rounds
for the years (2010 - 2015), depicting the budgeted amount, actual spent and the
remaining amounts:
1- Lukoil Company
2- ENI Company
3- Petronas Company
4- Exxonmobile
Year Budgeted amount
(USD)
Actual Spent
(USD)
Remaining Amounts
(USD)
2010 5,000,000 2,014,057 2,985,943
2011 5,000,000 1,704,390 3,295,610
2012 5,000,000 4,545,952 454,048
2013 5,000,000 2,341,184 2,658,816
2014 5,000,000 4,110,979 889,021
2015 5,000,000 3,403,249 1,596,751
Year Budgeted amount
(USD)
Actual Spent
(USD)
Remaining Amounts
(USD)
2010 4,328,765 0 4,328,765
2011 5,000,000 0 5,000,000
2012 5,000,000 3,198,273 1,801,727
2013 5,000,000 3,746,332 1,253,668
2014 5,000,0003,415,988
1,584,012
2015 5,000,000 5,000,000
Year Budgeted amount
(USD)
Actual Spent
(USD)
Remaining Amounts
(USD)
2010 5,000,000 2,744,670 2,255,330
2011 5,000,000 1,614,232 3,385,768
2012 5,000,000 3,626,036 1,373,964
2013 5,000,000 2,049,520 2,950,480
2014 5,000,000 4,055,733 944,267
2015 5,000,000 97,011 4,902,989
Year Budgeted amount
(USD)
Actual Spent
(USD)
Remaining Amounts
(USD)
2010 4,200,000
5,155,826 24,184,174
2011 5,000,000
2012 5,000,000
2013 5,000,000
2014 5,000,000
2015 5,000,000
(Table (134) – Training Programs(1))
(Table (135) – Training Programs(2))
(Table (136) – Training Programs(3))
(Table (137) – Training Programs(4))
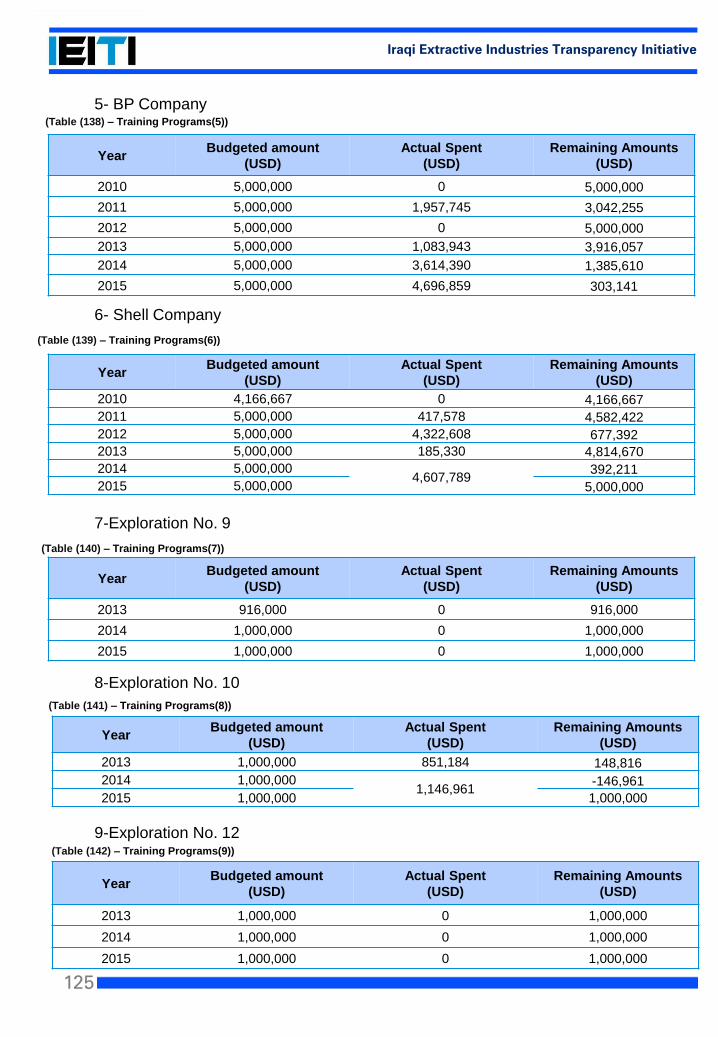
125
Iraqi Extractive Industries Transparency Initiative
5- BP Company
6- Shell Company
7-Exploration No. 9
8-Exploration No. 10
9-Exploration No. 12
Year Budgeted amount
(USD)
Actual Spent
(USD)
Remaining Amounts
(USD)
2010 5,000,000 0 5,000,000
2011 5,000,000 1,957,745 3,042,255
2012 5,000,000 0 5,000,000
2013 5,000,000 1,083,943 3,916,057
2014 5,000,000 3,614,390 1,385,610
2015 5,000,000 4,696,859 303,141
Year Budgeted amount
(USD)
Actual Spent
(USD)
Remaining Amounts
(USD)
2010 4,166,667 0 4,166,667
2011 5,000,000 417,578 4,582,422
2012 5,000,000 4,322,608 677,392
2013 5,000,000 185,330 4,814,670
2014 5,000,0004,607,789
392,211
2015 5,000,000 5,000,000
Year Budgeted amount
(USD)
Actual Spent
(USD)
Remaining Amounts
(USD)
2013 916,000 0 916,000
2014 1,000,000 0 1,000,000
2015 1,000,000 0 1,000,000
Year Budgeted amount
(USD)
Actual Spent
(USD)
Remaining Amounts
(USD)
2013 1,000,000 851,184 148,816
2014 1,000,0001,146,961
-146,961
2015 1,000,000 1,000,000
Year Budgeted amount
(USD)
Actual Spent
(USD)
Remaining Amounts
(USD)
2013 1,000,000 0 1,000,000
2014 1,000,000 0 1,000,000
2015 1,000,000 0 1,000,000
(Table (138) – Training Programs(5))
(Table (139) – Training Programs(6))
(Table (140) – Training Programs(7))
(Table (141) – Training Programs(8))
(Table (142) – Training Programs(9))
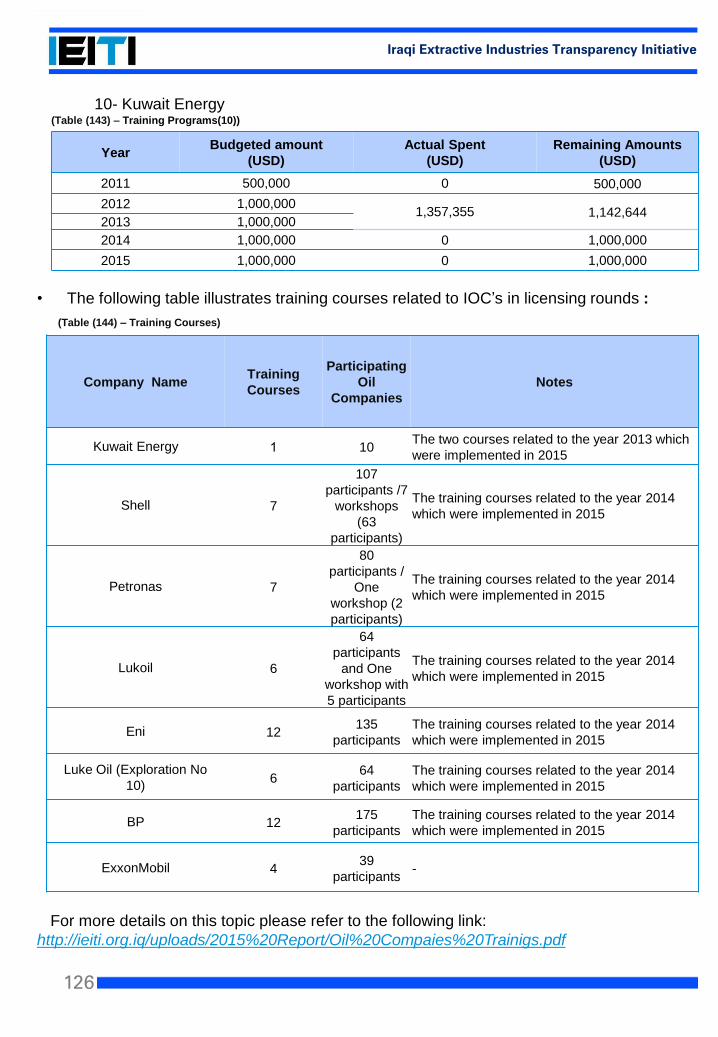
126
Iraqi Extractive Industries Transparency Initiative
• The following table illustrates training courses related to IOC’s in licensing rounds :
For more details on this topic please refer to the following link:
http://ieiti.org.iq/uploads/2015%20Report/Oil%20Compaies%20Trainigs.pdf
10- Kuwait Energy
Year Budgeted amount
(USD)
Actual Spent
(USD)
Remaining Amounts
(USD)
2011 500,000 0 500,000
2012 1,000,0001,357,355 1,142,644
2013 1,000,000
2014 1,000,000 0 1,000,000
2015 1,000,000 0 1,000,000
Company NameTraining
Courses
Participating
Oil
Companies
Notes
Kuwait Energy 1 10The two courses related to the year 2013 which
were implemented in 2015
Shell 7
107
participants /7
workshops
(63
participants)
The training courses related to the year 2014
which were implemented in 2015
Petronas 7
80
participants /
One
workshop (2
participants)
The training courses related to the year 2014
which were implemented in 2015
Lukoil 6
64
participants
and One
workshop with
5 participants
The training courses related to the year 2014
which were implemented in 2015
Eni 12135
participants
The training courses related to the year 2014
which were implemented in 2015
Luke Oil (Exploration No
10)6
64
participants
The training courses related to the year 2014
which were implemented in 2015
BP 12175
participants
The training courses related to the year 2014
which were implemented in 2015
ExxonMobil 439
participants-
(Table (143) – Training Programs(10))
(Table (144) – Training Courses)
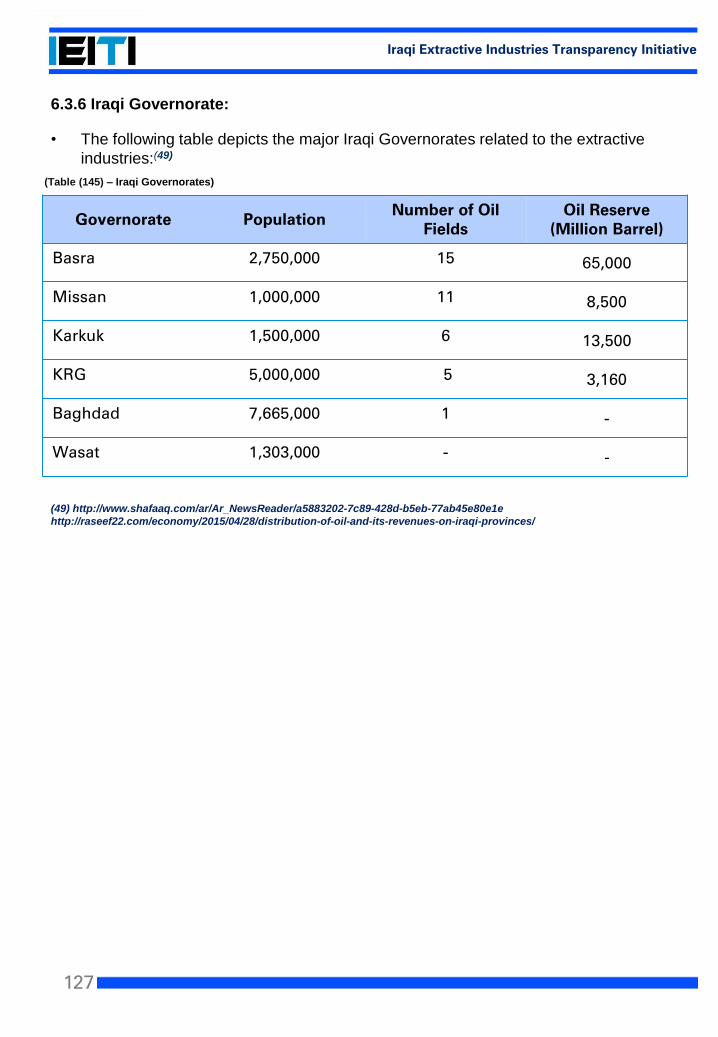
127
Iraqi Extractive Industries Transparency Initiative
6.3.6 Iraqi Governorate:
• The following table depicts the major Iraqi Governorates related to the extractive
industries:(49)
(49) http://www.shafaaq.com/ar/Ar_NewsReader/a5883202-7c89-428d-b5eb-77ab45e80e1e
http://raseef22.com/economy/2015/04/28/distribution-of-oil-and-its-revenues-on-iraqi-provinces/
Governorate Population Number of Oil
FieldsOil Reserve
(Million Barrel)
Basra 2,750,000 15 65,000
Missan 1,000,000 11 8,500
Karkuk 1,500,000 6 13,500
KRG 5,000,000 5 3,160
Baghdad 7,665,000 1 -
Wasat 1,303,000 - -
(Table (145) – Iraqi Governorates)
128
Iraqi Extractive Industries Transparency Initiative
7Impact
EITI Requirement:7- Outcomes and impact.
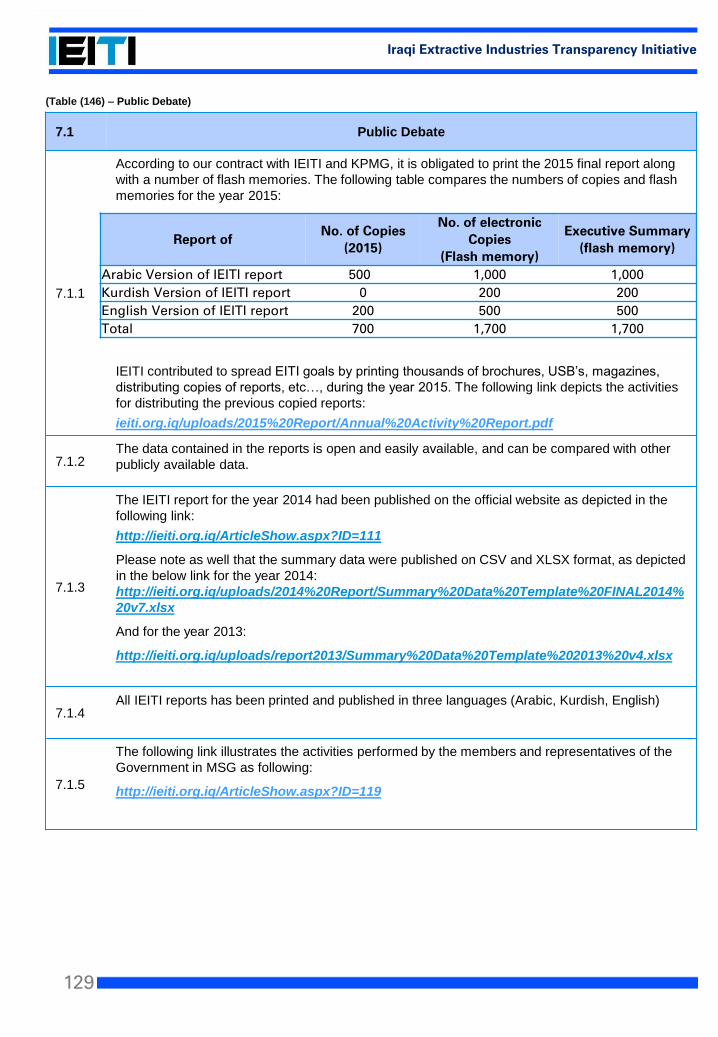
129
Iraqi Extractive Industries Transparency Initiative
7.1 Public Debate
7.1.1
According to our contract with IEITI and KPMG, it is obligated to print the 2015 final report along
with a number of flash memories. The following table compares the numbers of copies and flash
memories for the year 2015:
IEITI contributed to spread EITI goals by printing thousands of brochures, USB’s, magazines,
distributing copies of reports, etc…, during the year 2015. The following link depicts the activities
for distributing the previous copied reports:
ieiti.org.iq/uploads/2015%20Report/Annual%20Activity%20Report.pdf
7.1.2The data contained in the reports is open and easily available, and can be compared with other
publicly available data.
7.1.3
The IEITI report for the year 2014 had been published on the official website as depicted in the
following link:
http://ieiti.org.iq/ArticleShow.aspx?ID=111
Please note as well that the summary data were published on CSV and XLSX format, as depicted
in the below link for the year 2014:
http://ieiti.org.iq/uploads/2014%20Report/Summary%20Data%20Template%20FINAL2014%
20v7.xlsx
And for the year 2013:
http://ieiti.org.iq/uploads/report2013/Summary%20Data%20Template%202013%20v4.xlsx
7.1.4All IEITI reports has been printed and published in three languages (Arabic, Kurdish, English)
7.1.5
The following link illustrates the activities performed by the members and representatives of the
Government in MSG as following:
http://ieiti.org.iq/ArticleShow.aspx?ID=119
(Table (146) – Public Debate)
Report of No. of Copies
(2015)
No. of electronic
Copies
(Flash memory)
Executive Summary
(flash memory)
Arabic Version of IEITI report 500 1,000 1,000
Kurdish Version of IEITI report 0 200 200
English Version of IEITI report 200 500 500
Total 700 1,700 1,700
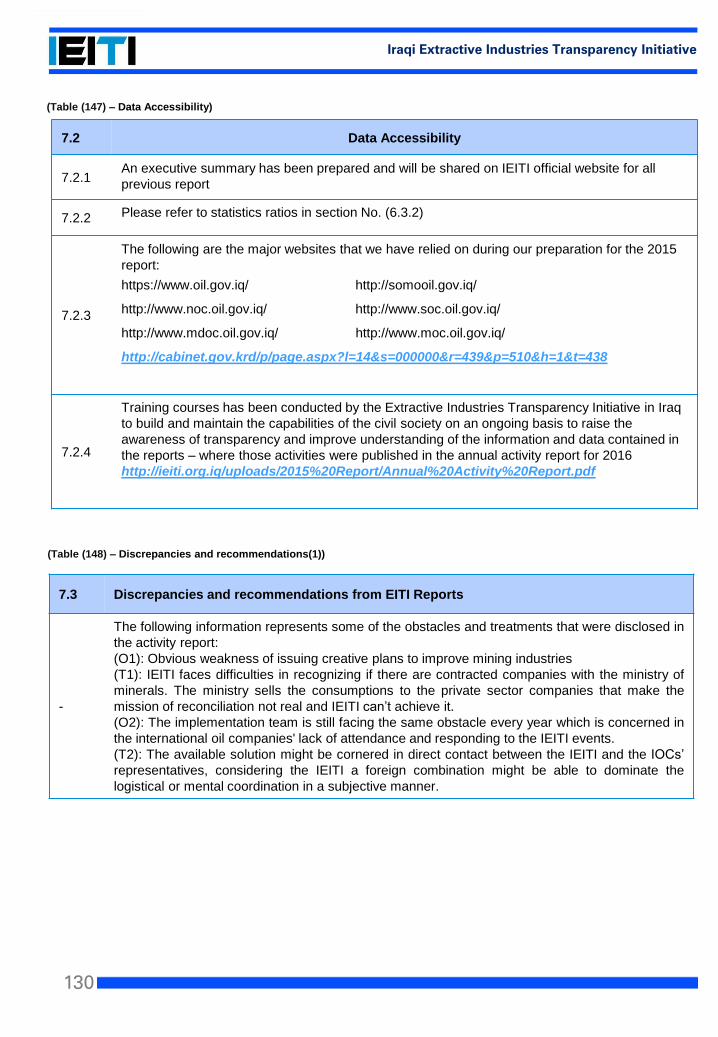
130
Iraqi Extractive Industries Transparency Initiative
7.3 Discrepancies and recommendations from EITI Reports
-
The following information represents some of the obstacles and treatments that were disclosed in
the activity report:
(O1): Obvious weakness of issuing creative plans to improve mining industries
(T1): IEITI faces difficulties in recognizing if there are contracted companies with the ministry of
minerals. The ministry sells the consumptions to the private sector companies that make the
mission of reconciliation not real and IEITI can’t achieve it.
(O2): The implementation team is still facing the same obstacle every year which is concerned in
the international oil companies' lack of attendance and responding to the IEITI events.
(T2): The available solution might be cornered in direct contact between the IEITI and the IOCs’
representatives, considering the IEITI a foreign combination might be able to dominate the
logistical or mental coordination in a subjective manner.
7.2 Data Accessibility
7.2.1An executive summary has been prepared and will be shared on IEITI official website for all
previous report
7.2.2 Please refer to statistics ratios in section No. (6.3.2)
7.2.3
The following are the major websites that we have relied on during our preparation for the 2015
report:
https://www.oil.gov.iq/ http://somooil.gov.iq/
http://www.noc.oil.gov.iq/ http://www.soc.oil.gov.iq/
http://www.mdoc.oil.gov.iq/ http://www.moc.oil.gov.iq/
http://cabinet.gov.krd/p/page.aspx?l=14&s=000000&r=439&p=510&h=1&t=438
7.2.4
Training courses has been conducted by the Extractive Industries Transparency Initiative in Iraq
to build and maintain the capabilities of the civil society on an ongoing basis to raise the
awareness of transparency and improve understanding of the information and data contained in
the reports – where those activities were published in the annual activity report for 2016
http://ieiti.org.iq/uploads/2015%20Report/Annual%20Activity%20Report.pdf
(Table (148) – Discrepancies and recommendations(1))
(Table (147) – Data Accessibility)
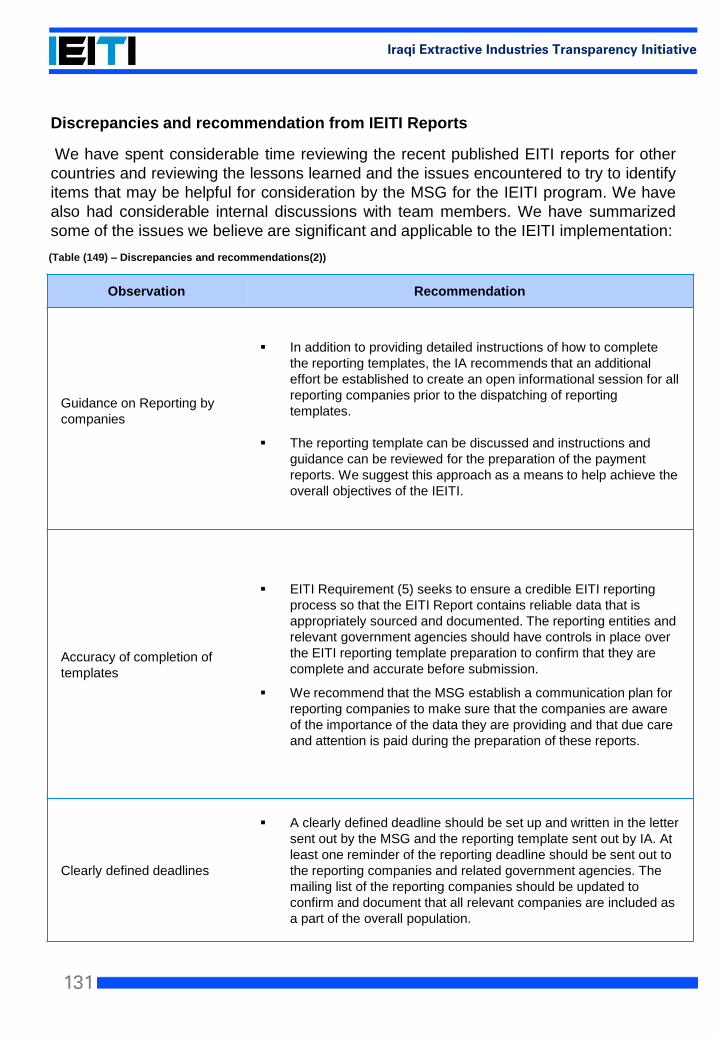
131
Iraqi Extractive Industries Transparency Initiative
Discrepancies and recommendation from IEITI Reports
We have spent considerable time reviewing the recent published EITI reports for other
countries and reviewing the lessons learned and the issues encountered to try to identify
items that may be helpful for consideration by the MSG for the IEITI program. We have
also had considerable internal discussions with team members. We have summarized
some of the issues we believe are significant and applicable to the IEITI implementation:
Observation Recommendation
Guidance on Reporting by
companies
In addition to providing detailed instructions of how to complete
the reporting templates, the IA recommends that an additional
effort be established to create an open informational session for all
reporting companies prior to the dispatching of reporting
templates.
The reporting template can be discussed and instructions and
guidance can be reviewed for the preparation of the payment
reports. We suggest this approach as a means to help achieve the
overall objectives of the IEITI.
Accuracy of completion of
templates
EITI Requirement (5) seeks to ensure a credible EITI reporting
process so that the EITI Report contains reliable data that is
appropriately sourced and documented. The reporting entities and
relevant government agencies should have controls in place over
the EITI reporting template preparation to confirm that they are
complete and accurate before submission.
We recommend that the MSG establish a communication plan for
reporting companies to make sure that the companies are aware
of the importance of the data they are providing and that due care
and attention is paid during the preparation of these reports.
Clearly defined deadlines
A clearly defined deadline should be set up and written in the letter
sent out by the MSG and the reporting template sent out by IA. At
least one reminder of the reporting deadline should be sent out to
the reporting companies and related government agencies. The
mailing list of the reporting companies should be updated to
confirm and document that all relevant companies are included as
a part of the overall population.
(Table (149) – Discrepancies and recommendations(2))

132
Iraqi Extractive Industries Transparency Initiative
Observation Recommendation
Voluntary disclosure of
supporting information
As a guideline to the reporting, the companies should be
encouraged to attach detailed specifications on each reporting
item specifying amounts and payment dates, to simplify the
reconciliation work.
Detailed specifications increase the efficiency of the reconciliation
process, reduce the need for follow up with companies and can
help to improve the quality of the reported data.
For a more reliable EITI reporting, the instructions sent out with
the reporting templates to extractive companies will indicate that
when compiling their templates, extractive entities and related
government agencies are encouraged to provide the IA with
schedules showing a breakdown of all amounts included.
Increase awareness of the differences between Unified Iraqi
Accounting System and the International Financial Reporting
Standards in order to ensure consistency among all companies
and institutions. Such awareness can be done through holding
some training session on a continuous basis.

133
Iraqi Extractive Industries Transparency Initiative
The civil society may not be
aware of social contributions
in extractive industries
Reporting of the social contribution of the
extractive industries whether cash or in-kind
contributions and awareness should also be
exercised by the reporting entities as well.
IEITI Challenges Recommendation
Outdated information
regarding the oil reserves
IEITI should recommend the government to
assess the reserves in areas with significant
extractive interests. More clear information on
proven and probable geological reserves could
ensure more efficient production and fiscal
planning.
• Disclosure of beneficial ownership.
• Establish public beneficial ownership
registers.
Inconsistency in reporting;
local standards Vs. IFRS or
Cash Vs. Accrual basis
Request from all reporting entities to prepare
their financial statements in accordance with
IFRS
Identify who owns
companies and who
benefits: The identity of the
real owners – the ‘beneficial
owners’ – of the extractive
companies s often unknown
Review the outcomes and impact of EITI implementation.
(Illustration (14) – Challenges)
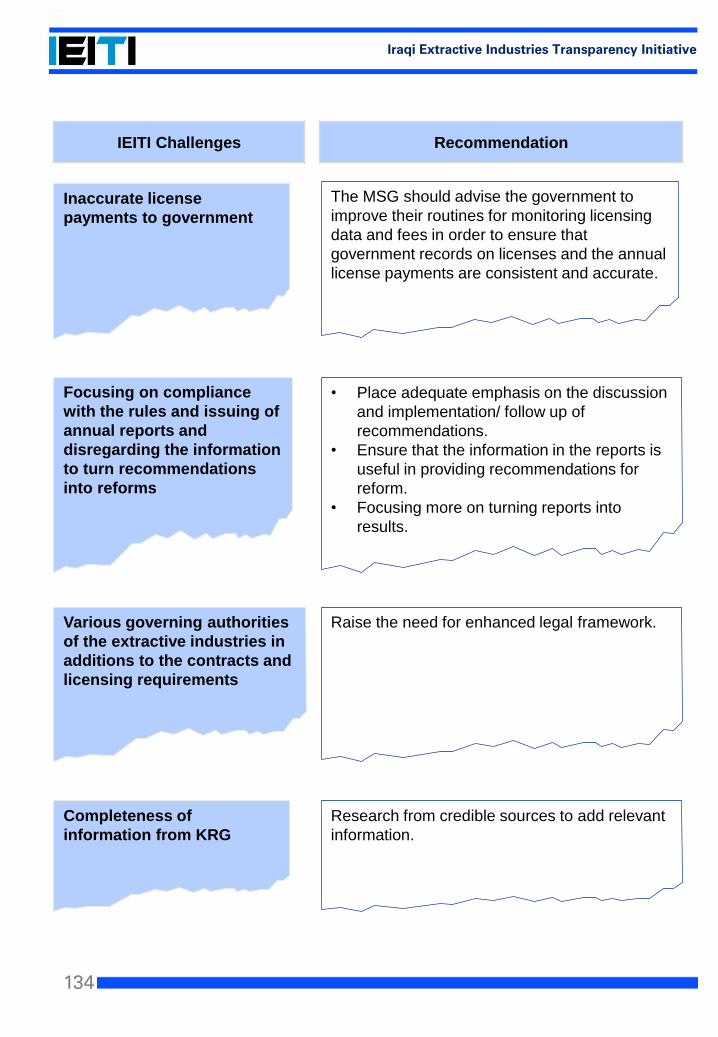
134
Iraqi Extractive Industries Transparency Initiative
Inaccurate license
payments to government
The MSG should advise the government to
improve their routines for monitoring licensing
data and fees in order to ensure that
government records on licenses and the annual
license payments are consistent and accurate.
Focusing on compliance
with the rules and issuing of
annual reports and
disregarding the information
to turn recommendations
into reforms
• Place adequate emphasis on the discussion
and implementation/ follow up of
recommendations.
• Ensure that the information in the reports is
useful in providing recommendations for
reform.
• Focusing more on turning reports into
results.
Various governing authorities
of the extractive industries in
additions to the contracts and
licensing requirements
Raise the need for enhanced legal framework.
Completeness of
information from KRG
Research from credible sources to add relevant
information.
IEITI Challenges Recommendation
135
Iraqi Extractive Industries Transparency Initiative
One of the main activities for IEITI during 2015 was researching and reviewing the impact
implementation of the natural resource in Iraq, as summarized in the activity report for 2015:
http://ieiti.org.iq/ArticleShow.aspx?ID=119
In accordance with issued instructions by the Ministry of Oil in February 2014, all IOCs are
obligated to disburse an amount of five million dollars annually for social contribution
projects in the areas of productions that are included within the petroleum cost items.
To add another value for 2015 report, we have added environmental impact studies
prepared by international companies to study the environmental impact of the production
areas as follows:
Health, Safety and Environment
There are a number of laws that will affect how petroleum operations are conducted. For
example:
Labor Law No. 71 of year1987, sets certain restrictions and special provisions for
employers in relation to their labor force working in hazardous or arduous work
environments (which include oil and gas exploration and extraction).
Protection of the Environment Law No. 27 of year 2009, contains broad restrictions
and requirements applicable to oil and gas operations.
Preservation of Hydrocarbon Resources Law No. 84 of year 1985, broadly prohibits
any wastage of oil and gas resources.
Protection of Rivers and Public Waters from Pollution Regulations No. 25 of year 1967,
which broadly prohibits discharging any pollutants into fresh waters.
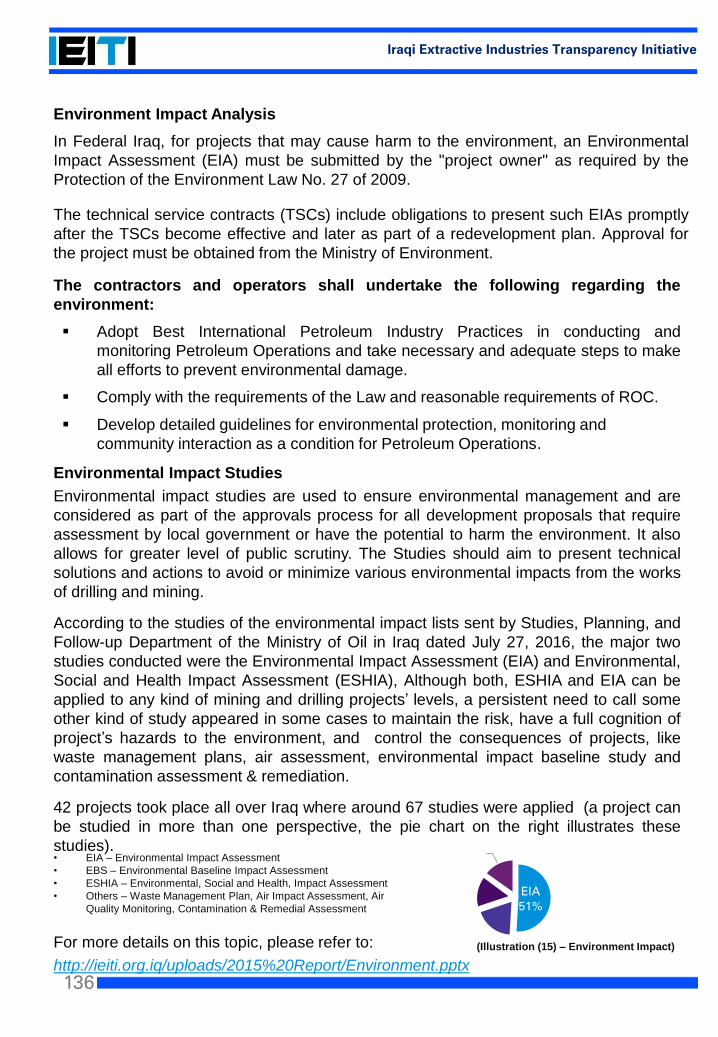
136
Iraqi Extractive Industries Transparency Initiative
Environment Impact Analysis
In Federal Iraq, for projects that may cause harm to the environment, an Environmental
Impact Assessment (EIA) must be submitted by the "project owner" as required by the
Protection of the Environment Law No. 27 of 2009.
The technical service contracts (TSCs) include obligations to present such EIAs promptly
after the TSCs become effective and later as part of a redevelopment plan. Approval for
the project must be obtained from the Ministry of Environment.
The contractors and operators shall undertake the following regarding the
environment:
Adopt Best International Petroleum Industry Practices in conducting and
monitoring Petroleum Operations and take necessary and adequate steps to make
all efforts to prevent environmental damage.
Comply with the requirements of the Law and reasonable requirements of ROC.
Develop detailed guidelines for environmental protection, monitoring and
community interaction as a condition for Petroleum Operations.
Environmental Impact Studies
Environmental impact studies are used to ensure environmental management and are
considered as part of the approvals process for all development proposals that require
assessment by local government or have the potential to harm the environment. It also
allows for greater level of public scrutiny. The Studies should aim to present technical
solutions and actions to avoid or minimize various environmental impacts from the works
of drilling and mining.
According to the studies of the environmental impact lists sent by Studies, Planning, and
Follow-up Department of the Ministry of Oil in Iraq dated July 27, 2016, the major two
studies conducted were the Environmental Impact Assessment (EIA) and Environmental,
Social and Health Impact Assessment (ESHIA), Although both, ESHIA and EIA can be
applied to any kind of mining and drilling projects’ levels, a persistent need to call some
other kind of study appeared in some cases to maintain the risk, have a full cognition of
project’s hazards to the environment, and control the consequences of projects, like
waste management plans, air assessment, environmental impact baseline study and
contamination assessment & remediation.
42 projects took place all over Iraq where around 67 studies were applied (a project can
be studied in more than one perspective, the pie chart on the right illustrates these
studies).
For more details on this topic, please refer to:
http://ieiti.org.iq/uploads/2015%20Report/Environment.pptx
• EIA – Environmental Impact Assessment
• EBS – Environmental Baseline Impact Assessment
• ESHIA – Environmental, Social and Health, Impact Assessment
• Others – Waste Management Plan, Air Impact Assessment, Air
Quality Monitoring, Contamination & Remedial Assessment
EIA51%
ESHIA19%
EBS15%
others15%
(Illustration (15) – Environment Impact)
137
Iraqi Extractive Industries Transparency Initiative
Kurdistan Region
138
Iraqi Extractive Industries Transparency Initiative
Introduction regarding KRG data
We would like to highlight the challenges that have been faced by our team during the
information collection from Kurdistan. This led to our inability to obtain, reconcile, and match
information related to KRG for the transparency report of 2015.
On the12th of July 2016, we received a letter from the Transparency Initiative for Extractive
Industries in Iraq to facilitate our mission in KRG. Accordingly, our team met the Ministry of
Natural Resources’ representatives in Kurdistan on 25th July 2016 and on 8th August 2016,
who apologized for not providing the requested information, explaining that the Ministry of
Natural Resources can’t provide any party with such information, and any information
requested shall be done directly through the Ministry of Oil. We received an official email
from the Ministry of Oil stating that no information related to Kurdistan Region is available.
Thus, the following slides related to KRG oil and gas industry were extracted from published
data.
Economy of Kurdistan Regional Government (KRG)
The Kurdistan region's economy is dominated by the oil industry (with potential reserves of
around 45 billion barrels), agriculture and tourism. Due to relative peace in the region it has
a more developed economy in comparison to other parts of Iraq.
In 2006, the first new oil well was drilled in the Kurdistan region by the Norwegian energy
company DNO. Initial indications were that the oil field contains at least 100 million barrels
(16,000,000 Cubic Meters) of oil and will be pumping 5,000 bbl /d (790 Cubic Meter/d) by
early 2007.(50)
The stability of the Kurdistan region has allowed it to achieve a higher level of development
than other regions in Iraq. In 2004, the per capita income was 25% higher than in the rest of
Iraq.
Low global oil prices are weakening Iraqi Kurdistan's finances. Although the cash-strapped
Kurdish government has managed to export oil independently of Baghdad since June 2015,
it will increasingly rely on foreign support the longer oil prices remain depressed, regardless
of how much control it has over its oil export revenue.
(50) http://minerals.usgs.gov/minerals/pubs/commodity/phosphate_rock/mcs-2015-phosp.pdf
139
Iraqi Extractive Industries Transparency Initiative
Constitutional and legal framework for the oil sector in KRG
In 2007, the Kurdistan Regional Government (KRG) elected to fill the void created by the
absence of a Federal Oil and Gas Law by enacting its own oil and gas law, the Kurdistan
Oil and Gas Law No. 28 of 2007.
The Kurdistan Region and some of the provinces of Iraq interpret the Constitution to mean
that they should be able to control the extraction of oil and gas within their borders. With
respect to the Kurdistan Region of Iraq, the Ministry of Natural Resources (MNR) of the
Kurdistan Regional Government (KRG) has taken de facto control of oil and gas within its
borders and has been regulating activities in the sector since 2008.
The MNR has entered into over forty production sharing contracts (PSCs) with oil
companies. The Kurdistan Environment Protection Commission is responsible for
overseeing and regulating environmental matters in Kurdistan.
Key features of the leases, licenses or concessions which are issued under the
regulatory regime
A production sharing contract model utilized by the Kurdistan Regional Government. In
this contractual model, the contractor undertakes petroleum operations at its sole risk and
expense.
If petroleum operations are successful, the contractor is entitled for a share of production
to recover the costs of petroleum operations (cost oil) and a share proportion of remaining
production (profit oil), which is shared with Government.
The Government has a carried interest in a number of contracts that it may assign to third
parties.
140
Iraqi Extractive Industries Transparency Initiative
Kurdistan Transparency Initiative Background
Transparency has been the cornerstone of the Kurdistan Region’s investment laws and
policies. The Extractive Industry Transparency Initiative was incorporated as an article in
the regional oil and gas law in 2007, and helps ensure transparency and proper budgetary
management of oil revenues. The full version of the Kurdistan Oil and Gas Law has been
available to the public since 2007, and the Ministry of Natural Resources has ensured that
all production-sharing contracts, including any amendments are available for all to see
online.
Tax structure for Contracts
Per the terms of the PSC in Kurdistan, the contractor is subject to income tax, but the tax
is paid on its behalf by the KRG from its share of Profit Oil.
Income tax is currently 15% of taxable income. The KRG indemnifies the contractor
against other taxes. The contractor's production is subject to a 10% royalty rate payable
to in cash or in kind as the KRG
elects (Articles 37 and 41, Kurdistan Oil and Gas Law and the terms of the PSCs).(51)
Environment Impact Analysis (EIA)
In Kurdistan, the PSCs require the submission of EIAs to the Kurdistan Regional
Government.
(51) http://us.practicallaw.com/9-581-2725
141
Iraqi Extractive Industries Transparency Initiative
KRG Budget
According to the General Federal Budget of the Republic of Iraq for the Fiscal year 2015,
published in the official gazette, no. 4352; KRG budgeted expenditures were as follows:
The federal budget also highlighted the following items regarding KRG:
Article 1 (B): “Revenues from exporting crude oil are calculated based on an average price
of $56 per barrel and an average export of 3,300,000 bpd including 250,000 bpd from
quantities of the Kurdistan Region produced crude oil and 300,000 bpd from quantities of
Kirkuk Governorate produced crude oil and registering all fulfilled revenues, as a final,
actual revenue, in the account of the general treasury.”
Article 10 (1st): “The Kurdistan Region’s share is specified to be 17% of gross expenses
explained in (sovereign expenses) is paid by the Federal Finance Ministry.”
Erbil and Baghdad reach agreement on Kirkuk oil exports
Baghdad and Erbil agreed on November 2014 to sign a deal that provides assistant from
Baghdad to KRG. In exchange for Erbil's export of 550,000 bpd (KRG will facilitate the
export of 300,000 oil (bpd) from Kirkuk’s oil fields, in addition to 250,000 from KRG-
controlled oil wells) of crude oil through Turkey's Ceyhan port, where Baghdad's oil
marketing company would sell to foreign customers, Baghdad would give 17 percent of its
budget to the KRG (roughly), the amount needed to cover Erbil's monthly bill of $1.1 billion.(52)
Budgeted current Expenditures
(Million Iraqi Dinar)
Budgeted
Investment Expenditures
(Million Iraqi Dinar)
Budgeted
Total Expenditure (Million Iraqi
Dinar)
9,296,559.702 5,520,915.288 14,817,474.99
(52) www.stratfor.com/analysis/why-iraqi-kurdistan-struggling-pay-its-bills
(Table (150) – KRG))
142
Iraqi Extractive Industries Transparency Initiative
Erbil and Baghdad reach agreement on Kirkuk oil exports – Continued
However, the deal was terminated in June 2015. Exports through KRG pipeline maintained
at around 260,000 BPD – throughout the first quarter of 2015, while planned upgrades to
the export pipeline network took place. In accordance, Federal Government gradually
scaled-down KRG’s share (17%) of the total Federal Budget to less than (40%) of the total
agreed upon share in June 2015 despite the completion of infrastructure upgrades in April,
and the instant increase of KRG pipeline capacity by more than 50%, reaching an average
of around 563,000 BPD in cooperation with NOC, which contributed to an average of
150,000 BPD.
Therefore, KRG declared the start of independent direct oil sales, and signed pre-payment
deals with some international oil trading companies.
Moreover, though KRG faced political and economic crisis – series of theft and sabotage
attacks on the main export pipeline, direct exports and sales growth were maintained to
reach a monthly average of around 596,000 BPD in October 2015. (53)
Some 43 percent of Kurdish oil exports from Ceyhan went directly to European customers,
primarily in Italy. Another 17 percent transferred to ships off the coast of Cyprus, likely
bound for other destinations on the Continent. Although Baghdad threatened KRG of a legal
suit.
Erbil currently owes these firms (buyers) quite a bit of money in back payments. Its debt to
DNO stands at approximately $992 million; to Genel Energy $378 million; and to Gulf
Keystone Petroleum $283 million.(54)
Despite its many other financial burdens, KRG made paying off oil company debts one of its
top priorities. Toward the end of 2015, upstream activity began to decline, causing total
production growth to taper off. DNO, Genel Energy and Gulf Keystone Petroleum have all
announced that they will readjust their 2016 budgets if Erbil cannot make its payments
consistently — a move that would likely lead to reduce output and drive the KRG's revenue
down even further.
(53) Ministry of Natural Resources. MNR Annual Report 2015. WWW.MNR.KRG.ORG
(54) www.stratfor.com/analysis/why-iraqi-kurdistan-struggling-pay-its-bills
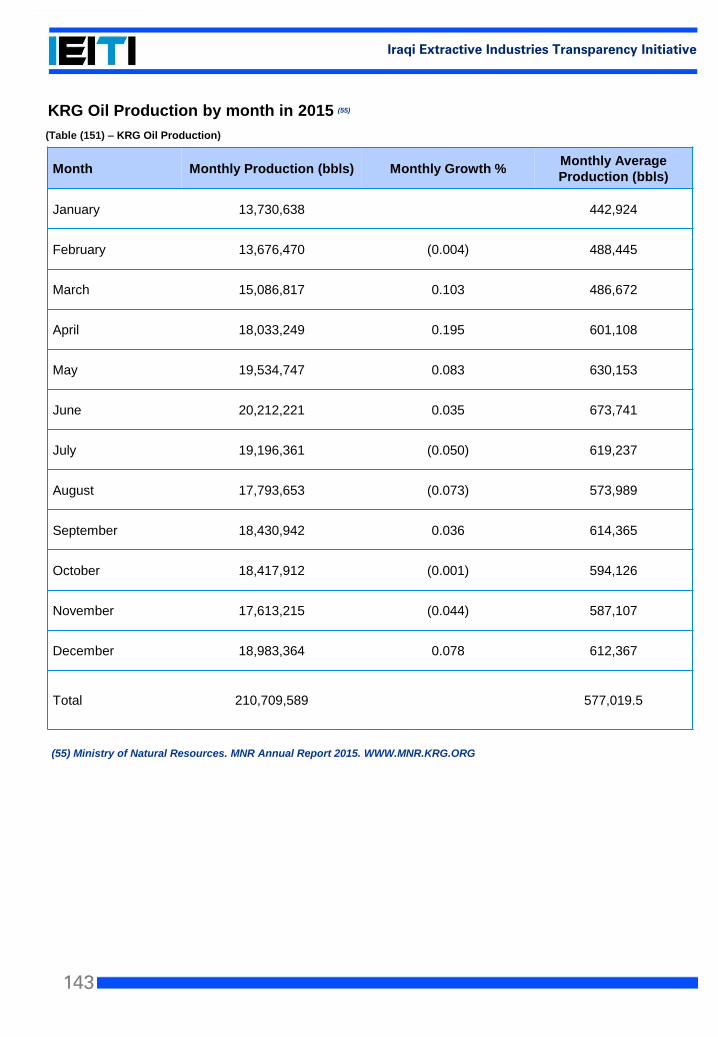
143
Iraqi Extractive Industries Transparency Initiative
KRG Oil Production by month in 2015 (55)
Month Monthly Production (bbls) Monthly Growth %Monthly Average
Production (bbls)
January 13,730,638 442,924
February 13,676,470 (0.004) 488,445
March 15,086,817 0.103 486,672
April 18,033,249 0.195 601,108
May 19,534,747 0.083 630,153
June 20,212,221 0.035 673,741
July 19,196,361 (0.050) 619,237
August 17,793,653 (0.073) 573,989
September 18,430,942 0.036 614,365
October 18,417,912 (0.001) 594,126
November 17,613,215 (0.044) 587,107
December 18,983,364 0.078 612,367
Total 210,709,589 577,019.5
(55) Ministry of Natural Resources. MNR Annual Report 2015. WWW.MNR.KRG.ORG
(Table (151) – KRG Oil Production)
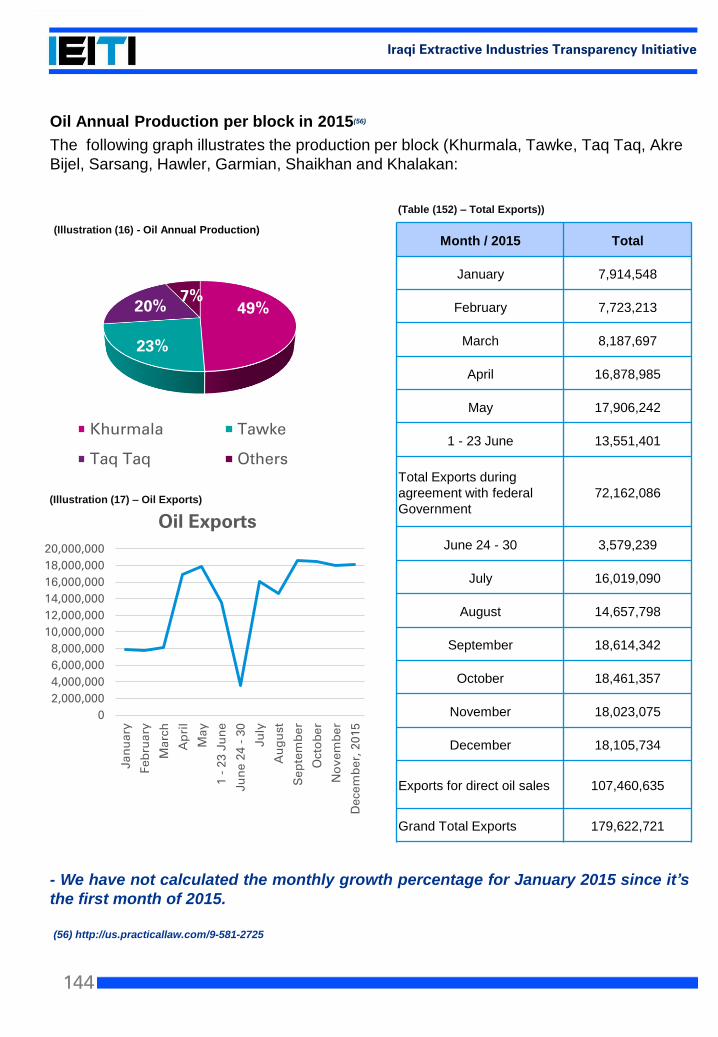
144
Iraqi Extractive Industries Transparency Initiative
Oil Annual Production per block in 2015(56)
The following graph illustrates the production per block (Khurmala, Tawke, Taq Taq, Akre
Bijel, Sarsang, Hawler, Garmian, Shaikhan and Khalakan:
- We have not calculated the monthly growth percentage for January 2015 since it’s
the first month of 2015.
49%
23%
20%
7%
Khurmala Tawke
Taq Taq Others
Month / 2015 Total
January 7,914,548
February 7,723,213
March 8,187,697
April 16,878,985
May 17,906,242
1 - 23 June 13,551,401
Total Exports during
agreement with federal
Government
72,162,086
June 24 - 30 3,579,239
July 16,019,090
August 14,657,798
September 18,614,342
October 18,461,357
November 18,023,075
December 18,105,734
Exports for direct oil sales 107,460,635
Grand Total Exports 179,622,721
0
2,000,000
4,000,000
6,000,000
8,000,000
10,000,000
12,000,000
14,000,000
16,000,000
18,000,000
20,000,000
Ja
nu
ary
Feb
rua
ry
Marc
h
Ap
ril
May
1 -
23
Ju
ne
Ju
ne
24
- 3
0
Ju
ly
Au
gu
st
Se
pte
mb
er
Octo
be
r
No
ve
mb
er
Dece
mb
er,
20
15
Oil Exports
(56) http://us.practicallaw.com/9-581-2725
(Illustration (17) – Oil Exports)
(Illustration (16) - Oil Annual Production)
(Table (152) – Total Exports))
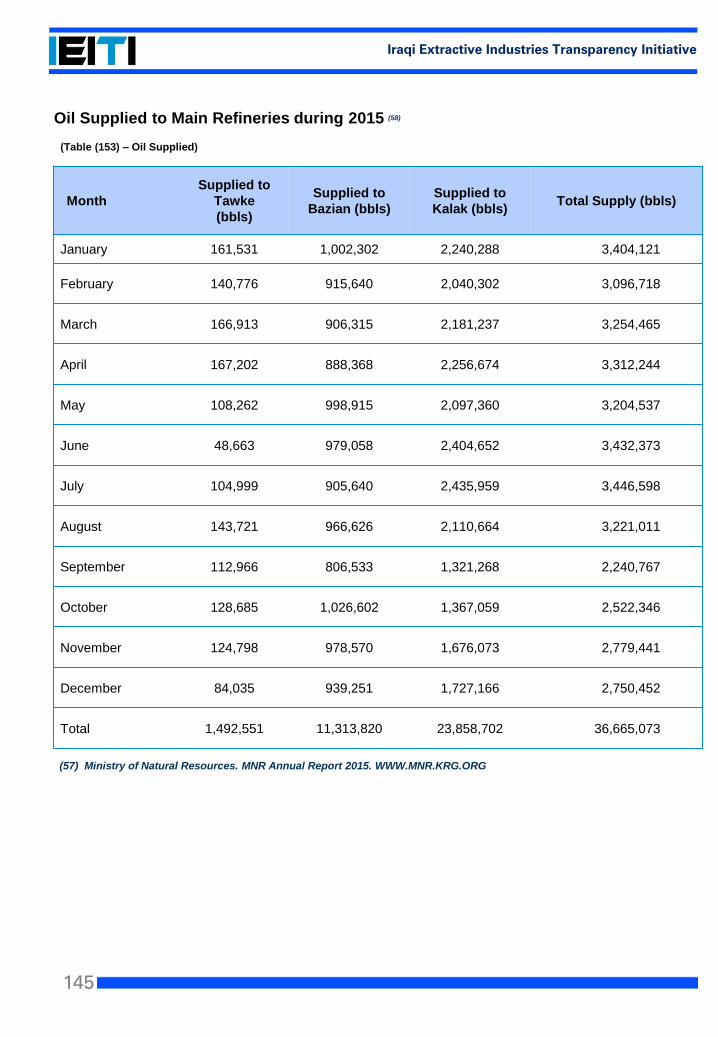
145
Iraqi Extractive Industries Transparency Initiative
Oil Supplied to Main Refineries during 2015 (58)
Month
Supplied to
Tawke
(bbls)
Supplied to
Bazian (bbls)
Supplied to
Kalak (bbls)Total Supply (bbls)
January 161,531 1,002,302 2,240,288 3,404,121
February 140,776 915,640 2,040,302 3,096,718
March 166,913 906,315 2,181,237 3,254,465
April 167,202 888,368 2,256,674 3,312,244
May 108,262 998,915 2,097,360 3,204,537
June 48,663 979,058 2,404,652 3,432,373
July 104,999 905,640 2,435,959 3,446,598
August 143,721 966,626 2,110,664 3,221,011
September 112,966 806,533 1,321,268 2,240,767
October 128,685 1,026,602 1,367,059 2,522,346
November 124,798 978,570 1,676,073 2,779,441
December 84,035 939,251 1,727,166 2,750,452
Total 1,492,551 11,313,820 23,858,702 36,665,073
(57) Ministry of Natural Resources. MNR Annual Report 2015. WWW.MNR.KRG.ORG
(Table (153) – Oil Supplied)
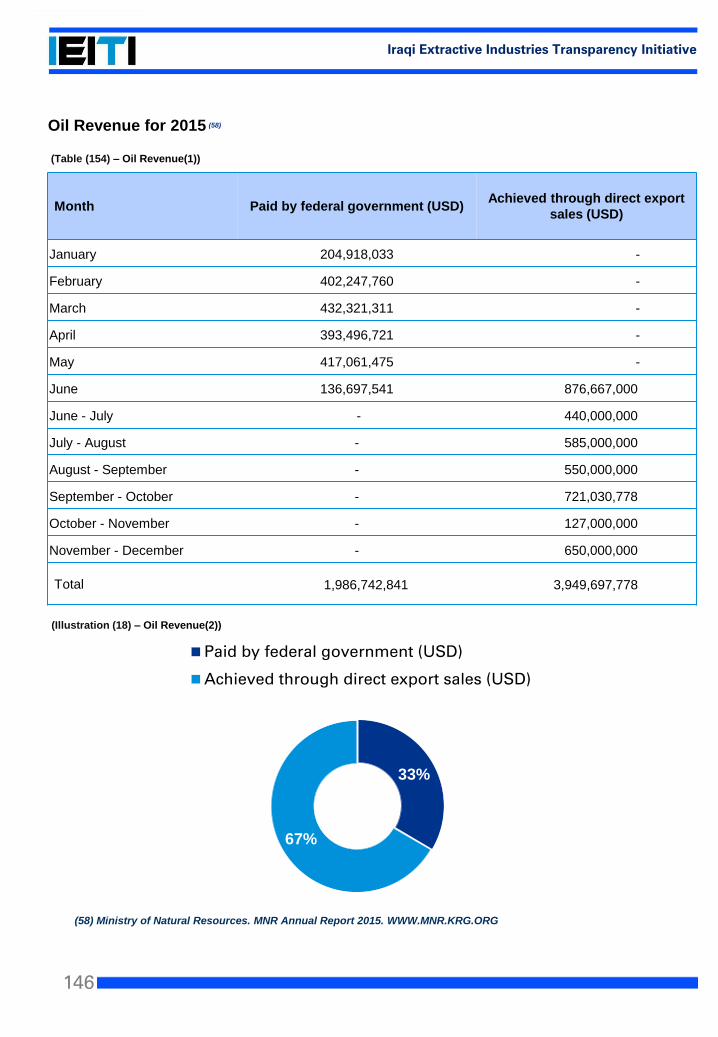
146
Iraqi Extractive Industries Transparency Initiative
Oil Revenue for 2015 (58)
Month Paid by federal government (USD)Achieved through direct export
sales (USD)
January 204,918,033 -
February 402,247,760 -
March 432,321,311 -
April 393,496,721 -
May 417,061,475 -
June 136,697,541 876,667,000
June - July - 440,000,000
July - August - 585,000,000
August - September - 550,000,000
September - October - 721,030,778
October - November - 127,000,000
November - December - 650,000,000
Total 1,986,742,841 3,949,697,778
33%
67%
Paid by federal government (USD)
Achieved through direct export sales (USD)
(58) Ministry of Natural Resources. MNR Annual Report 2015. WWW.MNR.KRG.ORG
(Table (154) – Oil Revenue(1))
(Illustration (18) – Oil Revenue(2))
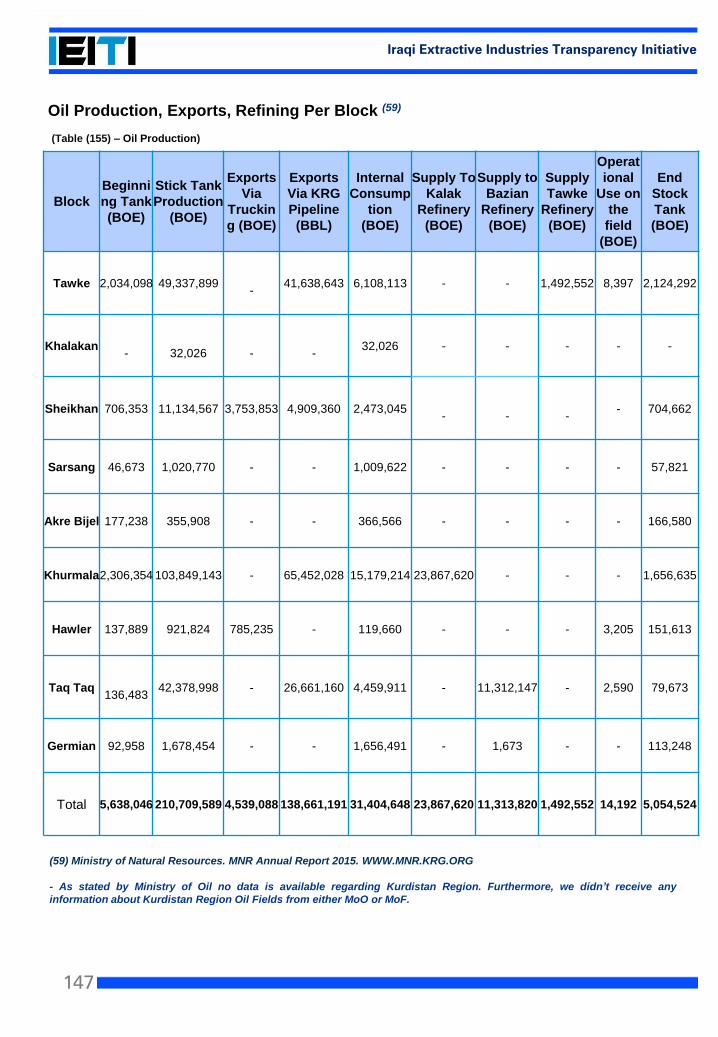
147
Iraqi Extractive Industries Transparency Initiative
Oil Production, Exports, Refining Per Block (59)
Block
Beginni
ng Tank
(BOE)
Stick Tank
Production
(BOE)
Exports
Via
Truckin
g (BOE)
Exports
Via KRG
Pipeline
(BBL)
Internal
Consump
tion
(BOE)
Supply To
Kalak
Refinery
(BOE)
Supply to
Bazian
Refinery
(BOE)
Supply
Tawke
Refinery
(BOE)
Operat
ional
Use on
the
field
(BOE)
End
Stock
Tank
(BOE)
Tawke 2,034,098 49,337,899 -
41,638,643 6,108,113 - - 1,492,552 8,397 2,124,292
Khalakan- 32,026 - -
32,026 - - - - -
Sheikhan 706,353 11,134,567 3,753,853 4,909,360 2,473,045 - - -
- 704,662
Sarsang 46,673 1,020,770 - - 1,009,622 - - - - 57,821
Akre Bijel 177,238 355,908 - - 366,566 - - - - 166,580
Khurmala2,306,354 103,849,143 - 65,452,028 15,179,214 23,867,620 - - - 1,656,635
Hawler 137,889 921,824 785,235 - 119,660 - - - 3,205 151,613
Taq Taq136,483
42,378,998 - 26,661,160 4,459,911 - 11,312,147 - 2,590 79,673
Germian 92,958 1,678,454 - - 1,656,491 - 1,673 - - 113,248
Total 5,638,046 210,709,589 4,539,088 138,661,191 31,404,648 23,867,620 11,313,820 1,492,552 14,192 5,054,524
(59) Ministry of Natural Resources. MNR Annual Report 2015. WWW.MNR.KRG.ORG
- As stated by Ministry of Oil no data is available regarding Kurdistan Region. Furthermore, we didn’t receive any
information about Kurdistan Region Oil Fields from either MoO or MoF.
(Table (155) – Oil Production)
148
Iraqi Extractive Industries Transparency Initiative
Annexes
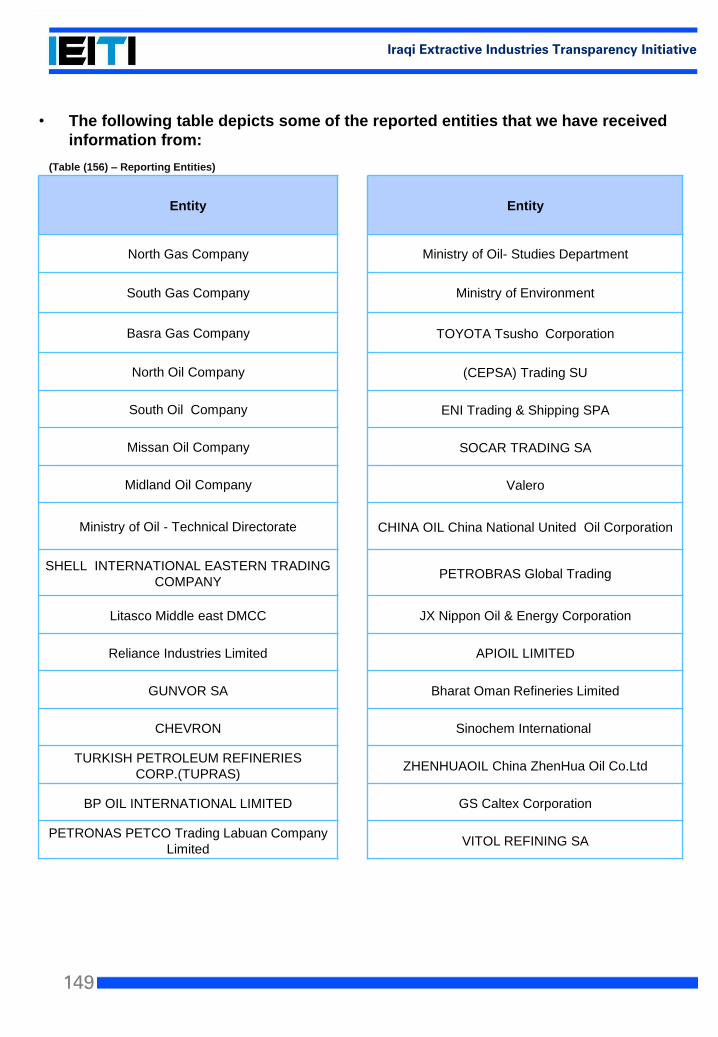
149
Iraqi Extractive Industries Transparency Initiative
• The following table depicts some of the reported entities that we have received
information from:
Entity Entity
North Gas Company Ministry of Oil- Studies Department
South Gas Company Ministry of Environment
Basra Gas Company TOYOTA Tsusho Corporation
North Oil Company (CEPSA) Trading SU
South Oil Company ENI Trading & Shipping SPA
Missan Oil Company SOCAR TRADING SA
Midland Oil Company Valero
Ministry of Oil - Technical Directorate CHINA OIL China National United Oil Corporation
SHELL INTERNATIONAL EASTERN TRADING
COMPANY PETROBRAS Global Trading
Litasco Middle east DMCC JX Nippon Oil & Energy Corporation
Reliance Industries Limited APIOIL LIMITED
GUNVOR SA Bharat Oman Refineries Limited
CHEVRON Sinochem International
TURKISH PETROLEUM REFINERIES
CORP.(TUPRAS)ZHENHUAOIL China ZhenHua Oil Co.Ltd
BP OIL INTERNATIONAL LIMITED GS Caltex Corporation
PETRONAS PETCO Trading Labuan Company
Limited VITOL REFINING SA
(Table (156) – Reporting Entities)
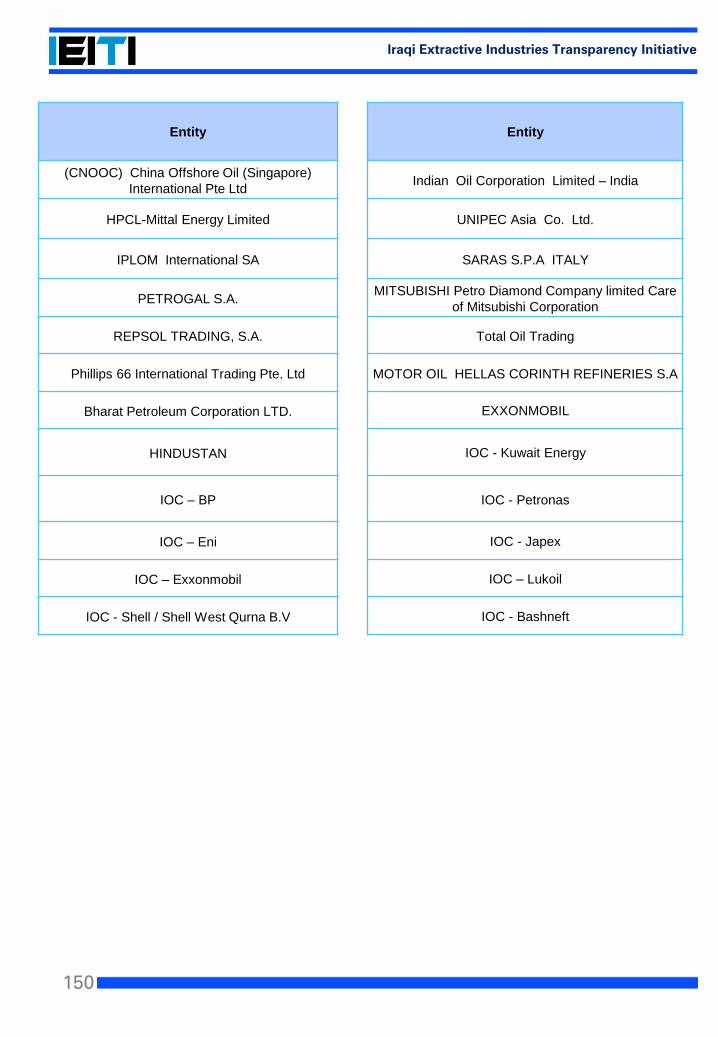
150
Iraqi Extractive Industries Transparency Initiative
Entity Entity
(CNOOC) China Offshore Oil (Singapore)
International Pte Ltd Indian Oil Corporation Limited – India
HPCL-Mittal Energy Limited UNIPEC Asia Co. Ltd.
IPLOM International SA SARAS S.P.A ITALY
PETROGAL S.A.MITSUBISHI Petro Diamond Company limited Care
of Mitsubishi Corporation
REPSOL TRADING, S.A. Total Oil Trading
Phillips 66 International Trading Pte. Ltd MOTOR OIL HELLAS CORINTH REFINERIES S.A
Bharat Petroleum Corporation LTD. EXXONMOBIL
HINDUSTAN IOC - Kuwait Energy
IOC – BP IOC - Petronas
IOC – Eni IOC - Japex
IOC – Exxonmobil IOC – Lukoil
IOC - Shell / Shell West Qurna B.V IOC - Bashneft
151
Iraqi Extractive Industries Transparency Initiative
The contact at KPMG in connection
with this document is:Tel: + 962 6 5657090
kpmg.com/socialmedia kpmg.com/app