Embed Size (px)
Citation preview
1
We drive sustainable solutionsDr. Stefanie Wettberg, Senior Vice PresidentInvestor Relations
Dr. Tim Balensiefer,IR Manager Sustainability
HSBC ESG DayFrankfurt, June 14, 2018
Cautionary note regarding forward-looking statements
This presentation contains forward-looking statements. These statements are based on current estimatesand projections of the Board of Executive Directors and currently available information. Forward-lookingstatements are not guarantees of the future developments and results outlined therein. These are dependenton a number of factors; they involve various risks and uncertainties; and they are based on assumptions thatmay not prove to be accurate. Such risk factors include those discussed in the Opportunities and RisksReport from page 111 to 118 of the BASF Report 2017. BASF does not assume any obligation to update theforward-looking statements contained in this presentation above and beyond the legal requirements.
2
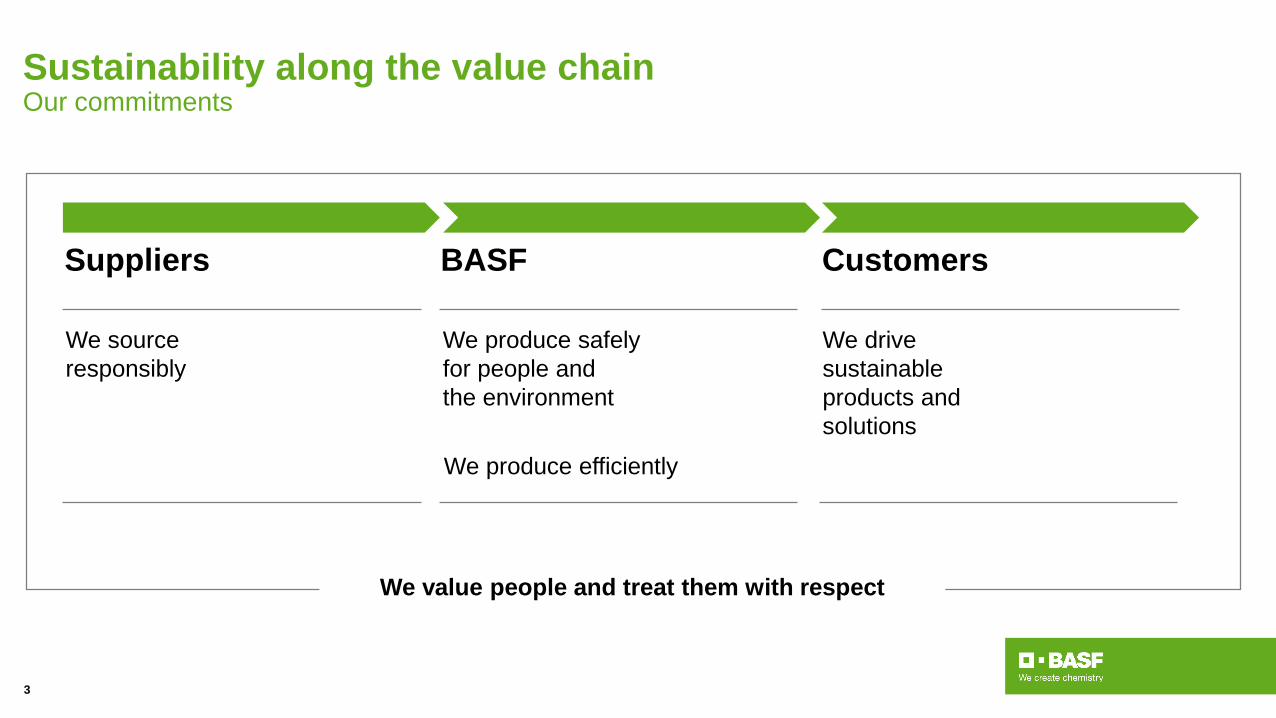
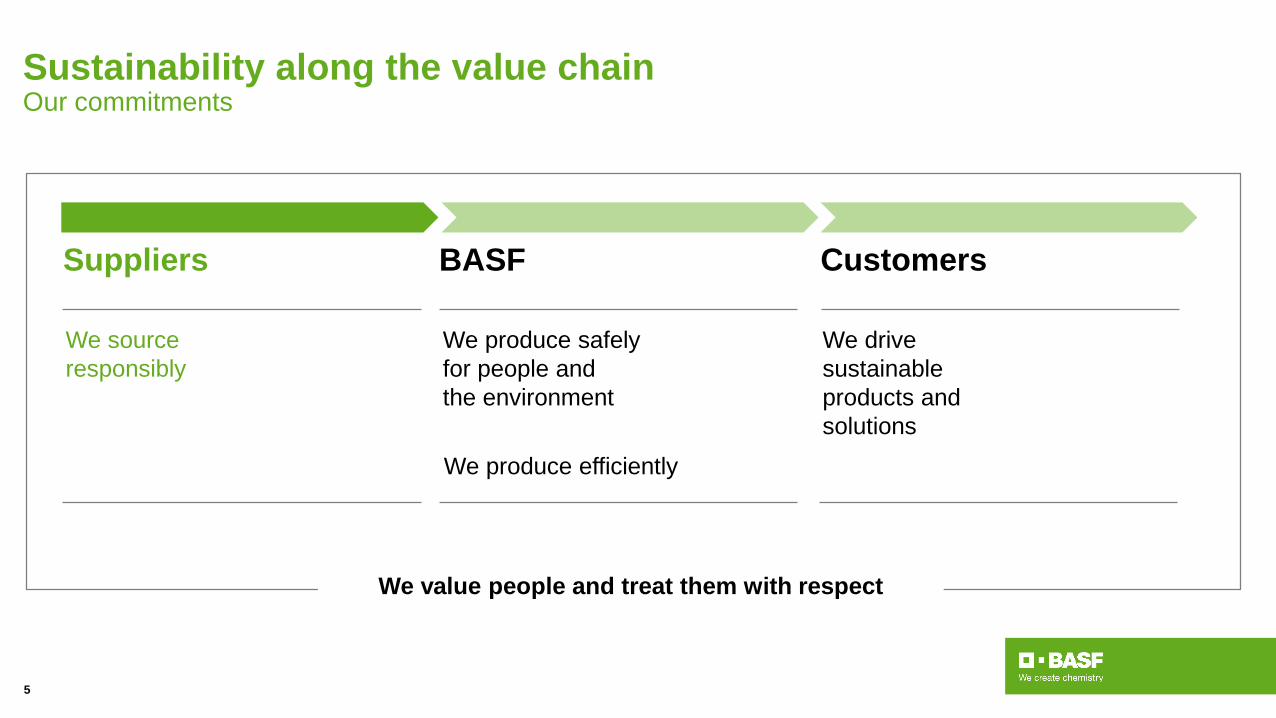
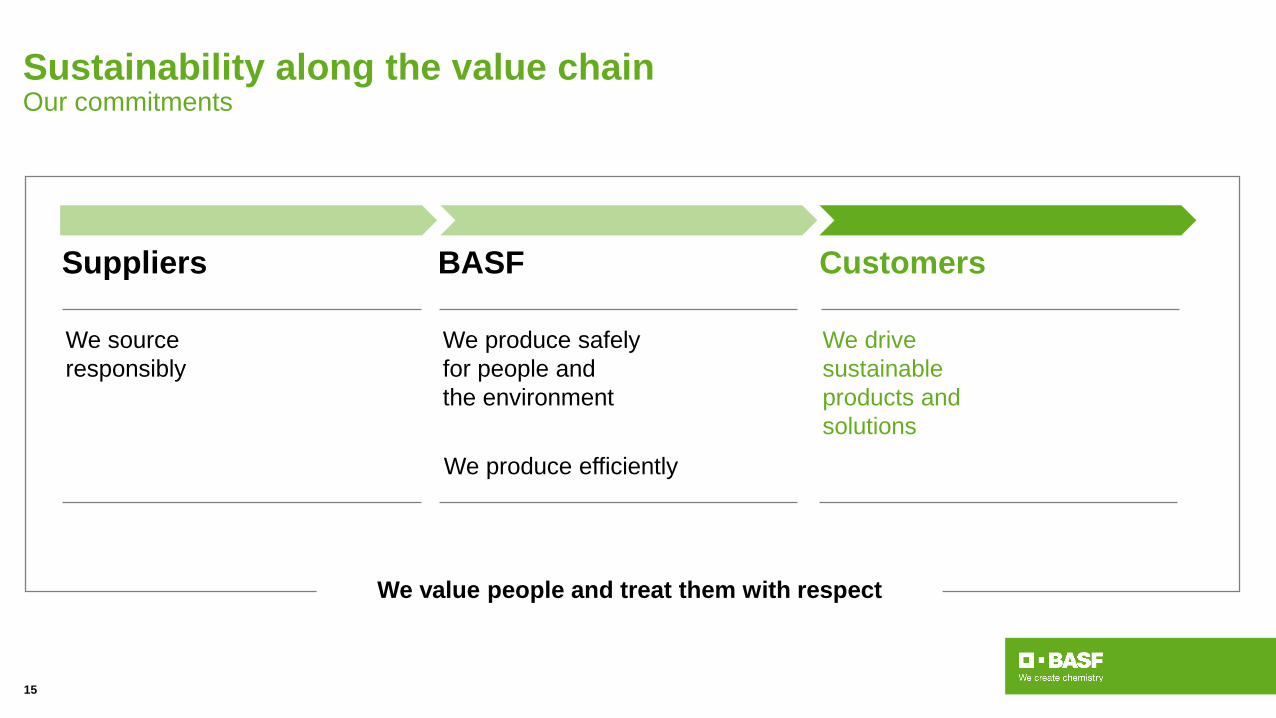
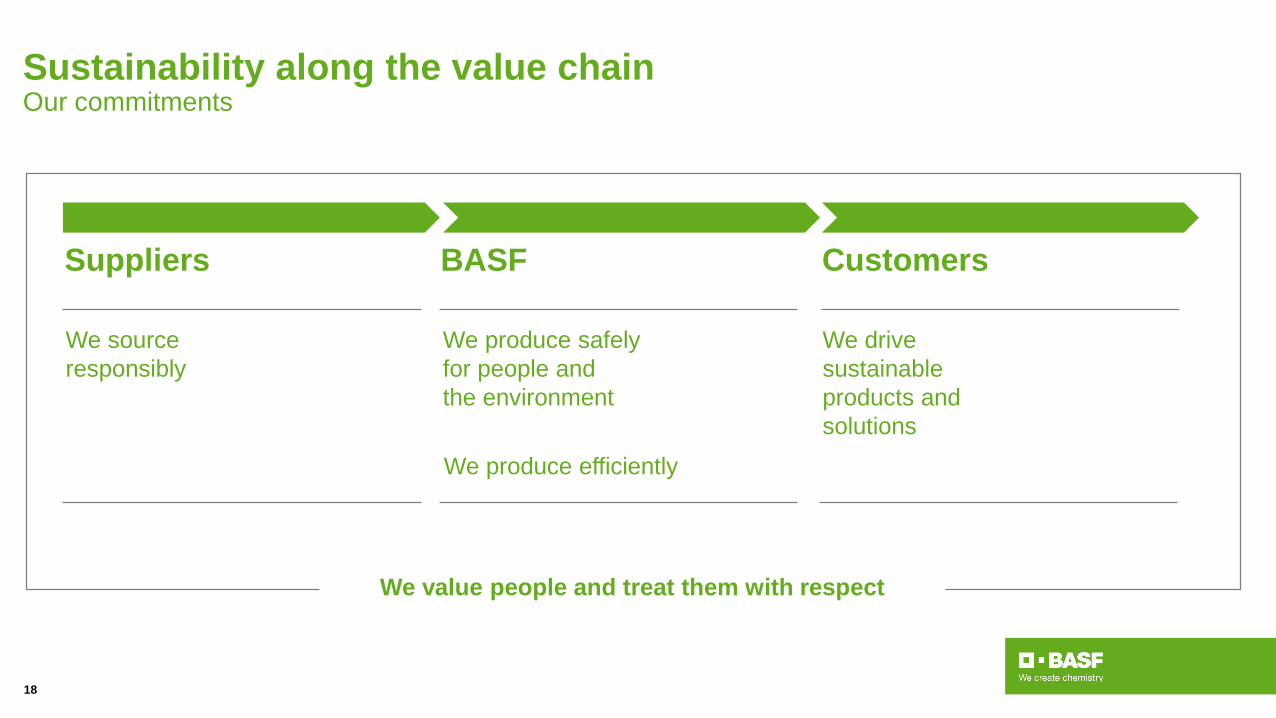
Sustainability along the value chainOur commitments
We drivesustainableproducts andsolutions
We produce safelyfor people andthe environment
We produce efficiently
We sourceresponsibly
Suppliers BASF Customers
We value people and treat them with respect
3
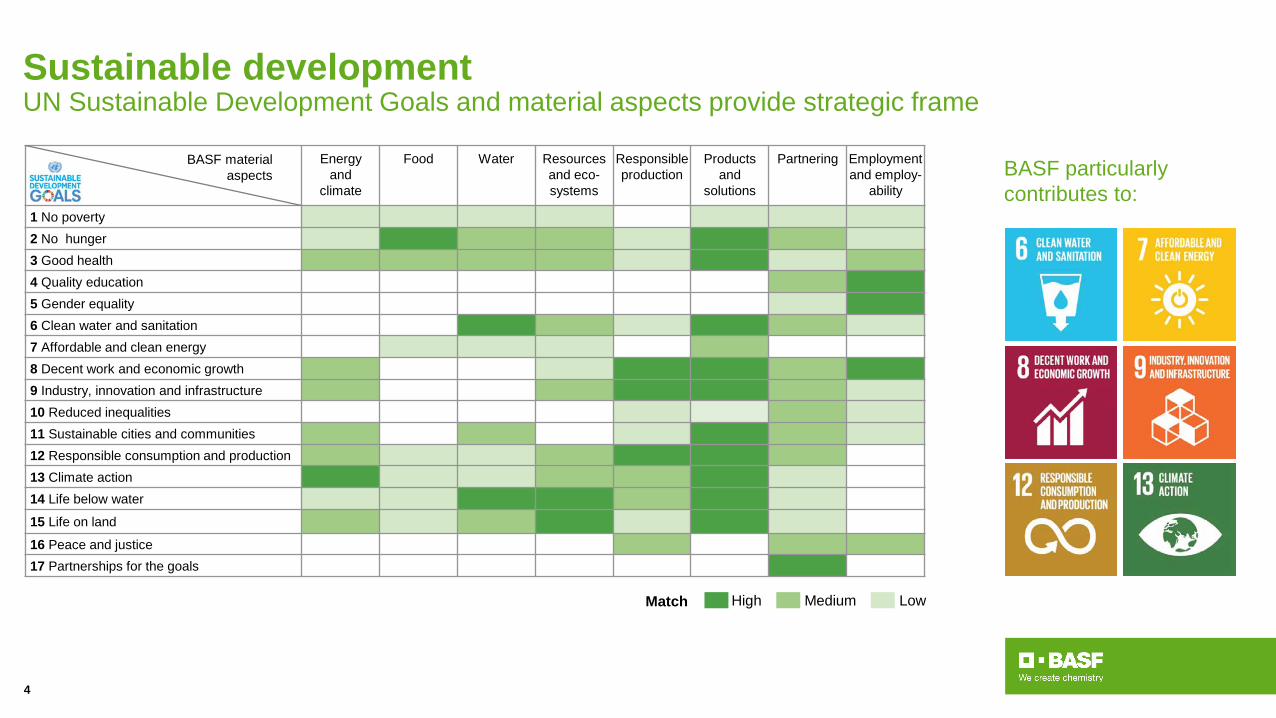
Sustainable developmentUN Sustainable Development Goals and material aspects provide strategic frame
LowMediumHighMatch
Energyand
climate
Food Water Resources and eco-systems
Responsible production
Products and
solutions
Partnering Employment and employ-
ability
1 No poverty2 No hunger3 Good health4 Quality education5 Gender equality6 Clean water and sanitation7 Affordable and clean energy8 Decent work and economic growth9 Industry, innovation and infrastructure10 Reduced inequalities11 Sustainable cities and communities12 Responsible consumption and production13 Climate action14 Life below water
15 Life on land
16 Peace and justice17 Partnerships for the goals
4
BASF particularly contributes to:
BASF materialaspects
Suppliers BASF Customers
We value people and treat them with respect
Sustainability along the value chainOur commitments
5
We drivesustainableproducts and solutions
We produce safelyfor people andthe environment
We produce efficiently
We sourceresponsibly
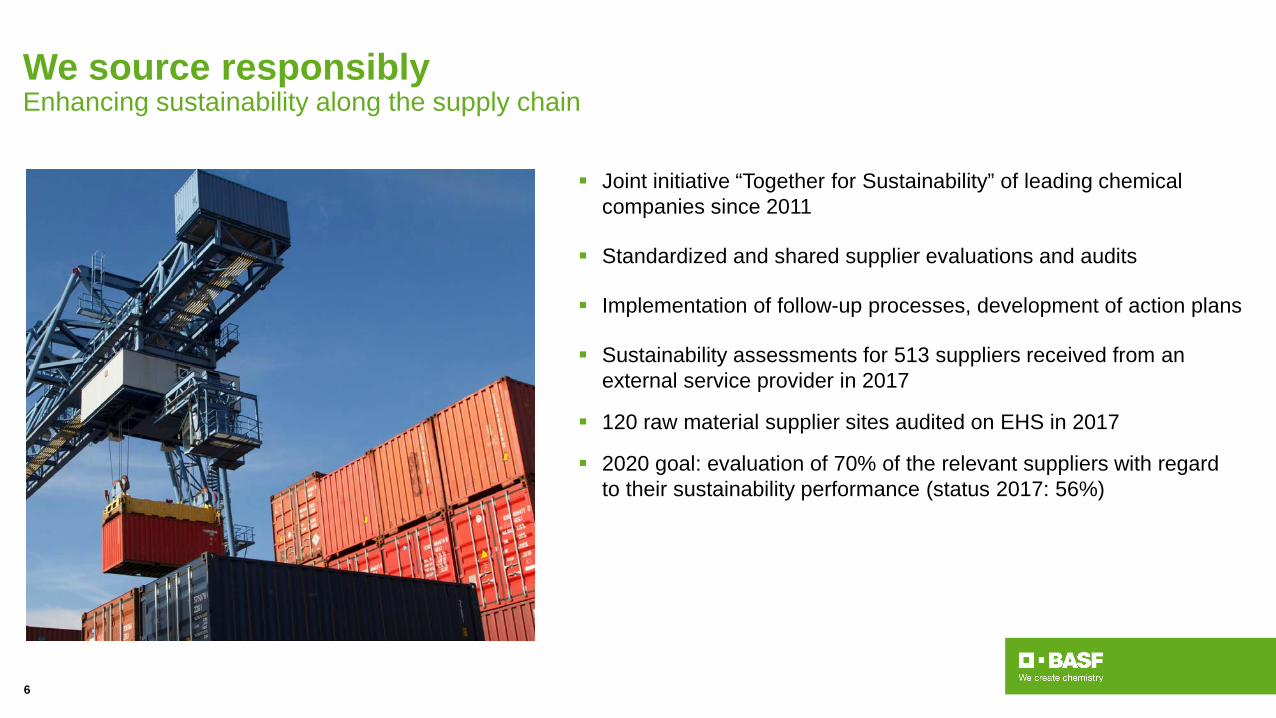
We source responsiblyEnhancing sustainability along the supply chain
Joint initiative “Together for Sustainability” of leading chemical companies since 2011
Standardized and shared supplier evaluations and audits
Implementation of follow-up processes, development of action plans
Sustainability assessments for 513 suppliers received from an external service provider in 2017
120 raw material supplier sites audited on EHS in 2017
2020 goal: evaluation of 70% of the relevant suppliers with regard to their sustainability performance (status 2017: 56%)
6
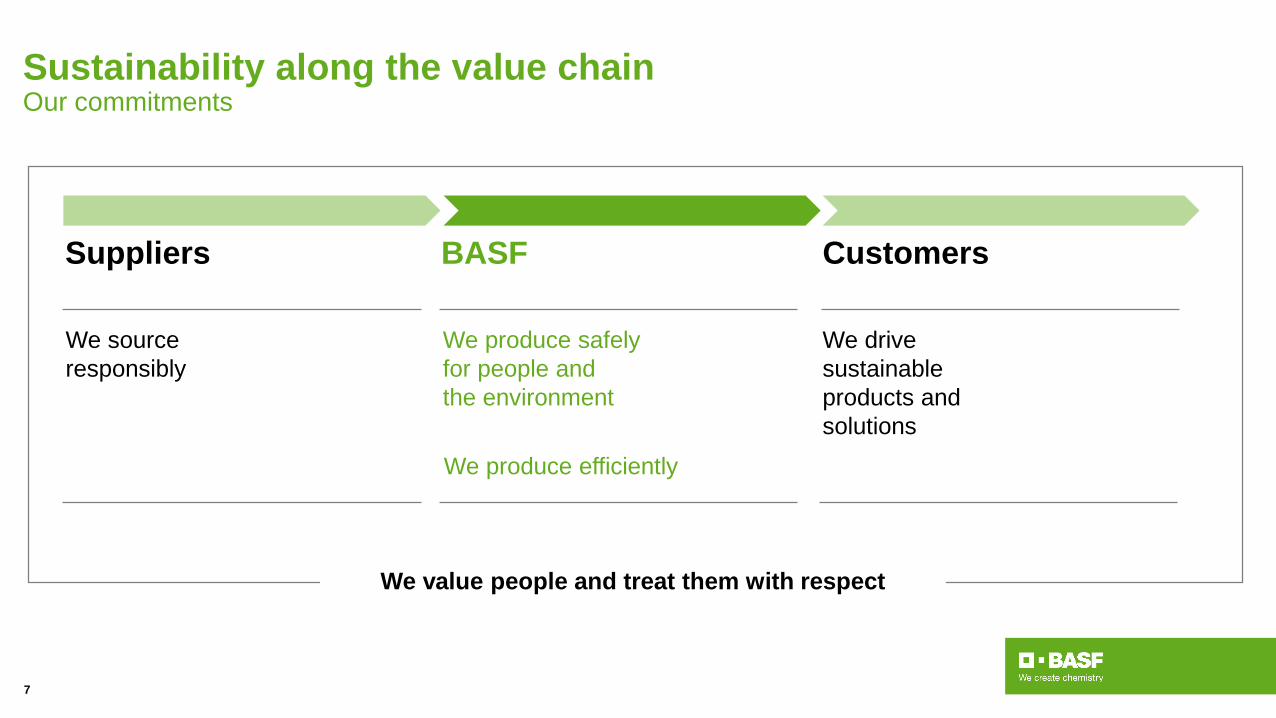
Sustainability along the value chainOur commitments
Suppliers BASF Customers
We value people and treat them with respect
7
We drivesustainableproducts andsolutions
We produce safelyfor people andthe environment
We produce efficiently
We sourceresponsibly
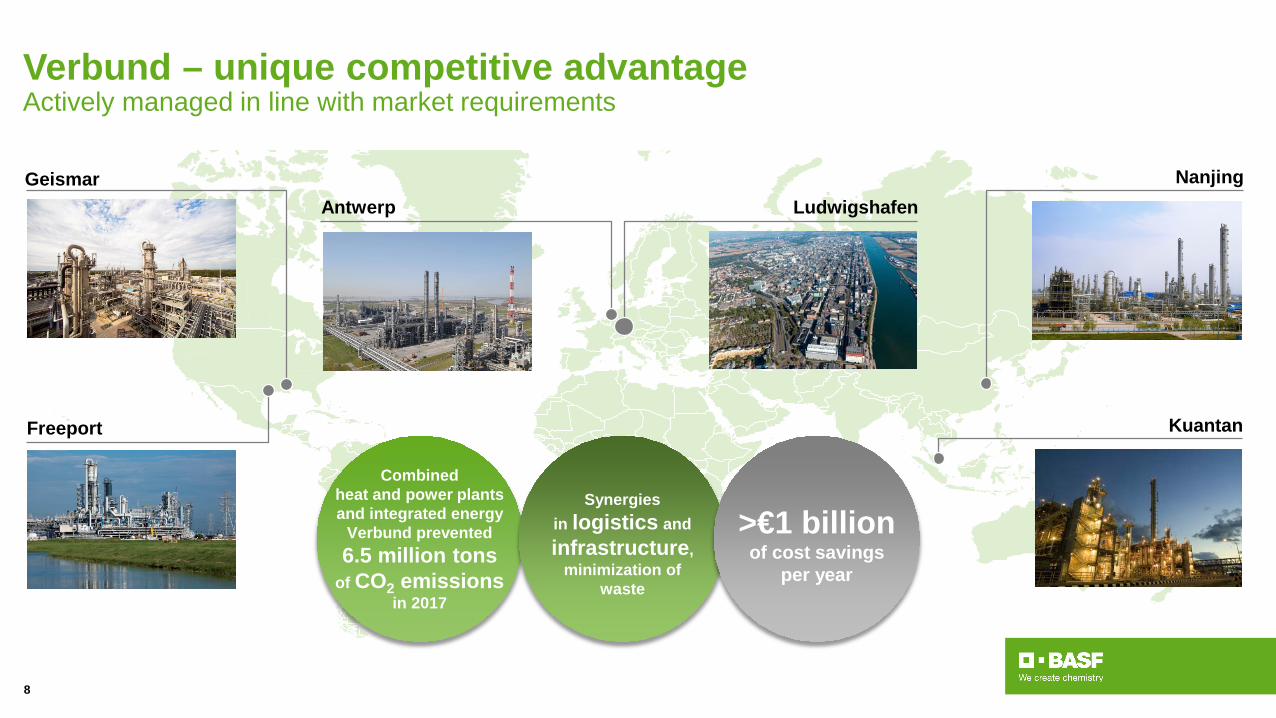
Verbund – unique competitive advantageActively managed in line with market requirements
.
Antwerp
Freeport
Geismar
Kuantan
Nanjing Ludwigshafen
Combinedheat and power plantsand integrated energy
Verbund prevented 6.5 million tons
of CO2 emissions in 2017
Synergiesin logistics and infrastructure,
minimization of waste
>€1 billionof cost savings
per year
8
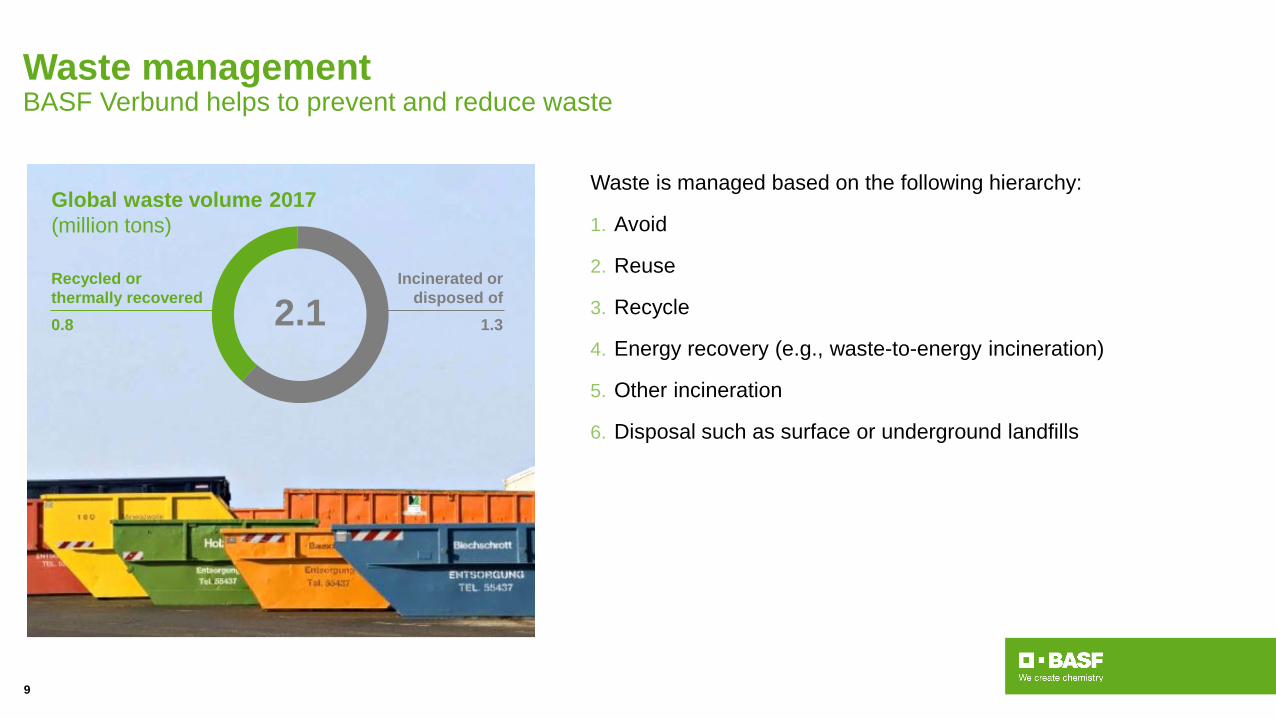
Waste managementBASF Verbund helps to prevent and reduce waste
Waste is managed based on the following hierarchy:
1. Avoid
2. Reuse
3. Recycle
4. Energy recovery (e.g., waste-to-energy incineration)
5. Other incineration
6. Disposal such as surface or underground landfills
Global waste volume 2017(million tons)
Recycled orthermally recovered0.8
Incinerated ordisposed of
1.32.1
9
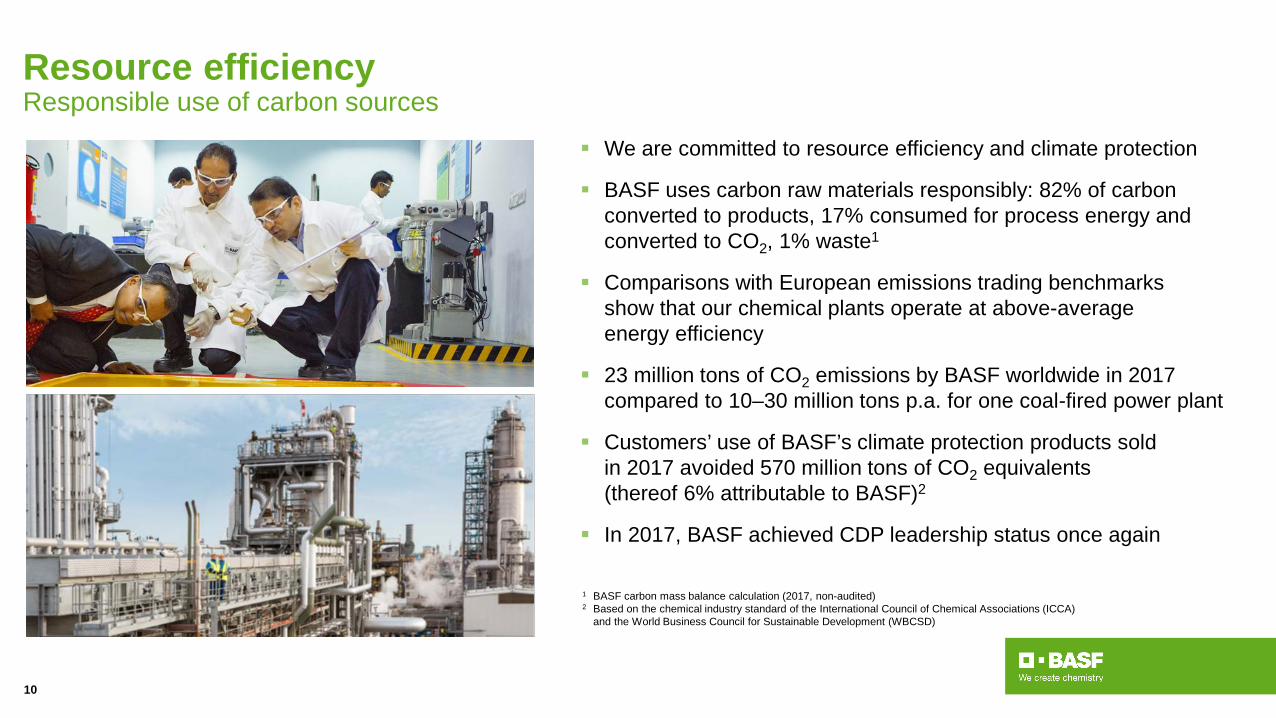
Resource efficiencyResponsible use of carbon sources
We are committed to resource efficiency and climate protection
BASF uses carbon raw materials responsibly: 82% of carbon converted to products, 17% consumed for process energy and converted to CO2, 1% waste1
Comparisons with European emissions trading benchmarks show that our chemical plants operate at above-average energy efficiency
23 million tons of CO2 emissions by BASF worldwide in 2017 compared to 10–30 million tons p.a. for one coal-fired power plant
Customers’ use of BASF’s climate protection products sold in 2017 avoided 570 million tons of CO2 equivalents (thereof 6% attributable to BASF)2
In 2017, BASF achieved CDP leadership status once again
1 BASF carbon mass balance calculation (2017, non-audited) 2 Based on the chemical industry standard of the International Council of Chemical Associations (ICCA)
and the World Business Council for Sustainable Development (WBCSD)
10
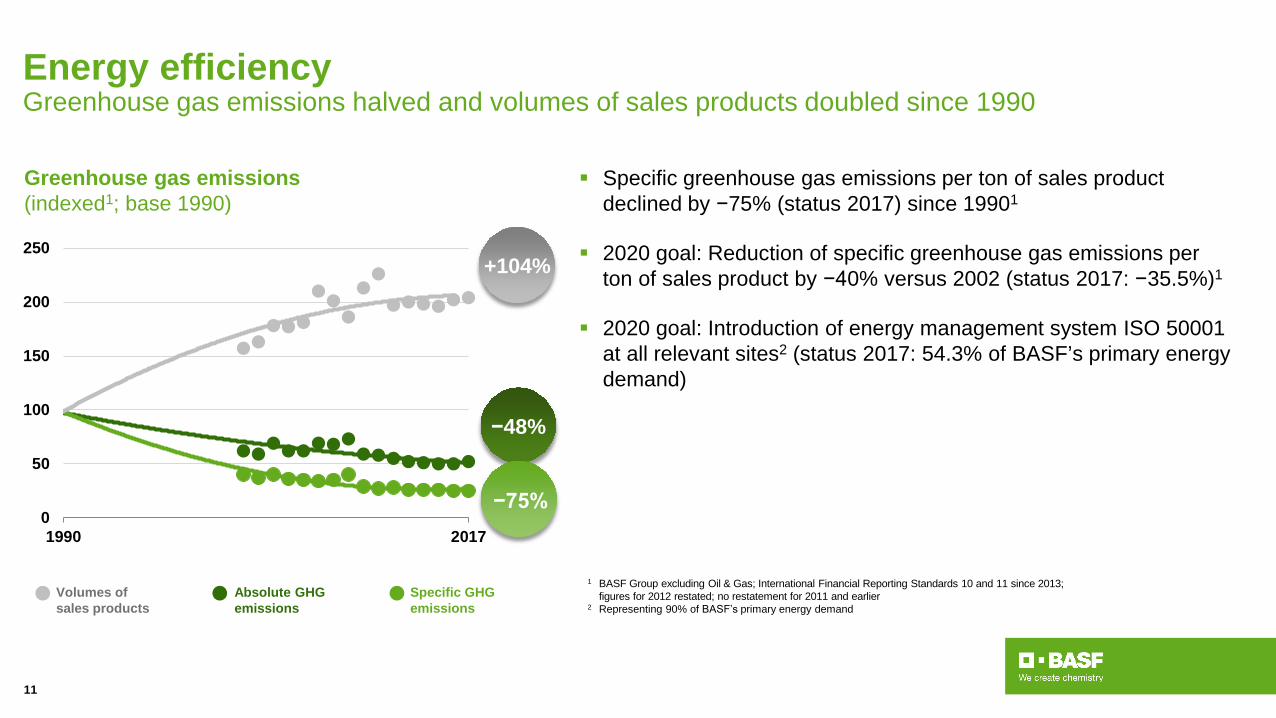
Energy efficiencyGreenhouse gas emissions halved and volumes of sales products doubled since 1990
0
50
100
150
200
250
1990 2017
Volumes of sales products
Absolute GHG emissions
Specific GHG emissions
Greenhouse gas emissions(indexed1; base 1990)
1 BASF Group excluding Oil & Gas; International Financial Reporting Standards 10 and 11 since 2013; figures for 2012 restated; no restatement for 2011 and earlier
2 Representing 90% of BASFʼs primary energy demand
Specific greenhouse gas emissions per ton of sales product declined by −75% (status 2017) since 19901
2020 goal: Reduction of specific greenhouse gas emissions per ton of sales product by −40% versus 2002 (status 2017: −35.5%)1
2020 goal: Introduction of energy management system ISO 50001 at all relevant sites2 (status 2017: 54.3% of BASF’s primary energy demand)
+104%
−48%
−75%
11
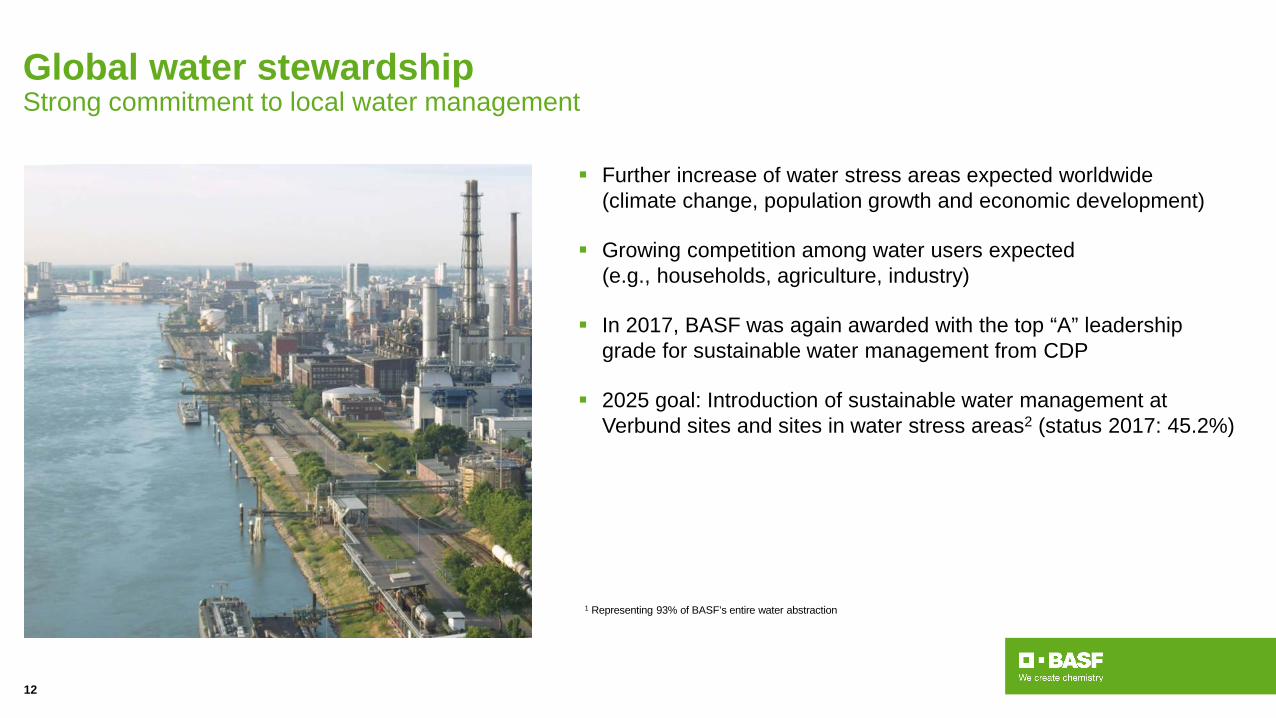
Global water stewardshipStrong commitment to local water management
1 Representing 93% of BASF’s entire water abstraction
Further increase of water stress areas expected worldwide (climate change, population growth and economic development)
Growing competition among water users expected(e.g., households, agriculture, industry)
In 2017, BASF was again awarded with the top “A” leadership grade for sustainable water management from CDP
2025 goal: Introduction of sustainable water management at Verbund sites and sites in water stress areas2 (status 2017: 45.2%)
12
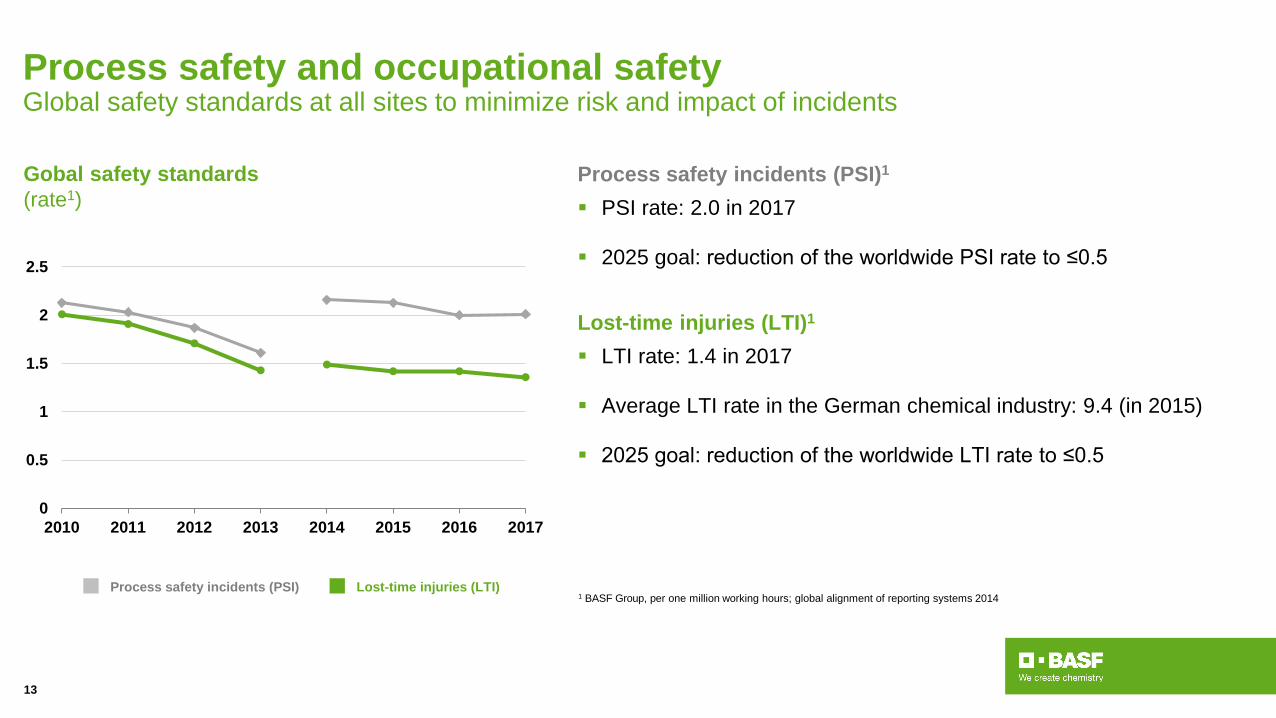
Process safety and occupational safetyGlobal safety standards at all sites to minimize risk and impact of incidents
Process safety incidents (PSI)1
PSI rate: 2.0 in 2017
2025 goal: reduction of the worldwide PSI rate to ≤0.5
Lost-time injuries (LTI)1
LTI rate: 1.4 in 2017
Average LTI rate in the German chemical industry: 9.4 (in 2015)
2025 goal: reduction of the worldwide LTI rate to ≤0.5
1 BASF Group, per one million working hours; global alignment of reporting systems 2014
0
0.5
1
1.5
2
2.5
2010 2011 2012 2013 2014 2015 2016 2017
Process safety incidents (PSI) Lost-time injuries (LTI)
Gobal safety standards(rate1)
13
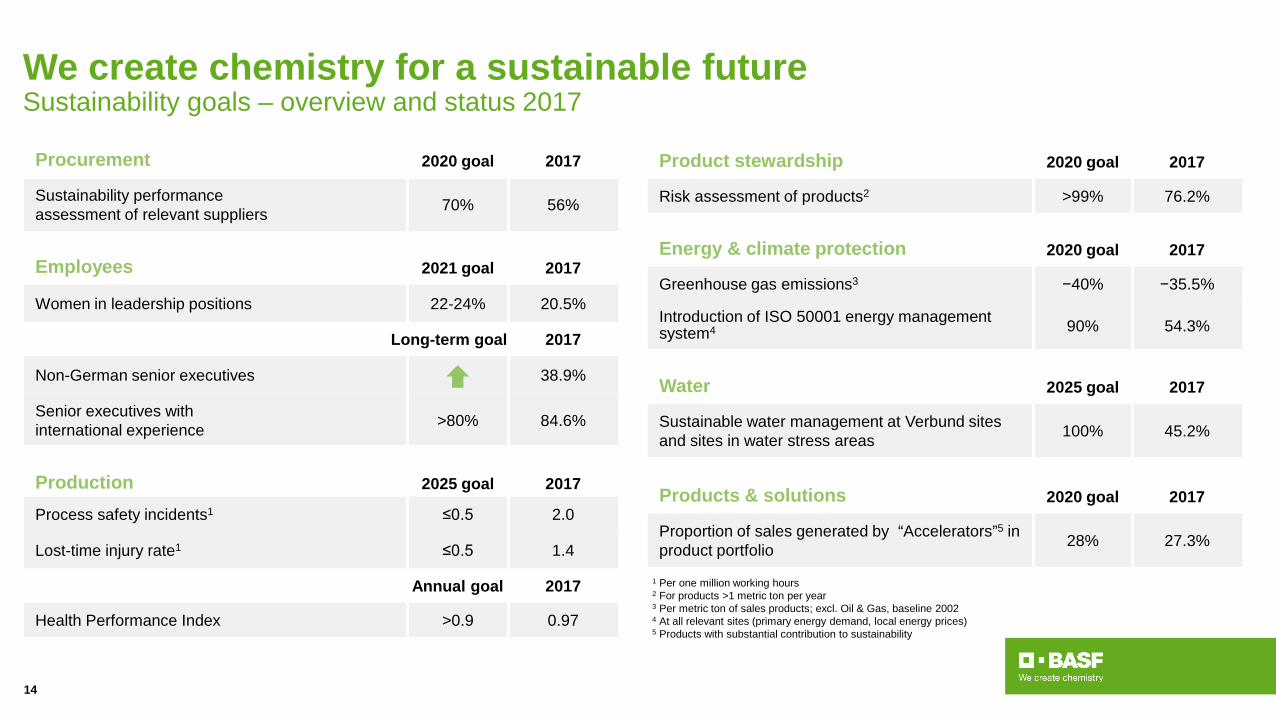
We create chemistry for a sustainable futureSustainability goals – overview and status 2017
Procurement 2020 goal 2017
Sustainability performanceassessment of relevant suppliers 70% 56%
Employees 2021 goal 2017
Women in leadership positions 22-24% 20.5%
Long-term goal 2017
Non-German senior executives 38.9%
Senior executives with international experience >80% 84.6%
Production 2025 goal 2017
Process safety incidents1 ≤0.5 2.0
Lost-time injury rate1 ≤0.5 1.4
Annual goal 2017
Health Performance Index >0.9 0.97
Product stewardship 2020 goal 2017
Risk assessment of products2 >99% 76.2%
Energy & climate protection 2020 goal 2017
Greenhouse gas emissions3 −40% −35.5%
Introduction of ISO 50001 energy management system4 90% 54.3%
Water 2025 goal 2017
Sustainable water management at Verbund sites and sites in water stress areas 100% 45.2%
Products & solutions 2020 goal 2017
Proportion of sales generated by “Accelerators”5 in product portfolio 28% 27.3%
1 Per one million working hours2 For products >1 metric ton per year 3 Per metric ton of sales products; excl. Oil & Gas, baseline 20024 At all relevant sites (primary energy demand, local energy prices)5 Products with substantial contribution to sustainability
14
Sustainability along the value chainOur commitments
Suppliers BASF Customers
We value people and treat them with respect
15
We drivesustainableproducts andsolutions
We produce safelyfor people andthe environment
We produce efficiently
We sourceresponsibly
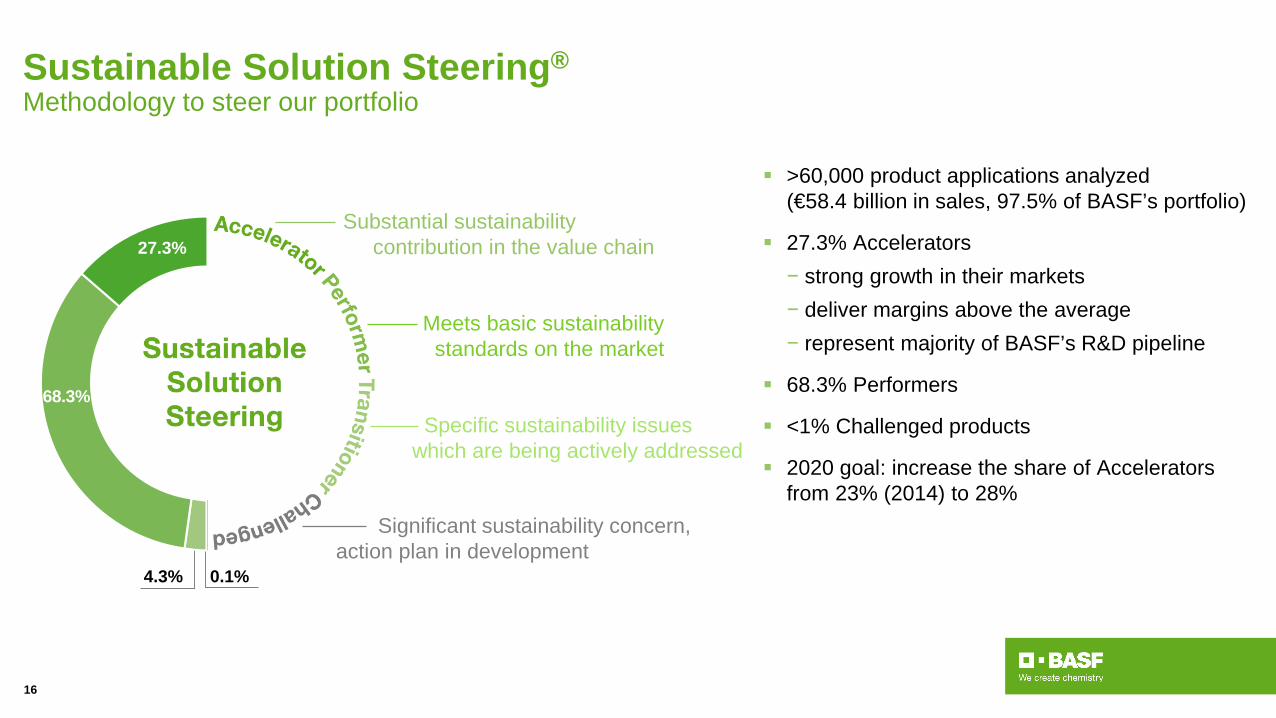
Sustainable Solution Steering®Methodology to steer our portfolio
Substantial sustainability contribution in the value chain
Meets basic sustainability standards on the market
Specific sustainability issues which are being actively addressed
Significant sustainability concern,action plan in development
27.3%
68.3%
4.3% 0.1%
>60,000 product applications analyzed (€58.4 billion in sales, 97.5% of BASF’s portfolio)
27.3% Accelerators− strong growth in their markets − deliver margins above the average− represent majority of BASF’s R&D pipeline
68.3% Performers
<1% Challenged products
2020 goal: increase the share of Accelerators from 23% (2014) to 28%
16
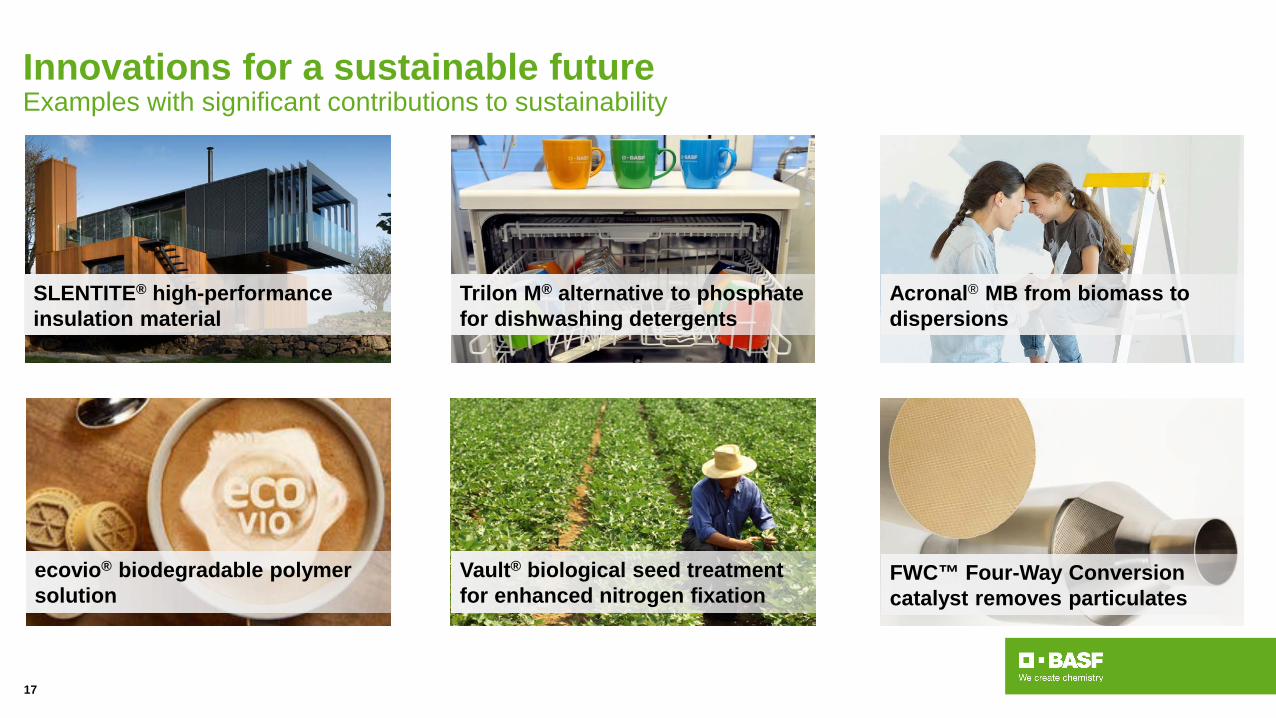
Innovations for a sustainable futureExamples with significant contributions to sustainability
FWC™ Four-Way Conversion catalyst removes particulates
Acronal® MB from biomass to dispersions
Trilon M® alternative to phosphate for dishwashing detergents
SLENTITE® high-performance insulation material
ecovio® biodegradable polymer solution
17
Vault® biological seed treatmentfor enhanced nitrogen fixation
Sustainability along the value chainOur commitments
Suppliers BASF Customers
We value people and treat them with respect
18
We drivesustainableproducts andsolutions
We produce safelyfor people andthe environment
We produce efficiently
We sourceresponsibly
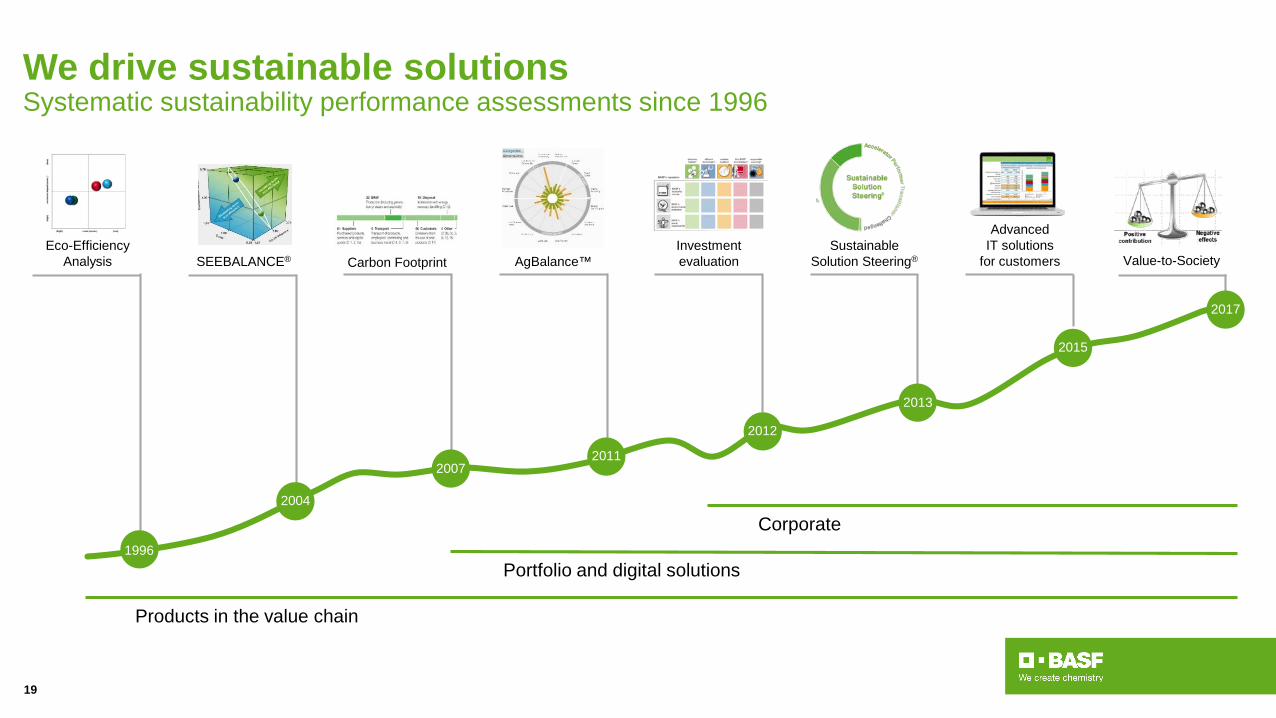
We drive sustainable solutionsSystematic sustainability performance assessments since 1996
SEEBALANCE®
Advanced IT solutions
for customersAgBalance™Sustainable
Solution Steering®Eco-Efficiency
AnalysisInvestmentevaluation Value-to-SocietyCarbon Footprint
19
Products in the value chain
Portfolio and digital solutions
Corporate1996
2004
20072011
2012
2013
2015
2017
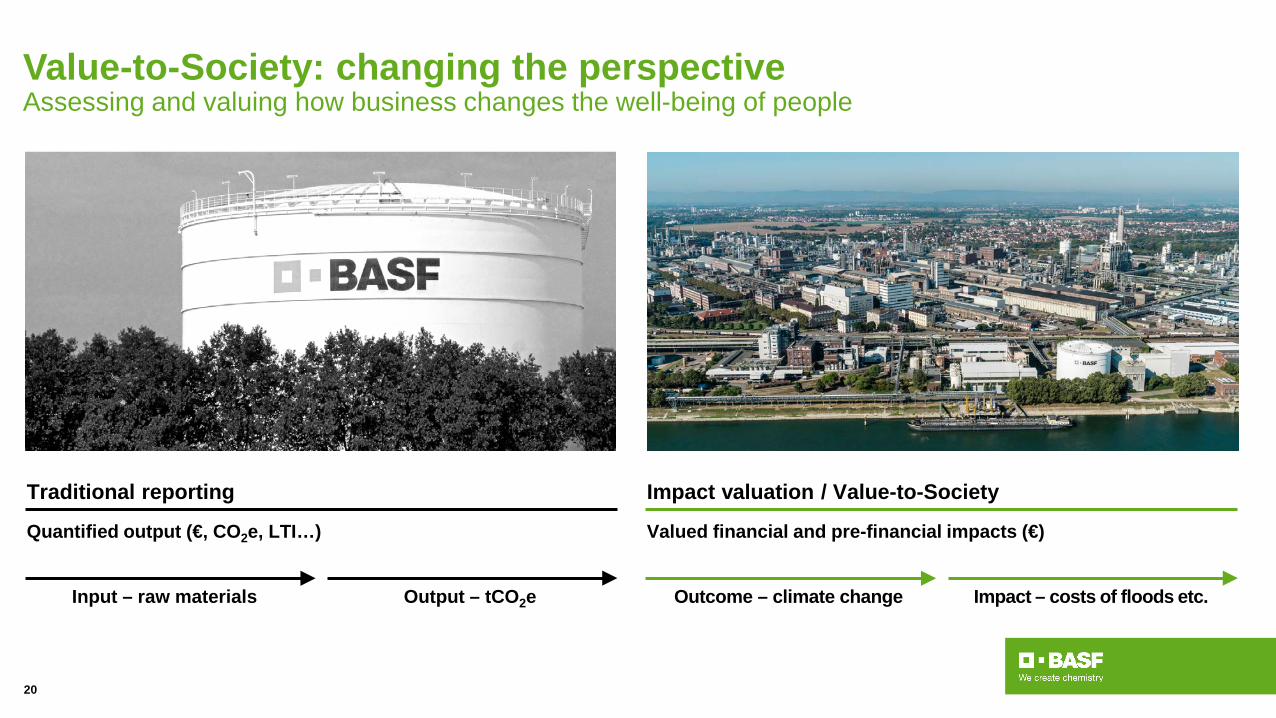
Value-to-Society: changing the perspectiveAssessing and valuing how business changes the well-being of people
Traditional reporting
Quantified output (€, CO2e, LTI…)
Impact valuation / Value-to-Society
Valued financial and pre-financial impacts (€)
Output – tCO2eInput – raw materials Impact – costs of floods etc.Outcome – climate change
20
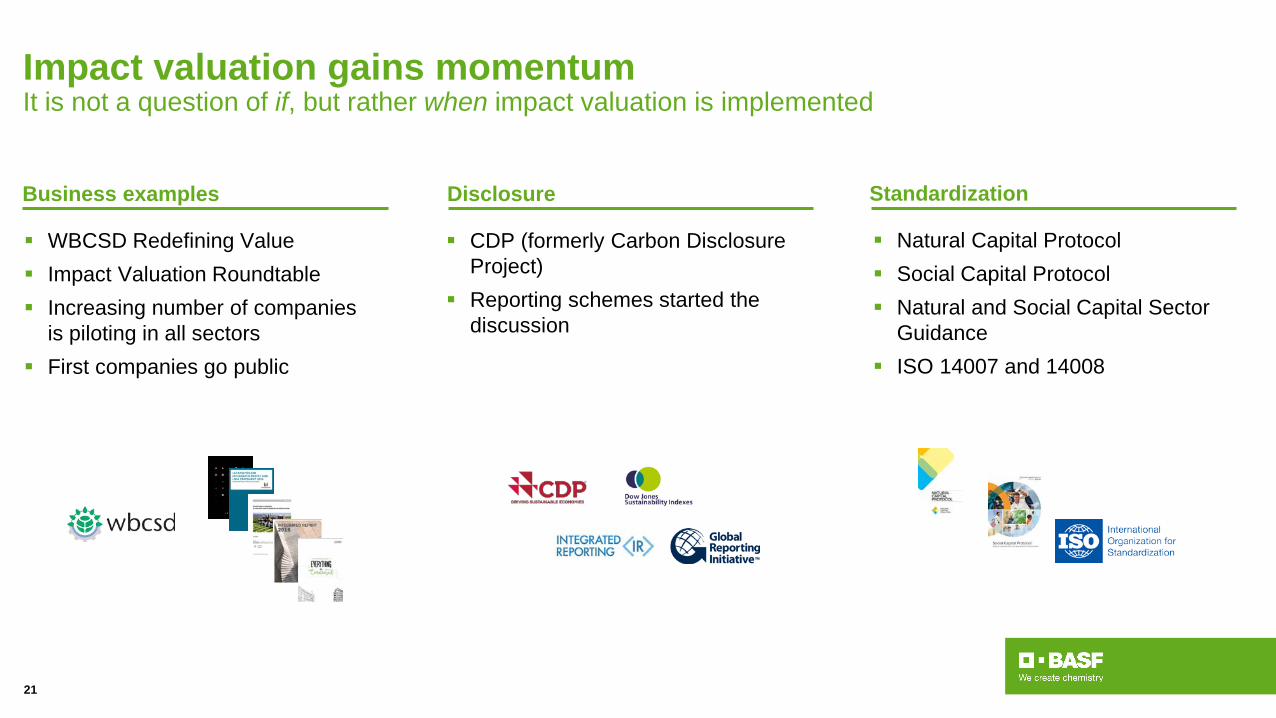
Impact valuation gains momentumIt is not a question of if, but rather when impact valuation is implemented
StandardizationDisclosureBusiness examples
Natural Capital Protocol Social Capital Protocol Natural and Social Capital Sector
Guidance ISO 14007 and 14008
CDP (formerly Carbon Disclosure Project)
Reporting schemes started the discussion
WBCSD Redefining Value Impact Valuation Roundtable Increasing number of companies
is piloting in all sectors First companies go public
21
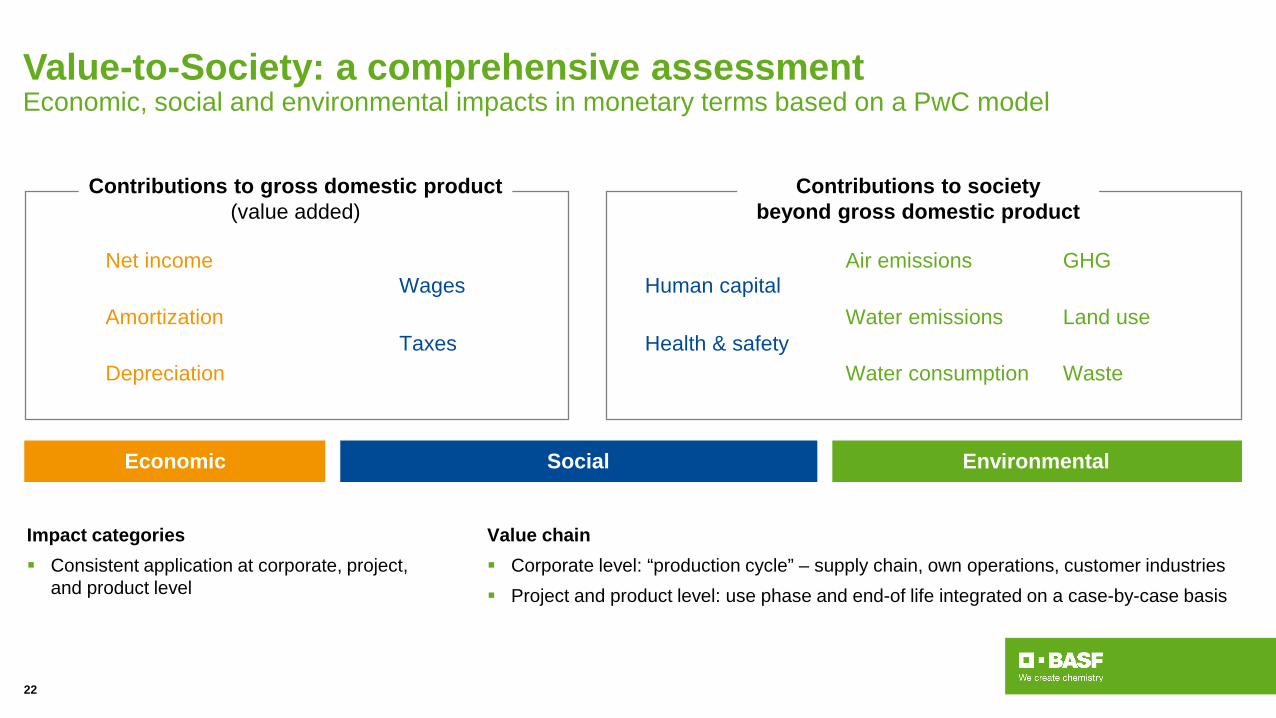
Value-to-Society: a comprehensive assessmentEconomic, social and environmental impacts in monetary terms based on a PwC model
Net incomeWages
Health & safety
Human capitalAir emissions
Land use
Water consumption
Water emissions
GHG
Waste
Amortization
DepreciationTaxes
Impact categories Consistent application at corporate, project,
and product level
Value chain Corporate level: “production cycle” – supply chain, own operations, customer industries Project and product level: use phase and end-of life integrated on a case-by-case basis
Economic Social
Contributions to gross domestic product (value added)
Contributions to society beyond gross domestic product
Environmental
22
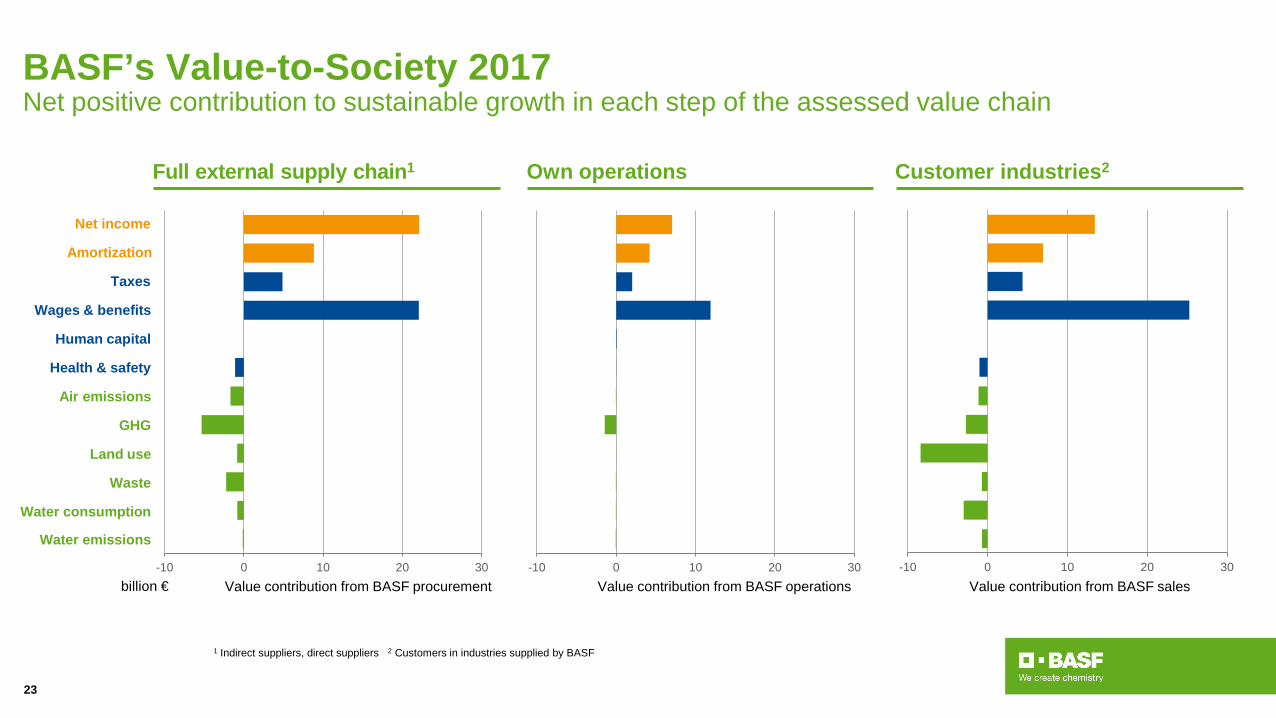
BASF’s Value-to-Society 2017Net positive contribution to sustainable growth in each step of the assessed value chain
Net income
Taxes
Wages & benefits
Human capital
Health & safety
Air emissions
GHG
Land use
Waste
Water consumption
Water emissions
Amortization
Value contribution from BASF procurement Value contribution from BASF operations Value contribution from BASF sales
Full external supply chain1 Own operations Customer industries2
1 Indirect suppliers, direct suppliers 2 Customers in industries supplied by BASF
billion €
23
-10 0 10 20 30 -10 0 10 20 30 -10 0 10 20 30
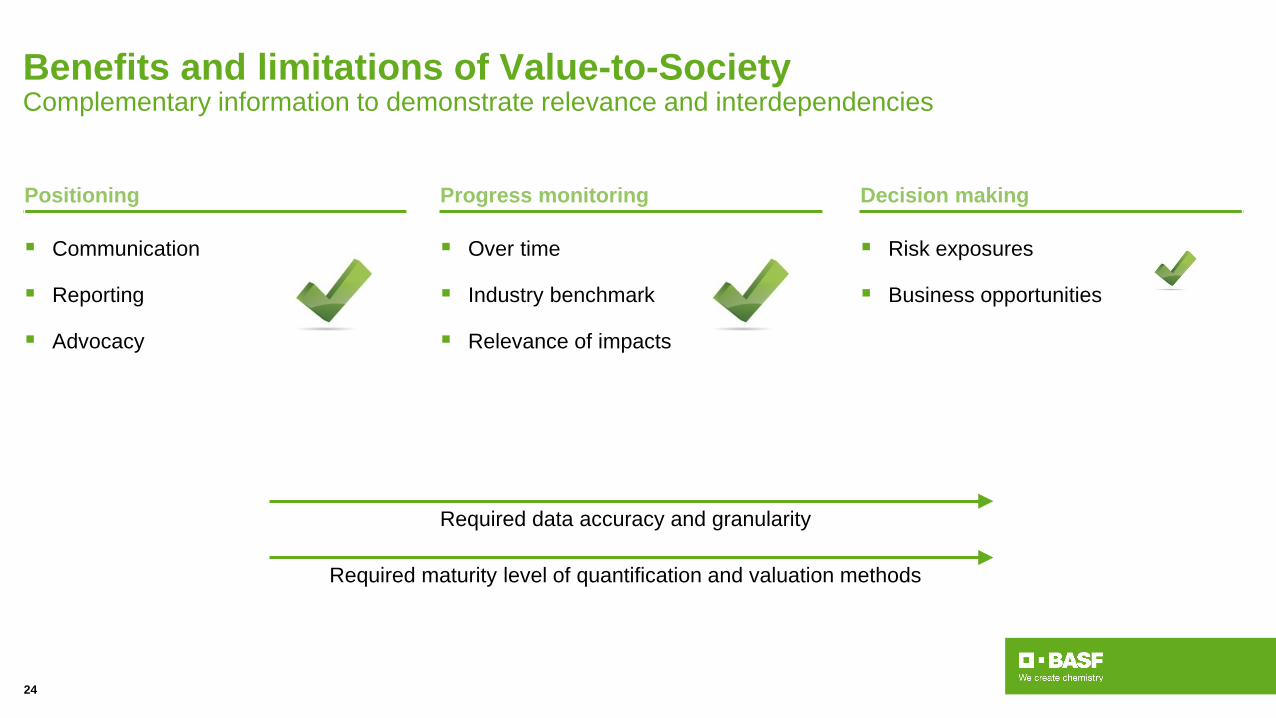
Benefits and limitations of Value-to-SocietyComplementary information to demonstrate relevance and interdependencies
Required data accuracy and granularity
Required maturity level of quantification and valuation methods
Positioning Progress monitoring Decision making
Communication
Reporting
Advocacy
Over time
Industry benchmark
Relevance of impacts
Risk exposures
Business opportunities
24
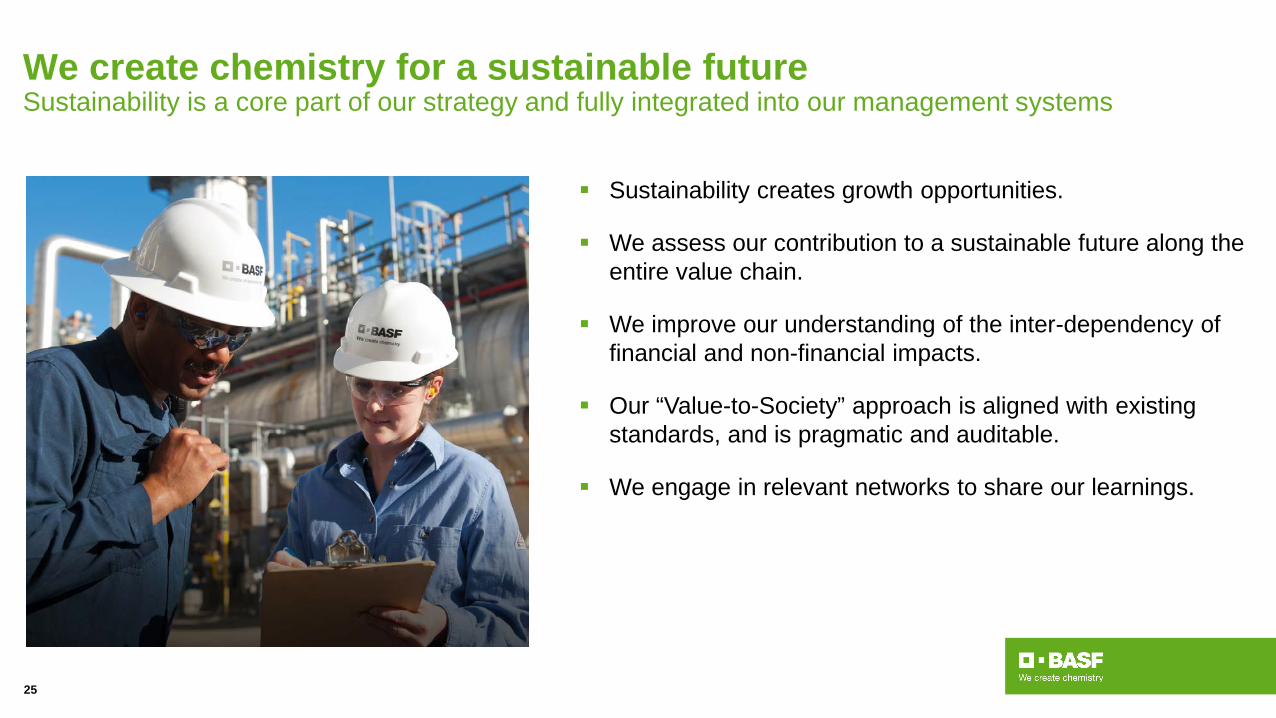
We create chemistry for a sustainable futureSustainability is a core part of our strategy and fully integrated into our management systems
Sustainability creates growth opportunities.
We assess our contribution to a sustainable future along the entire value chain.
We improve our understanding of the inter-dependency of financial and non-financial impacts.
Our “Value-to-Society” approach is aligned with existing standards, and is pragmatic and auditable.
We engage in relevant networks to share our learnings.
25
BASF SRI Story, November 2017 26
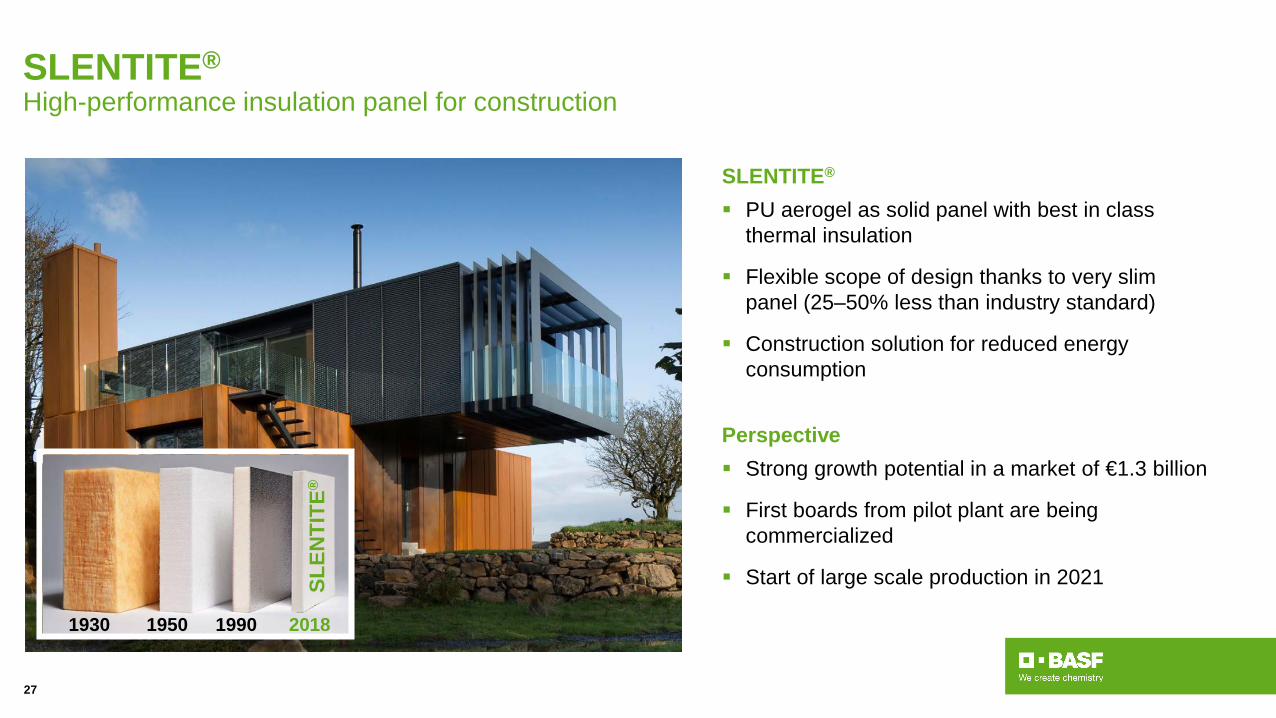
SLENTITE®High-performance insulation panel for construction
1990
Slen
tite®
1950 1990 20181930
SLEN
TITE
®
27
SLENTITE®
PU aerogel as solid panel with best in class thermal insulation
Flexible scope of design thanks to very slim panel (25–50% less than industry standard)
Construction solution for reduced energy consumption
Perspective Strong growth potential in a market of €1.3 billion
First boards from pilot plant are being commercialized
Start of large scale production in 2021
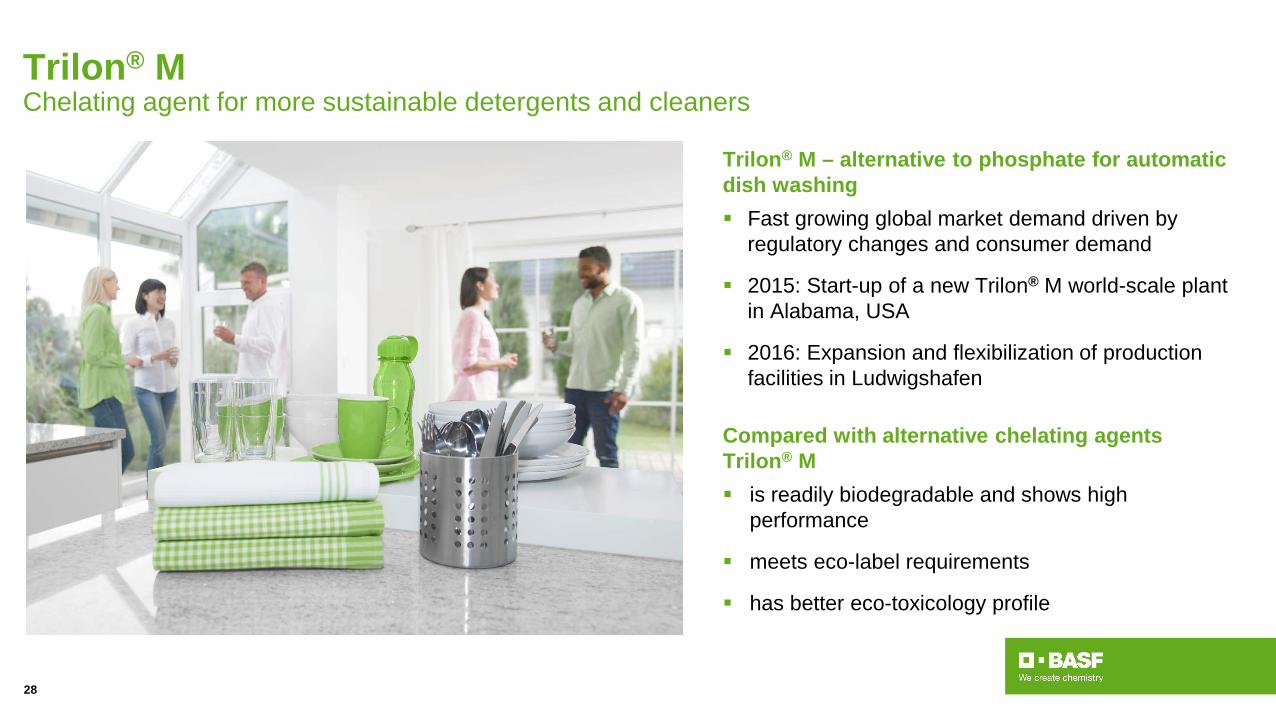
Trilon® MChelating agent for more sustainable detergents and cleaners
Trilon® M – alternative to phosphate for automatic dish washing Fast growing global market demand driven by
regulatory changes and consumer demand
2015: Start-up of a new Trilon® M world-scale plant in Alabama, USA
2016: Expansion and flexibilization of production facilities in Ludwigshafen
Compared with alternative chelating agents Trilon® M is readily biodegradable and shows high
performance
meets eco-label requirements
has better eco-toxicology profile
28
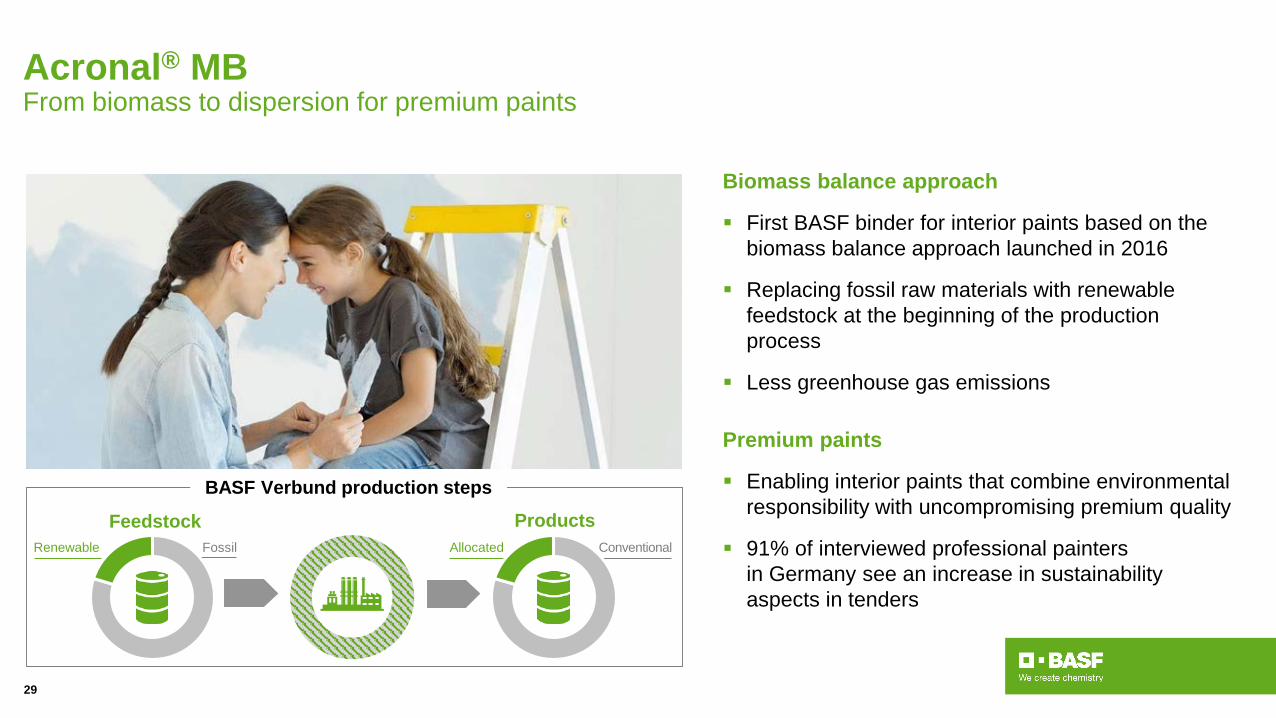
Acronal® MBFrom biomass to dispersion for premium paints
Biomass balance approach
First BASF binder for interior paints based on the biomass balance approach launched in 2016
Replacing fossil raw materials with renewable feedstock at the beginning of the production process
Less greenhouse gas emissions
Premium paints
Enabling interior paints that combine environmental responsibility with uncompromising premium quality
91% of interviewed professional painters in Germany see an increase in sustainability aspects in tenders
Renewable
Feedstock ProductsConventionalAllocatedFossil
BASF Verbund production steps
29
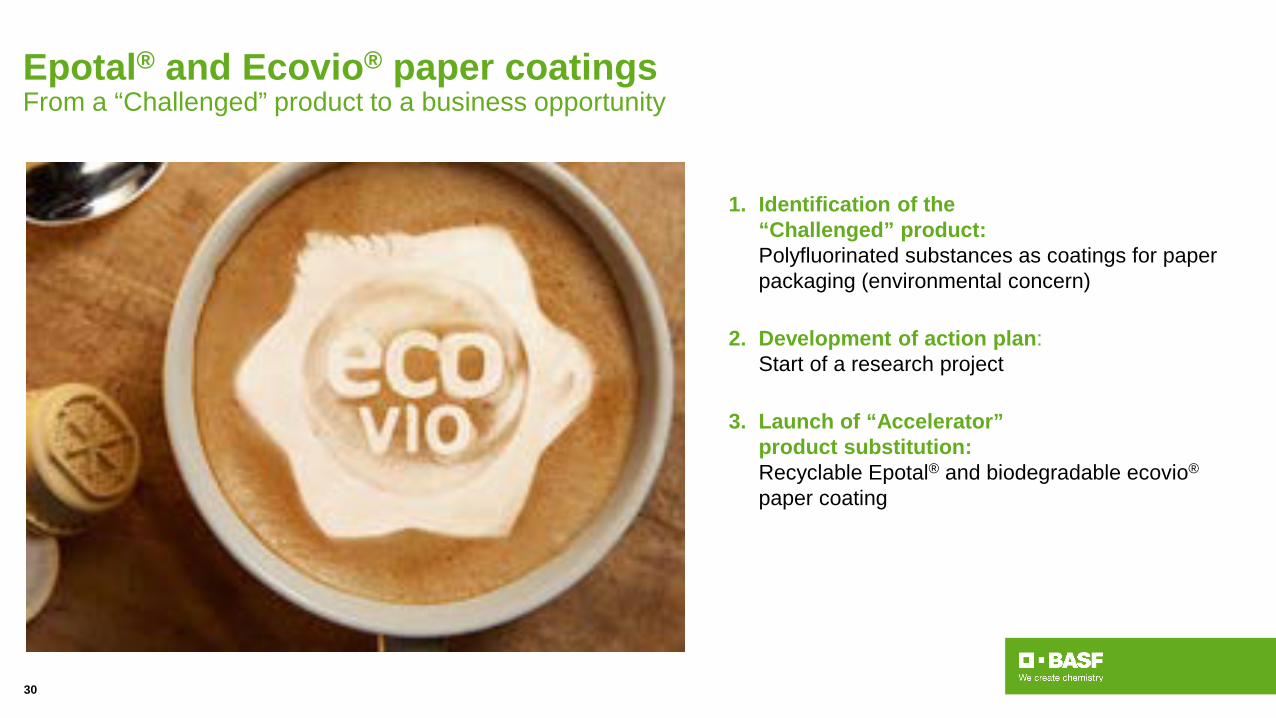
Epotal® and Ecovio® paper coatingsFrom a “Challenged” product to a business opportunity
1. Identification of the “Challenged” product: Polyfluorinated substances as coatings for paper packaging (environmental concern)
2. Development of action plan: Start of a research project
3. Launch of “Accelerator” product substitution: Recyclable Epotal® and biodegradable ecovio®
paper coating
30
31
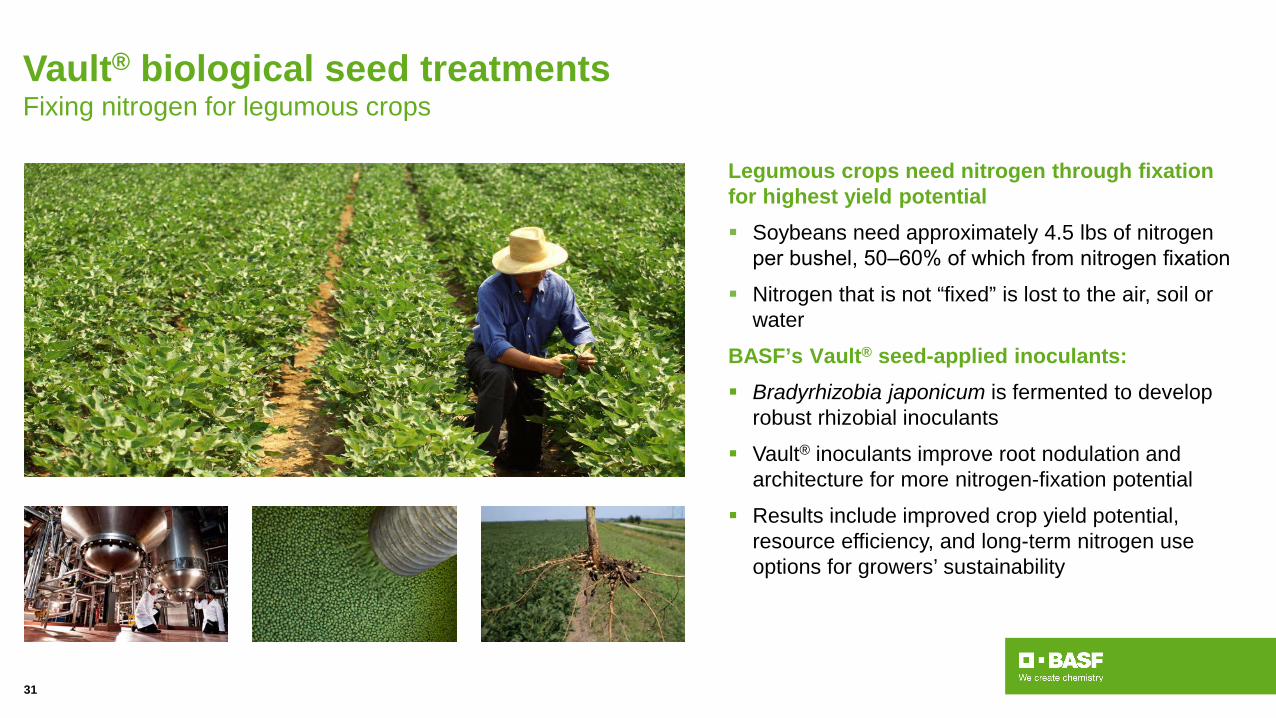
Vault® biological seed treatmentsFixing nitrogen for legumous crops
Legumous crops need nitrogen through fixation for highest yield potential Soybeans need approximately 4.5 lbs of nitrogen
per bushel, 50‒60% of which from nitrogen fixation
Nitrogen that is not “fixed” is lost to the air, soil or water
BASF’s Vault® seed-applied inoculants: Bradyrhizobia japonicum is fermented to develop
robust rhizobial inoculants
Vault® inoculants improve root nodulation and architecture for more nitrogen-fixation potential
Results include improved crop yield potential, resource efficiency, and long-term nitrogen use options for growers’ sustainability
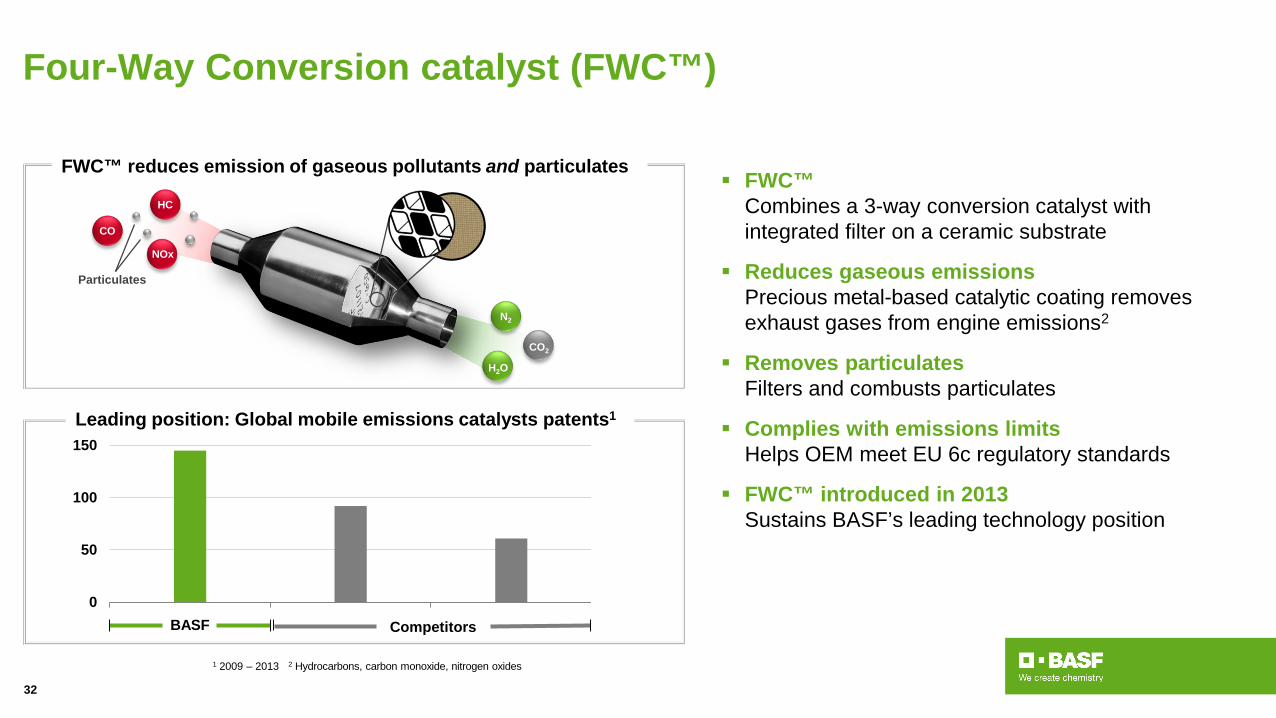
Four-Way Conversion catalyst (FWC™)
FWC™Combines a 3-way conversion catalyst with integrated filter on a ceramic substrate
Reduces gaseous emissionsPrecious metal-based catalytic coating removes exhaust gases from engine emissions2
Removes particulatesFilters and combusts particulates
Complies with emissions limitsHelps OEM meet EU 6c regulatory standards
FWC™ introduced in 2013 Sustains BASF’s leading technology position
1 2009 – 2013 2 Hydrocarbons, carbon monoxide, nitrogen oxides
0
50
100
150
BASF Competitors
Leading position: Global mobile emissions catalysts patents1
FWC™ reduces emission of gaseous pollutants and particulates
HC
CO
NOx
N2
H2O
CO2
Particulates
32

BASF SRI Story, November 2017 33