Embed Size (px)
Citation preview

If we do not take charge and do it, who will?
If we don't do it now, when can we?
-University of the Philippines
Student Slogan

All I really need to know I learned in Kindergarten.
Most of what I really need to know about how to live and what to do and how to be
I learned in kindergarten.
Wisdom was not at the top of the graduate-school mountain, but there in the sandpile at Sunday School.
These are the things I learned:
Share everything.
Play fair.
Don't hit people.
Put things back where you found them.
Clean up your own mess.
Don't take things that aren't yours.
Say you're sorry when you hurt somebody.
Wash your hands before you eat.
Flush.
Warm cookies and cold milk are good for you.
Live a balanced life--Iearn some and think some and draw and paint and sing and dance and play and work everyday some.
Take a nap every afternoon.
When you go out into the world, watch our for traffic, hold hands, and stick together.
Be aware of wonder.
--Robert Fulghum--
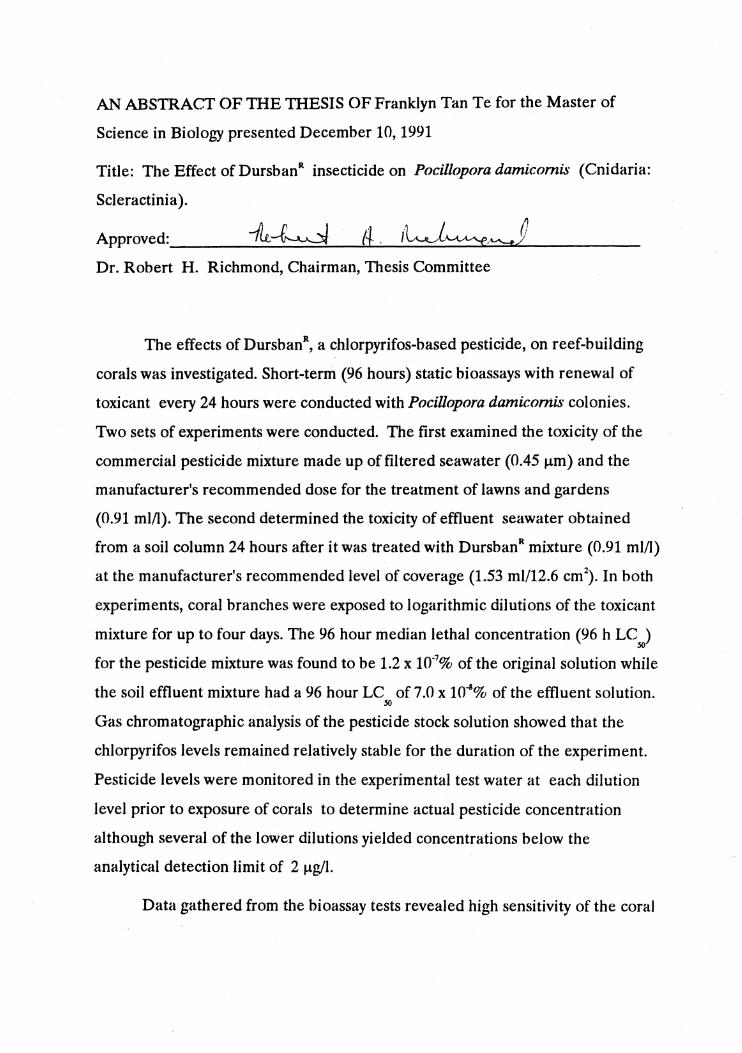
AN ABSTRACT OF THE THESIS OF Franklyn Tan Te for the Master of
Science in Biology presented December 10, 1991
Title: The Effect of DursbanR insecticide on Pocillopora damicomis (Cnidaria:
Scleractinia). I)
Approved: ____ -/&;-=-~_=_~___=...::::.!.___.l:.{±.l...' ,;"... . ....:.(~..:.......::...6_-J..:.:,,~..::::::s:..:;.}_/ ___ _
Dr. Robert H. Richmond, Chairman, Thesis Committee
The effects of DursbanR, a chlorpyrifos-based pesticide, on reef-building
corals was investigated. Short-term (96 hours) static bioassays with renewal of
toxicant every 24 hours were conducted with Pocillopora damicomis colonies.
Two sets of experiments were conducted. The first examined the toxicity of the
commercial pesticide mixture made up of filtered seawater (0.45 !-lm) and the
manufacturer's recommended dose for the treatment of lawns and gardens
(0.91 mIll). The second determined the toxicity of effluent seawater obtained
from a soil column 24 hours after it was treated with DursbanR mixture (0.91 mill)
at the manufacturer's recommended level of coverage (1.53 m1112.6 cm2). In both
experiments, coral branches were exposed to logarithmic dilutions of the toxicant
mixture for up to four days. The 96 hour median lethal concentration (96 h LC ) 50
for the pesticide mixture was found to be 1.2 x 10.7% of the original solution while
the soil effluent mixture had a 96 hour LC of 7.0 x 10⁻⁸% of the effluent solution. 50
Gas chromatographic analysis of the pesticide stock solution showed that the
chlorpyrifos levels remained relatively stable for the duration of the experiment.
Pesticide levels were monitored in the experimental test water at each dilution
level prior to exposure of corals to determine actual pesticide concentration
although several of the lower dilutions yielded concentrations below the
analytical detection limit of 2 flgll.
Data gathered from the bioassay tests revealed high sensitivity of the coral
Pocillopora damicomis to the two toxicant preparations. The soil effluent water
was appreciably more toxic to the coral than the straight pesticide mixture. This
was thought to reflect formation of more toxic breakdown products derived from
chlorpyrifos after application to the soil column. Other factors, like the
interactive effects between the chemical binders and dispersants within the
commercial formulation and the soil may have contributed to the increase in
toxicity of the soil effluent solution. Effluent water from pesticide-treated areas
may be more toxic to corals than previously suspected.
The Effect of DursbanR insecticide on Pocillopora damicomis
( Cnidaria: Scleractinia)
by
FRANKLYN TAN TE
A thesis submitted in partial fulfillment of the requirements for the degree of
MASTER OF SCIENCE
IN
BIOLOGY
University of Guam
December 1992

TO THE OFFICE OF GRADUATE SCHOOL AND RESEARCH
The members of the Committee approve the thesis of Mr. Franklyn Tan Te presented December 10, 1991.
. ~R:;:::::rurm~ 7' Stephen G. Nelson, Member
lIse Schreiner, Member
ACCEPTED:
~/ ./ ,
~' I3aViiesp·~ ~ Date Dean, Graduate School and Research

Acknowledgements
Sincere appreciation is due to Robert Richmond, Paul Jokiel, Donald Crosby, David Krupp, Stephen Nelson, Charles Birkeland, Gary Denton, John Lacson, Ernest Matson, Evelyn Cox and Ilse Schreiner for their critical comments, constructive suggestions and patience in reviewing the manuscript.
Special thanks are due to Valerie Paul, Steven Amesbury, Richard Randall, Barry Smith, David Hopper, Karen Meyer, Kazuhiro Sonoda, Daniel Norris, Rick Wood, and Andrew Sergio Quenga for their continued encouragement and lively discussions. Herling Sanger was responsible for the author's adjustment to life in Guam and is esoterically thanked.
Heartfelt gratitude is due to Jeri Fox, Mark Hamilton, Larry Meyer, Alan Holzgrafe, Alexander Kerr, Steven Lock, Joni Quenga-Kerr, Suzanne Wilkins, Mike Wilkins and Grace Paloma who shared their time during the numerous activities that opened new horizons for the author.
Wholehearted thanks are due Joanne Collins, Priscilla Martinez, Fernando Rivera, Rosanna Yoon, Lena Quinata and Arlene Pangelinan who were indispensable companions that took up the slack and allowed the author to work more readily on this study.
Genuine recognition is due to Richard Sakamoto, Elburn Irish, Mark Rogers, Shelley Rogers and Chris Bassler who contributed much to the logistics and experimental design of this study in Guam. Sincere thanks are due to Karl Yanagihara and Linda Groves for their skill, time and patience in getting the gas chromatograph to run properly and for analyzing the samples in Hawaii.
Earnest appreciation is due to Marie Peredo, Angie Duenas, Rose Muna and Thelma Sarmiento who endured numerous inquiries and were essential to the finalization of the manuscript. Thanks are also due Lloyd Watarai, Annette Chang, Cindy Flynn, Edna Mukai, Lucia Keane and the rest of the very helpful and friendly staff of the Hawaii Institute of Marine Biology.
Many joyful moments were provided by Skyler Matson, Aja Matson and Lindsey Spiers. Fleabag, Bimbo, One-Z, Autumn Leaf, Seabreeze and Moonbeam made things more enjoyable and less tiresome.
This work is dedicated to the author's parents, Lupo Te and Nancy Tan Siu Tin, whose unending concern and encouragement made all things possible; and to the author's sister, Elizabeth,whose continued correspondence and thoughtfulness made life worth living this many miles away from home.
This study was supported in part by the Kaneohe Bay Research Fund (UHF#13-480-0) and by the National Institutes of Health (S06GM44796-0l).

Table of Contents
List of Tables ................................................................................................. .
List of Figures...................................................... ............ ........... ..... .... ........... II
Introduction...................................................................................................... 1
Materials and Methods Test Organism....................................................................................... 3 Quantification of Mortality in Corals.................................................. 3 Pesticide Stability in Seawater.............................................................. 3 Baseline Toxicity Tests.......................................................................... 7 Soil Effluent Toxicity Tests................................................................... 9 Estimation of the Lethal Concentration (LC ).................................... 10
50
Results Pesticide Stability in Seawater.............................................................. 12 Baseline Toxicity Tests.......................................................................... 12 Effluent Toxicity Tests.......................................................................... 15
Discussion Pesticide Stability in Seawater .............................................................. 19 Bioassay Tests......................................................................................... 21 Problems Encountered and Possible Errors......................................... 23
Summary............................................................................................................ 23
References......................................................................................................... 25
Appendi ces.. ................. ............ ..... ............. ....... .......... .... .... ..... ................... ... ... 28
List of Tables
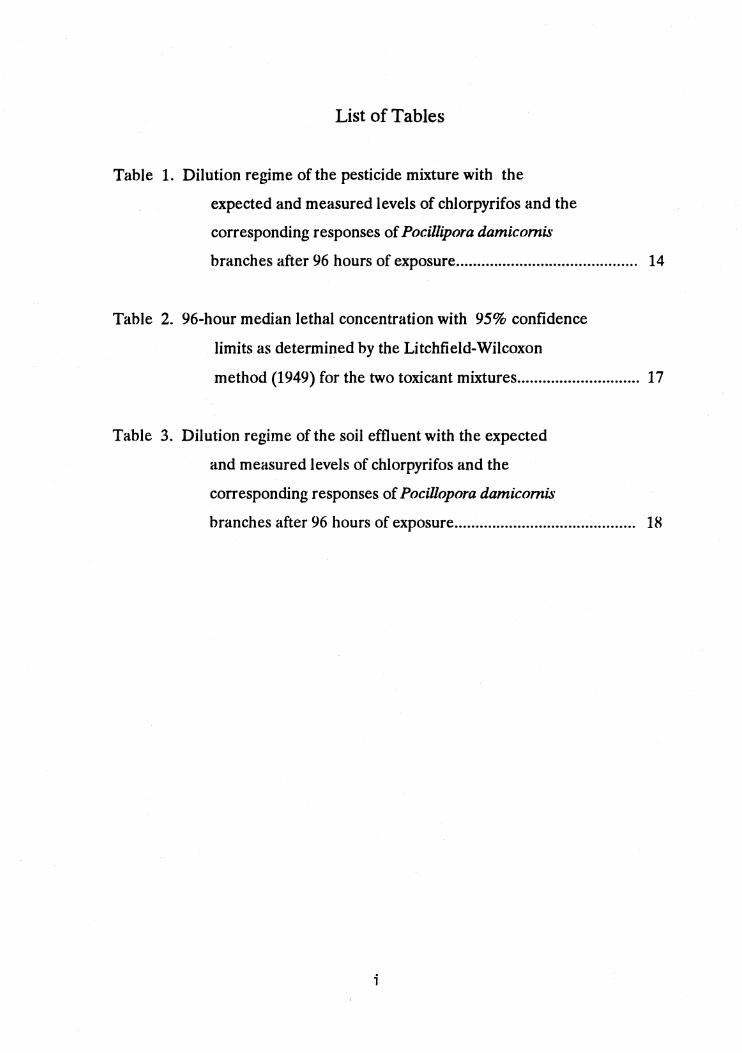
Table 1. Dilution regime of the pesticide mixture with the
expected and measured levels of chlorpyrifos and the
corresponding responses of Pocillipora damicomis
branches after 96 hours of exposure........................................... 14
Table 2. 96-hour median lethal concentration with 95% confidence
limits as determined by the Litchfield-Wilcoxon
method (1949) for the two toxicant mixtures............................. 17
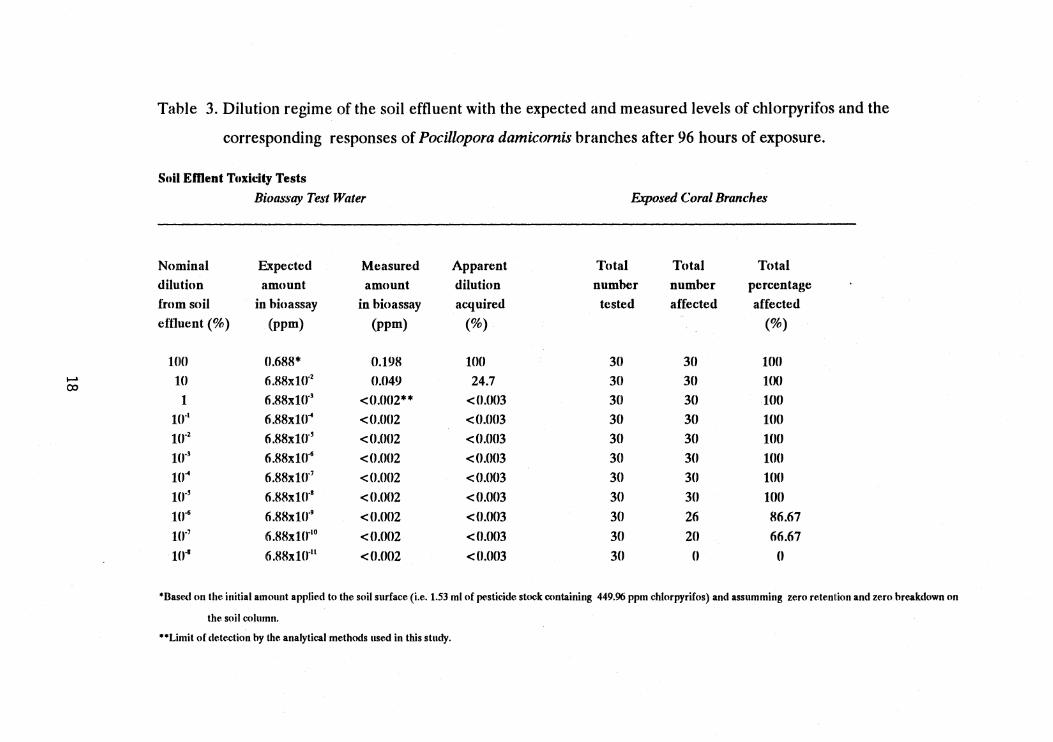
Table 3. Dilution regime of the soil effluent with the expected
and measured levels of chlorpyrifos and the
corresponding responses of Pocillopora damicomis
branches after 96 hours of exposure........................................... 18
i
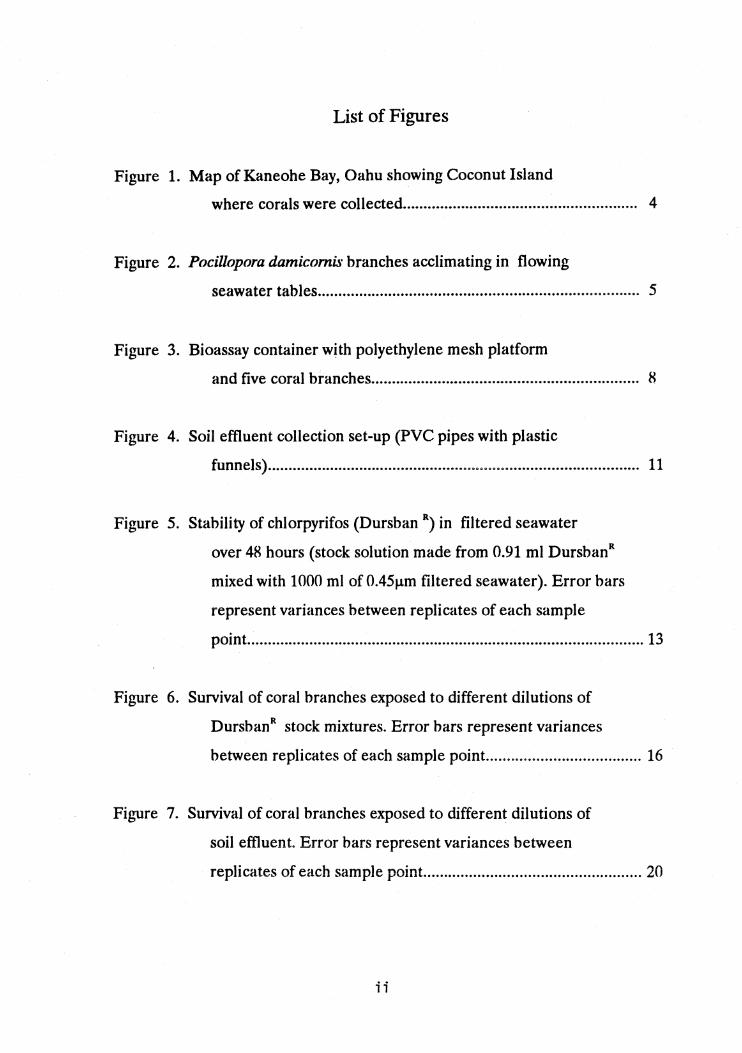
List of Figures
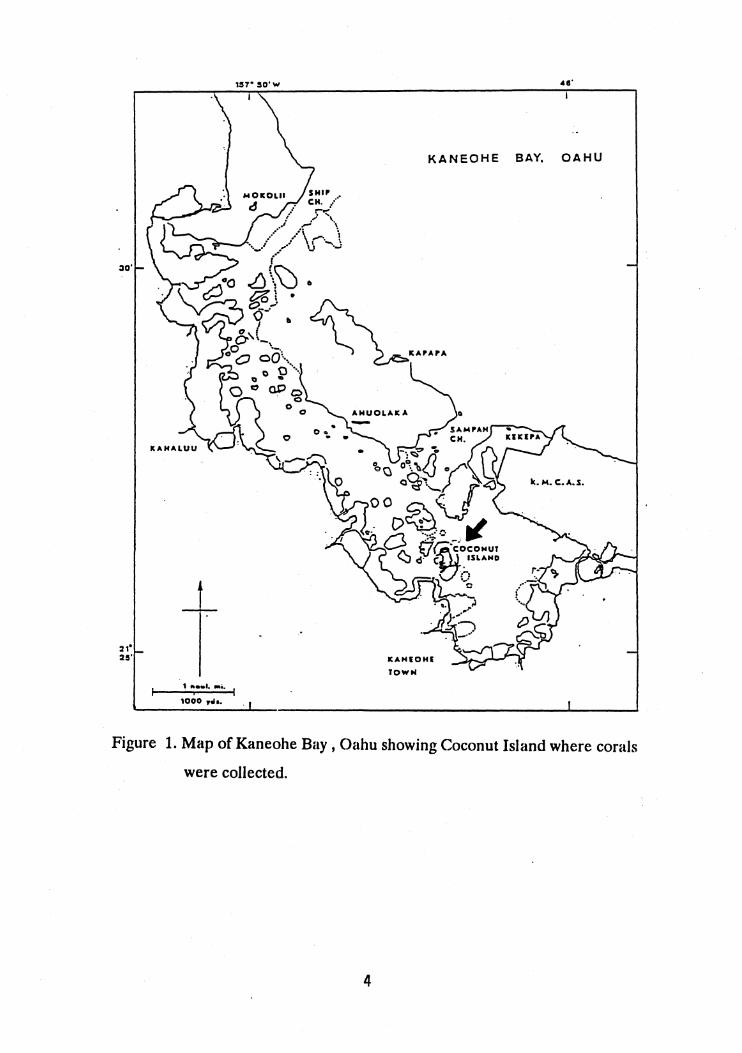
Figure 1. Map of Kaneohe Bay, Oahu showing Coconut Island
where corals were collected........................................................ 4
Figure 2. Pocillopora damicomis branches acclimating in flowing
seawater tables............................................................................. 5
Figure 3. Bioassay container with polyethylene mesh platform
and five coral branches................................................................ 8
Figure 4. Soil effluent collection set-up (PVC pipes with plastic
funnels) ......................................................................................... 11
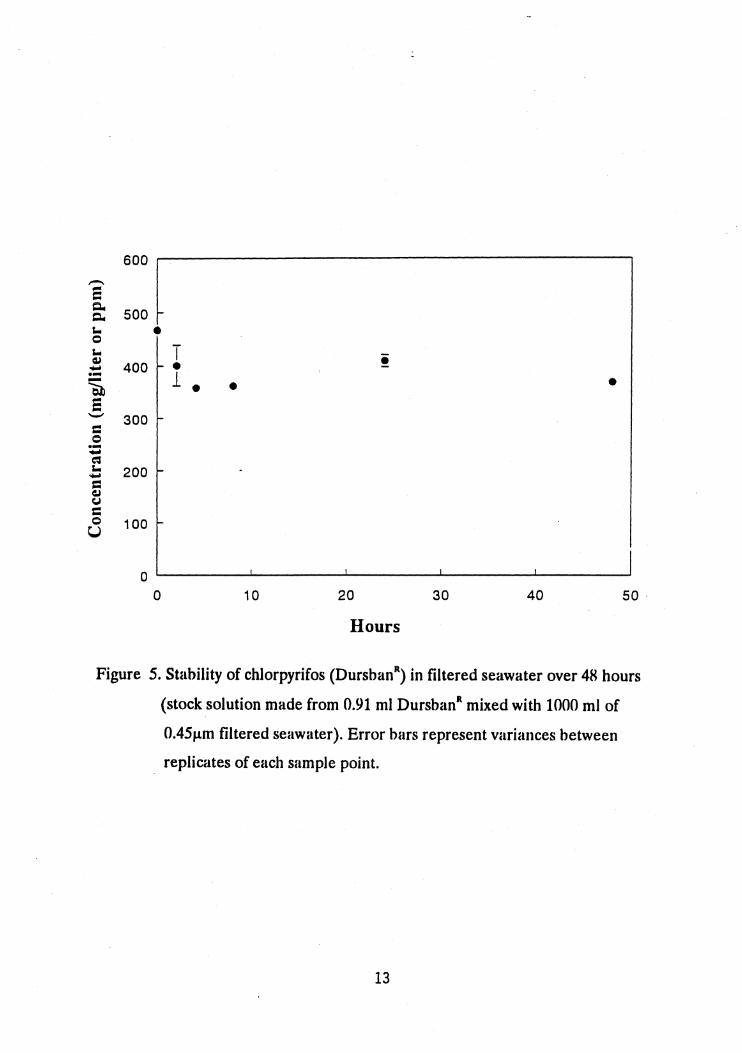
Figure 5. Stability of chlorpyrifos (Dursban R) in filtered seawater
over 48 hours (stock solution made from 0.91 ml DursbanR
mixed with 1000 ml of 0.45f.1m filtered seawater). Error bars
represent variances between replicates of each sample
point. .............................................................................................. 13
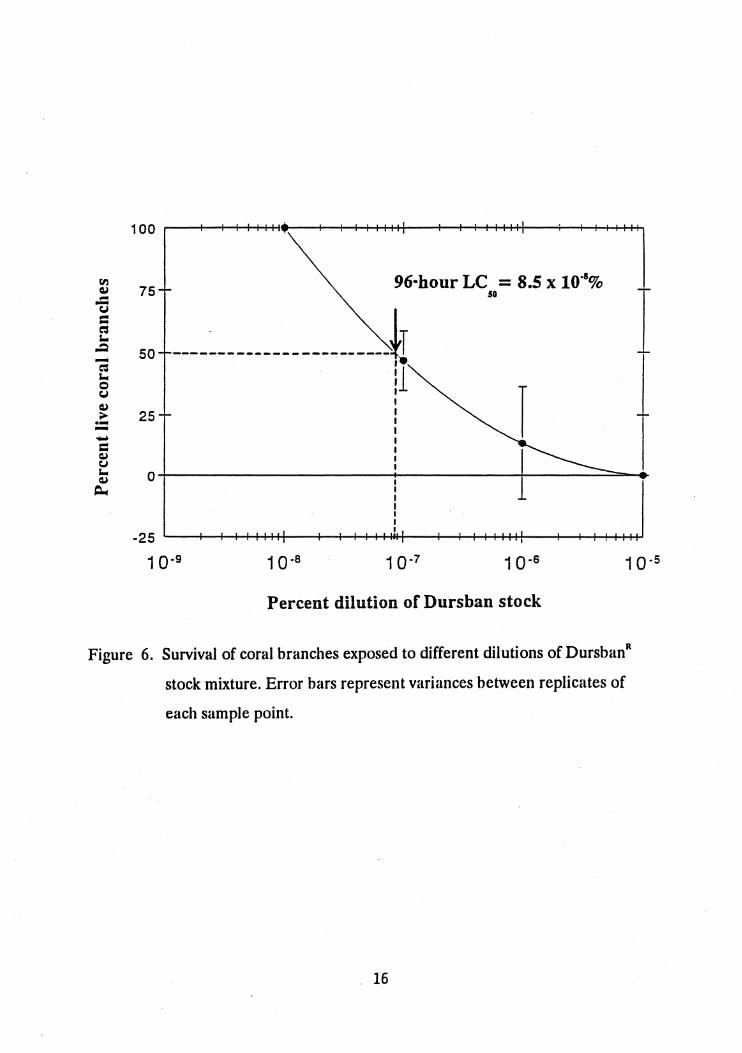
Figure 6. Survival of coral branches exposed to different dilutions of
DursbanR stock mixtures. Error bars represent variances
between replicates of each sample point. .................................... 16
Figure 7. Survival of coral branches exposed to different dilutions of
soil effluent. Error bars represent variances between
replicates of each sample point. ................................................... 20
ii

Introduction
Coral reefs are among the most productive ecosystems in the world and
are economically valuable resources for tropical island nations (Gomez, 1988;
McManus, 1988; Erez, 1990). However, pollution of coasts and nearshore areas
stemming from the continued increase in human population and impact has
contributed to the decline in abundance and diversity of organisms on coral reef
areas (Gomez, 1988; Rogers, 1990; Grigg and Dollar, 1990). Sedimentation,
sewage pollution and chemical contamination are but a few of the more
noticeable causes of coral reef degradation around the world (Chansang, 1988;
Hodgson, 1989; Gomez et aI., 1990).
One of the important issues regarding pollution of coasts and coral reefs
has been the effects of pesticides and other chemicals in runoff water (Gomez,
1988; Glynn et aI., 1984; Glynn et aI., 1986; Glynn et aI., 1989). Several studies
have shown that pesticides are present in runoff water and persist in nearshore
areas, embayments and water catchment areas (Hughes et aI., 1980; Thoma,
1989). With the continued increase of pesticide usage due to expanding
agricultural activities, the boom in golf-course construction, and the growth of
housing projects, the risk of nearshore contamination and coral reef destruction is
of major concern.
DursbanR is one of the more common pesticides readily available in
hardware stores and gardening supply centers in many urbanized area (Racke, in
press). Its use in many industrialized countries has increased rapidly over the last
15-20 years since chlordane and heptachlor were banned. For example, in Guam,
the use of DursbanR grew from 17.5 gallons in 1986 to 1,356 gallons in 1988
(Guam EPA unpublished records). DursbanR is a broad spectrum
organophosphate insecticide that is used primarily against termites and a wide
range of lawn insect pests. Chlorpyrifos (O,O-diethyl O-(3,5,6-trichloro-2-pyridyl)
phosphorothioate), the active ingredient in DursbanR (Hotchkiss and Gillett,
1
1987; USEPA 1987; Racke, in press) has been found to be toxic to aquatic
organisms with 96 hour LC values ranging from 0.01 J.Lg/l for saltwater shrimps so
to 1,911 J.Lg/l for oysters. The persistence of this chemical varies depending on
temperature, pH and substrate type (Kuhr and Tashiro, 1978; Meikle and
Young, 1978; Miles et al. 1979; Miles et aI., 1983; Elhag et aI., 1989). After an
extensive review of all available information on chlorpyrifos, none is yet available
regarding the persistence of this chemical in seawater (Racke, in press). Studies
most relevant for comparison to the marine environment have been performed
on estuarine waters and salt marshes (as reviewed by Racke, in press). A major
concern is how this pesticide affects corals, especially the nearshore species like
Pocillopora damicomis, which would be one of the first organisms affected by
pesticide contaminated runoff.
The main goal of this study was to determine if DursbanR, in its
commercial application dose, is toxic to the coral Pocillopora damicomis. The
second goal was to determine if percolated water from pesticide-treated soils is
toxic to the coral. To achieve these goals, three sets of experiments were
established. First, DursbanR dissipation in seawater was monitored for 48 hours
to determine the persistence of the pesticide formulation in seawater. This
experiment would then establish the renewal regime for the bioassays in the two
succeeding experiments. Second, a baseline toxicity test using the recommended
application dose of DursbanR for the treatment of lawns and gardens was
conducted on branches of Pocillopora damicomis corals. Third, a soil-effluent
toxicity test was run to determine if percolated water from pesticide treated soils
is toxic to the coral.
2
Materials and Methods
Test Organism
Fifteen colonies of Pocillopora damicomis with an average diameter of 10
centimeters were collected from the reefs flats of Coconut Island, Kaneohe,
Hawaii (Figure 1). These coral colonies were allowed to acclimate in flowing
seawater tanks (20 gallon volume) that were kept in the shade. Five-centimeter
branches were then clipped from these colonies, pooled together and allowed to
recuperate for two weeks prior to being used in the toxicity tests (Figure 2).
Coral branches were then randomly chosen and carefully placed in the bioassay
containers. These branches were allowed to acclimate in the bioassay containers
for 2 hours prior to commencing the toxicity tests.
Quantification of Mortality in Corals
Most toxicity tests use death of the test specimen as the end point of
reaction to a toxicant. This does not readily apply to corals due to their colonial
structure. Nevertheless, this study adopted the concept of a branch being an
"individual", with five branches per replicate representing a, "group" of individuals
per test solution. Death of the coral "individual" was considered as total tissue
loss per branch after 96 hours. Therefore, one dead "individual" represented 20%
mortality of the group and the average percent mortality per replicate was
determined after 96 hours. No partial mortalities per individual branch were
considered during this set of experiments.
Pesticide Stability in Seawater
The toxicity tests employed during the present study were of a static
nature and involved changing the test water periodically. To determine the
3
30'
:11· 25'
1Sr" so· w
t ...... Mi.
1000 ••••
KANEOHE BAY. OAHU
o
,
~ .... " o
Figure 1. Map of Kaneohe Bay, Oahu showing Coconut Island where corals
were collected.
4
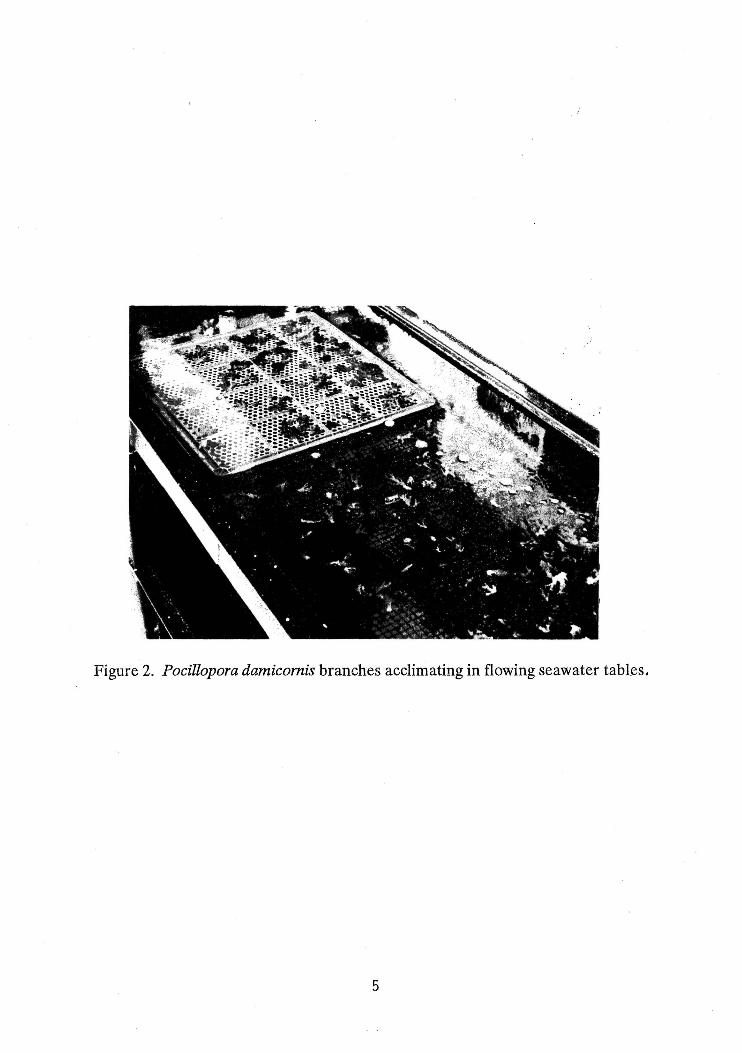
Figure 2. Pocillopora damicomis branches acclimating in flowing seawater tab1.es.
5
stability of chlorpyrifos in seawater, a stock suspension of DursbanR, equivalent to
the manufacturer's recommended dose for the treatment of lawns and gardens
(0.91 ml ofDursbanR pesticide,Ortho-KlorR brand, per liter of water) was made
up with two liters of filtered seawater (0.45 JIm) and divided equally into two
borosilicate glass containers similar to those used in the bioassay experiments. A
15-ml sample was collected using a 20-ml glass syringe at mid-water level from
each container at 0, 2, 4, 8, 24 and 48 hours after stock preparation. The samples
were immediately injected into methanol-activated C18 "Sep-pak" cartridges .
(solid-phase extraction) at a rate of about 1 ml/min to extract the pesticide
compound. The efficiency of thi& method, with respect to recovery of pesticide
from spiked aqueous samples was about 90-95% (Groves, Crosby and
Yanagihara, pers. comm). The "loaded" cartridges were then eluted with 10 ml of
reagent grade acetone into clean reseal able glass test tubes. The eluted solutions
were milky white and flocculent due to seawater salt precipitation by the
acetone. To remedy this problem, the eluted samples were aspirated through
Pasteur pipettes loaded with sodium sulfate on a glass wool plug. The "cleaned"
samples were then stored in a refrigerator at 15°C prior to gas chromatographic
analysis conducted by Miss Linda Groves and Mr. Karl Yanagihara at the
Environmental Biochemistry Department at the University of Hawaii (Manoa).
A Hewlett-Packard (HP) 5890A gas chromatograph was used for the gas
chromatographic (GC) analysis of the test mixtures. The "cleaned" samples were
loaded onto a HP76731 automatic sample loader and 2-JlI aliquots of the sample
were injected onto a HP7673A gas chromatograph controller through a HP5
capillary column (10m x 0.53mm x 2.65J1). The oven temperature was set at
100°C, gas flow rate was at 10.0 ml!min and the GC unit had a flamephotometric
detection sensor set at 1000e with a holding duration of 1 minute. Resulting data
were integrated and printed out on a HP3396A data integrator. Standards were
run before and after every sample to monitor machine drift and ensure proper
6
calibration. During the experiment, the pesticide stock suspension was kept in a
flowing seawater bath maintained at 25°C with ambient light level of 633 flE/s/m2
measured at 10:00 A.M. daily. The pH of the pesticide suspension was around 8,
while the salinity was constant at 34 °/00.
Baseline Toxicity Tests
Logarithmic serial dilutions (100% to l.Ox10"'%) of the pesticide DursbanR
(Ortho-klor brand containing 12.6% active ingredient chlorpyrifos) were
prepared with fresh, filtered seawater (0.45 flm). The stock mixture (designated
as 100%) was based on the recommended application dose for the treatment of
lawns and gardens (0.91 ml per liter of water) as used in the earlier experiment.
Six (6) replicate tests per concentration of the pesticide solution were established
with five (5) live branches (5 cm length,S ml volume per branch) of Pocillopora
damicomis per replicate. Dilutions were made by pi petting the appropriate
amount from the pesticide stock emulsion into a 1000-ml glass jar (previously
washed with methanol and distilled water) and diluting to 1000 ml with filtered
seawater (e.g., 100 ml of stock emulsion diluted up to 1000 ml equals 10%
dilution; 10 ml from the stock diluted to 1000 ml equals 1 % dilution, and so
on ... ). It became apparent during the dilution process that the pesticide mixture
remained as a suspension even after several attempts of vigorous mixing.
Moreover, noticeable cloudy-white layers were also visible and were impossible
to remove by vigorous agitation. The apparent drawbacks of this condition will be
discussed in later sections.
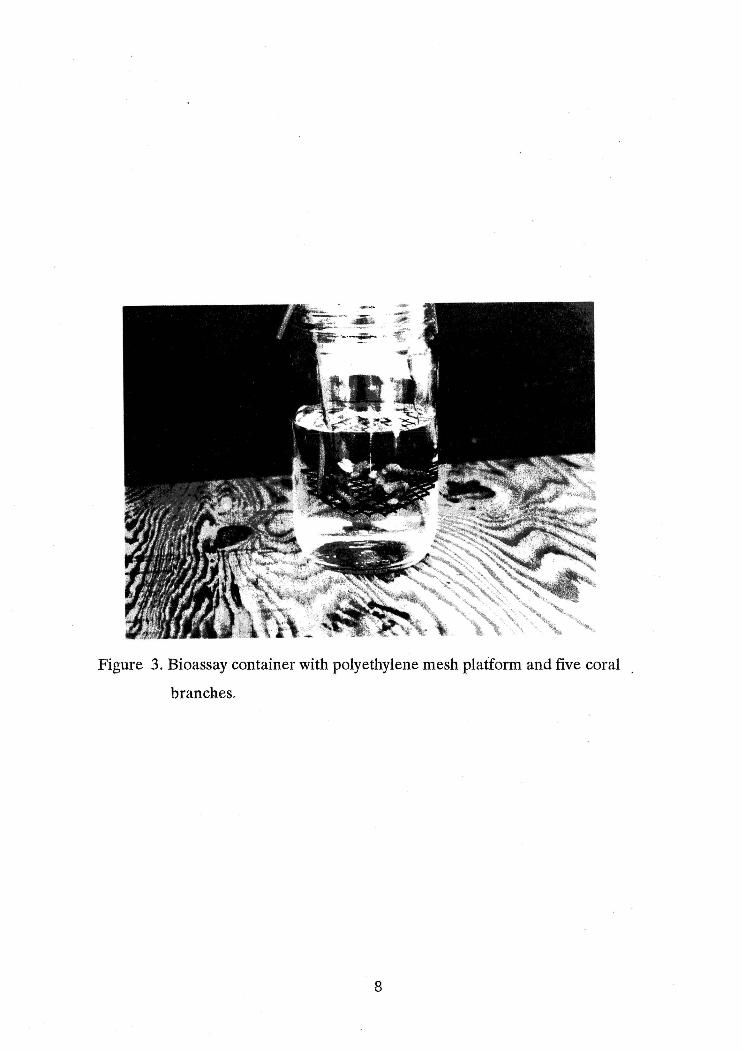
The coral branches were elevated (ca. 5 cm) from the bottom of the glass
containers with a polyethylene mesh platform (Figure 3) to prevent
accumulation of debris and contact with the bioassay container. The controls
were established with filtered seawater and corals only. All containers were kept
7
- , .. ;; .~.
,_ ............ ~
Figure 3. Bioassay container with polyethylene mesh platform and five coral
branches.
8
in flowing seawater tanks under a shade. Observations for total tissue loss and
other reactions were made at regular intervals for 96 hours and test suspensions
were renewed every 24 hours with freshly prepared pesticide suspensions. The
renewal procedure involved transferring the corals from the original containers to
new ones. Specifically, the corals were lifted from the old test suspension
containers via the mesh platform and transferred to new jars containing freshly
made test suspensions.
The pH, salinity, temperature, ambient light, and dissolved oxygen per test
container (total of 6 per dilution level) were recorded before the start of the
exposure to the coral branches, midway through the experiment and at
termination of the bioassays after 96 hours.
Water samples for gas chromatographic analysis were randomly
collected from two of the six replicate bioassay containers at each dilution level
prior to exposure of the coral branches. The sampling and analytical procedures
were identical to those outlined in the previous section. In addition, sample
concentrations were determined by comparing peak areas (100%-1 % dilutions)
and peak heights « 1 % dilutions) with appropriate standards. The
chromatograms showed flat baselines with no other interfering peaks.
The detection limit of the GC unit was approximately 50 Ilg!l (ppb). To
achieve greater sensitivity at the lowest dilution levels of the test solutions, the
injection volume of the test samples was increased to 4 III and the attenuation
factor was reset to level 4 from a normal level of 6. Baseline stability of the
chromatogram outputs were not appreciably affected, and a detection limit of
about 2 Ilg!l was achieved.
Soil Emuent Toxicity Tests
Soil was collected from a garden plot on Coconut Island, Kaneohe with a
9

steel shovel and sieved through a < 1mm pore diameter stainless steel mesh. The
sieved soil was then hand-compacted into four 30 cm long PVC pipes of four cm
diameter. Polyethylene funnels lined with filter papers were place on one end of
the PVC pipe to prevent the soil from coming out (Figure 4). Total length of the
soil column was 26 cm. The surface area of the PVC pipe was calculated to be
0.013 fe (12.6 cm2). In accordance with the manufacturer's guidelines, the
appropriate amount of pesticide stock suspension (1.53 ml) was sprayed onto the
soil using a hand-held sprayer.
The treated soils were allowed to stand, undisturbed in the shade, for 24
hours with the assumption that all volatile petroleum solvent carriers would
evaporate during this time. Mter the 24-hour period, unfiltered seawater (1000
ml) was sprinkled into the PVC pipes and the resulting effluent water collected
and used as the stock solution for the effluent toxicity tests. Similar dilution
procedures, experimental protocols and water sampling procedures used for the
baseline toxicity tests were followed in this set of experiments. The control group
followed similar experimental procedures but received soil effluent water from
non-pesticide treated soil.
Estimation of the Lethal Concentration (LC ) 50
A semi-logarithmic plot of the survival data versus the appropriate dilution
level for both the pesticide suspension and the soil effluent solution was initially
done to get a range estimate of the 96-hour median lethal concentrations for
both toxicant mixtures and determine the shape of the toxicity curve (Peltier and
Weber, 1985). To get more accurate estimates of the 96-hour median lethal
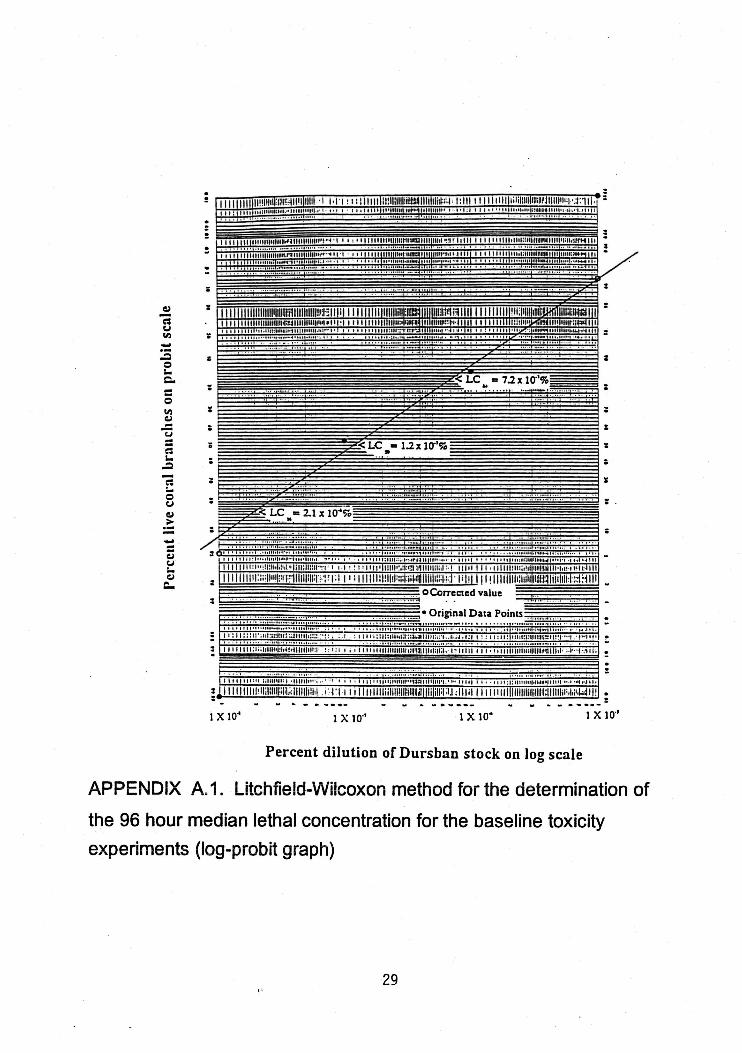
concentration, the Litchfield-Wilcoxon (1949) log-probit method was later used.
Briefly, this involved plotting the percent (%) mortality against the appropriate
test dilution on log-probability paper and fitting a line to the data points by eye.
10
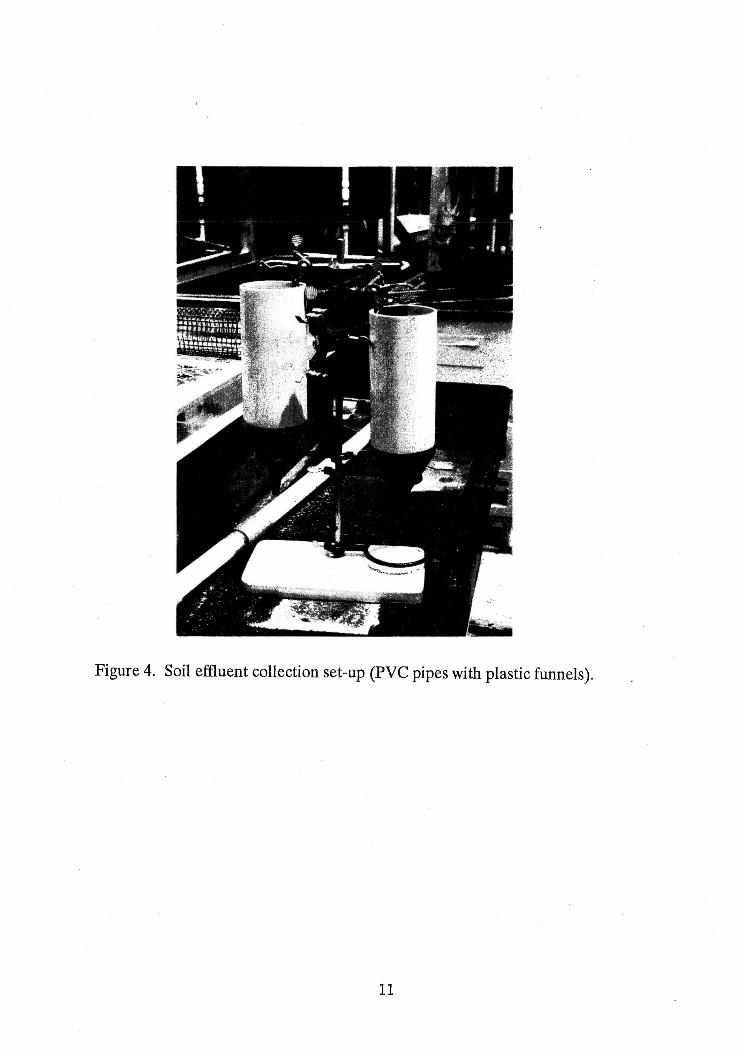
Figure 4. Soil effluent collection set-up (PVC pipes with plastic funnels) .
11
The corrected values, the corresponding LC ,the 95% confidence limits of the 50
LC ,the slope function "S" and its confidence limits were then derived by the 50
appropriate nomographic procedures discussed by Litchfield and Wilcoxon
(1949).
Results
Pesticide Stability in Seawater
The stability of chlorpyrifos in seawater is shown in Figure 5. Following an
initial decline, most likely due to the adsorption of chlorpyrifos onto the walls of
the glass containers, levels remained reasonably stable for the duration of the
experiment. These findings suggested that a 24-hour toxicant solution renewal
program proposed for the bioassays (A.P.H.A. et aI., 1989) would be more than
sufficient to maintain relatively constant test concentrations at each dilution level.
Baseline Toxicity Tests
The analytical method used in this study was not able to detect the actual
chlorpyrifos concentration at the lowest dilution level (Table 1). Furthermore, as
a result of the pesticide "layering effect" observed at all test dilutions, the actual
concentration measured was notably different from that expected (Table 1) and
bore little relationship to the dilution level. For these reasons, the precise median
lethal concentration could not be determined with any degree of satisfaction, and,
in the absence of more definitive data, toxicity estimates were based on nominal
dilution levels rather than on measured concentrations.
All corals died in test dilutions ranging from 100% down to the 1 x 10⁻⁵%
during the 4-day exposure period (Table 1). Totai tissue loss per coral colony
was the endpoint used. Initial reactions to the toxicant by the coral branches
12
600 -.. e Q.,
500 c.. r.. • 0 r.. T i ~
400 • -.- 1 - • • "C:b • e --= 300 0 .--~ r.. 200 -= ~ CJ
= 0 100 U
o ~--------~--------~--------~--------~--------~ o 10 20 30 40 50 .
Hours
Figure 5. Stability of chlorpyrifos (DursbanR) in filtered seawater over 48 hours
(stock solution made from 0.91 ml DursbanR mixed with 1000 ml of
0.451lm filtered seawater). Error bars represent variances between
replicates of each sample point.
13

...... ~
Table 1. Dilution regime of the pesticide mixture with the expected and measured levels of chlorpyrifos and the
corresponding responses of Pocillopora damicomis branches after 96 hours of exposure.
Pesticide Mixture Toxicity Tests
moassay Test Water
Nominal Expected
dililltion amount
from stock in bioassay
(%) (ppm)
100 115.2
10 11.5
1.15 10-1 1. 15x1O-1
10-2 1. 15xl0-2
10-' 1. 15xlO-'
10'" 1. 15xl0'" 10-' 1. 15x10-'
10"" 1. 15xlO"" 10-' 1.15xlO-' 10-1 1.15xlO-'
Measured
amount
in bioassay
(ppm)
449.96
36.76
9.32
1.61
0.35
0.25
0.09
0.04
0.02
0.006
<0.002*
*Limit of detection by analytical methods used in this study.
Exposed Coral Branches
Apparent Total Total Total
dilution number number percentage
acquired tested affected affected
(%) (%)
100 30 30 100
8.2 30 30 100
2.1 30 30 100
0.4 30 30 100
0.07 30 30 100
0.05 30 30 100
0.02 30 30 100
0.009 30 30 100
0.004 30 26 86.67
0.001 30 16 53.33
<0.0003 30 0 0

started with tentacle retraction, lethargic responses by the polyps to physical
contact with a dissecting probe and mucus secretion at the tenth hour of exposure.
Noticeable tissue sloughing was observed by the 24th hour in most of the
treatments and, eventually, death occurred (measured as total tissue lost). A
semilogarithmic plot of the percent survival data versus the appropriate dilution
factor is shown in Figure 6. From the smooth curve, the 96-hour LC was 50
estimated to be around 8.5 x 10"%. This value closely approximates a value of 1.2
x 10.7% estimated by the Litchfield-Wilcoxon nomographic procedure (Table 2,
Appendix A.l and A.2). The controls did not show any signs of stress or
moribundity after 96 hours.
The pH, salinity, temperature, ambient light, and dissolved oxygen in each
of the six replicate containers per test concentration were similar (see Appendix
B for full detailed summary of data. All the data represented average
measurements (3 sampling times) of means (6 replicates) for each
concentration ).
Emuent Toxicity Tests
The results of the soil effluent toxicity tests are summarized in Table 3.
Effluent dilutions from 100% down to 1 x 10⁻⁵% were found to cause 100%
mortality over a four-day period. Reactions to the effluent water ranged from
lethargic responses of the polyps to physical contact and mucus secretions in
most treatments by the 8th hour of exposure. Tissue-sloughing and death became
evident in most of the treatments past the 24th hour.
No mortalities were observed at the dilution of 1 x 10"%, and all the
controls remained healthy over this time. The pH, salinity, temperature, ambient
light and dissolved ox-ygen in each container per test concentration remained
relatively constant (see Appendix D). The toxicity curve representing dilutions 1 x
15
-~ s.. o CJ 4) ~ .-
100 r---+-~~~~'.~~--I~I~IHHII~19~11~6-.h-o-~ur+IL-1~c+I+I_~IIH~+I.-5--+XI-0~:-8~+~~I~141~"1
75 50 I 50 ------------------------~ :1 25
, , , , I , , I I
O~----------------------~----------~------~~~
-25 ~~~~+++H~~~~++~~~--~+++H~~~~~~
10-g 10-a 10-7 10-s 10-5
Percent dilution of Dursban stock
Figure 6. Survival of coral branches exposed to different dilutions of DursbanR
stock mixture. Error bars represent variances between replicates of
each sample point.
16

Table 2. 96-hour median lethal concentration with 95% confidence
limits as determined by the Litchfield-Wilcoxon method (1949) for the
two toxicant mixtures.
Pesticide Mixture Toxicity Tests
96-hour LC 7.2 x 10⁻⁷%* 84
95% confidence limits of the LC JO
96-hour LC 1.2 x 10⁻⁷% 50
Upper limit = 2.93 x 10⁻⁷%
96-hour LC 2.1 x 10""% Lower limit = 4.90 x 10⁻⁸% 16
Soil Emuent Toxicity Tests
96-hour LC 6.8 x 10⁻⁷% 84
95% confulence limits of the LC JO
96-hour LC 7.0 x 10⁻⁸% 50
Upper limit = 2.22 x 10⁻⁷%
96-hour LC 7.0 x 10⁻⁹% Lower limit = 2.20 x 10⁻⁸% 16
* All values are in terms of percentage dilution of the toxicant stock mixtures_
17
~ OJ
Table 3. Dilution regime of the soil effluent with the expected and measured levels of chlorpyrifos and the
corresponding responses of Pocillopora damicornis branches after 96 hours of exposure.
Soil Ement Toxicity Tests
Bioassay Test Water Exposed Coral Branches
Nominal Expected Measured Apparent Total Total Total
dilution amount amount dilution number number percentage from soil in bioassay in bioassay acquired tested affected affected
eftluent (%) (ppm) (ppm) (%) (%)
100 0.688· 0.198 100 30 30 100 10 6.88xlO-2 0,(149 24.7 30 30 100
1 6.88xl0-3 <0,(102" <0,(103 30 30 100 10-1 6.88xlO-4 <0.002 <0.003 30 30 100 10-2 6.88xHr' <OJ102 <0.003 30 30 100 10-3 6.88xHr6 <0.002 <0,(103 30 30 100 10-4 6.88xlO-' <0,(102 <0,(103 30 30 100 HI"' 6.88xHrI <0,(102 <0.003 30 30 100 10-6 '6.88xHr' <0.002 <0,(103 30 26 86.67 Hr' Ifi.88xlO-IO <0.002 <0,(103 30 20 66.67 10-1 16 .88x 10-11 <0,(102 <0,(103 30 0 (}
·nas~.(1 on the initial amount applied to the soil surface (Le_ 153 ml of pesticide stock containing 449_96 ppm chlorpyrifos) and assumming zero reteniion and zero bre-.akdown on
the soil ('.()hunn_
"Limit of detection by Ithe analytical methods used in this study_

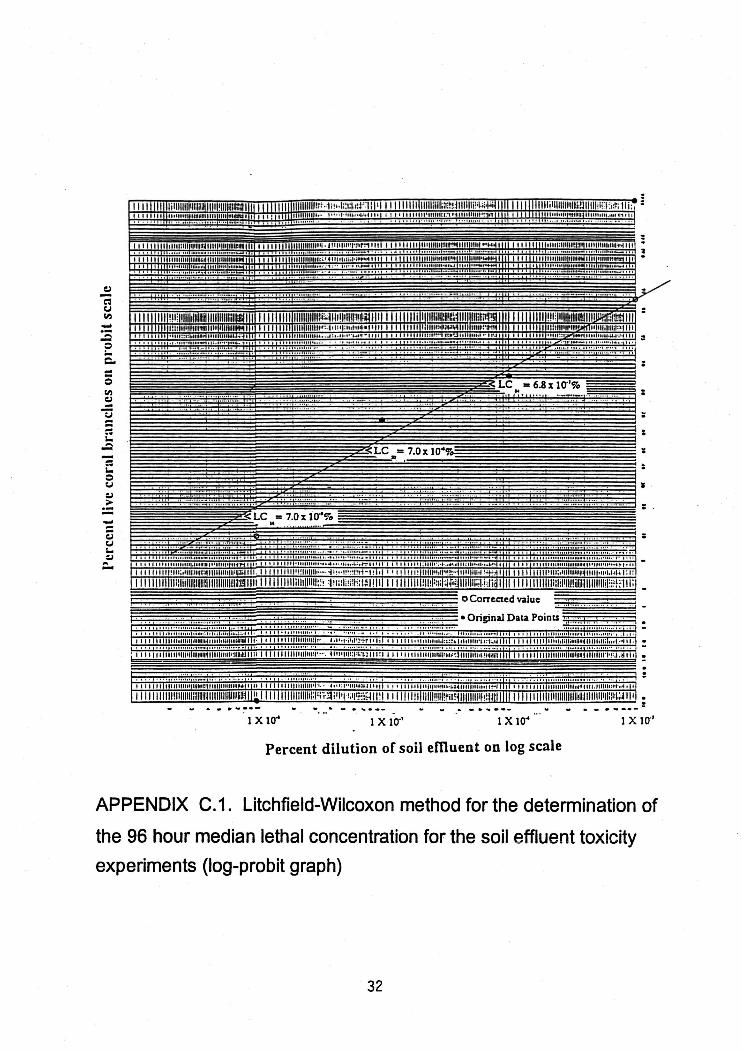
10.5% to 1 X 10'" % is shown in Figure 7. From this, an initial approximation of
the 96-hour LC was found to be 4.5 x 10"'% of the effluent mixture. A more 50
accurate estimate obtained by the Litchfield-Wilcoxon method showed the 96-
hour LC to be 7 x 10"'% ( see Table 2 and also Appendix C.1 and C.2 for 50
detailed calculations). It will be noted that these critical dilutions were in fact
very close to those obtained during the baseline toxicity experiment. However, if
we assume that all of the pesticide (688 J..I.g) applied to the soil column in 1.53 ml
of stock suspension was eluted in 11iter of seawater, levels of chlorpyrifos in the
soil effluent water would have been 654 times lower than the original stock
suspension for any given level ofdilution. Clearly then, the effluent water from
pesticide treated soil was appreciably more toxic to corals than the original stock
suspension.
Discussion
Pesticide Stability in Seawater
This study determined that commercial formulations of DursbanR mixed
with filtered seawater resulted in virtually no loss of the active ingredient,
chlorpyrifos, over a 48-hour period. The slight initial decline (Figure 5) most
likely reflected the adsorption of the chlorpyrifos to the walls of the glass
containers used in the bioassays (Denton, pers. comm.). Upon saturation of these
adsorption sites, no further losses were observed for the duration of the
experiment. The stability of chlorpyrifos in seawater was surprising in view of the
its normally short half-life under alkaline conditions (Hotchkiss and Gillett,
1987). However, many other studies that have found long hydrolytic half-lives
(29-72 days) for chlorpyrifos under various experimental conditions on land and
in estuarine systems (Meikle and Youngson, 1978; Racke, in press). To date, this
19

-~ ~ o CJ CJ > .--.....
75 96·hour LC = 4.5 x 10.1% 50
50 ------------------* . !~T I
25 1
o+-------------------~~--------------~------~==~
-25 ~~r-~_HH+H_--~~~~~--_+_+~++~~--~+_~~~
10-9 10.8 10.7 10.6
Percent dilution of soil effiuent
Figure 7. Survival of coral branches exposed to different dilutions of soil
effluent. Error bars represent variances between replicates of each
sample point.
20
10.5

is the only data set available with regard to the persistence of chlorpyrifos in
seawater.
Bioassay Tests
The commercial pesticide formulation, DursbanR , was found to be
extremely toxic to Pocillopora damicomis. Approximately one ten millionth of the
manufacturer's recommended level of dilution for the treatment of lawns and
gardens was sufficient to kill 50% of the test organisms over 4 days. The
chlorpyrifos concentration at this level of dilution was around 6 f.1g/l.
Acute and chronic toxicity criteria for chlorpyrifos recommended by the
USEPA for the protection of marine life is 0.011 and 0.0056 f.1g/l, respectively
(USEPA, 1987). Loosely translated, this means that short-term fluctuations of
chlorpyrifos in marine waters should not exceed 0.011 f.1g/l while long term
average should not exceed 0.0056 f.1g/l if the integrity of the marine environment
is to be protected.
Notwithstanding the analytical uncertainties mentioned earlier,
chlorpyrifos concentrations at the 96-hour LC level of dilution were some 500 .50
times higher than the acute toxicity criteria and over 1000 times higher than the
chronic toxicity criteria. This would imply that the USEPA standards afford
adequate protection against chlorpyrifos in marine waters, at least for Pocillopora
damicomil'.
Unfortunately, these standards do not adequately account for any toxicity
enhancement processes that may occur in the field as a result of interactions
between chlorpyrifos and various environmental components. This was clearly
demonstrated during the present study when effluent water from chlorpyrifos
treated soil column was found to be appreciably more toxic than the original
commercial formulation. In fact, based on the dilution factors alone, the toxicity
21
of the soil effluent water was at least 600 times more toxic than the pesticide
stock solution. The increase in toxicity of the soil effluent despite having lower
chlorpyrifos concentrations can be due to either one or both of the following ..
reasons: First, the by-products of chlorpyrifos as it reacts in the soil and seawater
may be more toxic to the coral than the chlorpyrifos solution alone. For example,
Allender and Keegan (1991) stated that 3,5,6-tricholo-pyridinol, a breakdown
product of chlorpyrifos, was more toxic to Holstein cattle than the chlorpyrifos
itself. Second, the chemical dispersants, binders and other components in the
commercial formulation, may have reacted with other substances in the soil to
produce highly toxic components to the coral. Although the identity of these
components was not determined during the present study, it is pertinent to note
that Glynn et al. (1986) found the dispersant Tergitol NPX to be toxic to corals
even at low concentrations (0.025 ppm). The components within the commercial
formulation of DursbanR may have similar effects on corals.
The purported rapid adsorption and strong binding ability of the pesticide
to soil (Sharom et aI. 1980, Racke, in press) is not supported by this study. In fact,
of the initial 688 J.lg of chlorpyrifos added to the soil column surface, 198 J.lg of
chlorpyrifos or 29% of the original amount was recovered in the effluent water. It
is possible that channeling of the pesticide suspension between the soil column
and the sides of the PVC pipe accounts for some of this movement although, in
view of the very small volume of pesticide stock suspension initially applied to the
soil (1.53 ml), this seems most unlikely. The indications are that, in the presence
of seawater, chlorpyrifos is easily displaced from the particular soil type used in
this study and is certainly a matter of concern particularly for local areas treated
with pesticide that are near the sea or those exposed to strong ocean wave action
that could easily erode the soil.
22

Problems Encountered and Possible Errors in the Experiments
The initial assumption of this study was that the pesticide DursbanR would
be easily dissolved in seawater and would result in a homogeneous solution
readily available for bioassay tests. However, after several attempts of vigorous
shaking and stirring, the pesticide mixture remained a suspension with obvious
layers of white film on the surface of the seawater after 5 minutes of non
agitation. Based on the GC analysis (Table 3), there is no direct correspondence
between presumed dilution level and the actual measured chlorpyrifos
concentration. The most likely cause of this disparity is that the resulting
emulsion/suspension of the pesticide mixture in seawater had many layers of
varying chlorpyrifos concentrations within the pesticide stock. When samples
were taken to dilute to the next level, what was assumed to be a direct dilution of
a homogenous stock was, in reality, not accurate (see Appendix E and F).
Furthermore, dispensing errors in the serial dilution technique employed in this
study may have added to the problem especially in the higher dilution levels. In
such instances, small initial errors in measurement of the pesticide stock may
have been carried over and magnified as the serial dilution scheme progressed
from the lowest to the highest dilution level.
The exact mechanism of action by the pesticide on the coral has not yet
been studied. The physiology of the coral nervous system is not yet been fully
understood; but recent studies have shown that corals have sensory cells (Fautin
and Mariscal, 1991) which may be acted on by the cholinesterase inhibiting
properties of DursbanR • More work is needed to clarify these ideas.
Summary
The commercial pesticide formulation, DursbanR, is highly toxic to the
23
coral Pocillopora damicomis. A conservative estimate of the 96-hour LC was .so
found to be equivalent to 1.2 x 10⁻⁷% of the manufacturer's recommended
dilution level for lawn and garden pest control. Chlorpyrifos concentrations
measured at this dilution level were in the order of 6 J.lg/l. Seawater leached from
chlorpyrifos-treated soil had a greater detrimental effect on the coral Pocillopora
damicomis than could be predicted from conventional toxicity tests carried out
with the commercial formulation direct from the bottle. This may be due to the
breakdown products of the pesticide being more toxic than the original pesticide.
In addition, interactions of the dispersants, binders, and other available
substances present in the commercial formulation with the soil and seawater may
also have influenced the toxicity of the pesticide. More tests with other
commercial-grade pesticides are needed to determine whether pesticide/soil
associations result in toxicity enhancement and provide more realistic estimates
of the maximum allowable dose in the marine environment. More comprehensive
experiments with other tropical marine invertebrates may better elucidate the
toxicity of DursbanR and other pesticides on coral reefs.
24
References
Allender, W.J., Keegan, J. 1991. Determination ofChlorpyrifos and its major breakdown products in technical formulations. Bull. Environ. Contam. Toxicol. 46:313-319.
American Public Health Association, American Water Works Association and Federal Water Pollution Control Administration. 1989. Standard methods for the examination of water and wastewater. 17th Edition. American Public Health Association etal., Washington, D.C. 2134 pages.
Chansang, H. 198ft Coastal tin-mining and marine pollution in Thailand. Ambio 17:223-228.
Elhag, F.A., Yule, W.N., Marshall, W.D. 1989. Persistence and degradation of PP99 Pyrethroid, Fonofos, and Chlorpyrifos in a Quebec cornfield's soil. Bull. Environ. Contam. Toxicol. 42:172-176.
Erez, J. 1990. On the importance of food sources -in coral-reef ecosystems. IN Z. Dubinsky (ed.) Coral Reefs (Ecoystems of the World # 25). Elsevier Science Publishers B.V., Amsterdam, The Netherlands. pp 411-418.
Fautin, D.G., Mariscal, R.N. 1991. Cnidaria: Anthozoa. IN Microscopic Anatomy of Invertebrates. Volume 2: Placozoa,Porifera, Cnidaria and Ctenophora. Wiley-Liss, Inc. New York. pp. 267-358.
Glynn, P.W., Howard, L.S., Corcoran, E., Freay, D. 1984. The occurrence and toxicity of herbicides in reef building corals. Mar. Pollut. Bull. 15: 370-374.
Glynn, P.W., Howard, L.S., Corcoran, E., Freay, D. 1986. Preliminary investigations into the occurrence and toxicity of commercial herbicide formulations in reef building corals. IN Jokiel, P.L., Richmond, R.H., Rogers, R.A. (eds.) Conti reef population biology. Hawaii Institute of Marine Biology Tech. Rep. # 37. Seagrant Cooperative Report UNIHA W-SEAGRANT CR-86-01. pp. 473-485.
Glynn, P.W., Szmant, A.M., Corcoran, E., Cofer-Shabica, S.V. 1989. Condition of coral reef cnidarians from northern Florida reef tract: Pesticides, heavy metals and histopathological examination. Mar. Pollut. Bull. 20:568-576.
Gomez, E.D. 1988. Overview of the environmental problems in the East Asian Seas Region. Ambio 17:166-169.
25
Gomez, E.D., Deocadiz, E. Hungspreugs, M., Jothy, A.A., Kuan Kwee Jee, Soegiarto, A., Wu, R.S.S. 1990. The state of the marine environment in the East Asian Seas Region. UNEP Regional Seas Reports and Studies # 126. United Nations Environment Programme. 63 pages.
Grigg, R.W., Dollar, S.J. 1990. Natural and anthropogenic disturbances on coral reefs. IN Z. Dubinsky (ed.) Coral Reefs (Ecosystems of the World # 25). Elsevier Science Publishers B.V., Amsterdam, The Netherlands. pp. 497-512.
Hodgson, G. 1989. The effects of sedimentation on Indo-Pacific reef corals. Ph.D. dissertation, Department of Zoology, University of Hawaii, Honolulu. 338 pages.
Hotchkiss, B.E., Gillett, J.W. 1987. Extension Toxicology Network (EXTOXNET) Bulletin on Chlorpyrifos. Pesticide Information Project of the Cooperative Extension Offices of Cornell University, the University of California, Michigan State University and Oregon State University. 10 pages.
Hughes, D.N., Boyer, M.G., Papst, M.H., Fowle, C.D., Rees, G.A.V., Baulu, P. 1980. Persistence of three organophosphorus insecticides in artificial ponds and some biological implications. Arch. Environm. Contam. Toxicol. 9:269-279.
Kuhr, R.J., Tashiro, H. 1978. Distribution and persistence of Chlorpyrifos and Diazinon applied to turf. Bull. Environm. Contam. Toxicol. 20:652-656.
Litchfield, J.T., Wilcoxon, F. 1949. A simplified method of evaluating dose effect experiments. J. Pharm. Exp. Ther. 96:99-113.
McManus, J.W. 1988. Coral reefs of the Asian Region: status and management. Ambio 17:189-193.
Meikle, R.W., Youngson, C.R. 1978. The hydrolysis rate of Chlorpyrifos, 0-0-Diethyl 0-(3,5,6-Trichloro-2-Pyridyl) Phosphorothioate and its Dimethyl analog, Chlorpyrifos-methyl, in dilute aqueous solution. Arch. Environm. Contam. Toxico!. 7:13-22.
Miles, J.R.W., Tu, C.M. 1979. Persistence of 8 organophosphorous insecticides in sterile and non-sterile mineral and organic soils. Bull. Environm. Contam. Toxicol. 22:312-318.
26
Miles, J.R.W., Harris, C.R., Tu, C.M. 1983. Influence of temperature on the persistence of Chlorpyrifos and Chlorfenvinphos in sterile and natural mineral and organic soils. J. Environ. Sci. Health B18:705-712.
Peltier, W.H., Weber, C.l. 1985. Methods for measuring the acute toxicity of effluents to freshwater and marine organisms (3rd ed.) Environmental Monitoring and Support Laboratory-Cincinnati. USEPA/600/4-85/013. 216 pages.
Racke, K.D. (in press). The environmental fate of chlorpyrifos. Rev. Environ. Contam. Toxicol.
Rogers, C. 1990. Responses of coral reefs and reef organisms to sedimentation. Mar. Ecol. Prog. Ser. 62:185-202.
I
Sharom, M.S., Miles, J.R.W., Harris, C.R. McEwen, F.L. 1980. Behaviour of12 insecticides in soil and aqueous suspensions of soil and sediment. Water Research 14:1095-1100.
Thoma, K. 1989. Pesticide losses in run-off from a horticultural catchment in south Australia and their relevance to stream and reservoir water quality. Environm. Tech. Lett. 10:117-129.
United States Environmental Protection Agency. 1987. Quality criteria for water. Update # 2 (May 1, 1987). Office of Water Regulations and Standards. Criteria and Standards Division. Washington, D.C. 35 pages.
27

APPENDICES
28
-(j --c: I~ -c: Io U 1:.1
.~ -... -1:.1 U
t c..
;
:
;
:
;:
: Original Data Points
, ' . ,
; ,
;:
:
;
;
l:
;
5
:
. . .. ... ....... -.-1 X 10"
Percent dilution of Dursban stock on log scale
APPENDIX A.1. Litchfield-Wilcoxon method for the determination of
the 96 hour median lethal concentration for the baseline toxicity
experiments (Iog-probit graph)
29 "
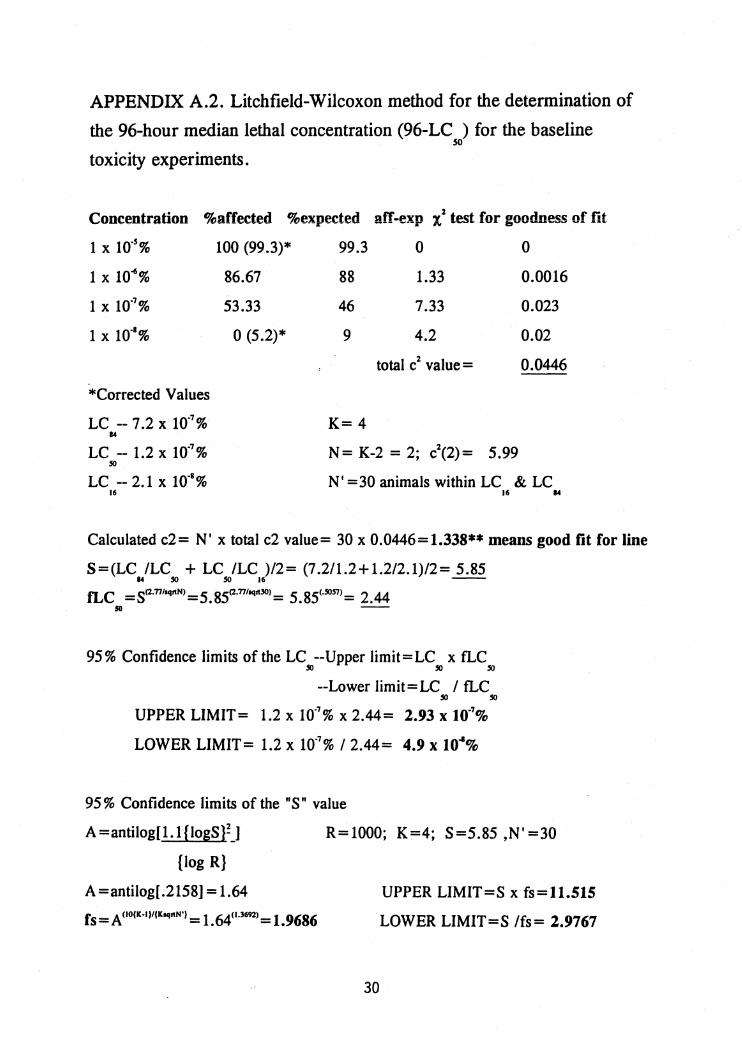
APPENDIX A.2. Litchfield-Wilcoxon method for the determination of
the 96-hour median lethal concentration (96-LC ) for the baseline so
toxicity experiments.
Concentration %aCCected %expected aff-exp 'l test for goodness of fit
1 x 10'5%
1 x 10⁻⁶%
1 x 10"%
1 x 10'1%
*Corrected Values
LC -- 7.2 x 10'7% 14
100 (99.3)* 99.3
86.67 88
53.33 46
o (5.2)* 9
K= 4
0 0
1.33 0.0016
7.33 0.023
4.2 0.02
total c2 value = 0.0446
LC -- 1.2 X 10'7 % 50
N = K-2 = 2; c2(2) = 5.99
LC -- 2.1 x 10'· % N' =30 animals within LC & LC 16 16 ...
Calculated c2= N' x total c2 value= 30 x 0.0446=1.338** means good fit for line
S=(LC ILC + LC ILC )/2= (7.2/1.2+1.2/2.1)/2= 5.85 ... 50 50 16 --
fLC = S(2·77/"1otN) = 5. 85(2·77/"1otlO) = 5.85(·5057) = 2.44 50
95% Confidence limits of the LC --Upper limit=LC x fLC 50 50 50
--Lower limit=LC I fLC 50 50
UPPER LIMIT= 1.2 x 10'7% x 2.44= 2.93 x 10"%
LOWER LIMIT= 1.2 x 10'7% 12.44= 4.9 x 10"%
95% Confidence limits of the "S" value
A=antilog[1.1{logS}~J R=1000; K=4; S=5.85 ,N' =30
{log R}
A=antilog[.2158] = 1.64 UPPER LIMIT=S x fs=11.515
fs= A(lO(K'I)/(K"IotN') = 1.64(1·3692)=1.9686 LOWER LIMIT=S Ifs= 2.9767
30
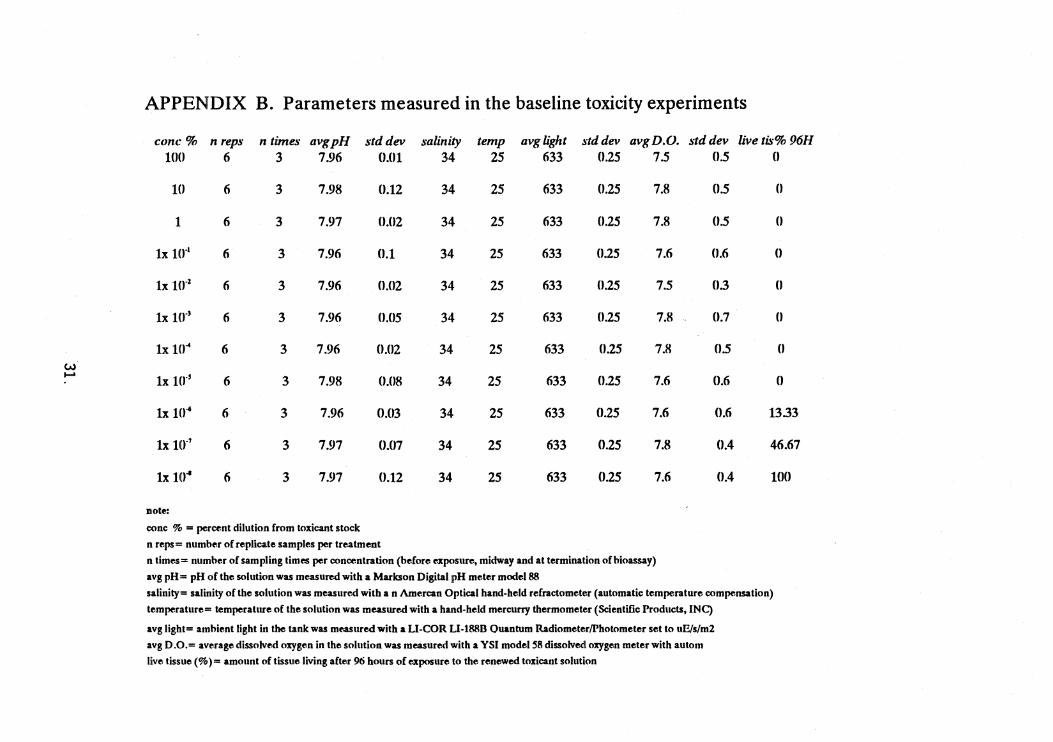
APPENDIX B. Parameters measured in the baseline toxicity experiments
cone % n reps n times avg pH std dev salinity temp avglight std dev avg D.O. std dev live tis% 96H 100 6 3 7.96 (l.Ol 34 25 633 0.25 7.5 0.5 0
10 6 3 7.98 0.12 34 25 633 0.25 7.8 0.5 0
11 6 3 7.97 0.02 34 25 633 0.25 7.8 0.5 0
1x 10⁻¹ 6 3 7.96 O.t 34 25 633 0.25 7.6 0.6 0
Ix 1O-z 6 3 7.96 0.02 34 25 633 0.25 7.5 0.3 0
1x HI"' 6 3 7.96 0.05 34 25 633 0.25 7.8 0.7 0
1x1O" 6 3 7.96 0.02 34 25 633 0.25 7.8 0.5 0 w I-'
1x UI"' 6 3 7.98 0.08 34 25 633 0.25 7.6 0.6 0
1x 10⁻⁴ 6 3 7.96 0.03 34 25 633 0.25 7.6 0.6 13.33
1x 11[1"7 6 3 7.97 O'(J7 34 25 633 0.25 7.8 0.4 46.67
1x 10⁻¹ 6 3 7.97 0.12 34 25 633 0.25 7.6 0.4 100
JlIote:
conc % = percent dilution from toxicant stock
III reps =. number of replic;Lt,e samples per treatment
III time.s= number of sampling times per concentration (before exposure, midway and at termination of bioassay)
avg pH = pH of the solution was measured with a Markson Digital pH meter model 88
salinity= salinity of the solution was measure.d with an Amercan Optical hand-held refractometer (automatic temperature compensation)
temper:lture= temperahu'e of the solution was measured with a hand-held mercurry thermometer (Scientific Products, INC)
avg Iight= ambient light in the tank was me.asured with a LI·COR LI·l88D Ouantum Radiometer/Photometer set to uE/5/m2
avg D .0.= average dissolved oxygen in the solution was measured with a YSI model 58 dissolved! oxygen meter with autom
live tissue (%) = amount of tissue living after 96 hours of exposure 10 the renewed toxicant solution
IIIIII~I_IIIIIII~II . ':111"" II 11111 l!IIL~IW!~i
IIIE ·11 "'''' ''~''::, -~g~
Co) -~ II!!!_' lt ~ :
1111 , . III ~ III , ~ "
:.. Co.
-1j
= -~ ,.Q -E o (J
Co)
&I ~LC '6.8 :1(r'% .~~ .. . .
:"'LC. ' 7.0x 10 .;
~
II
~ _"'7.0;10"% ' . : :~;.
Co) (J :.. Co)
c.. .. ,
I
11111
111111
, 111111111
" ,;, , . . I
lIilliiIllUIR.: III i
. '" ::i .. : I II " "
1· ! !lIIIIII ' ; · ··~hll
lillllllllll:':! lil:oii",I:,' 11111
, , .... " ", . ,
.. "', .... """"" . ""'" H;',
;
, . , , , "", . "
: '" I::il:i'f~ 11111 Jj'ofii lli _
o Corrected value , -• Original Data Points i . : .. .! •
!!.:!:!' .. '. , , ... , "'I" """"" ' I
I, II I' , '
.. -~': . .
'illI!!.III;;;III1I1I1I:i;:;'·~~~~I~IIIII;1! ,. ,; ::UII;III\1I!;:I;tlIIIIIIIIII~; .. .. • _ ..... - .... .... ••• _ ., ..... _ _ _ ... • ..... ___ ... v ....... -.-
1 X 10" I X ler'
Percent dilution of soil effiuent on log scale
APPENDIX C.1. Litchfield-Wilcoxon method for the determination of
the 96 hour median lethal concentration for the soil effluent toxicity
experiments (Iog-probit graph)
32
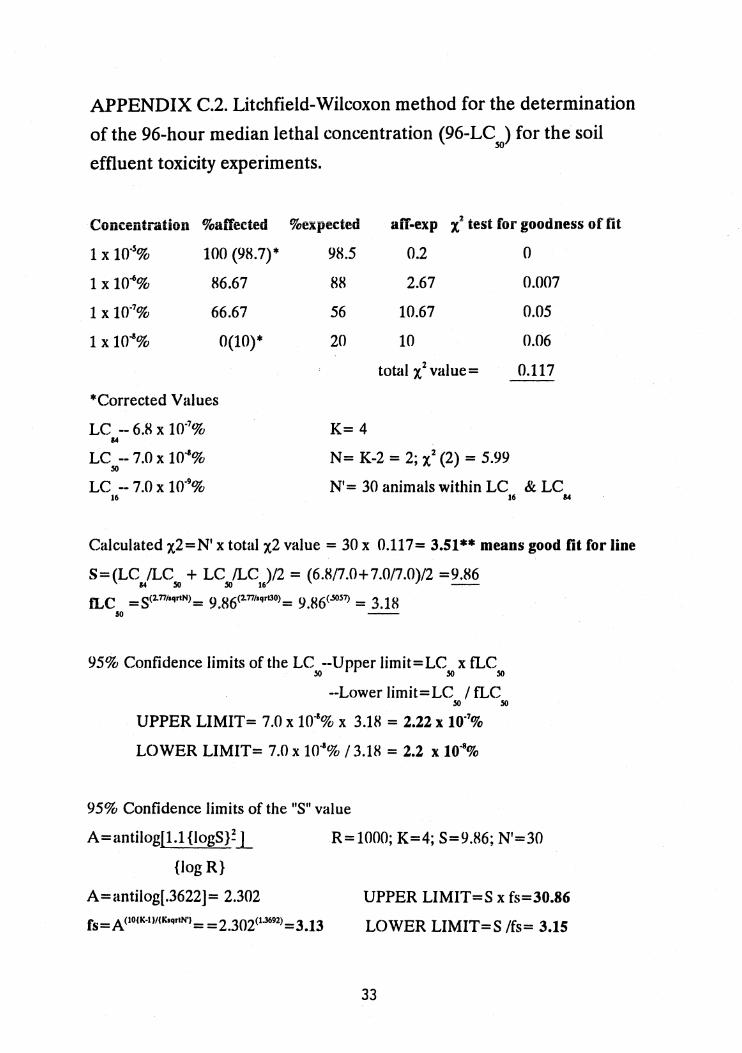
APPENDIX C.2. Litchfield-Wilcoxon method for the determination
of the 96-hour median lethal concentration (96-LC ) for the soil 50
effluent toxicity experiments.
ConCentrdtion %affeded %expected aiT-exp x" test iar goodness of fit
1 x 10·.5% 100 (98.7)* 98.5 0.2 0
1 x 10⁻⁶% 86.67 88 2.67 0.007
1 x 10.7% 66.67 56 10.67 0.05
1 x 10"'% 0(10)* 20 10 0.06
total X2 value= 0.117
*Corrected Values
LC -- 6.8 x 10.7% K= 4 14
N= K-2 = 2; X2 (2) = 5.99 LC -- 7.0 x 10"'% 50
LC --7.0 x 10.9% N'= 30 animals within LC & LC 16 16 14
Calculated X2=N' x total X2 value = 30 x 0.117= 3.51** means good fit for line
S=(LC)LC50 + LCJLC)12 = (6.817.0+7.017.0)/2 =9.86
ILC =S(2.maqrIN)= 9.H6(2.77/sqrt30)= 9.86(..so51) = 3.18 50
95% Confidence limits of the LC --Upper limit=LC x fLC 50 50 50
--Lower limit=LC 1 fLC 50 50
UPPER LIMIT= 7.0 x 10-&% x 3.18 = 2.22 x 10.7%
LOWER LIMIT= 7.0 x 10·'% 13.18 = 2.2 x 10⁻⁸%
95% Confidence limits of the "S" value
A=antilog[1.1 {logS}:_l R= 1000; K=4; S=9.86; N'=30
{log R}
A=antilog[.3622]= 2.302 UPPER LIMIT=S x fs=30.86
fs = A(IO{K.II/IKsqrIN'1 = =2.30Z<1.3692)=3.13 LOWER LIMIT=S Ifs= 3.15
33
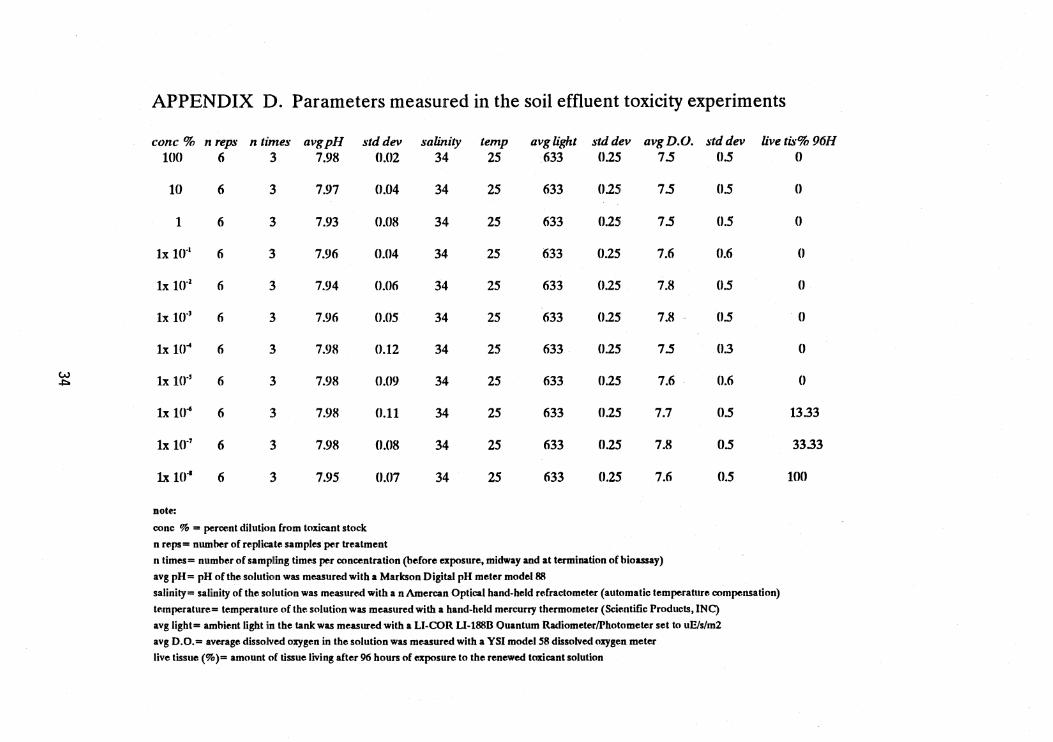
APPENDIX D. Parameters measured in the soil effluent toxicity experiments
cone % n reps n times avgpH std dev salinity temp avglight std dev avgD.O. stddev live tis% 96H toO 6 3 7.98 0.02 34 25 .633 0.25 7.5 0.5 ()
10 6 3 7.97 (J.{)4 34 25 633 0.25 7.5 0.5 0
1 6 3 7.93 0.08 34 25 633 0.25 7.5 0.5 0
Ix tool 6 3 7.96 0,(14 34 25 633 0.25 7.6 0.6 0
Ix to°2 6 3 7.94 0,(16 34 25 633 0.25 7.8 0.5 0
Ix tool 6 3 7.96 0.05 34 25 633 0.25 7.8 0.5 0
Ix 10" 6 :3 7.98 0.12 34 25 633 0.25 7.5 03 0
w Ix Hr' 6 3 7.98 (1.09 34 25 633 0.25 7.6 0.6 0 ~
Ix HI"" 6 :3 7.98 (1.11 34 25 633 0.25 7.7 0.5 1333
Ix ur7 6 3 7.98 0.08 34 25 633 0.25 7.8 0.5 3333
Ix to" 6 3 7.95 (J.(17 34 25 633 0.25 7.6 0.5 100
note:
conc % = percent dilution from toxicant stock
n reps = number of replicate samples per treatment
n time.s= number of sam piling times per concentration (before exposure, midway and at termination of bioassay)
avg pH = pH of the solution was measured with a Markson Digital pH meter model 88
salinity= salinity of the solution was measure.d with a n Amercan Optical hand-held refractometer (automatic temperature compensation)
temperature= temperatlllr,e of the solution was measured with a hand-held mercurry thermometer (Scientific Products, INC)
avg Iight= ambient light ilB the tank was me.a5ured with aLI-COR LI-1888 Quantum RadiometerlPhotometer set to uE/s/m2
avg DoO.= average dissolved oxygen in the solution was mt'.a5ure.d with a YSI model 58 dissolved oxygen meter
live tissue (%)= amount of tissue living after 96 hours of exposure to the renewed toxicant solution
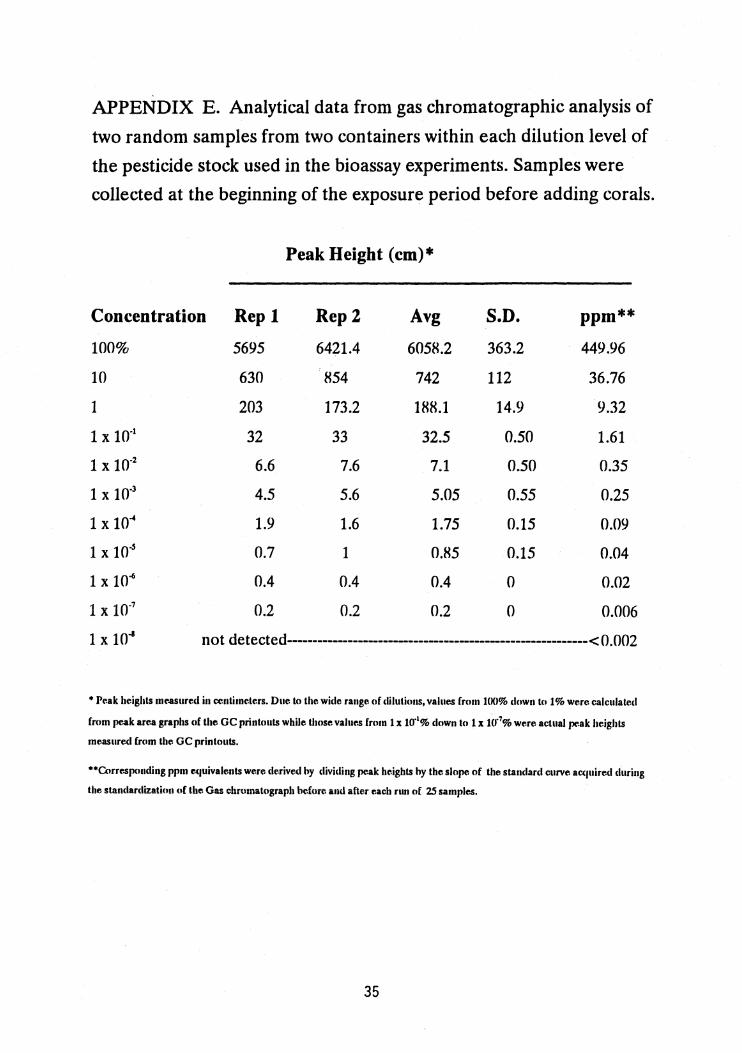
APPENDIX E. Analytical data from gas chromatographic analysis of
two random samples from two containers within each dilution level of
the pesticide stock used in the bioassay experiments. Samples were
collected at the beginning of the exposure period before adding corals.
Peak Height (em)·
Concentration Rep 1 Rep 2 Avg S.D. ppm·*
100% 5695 6421.4 605H.2 363.2 449.96
10 630 H54 742 112 36.76
1 203 173.2 1HH.1 14.9 9.32
1 x 1001 32 33 32.5 0.50 1.61
1 x 1002 6.6 7.6 7.1 0.50 0.35
1 x 1003 4.5 5.6 5.05 0.55 0.25
1 x 10⁻⁴ 1.9 1.6 1.75 0.15 0.09
1 x 1005 0.7 1 0.H5 0.15 0.04
1 x 10⁻⁶ 0.4 0.4 0.4 0 0.02
1 x 1001 0.2 0.2 0.2 0 0.006
1 x 1008 not de tected----------------------------------------------------------< 0.002
* Peak heights meo.asured in eentimeterso Due to the wide range of dilutions, values from UKI% down to 1% were calculated
from peo.ak areo.a graphs of the GC printouts while those valueo.s from 1 x 1001% down to 1 x 100'% were actual peak heights
meo.asured from the GC printoutso
**Correo.sponding ppm e(luivalents were derived by dividing peak heights by the slope of the standard curve acquired during
the standardization of the Gas chromatograph b<lfore and aftr.r each run of 25 sampieso
35

APPENDIX F. Analytical data from gas chromatographic analysis of
two random samples from two containers within each dilution level of
the soil effluent stock used in the bioassay experiments. Samples were
collected at the beginning of the exposure period before adding corals.
Concentration
100%
10
1
1 X 10⁻¹
1 X 10⁻²
1 X 10⁻³
1 X 10⁻⁴
1 x 1O-s
1 X 10⁻⁶
1 X 10⁻⁷
1 X 10⁻⁸
Rep 1
4
1
Peak Height (cm) *
Rep 2
4
1
Avg
4
1
S.D.
o o
ppm**
0.19H
0.049
not de tected -----------------------------------< 0.002
not dete eted -----------------------------------< 0.002
not de tected ----------------------------------< 0.002
not de tected ---------------------------------< 0.002
not de tected -----~---------------------------< 0.002
not detected ----------------------------------< 0.002
not detected -------------------------------------< 0.002
not de tected -------------------------------------< 0.002
not de te cted -----------------------------------< 0.002
·Pt'.ak heights mt'.asured in centimeters from GC printouts. There were no peaks evident below the 10% dilution level of the
soil effiuent stock.
"Corresponding ppm e(luivalents were derived by dividing peak heights hy the slope of the standard curve aC'Iuired during
the standardization of the Gas chromatograph before and after each run of 2S samplt'.s.
36

Do not burn yourselves out. Be as I am. A reluctant enthusiast and part-time crusader. A half-hearted fanatic. Save the other half of yourself for pleasure and adventure.
It is not enough to fight for the west. It is even more important to enjoy it while you can, while it's still there. So get out there, hunt, fish, mess around with your friends, ramble out yonder and explore the forests, encounter the griz, climb a mountain, bag the peaks, run the rivers, breathe deep of that yet sweet and elusive air.
Sit quietly for a while and contemplate the precious stillness of the lovely, mysterious and awesome space. Enjoy yourself.
Keep your brain in your head and your head firmly attached to the body, the body active and alive. And I promise you this one sweet victory over our adversaries, over those desk-bound people with their hearts in safe deposit boxes and their eyes hypnotized by their desk calculators. I promise you this ... You will outlive those bastards!!
---Edward Abbey---