Embed Size (px)
Citation preview

SUMMARY REPORT
JUNE 2013
We ask because We care.
201306278
What language do you feel most comfortable speaking in with your health-care provider?
Which of the following
best describes your racial or ethnic group?
Do you have any of the following
disabilities?
Will you please provide us with information about yourself?This information will increase access to services
and improve the quality of care.
With funding and support from the Toronto Central LHIN.
We ask because we careThe Tri-Hospital + TPH Health Equity Data Collection Research Project Report

STEERING COMMITTEE:
Branka Agic – Centre for Addiction & Mental Health
Simone Atungo – Mount Sinai Hospital
Caroline Bennett-AbuAyyash – Mount Sinai Hospital
Robert Coughlin – Toronto Public Health
Margaret de Wit – Toronto Public Health
Cindy Fedell – Mount Sinai Hospital
Marylin Kanee – Mount Sinai Hospital
Kwasi Kafele – formerly Centre for Addiction & Mental Health
Ruby Lam – Toronto Public Health
Janet Mawhinney – Centre for Addiction & Mental Health
Kwame McKenzie – Centre for Addiction & Mental Health
Anthony Mohamed – St. Michael’s Hospital
Daniela Mucuceanu – formerly Mount Sinai Hospital
Jim O’Neill – St. Michael’s Hospital
Andrew Pinto – St. Michael’s Hospital
Gabriela Rattner – Mount Sinai Hospital
Ketan Shankardass – St. Michael’s Hospital
Maureen Sluman – formerly Mount Sinai Hospital
Andrew Tuck – Centre for Addiction & Mental Health
Caroline Wai – Toronto Public Health
PRINCIPAL INVESTIGATORS:
Branka Agic – Centre for Addiction & Mental Health
David McKeown – Toronto Public Health
Kwame McKenzie – Centre for Addiction & Mental Health
Andrew Pinto – St. Michael’s Hospital
Samir Sinha – Mount Sinai Hospital
ACKNOWLEDGMENTS:
Sergio Gaustein – Mount Sinai Hospital
Cleo Haber – Mount Sinai Hospital
Diane Shrott – Toronto Public Health
Chris Wakefield – formerly Mount Sinai Hospital
The Steering Committee would like to acknowledge the Toronto Central Local Health Integration
Network’s (TC LHIN) financial support toward the production of this document.
The Steering Committee would also like to acknowledge the significant contributions made by our
extended group of data collectors, IT support, front-line staff, data analysts, and members of our
hospitals’ internal committees. Their efforts were vital for the success of this project.
PREPARED BY:
Ron Wray (with Ilene Hyman)- DGL Consulting, Branka Agic, Caroline Bennett-AbuAyyash,
Marylin Kanee, Ruby Lam, Anthony Mohamed, and Andrew Tuck
The full research project report is available at:
• http:// www.mountsinai.ca
• http://knowledgex.camh.net/health_equity/Pages/default.aspx
• http:// www.stmichaelshospital.com
• http://www.toronto.ca/health

WE ASK BECAUSE WE CARE
1
IntroductionToronto has undergone a massive transformation over
the last three decades. From the force of immigration,
the demographics of the city have dramatically
changed. No less transformative is the concerted
community push for greater recognition of all forms
of diversity and social exclusion such as disability,
sexual orientation and gender. Yet while Toronto has
experienced deep-rooted change, it remains unclear
whether our health care system has evolved at the
same pace. Such a question becomes all the more
relevant in light of changes to the Ontario Human
Rights Code, the passage of the Excellent Care for All
Act (2010), and an evolving health care system that
has come to recognize patient-centered care as a
pillar of quality care.
Why are socio-demographic data important? Over
four decades of research has generated a large and
compelling body of literature on socio-demographic
differences in health care access, experiences and
outcomes. While universal health care has a levelling
effect that reduces health inequities for a majority
of the population, affordability does not address
other barriers in relation to factors such as racialized
status and ethnicity, language, gender, and sexual
orientation. We know that there is a significant decline
in the physical and mental health status of recent
immigrants within a two to five year period following
settlement (DeMaio 2010; Hyman 2007; Ng, Wilkins,
Gendron, & Berthelot, 2005; Pahwa, Karunanayake,
McCrosky, & Thorpe, 2012). Studies also tell us social
stigma and discrimination affect access and usage
of health care services for persons from the lesbian,
gay, bi-sexual, transgender and inter-sex populations
(Bergeron & Senn, 2003; Coker, Austin, & Schuster,
2010; Jillson, 2002; Kerith, Conron, Mimiaga, &
Landers, 2010; Mayer et al., 2008). Yet, while health
equity research has pushed out the boundaries for
health system action, there has not been a parallel
expansion in the type of data that is routinely collected
and used to improve health care.
Currently in Canada, most information on health
equity is derived from population level data such as
the Canadian Community Health Survey and/or linked
databases, which can signal important variations in
health outcomes. While that data can provide insight
into diverse social and geographic population groups,
characteristics such as sexual orientation or gender
identity are often missed.
Population health survey data are not
routinely linked to specific health care
organizations, limiting their capacity to assess
their own performance improvements in
relation to the observed risk and prevalence
of differences in health.
As the old saying goes, “you cannot manage what
you don’t measure”. Administrative records have
traditionally focused on limited patient factors
such as age and geographic location and medical
measures like diagnosis and length of stay. All critical
information, yet insufficient when viewed against the
new imperatives of health care management. In sum,
the lack of socio-demographic information hinders
the growth of patient-centred care that captures
diversity in multiple forms, and presents a barrier
to investigating whether past and on-going change
initiatives have produced positive outcomes.

TRI-HOSPITAL + TPH SUMMARY REPORT
2
Getting StartedIn 2009, a group of equity practitioners from MSH,
SMH and CAMH convened a meeting to establish
a partnership to further equity in health through
the collection of socio-demographic data. All
participants had deep experience in the theory and
practice of health equity principles, yet recognized
that the current system of health data collection
did not capture variables (e.g., income) recognized
in research as important influences on health
care access, experience and outcomes. At a later
point, TPH asked to join the process, providing a
population health perspective as well as another
unique pilot project setting.
The project objectives of the partnership were
decided to be:
Develop and pilot test evidence-based data
collection methods and a survey tool
Analyze patient responses and feedback from data
collectors to improve the methodology and tool
Explore the relation between demographic
variables and self-rated health
Ensure knowledge exchange with other institutions
in the Toronto Central LHIN around the findings
of the project.
The definition of ‘mission critical’ was acquiring the
best evidence on a range of questions and employing
the appropriate expertise - policy researchers, data
experts, information technology specialists - at each
stage of development. The research questions to be
explored were: 1) What socio-demographic variables
should be collected? 2) Who is best suited to ask
patients for sensitive personal information? 3) What
formats maximize response rates? and, 4) How best
to inform staff and patients about socio-demographic
data collection?
The following report provides an overview of a four
year process among four organizations: Mount
Sinai Hospital (MSH), St. Michael’s Hospital
(SMH), the Centre for Addiction and Mental Health
(CAMH) and Toronto Public Health (TPH). Through
the development and pilot project trial of a socio-
demographic questionnaire with a participation
rate of over 80%, a set of eight questions and three
optional questions is being recommended for
wide-scale implementation. Research on the equity
of health and health care compels action on the
collection of socio-demographic data. The results of
the Tri-Hospital + TPH Health Equity Data Collection
Project provide evidence that it is ‘doable’.

WE ASK BECAUSE WE CARE
3
Policy are working toward a coordinated approach for
standardization of data collection (Hawkins, Torres,
Simpson, & Cohen, 2011). Through a process of
development, a set of socio-demographic questions
were identified and then tested and refined through
pilot projects.
While previously focused on collecting race,
ethnicity, and language (REaL data), US hospitals
have now started expanding the list of demographic
paramters due to the recognition that more data
collection is required for a comprehensive picture
on health equity. The Affordable Care Act requires
the mandatory collection of data on disability status
(Office of Minority Health [OMH], 2011). More
recently, the U.S. Department of Health and Human
Services (HSS) stated that it would begin a plan to
collect data on lesbian, gay, bisexual & transgender
populations (LGBT) (OMH).
Public Perception on the Collection of Socio-Demographic Data – The ‘Gradient of Comfort’
The collection of socio-demographic data carries
with it ethical implications and, for some individuals,
a threat or intrusion in their personal lives. A number
of studies in the U.S. and Canada have explored
whether the general public are accepting of the
idea of being asked about race/ethnicity, sexual
orientation and other sensitive topics (Baker et al.,
2005; Baker, Hasnain-Wynia, Kandula, Thompson,
& Brown, 2007; Varcoe, Browne, & Wong, 2009).
Findings from these studies are generally positive
with responses hovering in the area of 80% and
above (e.g., Quan, Wong, & Johnson, 2006), with
the exception of one national study in Canada
suggesting a much lower level of support at 50%
(Lofters, Shankardass, Kirst, & Quinonez, 2011). This
study stands in contrast to an earlier Calgary study in
which the findings were similar to earlier U.S. work
over 80% (Quan et al.).
Moving Along the Learning CurveFrom the Literature – Commitment, Standardization and Consolidation
In response to the expanding recognition of the
social determinants of health and growing push
towards health equity, a number of jurisdictions
have set a regulatory requirement that health care
organizations collect socio-demographic data, most
often on racialized status or ethnicity. In England
and Wales, government policy for hospitals to collect
race/ethnicity data was a story of weak commitment
(Fulton, 2010; Iqbal et al., 2009). While all hospitals
collected the data as required, the number of
responses marked ‘not known’ or ‘not stated’ was
nearly 90% until a concerted policy push to improve
compliance.
For the U.S., acknowledged by most as the
international leader, the issue appears to be too
much data collection and mandatory requirements
marked by too little standardization (Escarce,
Carreon, Veselovsky, & Lawson, 2011; Institute
of Medicine [IOM], 2009). The process of socio-
demographic data collection might be described
as a “smorgasboard” of different standards,
policies and requirements,mirroring the highly
fragmented character of the U.S. health care
system and government. Moreover, given the early
days of such pioneering work, much of the data
collection implemented what might be described
as “bad practices”. Methods including staff
visually scrutinizing patients to determine race or
categorizing ethnicity on the basis of last names
has resulted in misclassifcation rates of up to 50%
(Andrews, 2011; Escarce et al.). Emerging from the
fragmentation are signs of consolidation as well as
pushing out the parameters of socio-demographic
factors. In Massachusetts, the Department of Public
Health and Division of Health Care Finance and

TRI-HOSPITAL + TPH SUMMARY REPORT
4
What Socio-Demographic Factors to Measure – Follow the Evidence
The socio-demographic factors most consistently
collected by health organizations are race or
ethnicity. The rationale for this focus is easy to
explain: there is a vast body of international and
Canadian research indicating that race and ethnicity
play a pivotal role in one’s health status, healthcare
experience and satisfaction, quality of care received
and outcomes (IOM, 2009; Nestel, 2012; Tjepkema,
Wilkins, Senécal, Guimond, & Penney, 2009;
Tjepkema, Wilkins, Senécal, Guimond, & Penney,
2010; Wray, & Hyman, 2013).
And yet, while race and ethnicity are significant
influences on quality and outcomes, there is an
equally robust body of evidence on the effects of low
income (Phipps, 2003; Ross et al., 2006). Similarly,
the effects of social exclusion and marginalization
on patients and the provision of health care are now
being examined in relation to factors such as:
immigration status (e.g., DeMaio, 2010;
Hyman, 2007)
sexual orientation (e.g., IOM, 1999; IOM, 2011;
Mayer et al., 2008)
gender (e.g., Bierman, 2012)
language (e.g., Bowen, 2001)
disability (e.g., Lezzoni, 2011; Sullivan, Heng, &
Cameron, 2006; Veltman, Stewart, Gaetan, Tardif,
& Branigan, 2001), and
homelessness (e.g., Frankish, Hwang, & Quantz,
2005; Hwang, 2000; Hwang, 2001; Hwang,
& Henderson 2010).
What is consistent across the studies is that there
is a ‘gradient of comfort’ – people are most open
to questions about language, while they are less
receptive to questions regarding their income.
Similarly, there is a ‘gradient’ in relation to who
is asking for the data, with physicians ranked as
the most trusted and greater reluctance about
administrative staff.
While the implications of the national survey were of
concern, the development and pilot testing process
was designed to target and influence the ‘gradient
of comfort’ through various strategies. In relation to
the sensitivity of questions, the ordering of questions
would move from least sensitive (language) to most
discomforting (income). This would both enable
the capture of most of the data while also allowing
the respondent to ease into a sense of trust. It was
important to ensure all data collectors were well
trained in understanding the purpose of the data
for quality care, and had a natural confidence in
establishing a sense of trust with the respondents.

WE ASK BECAUSE WE CARE
5
collectors. A total of eleven local human service
organizations were scanned ranging from the
Toronto District School Board to the South Riverdale
Community Health Centre as well as the Disparities
Solution Centre in Boston. The combination of
learned experience and hard copy information was
used to shape the socio-demographic questions and
categories, and the strategy of implementation.
Gearing UpWhen tasked with reporting data on patients from
diverse populations, McKenzie and Cowcroft (1996)
suggest adopting a popular learning strategy from
medical school: “if you do not know the right name
for something then describe it”(p. 1054). There are
few words that are more complex and less subject
to single definitions than race and ethnicity. Race, as
is well accepted by most experts, is not a scientific
construct. It is a social construct with diverse
interpretations (Krieger, 2003; Williams, 2012). In
turn, ethnicity can be measured along a variety of
dimensions and associations such as origin, ancestry
or identity (Statistics Canada, 2003). Nor is there
always accepted language for sexual orientations,
with familiar variations such as gay or lesbian or the
Aboriginal term two-spirited. Lastly, the potential
categorizations for religious affiliations, while not
infinite, are large (with estimates up to 4,200).
The process of survey question
development was one of creating questions
and categorizations that are both useful
for the purposes of collection, aggregation
and analysis, while meaningful for survey
respondents.
An emerging research base is empirically validating
what has long been known - social marginalization
is often mirrored by health inequities. In some
countries, legislation and regulation is at last
following the evidence.
In many respects, Canada is a laggard in the collection
of socio-demographic data. While equity in health
has long been a goal of advocates, academics and
policy makers, there has been a systematic failure to
generate the data necessary to ask ‘is it working?’ and
‘how can we do better?’. Despite rich and compelling
evidence, action on standardized socio-demographic
health data collection is not following the evidence.
For this process, literature reviews were implemented
to identify evidence-based key questions for the
systematic collection of data; collecting data on
those questions will consequently support evidence-
based quality care improvements in Toronto. These
questions are language, race/ethnicity, born in
Canada, disability, sexual orientation, gender, housing,
age, religion and income.
Environmental Scan – Don’t Reinvent the Wheel
While Canada might be behind in terms of the
standardized collection of socio-demographic data
for healthcare at the national, provincial and local
levels, there are many organizations in various sectors
(including health) that have recognized the need and
independently moved forward. Having gone through
the process of testing and tweaking the questions for
real world application, many of those organizations
had valuable input on what works and what doesn’t
in the development of socio-demographic questions.
Accordingly, the Tri-Hospital + TPH environmental
scan was comprised of key informant interviews
in addition to compiling materials on promotion,
education and training in data collection. This
material included tested tools that can be used to
inform and engage patients, as well as prepare data

TRI-HOSPITAL + TPH SUMMARY REPORT
6
Since the health care system is not a singular system
and, indeed, hospitals are comprised of a wide variety
of programs, settings, patient populations, another
focus was to identify a diverse number of pilot sites.
The process was a blend of selection and internal
hospital championing, negotiation and agreement.
The sites represent a diverse number of settings:
outpatient, inpatient, family practice and home
visits. Similarly, the patient populations varied from
persons with serious mental illness, frail elderly with
varying degrees of cognitive competency, socially
excluded women with a high risk of pregnancy,
patients with complex co-morbidities, and
individuals using primary health care. Along with a
mix of settings, various methods of administering
the surveys were utilized.
Table 1
List of sites for demographic data collection
LOCATION METHOD ADMINISTRATION
MSH – General Internal Medicine – bedside
Paper
Volunteers (internationally educated health professionals)
MSH – Gravonsky Gluskin Family Medicine Centre – waiting room
Paper
Self with assistance of volunteers (internationally educated health professionals)
SMH – Family Practice Outpatient Clinic - waiting room
Tablet
Self with assistance of two multi-lingual post-graduate students
CAMH – Outpatient Schizophrenia Program
PaperVolunteers, research staff and health care providers
TPH – Healthiest Babies Possible Program – 2nd visit
PaperHealth providers
Just as a “describe it” process guided question
development for data collection purposes, it
was essential that people “see themselves” in
the descriptions. Although sociological research
suggests that the preferred method is open ended
categories in which the person self-identifies,
it is also acknowledged this process generates
information that cannot be easily aggregated (if at
all), nor is the data analysis able to distinguish on
what basis the individual self-identified (Brunsma,
2005; Brunsma, 2006; Khanna, 2012). Therefore, the
development of questions was guided by a middle
point approach of using groupings that reflect the
demographics of Toronto that can be aggregated
(e.g., Black, Asian) and disaggregated (e.g. Black
– Caribbean, Asian - South), and uses examples of
source countries so that people can recognize and
place themselves within the description.
There were a total of 23 iterations of the survey
questions developed via existing data collection
tools, adjusted after consultations with informed
experts and final revisions drawn from the pilot
project findings. The primary source of questions
and descriptions for race/ethnicity, language and
religion was the Toronto District School Board
census survey, a survey instrument that has
been successfully implemented and validated on
repeated occasions. For disability, the question and
categories were drawn from Ontario’s Human Rights
legislation. Questions regarding sexual orientation
and gender were created in consultation with the
lesbian, gay, bisexual and trans (LGBT) communities.
Drawing from the environmental scan, the next step
was to create a survey protocol, recruitment script,
data collection training handbook and promotional
materials building upon materials developed by NHS
Scotland (2009).

1 Please note that one of the sites didn’t report the number of refusals. The revised participation rate excluding that site is 82.5%
WE ASK BECAUSE WE CARE
7
What We Found – The Pilot ProjectA total of 2,242 patients were approached in five pilot
sites during the summer of 2012. Of these, 86.6% of
patients (n = 1,942) answered the survey and 13.4%
(n = 300) declined to answer. In other words, the first
finding was that patients were willing to share their
information1.
Summary of Data Collection Methods
The techniques and processes used to collect data
across the six sites were examined, including where
the survey was administered, who provided and who
collected the information, and how the data was
captured. The pie charts below provide a summary
of the findings.
Analysis of the Survey Results
Response validity was calculated for each question
by looking at the proportion of “valid” responses. A
response was considered to be valid if the respondent
selected any one of the available response options
(responses of “don’t know” and “prefer not to
answer” are considered valid).
Who provided the information?
8.70%Other person
0.70% Missing data
90.60%Patient
What survey format was used?
8.70%Tablet
0.70% Missing data
90.60%Paper
Who collected the information?
44.20% Staff
11.30%Healthcare provider
33.20%Self-patient
10.60%Other
0.70% Missing data
Where was the survey administered?
50.20% Waiting room
10.22%Private/Clinic
35.97%Bedside
0.10%ED
0.70% Missing data

TRI-HOSPITAL + TPH SUMMARY REPORT
8
Self-rated health (SRH) was used as an indicator of
subjective health. Respondents were asked to rate
their health as excellent, very good, good, fair, or poor.
The survey findings show that:
A greater proportion of individuals who rated their
ability to speak and understand English as “Not
Well” or “Not at All” reported “Poor” perceived
health (29.7%) compared to those who said they
spoke and understood English ”Very Well” Or
“Well” (11.1%)
The average length of residency in Canada was
significantly longer for immigrants who rated their
health as “Poor” (38.76 ± 19.46 years) compared
to immigrants who rated it as “Excellent” (19.34 ±
20.149 years), “Very Good” (21.17 ± 18.97 years),
or “Good” (24.68 ± 19.39 years)
A greater proportion of the Aboriginal and Racialized
group (17.6%) rated their health as “Excellent” than
the “White” group (13.7%), and a lower proportion
rated their health as “Poor” (9.7%) compared to the
“White” population (14.4%)
A greater proportion of males (35.6%) reported
their health as “Fair” or “Poor” compared to
females (26.7%)
Follow-up: Feedback from Data Collectors
Discussions with data collectors revealed that the
reception of patients to the survey questions was
positive and most people were willing to provide the
requested information. The general conclusion of data
collectors was that the training was of high quality and
helpful in a way that made the process of collection
relatively easy.
Table 2
Percentage of valid responses per survey question
QUESTION
VALID RESPONSES
In what language would you feel most comfortable speaking in with your healthcare provider? (n = 1942)
97.6%
How would you rate your ability to speak and understand English? (n = 1942)
98.3%
In what language would you prefer to read healthcare information? (n = 1942)
97.3%
Were you born in Canada (n = 1942) 98.6%
*If not born in Canada, what year did you arrive? (n = 876)
85.5%
Which of the following best describes your race? (n = 1942)
97.6%
What is your religious or spiritual affiliation? (n = 1727)i
94.6%
What is your gender? (n = 1942) 97.9%
What is your sexual orientation? (n = 1942) 97.1%
What was your total family income before taxes last year? (n = 1942)
96.4%
*How many people does this income support? (n = 1942)
84.6%
What type of housing do you live in? (n = 1942)
97.2%
In what year were you born? (n = 1232)ii 96.1%
Do you have any of the following disabilities? (n = 1942)
94.2%
* Follow up itemii Note: the sample size is smaller because some respondents were
asked this question as two separate questions. These individuals could not be grouped appropriately with the other respondents.
iii Note: the sample size is smaller because for some respondents their date of birth was taken from their health record, not as it was reported on the survey.

WE ASK BECAUSE WE CARE
9
Lesson #5: When introducing a demographic data
collection model and coordinating data collection
across multiple sites, it is essential to continually
monitor progress and engage staff and management
around that progress. This can include monitoring
participation rates for data quality and addressing
issues that arise early on.
Lesson #6: All hospitals should implement their
own process of learning and adaptation to align the
data collection method with technology, setting, and
program population. While standardizing definitions,
categories of the questions, and self-reporting is
necessary to ensure quality data, the method of data
collection for each setting can be flexible.
The Tri-Hospital + TPH project was able to meet its
objectives after years of discussions, consultations,
and research. The extensive work leading up to those
objectives makes it easy to forget that demographic
data collection is only a means to a bolder end:
equity in health, represented in “the absence of
systematic disparities in health between groups
with different levels of underlying social advantage/
disadvantage- that is, wealth, power, or prestige”
(Braveman & Gruskin, 2003, p. 254). The lessons
laid out in this report are key to the ambitious work
ahead of us, and provide much-needed direction on
the long journey to providing equitable health care.
What We Learned – Looking to the FutureThe success of the Tri-Hospital + TPH project is
now moving from a small collaborative initiative to
a system wide application. The TC LHIN identified
the collection of socio-demographic as a key pillar
in its health equity strategy. The questions and
categorizations were assessed to work well, and a
final set of 8 core questions with three optional –
but recommended − questions has been adopted
as the preferred survey approach for wide scale
implementation as directed by the TC LHIN (See
Appendix A).
Following are the lessons learned from the Tri-Hospital + TPH project:
Lesson #1: With a participation rate of over 80%, the
pilot project demonstrated that the collection of socio-
demographic data from patients/clients is ‘doable.’
Lesson #2: A strong commitment by senior
leadership to the value and importance of socio-
demographic data collection is necessary.
Lesson #3: The training of data collectors is the key
step in successful implementation. Education on
health equity (the ‘big picture’) is important in moving
attitudes and acceptance toward buy-in and interest.
Lesson #4: The use of technology is challenging for
some patients. For certain populations such as the
elderly or people with some disabilities, there is the
potential for a steeper learning curve.

TRI-HOSPITAL + TPH SUMMARY REPORT
10
ReferencesAndews, R. (2011). Race and ethnicity reporting in statewide hospital data: progress and future challenges in
a key resource for local and state monitoring of health disparities. Journal of Public Health Management,
17, 167-173.
Baker, D., Cameron, K., Feinglass, J., Georgas, P., Foster, S., Pierce, D., Thompson, J., & Hasnain-Wynia,
R. (2005). Patients’ attitudes toward health care providers collecting information about their race and
ethnicity. Journal of General Internal Medicine, 20, 895-900.
Baker, D., Hasnain-Wynia, R., Kandula, N., Thompson, J., & Brown, E. (2007). Attitudes toward health care
providers, collecting information about patients’ race, ethnicity, and language. Medical Care, 45, 1034-42.
Bergeron, S., & Senn, C. (2003). Health care utilization in a sample of Canadian lesbian women: predictors of
risk and resilience. Women & Health, 37, 19-35.
Bierman, A. (2012). Project for an Ontario women’s health evidence-based report: volume 2. Toronto.
Bowen, S. (2001). Language barriers in access to health care. Ottawa: Health Canada.
Braveman, P., & Gruskin, S. (2003). Defining equity in health. Journal of Epedimiology and Community Health,
57, 254-258.
Brunsma, D. (2005). Interracial families and the racial identification of mixed race children: evidence from the
early childhood longitudinal study. Social Forces, 84, 1131-1157.
Brunsma, D. (2006). Public categories, private identities: exploring regional differences in the biracial
experience. Social Science, 35, 555-576.
Coker, R., Austin, S., & Schuster, M. (2010). The health and health care of lesbian, gay, and bisexual
adolescents. Annual Review of Public Health, 31, 457-477.
DeMaio, F. (2010). Immigration as pathogenic: a systematic review of the health of immigrants to Canada.
International Journal for Equity in Health, 9. doi:10.1186/1475-9276-9-27.
Escarce, J., Carreon, R., Veselovskiy, G., & Lawson, E. (2011). Collection of race and ethnicity data by health
plans has grown substantially, but opportunities remain to expand efforts. Health Affairs, 30, 1984-1991.
Fulton, R. (2010). Ethnic monitoring: is health equality possible without it? London: Race Equality Foundation.
Frankish, J., Hwang, S., & Quantz, D. (2005). Homelessness and health in Canada: research lessons and
priorities. Canadian Journal of Public Health, 96, 23-29.

WE ASK BECAUSE WE CARE
11
Hawkins, S., Torres, B., Simpson, G., & Cohen, B. (2011). Setting the standards for collecting ethnicity Data in
the Commonwealth of Massachusetts. Journal of Public Health Management Practice, 17, 550-563.
Hwang, S. (2000). Mortality among men using homeless shelters in Toronto, Ontario. Journal of American
Medical Association, 283, 2152-2157.
Hwang, S. (2001). Homelessness and health. Canadian Medical Association Journal, 164, 229-232.
Hwang, S., & Henderson, M. (2010). Health care utilization in homeless people: translating research into policy
and practice. Agency for Healthcare Research and Quality, Working Paper No. 10002.
Hyman, I. (2007). Immigration and health: reviewing evidence of the healthy immigrant effect in Canada. CERIS
Working Paper No. 55.
Institute of Medicine. (1999). Lesbian health: current assessment and directions for the future. Washington, DC:
National Academies Press.
Institute of Medicine. (2009). Race, ethnicity, and language data: standardization for health care quality
improvement. Washington, DC: National Academies Press.
Institute of Medicine. (2011). The health of lesbian, gay, bisexual, and transgender people: building a foundation for
better understanding. Washington, DC: The National Academies Press.
Iqbal, G., Gumber, A., Johnson, M., Szczepura, A., Wilson, S., & Dunn, J. (2009). Improving ethnicity data
collection for health statistics in the U.K. Diversity in Health and Care, 6. doi:10.1186/1471-2458-12-243.
Jillson, I. (2002). Opening closed doors: Improving access to quality health services for LGBT populations.
Clinical Research and Regulatory Affairs, 19, 153–190.
Kerith J., Conron, J., Mimiaga, S., & Landers, L. (2010). A population-based study of sexual orientation identity
and gender differences in adult health. American Journal of Public Health, 100, 1953-1960.
Khanna, N. (2012). Multiracial Americans: racial identity choices and implications for the collection of race
data. Sociology Compass, 6, 316-331.
Krieger N., (2003). Does racism harm health? did child abuse exist before 1962? on explicit questions, critical
science, and current controversies: an eco-social perspective. American Journal of Public Health, 93, 194-199.
Lezzoni, L. (2011). Eliminating health and health care disparities among the growing population of people with
disabilities. Health Affairs, 30, 1947-1954.

TRI-HOSPITAL + TPH SUMMARY REPORT
12
Lofters, A., Shankardass, K., Kirst, M., & Quiñonez, C. (2011). Sociodemographic data collection in healthcare
settings: an examination of public opinions. Medical Care, 49, 193-199.
Mayer, K., Bradford, J., Makadon, H., Stall, R., Goldhammer, H., & Landers, S. (2008). Sexual and gender
minority health: what we know and what needs to be done. American Journal of Public Health, 98, 989-995.
McKenzie, K., & Crowcroft, N. (1996). Describing race, ethnicity, and culture in medical research. British
Medical Journal, 312, 1054.
Nestel, S. (2012). Colour coded health care: the impact of race and racism on Canadians’ health. Toronto:
Wellesley Institute;
Ng, E., Wilkins, R., Gendron, F. & Berthelot, J-M., (2005). The changing health of immigrants. Canadian Social
Trends, Ottawa: Statistics Canada.
NHS Scotland. (2009). ‘Happy to Ask’: DVD resource to support NHS staff in collecting diversity data from
patients. Retrieved May 27, 2013 from http://www.isd.scot.nhs.uk/isd/5652.html
Office of Minority Health. (2011). Reducing health disparities with improved data collection: new refined data
standards for race, ethnicity, sex, primary language, and disability status. Retrieved May 11, 2013 from
http://minorityhealth.hhs.gov/templates/content.aspx?ID=9232
Pahwa, P., Karunanayake, C., McCrosky, J., & Thorpe, L. (2012). Longitudinal trends in mental health among
ethnic groups in Canada. Chronic Diseases and Injuries in Canada, 32, 164-176.
Phipps, S. (2003). The impact of poverty on health: a scan of research literature. Ottawa: Canadian Institute for
Health Information.
Quan, H., Wong, A., & Johnson, D. (2006). The public endorses collection of ethnicity information in hospital:
implications for routine data capture in Canadian health systems. Healthcare Policy, 1, 55– 64.
Research Alliance for Canadian Homelessness, Housing and Health. (2010). Housing vulnerability and health:
Canada’s hidden emergency, a report on the reach health and housing in transition study. Toronto.
Ross, N., Wolfson, M. Kaplan, G., Dunn, J., Lynch, J., & Sanmartin, C. (2006). Income inequality as a
determinant of health. In J. Heymann, C. Hertzman, M. Barer, & R. Evans (Ed.). Healthier Societies: From
Analysis to Action, New York: Oxford University Press;
Statistics Canada. (2003). Ethnic diversity survey: a portrait of a multicultural society. Ottawa: Statistics Canada.
Sullivan, W., Heng, J., & Cameron, D. (2006). Consensus guidelines for primary health care of adults with
developmental disabilities. Canadian Family Physician, 52, 1410-1418.

WE ASK BECAUSE WE CARE
13
Tjepkema, M., Wilkins, R., Senécal, S., Guimond, E. & Penney, C. (2009). Mortality of Métis and registered
Indian adults in Canada: an 11-year follow-up study. Health Reports, 20, 31-51.
Tjepkema, M., Wilkins, R., Senécal, S., Guimond, E., & Penney, C. (2010). Mortality of urban aboriginal adults
in Canada, 1991–2001. Chronic Diseases in Canada, 31, 4-21.
Varcoe, C., Browne A., & Wong, S. (2009). Harms and benefits: collecting ethnicity data in a clinical context.
Social Science & Medicine, 68, 1659 –1666.
Veltman, A., Stewart, D., Gaetan, E., Tardif, S., & Branigan, M. (2001). Perceptions of primary healthcare
services among people with physical disabilities. part 1: access issues, Medscape General Medicine.
Williams, D. (2012). Milles to go before we sleep: racial inequalities in health. Journal of Health and Social
Behaviour, 53, 279-95.
Wray, R., & Hyman, I. (2013) Health inequalities and racialized groups: a literature review, Toronto Public Health.
TRI-HOSPITAL + TPH SUMMARY REPORT
1414
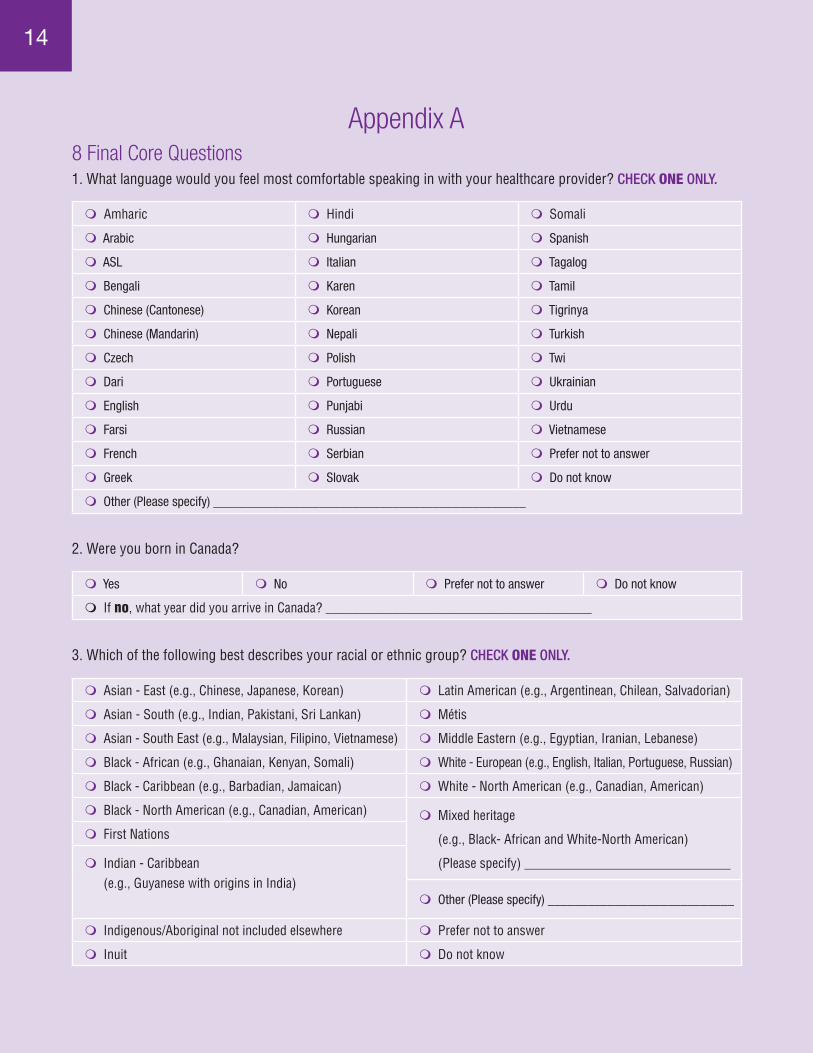
1. What language would you feel most comfortable speaking in with your healthcare provider? CHECK ONE ONLY.
m Amharic m Hindi m Somali
m Arabic m Hungarian m Spanish
m ASL m Italian m Tagalog
m Bengali m Karen m Tamil
m Chinese (Cantonese) m Korean m Tigrinya
m Chinese (Mandarin) m Nepali m Turkish
m Czech m Polish m Twi
m Dari m Portuguese m Ukrainian
m English m Punjabi m Urdu
m Farsi m Russian m Vietnamese
m French m Serbian m Prefer not to answer
m Greek m Slovak m Do not know
m Other (Please specify) _______________________________________________
2. Were you born in Canada?
m Yes m No m Prefer not to answer m Do not know
m If no, what year did you arrive in Canada? ________________________________________
3. Which of the following best describes your racial or ethnic group? CHECK ONE ONLY.
m Asian - East (e.g., Chinese, Japanese, Korean) m Latin American (e.g., Argentinean, Chilean, Salvadorian)
m Asian - South (e.g., Indian, Pakistani, Sri Lankan) m Métis
m Asian - South East (e.g., Malaysian, Filipino, Vietnamese) m Middle Eastern (e.g., Egyptian, Iranian, Lebanese)
m Black - African (e.g., Ghanaian, Kenyan, Somali) m White - European (e.g., English, Italian, Portuguese, Russian)
m Black - Caribbean (e.g., Barbadian, Jamaican) m White - North American (e.g., Canadian, American)
m Black - North American (e.g., Canadian, American) m Mixed heritage
(e.g., Black- African and White-North American)
(Please specify) _______________________________
m First Nations
m Indian - Caribbean (e.g., Guyanese with origins in India)
m Other (Please specify) ____________________________
m Indigenous/Aboriginal not included elsewhere m Prefer not to answer
m Inuit m Do not know
Appendix A8 Final Core Questions

WE ASK BECAUSE WE CARE
1515
4. Do you have any of the following disabilities? CHECK ALL THAT APPLY.
m No disabilities m Physical disability
m Chronic illness m Sensory disability (i.e. hearing or vision loss)
m Developmental disability m Other (Please specify) ____________________________________________m Drug or alcohol dependence
m Learning disability m Prefer not to answer
m Mental illness m Do not know
5. What is your gender? CHECK ONE ONLY.
m Female m Intersex m Male m Trans- Female to Male
m Trans-Male to Femalem Other (Please specify)
______________________m Prefer not to answer m Do not know
6. What is your sexual orientation? CHECK ONE ONLY.
m Bisexual m Two-Spirit
m Gay m Other (Please specify) ____________________________________________m Heterosexual (“straight”)
m Lesbian m Prefer not to answer
m Queer m Do not know
7. What was your total family income before taxes last year? CHECK ONE ONLY.
m $0 to $29,999 m $120,000 to $149,999
m $30,000 to $59,999 m $150,000 or more
m $60,000 to $89,999 m Prefer not to answer
m $90,000 to $119,999 m Do not know
8. How many people does this income support? ___________
m Prefer not to answer m Do not know

TRI-HOSPITAL + TPH SUMMARY REPORT
1616
Optional Questions(Recommended but not required by the TC LHIN)
1. In what language would you prefer to read healthcare information? CHECK ONE ONLY.
m Amharic m Hindi m Somali
m Arabic m Hungarian m Spanish
m Bengali m Italian m Tagalog
m Braille m Karen m Tamil
m Chinese (Simplified) m Korean m Tigrinya
m Chinese (Traditional) m Nepali m Turkish
m Czech m Polish m Twi
m Dari m Portuguese m Ukrainian
m Farsi m Punjabi m Urdu
m English m Russian m Vietnamese
m French m Serbian m Prefer not to answer
m Greek m Slovak m Do not know
m Other (Please specify) ______________________________________________
2. What is your religious or spiritual affiliation? CHECK ONE ONLY.
m I do not have a religious or spiritual affiliation m Jainism m Sikhism
m Animism or Shamanism m Jehovah’s Witnesses m Spiritual
m Atheism m Judaism m Unitarianism
m Baha’i Faith m Islam m Zoroastrianism
m Buddhism m Native Spirituality m Other (Please specify) ______________________m Christian, not included elsewhere on this list m Pagan
m Christian Orthodox m Protestant m Prefer not to answer
m Confucianism m Rastafarianism m Do not know
m Hinduism m Roman Catholic
3. What type of housing do you live in? CHECK ONE ONLY.
m Boarding Home m Homeless/on street m Shelter/Hostel m Prefer not to answer
m Correctional Facility m Own home m Supportive Housing m Do not know
m Group Home m Renting m Other (Please specify) ___________________________