Embed Size (px)
Citation preview

WDNR Wetland Rapid Assessment Methodology – User Guidance
Document Version 2.0
Wisconsin Department of Natural Resources
March 2014

CONTENTS Introduction ................................................................................................................................................................ 1
WRAM Specific Guidance ....................................................................................................................................... 2
Wetland Identification ...................................................................................................................................... 2
Site Description .................................................................................................................................................... 3
Site Map ................................................................................................................................................................... 4
Section 1: Functional Value Assessment .................................................................................................... 4
Human Use Values ......................................................................................................................................... 5
Wildlife Habitat ............................................................................................................................................... 6
Fish and Aquatic Life Habitat .................................................................................................................... 8
Shoreline Protection ..................................................................................................................................... 8
Storm and Floodwater Storage ................................................................................................................. 9
Water Quality Protection ............................................................................................................................ 9
Groundwater Processes............................................................................................................................ 10
Section 1 Comments ................................................................................................................................... 11
Section 2: Floristic Integrity ......................................................................................................................... 11
Plant Species List ......................................................................................................................................... 13
Summary of Floristic Integrity .............................................................................................................. 13
Section 3: Condition Assessment of Wetland Assessment Area and Buffer (stressor
checklist) .............................................................................................................................................................. 13
Summary of Condition Assessment ..................................................................................................... 14
Summary of Functional Values .............................................................................................................. 14
Section 4: Project Impact Assessment ..................................................................................................... 14
Brief Project Description .......................................................................................................................... 15
Expected Project Impacts ........................................................................................................................ 15
References ................................................................................................................................................................ 20

1
INTRODUCTION This methodology is intended as a rapid method for assessing wetland condition and
functional values based upon observable characteristics and using best professional
judgment to interpret those observations. Both desktop and field observations are
required. The user must also possess basic knowledge and expertise in wetland ecology.
The methodology is arranged in sections. The first page is general information about the
wetland. Section 1 is a series of questions or characteristics that apply to specific functional
values. A “yes” or “potential” answer indicates that the wetland supports, partially supports
or could support that use or functional value. The final determination of the significance of
functional support is based on the reviewer’s best professional judgment, guided by the
answers to the statements in the assessment form.
Floristic integrity is covered in Section 2. Floristic composition and integrity are significant
predictors for several functional values. Plant species lists can be done rapidly or site
information can be gathered using intensive methods, depending upon the time allotted for
fieldwork and the desired data resolution.
Section 3 assesses the condition of the wetland and surrounding area. Recent aerial
photographs in addition to good site investigation will be needed to complete this section.
After Section 3, there is a page to summarize the significance of functional values and
provide a rationale for those determinations.
Section 4 addresses how to evaluate potential impacts to a wetland’s functional values
resulting from a proposed activity.
This methodology can be used for any purpose where wetlands need to be assessed. It can
be used to collect Level 2 assessment data on the quality of wetlands. It is expected that
most assessments will be done to evaluate wetlands for regulatory purposes.
Field Work Preparation
Collect all necessary data before going into the field. Many of the layers and maps listed in
this document are available on the WDNR’s Surface Water Data Viewer (go to the WDNR
website and search “SWDV”). Several of the functional assessment factors require desktop
review of specific data sources. Examples of these data sources include the following:
ͻ Recent and historic aerial photographs
ͻ Topographic map
ͻ Wisconsin Wetland Inventory map
ͻ NRCS soils map
ͻ 12-digit Hydrologic Unit Code table
ͻ Wisconsin Priority Townships (Joint Venture Map)
ͻ Natural Heritage Inventory site map and data

2
ͻ Archaeological/historical site map
DNR employees go to
http://intranet/int/land/facilities/facilities/arch.html
Non-DNR employees contact the State Historical Society at
https://www.wisconsinhistory.org/archaeology/
ͻ Floodplain maps or special designated waters map
ͻ Project plans if evaluating a proposed project impact
ͻ Other maps or site information (survey or inventory data)
Make sure that weather conditions are appropriate for observing wetland functions. For
instance, early spring may be the best time to observe hydrologic functions in a floodplain
forest but mid-late summer may be the best time to document the plant community. For
that reason, multiple site visits are recommended. If only one visit is possible, it must occur
during the growing season.
WRAM SPECIFIC GUIDANCE This section describes specific aspects of the WRAM datasheet. Starting from page one of
the WRAM datasheet, this section explains each aspect of the datasheet in detail.
WETLAND IDENTIFICATION This section is found at the top of the first page of the WRAM. Below are explanations of the
wetland identification and location description information needed.
Project name: Name of the project site or owner.
File #: Permit number(s) related to a proposed wetland project or other identifying
information. This is usually a state or federal permit number. Include other
identifying number as appropriate for assessing a wetland for other purposes.
Evaluators/Date of visit(s): List major author plus all other evaluators and all dates
the site was visited.
Location: Include county, city, village or town, and township, range, section (to the
nearest quarter quarter) and/or latitude/ longitude coordinates. Example: NW NW
S32, T07N, R06E; Lat/Lon: 43o2’39.4”N 89o49’2.5”W, Town of Vermont, Dane
County.
Ecological Landscape: Refer to Ecological Landscapes layer in the Surface Water
Data Viewer (SWDV). Example: Western Coulee & Ridges.
Watershed: Refer to Watersheds layer in the SWDV. List the watershed code and
name. Example: LW15, Mill and Blue Mounds Creek.

3
SITE DESCRIPTION This section can be found at the bottom half of the top box on page one of the WRAM. Below
are definitions and explanations of the wetland physical descriptor parameters needed.
WWI Class: List the Wisconsin Wetland Inventory (WWI) Classification from SWDV
or paper maps. If unmapped, mark “unmapped”. Example: T3H.
Wetland Type: Use Eggers and Reed classification, third edition. If the site supports
a rare wetland type(s) as identified on the Natural Heritage Inventory Working List,
include that also. Example: Hardwood swamp (Eggers and Reed), Forested Seep
(NHI).
Wetland Area Impacted: Estimate in wetland acres areas potentially impacted by a
proposed project. Include all potential impacts and indicate type: direct, indirect,
secondary or cumulative impacts. If assessing a wetland for non-regulatory
purposes, indicate the purpose and acreage of the area being assessed.
Soils, mapped types: List all mapping units and soil series from the NRCS Wisconsin
Soils layer in the SWDV. Include the official soil series description found on the
NRCS web soil survey website. Example: Mapping unit: 21A .Soil Series: Palms
muck. Loamy, mixed, euic, mesic Terric Haplosaprist. Also add minor components.
Example: Minor soils include Ettrick silt loam, Kalmarville silt loam and water.
Field Verified: Indicate whether the mapped soil types were found on site. If not,
include as much information as you can about what type or types are present and
the possible reason the soil type did not match the mapped type. Examples: Not
verified. Soils are mapped as Otter silt loam but are organic, possibly Houghton
muck, or Not verified. Mapped soils overlain by coarse gravel fill.
Hydrology: Include as much information as possible about hydrology including
hydrology sources and any observed hydrology indicators. Example: Hydrology
source is seasonal high groundwater table and flooding from adjacent tributary
stream. Indicators observed include saturation to the surface (observed 4/21/11
and 5/16/11), drainage patterns, iron deposits and drift deposits.
Vegetation: Briefly describe all the plant communities within the area being
evaluated. Include areas that may be affected through direct, indirect, secondary
and cumulative impacts from a proposed project. Example: Area of potential direct
impacts is a southern sedge meadow dominated by Carex stricta. Secondary impacts
may affect two communities: shrub carr dominated by Salix interior and a forested
seep dominated by Fraxinus nigra and Symplocarpus foetidus.

4
SITE MAP This section can be found at the bottom half of the first page of the WRAM. Below are
instructions for drawing and describing the layout of the wetland assessment area.
Draw site details showing wetland being evaluated or include a generated map of
the site. Always include scale, a north arrow, wetland boundaries, potential or
current impact area, surrounding land uses, and any adjacent local roads or other
features to help locate the site. Also, draw a 100 meter buffer around the
assessment area. If generating a map, make sure that the Wisconsin Wetland
Inventory (WWI) mapped wetlands are accurate. If not, make changes to the map
showing actual locations. A copy of this map on a current aerial photo base should
be sent to Lois Simon, WWI Coordinator.
The Assessment Area (AA) should include the wetland in question, plus any
contiguous wetland areas that are in the same physical and hydrologic setting,
regardless of vegetation type. For instance, splits can be made where there is a
different hydrologic modifier on the WWI (“H” vs “K“) but not for different
vegetation types with the same hydrologic modifier (contiguous “S3K” and “E3K” or
“E2K” wetlands would be included the same Assessment Area). Splits can be made
where there is a distinct change in shape, such as an “hourglass” shape, to avoid
widely separated areas being part of the same Assessment Area. For evaluating
Floristic Integrity, each distinct plant community within the Assessment Area must
be evaluated separately.
A topographic map or GIS tools should be used to delineate the contributing
watershed of the AA.
SECTION 1: FUNCTIONAL VALUE ASSESSMENT This section can be found on page two of the WRAM. Below are instructions for answering
the questions in each of the seven subsections of this section.
For the wetland, if the characteristic is observed, mark “yes”. Mark “potential” if there is a
reasonable possibility of this characteristic occurring. An example is a wetland that is
supporting a breeding population of Blue-winged Teal (a Species of Greatest Conservation
Need) is marked as “yes” in that line of the Wildlife Habitat section. If Blue-winged Teal
have not been observed but the wetland supports suitable habitat, then you should mark
“potential”. Specific guidance for characteristics is described below.
Questions are in yes-no format but with the intent of informing your best professional
judgment of the level of significance of a function along a gradient. Document your best
professional judgment when a specific answer falls somewhere along the gradient. For
example, if the cutoff point for intact buffer land cover for wildlife habitat is 50% or less and

5
your site has 45% it will be very different from a site with 5%. Both answers would result
in a “no”, so an explanation in comments section is needed.
Use the comments section to describe answers. For example, provide comments if a
wetland is used by a local school for educational purposes or a state threatened species uses
the wetland for migratory habitat.
HUMAN USE VALUES
1. Used for recreation (hunting, birding, hiking, etc.): This applies to any
recreational use, whether private or public, active or passive. Also consider
tribal use.
2. Used for educational or scientific purposes: Includes any monitoring or research
(professional or volunteer) and school and nature tours, etc.
3. Visually or physically accessible to public: Visible from any public location,
including public land, roads and trails.
4. Aesthetically pleasing due to diversity of habitat types, lack of pollution or
degradation: Refers to wetlands which look “natural” without a lot of signs of
human influence. Potential can be marked if the wetland would appear
aesthetically pleasing after removing trash or other human disturbances.
5. In or adjacent to RED FLAG areas: List all that apply. Include RED FLAG areas
that the wetland is located in, has close proximity to or has a direct hydrologic
connection to the areas listed in the table below.
Listing of RED FLAG areas Cold water communities as defined in s. NR 102.04(3)(a), including all trout streams and their tributaries and trout lakes
Lakes Michigan and Superior and the Mississippi river
State and federal designated wild and scenic rivers, designated state riverways and state designated scenic urban waterways, s. 30.26, Stats., ch. NR 302, 16 USC 1271 to 1287, ss. 30.40 to 30.49, Stats., and s. 30.275, Stats Unique and significant wetlands identified in plans, including special area management plans (SAMP), special wetland inventory studies (SWIS), advanced delineation and identification studies (ADID), areas designated by the United States environmental protection agency under section 404(c), 33 USC 1344 (c) and regional natural areas plans Calcareous fens
State parks, forests, trails and recreation areas
State and federal fish and wildlife refuges and fish and wildlife management areas
State and federal designated wilderness areas (16 USC 1131 to 1135 and s. NR 1.415)
Designated or dedicated state natural areas established under ss. 23.27 to 23.29, Stats
Wild rice waters
Any other surface waters identified as outstanding or exceptional resource waters in ch. NR 102Priority natural communities listed in the Ecological Landscapes Handbook Areas with significant tribal interest

6
6. Supports or provides habitat for endangered, threatened or special concern
species: Include plant and animal species and indicate whether they are
federally or state endangered, threatened or special concern. Make sure to
include wetland, aquatic and terrestrial species that require or use wetlands for
all or part of their life cycles. Listed species are confidential (not public)
information and should be included in the file under a cover memo with this
language:
Natural Heritage Inventory (NHI) data are for official DNR staff use
only and are not to be provided outside of the DNR. These data are
exempt from the State Open Records Law (s. 19.35, 23.27(3)(b)). These data
are considered sensitive for several reasons and thus not appropriate for
general distribution.
7. In or adjacent to archaeological or cultural resource site: DNR employees check
intranet website http://intranet/int/land/facilities/facilities/arch.html to
determine whether the wetland may be located in or adjacent to an
archaeological or cultural resource site. Non-DNR employees check with the
State Historical Society by going to
https://www.wisconsinhistory.org/archaeology/. If the wetland is within a
designated area, follow the procedures in Manual Code 1810.1.
WILDLIFE HABITAT The wildlife habitat section refers to wildlife species and the habitat they use for all or
portions of their life stages. This section does not apply to aquatic species that are totally
dependent on permanently inundated wetlands for their entire life cycles except for aquatic
species used as food by wildlife species.
1. Wetland and contiguous habitat >10 acres: Consider both wetland and upland
habitat.
2. 3 or more strata present (> 10% cover): Strata include tree, sapling, shrub, herb
and vine.
3. Within or adjacent to habitat corridor or established wildlife habitat areas:
Include all mapped or designated corridors including primary and secondary
environmental corridors.
4. Buffer land cover ≥50% (southern Wisconsin) and 75% (northern Wisconsin)
intact: The division between northern and southern Wisconsin is State Highway
(STH) 10. A default buffer area is 100 meters. Buffer area is described in detail
in Section 4. A natural land cover buffer means an absence of human uses that
create a barrier to wildlife, e.g., roads wider than 20 feet or intensive urban
development.

7
5. Occurs in a Joint Venture priority township: This designation is based on the
Upper Mississippi River and Great Lakes Region Joint Venture – Wisconsin Plan.
This document is available on the WDNR website (search “waterfowl
management”). See Appendix A for the map of priority townships.
6. Interspersion of different habitat structure (hemi-marsh, shrub/emergent,
wetland/upland complex, etc.): Diverse habitats generally support more diverse
assemblages of wildlife.
7. Supports or provides habitat for SGCN, birds listed as priority species in the
Wisconsin All-Bird Conservation Plan or other plans: Species of Greatest
Conservation Need (SGCN) have low and/or declining populations that are in
need of conservation action. They include various birds, fish, mammals, reptiles,
amphibians, and invertebrates (e.g. dragonflies, butterflies, and freshwater
mussels) that are: already listed as threatened or endangered; at risk because of
threats to their life history needs or their habitats; stable in number in
Wisconsin, but declining in adjacent states or nationally or of unknown status in
Wisconsin and suspected to be vulnerable. SGCN Species can be found by going
to the WDNR website and searching for “Wildlife Action Plan”.
Priority bird species are identified by the Wisconsin Bird Conservation Initiative
(WBCI). WBCI developed this list from national bird conservation plans,
regional planning documents and Wisconsin’s Wildlife Action Plan (WAP).
Consult the WAP for other species, including plants. This list represents both
rare species and more common species that are considered important. The
priority species list is at: http://www.wisconsinbirds.org/plan/species/list.htm.
8. Part of a large habitat block that supports area sensitive species: Consider
wildlife species that rely on any habitat types, including emergent (marsh,
grasslands, meadows), shrub/scrub, forested or habitat complexes. Some
examples of area sensitive species are black bears, bobcats, Scarlet Tanagers,
Northern Harrier, Sedge Wren and Yellow Rail. Large mammals are generally
area sensitive. See WDNR PUBL-SS-925-97: Managing habitat for grassland
birds: a guide for Wisconsin by David W. Sample and Michael J. Mossman for more
information on area sensitive grassland birds. Information about area-sensitive
forest interior birds can be found in A land managers guide to improving habitat
for Scarlet Tanagers and other forest-interior birds. See references for website
links. http://www.birds.cornell.edu/conservation/tanager/midwest.html. For
more information on area sensitive species, consult with a local wildlife biologist
or see additional references listed in the References section.
9. Ephemeral pond with water present ≥ 45 days: An ephemeral pond is an
isolated wetland that contains ponded water for part of the growing season.
These wetlands regularly dry down which eliminates fish populations that
would prey on amphibians. Forty-five days is a general minimum length of time
for amphibians to successfully complete their breeding cycles.

8
10. Standing water provides habitat for amphibians and aquatic invertebrates:
These species provide food for wildlife species. Invertebrates are especially
critical for breeding waterfowl.
11. Seasonally exposed mudflats: These areas can provide critical migratory
shorebird habitat.
12. Provides habitat scarce in the area (urban, agricultural, etc.): These wetlands
may be small but they may be critical in highly modified urban or agricultural
areas where habitat is scarce.
FISH AND AQUATIC LIFE HABITAT This section applies to fish, aquatic invertebrates, mollusks, amphibians and aquatic reptile
species.
1. Wetland is connected to or contiguous with perennial stream or lake: Also
consider that intermittent waterways connecting the wetland to perennial
streams or lakes may provide seasonal access for fish and aquatic life species for
breeding.
2. Standing water provides habitat for amphibians and aquatic invertebrates:
Amphibians and invertebrates provide food for fish species.
3. NHI listed aquatic species within aquatic system: The Natural Heritage
Inventory (NHI) lists state endangered, threatened and special concern species
(WDNR website, search “NHI working list”).
4. Vegetation is inundated in spring: shallow water wetlands with vegetation that
is inundated in spring are highly productive for invertebrate populations.
Invertebrates are important food for fish and other aquatic species such as
larval salamanders. Also consider wetlands which are not connected to
perennial surface waters. Ephemeral ponds with water present for at least two
weeks may support breeding populations of fairy shrimp and other
invertebrates.
SHORELINE PROTECTION This section applies to wetlands that abut lakes, rivers, or streams.
1. Along shoreline of a stream, lake, pond or open water area (≥1 acre): The
wetland must be associated with a stream, lake or other waterbody to perform
this function.
2. Potential for erosion due to wind fetch, waves, heavy boat traffic, erosive soils,
fluctuating water levels or high flows: Shoreline is exposed to conditions which
may be erosive.
3. Densely rooted emergent or woody vegetation: Vegetation must be dense
enough to be capable of attenuating the erosive forces of waves or currents.

9
STORM AND FLOODWATER STORAGE This section refers to storm and floodwater storage and attenuation.
1. Basin wetland, constricted outlet, has through-flow or is adjacent to a stream:
These geomorphic positions and cross-sectional wetland shapes allow the
wetland to receive surface or floodwaters during a flood event and temporarily
store it to be gradually released back to surface waters as opposed to wetlands
on extensive flats. For constricted outlet, this may be a natural constriction or
an artificial outlet that constricts flow, such as a culvert, bridge, dam or road.
Mark this as “yes” if one or more of these factors are observed.
2. Water flow through wetland is NOT channelized: Note the cross-section and
length of any channels to judge the volume of water that will flow through the
channel before water overtops the banks of the channel into the wetland.
3. Dense, persistent vegetation
4. Evidence of flashy hydrology: Evidence includes water marks on trees, sediment
deposits, drift deposits, algal mat or crust, iron deposits, sparsely vegetated
concave surface, water-stained leaves, deposits of aquatic fauna, marl deposits,
surface soil cracks, drainage patterns and moss trim lines. See the Regional
Supplements to the Corps of Engineers Wetland Delineation Manual for further
descriptions. This factor applies not only to observations within the wetland but
also to any observations in the contributing watershed. Note whether the
observation is in the wetland or watershed.
5. Point or non-point source inflow: Includes urban and agricultural stormwater
and wastewater treatment, cooling water and other inputs. Examples of urban
inputs include runoff from roads, buildings and parking lots.
6. Impervious surfaces cover ≥10% of land surface within the watershed: Consult
the % heavy urban land cover in the 12-digit HUC code table. This provides
context for the relative need for water storage at the watershed level. See
Appendix B.
7. Within a watershed with ≤10% wetland: See Appendix B. The wetland
watershed can be identified to the 12-digit Federal Hydrologic Unit Code (HUC)
on the SWDV.
8. Potential to hold > 10% of the runoff from contributing area from a 2-year 24-
hour storm event: See Appendix C for step-by-step instructions on how to
calculate storm and floodwater capacity storage.
WATER QUALITY PROTECTION This section refers to sediment trapping and nutrient retention and transformation that
improve downstream water quality.
1. Provides substantial storage of storm and floodwater: This is as determined in
the previous section.
2. Basin wetland or constricted outlet

10
3. Water flow through wetland is NOT channelized: Note the cross-section and
length of any channels to estimate the volume of water that will flow through
the channel before water overtops the banks of the channel into the wetland.
The wetland will not have the opportunity to trap sediment in channelized
water flow.
4. Vegetated wetland associated with a lake or stream 5. Dense, persistent vegetation
6. Signs of excess nutrients, such as algae blooms or heavy macrophyte growth:
Macrophytes include species such as cattails, duckweed, milfoil and coontail.
7. Stormwater or surface water from agricultural land is a major hydrology source
8. Discharge to surface water: Outflow from the wetland discharges to surface
water.
9. Natural land cover in buffer <50%: The buffer can be determined by drawing a
line 100 meters (~330 foot) from the outer edge of the area to be assessed (see
Section 3). Do not consider land outside the wetland AA watershed.
GROUNDWATER PROCESSES This section refers to both groundwater discharge and recharge processes.
1. Springs, seeps or indicators of groundwater present: Indicators of groundwater
include iron and marl deposits and certain plant species such as angelica
(Angelica atropurpurea), joe-pye weed (Eupatorium maculatum), boneset
(Eupatorium perfoliatum), watercress (Nasturtium officinale), skunk cabbage
(Symplocarpos foetidus), marsh marigold (Caltha palustris), rough-leaved
goldenrod (Solidago patula) and some sedges (Carex spp.). Many other plant
species inhabit fens and are good indicators (see UW leaflet 17, “demystifying
fens” http://www.botany.wisc.edu/zedler/images/Leaflet_17.pdf).
2. Location near a groundwater divide or a headwater wetland: These wetlands
are likely to recharge groundwater. Headwater wetlands are located adjacent to
or upstream from a first order stream.
3. Wetland remains saturated for an extended time period with no additional
water inputs: These inputs are surface water or precipitation.
4. Wetland soils are organic: Organic soils form under saturated conditions which
are likely to be groundwater-dominated. Verify on Web Soil Survey and in the
field that the soil is organic.
5. Wetland is located within a wellhead protection area: Check with the WDNR’s
Wellhead Protection Program to determine if the wetland may be located within
a community’s designated wellhead protection area. More specific information
on wellhead protection areas is available from the local communities.

11
SECTION 1 COMMENTS This section can be found on the top of page three of the WRAM. Use this space to add
comments on the functional value factors. Use the code and numbers, for example, WH2, to
comment on factor 2 in the wildlife habitat section.
Wildlife Habitat and Species Observations
Include any observations of wildlife species, including amphibians and reptiles.
List the type of observation, i.e., direct or tracks, scat or other sign. Also list how
the species is using the wetland, i.e., nesting, migratory, winter use, etc. If the
habitat provides the potential for species but they have not been observed,
indicate that under the “potential” column. Also include any recorded reliable
data.
Fish and Aquatic Life Habitat and Species Observations
List direct observations and other signs. Describe the type of habitat the
wetland provides, i.e., nesting, spawning, nursery areas, etc. Include any reliable
recorded data.
SECTION 2: FLORISTIC INTEGRITY This section can be found beginning on page four of the WRAM datasheet. Floristic integrity
is both a functional value and an indicator of wetland condition. For example, a high
integrity plant community is intrinsically valuable. These plant communities are a part of
our natural heritage. Floristic integrity is also a measure of the biological community’s
response to stressors. As a functional value, it fits in Section 1. As a measure of condition, it
fits in Section 3. Floristic integrity is included in the Summary of Functional Values found
on page six of the WRAM form.
Plant Community Integrity: The floristic integrity section may be filled out in full
or partially if plant species data is not complete. The essential part is the first
four questions, with the floristic quality assessment questions optional. Floristic
quality calculations are based on a fairly thorough plant species list. If this is not
possible due to an inability to collect thorough species data, then the Floristic
Quality Assessment section may be left blank.
ͻ Invasive species cover should be determined based upon visual estimates.
More quantitative data should be used if available. Examples of this data
include vegetation surveys or remote sensing data (reed canary grass layer
on the Surface Water Data Viewer). This data with estimates of percent
cover should be verified in the field. Invasive species are typically non-
native species which disrupt and replace native species.

12
ͻ Strata: “Strata” refers to tree, sapling, shrub, herb or vine. Many plant
communities do not have multiple strata, so this category refers to other
indicators of plant community integrity, i.e., lack of bare areas, native cover.
ͻ NHI Plant Community Rating: The plant community or communities should
be identified to determine state rank number (S). Go to the WDNR website
and search for “Natural Communities” to see a list of wetland plant
communities and their rank number. The rank number is a key feature of
the Natural Heritage Inventory methodology as a method for assessing
rarity of the plant communities, species and other elements.
ͻ Relative frequency of plant community in watershed: Rarity of a plant
community within a watershed will affect the rating in this category. An
example of a rare plant community which will be rated high to exceptional is
a southern tamarack swamp located well south of the tension zone in the
southern part of the state. A tamarack swamp in northern Wisconsin would
not rank as high.
ͻ FQI and Mean C: Floristic Quality Assessment Indicators – FQI and mean
C: These indicators of plant community condition can be calculated from
a complete plant inventory of the wetland Assessment Area. Weighted Mean
C and Weighted FQI can be calculated if the inventory includes measures of
abundance, such as percent cover estimates for each species. Conducting a
survey to compile a complete plant list would involve a higher level of effort
and a higher level of botanical expertise than is generally assumed for the
Rapid Assessment. Floristic Quality Assessment is recommended when a
higher, more intensive level of analysis is needed.
The method is based on the assignment of coefficients of conservatism (CofC), for vascular
plant species by an expert group thoroughly familiar with a regional flora. Coefficients of
conservatism are based on an estimate of the site fidelity and tolerance of anthropogenic
disturbance for each species. CofC values have been assigned for all species recognized as
part of the Wisconsin flora, considering the entire state as a region. To date a study of the SE
Wisconsin Till Plains Ecoregion has been completed and a study of the Lake Superior Basin
is nearing completion. The benchmark values for un-weighted Mean C and FQI shown in the
table are for the SE WI Till Plains, and discriminate between low, medium, high and
excellent plant community condition. These were calculated using all species (both native
and non-native) present on a site. The Lake Superior FQA benchmark values will be specific
to certain plant communities, and will be for weighted Mean C and weighted FQI based on
all species. Surveys are planned to develop benchmarks for all four of Wisconsin’s major

13
ecoregions over the next 3-4 years. The SE WI Till Plains benchmarks should be considered
as default values until additional surveys are completed.
It is essential that FQI and mean C calculations be done separately for each wetland plant
community type. Comparisons should only be made within the same plant community
type. For example, one can only compare the ratings of a shallow marsh with those of other
shallow marshes.
A description of the Floristic Quality Assessment methodology can be found on the WDNR
website, search “FQI”.
PLANT SPECIES LIST Plants should be identified to the species level and common names should also
be listed. Nomenclature can be based upon various sources, but should be
identified when using a source other than UW-Herbaria (Freckmann or
Madison).
Mark dominant species with an asterisk (*) based upon standard dominance
determination techniques such as those used to determine hydrophytic
vegetation indicators. Techniques include the Rapid Test for Hydrophytic
Vegetation, the Dominance Test (50-20 rule), Prevalence Index or other
recognized technique (see Wetland Delineation Regional Supplements).
List the coefficient of conservatism if possible.
If more than one plant community is present, specify the plant community in
that column.
When possible, estimate absolute percent cover of each species. Estimates of
percent cover may be based upon a visual estimate or quantitative data. Specify
the method used.
SUMMARY OF FLORISTIC INTEGRITY Provide a general overview of all the floristic communities in this section. Summarize the
different plant communities, dominant species, rare species, percent cover of natives vs.
non-natives and invasive species, relative level and permanence of disturbance and sources.
SECTION 3: CONDITION ASSESSMENT OF WETLAND ASSESSMENT AREA AND BUFFER
(STRESSOR CHECKLIST) This section can be found beginning at the top of page five of the WRAM. This section
assesses the condition of the wetland based upon past and current land use stressors.
Assessment area is determined on a case by case basis. An assessment area may be an
entire wetland or a portion of a wetland. Buffer is defined as an area within a 100-meter

14
(~330 foot) radius around the assessment area. These areas should be marked on recent
aerial imagery.
Stressors are evaluated in both the wetland assessment area and buffer area.
Check either or both columns for those that apply.
Historic refers to a stressor which is evident but which is currently unlikely
to be causing any measurable effect on the wetland. An example is an old
drainage ditch which has filled in over time and where the affected area has
reverted back to high quality wetland. Do not consider the stressor historic
if the stressor is still affecting the wetland, i.e., wetland is still being drained
by the drainage ditch. Check the column for all stressors where historic
stressors are present.
Stressor impact levels should be ranked as “L” for low, “M” for medium or
“H” for high. This is a subjective decision based upon reviewer’s assessment
of the level of impact resulting from each stressor.
Relative frequency: Mark all that apply with “C” for common and “UC” for
uncommon. Consider the general condition of wetlands in the region or
watershed. In very urbanized settings, the relative frequency of many
stressors may be common. In more pristine settings, most stressors will be
uncommon.
SUMMARY OF CONDITION ASSESSMENT Describe the general condition of the wetland including: stressors, impact levels (low,
medium or high), impact locations (wetland assessment area or the buffer), whether
historic or recent, and relative frequency in the region or watershed.
SUMMARY OF FUNCTIONAL VALUES Significance: Significance of functional values is based upon how many characteristics were
ranked as “yes” or “potential” in Sections 1 and 2. The significance rating should also take
into account the relative performance of the function within the wetland. For example, a
high storm and floodwater storage function may be ranked as exceptional if the wetland is
located in a heavy urban use area.
Rationale: Describe the reason for the ranking here. This section should summarize the
positive ranked answers from Section 1 plus the floristic integrity assessment from Section
2.
SECTION 4: PROJECT IMPACT ASSESSMENT This section can be found beginning at the top of page seven of the WRAM datasheet. This
section is optional and is intended for use when evaluating potential impacts resulting from
a project which may affect a wetland.

15
BRIEF PROJECT DESCRIPTION Provide a brief description of a proposed project including type, extent and other general
information that is pertinent. Example: Proposed project is a real estate development
project which proposes to impact 0.3 acres of wetland through residential road
construction. The proposed road fill was minimized to reduce direct wetland loss.
Additional wetland loss or degradation may occur through indirect, secondary and
cumulative impacts.
EXPECTED PROJECT IMPACTS The table in the WRAM is intended to evaluate the potential for both positive and negative
wetland impacts resulting from the proposed project. The first column breaks down
impacts by type. Definitions for these impact types are:
Direct impacts are those that occur immediately as a result of the activity. Example:
A proposal to extend a road across a wetland will result in a direct wetland loss of
0.5 acres.
Secondary (or indirect) impacts are closely linked or causally related to the activity
but may occur over a longer period of time. Example: The road fill may indirectly
affect wildlife by altering drainage patterns and fragmenting habitat for species that
can no longer travel between breeding and non-breeding habitats. The road may
also provide access to landowners who wish to develop properties where additional
wetlands may need to be filled in order to create developable lots. Secondary
impacts are often much more extensive than direct impacts.
ͻ Secondary Impact Assessment and Buffer Concepts
Assessing wetlands requires the evaluation of not just the wetland but also
buffer areas surrounding the wetland. A buffer is a zone that protects the
wetland against the effects of human impacts, such as agriculture or residential
development. These land uses and human activities may have negative
influences on wetland functional values. Buffer zones can also provide suitable
adjacent habitat for wetland dependent wildlife. Wetland buffers are generally
thought of as upland but may be wetland of a different quality or community
type as the wetland area being buffered. An example of this is a high quality
sedge meadow that is surrounded by a degraded zone of Phalaris arundinacea
(reed canary grass). The degraded zone may provide some buffering capacity
for the higher quality area. There is a need to consider buffers when there is
concern about rare or important plant communities, animal species, important
water quality or other wetland functional values.
Activities that affect the quality or size of a buffer should be evaluated when
considering secondary project impacts. An important consideration is which

16
functional value(s) the wetland performs that the buffer is protecting. Different
minimum buffer sizes are needed for different wetland functional values.
Literature on buffer requirements provides some general guides on size
requirements.
ͻ Water Quality Buffer
The ability to trap sediment depends on the soil type, slope and vegetation in the
buffer area and the flow entering the buffer. Generally 100 feet (30 meters) is
used as a default assumption for effective water quality protection.
Concentrated flow coming into the buffer area will greatly decrease its ability to
trap sediment. Steep slopes in the buffer and erodible soil will also decrease
buffer effectiveness. Sediment trapping is most effective where vegetation is
thick and dense, less effective where vegetation is sparse and not effective
where there is disturbed or bare soil. Runoff containing silt and clay sized
particles will greatly increase the buffer width required to trap sediment, even if
the slope and vegetation characteristics are favorable.
ͻ Wildlife Habitat Buffer
The assessor should consider the range of wildlife known or likely to use the
wetland of interest and evaluate if the surrounding buffer area provides suitable
adjacent habitat. Work on wildlife habitat buffer widths around water bodies
has shown a very wide range in the width of adjacent suitable habitat that can
support various species. Values range from 30 feet (10m) along the water’s edge
for aquatic-oriented green frogs to over 1000 feet (300 meters) for salamanders
whose home range of terrestrial habitat extends far from its breeding pool. As
mentioned in the wildlife section, area sensitive species may need larger blocks
of habitat with buffers of 150 to over 300 feet. A general default number for a
wildlife buffer is of limited value, because it depends on the species of concern. A
buffer in the range 100-300 feet (30 meters – 90 meters) is a reasonable starting
point for general consideration. Experts should be consulted when specific
wildlife species are considered.
Amphibians and reptiles use ephemeral pond wetlands as breeding pools, but
also require adjacent core terrestrial habitat for other life-cycle
needs. Terrestrial habitats can be grassland, forested upland or forested
wetland, depending on the species. Most amphibians and reptiles return to the
same pond to breed. Home ranges can extend well beyond 1000 feet.
ͻ Plant Community Buffer
Buffers required to protect a natural plant community or complex will vary in
size. The general water quality default of a minimum of 100 feet can be used.

17
Effectiveness of water quality buffers depends on the soil type, slope and
vegetation in the buffer area and the flow entering the wetland. Another
important consideration is whether the contributing watershed or adjacent
areas support invasive species. Rare plant species or communities should be
evaluated more rigorously to determine whether a 100-foot buffer is adequate.
Also, consider the type of invasive species and dispersal pathways, i.e., bird,
animal, human, wind or water. A buffer that can’t filter stormwater runoff from
an infested property will not be adequate to protect a wetland from an invasive
plant species whose seeds are water-dispersed. Distance from the wetland and
prevailing winds are important considerations for invasive species whose seeds
are wind-dispersed.
When evaluating potential impacts to a wetland, consider how the loss of a
buffer, either wetland or upland, will impact the wetland’s functional values.
For example, a project which proposes to fill only a small area of low quality
reed canary grass-dominated wetland may result in insignificant direct wetland
impacts. However, if the low quality wetland is buffering an area of higher
quality sedge meadow, then the expected secondary impact could potentially be
a degradation or even total loss of the sedge meadow plant community.
Cumulative impacts are those impacts attributable to the proposed activity which
may occur, based upon past or reasonably anticipated impacts on wetland
functional values of similar activities in the affected area. Example: Permitting a
wetland fill for a landowner to develop a buildable lot may result in other proposals
for landowners under similar circumstances. One can anticipate that this would
result in additional wetland losses and impacts.
To determine whether cumulative impacts are significant, calculate the acreage
and/or the percent of the wetland that will be lost or impacted if similar projects are
allowed to occur within the wetland. The assumption will apply to other property
owners or to the current project proponent if this individual is the sole owner of the
wetland property. Then, using the loss/impact analysis, reassess functional values
of the wetland to determine if the gain or loss will be significant.
18
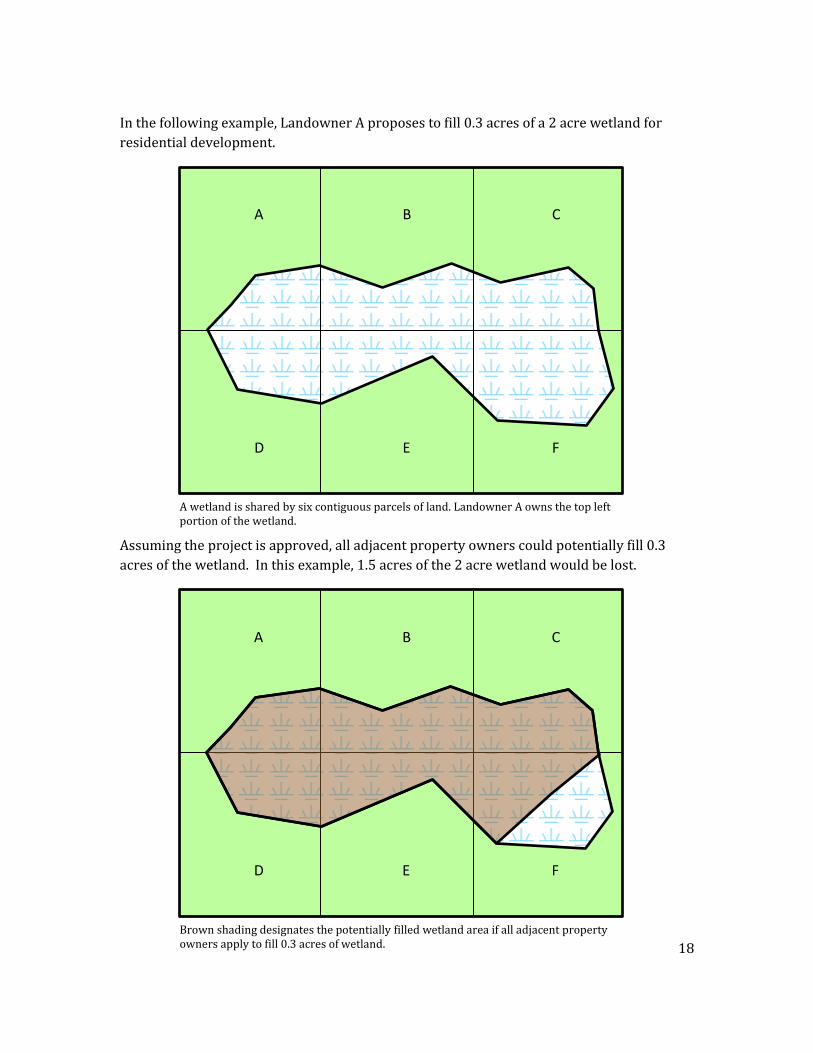
In the following example, Landowner A proposes to fill 0.3 acres of a 2 acre wetland for
residential development.
Assuming the project is approved, all adjacent property owners could potentially fill 0.3
acres of the wetland. In this example, 1.5 acres of the 2 acre wetland would be lost.
A B C
D E F
A B C
D E F
A wetland is shared by six contiguous parcels of land. Landowner A owns the top left portion of the wetland.
Brown shading designates the potentially filled wetland area if all adjacent property owners apply to fill 0.3 acres of wetland.

19
Reassess the functional values of the remaining 0.5 acre wetland. Then compare this result
to the functional values of the entire wetland to determine if the cumulative loss would be
significant.
Spatial/Habitat Integrity refers to the loss of wetlands within an area where
these wetlands may be critical habitat components to a species or assemblage of
species. Example: Large habitat blocks are critical for many grassland, marsh or
forest-dwelling species of birds and mammals. The loss of part of, or
fragmentation of, a wetland may result in the loss of a population of these area
sensitive species. This concept also refers to the location of core essential
habitat units and a species’ ability to move between these units to maintain
healthy populations. Loss of specific habitat units may result in the ultimate loss
of a species within an area.
Rare Plant/Animal Communities refers to any impact that may occur to rare
species. Example: A proposed wetland fill for a road project is expected to result
in the loss of ten individuals of the state threatened plant Cypripedium candidum
(small white lady’s-slipper orchid).
Permanence/Reversibility: In this column, include the level of permanence or
reversibility of expected project impacts. Include this for each impact category.
Example: Direct Impacts: The road fill will impact 0.3 acres of wetland resulting
in a permanent wetland loss. Indirect Impacts: The road fill site is expected to
change hydrology in the remaining wetlands. This hydrologic change may result
in the degradation and eventual loss of an estimated 10 acres of wet prairie
wetlands. Rare Plant/Animal Communities: Changes in hydrology are likely to
result in the additional loss of the remaining population of Cypripedium
candidum (white lady-slipper orchid). Loss of rare plant community types and
rare species is likely to be permanent and irreversible.
Significance (Low, Medium, High): Rate the significance of the expected impact
based upon all factors. Example: Direct Impacts: For a project proposing to fill
0.3 acres of a 30 acre wetland, the direct loss of wetlands is of moderate
significance. While the wetland rates as moderate to high functional
significance, in this example, the loss is less than 1% of the entire wetland.
Indirect Impacts: The additional degradation and/or loss of an estimated 10
acres of wet prairie is of high significance for a wetland rated as having
moderate to high functional significance. Rare Plant/Animal Communities:
Expected project impacts are a direct loss of a small number of the threatened
plant species Cypripedium candidum but through indirect impacts from
hydrologic changes, a total loss of a large population occurring across a ten acre
site. This population is only one of two known to occur within this watershed.
This impact is likely to be significant.

20
REFERENCES
Bernthal, Thomas W. 2003. Development of a
floristic quality assessment methodology for
Wisconsin. Wisconsin Department of Natural
Resources, Bureau of Integrated Science
Services, Madison, WI.
(PUB-SS-986 2003). 18 pp. + appendix.
http://dnr.wi.gov/org/water/fhp/wetlands/
documents/FQAMethodWithAcknowledgeme
nts.pdf.
Bernthal, Thomas W., J. Kline, A. Reis. 2007.
Floristic Quality Assessment Benchmarks for
Wetlands in Southeast Wisconsin. Wisconsin
Department of Natural Resources.
Final Report to USEPA—Region V. Wetland
Grant #CD96511801.
Castelle, A.J., Johnson, A.W. and Conolly, C.
1994. Wetland and stream buffer size
requirement – a review. Journal of
Environmental Quality 23:878-882.
Cornell Lab of Ornithology. A Land Manager’s
Guide to improving habitat for Scarlet
Tanagers and other forest-interior birds,
http://www.birds.cornell.edu/conservation/t
anager/midwest.html.
Eggers, Steve D. and Donald M. Reed. 2011.
Wetland plants and plant communities of
Minnesota and Wisconsin, 3rd edition. U.S.
Army Corps of Engineers, St. Paul District.
Hagan, III, J.M. (editor). 1992. Ecology and
conservation of Neotropical migrant
landbirds. Smithsonian Institution Press,
Washington, D.C.
Harper, E., Rittenhouse, T., and Semlitsch, R.
2008. Demographic consequences of
terrestrial habitat loss for pool-breeding
amphibians: predicting extinction risks
associated with inadequate size of buffer
zones. Conservation Biology 22(5):1205-
1215.
Hlina, P., N. Danz, and T. Bernthal. In
preparation. Anticipated title: Lake Superior
Basin Floristic Quality Assessment Survey:
Setting Benchmarks for Inland Wetland Plant
Communities. Lake Superior Research
Institute, University of Wisconsin-Superior.
Michigan Department of Natural Resources
and Environment. 2010 Michigan rapid
assessment method for wetlands (MiRAM),
Version 2.1. DNRE, Lansing, Michigan.
Miller, Nicholas A, J.L. Wagner, and N.L. Van
Helden. 2009. Wetland protection priorities
and restoration opportunities in the
Sheboygan River Basin. The Nature
Conservancy.
Minnesota Board of Water and Soil
Resources, Minnesota routine assessment
method for evaluating wetland functions
(MnRAM 3.4).
Rosenberg, K.V, R.W. Rohrbaugh, Jr., S.E.
Barker, J.D. Lowe, R.S. Hames, and A.A.
Dhondt. 1999. A land manager’s guide to
improving habitat for scarlet tanagers and
other forest-interior birds. The Cornell Lab of
Ornithology.

21
Sample, David W. and Michael J. Mossman
Managing habitat for grassland birds: a guide
for Wisconsin. WDNR PUBL-SS-925-97.
http://www.npwrc.usgs.gov/resource/birds/
wiscbird/index.htm.
Semlitsch, R. and Bodie, R. 2003. Biological
criteria for buffer zones around wetlands and
riparian habitats for amphibians and reptiles.
Conservation Biology 17(5):1219-1228.
Southeastern Wisconsin Regional Planning
Commission. 2010. Managing the water’s
edge: making natural connections.
Thompson, III, F.R. ed. 1996. Management of
Midwestern landscapes for the conservation
of neotropical migratory birds. U.S.
Department of Agriculture, North Central
Forest Experiment Station, General Technical
Report NC-187.
Wisconsin Department of Natural Resources.
2012. Ecological Landscapes of Wisconsin.
Handbook 1805.1, Wisconsin Department of
Natural Resources, Madison.
Wisconsin Department of Natural
Resources. 2005. Wisconsin's Strategy for
Wildlife Species of Greatest Conservation
Need. Madison, WI.

Appendices
Appendix A: Wisconsin Priority Townships
Appendix B: Wetland Characteristics for 12-Digit Watersheds
Appendix C: Storm and Floodwater Storage Example


![Draft resolution on the rapid assessment of wetland ... · Draft resolution on the rapid assessment of wetland ecosystem [services] [functions] Submitted by the Republic of Korea](https://img.pdfslide.us/doc/110x75/5dd112afd6be591ccb6416bc/draft-resolution-on-the-rapid-assessment-of-wetland-draft-resolution-on-the.jpg)
![Rapid Prototyping Methodology in Action: A Developmental …gmswan3/609/Jones_Richey_2000.pdf · Rapid Prototyping Methodology in Action: A Developmental Study [] ... enhances traditional](https://img.pdfslide.us/doc/110x75/5aef7fef7f8b9ac2468cdf6c/rapid-prototyping-methodology-in-action-a-developmental-gmswan3609jonesrichey2000pdfrapid.jpg)