Embed Size (px)
Citation preview
WCSD Board of Trustees
Katy Simon Holland, President Malena Raymond, Vice President John Mayer, Clerk Scott Kelley, District A Debra Feemster, Ph.D., District C Angela Taylor, Ph.D., District E Verónica Frenkel, M.A., District F Traci Davis, Superintendent
Sections
• Equity Lens
• K-8 Pathway Indicators
• HS pathway and College Readiness
• Chronic Absenteeism
• Climate and Conditions for Learning
• Glossary of Terms & Acronyms
Equity Lens
The Washoe County School District Equity and Diversity Department would like to encourage you to look at your Data through an Equity Lens.
As we move forward with this great work, it is important for us to understand that Equity includes Culture, Leadership, and Practice. We must work to incorporate Rigor, Relevancy, Relationships, and Expectations into every area of our schools' climate. We are all working to ensure successful outcomes for ALL of our students, and the following resources are tools to guide your planning, programming, policies, and decisions that impact equitable outcomes for ALL of our students, families, and staff in our district.
1
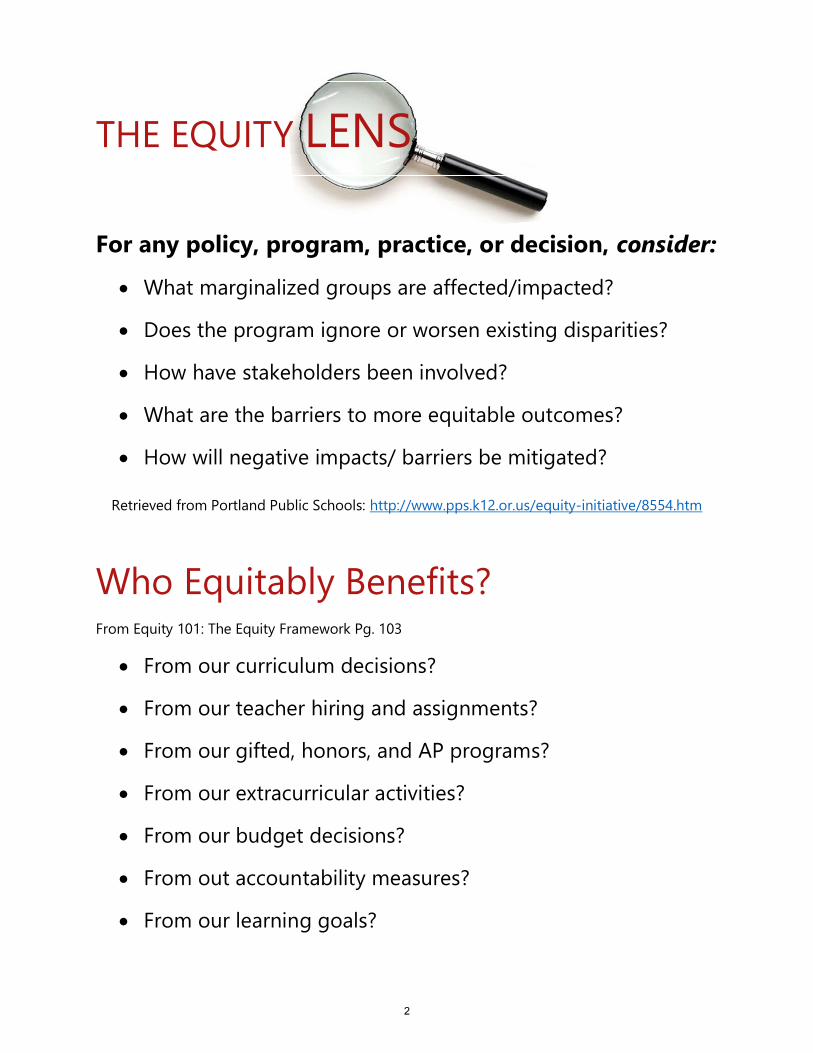
THE EQUITY LENSFor any policy, program, practice, or decision, consider:
What marginalized groups are affected/impacted? Does the program ignore or worsen existing disparities? How have stakeholders been involved? What are the barriers to more equitable outcomes? How will negative impacts/ barriers be mitigated?
Retrieved from Portland Public Schools: http://www.pps.k12.or.us/equity-initiative/8554.htm
Who Equitably Benefits?From Equity 101: The Equity Framework Pg. 103
From our curriculum decisions? From our teacher hiring and assignments? From our gifted, honors, and AP programs? From our extracurricular activities? From our budget decisions? From out accountability measures? From our learning goals?
2
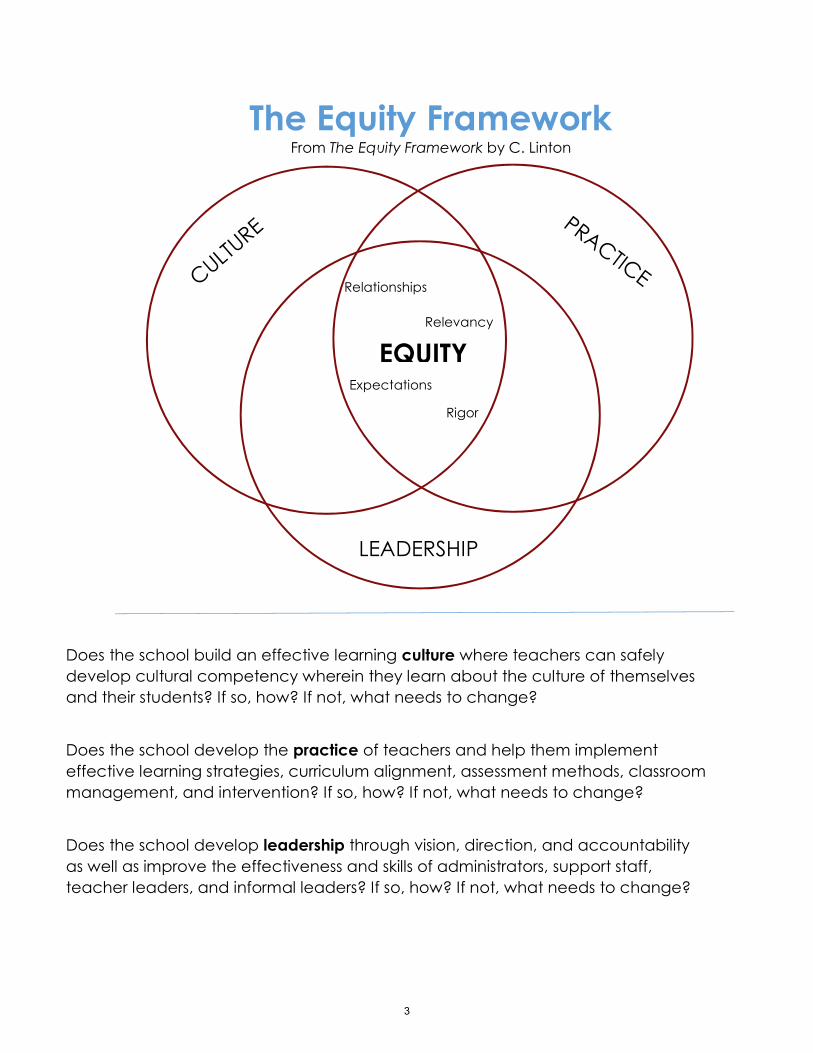
The Equity FrameworkFrom The Equity Framework by C. Linton
Does the school build an effective learning culture where teachers can safely develop cultural competency wherein they learn about the culture of themselves and their students? If so, how? If not, what needs to change?
Does the school develop the practice of teachers and help them implement effective learning strategies, curriculum alignment, assessment methods, classroom management, and intervention? If so, how? If not, what needs to change?
Does the school develop leadership through vision, direction, and accountability as well as improve the effectiveness and skills of administrators, support staff, teacher leaders, and informal leaders? If so, how? If not, what needs to change?
Relevancy
LEADERSHIP
Relationships
Expectations Rigor
EQUITY
3
K-8 Pathway Indicators
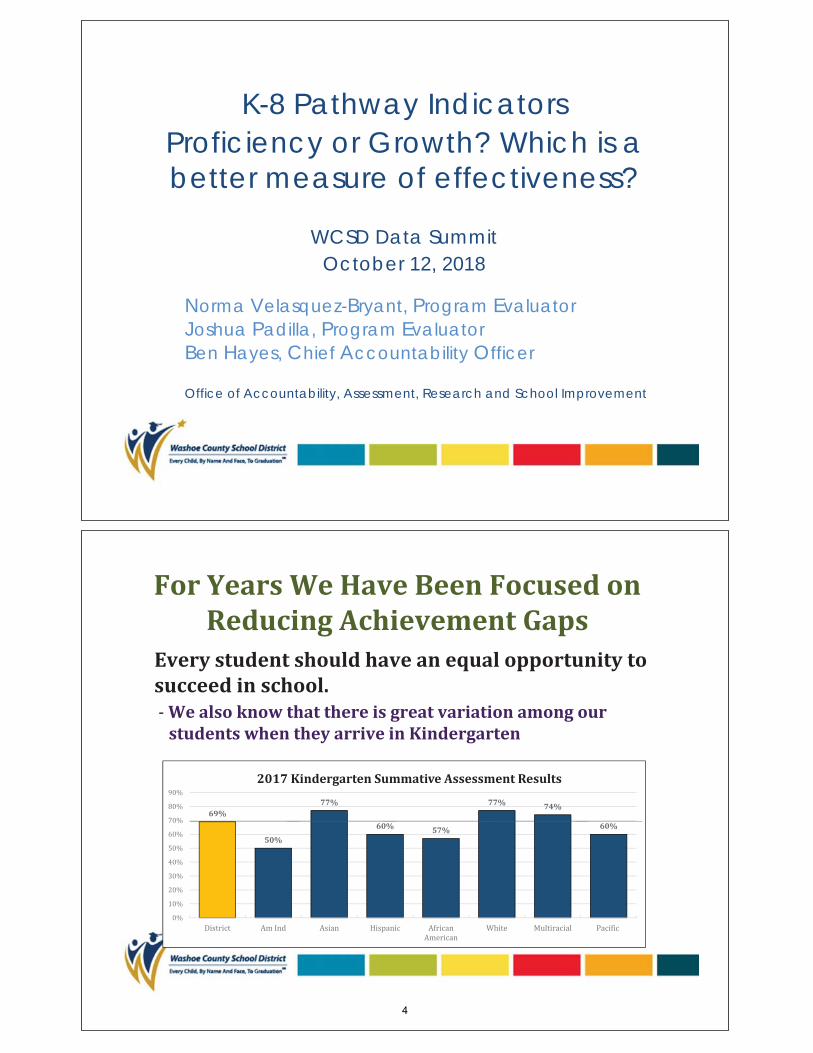
Norma Velasquez-Bryant, Program EvaluatorJoshua Padilla, Program EvaluatorBen Hayes, Chief Accountability Officer
Office of Accountability, Assessment, Research and School Improvement
K-8 Pathway IndicatorsProficiency or Growth? Which is a better measure of effectiveness?
WCSD Data SummitOctober 12, 2018
For Years We Have Been Focused onReducing Achievement Gaps
Every student should have an equal opportunity tosucceed in school.We also know that there is great variation among ourstudents when they arrive in Kindergarten
69%
50%
77%
60% 57%
77% 74%
60%
2017 Kindergarten Summative Assessment Results
4
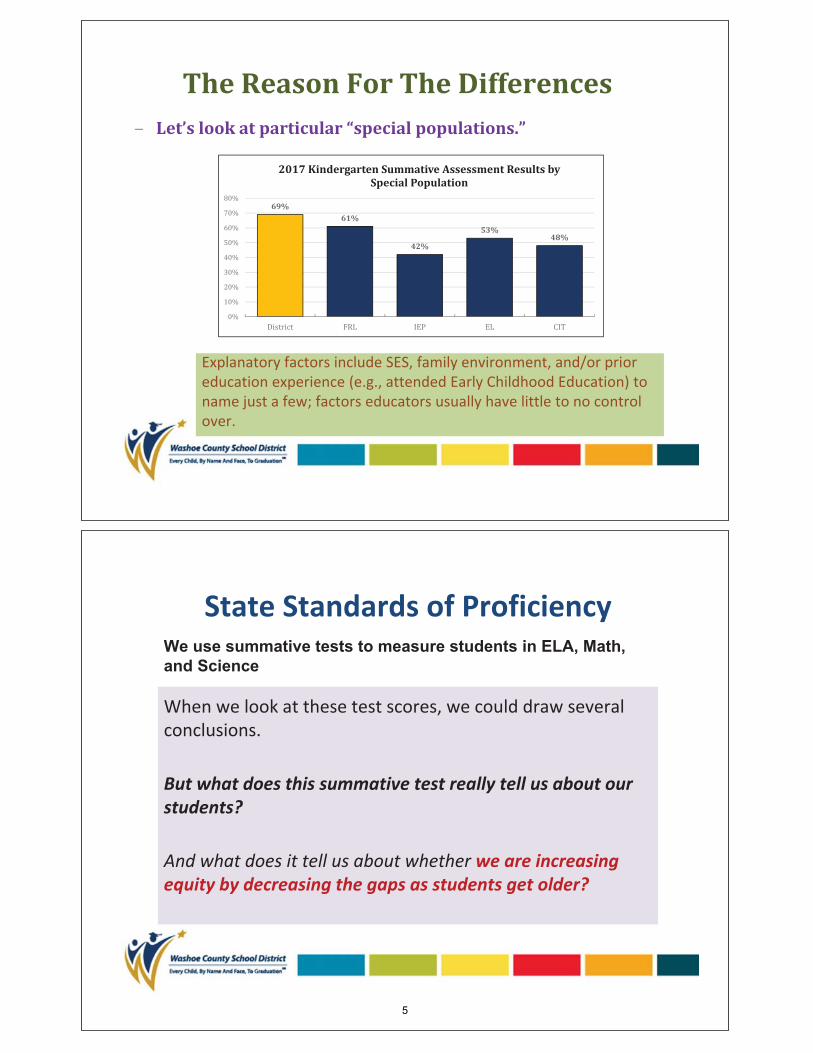
The Reason For The DifferencesLet’s look at particular “special populations.”
69%61%
42%
53%48%
2017 Kindergarten Summative Assessment Results bySpecial Population
5
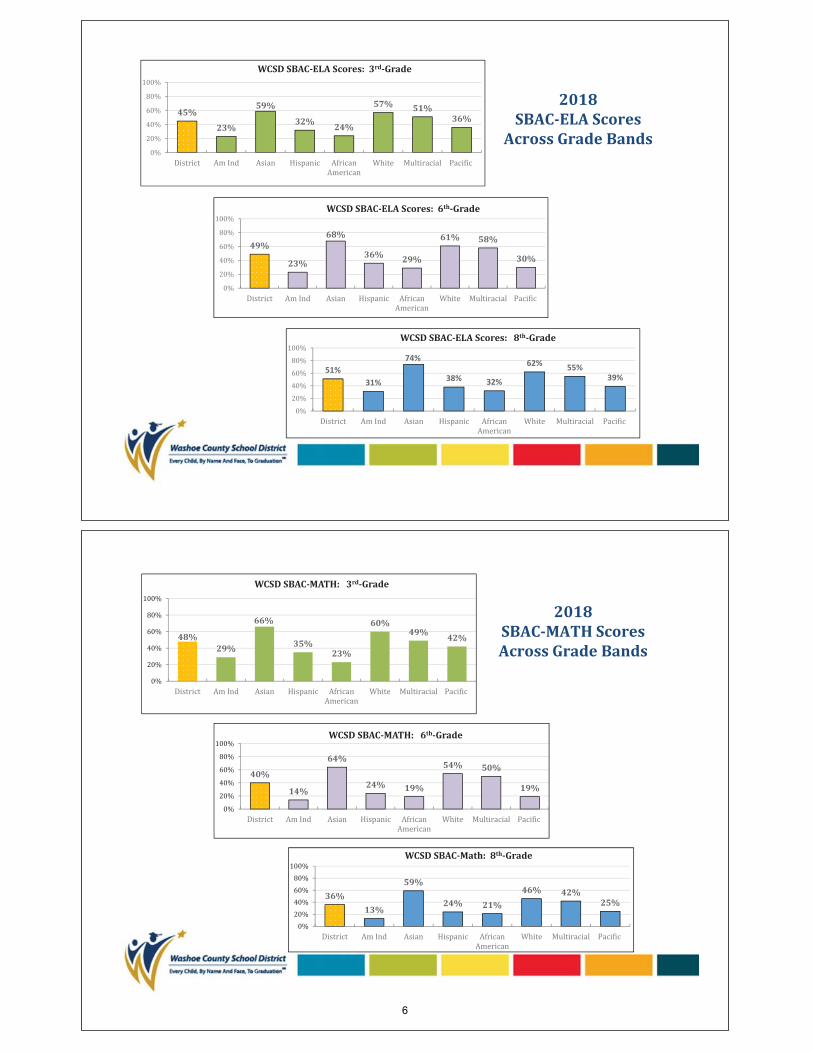
2018SBAC ELA Scores
Across Grade Bands
45%
23%
59%
32% 24%
57% 51%36%
WCSD SBAC ELA Scores: 3rd Grade
49%
23%
68%
36% 29%
61% 58%
30%
WCSD SBAC ELA Scores: 6th Grade
WCSD SBAC ELA Scores: 8th Grade
48%29%
66%
35%23%
60%49% 42%
WCSD SBAC MATH: 3rd Grade
40%
14%
64%
24% 19%
54% 50%
19%
WCSD SBAC MATH: 6th Grade
36%13%
59%
24% 21%
46% 42%25%
WCSD SBAC Math: 8th Grade
2018SBAC MATH ScoresAcross Grade Bands
6
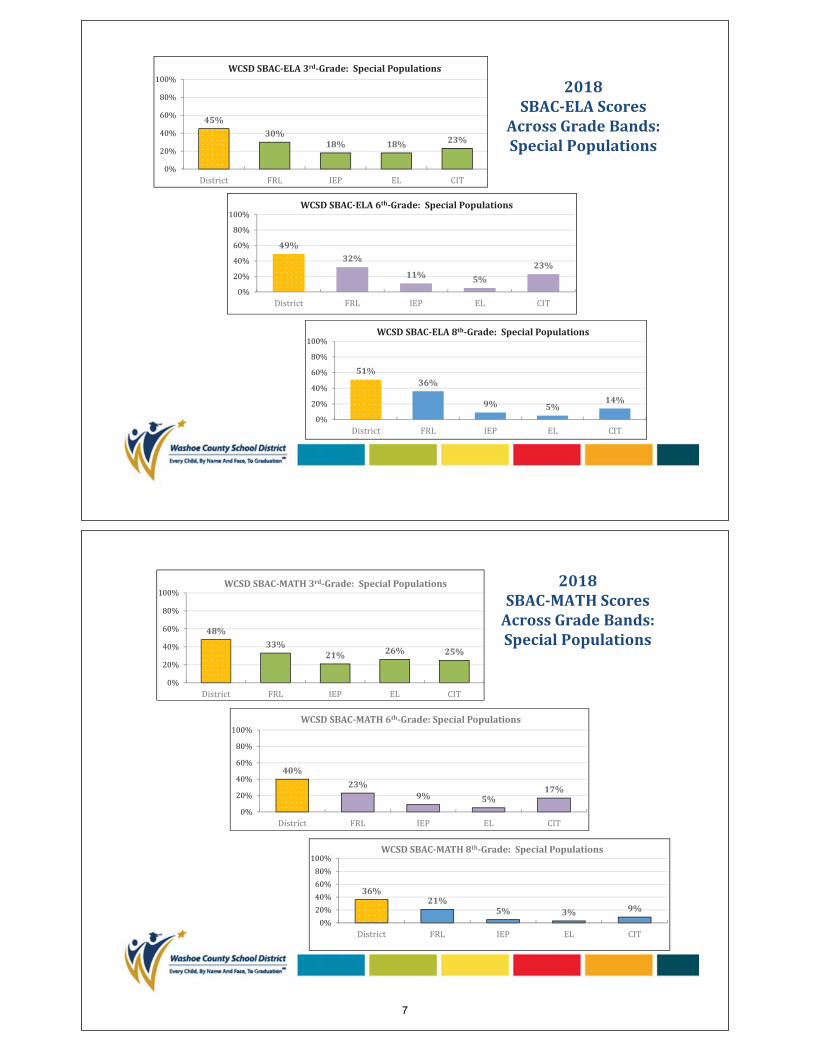
45%30%
18% 18% 23%
WCSD SBAC ELA 3rd Grade: Special Populations
49%32%
11% 5%23%
WCSD SBAC ELA 6th Grade: Special Populations
51%36%
9% 5%14%
WCSD SBAC ELA 8th Grade: Special Populations
2018SBAC ELA Scores
Across Grade Bands:Special Populations
48%33%
21% 26% 25%
WCSD SBAC MATH 3rd Grade: Special Populations
40%23%
9% 5%17%
WCSD SBAC MATH 6th Grade: Special Populations
36%21%
5% 3% 9%
WCSD SBAC MATH 8th Grade: Special Populations
2018SBAC MATH ScoresAcross Grade Bands:Special Populations
7
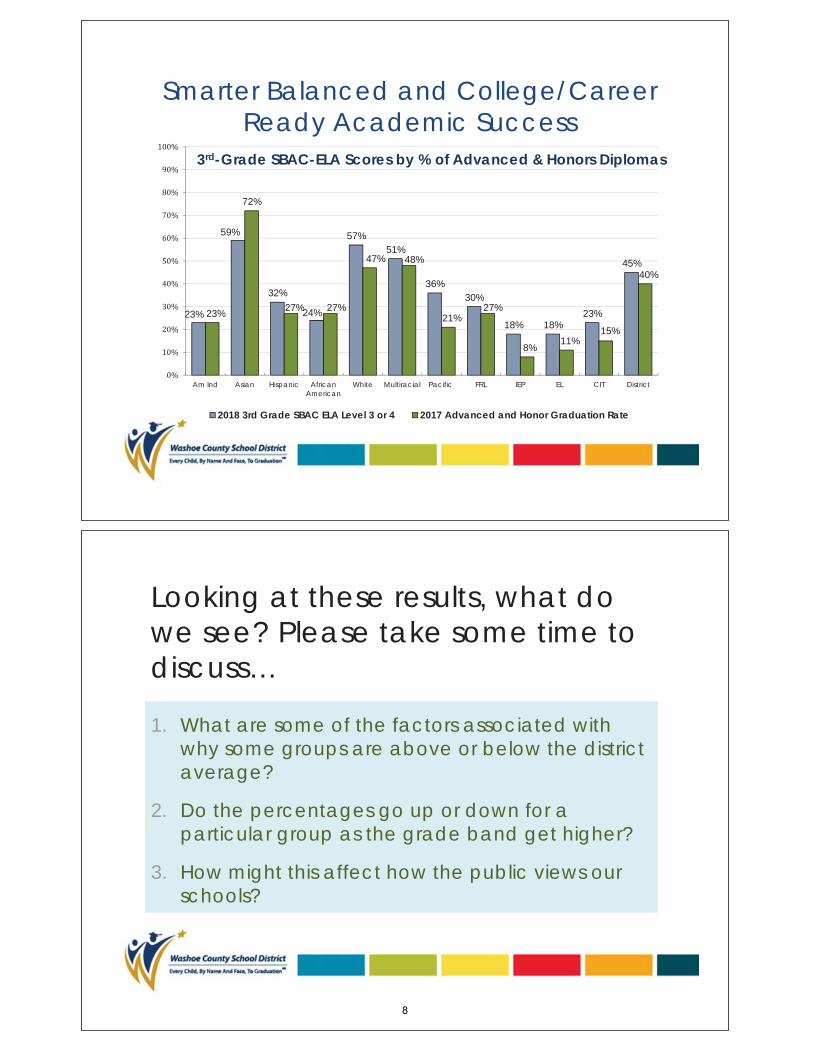
3rd-Grade SBAC-ELA Scores by % of Advanced & Honors Diplomas
23%
59%
32%
24%
57%51%
36%30%
18% 18%23%
45%
23%
72%
27% 27%
47% 48%
21%27%
8%11%
15%
40%
Am Ind Asian Hispanic AfricanAmerican
White Multiracial Pacific FRL IEP EL CIT District
2018 3rd Grade SBAC ELA Level 3 or 4 2017 Advanced and Honor Graduation Rate
Smarter Balanced and College/Career Ready Academic Success
Looking at these results, what do we see? Please take some time to discuss…
1. What are some of the factors associated with why some groups are above or below the district average?
2. Do the percentages go up or down for a particular group as the grade band get higher?
3. How might this affect how the public views our schools?
8
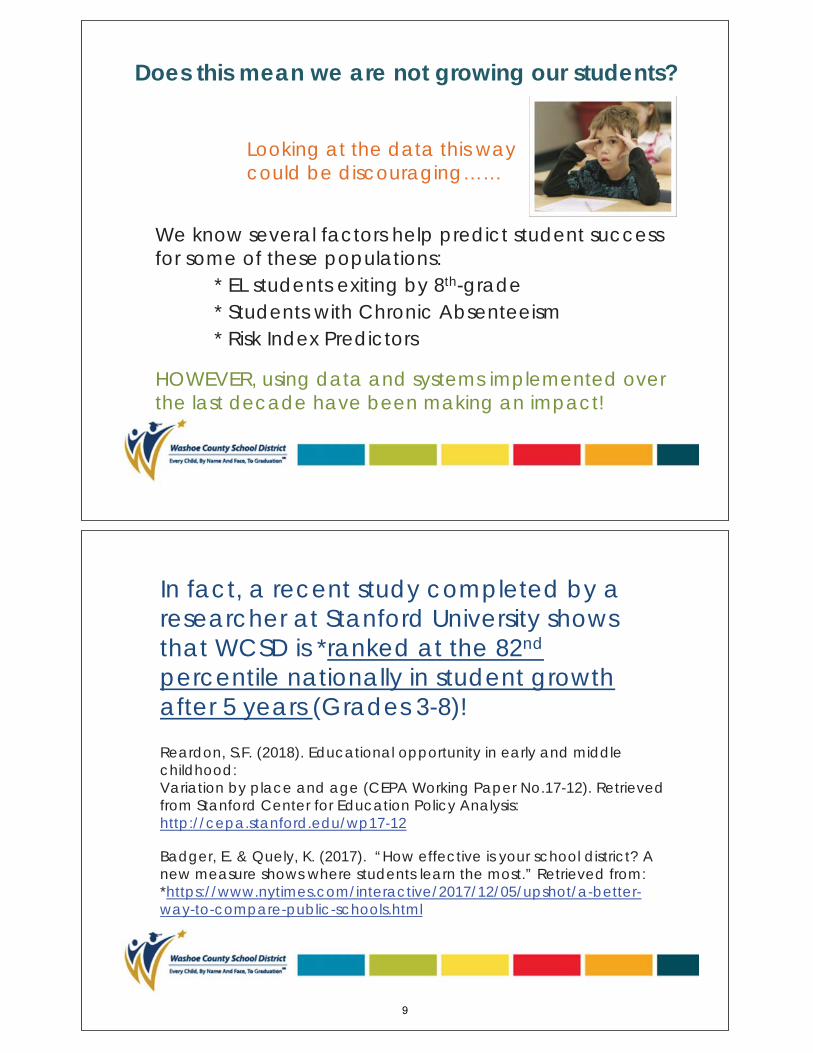
We know several factors help predict student success for some of these populations:
* EL students exiting by 8th-grade* Students with Chronic Absenteeism* Risk Index Predictors
HOWEVER, using data and systems implemented over the last decade have been making an impact!
Does this mean we are not growing our students?
Looking at the data this way could be discouraging……
In fact, a recent study completed by a researcher at Stanford University shows that WCSD is *ranked at the 82nd
percentile nationally in student growth after 5 years (Grades 3-8)!
Reardon, S.F. (2018). Educational opportunity in early and middle childhood:Variation by place and age (CEPA Working Paper No.17-12). Retrieved from Stanford Center for Education Policy Analysis: http://cepa.stanford.edu/wp17-12
Badger, E. & Quely, K. (2017). “How effective is your school district? A new measure shows where students learn the most.” Retrieved from: *https://www.nytimes.com/interactive/2017/12/05/upshot/a-better-way-to-compare-public-schools.html
9
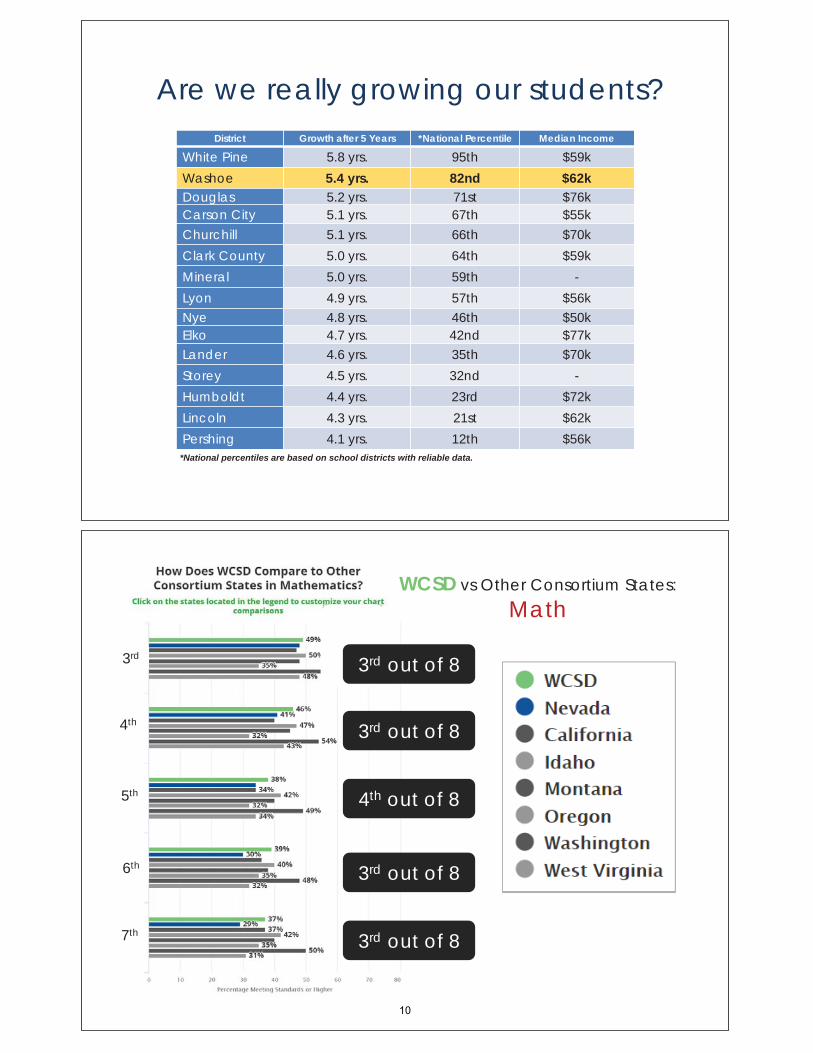
Are we really growing our students?District Growth after 5 Years *National Percentile Median Income
White Pine 5.8 yrs. 95th $59kWashoe 5.4 yrs. 82nd $62kDouglas 5.2 yrs. 71st $76kCarson City 5.1 yrs. 67th $55kChurchill 5.1 yrs. 66th $70kClark County 5.0 yrs. 64th $59kMineral 5.0 yrs. 59th -Lyon 4.9 yrs. 57th $56kNye 4.8 yrs. 46th $50kElko 4.7 yrs. 42nd $77kLander 4.6 yrs. 35th $70kStorey 4.5 yrs. 32nd -Humboldt 4.4 yrs. 23rd $72kLincoln 4.3 yrs. 21st $62kPershing 4.1 yrs. 12th $56k
*National percentiles are based on school districts with reliable data.
WCSD vs Other Consortium States:Math
3rd out of 8
4th out of 8
3rd out of 8
3rd out of 8
3rd
4th
7th
5th
6th
3rd out of 8
10
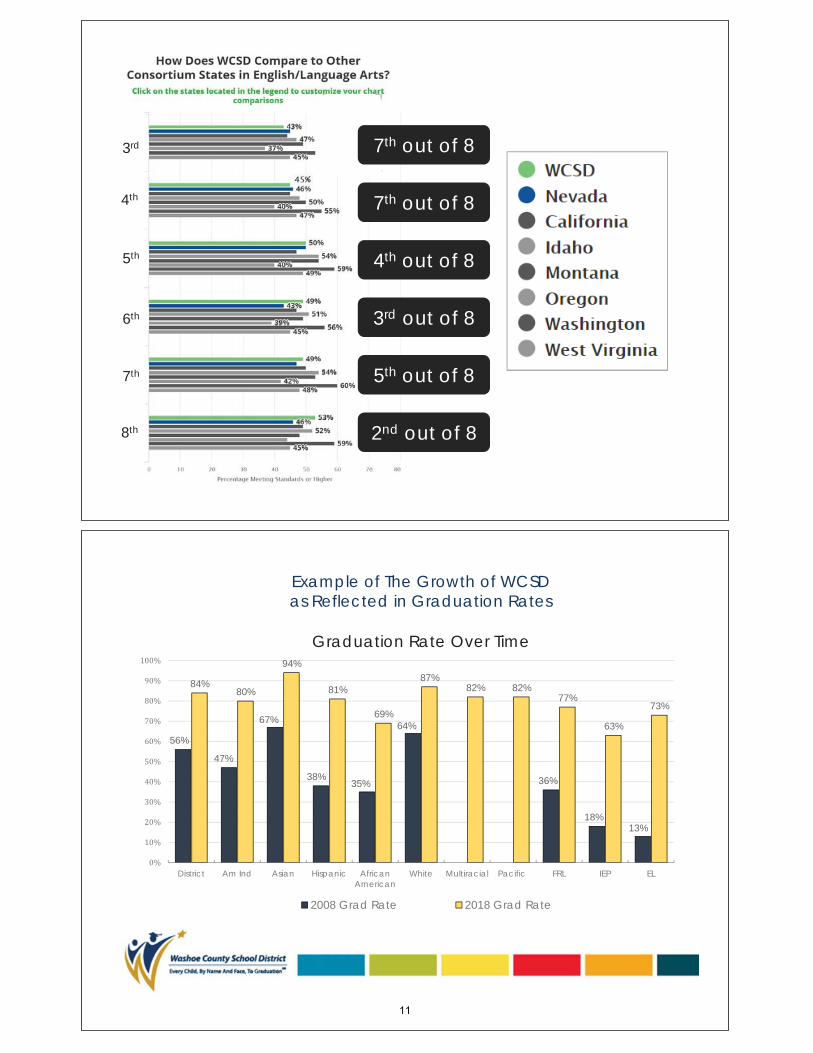
7th out of 8
4th out of 8
3rd out of 8
5th out of 8
3rd
4th
7th
8th
5th
6th
7th out of 8
2nd out of 8
Example of The Growth of WCSD as Reflected in Graduation Rates
56%
47%
67%
38%35%
64%
36%
18%13%
84%80%
94%
81%
69%
87%82% 82%
77%
63%
73%
District Am Ind Asian Hispanic AfricanAmerican
White Multiracial Pacific FRL IEP EL
Graduation Rate Over Time
2008 Grad Rate 2018 Grad Rate
11
QuestionsConclusions
Thank You
12

Data Summit Thought Organizer:
What conclusions can I draw from the presented data/information?
What is the connection to other points along the pathway to graduation and post-secondary readiness?
What is missing or needed to strengthen/complete this relationship or my understanding?
13
HS Pathway and College Readiness
High School Pathway
2018Data Summit
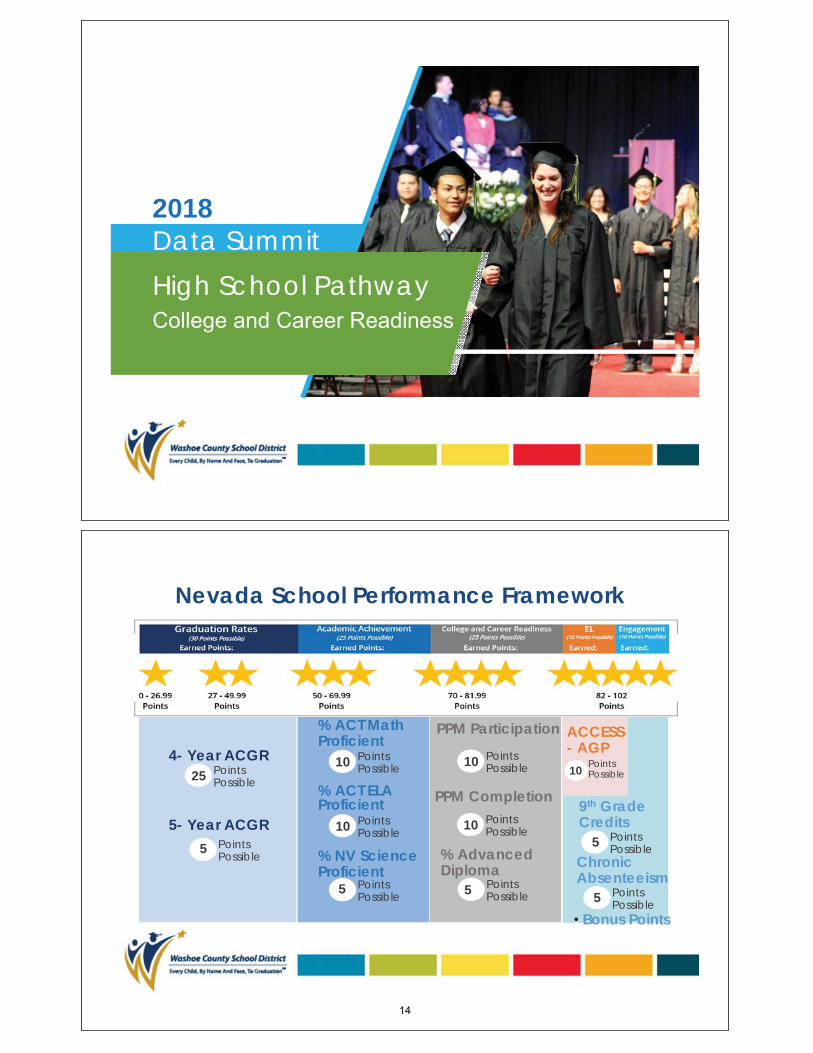
Nevada School Performance Framework
4- Year ACGRPointsPossible25
5- Year ACGRPointsPossible5
% ACT Math Proficient
PointsPossible10
% ACT ELA Proficient
PointsPossible10
% NV Science Proficient
PointsPossible5
PPM ParticipationPointsPossible10
PPM CompletionPointsPossible10
% Advanced Diploma
PointsPossible5
ACCESS- AGP
Points Possible10
9th GradeCredits
PointsPossible5
ChronicAbsenteeism
PointsPossible5
Bonus Points
14
ACT College and Career Readiness
Here in WCSD, 11th grade students saw their average composite scores decline very slightly—from 18.0 to 17.9—over the previous year. But our students continue to outperform the state in the percentage of students who are college-ready in all four subject areas—math, reading, science, and English. And WCSD students also had the highest percentage of students testing “college ready” in English (37%), followed by reading (28%), math (28%), and science (21%).
Traci DavisWashoe County School District SuperintendentThe Friday Minute, September 14, 2018
ACT College and Career ReadinessACT/NCEA (National Center for Educational Achievement) readiness benchmarks are minimum ACT test scores required for students to have a high probability of success in credit-bearing college courses (English comp, social sciences, algebra, and biology).
According to ACT research, the level of achievement necessary to be college-ready is also necessary to be career-ready.
ACT/NCEA are research-based and linked to ACT’s College Readiness Benchmarks. ACT’s College Readiness Benchmarks are empirically derived, based on the actual performance of students in college.
15
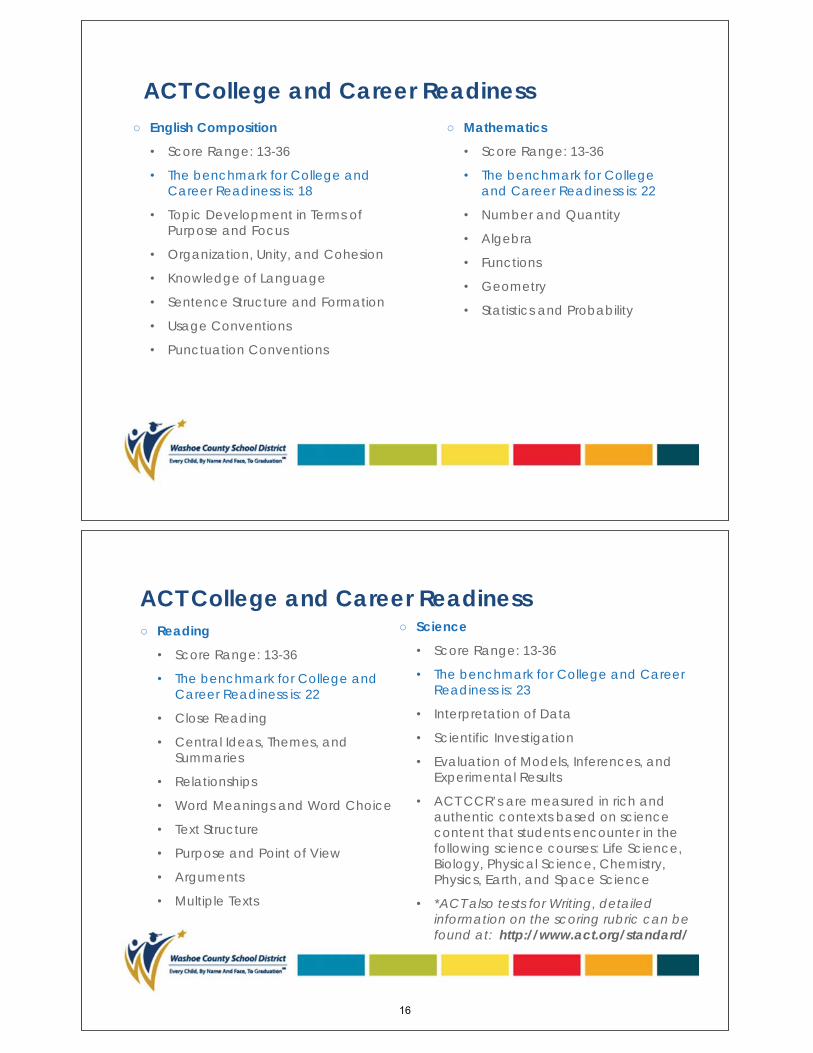
ACT College and Career ReadinessEnglish Composition
Score Range: 13-36
The benchmark for College andCareer Readiness is: 18
Topic Development in Terms ofPurpose and Focus
Organization, Unity, and Cohesion
Knowledge of Language
Sentence Structure and Formation
Usage Conventions
Punctuation Conventions
Mathematics
Score Range: 13-36
The benchmark for Collegeand Career Readiness is: 22
Number and Quantity
Algebra
Functions
Geometry
Statistics and Probability
ACT College and Career ReadinessReading
Score Range: 13-36
The benchmark for College andCareer Readiness is: 22
Close Reading
Central Ideas, Themes, andSummaries
Relationships
Word Meanings and Word Choice
Text Structure
Purpose and Point of View
Arguments
Multiple Texts
Science
Score Range: 13-36
The benchmark for College and CareerReadiness is: 23
Interpretation of Data
Scientific Investigation
Evaluation of Models, Inferences, andExperimental Results
ACT CCR’s are measured in rich andauthentic contexts based on sciencecontent that students encounter in thefollowing science courses: Life Science,Biology, Physical Science, Chemistry,Physics, Earth, and Space Science
*ACT also tests for Writing, detailedinformation on the scoring rubric can befound at: http://www.act.org/standard/
16
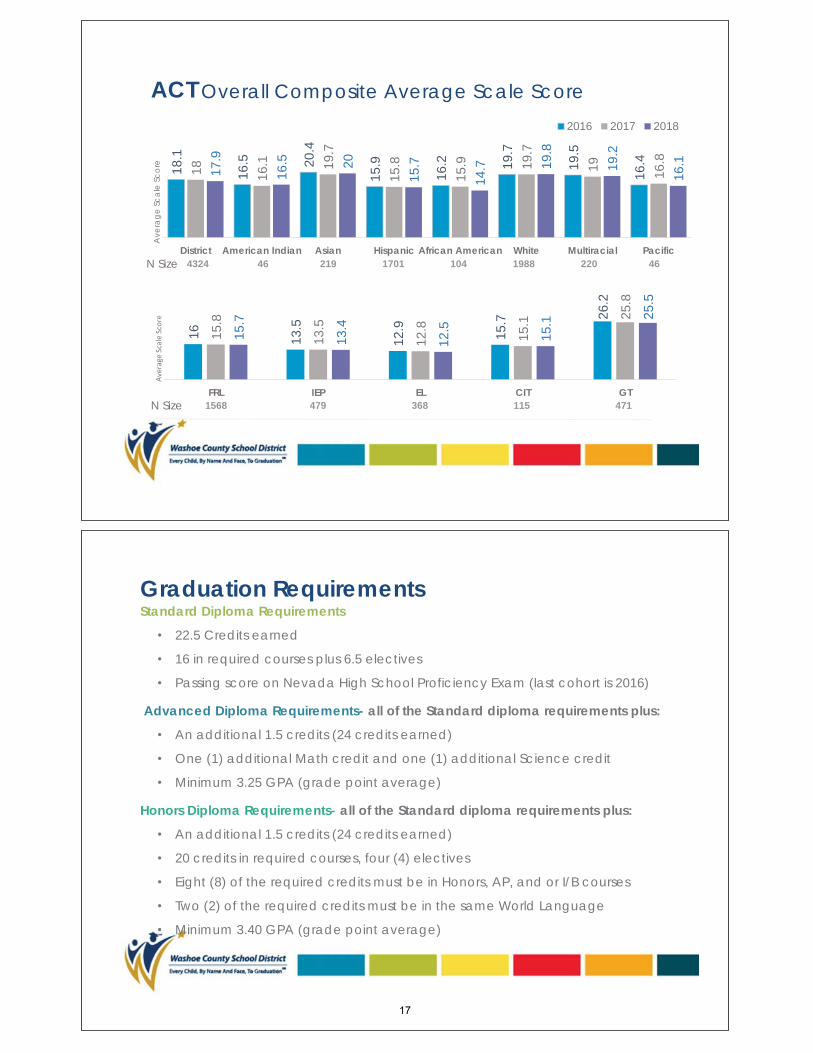
ACT Overall Composite Average Scale Score
18.1
16.5 20
.4
15.9
16.2 19
.7
19.5
16.4
18 16.1 19
.7
15.8
15.9 19
.7
19 16.8
17.9
16.5 20
15.7
14.7 19
.8
19.2
16.1
District American Indian Asian Hispanic African American White Multiracial Pacific
Ave
rage
Sca
le S
core
2016 2017 2018
4324 46 219 1701 104 1988 220 46N Size
16 13.5
12.9 15.7 26
.2
15.8
13.5
12.8
15.1 25
.8
15.7
13.4
12.5 15.1 25
.5
FRL IEP EL CIT GTN Size 1568 479 368 115 471
Graduation RequirementsStandard Diploma Requirements
22.5 Credits earned
16 in required courses plus 6.5 electives
Passing score on Nevada High School Proficiency Exam (last cohort is 2016)
Advanced Diploma Requirements- all of the Standard diploma requirements plus:
An additional 1.5 credits (24 credits earned)
One (1) additional Math credit and one (1) additional Science credit
Minimum 3.25 GPA (grade point average)
Honors Diploma Requirements- all of the Standard diploma requirements plus:
An additional 1.5 credits (24 credits earned)
20 credits in required courses, four (4) electives
Eight (8) of the required credits must be in Honors, AP, and or I/B courses
Two (2) of the required credits must be in the same World Language
Minimum 3.40 GPA (grade point average)
17
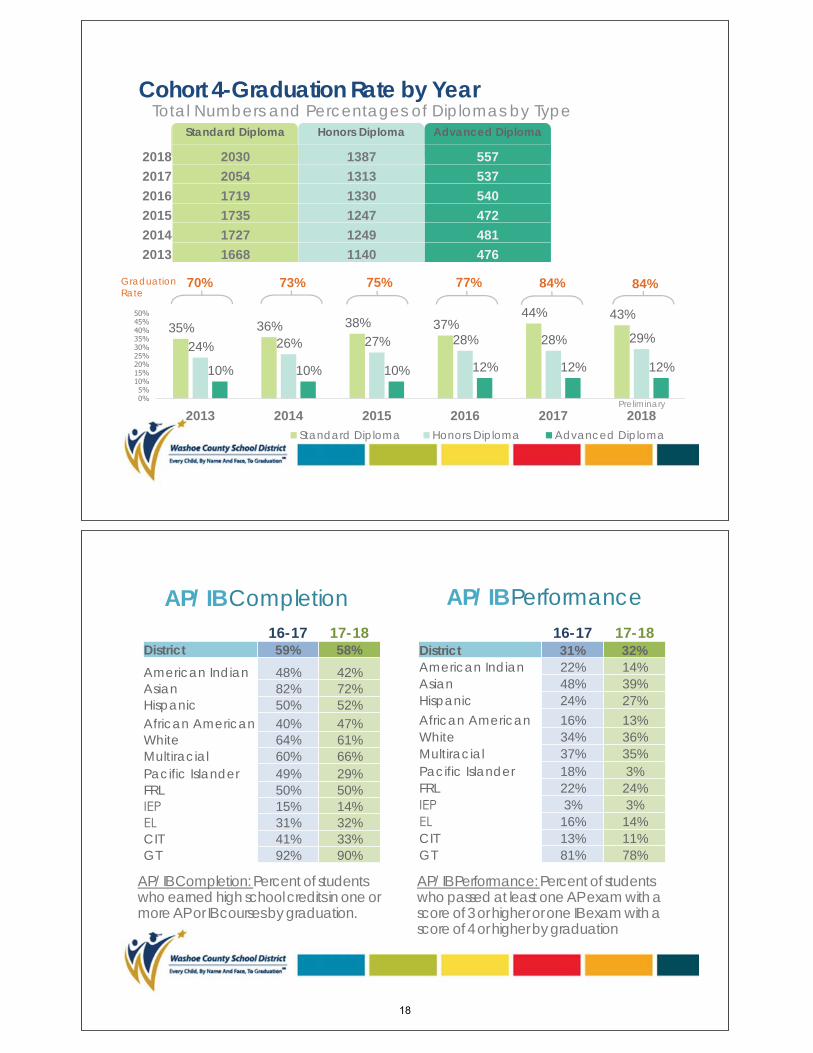
Standard Diploma Honors Diploma Advanced Diploma
2018 2030 1387 5572017 2054 1313 5372016 1719 1330 5402015 1735 1247 4722014 1727 1249 4812013 1668 1140 476
Cohort 4-Graduation Rate by YearTotal Numbers and Percentages of Diplomas by Type
35% 36% 38% 37%44% 43%
24% 26% 27% 28% 28% 29%
10% 10% 10% 12% 12% 12%
2013 2014 2015 2016 2017 2018Standard Diploma Honors Diploma Advanced Diploma
Graduation Rate
70% 73% 75% 77% 84% 84%
Preliminary
AP/ IB Performance16-17 17-18
District 59% 58%American Indian 48% 42%Asian 82% 72%Hispanic 50% 52%African American 40% 47%White 64% 61%Multiracial 60% 66%Pacific Islander 49% 29%FRL 50% 50%IEP 15% 14%EL 31% 32%CIT 41% 33%GT 92% 90%
AP/ IB Completion16-17 17-18
District 31% 32%American Indian 22% 14%Asian 48% 39%Hispanic 24% 27%African American 16% 13%White 34% 36%Multiracial 37% 35%Pacific Islander 18% 3%FRL 22% 24%IEP 3% 3%EL 16% 14%CIT 13% 11%GT 81% 78%
AP/ IB Completion: Percent of students who earned high school credits in one or more AP or IB courses by graduation.
AP/ IB Performance: Percent of students who passed at least one AP exam with a score of 3 or higher or one IB exam with a score of 4 or higher by graduation
18
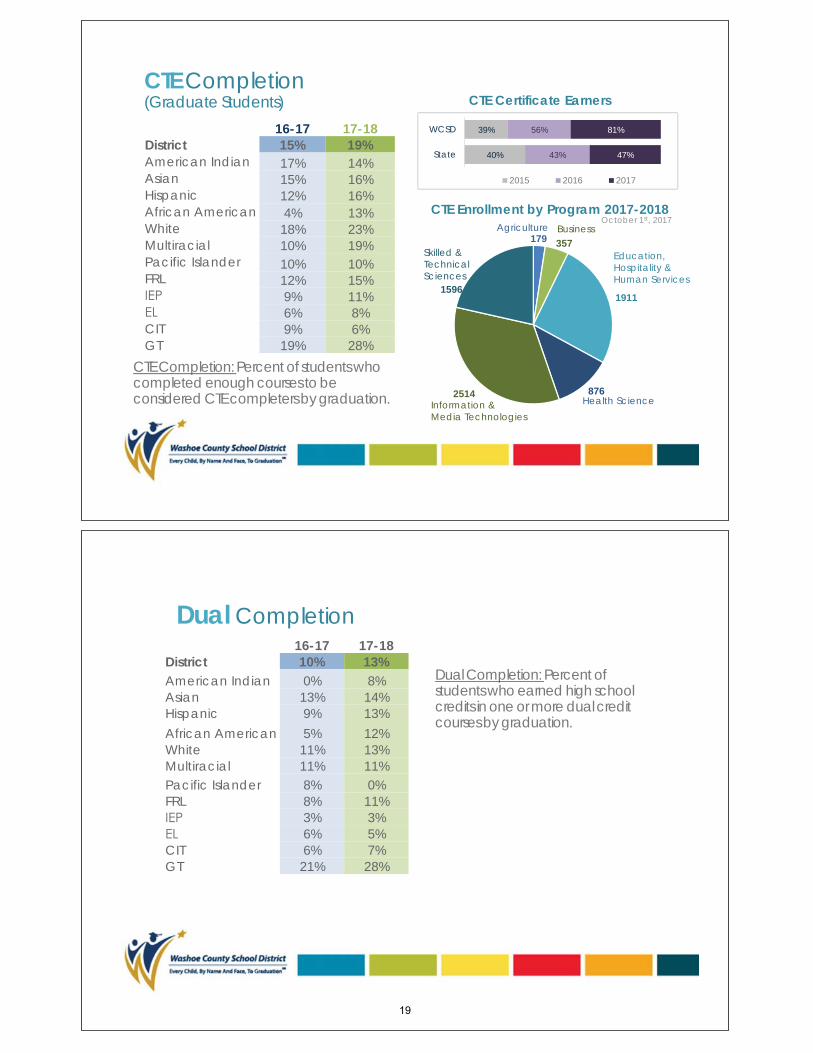
CTE Completion(Graduate Students)
16-17 17-1815% 19%17% 14%15% 16%12% 16%4% 13%18% 23%10% 19%10% 10%12% 15%9% 11%6% 8%9% 6%
District American Indian AsianHispanic African American White Multiracial Pacific Islander FRLIEPELCITGT 19% 28%
CTE Completion: Percent of students who completed enough courses to be considered CTE completers by graduation.
CTE Certificate Earners
40%
39%
43%
56%
47%
81%
State
WCSD
2015 2016 2017
CTE Enrollment by Program 2017-2018
179 357
1911
8762514
1596
Agriculture Business
Education, Hospitality & Human Services
Skilled & Technical Sciences
Information &Media Technologies
Health Science
October 1st, 2017
Dual Completion16-17 17-1810% 13%0% 8%13% 14%9% 13%5% 12%11% 13%11% 11%8% 0%8% 11%3% 3%6% 5%6% 7%
DistrictAmerican Indian AsianHispanicAfrican American White MultiracialPacific Islander FRLIEPELCITGT 21% 28%
Dual Completion: Percent of students who earned high school credits in one or more dual credit courses by graduation.
19
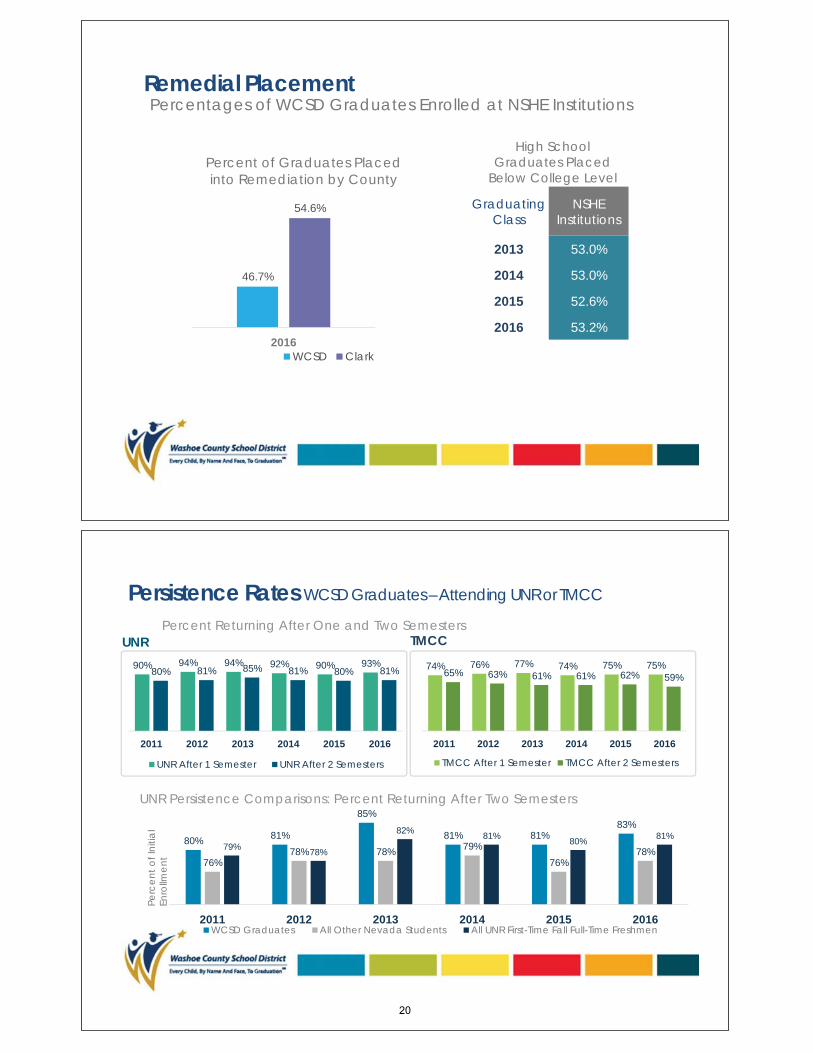
Remedial PlacementPercentages of WCSD Graduates Enrolled at NSHE Institutions
46.7%
54.6%
2016
Percent of Graduates Placed into Remediation by County
WCSD Clark
High School Graduates Placed
Below College Level
GraduatingClass
NSHEInstitutions
2013 53.0%
2014 53.0%
2015 52.6%
2016 53.2%
Persistence Rates WCSD Graduates –Attending UNR or TMCC
Percent Returning After One and Two SemestersUNR
90% 94% 94% 92% 90% 93%80% 81% 85% 81% 80% 81%
2011 2012 2013 2014 2015 2016
UNR After 1 Semester UNR After 2 Semesters
74% 76% 77% 74% 75% 75%65% 63% 61% 61% 62% 59%
2011 2012 2013 2014 2015 2016
TMCC After 1 Semester TMCC After 2 Semesters
TMCC
UNR Persistence Comparisons: Percent Returning After Two Semesters
80% 81%
85%
81% 81%83%
76%78% 78% 79%
76%78%79% 78%
82% 81% 80% 81%
2011 2012 2013 2014 2015 2016WCSD Graduates All Other Nevada Students All UNR First-Time Fall Full-Time Freshmen
Perc
ent o
f Ini
tial
Enro
llmen
t
20
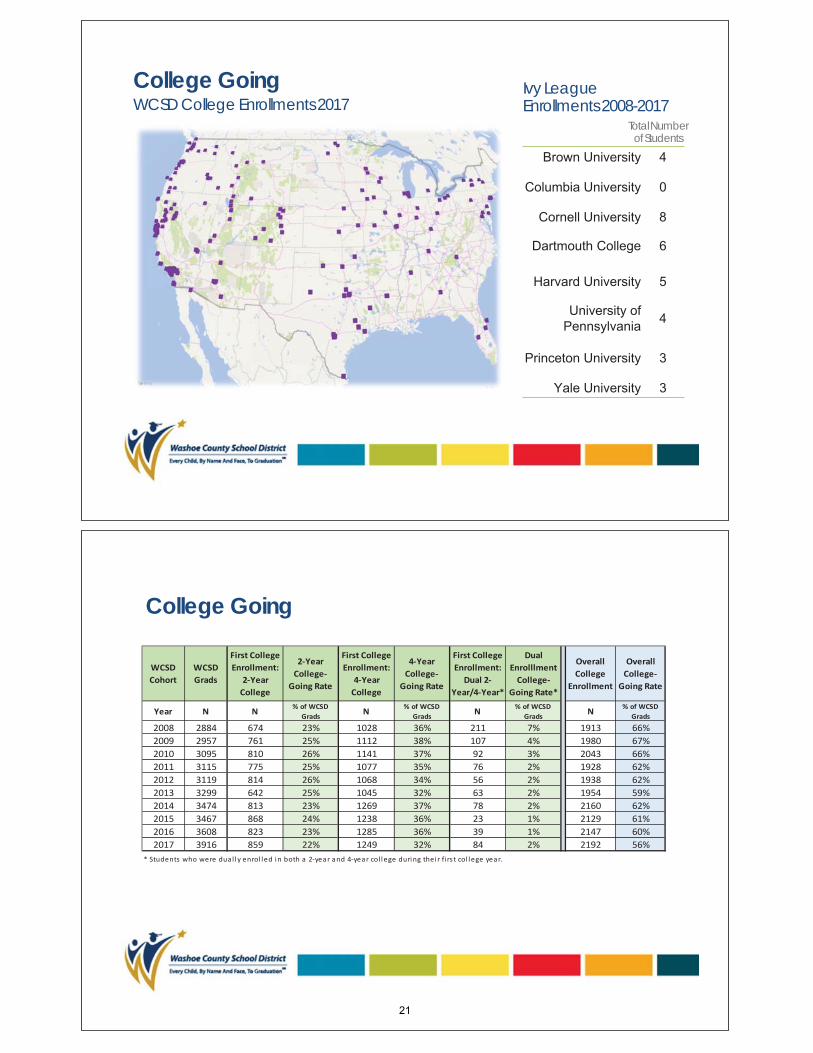
College GoingWCSD College Enrollments 2017
Total Number of Students
Ivy League Enrollments 2008-2017
College Going
21
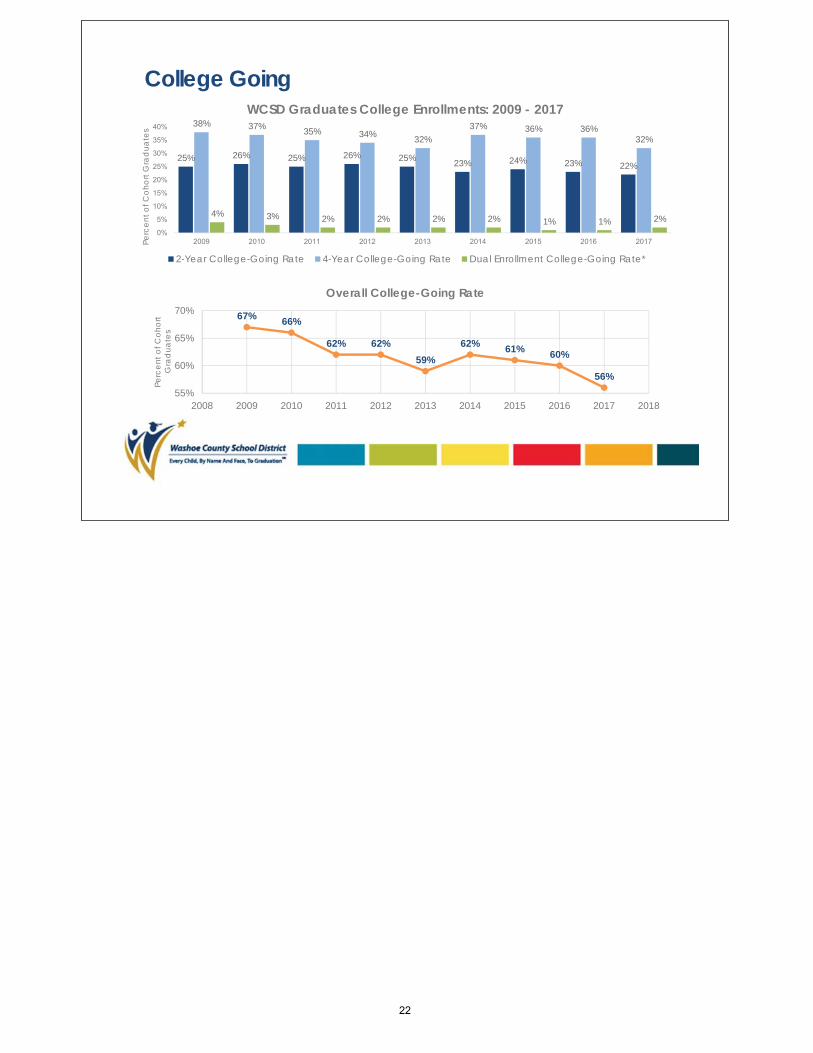
25% 26% 25% 26% 25% 23% 24% 23% 22%
38% 37% 35% 34% 32%37% 36% 36%
32%
4% 3% 2% 2% 2% 2% 1% 1% 2%
Perc
ent o
f Coh
ort G
rad
uate
s
WCSD Graduates College Enrollments: 2009 - 2017
2-Year College-Going Rate 4-Year College-Going Rate Dual Enrollment College-Going Rate*
College Going
67% 66%
62% 62%59%
62% 61% 60%
56%55%
60%
65%
70%
2008 2009 2010 2011 2012 2013 2014 2015 2016 2017 2018
Perc
ent o
f Coh
ort
Gra
dua
tes
Overall College-Going Rate
22

Data Summit Thought Organizer:
What conclusions can I draw from the presented data/information?
What is the connection to other points along the pathway to graduation and post-secondary readiness?
What is missing or needed to strengthen/complete this relationship or my understanding?
23
Chronic Absenteeism

AttendanceOctober 12, 2018
The Key Ingredient to Achievement
1. AttendanceFundamentals &Beliefs
2. Connection toAchievement Alongthe K 12 Pathway
3. Confronting Myths
Discussion Topics
24
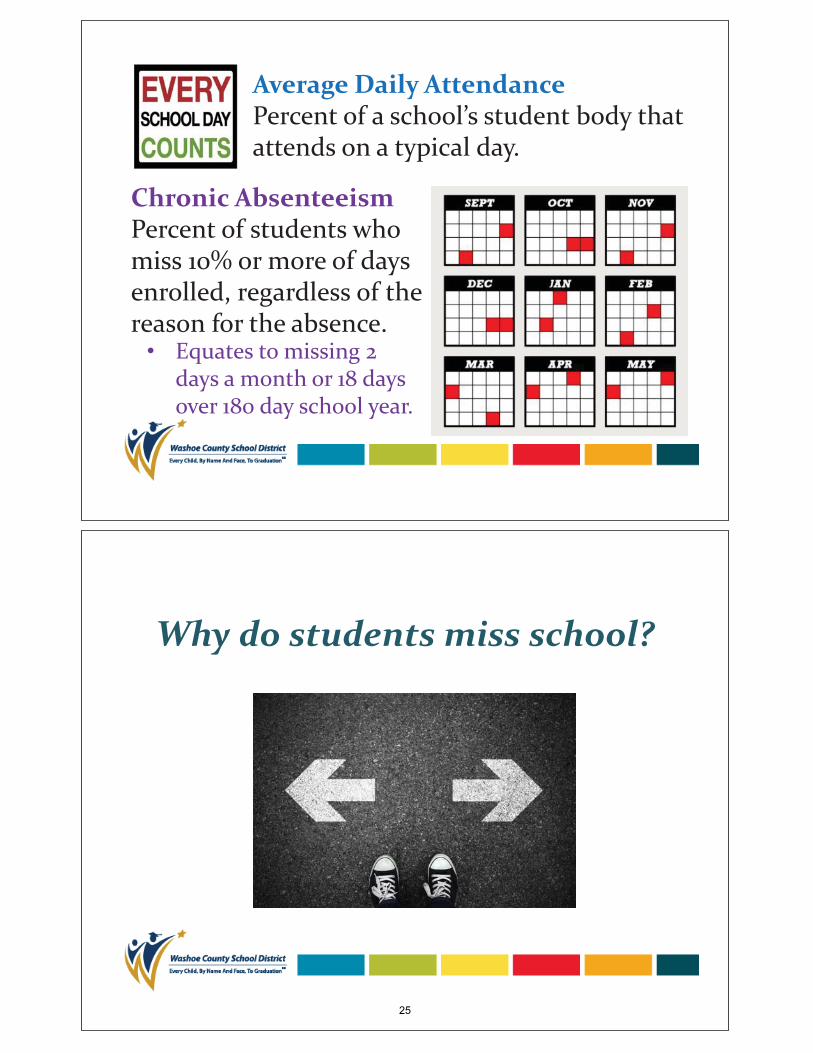
Chronic AbsenteeismPercent of students whomiss 10% or more of daysenrolled, regardless of thereason for the absence.
Equates to missing 2days a month or 18 daysover 180 day school year.
Average Daily AttendancePercent of a school’s student body thatattends on a typical day.
Why do students miss school?
25
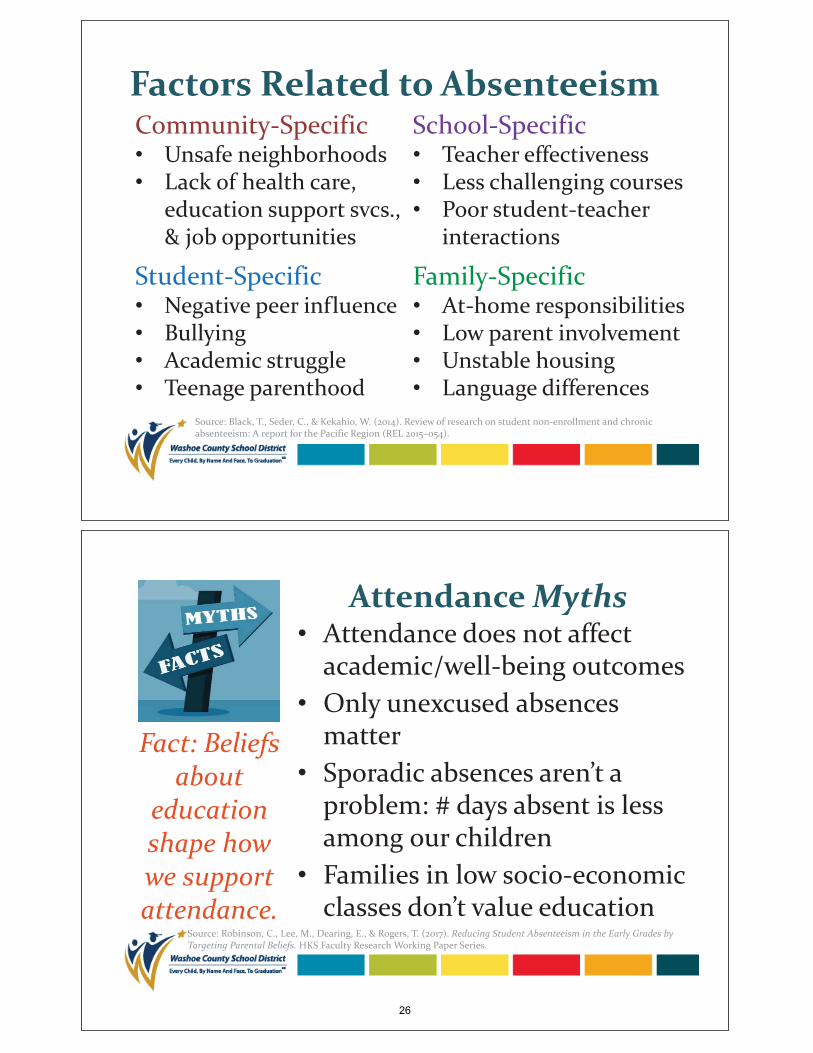
Factors Related to AbsenteeismCommunity Specific
Unsafe neighborhoodsLack of health care,education support svcs.,& job opportunities
Student SpecificNegative peer influenceBullyingAcademic struggleTeenage parenthood
School SpecificTeacher effectivenessLess challenging coursesPoor student teacherinteractions
Family SpecificAt home responsibilitiesLow parent involvementUnstable housingLanguage differences
Source: Black, T., Seder, C., & Kekahio, W. (2014). Review of research on student non enrollment and chronicabsenteeism: A report for the Pacific Region (REL 2015–054).
AttendanceMythsAttendance does not affectacademic/well being outcomesOnly unexcused absencesmatterSporadic absences aren’t aproblem: # days absent is lessamong our childrenFamilies in low socio economicclasses don’t value education
Fact: Beliefsabout
educationshape howwe supportattendance.
Source: Robinson, C., Lee, M., Dearing, E., & Rogers, T. (2017). Reducing Student Absenteeism in the Early Grades byTargeting Parental Beliefs. HKS Faculty ResearchWorking Paper Series.
26
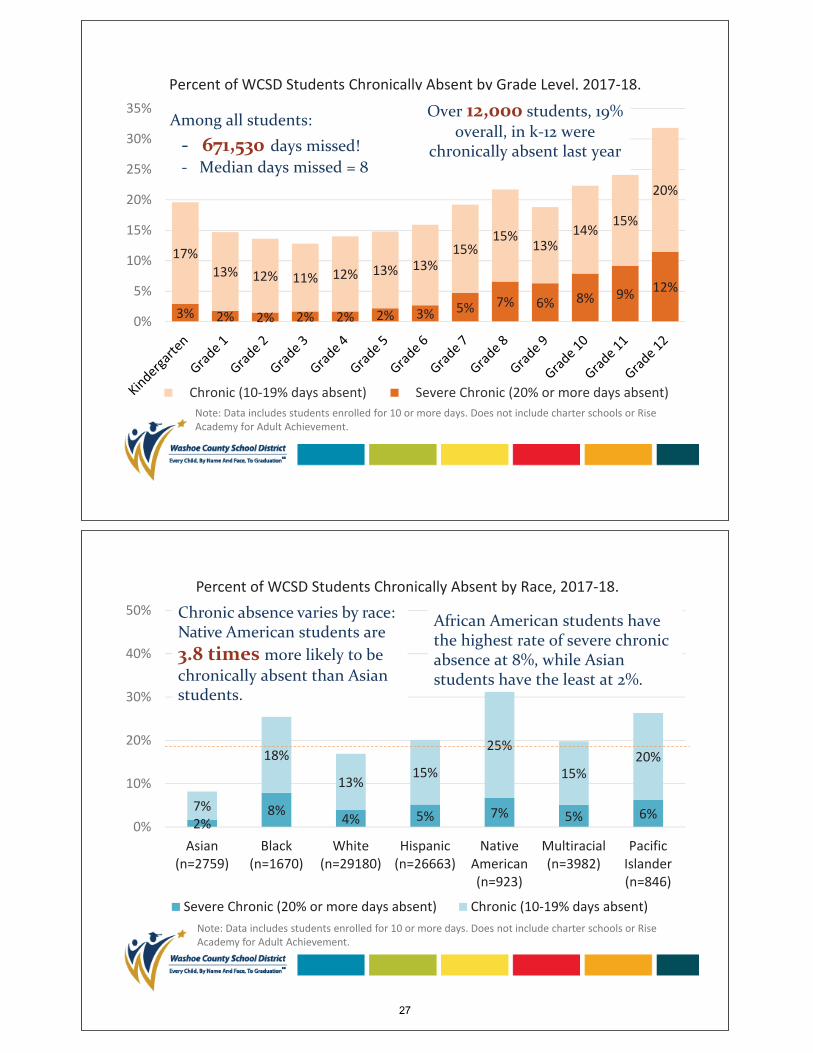
Among all students:671,530 days missed!Median days missed = 8
Over 12,000 students, 19%overall, in k 12 were
chronically absent last year
African American students havethe highest rate of severe chronicabsence at 8%, while Asianstudents have the least at 2%.
Chronic absence varies by race: Native American students are3.8 times more likely to be chronically absent than Asian students.
27
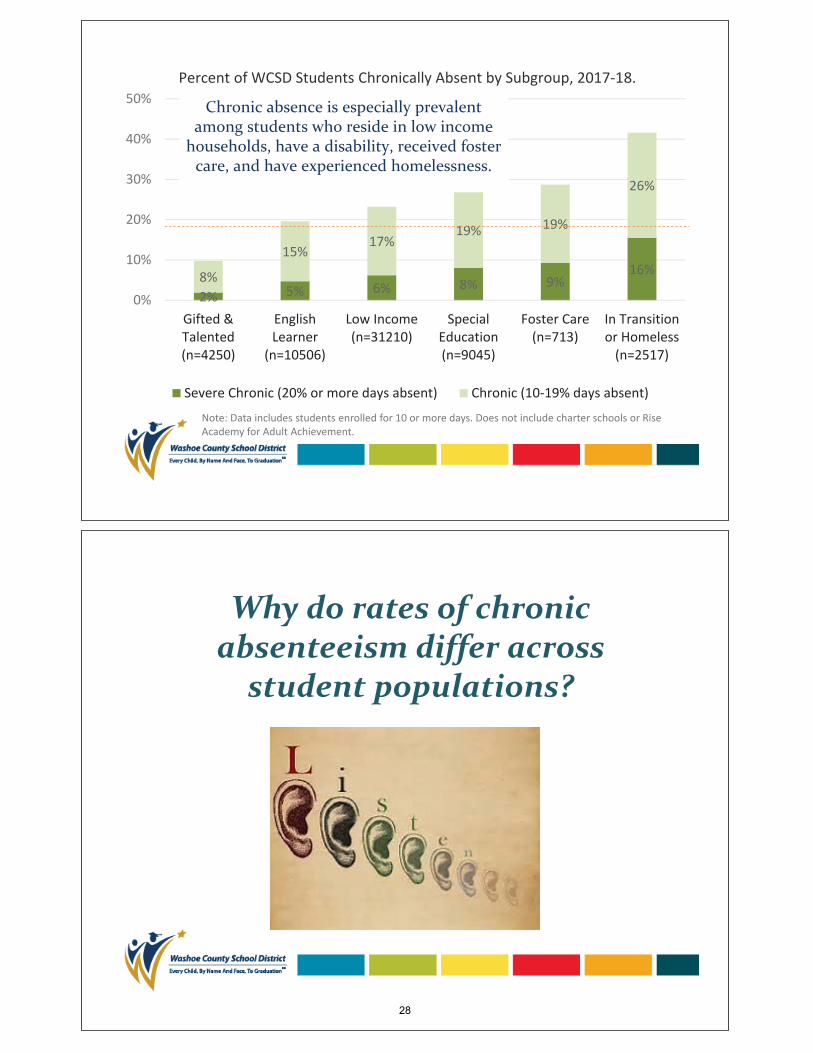
Chronic absence is especially prevalentamong students who reside in low income
households, have a disability, received fostercare, and have experienced homelessness.
Why do rates of chronicabsenteeism differ acrossstudent populations?
28
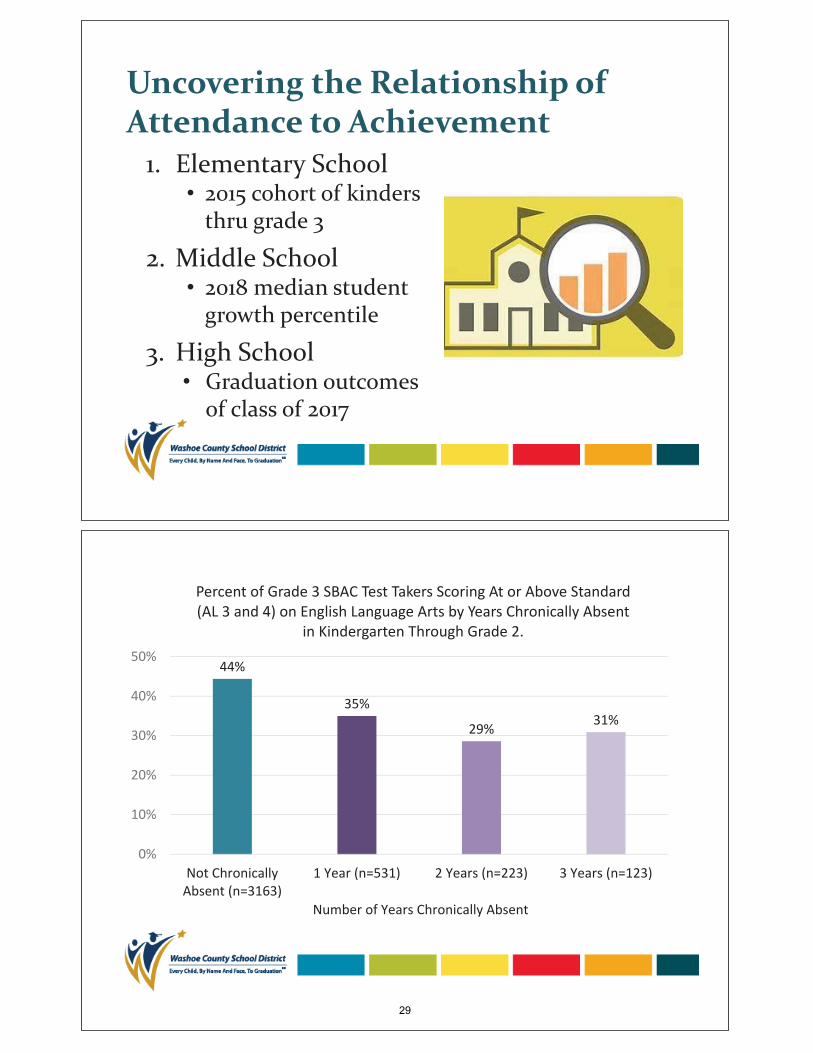
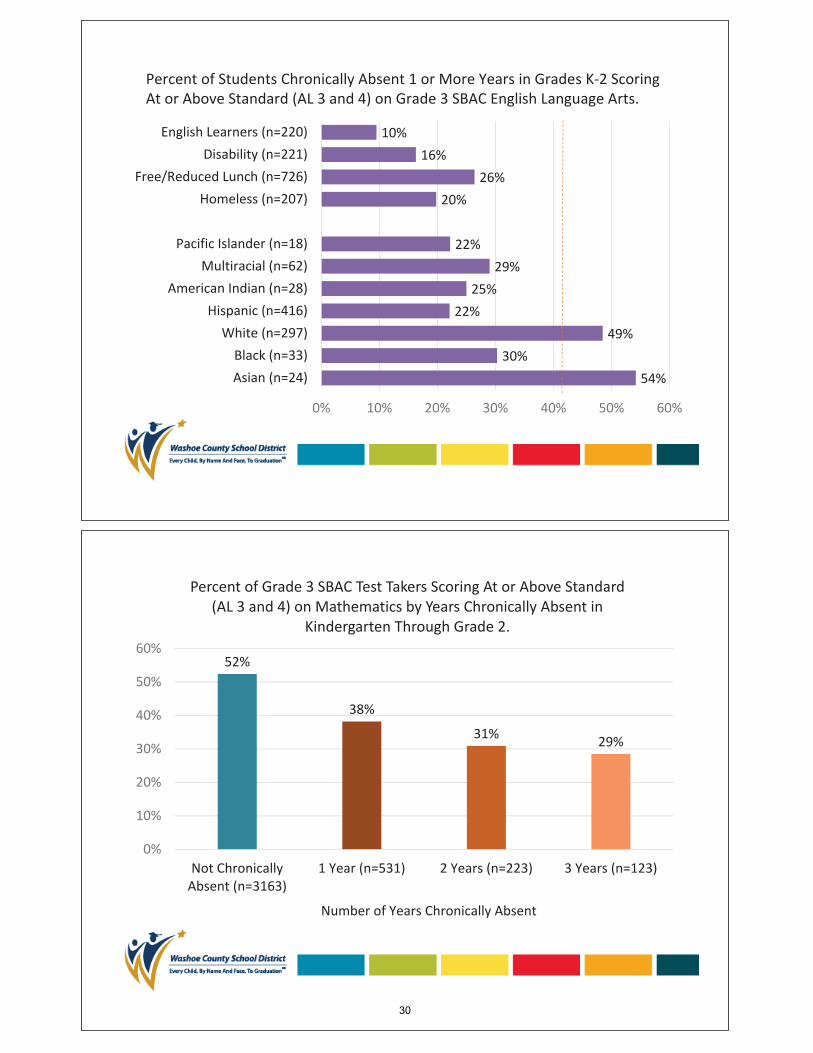
Uncovering the Relationship ofAttendance to Achievement1. Elementary School
2015 cohort of kindersthru grade 3
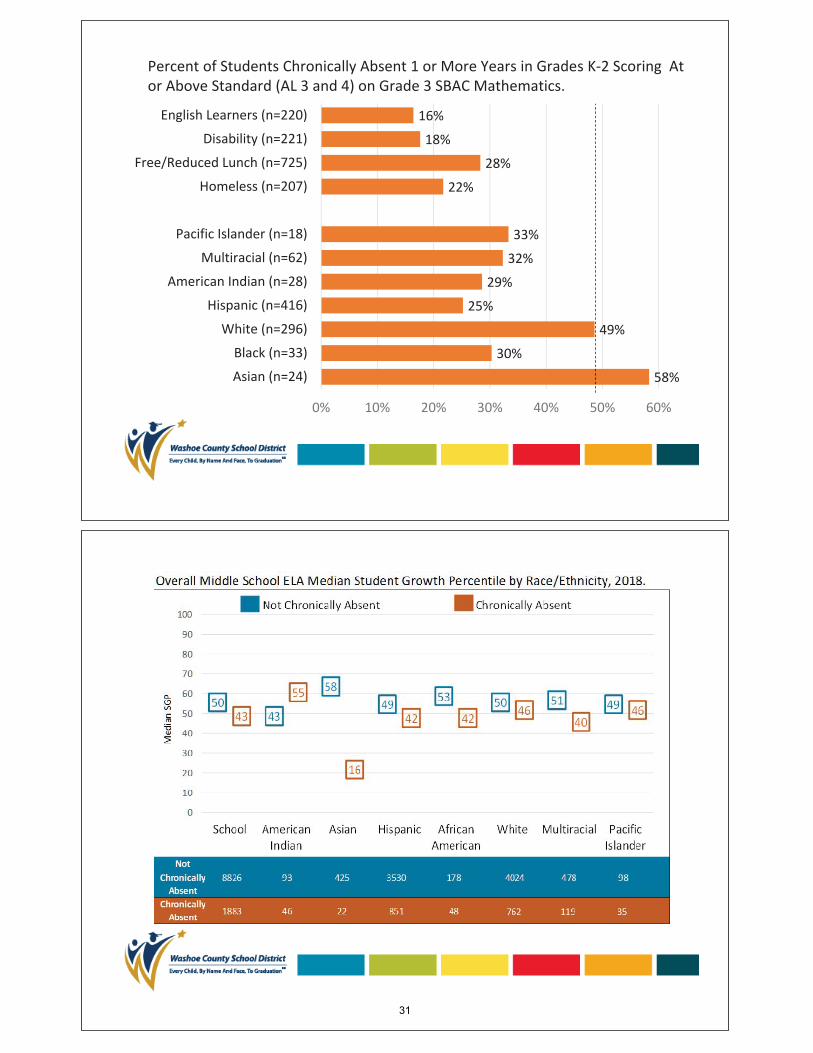
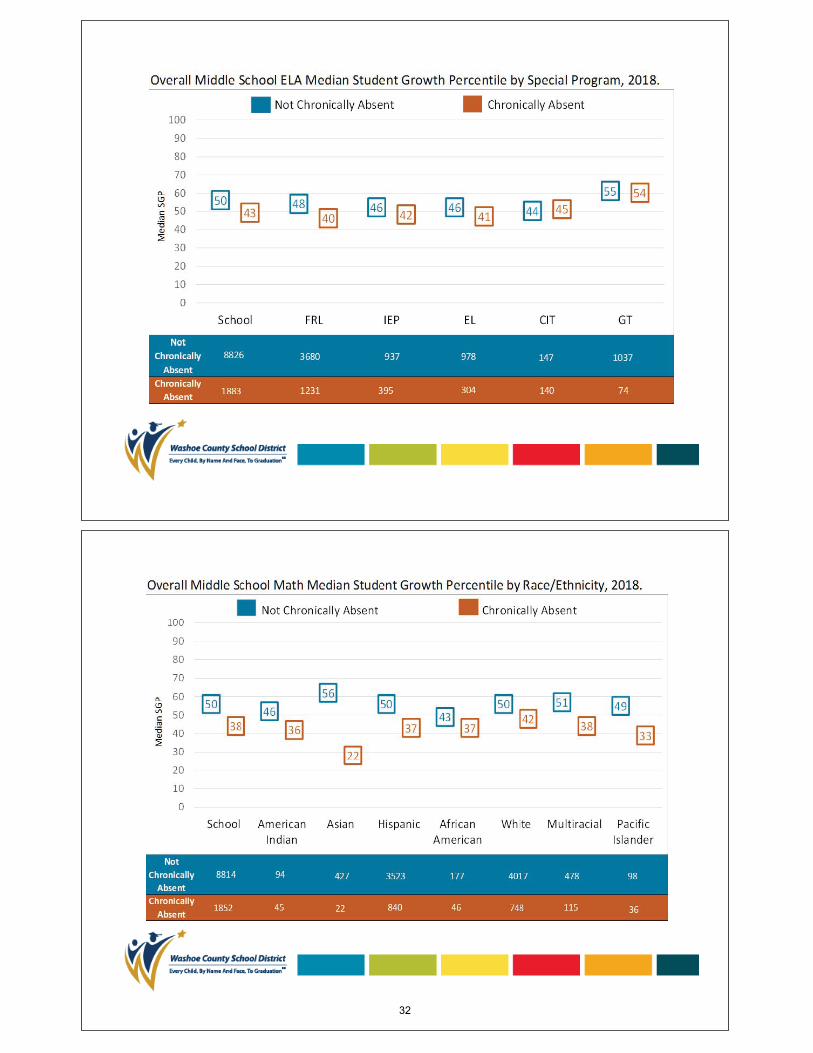
2. Middle School2018 median studentgrowth percentile
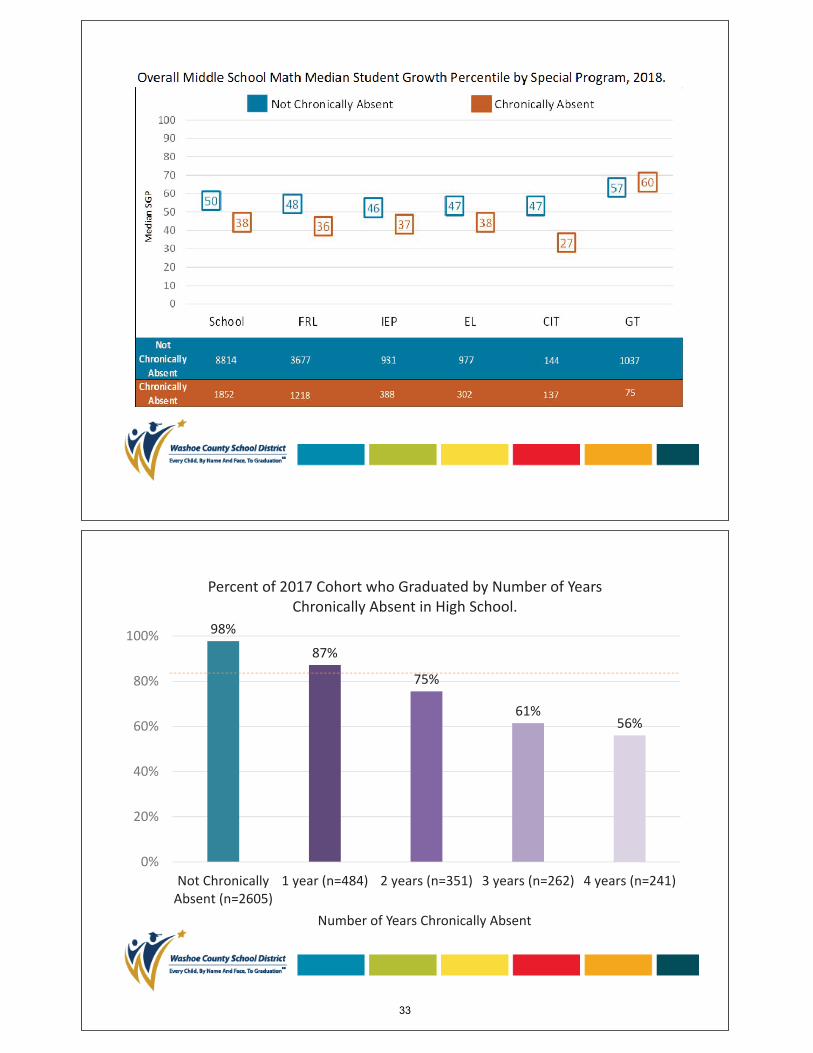
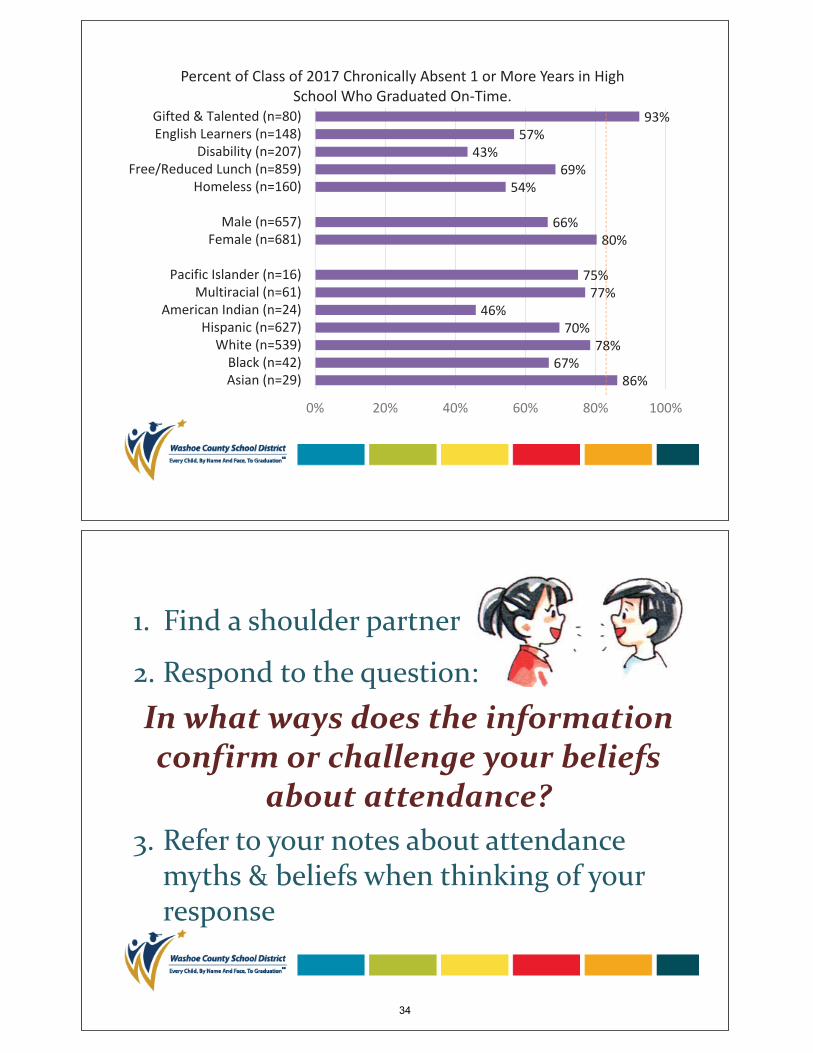
3. High SchoolGraduation outcomesof class of 2017
29
30
31
32
33
1. Find a shoulder partner
2. Respond to the question:In what ways does the informationconfirm or challenge your beliefs
about attendance?3. Refer to your notes about attendance
myths & beliefs when thinking of yourresponse
34
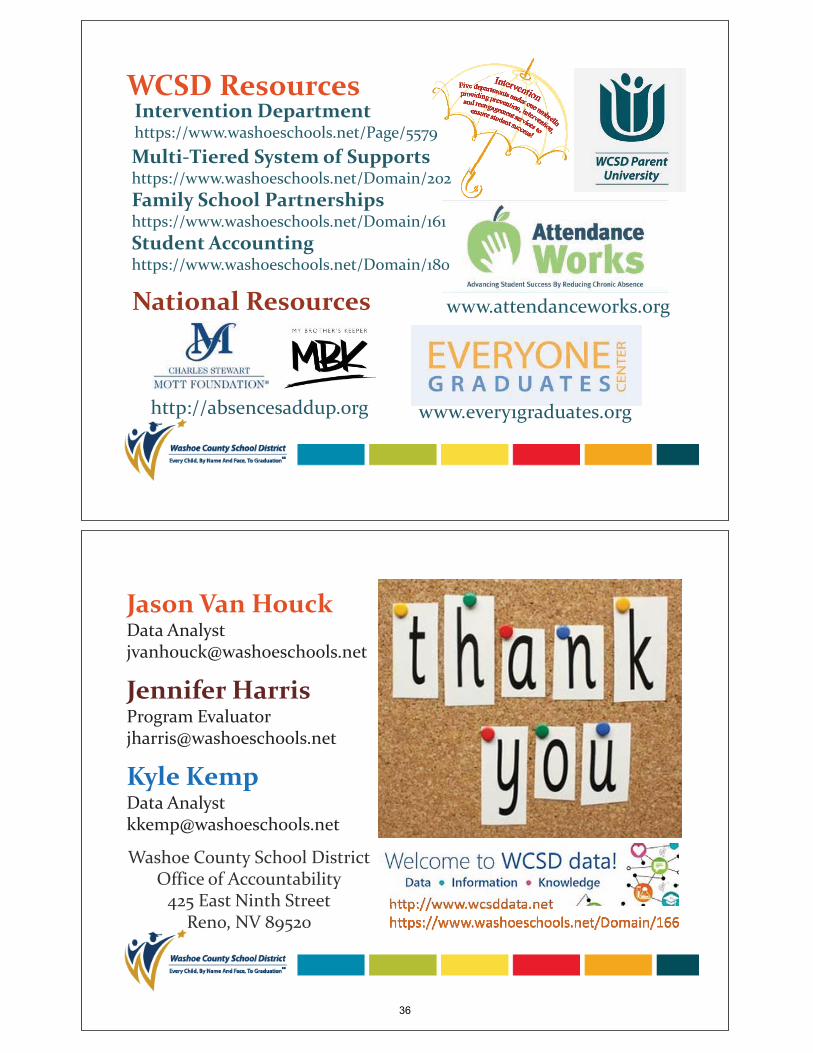
Confronting Myths1. Strong rigor & learning in early grades
Tied to Nevada Academic Content Standards2. Absences add up: Number of absences & years
chronic impact achievement outcomes3. Educational system rooted in white middle
class cultureValue for educationmay not be recognizedor demonstratedin expected waysSources: Victor Rios, keynote speech at the 2018 NV Family Engagement Summit.Egalite, A. (2016). How Family Background Influences Student Achievement. Education Next ; Cambridge Vol. 16, Iss. 2.
Commit to be an…
What can the District do to strengthenattendance for all students? What can you do?
35
WCSD Resources
National Resources www.attendanceworks.org
www.every1graduates.orghttp://absencesaddup.org
Intervention Departmenthttps://www.washoeschools.net/Page/5579Multi Tiered System of Supportshttps://www.washoeschools.net/Domain/202Family School Partnershipshttps://www.washoeschools.net/Domain/161Student Accountinghttps://www.washoeschools.net/Domain/180
Jason Van HouckData [email protected]
Jennifer HarrisProgram [email protected]
Kyle KempData [email protected]
Washoe County School DistrictOffice of Accountability425 East Ninth Street
Reno, NV 89520
36
37

Data Summit Thought Organizer:
What conclusions can I draw from the presented data/information?
What is the connection to other points along the pathway to graduation and post-secondary readiness?
What is missing or needed to strengthen/complete this relationship or my understanding?
38
Climate and Conditions for Learning
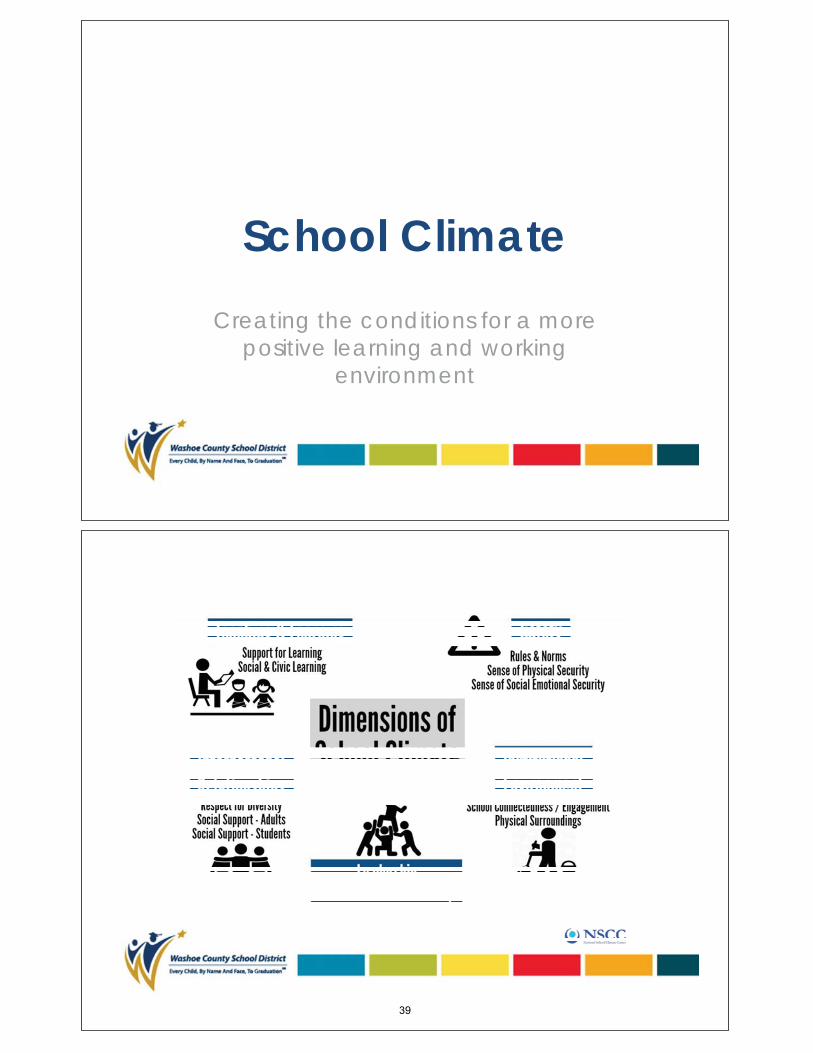
School ClimateCreating the conditions for a more
positive learning and working environment
39
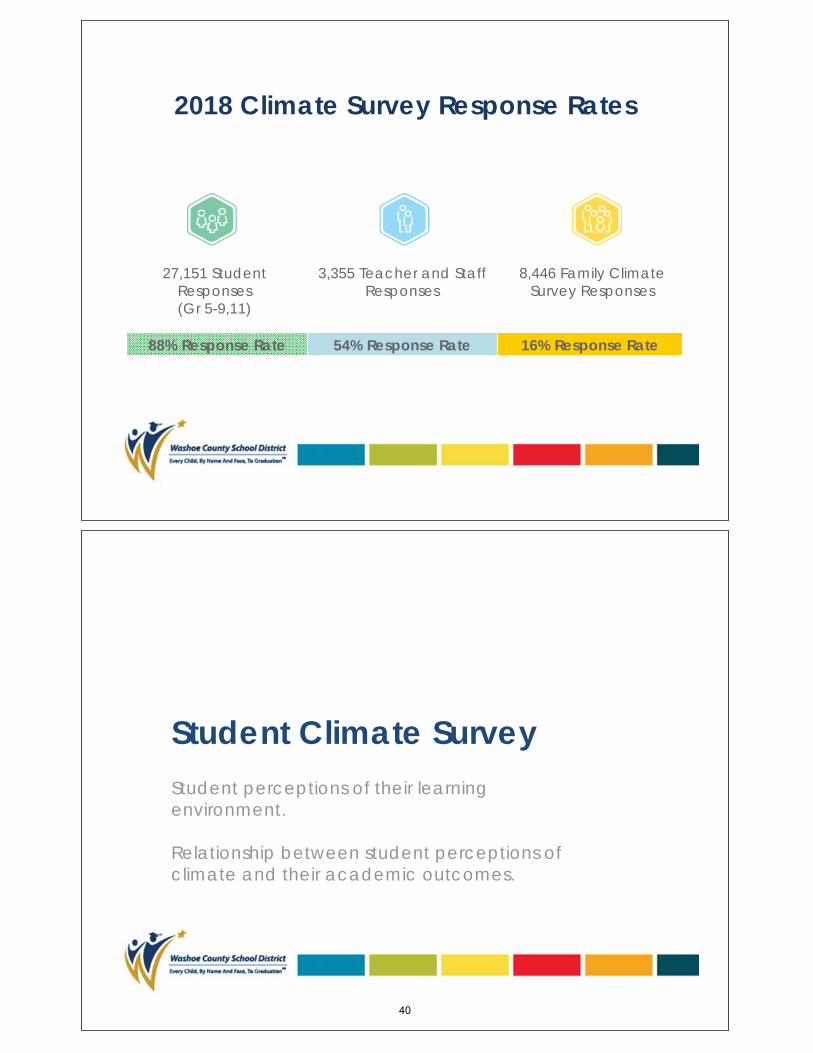
2018 Climate Survey Response Rates
88% Response Rate 54% Response Rate 16% Response Rate
27,151 Student Responses(Gr 5-9,11)
3,355 Teacher and Staff Responses
8,446 Family Climate Survey Responses
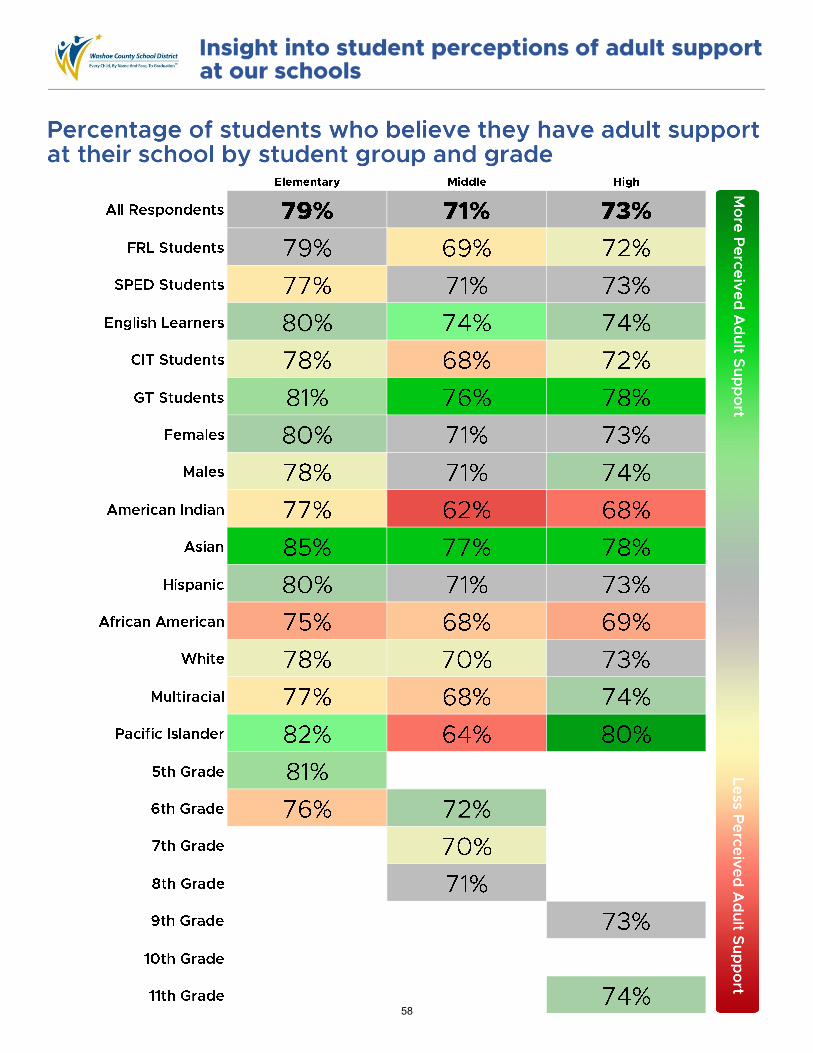
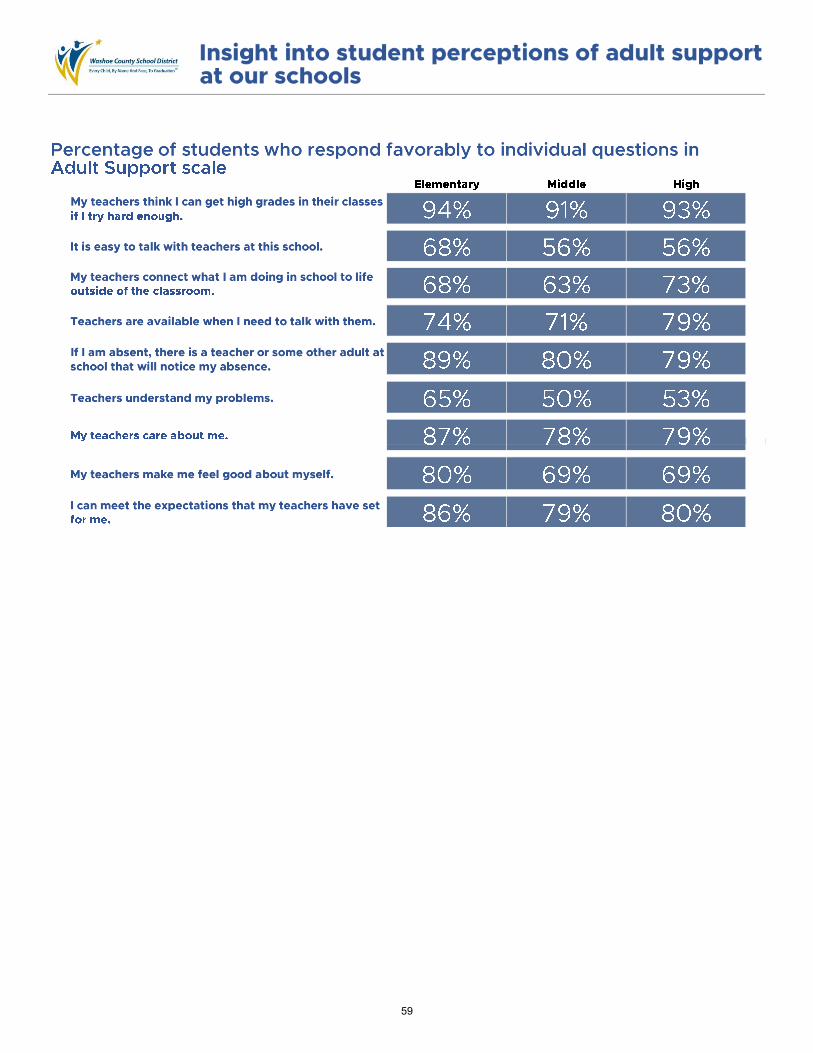
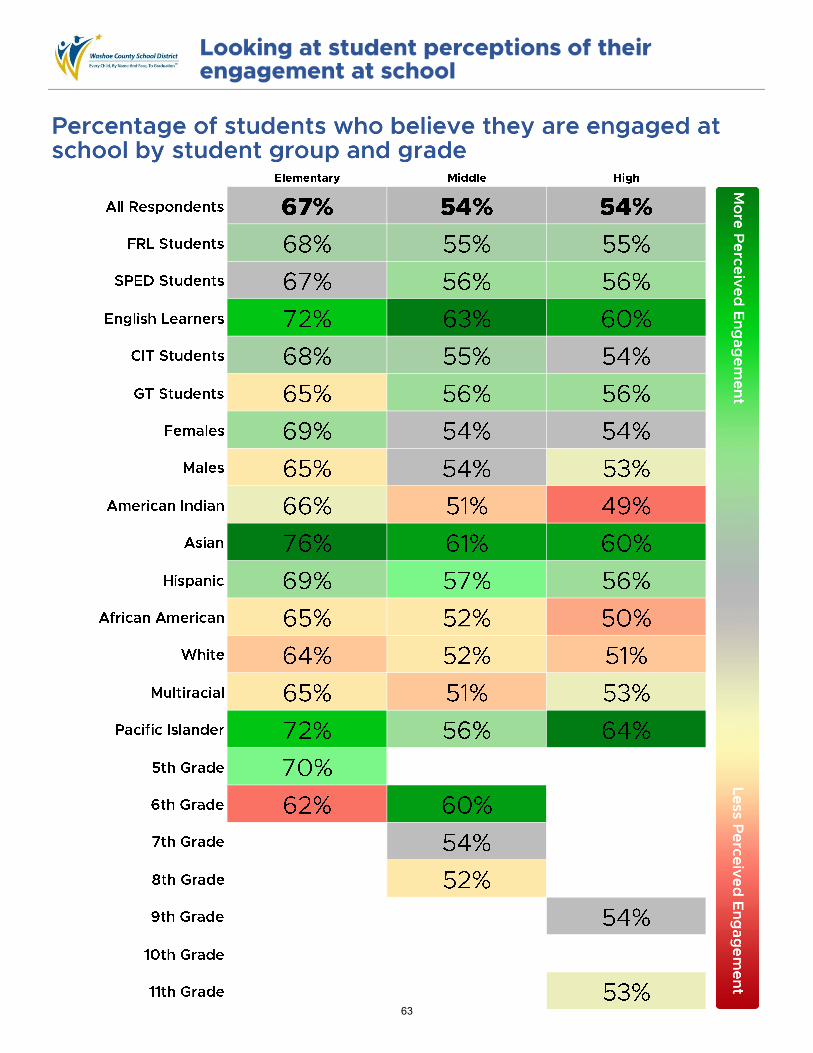
Student perceptions of their learning environment.
Relationship between student perceptions of climate and their academic outcomes.
Student Climate Survey
40
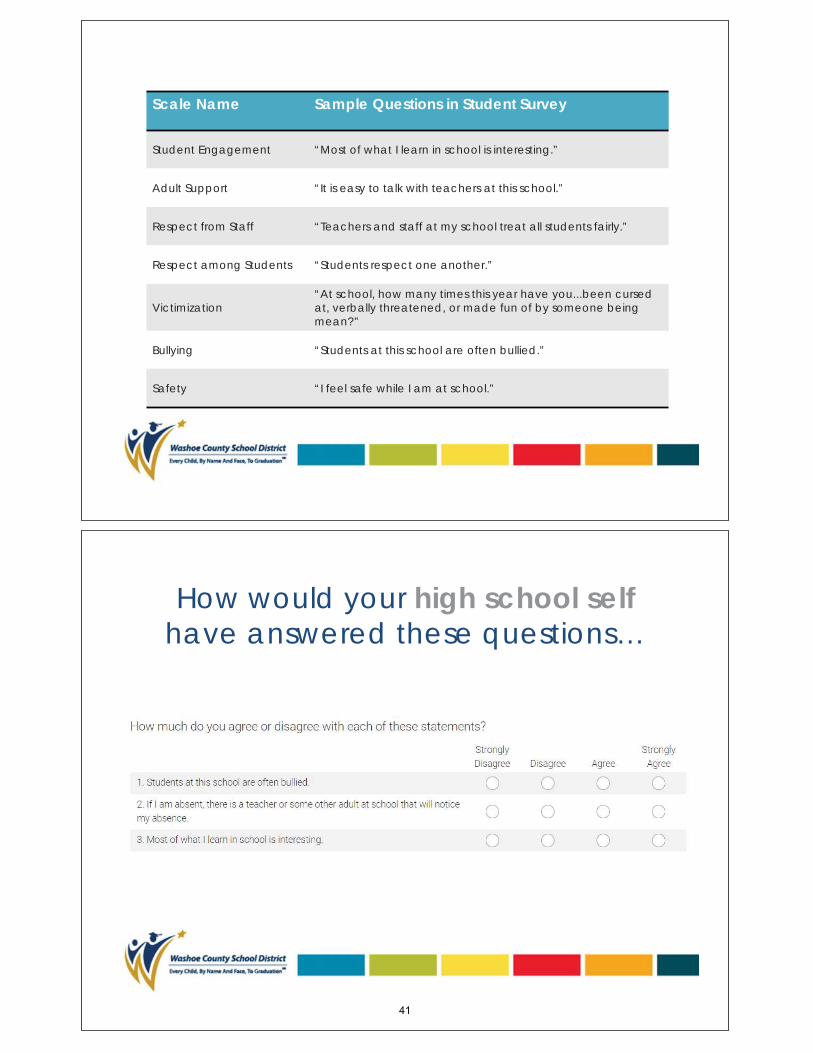
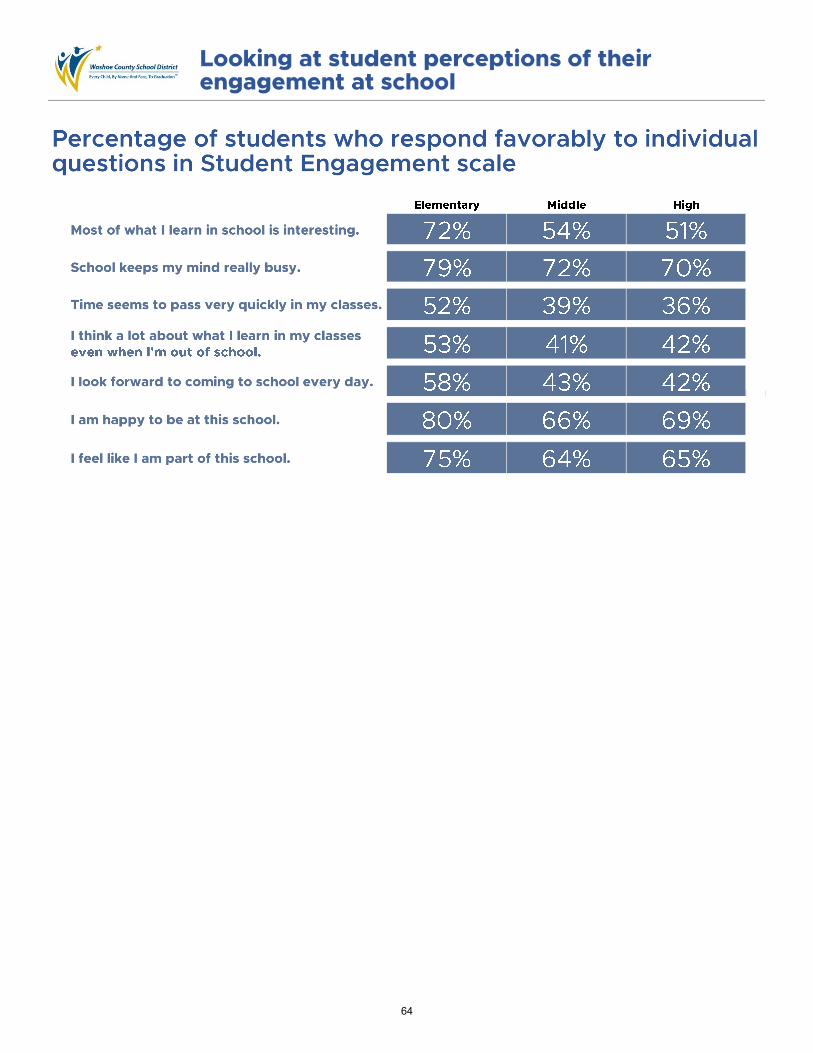
Scale Name Sample Questions in Student Survey
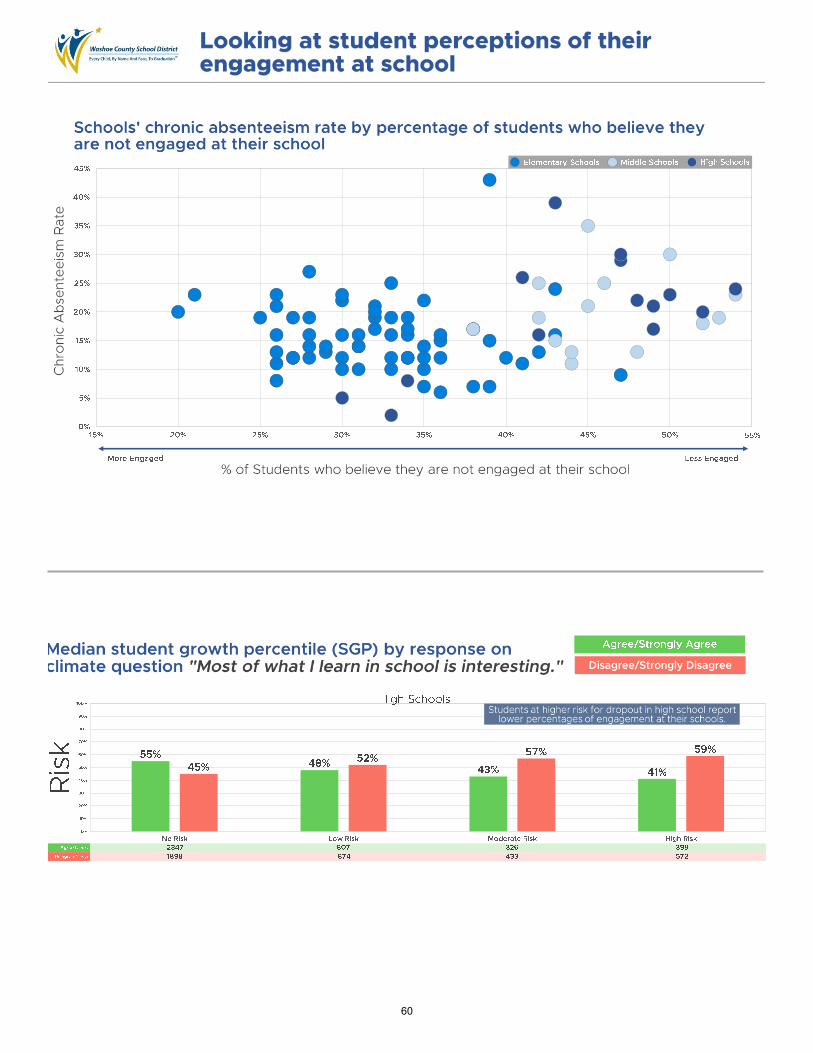
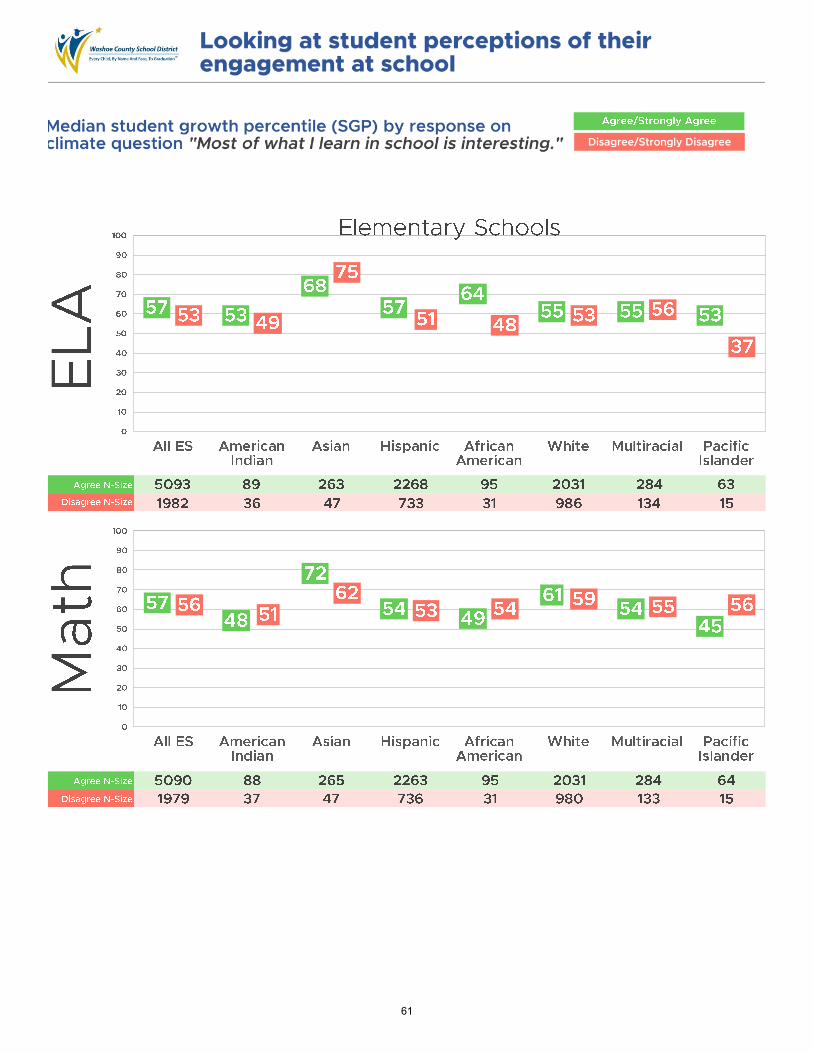
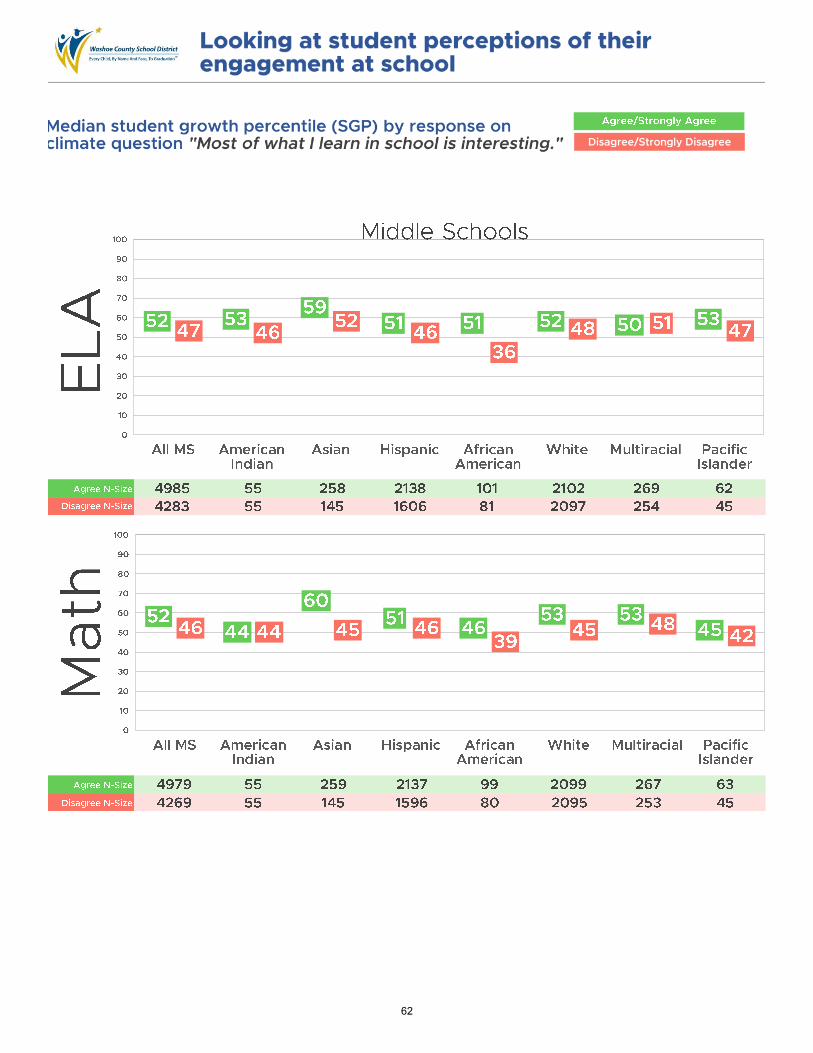
Student Engagement “Most of what I learn in school is interesting.”
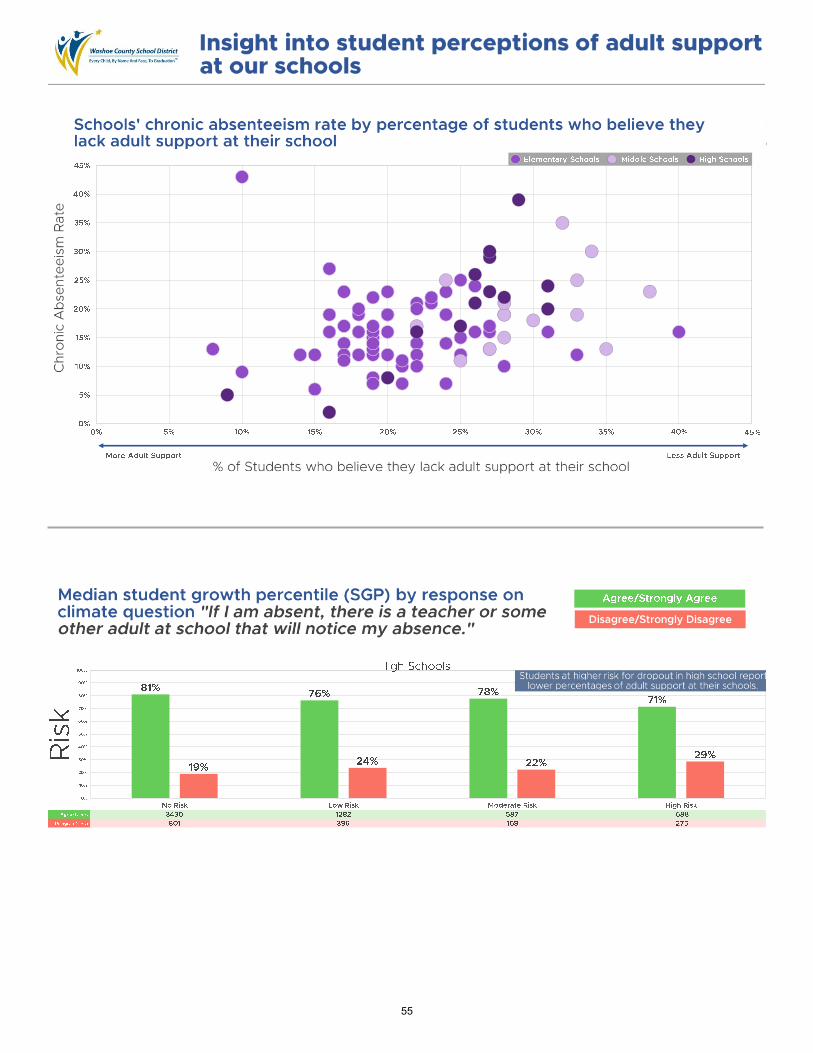
Adult Support “It is easy to talk with teachers at this school.”
Respect from Staff “Teachers and staff at my school treat all students fairly.”
Respect among Students “Students respect one another.”
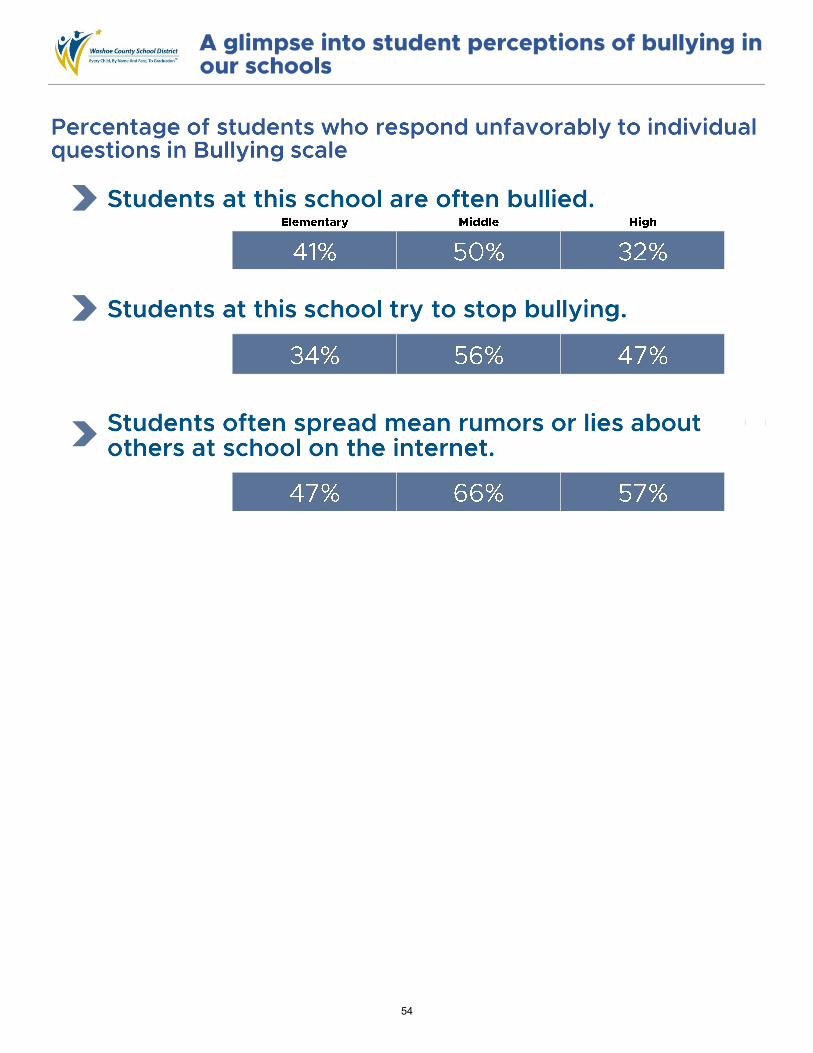
Victimization“At school, how many times this year have you...been cursed at, verbally threatened, or made fun of by someone being mean?”
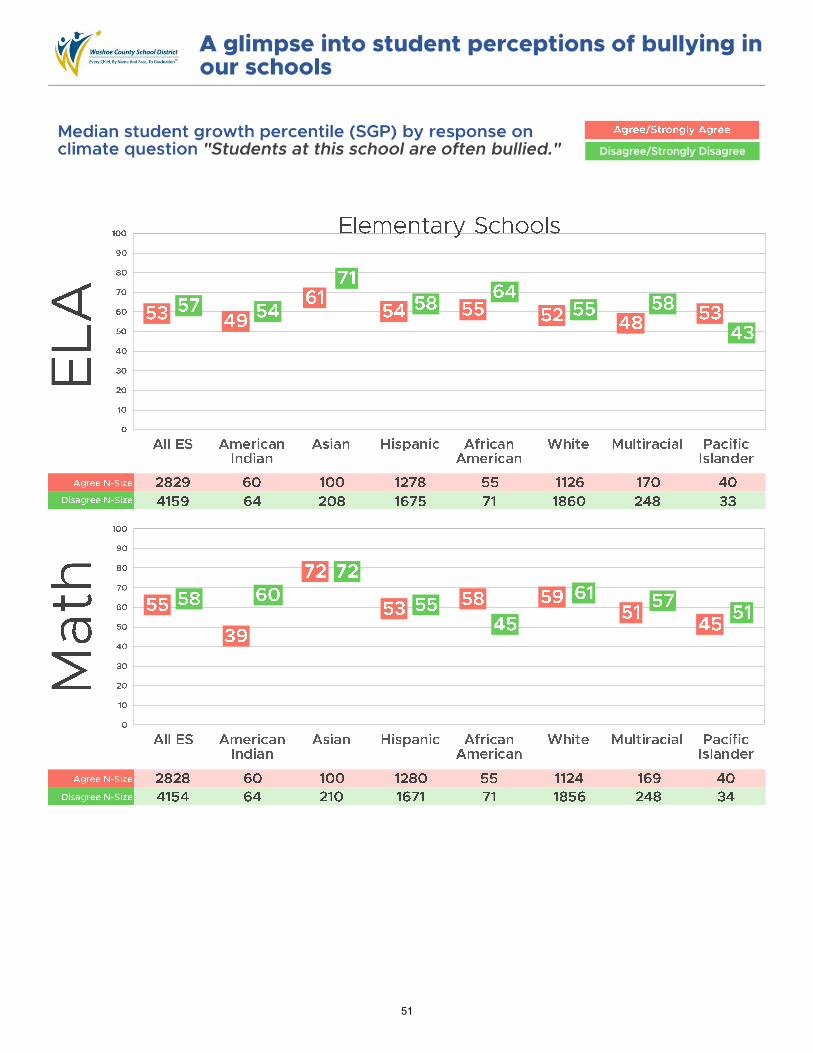
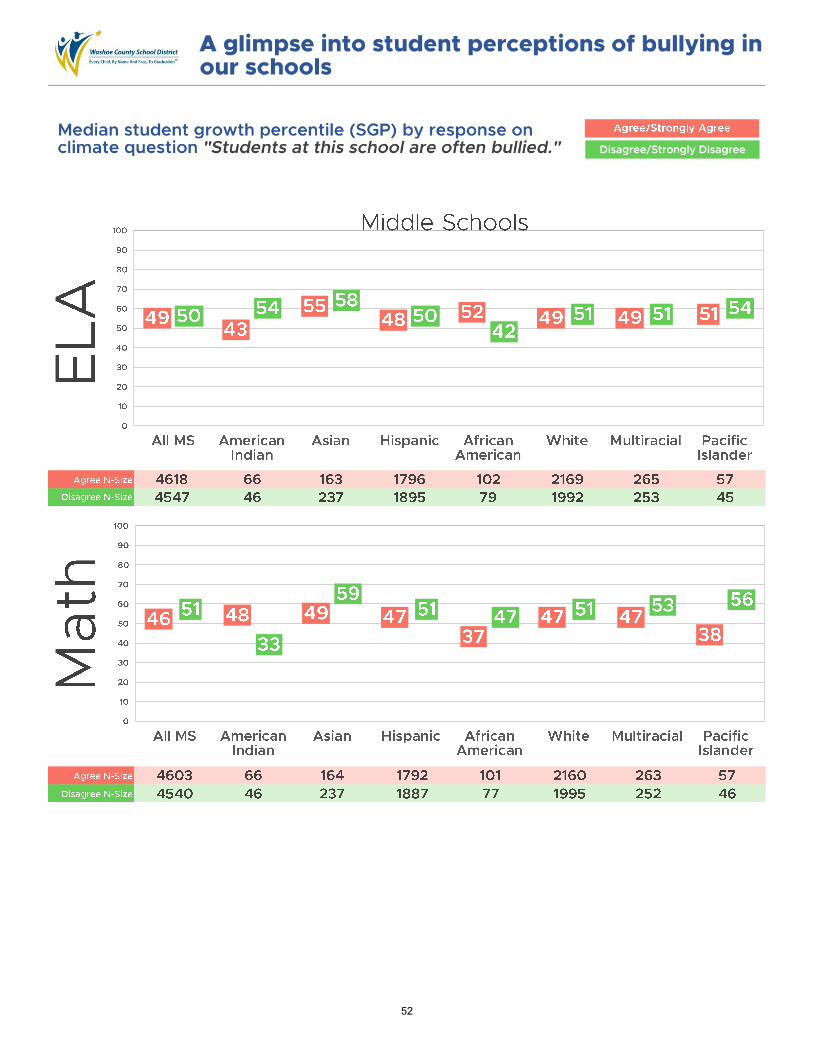
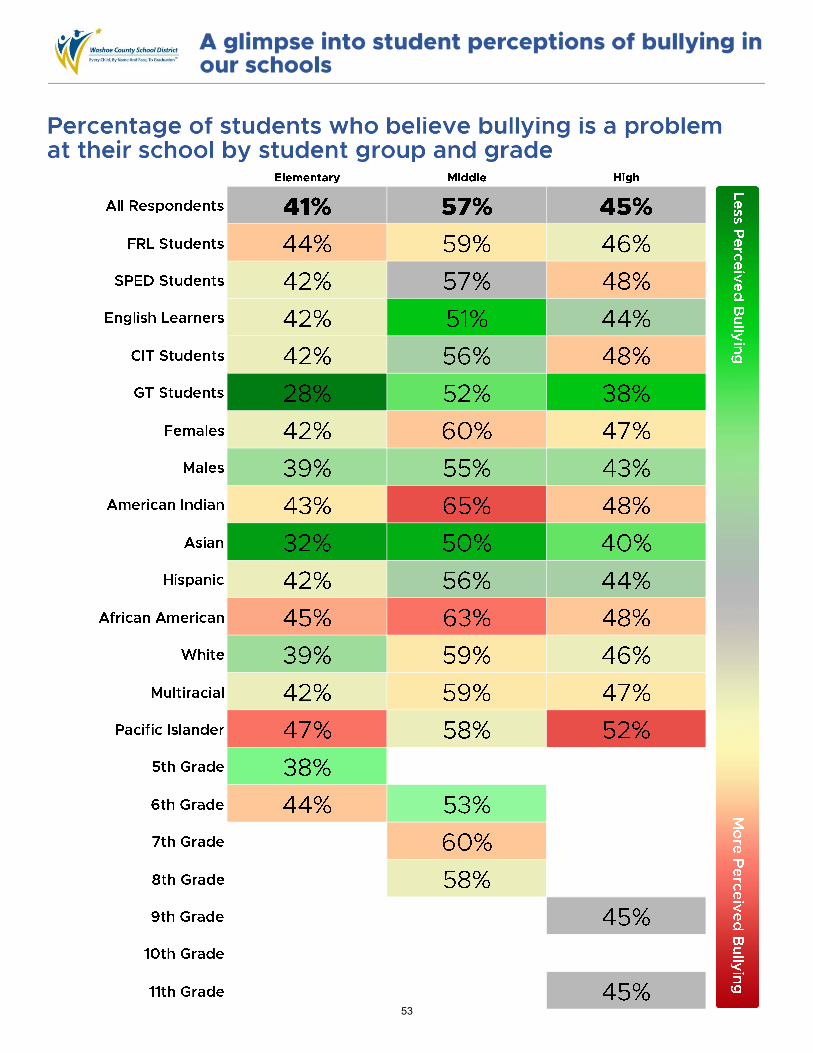
Bullying “Students at this school are often bullied.”
Safety “I feel safe while I am at school.”
How would your high school selfhave answered these questions…
41
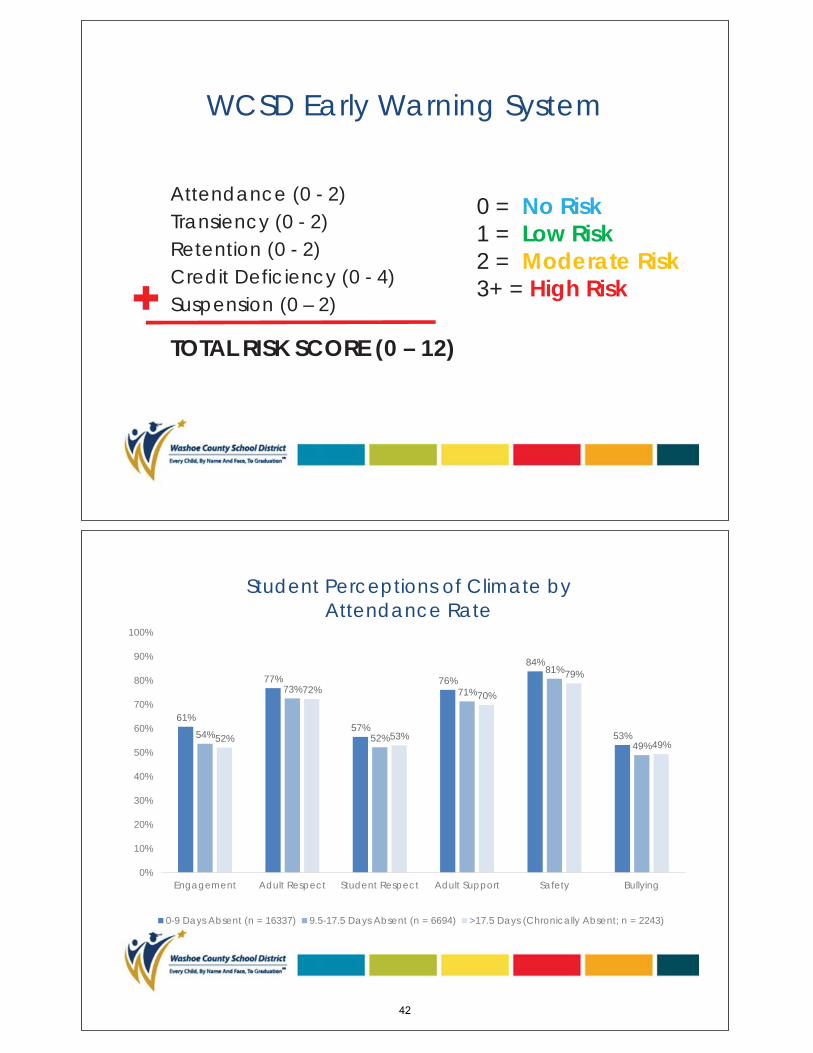
WCSD Early Warning System
Attendance (0 - 2)Transiency (0 - 2)Retention (0 - 2)Credit Deficiency (0 - 4)Suspension (0 – 2)
TOTAL RISK SCORE (0 – 12)
0 = No Risk1 = Low Risk2 = Moderate Risk3+ = High Risk
61%
77%
57%
76%
84%
53%54%
73%
52%
71%
81%
49%52%
72%
53%
70%
79%
49%
0%
10%
20%
30%
40%
50%
60%
70%
80%
90%
100%
Engagement Adult Respect Student Respect Adult Support Safety Bullying
Student Perceptions of Climate by Attendance Rate
0-9 Days Absent (n = 16337) 9.5-17.5 Days Absent (n = 6694) >17.5 Days (Chronically Absent; n = 2243)
42
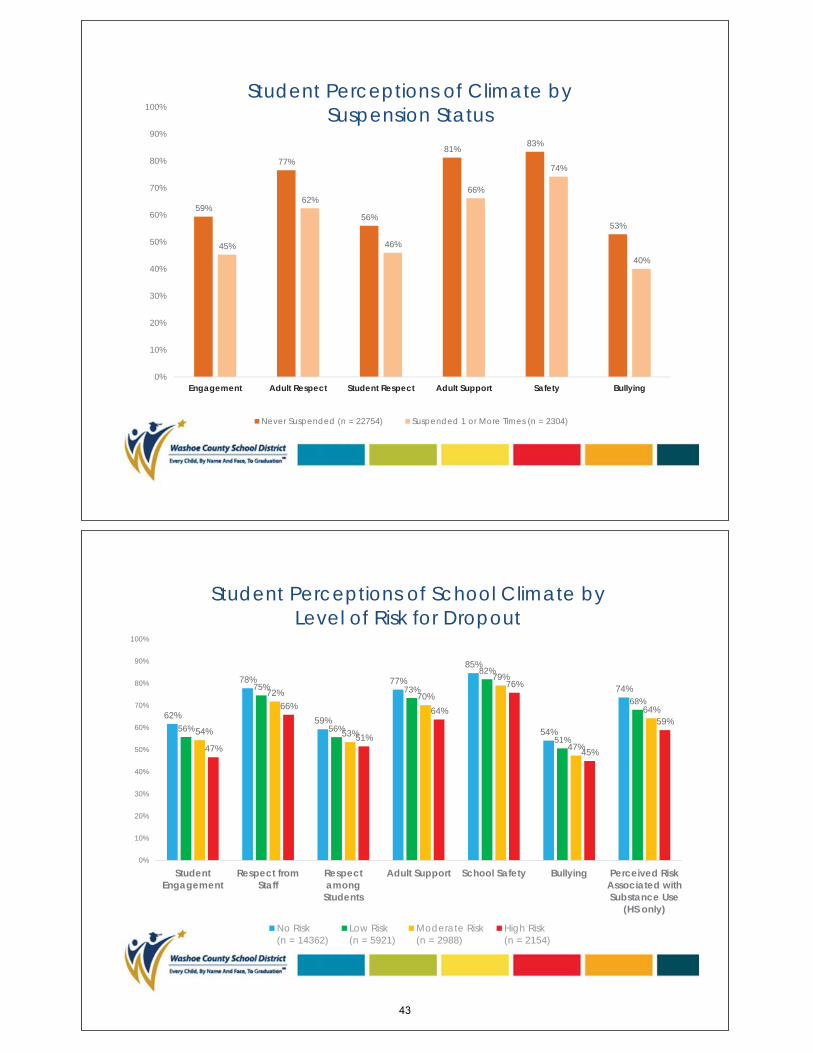
59%
77%
56%
81% 83%
53%
45%
62%
46%
66%
74%
40%
0%
10%
20%
30%
40%
50%
60%
70%
80%
90%
100%
Engagement Adult Respect Student Respect Adult Support Safety Bullying
Student Perceptions of Climate by Suspension Status
Never Suspended (n = 22754) Suspended 1 or More Times (n = 2304)
62%
78%
59%
77%
85%
54%
74%
56%
75%
56%
73%
82%
51%
68%
54%
72%
53%
70%
79%
47%
64%
47%
66%
51%
64%
76%
45%
59%
0%
10%
20%
30%
40%
50%
60%
70%
80%
90%
100%
StudentEngagement
Respect fromStaff
Respectamong
Students
Adult Support School Safety Bullying Perceived RiskAssociated withSubstance Use
(HS only)
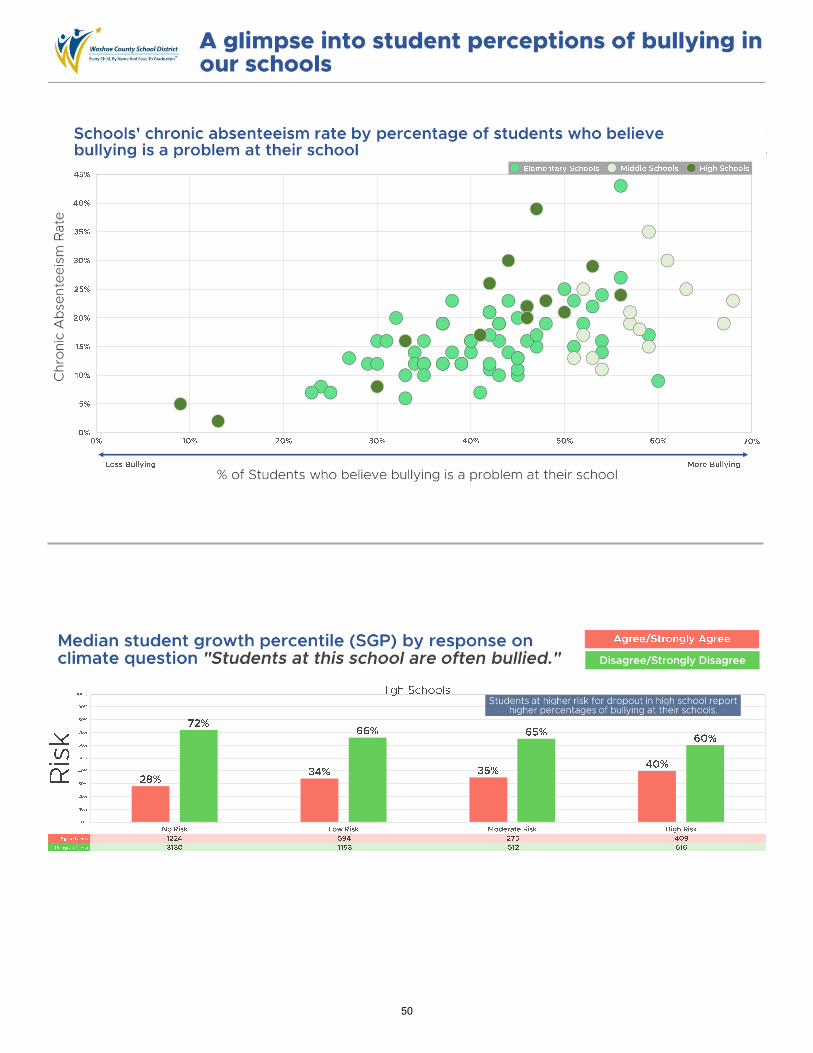
Student Perceptions of School Climate by Level of Risk for Dropout
No Risk(n = 14362)
Low Risk(n = 5921)
Moderate Risk(n = 2988)
High Risk(n = 2154)
43
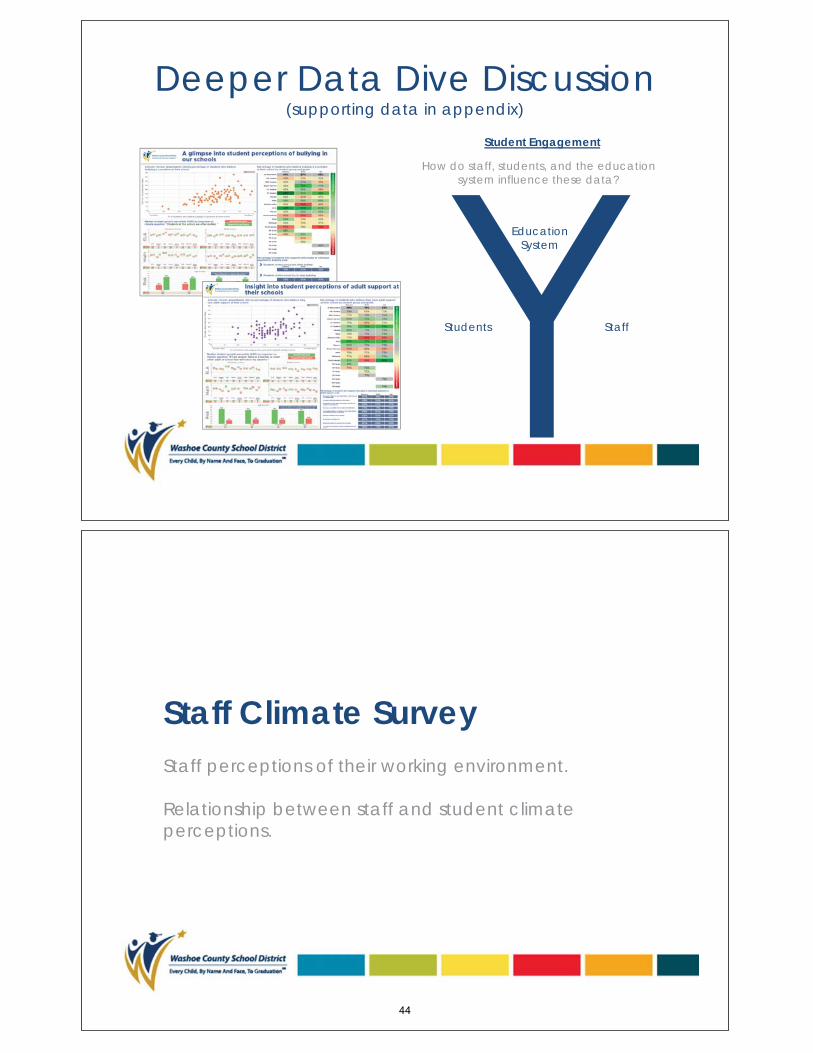
Deeper Data Dive Discussion(supporting data in appendix)
Student Engagement
How do staff, students, and the education system influence these data?
StaffStudents
Education System
Staff perceptions of their working environment.
Relationship between staff and student climate perceptions.
Staff Climate Survey
44
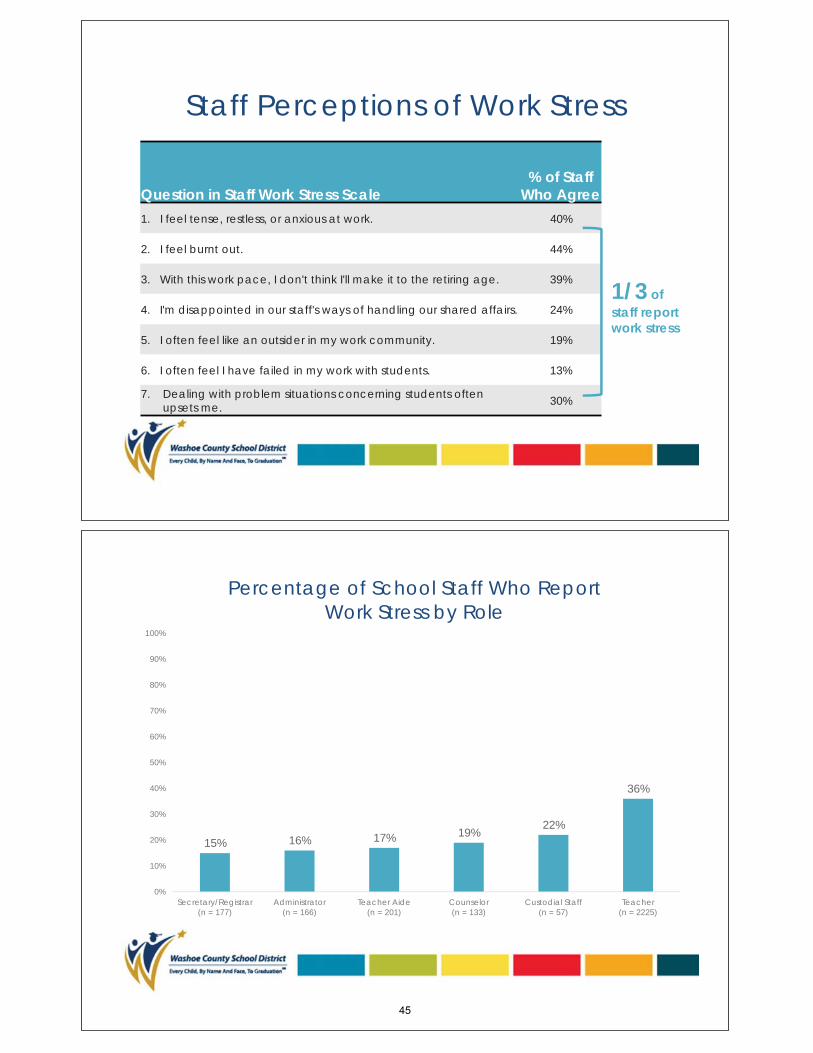
Staff Perceptions of Work Stress
Question in Staff Work Stress Scale% of Staff
Who Agree1. I feel tense, restless, or anxious at work. 40%
2. I feel burnt out. 44%
3. With this work pace, I don't think I'll make it to the retiring age. 39%
4. I'm disappointed in our staff's ways of handling our shared affairs. 24%
5. I often feel like an outsider in my work community. 19%
6. I often feel I have failed in my work with students. 13%
7. Dealing with problem situations concerning students oftenupsets me. 30%
1/3 ofstaff report work stress
15% 16% 17% 19% 22%
36%
0%
10%
20%
30%
40%
50%
60%
70%
80%
90%
100%
Secretary/Registrar(n = 177)
Administrator(n = 166)
Teacher Aide(n = 201)
Counselor(n = 133)
Custodial Staff(n = 57)
Teacher(n = 2225)
Percentage of School Staff Who Report Work Stress by Role
45
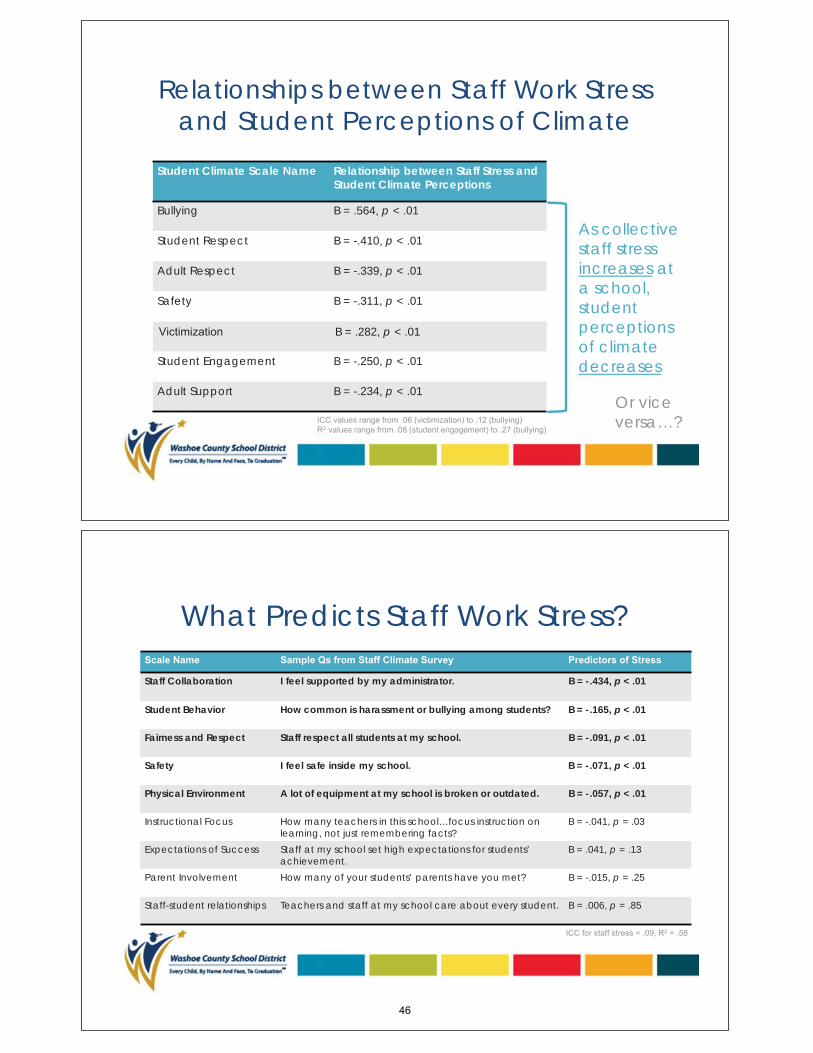
Relationships between Staff Work Stress and Student Perceptions of Climate
Student Climate Scale Name Relationship between Staff Stress and Student Climate Perceptions
Bullying B = .564, p < .01
Student Respect B = -.410, p < .01
Adult Respect B = -.339, p < .01
Safety B = -.311, p < .01
B = .282, p < .01
Student Engagement B = -.250, p < .01
Adult Support B = -.234, p < .01
As collective staff stress increases at a school, studentperceptionsof climate decreases
Or vice versa…?
What Predicts Staff Work Stress?
Staff Collaboration I feel supported by my administrator. B = -.434, p < .01
Student Behavior How common is harassment or bullying among students? B = -.165, p < .01
Fairness and Respect Staff respect all students at my school. B = -.091, p < .01
Safety I feel safe inside my school. B = -.071, p < .01
Physical Environment A lot of equipment at my school is broken or outdated. B = -.057, p < .01
Instructional Focus How many teachers in this school…focus instruction on learning, not just remembering facts?
B = -.041, p = .03
Expectations of Success Staff at my school set high expectations for students’ achievement.
B = .041, p = .13
Parent Involvement How many of your students’ parents have you met? B = -.015, p = .25
Staff-student relationships Teachers and staff at my school care about every student. B = .006, p = .85
46
Reflect
WCSD School Climate Surveys
47
2018 Data Summit - Climate Session
APPENDIX
48
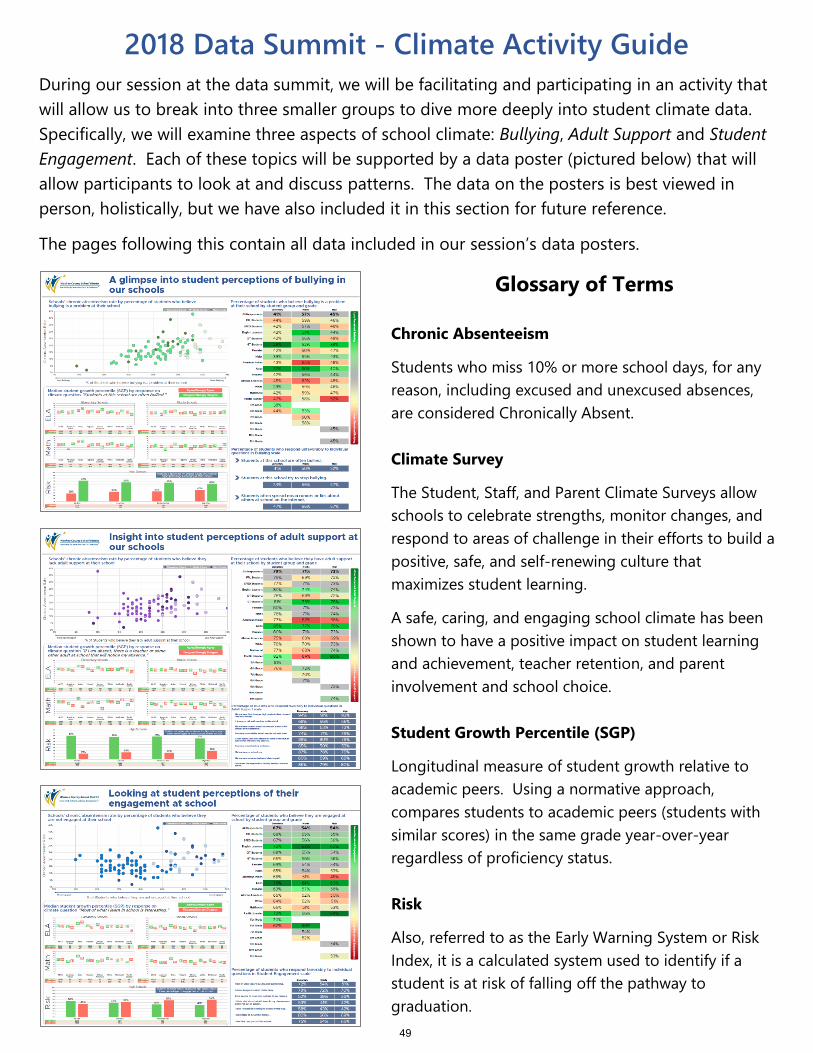
2018 Data Summit - Climate Activity Guide
During our session at the data summit, we will be facilitating and participating in an activity that
will allow us to break into three smaller groups to dive more deeply into student climate data.
Specifically, we will examine three aspects of school climate: Bullying, Adult Support and Student
Engagement. Each of these topics will be supported by a data poster (pictured below) that will
allow participants to look at and discuss patterns. The data on the posters is best viewed in
person, holistically, but we have also included it in this section for future reference.
The pages following this contain all data included in our session’s data posters.
Glossary of Terms
Chronic Absenteeism
Students who miss 10% or more school days, for any
reason, including excused and unexcused absences,
are considered Chronically Absent.
Climate Survey
The Student, Staff, and Parent Climate Surveys allow
schools to celebrate strengths, monitor changes, and
respond to areas of challenge in their efforts to build a
positive, safe, and self-renewing culture that
maximizes student learning.
A safe, caring, and engaging school climate has been
shown to have a positive impact on student learning
and achievement, teacher retention, and parent
involvement and school choice.
Student Growth Percentile (SGP)
Longitudinal measure of student growth relative to
academic peers. Using a normative approach,
compares students to academic peers (students with
similar scores) in the same grade year-over-year
regardless of proficiency status.
Risk
Also, referred to as the Early Warning System or Risk
Index, it is a calculated system used to identify if a
student is at risk of falling off the pathway to
graduation.
49
50
51
52
53
54
55
56
57
58
59
60
61
62
63
64

Data Summit Thought Organizer:
What conclusions can I draw from the presented data/information?
What is the connection to other points along the pathway to graduation and post-secondary readiness?
What is missing or needed to strengthen/complete this relationship or my understanding?
65

Glossary of Terms
& Acronyms
Glossary of Terms and Acronyms
Academic Growth: For an individual student, academic growth is the progress shown by the student, in a given subject area, over a given span of time. The Nevada Growth Model expresses annual growth, for an individual, with a student growth percentile in reading and mathematics. This percentile describes how much growth a student has made, year to year, relative to his/her "academic peers" (See “Student Growth Percentile”). For a school, district, or other relevant student grouping, student growth is summarized using the median of the student growth percentiles for that grouping.
Academic Proficiency Status: A single point in time score on an assessment. Status for an individual is expressed as a test score (or "scale score"), or it may be described using an achievement level. When we discuss the percentage of proficient students, we are discussing status. And when we discuss gains in proficiency we are discussing improvement in status, rather than growth.
Achievement Gap: Persistent differences in achievement among different types of students
ACT: American College Testing Standardized test for high school achievement and college admission in the United States
ADA: Average Daily Attendance Percentage of school enrollment in attendance on an “average school day” as of the 100th day of school.
AP: Advanced Placement The AP Program is a cooperative educational endeavor between secondary schools to accelerate learning by exposing students to college-level material through involvement in an Advanced Placement course at their high school. AP then gives students the opportunity to show that they have mastered the AP course by taking an AP exam. Colleges and universities grant credit, placement or both to students who have completed AP.
APR: Action Plan for Reform Plan to accomplish WCSD’s goals for every child to graduate and be college, career ready.
BOT: Board of Trustees The Washoe County School District Board of Trustees is an elected board of seven members. Five members are elected from geographical districts. Two members are elected as at-large. All members serve four-year terms. Please continue reading to "meet your Board of Trustees."
Chronic Absenteeism Students who miss 10% or more school days, for any reason, including excused and unexcused absences, are considered Chronically Absent.
CRT and/or SBAC: Criterion Referenced Tests Smarter Balanced Assessment Consortium (SBAC) is a state mandated standardized,
66
standards-based assessment administered in grades 3-8. These tests are tied to the state’s academic standards.
CTE: Career Technical Education (CTE) provides students of all ages with the academic and technical skills, knowledge and training necessary to succeed in future careers and to become lifelong learners. In total, about 12.5 million high school and college students are enrolled in CTE across the nation.
Disaggregated Group: A demographic set or population of students. Nevada reports student academic growth and status in disaggregated groups: students eligible for Free/Reduced Lunch, students with various races and/or ethnicities, students with disabilities and English Language Learners. For accountability, data are disaggregated by: each race/ethnicity category, students eligible for Free/Reduced lunch, English Language Learners, and students with disabilities.
DRA: Developmental Reading Assessment The Developmental Reading Assessment (DRA) is an interim benchmark assessment that is specifically designed for students in grades K-3. It enables teachers to systematically observe, record, and evaluate change in student reading performance over time.
ELA: English Language Arts
EL: English Learners The EL program is an English language development program using content for the development of Speaking, Listening, Reading and Writing skills for non-English proficient or English Language Learners (ELs).
ESEA: Elementary and Secondary Education Act ESEA was passed in 1965 as a part of the "War on Poverty." ESEA emphasizes equal access to education and establishes high standards and accountability. The law authorizes federally funded education programs that are administered by the states. In 2002, Congress amended ESEA and reauthorized it as the No Child Left Behind Act (NCLB).
EWS: Early Warning System The Risk index to identify if a student is at risk of falling off of the Pathway.
FRL: Free and Reduced Lunch Free and reduced price lunches are provided to students whose families fall below a minimum income threshold as determined by the federal government.
GPA: Grade Point Average
GT: Gifted and Talented Program to provide our gifted and talented students differentiated instruction that is commensurate with their exceptional abilities through a spectrum of curricular and instructional gifted services and opportunities. The District will provide programs for gifted
67
and talented students to work together under the guidance of trained teachers in an atmosphere that is intellectually and academically rigorous, fosters creativity, and provides emotional support.
IB: International Baccalaureate The International Baccalaureate Program is a comprehensive and rigorous curriculum designed to prepare students for a quality university education. The primary objective of the IB Program is to provide students with a balanced, integrated curriculum in all academic areas.
IEP: Individualized Education Plan The IEP is a written education plan for a school-aged child with disabilities that is developed by a team of professionals (teachers, therapists, etc.) and the child’s parents or family to meet the unique needs of students with disabilities who require specially designed instruction. This plan must be reviewed and updated yearly. It describes how the child is presently doing, specifies the child’s learning needs, and describes what services the child will need.
LEA: Local Education Agencies
LEP: Limited English Proficient LEP students are those for whom English is a second language and who are not reading or writing in English at grade level. This is another term for describing students who are English Language Learners (ELL).
MAP: Measures of Academic Progress Measures of Academic Progress is a computerized adaptive test administered 2-3 times a year in grades K-8 which helps teachers, parents, and administrators measure student growth and help define student instructional level.
Mean: A summary measure of a collection of numbers, calculated by adding all of the numbers together and dividing by how many numbers were in the collection (commonly known as the average).
Median: A number that summarizes a set of numbers, similar to an average. When a collection of numbers is ordered in a list from smallest to largest, the median is the middle score of the ordered list. The median is therefore the point below which 50 percent of the scores fall. Medians are more appropriate to calculate than averages in particular situations, especially since it is less sensitive to skew and outliers. Skew is the bigger issue in the case of Student Growth Percentile ranks because the highest or lowest outlier can only be 99 or 1, respectively. But if there was a small clump of very high SGP students in a school the mean (and distribution), it would skew and mask the fact that the median SGP in the school may be low (e.g. 40), which would be a better description of the student population.
MGP: Median Growth Percentile Median growth summarizes student growth rates by district, school, grade level, or other group of interest. It is measured using the median student growth percentile, which is
68
calculated by taking the individual student growth percentiles of the students, in the group of interest, and calculating the median.
NAA: Nevada Alternate Assessment NAA is the Nevada Alternate Assessment. A student may participate in NAA if the IEP team has determined that the student cannot participate in a particular general assessment, even with appropriate modifications and accommodations.
Nevada Growth Model (NGM) The Nevada Growth Model measures how much a student improves in academic performance over time, rather than simply whether he or she passed a test. It answers the question, “How much progress on statewide assessments did a student or group of students make in one year, as compared to academic peers across the state?” Examining student academic growth will help districts and schools to better plan learning experiences to help more students achieve higher levels of academic performance. Results are currently based on the Criterion-Referenced Tests (CRTs) in Reading and Mathematics for students in grades 4-8. The NGM is a statistical model to calculate each student’s progress on state assessments and a tool for displaying student, school, and district results to educators and to the public.
NCCAT: Nevada Comprehensive Curriculum Audit Tool For Schools The Nevada Comprehensive Curriculum Audit Tool for Schools (NCCAT-S) is designed to assist schools, districts, and the state in identifying the needs of schools that have been designated as “In Need of Improvement” (INOI) with the intent to prioritize the types of technical assistance a school will need in order to improve. The NCCAT-S was developed in response to the 2009 Nevada Legislature’s Senate Bill (SB) 389. The purpose of the NCCAT-S is to provide an in-depth analysis of the school in three key categories—Curriculum and Instruction, Assessment and Accountability, and Leadership.
NMSQT: National Merit Scholarship Qualifying Test
NSPF: Nevada School Performance Framework The NSPF is the result of the state’s 2012 “Elementary and Secondary Education Act (ESEA) flexibility request. The NSPF quantifies school performance using measures of growth and proficiency, based on statewide assessments, and “other” indicators that may or may not be assessment driven.
Percentile: A percentile is a way of showing how a particular score compares with all the other scores, in a dataset, by ranking ranges of scores from 1 to 99. The higher the percentile, the higher ranking the score is among all the other values. Each range of scores represents 1% of the pool of scores. For example, if your vocabulary knowledge is at the 60th percentile for people your age, that means that you are higher in the distribution than 60% of other people - in other words, you know more words than 60% of your peers. Conversely, 40% of people know more words than you. The percentile is useful because you do not need to know anything about the scales used for particular metrics or tests - if you know that your
69
score was at the 50th percentile, you know that your score is right in the middle of all the other scores, an average score.
Performance: General term used to encompass growth and achievement (Used to discuss both student and school level attainment).
PSAT: Preliminary SAT/National Merit Scholarship Qualifying Test
Qualitative: refers to a rating score that is derived from the observation of classroom instruction and practice.
Quantitative - refers to a rating score that is derived from student achievement scores.
Risk Index: (Early Warning System) Risk is based on attendance, mobility, suspensions, credit attainment and retention. Students receive a 0, 1, or 2 for each factor and those points are summed (0-12) and then put into “Risk” categories (No Risk, Low Risk, Moderate Risk, and High Risk). Higher scores equal greater risk for falling off the pathway to graduation.
SAT: Scholastic Assessment Test or Scholastic Aptitude Test Standardized test for college admission. The SAT assess a student’s readiness for college.
SBAC and/or CRT: Criterion Referenced Tests Smarter Balanced Assessment Consortium (SBAC) is a state mandated standardized, standards-based assessment administered in grades 3-8. These tests are tied to the state’s academic standards.
SGP: Student Growth Percentile A way of understanding a student's current CRT scale score based on his/her prior scores and relative to other students with similar prior scores. The student growth percentile provides a measure of academic growth (i.e. relative position change) where students who have similar academic score histories provide a baseline for understanding each student's progress. For example, a growth percentile of 60 in mathematics means the student's growth exceeded that of 60 percent of his/her academic peers. In other words, the student's latest score was somewhat higher than we would have expected based on past score history. Also referred to as a "growth percentile."
SPP: School Performance Plan For more information visit the SPP webpage at: http://www.washoeschools.net/Domain/261
WCSD: Washoe County School District
70
Data Summit Thought Organizer:
What conclusions can I draw from the presented data/information?
What is the connection to other points along the pathway to graduation and post-secondary readiness?
What is missing or needed to strengthen/complete this relationship or my understanding?
71

Data Summit Thought Organizer:
What conclusions can I draw from the presented data/information?
What is the connection to other points along the pathway to graduation and post-secondary readiness?
What is missing or needed to strengthen/complete this relationship or my understanding?
72

![[PPT]No Slide Title - Parkway Schools / Homepage · Web viewJEOPARDY! Click Once to Begin Template by Bill Arcuri, WCSD * * * Template by Bill Arcuri, WCSD JEOPARDY! 100 100 100 100](https://img.pdfslide.us/doc/110x75/5b0e1ea07f8b9a2c3b8e2ec4/pptno-slide-title-parkway-schools-viewjeopardy-click-once-to-begin-template.jpg)
![[PPT]No Slide Title - WordPress.com · Web viewJEOPARDY! Click Once to Begin Template by Bill Arcuri, WCSD * * * * Template by Bill Arcuri, WCSD Happens when Hardy Weinberg conditions](https://img.pdfslide.us/doc/110x75/5b0e1ea07f8b9a2c3b8e2ede/pptno-slide-title-viewjeopardy-click-once-to-begin-template-by-bill-arcuri.jpg)