Embed Size (px)
Citation preview
8/12/2019 WCDMA Enhanced UL Performance Evaluation.pdf
http://slidepdf.com/reader/full/wcdma-enhanced-ul-performance-evaluationpdf 1/80
University of Twente
Faculty of Electrical Engineering,
Mathematics and Computer Science (EEMCS)
WCDMA – Enhanced Uplink performanceevaluation
Camilo Orejuela Mesa
Master of Science in Telematics
Thesis
(carried out at Twente Institute for Wireless and Mobile Communications B.V. )
Project Supervisors:
Neill Whillans (M.eng.), TI -WMC
ir. Frank Brouwer, TI-WMC
Dr. ir. Sonia M. Heemstra de Groot, University of Twente
Dr. ir. Geert Heijenk, University of Twente
May 2006
Enschede, The Netherland

8/12/2019 WCDMA Enhanced UL Performance Evaluation.pdf
http://slidepdf.com/reader/full/wcdma-enhanced-ul-performance-evaluationpdf 2/80

8/12/2019 WCDMA Enhanced UL Performance Evaluation.pdf
http://slidepdf.com/reader/full/wcdma-enhanced-ul-performance-evaluationpdf 3/80
1

8/12/2019 WCDMA Enhanced UL Performance Evaluation.pdf
http://slidepdf.com/reader/full/wcdma-enhanced-ul-performance-evaluationpdf 4/80
Table of Contents
1Introduction........................................................................................................................................8
2UMTS Overview................................................................................................................................9
2.1WCDMA ....................................................................................................................................9
2.1.1Channelization Codes.........................................................................................................9
2.1.2Scrambling Codes.............................................................................................................10
2.1.3Transmission and Reception.............................................................................................11
2.2UMTS Architecture .................................................................................................................12
2.3Transport Channels...................................................................................................................13
2.4Physical Channels.....................................................................................................................14
2.5Power Control...........................................................................................................................15
2.6Admission and Congestion Control..........................................................................................16
2.7Packet Scheduling.....................................................................................................................16
3High Speed Packet Access ..............................................................................................................18
3.1HSDPA.....................................................................................................................................18
3.2HSUPA.....................................................................................................................................18
3.2.1Enhanced Dedicate Channel (E-DCH) Protocol Architecture..........................................19
3.2.2MAC-es/MAC-e ...............................................................................................................20
3.2.3Enhanced Uplink Physical Channels................................................................................23
3.2.4Fast Hybrid Automatic Retransmission Request (HARQ)...............................................24
3.2.5Fast Packet Scheduling.....................................................................................................26
3.2.5.1Uplink Scheduling information ................................................................................28
3.2.5.2Downlink Scheduling information ...........................................................................29
3.2.6Performance of HSUPA....................................................................................................30
4Modeling of HSUPA.......................................................................................................................31
4.1Actual Value Interface (AVI)...................................................................................................31
4.2Modeling of HARQ..................................................................................................................35
4.3Modeling of NodeB Packet Scheduling Signaling...................................................................36
4.4Mobility....................................................................................................................................37
4.5Path Loss...................................................................................................................................38
4.6E-DCH in EURANE.................................................................................................................39
4.6.1Link Implementation Details.............................................................................................39
4.6.2Trace Support....................................................................................................................42
5NodeB packet Scheduling................................................................................................................43
5.1Scheduling Algorithm Basic Functionality...............................................................................43
5.2Code/Rate Scheduling...............................................................................................................47
5.3Round Robin Scheduling..........................................................................................................47
5.4UCQI based Scheduling............................................................................................................48
5.5Rate Estimation Scheduler........................................................................................................48
6Simulations and Results...................................................................................................................50
2
8/12/2019 WCDMA Enhanced UL Performance Evaluation.pdf
http://slidepdf.com/reader/full/wcdma-enhanced-ul-performance-evaluationpdf 5/80
6.1Scenario 1 ................................................................................................................................50
6.1.1Rate Scheduling................................................................................................................51
6.1.2Round Robin.....................................................................................................................52
6.1.3Scheduler based on UCQI:................................................................................................54
6.1.4Scheduler with Rate Estimation:.......................................................................................56
6.1.5Time Delay:.......................................................................................................................586.1.6Total Transmitted Power:..................................................................................................61
6.1.7Throughput:.......................................................................................................................63
6.2Scenario 2.................................................................................................................................66
6.3Scenario 3.................................................................................................................................67
6.4Scenario 4.................................................................................................................................68
6.5Priority Scheduler:....................................................................................................................70
6.6E-DCH and DCH comparison..................................................................................................74
7Conclusions......................................................................................................................................75
3

8/12/2019 WCDMA Enhanced UL Performance Evaluation.pdf
http://slidepdf.com/reader/full/wcdma-enhanced-ul-performance-evaluationpdf 6/80
Abstract
This thesis focuses on the performance of the Enhanced Uplink for UTRAN, also called High
Speed Uplink Packet Access (HSUPA), with special emphasis on the fast packet scheduling basedat the NodeB, and how different scheduling mechanisms affect the performance of the system.
An extension to the Network Simulator (ns-2) environment has been developed to support the
functionality of the Enhanced Uplink, including the HARQ and the Fast Packet Scheduling. Several
scheduling mechanisms were implemented: a Rate Scheduling in which many users are scheduled
at the same time with low rates; a Round Robin Scheduler which schedules few users with high
rates; a UCQI Scheduler that gives priority to the users with best channel conditions; a Rate
Estimation Scheduler that estimates the maximum supported rate by a user depending on its path
loss, and a Priority Scheduler which gives priority to the user depending on the type of data they are
transmitting. All these schedulers were used in different simulation scenarios to analyze and
compare their impact in the performance of the system, and conclusions made.
4

8/12/2019 WCDMA Enhanced UL Performance Evaluation.pdf
http://slidepdf.com/reader/full/wcdma-enhanced-ul-performance-evaluationpdf 7/80
Acknowledgements
I want to express my gratitude to all the people who contributed to the completion of this work.
First of all I am very grateful to my supervisor Neill Whillans for his guidance and support. Also to
Irene de Bruin who was always willing to help whenever I need it. I am also very grateful for the
collaboration and valuable advices from Frank Brouwer, Geert Heijenk and Sonia Heemstra de
Groot s who contributed with their knowledge and experience.
I will also like to express my gratitude to all the people of WCM. It was very nice to meet you all
and which you the best in your professional and personal life.
Finally, I give special thanks to my family who made this great opportunity become possible.
5

8/12/2019 WCDMA Enhanced UL Performance Evaluation.pdf
http://slidepdf.com/reader/full/wcdma-enhanced-ul-performance-evaluationpdf 8/80
Abbreviations
3G 3rd generation mobile communications
3GPP 3rd generation partnership project
AMC Adaptive Modulation and Coding
ARQ Automatic repeat request
AVI Actual value interface
BLER Block error rate
CDMA Code division multiple access
CN Core network
CQI Channel quality indicator
DCH Dedicated channel
DPCCH Dedicated physical control channel
DPDCH Dedicated physical data channel
Eb/No Data bit energy to interference ratio
E-DCH Enhanced dedicated channel
FDD Frequency division duplex
FTP File transfer protocol
GGSN Gateway GPRS support node
GPRS General packet radio service
GSM Global system for mobile communications
HARQ Hybrid automatic repeat request
HSDPA High speed downlink packet access
HSUPA High speed uplink packet access
MAC Medium access control
NR Noise Rise
PDF Probability density function
PDU Packet data unit
6

8/12/2019 WCDMA Enhanced UL Performance Evaluation.pdf
http://slidepdf.com/reader/full/wcdma-enhanced-ul-performance-evaluationpdf 9/80
PHY Physical layer
PS Packet scheduler
QoS Quality of service
RLC Radio link control
RNC Radio network controller
RTT Round trip time
TBS Transport Block Size
TCP Transmission control protocol
TDD Time division duplex
TFC Transport format combination
TTI Transmission time intervalUCQI Uplink channel quality indicator
UE User Equipment
UMTS Universal mobile telecommunications system
UTRAN UMTS terrestrial radio access network
WCDMA Wideband code division multiple access
7

8/12/2019 WCDMA Enhanced UL Performance Evaluation.pdf
http://slidepdf.com/reader/full/wcdma-enhanced-ul-performance-evaluationpdf 10/80
8/12/2019 WCDMA Enhanced UL Performance Evaluation.pdf
http://slidepdf.com/reader/full/wcdma-enhanced-ul-performance-evaluationpdf 11/80

8/12/2019 WCDMA Enhanced UL Performance Evaluation.pdf
http://slidepdf.com/reader/full/wcdma-enhanced-ul-performance-evaluationpdf 12/80
frequency bandwidth of the channel. WCDMA can use the channelization codes to transmit
information at different bit rates, transmitting every bit of information as a code at 3.84Mcps, the
bit rate will depend on the length of the code. The shorter the code the higher the information bit
rate. If every bit of information is multiplied by the spreading code with a chip rate of 3.84Mcps, it
means that the bandwidth of the information signal is spread along the bandwidth used by the chip
rate (approximately 5MHz).
Figure 2.1: Spreading and Despreading [20].
2.1.2 Scrambling Codes
Scrambling codes are used to separate transmissions from different sources. In the uplink
scrambling codes separate different mobiles and in the downlink separate different NodeB cells or
sectors. This codes does not affect the transmission bandwidth and they are just use to separate
transmitters. There are two families of scrambling codes (short and long codes). In the uplink short
and long codes are used depending on NodeB receiver (long codes for Rake receiver and short
codes for multiuser detectors). Each family of codes contains millions of scrambling codes so
planning is not needed (in the uplink). In the downlink the number of codes is restricted to 512 to
prevent that the cell search procedure takes too much time. Since the number of codes is limited
network planning is needed to assign a scrambling code to a cell or sector, but 512 scrambling
codes is a large number of codes and the planning is trivial.
10

8/12/2019 WCDMA Enhanced UL Performance Evaluation.pdf
http://slidepdf.com/reader/full/wcdma-enhanced-ul-performance-evaluationpdf 13/80
2.1.3 Transmission and Reception
A WCDMA transmitter use a spreading code and scrambling code to spread and separate the signal
by multiplying the information signal with these codes. The spectrum of the transmitted signal is
spread in the 5MHz bandwidth of the channel so the information is propagated below the thermal
noise level. This makes makes the detection of the signal very difficult without knowledge of the
spreading sequence which introduce certain security to the transmitted information.
At the receiver side the same codes are used to be able to recover the information and separate it
form signals received at same time (interference) and from the thermal noise in the channel. Figure
2.2 describes the transmission and reception process using the spreading and scrambling codes.
Figure 2.2: Simplified Transmission and Reception Process [16].
For being able to recover the information signal at the receiver, the power of the signal after
despreading must be a few decibels above the interference and noise power. The Eb/No is defined
as the energy, or power density, per bit (Eb) over the interference and noise power density (No).
The higher the Eb/No the easier will be for the receiver to recover the information. The effect of
raising the signal over the interference and noise power is called “processing gain”. Using
correlation detection the signal is raised by the spreading factor form the interference present in the
system.
11
8/12/2019 WCDMA Enhanced UL Performance Evaluation.pdf
http://slidepdf.com/reader/full/wcdma-enhanced-ul-performance-evaluationpdf 14/80
(1)
(2)
where Gp is the processing gain, P is the received power of the information signal and I is the total
interference (the total received powers plus the thermal noise).
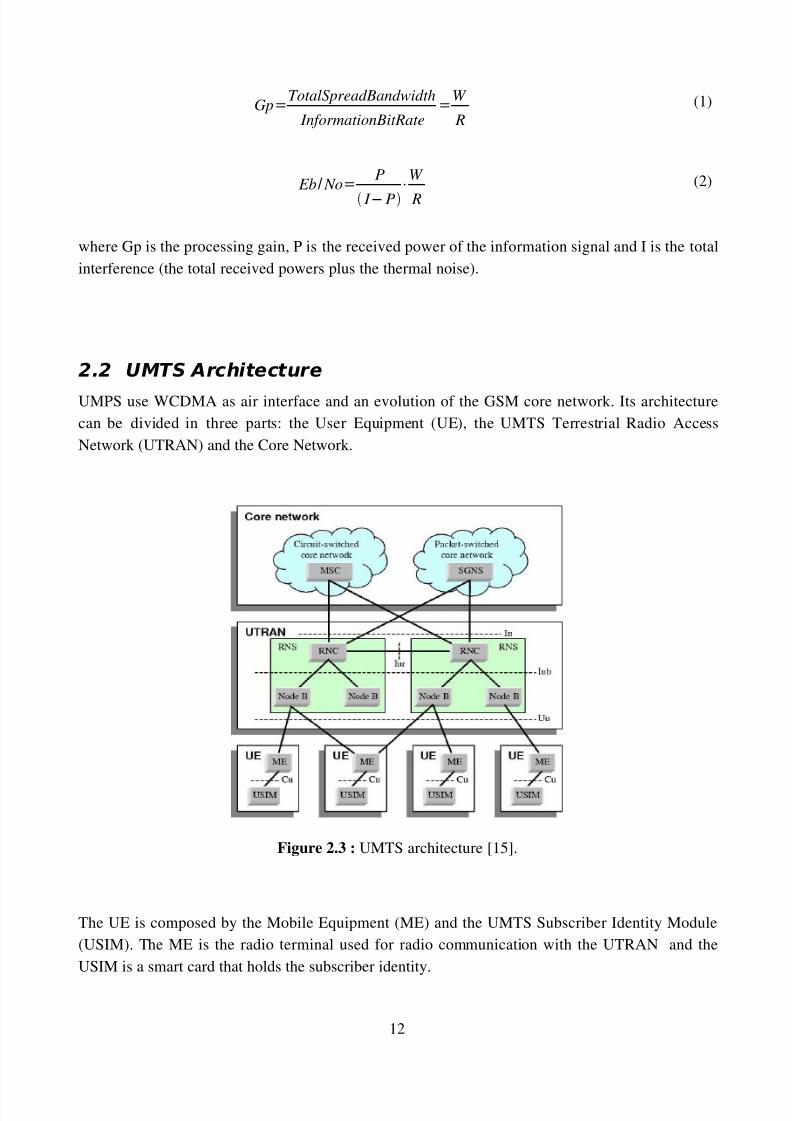
2.2 UMTS Architecture
UMPS use WCDMA as air interface and an evolution of the GSM core network. Its architecture
can be divided in three parts: the User Equipment (UE), the UMTS Terrestrial Radio Access
Network (UTRAN) and the Core Network.
Figure 2.3 : UMTS architecture [15].
The UE is composed by the Mobile Equipment (ME) and the UMTS Subscriber Identity Module
(USIM). The ME is the radio terminal used for radio communication with the UTRAN and the
USIM is a smart card that holds the subscriber identity.
12
Gp=TotalSpreadBandwidth
InformationBitRate=W
R
Eb / No= P
I − P⋅W
R
8/12/2019 WCDMA Enhanced UL Performance Evaluation.pdf
http://slidepdf.com/reader/full/wcdma-enhanced-ul-performance-evaluationpdf 15/80
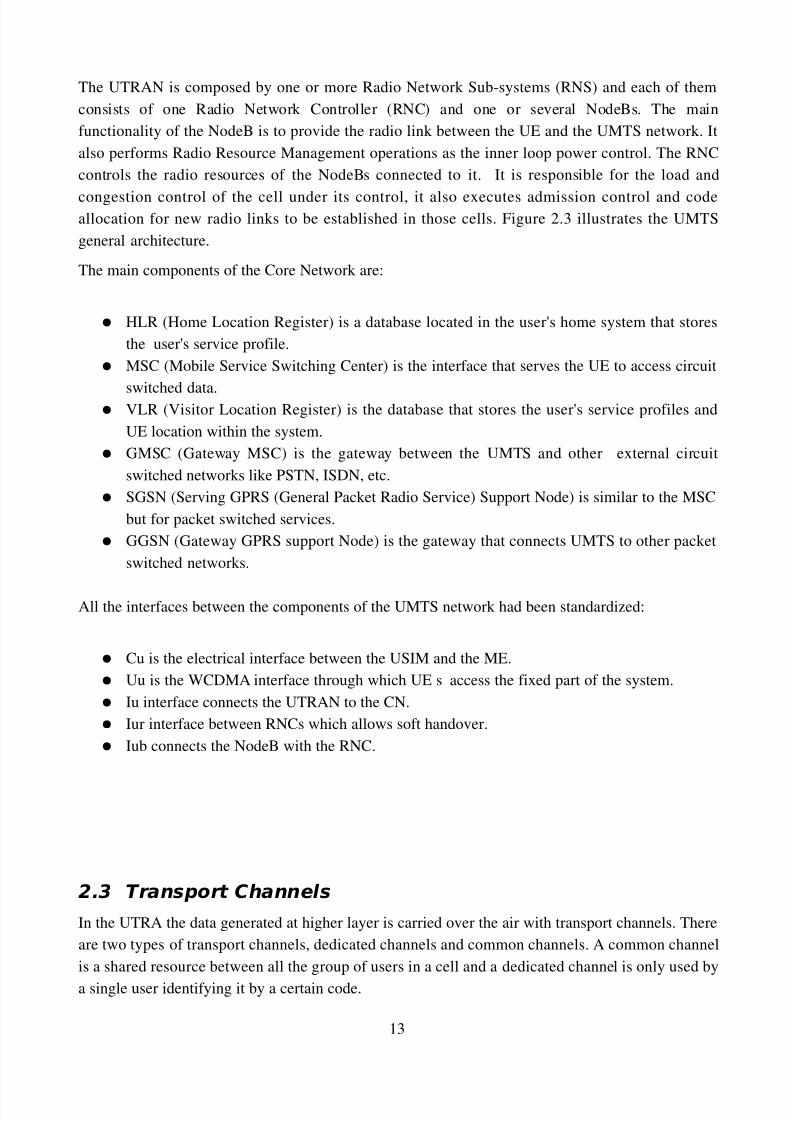
The UTRAN is composed by one or more Radio Network Sub-systems (RNS) and each of them
consists of one Radio Network Controller (RNC) and one or several NodeBs. The main
functionality of the NodeB is to provide the radio link between the UE and the UMTS network. It
also performs Radio Resource Management operations as the inner loop power control. The RNC
controls the radio resources of the NodeBs connected to it. It is responsible for the load and
congestion control of the cell under its control, it also executes admission control and codeallocation for new radio links to be established in those cells. Figure 2.3 illustrates the UMTS
general architecture.
The main components of the Core Network are:
● HLR (Home Location Register) is a database located in the user's home system that stores
the user's service profile.
● MSC (Mobile Service Switching Center) is the interface that serves the UE to access circuit
switched data.● VLR (Visitor Location Register) is the database that stores the user's service profiles and
UE location within the system.
● GMSC (Gateway MSC) is the gateway between the UMTS and other external circuit
switched networks like PSTN, ISDN, etc.
● SGSN (Serving GPRS (General Packet Radio Service) Support Node) is similar to the MSC
but for packet switched services.
● GGSN (Gateway GPRS support Node) is the gateway that connects UMTS to other packet
switched networks.
All the interfaces between the components of the UMTS network had been standardized:
● Cu is the electrical interface between the USIM and the ME.
● Uu is the WCDMA interface through which UE s access the fixed part of the system.
● Iu interface connects the UTRAN to the CN.
● Iur interface between RNCs which allows soft handover.
● Iub connects the NodeB with the RNC.
2.3 Transport Channels
In the UTRA the data generated at higher layer is carried over the air with transport channels. There
are two types of transport channels, dedicated channels and common channels. A common channel
is a shared resource between all the group of users in a cell and a dedicated channel is only used by
a single user identifying it by a certain code.
13

8/12/2019 WCDMA Enhanced UL Performance Evaluation.pdf
http://slidepdf.com/reader/full/wcdma-enhanced-ul-performance-evaluationpdf 16/80
DCH: is the Dedicated transport Channel used to carry all information form a given user coming
from the higher layers.
BCH: is the Broadcast Channel, is a common channel used to transmit information needed within
the cell (e.g available random access codes, access slots). It is decoded by the UE to be able to
register to the cell.
FACH: Forward Access Channel, is a common channel that carries control information to the UEs
in the cell.
PCH: Paging Channel, is a common channel that carries data for paging procedure (when the
network wants to initiate communication with the UE).
RACH: Random Access Channel, is an uplink common channel that carries control information
form the UE like a request to set up a connection
DSCH: Downlink Shared Channel, is a common transport channel that carries dedicated user data
or control information. The channel can be decoded by all UEs but the information is intended for aspecific UE.
2.4 Physical Channels
Transport channel are mapped into physical channels. A Physical channel can carry several
transport channels or it can carry just information relevant to the physical layer.
14
DCH
RACH
BCH
FACH
PCH
Dedicated Physical Data Channel (DPDCH)
Dedicated Physical Control Channel (DPCCH)
Fractional Dedicated Physical Data Channel (F-DPCH)
Physical Random Access Channel (PRACH)
Common Pilot Channel (CPICH)
Primary Common Control Physical Channel (P-CCPCH)
Secondary Common Control Physical Channel (S-CCPCH)
Sinchronisation Channel (SCH)
Acquisition Indicator Channel (AICH)
Paging Indicator Channel (PICH)
MBMS Notification Indicator Channel (MICH)
Transport
Channels
Physical
Channels
8/12/2019 WCDMA Enhanced UL Performance Evaluation.pdf
http://slidepdf.com/reader/full/wcdma-enhanced-ul-performance-evaluationpdf 17/80
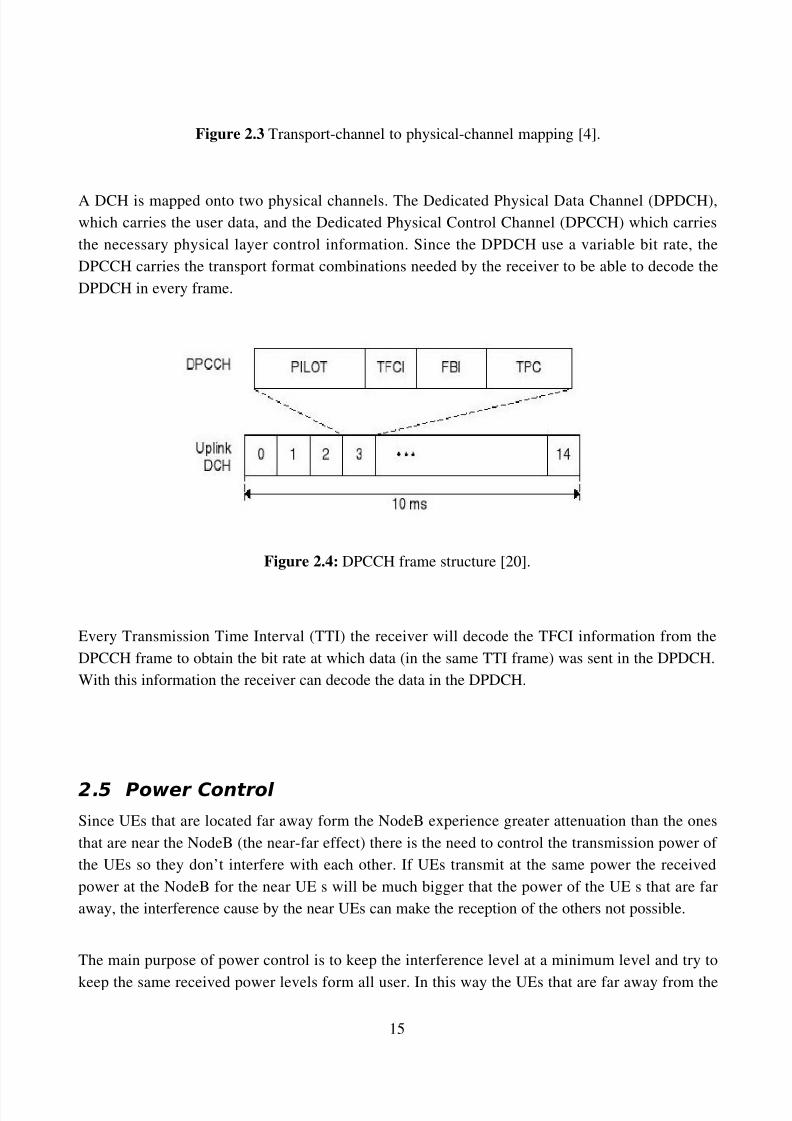
Figure 2.3 Transport-channel to physical-channel mapping [4].
A DCH is mapped onto two physical channels. The Dedicated Physical Data Channel (DPDCH),
which carries the user data, and the Dedicated Physical Control Channel (DPCCH) which carries
the necessary physical layer control information. Since the DPDCH use a variable bit rate, the
DPCCH carries the transport format combinations needed by the receiver to be able to decode the
DPDCH in every frame.
Figure 2.4: DPCCH frame structure [20].
Every Transmission Time Interval (TTI) the receiver will decode the TFCI information from the
DPCCH frame to obtain the bit rate at which data (in the same TTI frame) was sent in the DPDCH.
With this information the receiver can decode the data in the DPDCH.
2.5 Power Control
Since UEs that are located far away form the NodeB experience greater attenuation than the ones
that are near the NodeB (the near-far effect) there is the need to control the transmission power of
the UEs so they don’t interfere with each other. If UEs transmit at the same power the received
power at the NodeB for the near UE s will be much bigger that the power of the UE s that are far
away, the interference cause by the near UEs can make the reception of the others not possible.
The main purpose of power control is to keep the interference level at a minimum level and try to
keep the same received power levels form all user. In this way the UEs that are far away from the
15

8/12/2019 WCDMA Enhanced UL Performance Evaluation.pdf
http://slidepdf.com/reader/full/wcdma-enhanced-ul-performance-evaluationpdf 18/80
NodeB will transmit at a higher power than the ones that are near the NodeB. In the same way the
NodeB will transmit with less power to UEs located close to it and with more power to UEs located
far away.
● Open Loop power control: it makes an estimate of the path loss by means of a dowlink
beacon signal to set up the UE initial transmission power level. It is inaccurate because of
the large frequency separation in the downlink and uplink bands of WCDMA FDD mode. It
is mainly use to provide the initial power setting of the UE at the beginning of a connection.
●
● Close Loop power control: the NodeB measures the signal to interference ratio in the
uplink and commands the UE to increase or decrease the transmission power. WCDMA
updates the transmission power level at 1.5KHz (1500 times per second) and thats why it is
called fast power control.
●
● Outer Loop power control: the NodeB tells the RNC that the quality indicator of the signal
(in the uplink and in the downlink) is decreasing so the RNC will take a decision and
commands the NodeB to change (increase) the signal to interference ratio level.
2.6 Adission and Con!estion Control
Admission and congestion control are part of the radio resource management performed by the
RNC. The admission control will make the decision of accepting the admission of a new UE in the
cell if its admission doesn’t exceed a certain limit in the cell load. Congestion control will take
actions when the cell is becoming overloaded (mainly cause by movement of UEs from one cell to
another). The RNC will make a decision when the cell is overloaded and will try to bring back the
system to a normal condition reducing the non-real time applications bit rates or more drastically
dropping low priority calls.
2." Pac#et Schedulin!
Since non real time traffic doesn’t require any strictly guaranteed data rate and delay they are not
restricted in terms of the amount of minimum resources needed to meet a specific QoS. This traffic
can be controlled or scheduled according to the available resources of the system. The Packet
Scheduler (PS) performs this task taking into account the available resources, the amount of data in
the RLC buffer and UE power capabilities.
16
8/12/2019 WCDMA Enhanced UL Performance Evaluation.pdf
http://slidepdf.com/reader/full/wcdma-enhanced-ul-performance-evaluationpdf 19/80
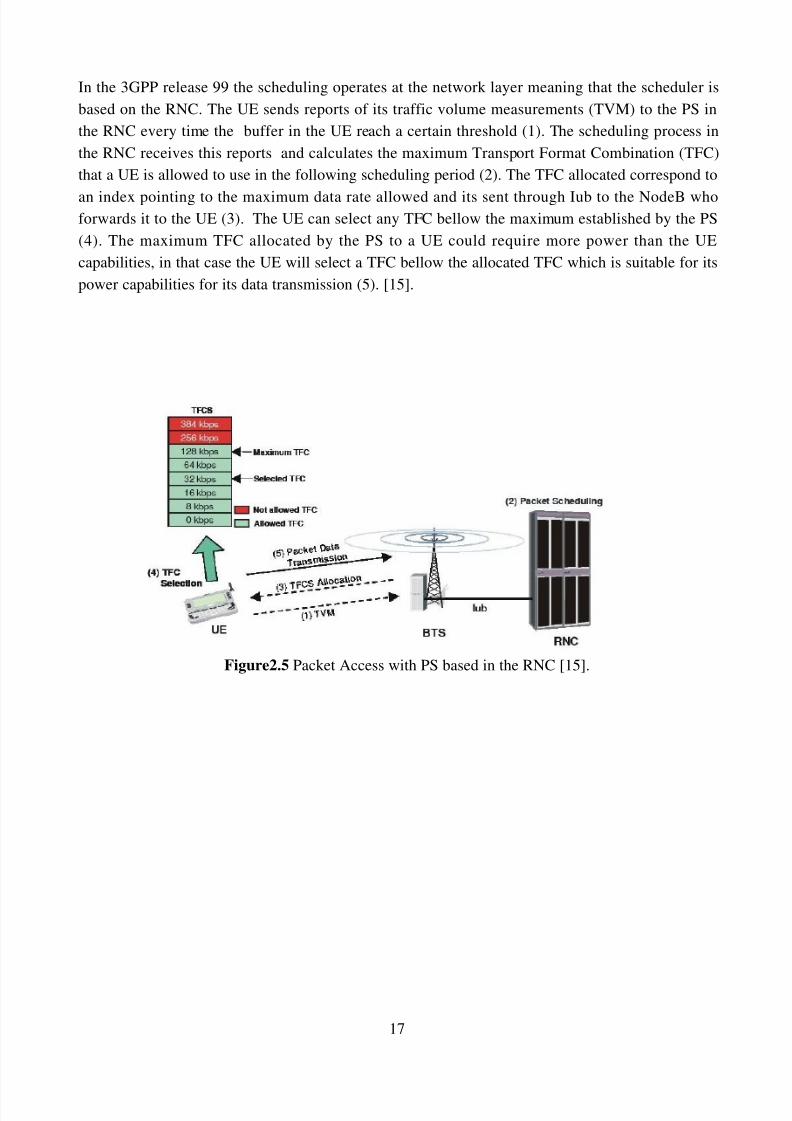
In the 3GPP release 99 the scheduling operates at the network layer meaning that the scheduler is
based on the RNC. The UE sends reports of its traffic volume measurements (TVM) to the PS in
the RNC every time the buffer in the UE reach a certain threshold (1). The scheduling process in
the RNC receives this reports and calculates the maximum Transport Format Combination (TFC)
that a UE is allowed to use in the following scheduling period (2). The TFC allocated correspond to
an index pointing to the maximum data rate allowed and its sent through Iub to the NodeB whoforwards it to the UE (3). The UE can select any TFC bellow the maximum established by the PS
(4). The maximum TFC allocated by the PS to a UE could require more power than the UE
capabilities, in that case the UE will select a TFC bellow the allocated TFC which is suitable for its
power capabilities for its data transmission (5). [15].
Figure2.5 Packet Access with PS based in the RNC [15].
17
8/12/2019 WCDMA Enhanced UL Performance Evaluation.pdf
http://slidepdf.com/reader/full/wcdma-enhanced-ul-performance-evaluationpdf 20/80
3 High Speed ac!et "ccess
3.1 $S%PA
High Speed Downlink Packet Access (HSDPA) introduce new techniques in order to optimize and
improve the packet transmission over UTRAN. HSDPA introduce a new downlink common
channel called HS-DSCH (High Speed DSCH) which support new features as high order
modulation, fast link adaptation, fast channel dependent scheduling and fast hybrid automatic
retransmission request (HARQ).
HSDPA can select a modulation method from QPSK to 16QAM in order to provide higher data
rates. The link adaptation is based on AMC (Adaptive Modulation and Coding) where the most
appropriate modulation scheme and coding rate are selected based on on fast channel qualityfeedback received from the UE. This ensures that the highest possible data rate is achieved for users
with good signal quality and for users at the edge of the cell. Functions like the variable spreading
factor (VSF) and fast power control are deactivated in HSDPA and their functionality is replaced by
the new features like AMC.
The packet scheduling is moved from the RNC to the NodeB reducing the delay and allowing the
scheduling algorithm to use parameters as the channel quality, terminal capabilities and QoS class.
The fast HARQ enables the UE to rapidly request physical layer retransmission of a data packet.
This retransmission is done form the NodeB and not from the RNC as done before which make theretransmission faster. Besides the fast retransmission, incorrectly received packets are not discarded
but stored and soft combined with the later retransmissions of the same packet to minimize the need
for further repeat requests when multiple errors occur in transmitted signals.
3.2 $SUPAAs in the donwlink, the need to improve the uplink air interface lead to the introduction of HSUPA
and its specification by the 3GPP in the Release 6.
The approach for a high speed uplink took some of the techniques used for HSDPA like the HARQ
and fast scheduling. The technique of adaptive modulation and coding used in HSDPA will not be
useful in HSUPA. One of the reasons is that the power resource capabilities of each individual user
are limited. That means that a user may not have enough power capabilities for a high rate
transmission (higher order modulation). Besides, higher order modulation has been found to cause
loss in link performance compared to multi-code transmission with BPSK [6], so just BPSK and
18

8/12/2019 WCDMA Enhanced UL Performance Evaluation.pdf
http://slidepdf.com/reader/full/wcdma-enhanced-ul-performance-evaluationpdf 21/80
QPSK will be used for the Enhanced Uplink, removing the advantage of high rates achieved with
16QAM in HSDPA. Another reason that doesn’t allow AMC to be used in the uplink is that the
received signal at the NodeB of UEs that transmit at the same time is not orthogonal and even if just
one UE is scheduled at a time other cell interference will not allow a good quality estimation of the
channel. The performance of the AMC depends on the quality estimation of the channel and since it
will have to deal with inta-cell and inter-cell interference the channel quality will change too muchfrom the time the measurement or estimation was made to the time of the transmission. All this
reason lead to exclude AMC from the new features of HSUPA and use fast close loop power
control mechanism as the link adaptation mechanism to be able to avoid the near-far problem.
For all this reasons we can expect that the results in the enhancements in the uplink will not be as
good as in the downlink.
The basic improvements for HSUPA are the fast packet scheduling and fast Hybrid Automatic
Retransmission Request (HARQ). The control of these two techniques will reside in the NodeB
allowing faster response times and less round trip delay than residing in the RNC. This changes alsoallow the scheduling to react rapidly to changes in the traffic load giving or taking out resources
from users depending on the load.
Another basic difference with HSDPA is the use of an enhanced dedicate channels (E-DCH) for
each user in the uplink and not of a shared channel common to all users as in the downlink.
3.2.1 #nhanced $edicate Channel %#&$CH' rotocol "rchitecture(
Figure 3.1: E-DCH protocol architecture
Basically, to support the E-DCH a new MAC entity (MAC-e/MAC-es) in the UE, NodeB and RNC
is introduced. The MAC-e is added to the UE and NodeB in order to handle HARQ retransmission,
19
MAC-d
MAC-es/
MAC-e
PHY
MAC-d
PHY TNLTNL
MAC-e EDCH FP EDCH FP
MAC-es
UE RNCNodeB
Uu Iub

8/12/2019 WCDMA Enhanced UL Performance Evaluation.pdf
http://slidepdf.com/reader/full/wcdma-enhanced-ul-performance-evaluationpdf 22/80
scheduling, multiplexing (at the UE) and demultiplexing (at the NodeB). This entity will handle the
primary enhancements of the high speed uplink which are the HARQ and the NodeB Packet
Scheduling.
A re-ordering entity is introduce as a separate MAC sub-layer called MAC-es entity and it is added
in the UE and in the RNC in order to provides in-sequence delivery. This entity is placed in the
RNC because data packets could be transmitted through different NodeBs in case of soft handover
so all the sequence of data packets will just be available in the RNC for their in-sequence delivery.
The reordering is based on Transmission Sequence Numbers (TSN) include in the MAC-es at the
UE side.
3.2.2 M"C&es)M"C&e
In HSUPA the overall MAC architecture includes the new MAC-es/MAC-e entity, this entity will
be in controls of the E-DCH.
Figure 3.2: UE side MAC architecture [12].
In the UE the MAC-d entity will receive from the RLC the dedicated logical channels, the MAC-d
is responsible for mapping these dedicated logical channels for the uplink onto dedicated transport
channels. It can also multiplex several dedicated logical channels onto one transport channel. The
20
8/12/2019 WCDMA Enhanced UL Performance Evaluation.pdf
http://slidepdf.com/reader/full/wcdma-enhanced-ul-performance-evaluationpdf 23/80
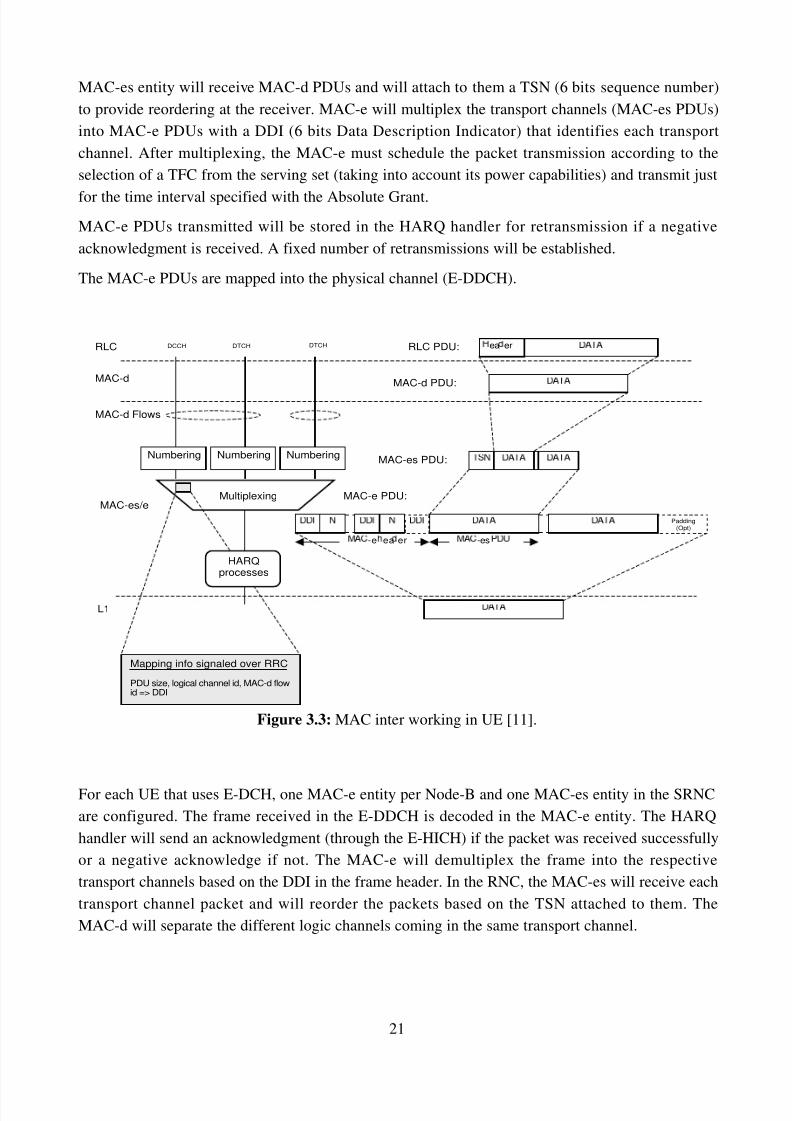
MAC-es entity will receive MAC-d PDUs and will attach to them a TSN (6 bits sequence number)
to provide reordering at the receiver. MAC-e will multiplex the transport channels (MAC-es PDUs)
into MAC-e PDUs with a DDI (6 bits Data Description Indicator) that identifies each transport
channel. After multiplexing, the MAC-e must schedule the packet transmission according to the
selection of a TFC from the serving set (taking into account its power capabilities) and transmit just
for the time interval specified with the Absolute Grant.
MAC-e PDUs transmitted will be stored in the HARQ handler for retransmission if a negative
acknowledgment is received. A fixed number of retransmissions will be established.
The MAC-e PDUs are mapped into the physical channel (E-DDCH).
Figure 3.3: MAC inter working in UE [11].
For each UE that uses E-DCH, one MAC-e entity per Node-B and one MAC-es entity in the SRNC
are configured. The frame received in the E-DDCH is decoded in the MAC-e entity. The HARQ
handler will send an acknowledgment (through the E-HICH) if the packet was received successfully
or a negative acknowledge if not. The MAC-e will demultiplex the frame into the respective
transport channels based on the DDI in the frame header. In the RNC, the MAC-es will receive each
transport channel packet and will reorder the packets based on the TSN attached to them. The
MAC-d will separate the different logic channels coming in the same transport channel.
21
MAC-d Flows
-es-e ea er
DCCH DTCH DTCH
HARQprocesses
Multiplexing
MAC-d
Padding(Opt)
RLC PDU:
MAC-e PDU:
L1
RLC
Mapping info signaled over RRC
PDU size, logical channel id, MAC-d flowid => DDI
MAC-d PDU:
ea er
MAC-es/e
NumberingMAC-es PDU:
Numbering Numbering
8/12/2019 WCDMA Enhanced UL Performance Evaluation.pdf
http://slidepdf.com/reader/full/wcdma-enhanced-ul-performance-evaluationpdf 24/80
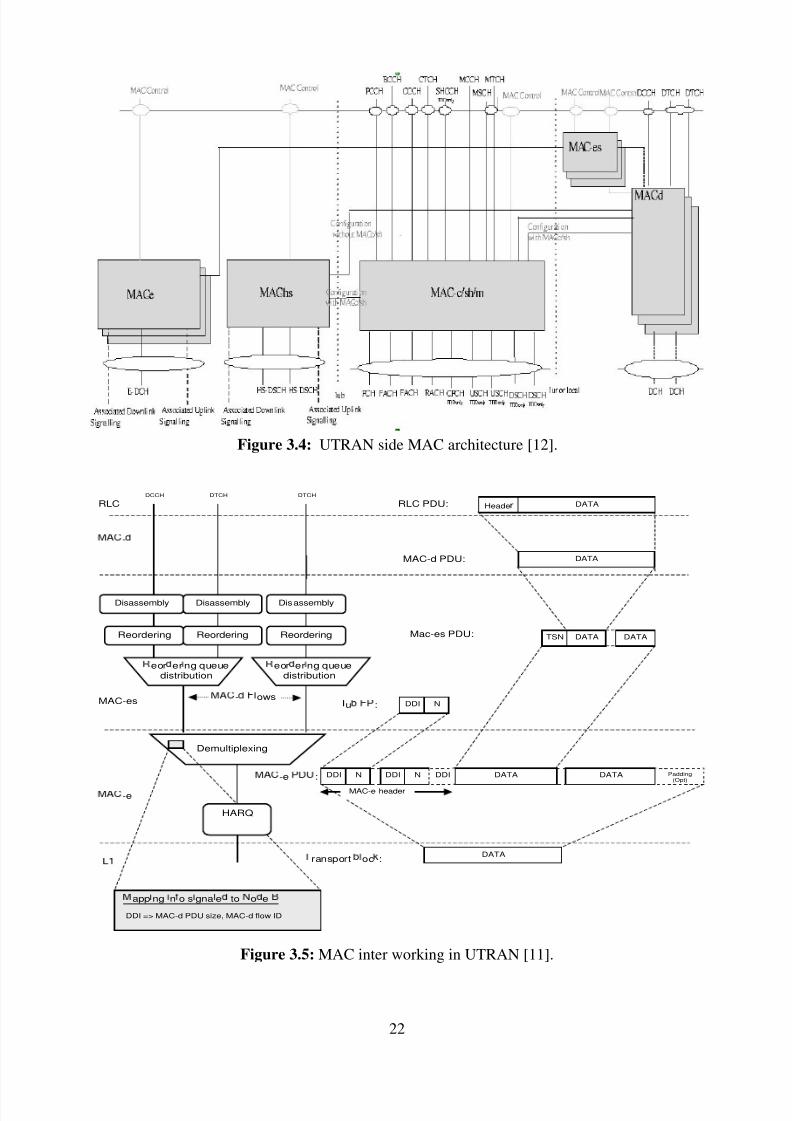
Figure 3.4: UTRAN side MAC architecture [12].
Figure 3.5: MAC inter working in UTRAN [11].
22
Mac-es PDU:
eor er ng queuedistribution
eor er ng queuedistribution
DCCH DTCH DTCH
- ows
HARQ
Demultiplexing
DATAHeader
-
-e
DATA
DATA
DATA DATA
-e :
RLC PDU:RLC
Reordering
MAC-es
Reordering Reordering
Disassembly Disassembly Disassembly
MAC-d PDU:
app ng n o s gna e to o e
DDI => MAC-d PDU size, MAC-d flow ID
TSN
MAC-e header
DDI N Padding(Opt)
DDI N DATADATADDI
ransport oc :
DDI Nu :

8/12/2019 WCDMA Enhanced UL Performance Evaluation.pdf
http://slidepdf.com/reader/full/wcdma-enhanced-ul-performance-evaluationpdf 25/80
3.2.3 #nhanced Uplin! h*sical Channels
To support the new enhanced features of HSUPA new physical channels were introduced.
Basically, the E-DCH is mapped into the E-DPDCH and the E-DPCCH. Other physical downlink
channels are defined to carry the necessary physical layer signaling between the NodeB and the UE.
Uplink:E-DPCCH: dedicated channel for uplink control signaling (just one per UE).
E-DPDCH: dedicated channel for uplink transport channel, it carries the user data and can have
variable bit rates. The E-DPDCH is divided in 5 sub frames of 2ms.
Figure 3.6 E-DDCH frame structure [13].
Downlink:
Fractional DPCH (F-DPCH): dedicated channel for layer 1 control information (e.g TPC).
Enhanced-Relative Grant Channel (E-RGCH): is a fixed rate (SF=128) downlink physical dedicated
channel carrying the uplink E-DCH Relative Grants.
E-DCH Hybrid ARQ Indicator Channel (E-HICH): is a fixed rate (SF=128) downlink physicalchannel carrying the uplink E-DCH Hybrid-ARQ Acknowledgment (HARQ-ACK) indicator.
Enhanced Absolute Grant Channel (E-AGCH): is a fixed rate (30 kbps, SF=256) downlink common
physical channel carrying the uplink E-DCH Absolute Grant.
Figure 3.7 shows the mapping of the transport-Channel to Pysical-channel introduced for the
Enhanced uplink and for the High Speed Downlink.
23
8/12/2019 WCDMA Enhanced UL Performance Evaluation.pdf
http://slidepdf.com/reader/full/wcdma-enhanced-ul-performance-evaluationpdf 26/80
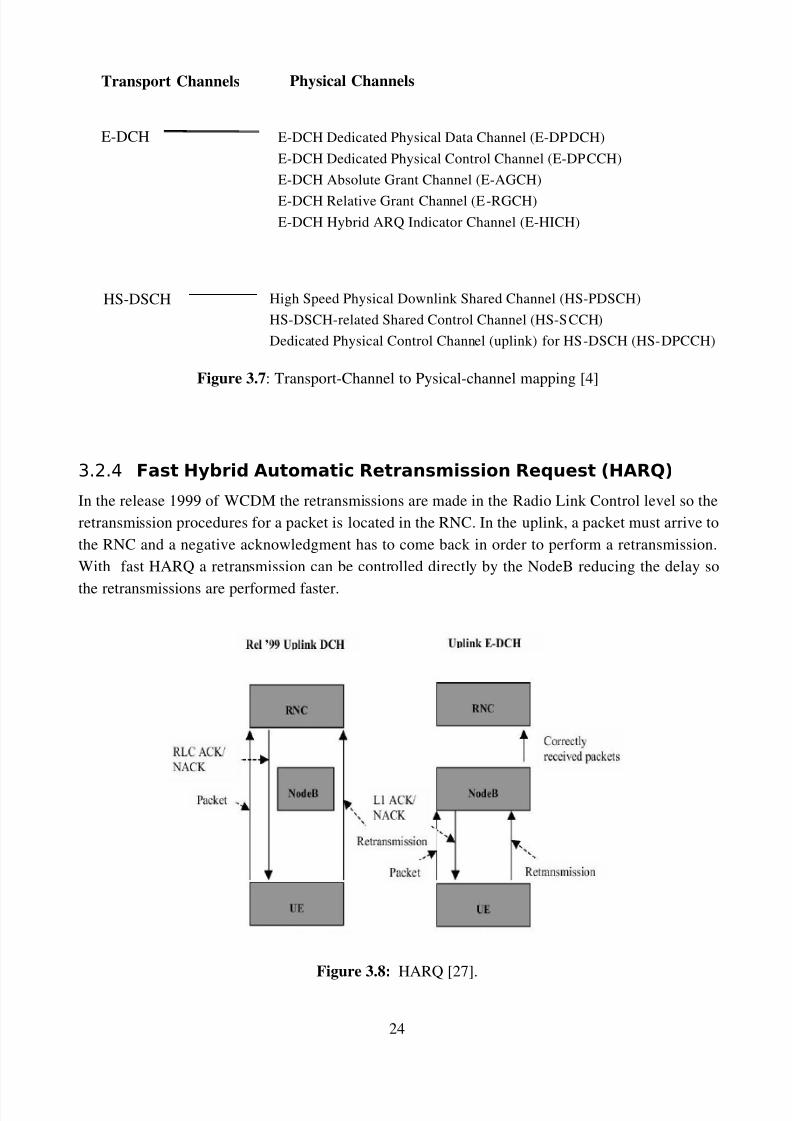
Figure 3.7: Transport-Channel to Pysical-channel mapping [4]
3.2.4 +ast H*brid "utomatic Retransmission Re,uest %H"R-'
In the release 1999 of WCDM the retransmissions are made in the Radio Link Control level so the
retransmission procedures for a packet is located in the RNC. In the uplink, a packet must arrive to
the RNC and a negative acknowledgment has to come back in order to perform a retransmission.
With fast HARQ a retransmission can be controlled directly by the NodeB reducing the delay so
the retransmissions are performed faster.
Figure 3.8: HARQ [27].
24
E-DCH
HS-DSCH
E-DCH Dedicated Physical Data Channel (E-DPDCH)
E-DCH Dedicated Physical Control Channel (E-DPCCH)
E-DCH Absolute Grant Channel (E-AGCH)
E-DCH Relative Grant Channel (E-RGCH)
E-DCH Hybrid ARQ Indicator Channel (E-HICH)
High Speed Physical Downlink Shared Channel (HS-PDSCH)
HS-DSCH-related Shared Control Channel (HS-SCCH)
Dedicated Physical Control Channel (uplink) for HS-DSCH (HS-DPCCH)
Transport Channels Physical Channels
8/12/2019 WCDMA Enhanced UL Performance Evaluation.pdf
http://slidepdf.com/reader/full/wcdma-enhanced-ul-performance-evaluationpdf 27/80
Figure 3.8 shows the difference between the retransmission mechanism used for the uplink DCH
and the HARQ used in the E-DCH.
Fast HARQ is based on a stop-and-wait protocol which means that the transmission does not
continue until a positive or negative acknowledgment is received. A limited number of HARQ
processes is allowed to be active at the same time, that means the UE can keep sending packets
continuously while waiting for the acknowledgments of each sent packet until it reaches a limitnumber. The number of processes depends on the transmission time interval (TTI) and have been
specified 8 for 2ms TTI and 4 for 10ms TTI for the Enhanced Uplink [12]. Also a limited number
of retransmission attempts is set so if this number is reached the packet is dropped.
HARQ enables rapidly request of physical layer retransmission of a data packet. The retransmission
request is made in the NodeB decreasing the time than if it is made from the RNC.
Besides the fast retransmission, incorrectly received packets are not discarded but stored and soft
combined with the later retransmissions of the same packet to minimize the need for further repeat
requests when multiple errors occur in transmitted signals.
Soft combining: with this scheme if an erroneous packet is received, the packet is stored in the
receivers memory. Retransmissions are exact copies of the first transmission and if again are
received erroneously they are combined with the first transmission to improve the likelihood that
the packet is correctly received.
Incremental Redundancy (not self-decodable): in this scheme the first transmission data is sent, and
in the following transmissions only redundancy bits are sent. This means that the data in the
retransmission can only be used together with the original packet.
Incremental Redundancy (self-decodable): In this scheme each retransmission is self-decodable,
meaning that a retransmitted packet can be decode even if the original packet was lost.
It could be the case that the UE is in a soft-handover situation and two NodeB receive a packet and
two acknowledgments are sent to the UE, if at least one positive acknowledgment is receive by the
UE the packet is considered as correctly received. In a similar case a retransmission of a packet
received by a second NodeB who didn’t receive the first transmission could only decode the packet
if soft combining or self-decodable incremental redundancy are used.
25

8/12/2019 WCDMA Enhanced UL Performance Evaluation.pdf
http://slidepdf.com/reader/full/wcdma-enhanced-ul-performance-evaluationpdf 28/80
3.2.5 +ast ac!et Scheduling
The RNC based Packet Scheduling brings long delays because of the needed signaling between the
UE and the RNC. RNC based Packet Scheduling of non real time traffic, which are characterized
by a bursty traffic profile, is not efficient because it takes too much time to allocate and release
resources; when a user is allocated with large amount of resources for a bursty transmission this
resources take a long time to be released. To be able to rapidly allocate and release resources to the
UEs depending on their load the Packet Scheduling is moved to the NodeB reducing the delay and
allowing it to react faster than residing in the RNC. NodeB scheduling enables a better control over
the uplink interference which leads to increase the capacity and improve the coverage of the cell.
Figure 3.9 illustrates the steps of packet transmission using NodeB PS. First the UEs will request
the PS located in NodeB for resources using an uplink signaling(1) and the PS will determine the
TFCS which they are allowed to use (2). The PS will grant each UE with a set of allowed TFC (3),
form this allowed set the UE will select a TFC which is suitable according to its power capabilities
(4) for transmission of the packet (5). [27].
Figure 3.9: Uplink packet access scenario [27].
In HSDPA the PS was also moved to the NodeB but the differences between the downlink and the
uplink transmission make the PS algorithm more complicated for the Enhanced uplink. In the
downlink the transmission is made from a common entity, the NodeB, so it can control its own
power. In the uplink, the transmission it is distributed among all the users in the cell which makes
more complicated to control the received power form all the users.
The Packet scheduler needs to share the available air interface capacity between the users and there
26
8/12/2019 WCDMA Enhanced UL Performance Evaluation.pdf
http://slidepdf.com/reader/full/wcdma-enhanced-ul-performance-evaluationpdf 29/80
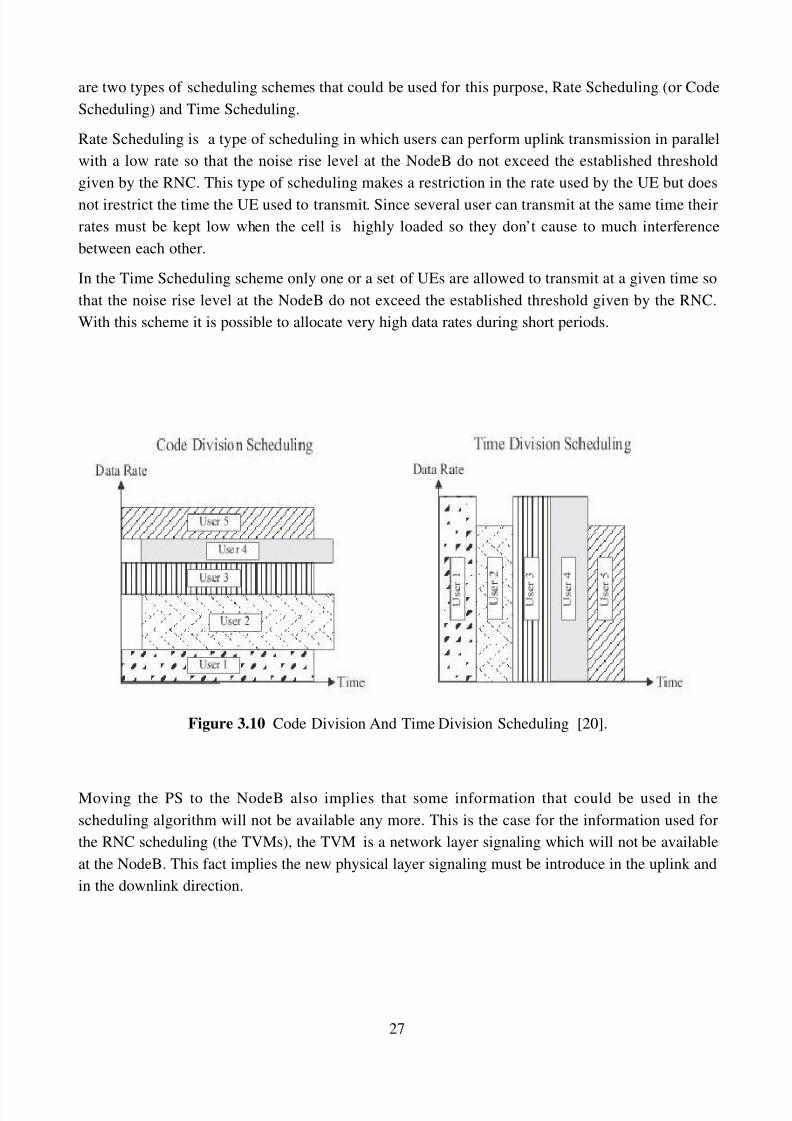
are two types of scheduling schemes that could be used for this purpose, Rate Scheduling (or Code
Scheduling) and Time Scheduling.
Rate Scheduling is a type of scheduling in which users can perform uplink transmission in parallel
with a low rate so that the noise rise level at the NodeB do not exceed the established threshold
given by the RNC. This type of scheduling makes a restriction in the rate used by the UE but does
not irestrict the time the UE used to transmit. Since several user can transmit at the same time their
rates must be kept low when the cell is highly loaded so they don’t cause to much interference
between each other.
In the Time Scheduling scheme only one or a set of UEs are allowed to transmit at a given time so
that the noise rise level at the NodeB do not exceed the established threshold given by the RNC.
With this scheme it is possible to allocate very high data rates during short periods.
Figure 3.10 Code Division And Time Division Scheduling [20].
Moving the PS to the NodeB also implies that some information that could be used in the
scheduling algorithm will not be available any more. This is the case for the information used for
the RNC scheduling (the TVMs), the TVM is a network layer signaling which will not be available
at the NodeB. This fact implies the new physical layer signaling must be introduce in the uplink and
in the downlink direction.
27
8/12/2019 WCDMA Enhanced UL Performance Evaluation.pdf
http://slidepdf.com/reader/full/wcdma-enhanced-ul-performance-evaluationpdf 30/80
3.2.5.1 Uplin# Schedulin! in&oration
The scheduling signaling sent in the uplink direction is used as control information by the UEs to
indicate the NodeB the amount of resources they requirer. This type of signaling can be seen as a
request for resources from the UE to the NodeB. 3GPP release 6 specifies the signaling used by the
UE to make a request. A single bit field is included in the E-DPCCH for every E-DCH
transmission. This bit called “happy bit” takes two values, “not happy” and “happy” indicating
respectively whether the UE could use more resources or not. Other needed information for the
scheduling is sent in the uplink direction as part of the MAC header (specifically in the MAC-e
header) and will be use to provide the NodeB with a better view of the amount of system resources
needed by the UE and the amount of resources it can actually make use of. The information sent to
the NodeB will include the total E-DCH buffer status (5 bits), the highest priority logical channel
ID (4 bits) with its buffer status (4 bits) and the UE power headroom (5 bits) which is the ratio
between the maximum allowed UE Tx power and the DPCCH.
The transmission of this uplink scheduling information can be configured by the Radio Resource
Controller to be periodic (setting a timer) or triggered by an event (when the buffer status is larger
than zero and there is no available grant).
Some schedulers will use the channel condition experienced by the users to make a scheduling
decision. The Uplink Channel Quality Indicator (UCQI) is a parameter which indicate the quality of
the channel. Basically this parameter is an indicator of the path loss experienced by each user and
for the NodeB to calculated this parameter it will need the values of the received power and the
transmitted power of the UEs.
To obtain the UE transmitted power the UTRAN must ask the UE for a measurement report. The
UE will execute this measurement and it will signal the obtained value to the UTRAN in the
Dedicated Control Channel. This is a network layer signaling which will not be available at the
NodeB so the RNC will have to provide the NodeB with this information. This means that the
measurement of the UE transmitted power will not be available in a TTI resolution in the NodeB to
execute the scheduling process and an estimation of this value with a less frequent report will have
to be made. Relaying on this method to get the value of the UE transmitted power will imply that all
the gain obtain with a channel dependent scheduler will be depending on the estimation of this
value.
The signaling of this measurement reports for the UE transmitted power is not considered in thesimulator and it is assumed that the NodeB will have this information available every TTI for the
scheduling process with a high accuracy. Even doe this assumption is used in the simulator, in
reality it is possible to think on a different way for the NodeB to measure the UE transmitted power
at a TTI resolution.
If the NodeB is able to obtain a value for the maximum UE transmission power at the beginning of
the connection it is possible to calculate the UE transmitted power every TTI using the headroom
signaling included in the MAC-e header and computing the path loss.
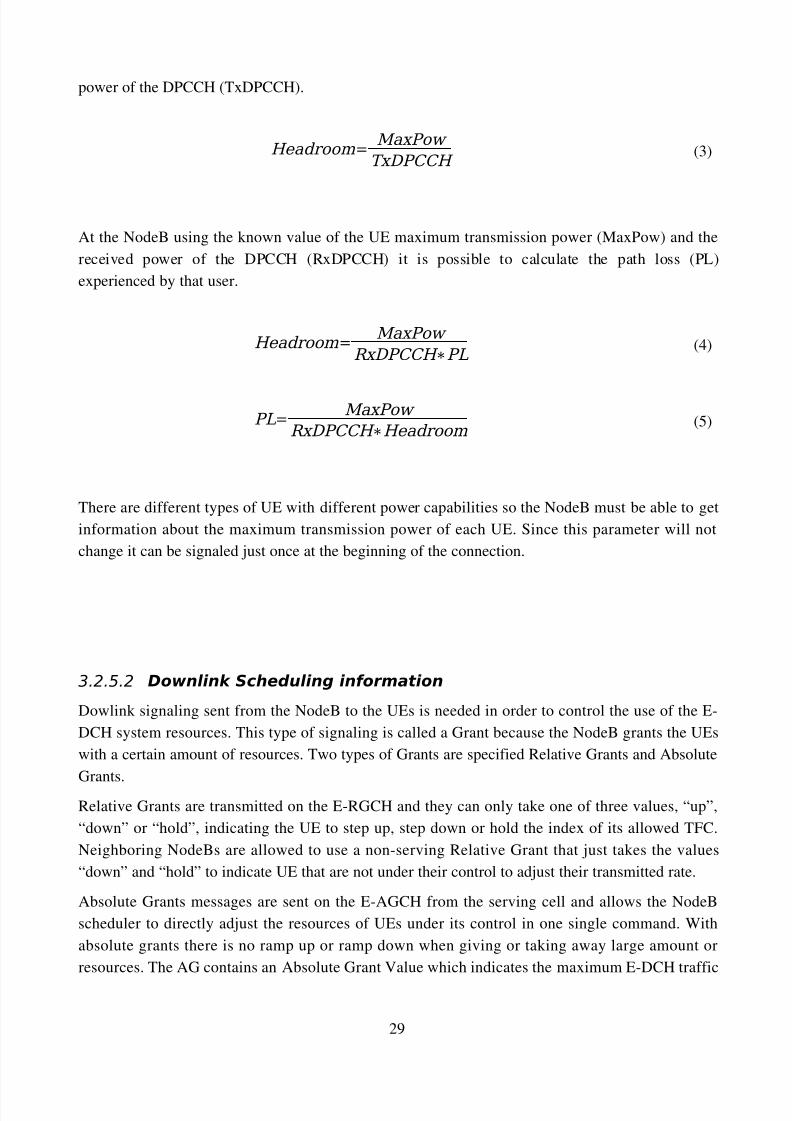
The headroom is defined as the ratio between the maximum transmission power (MaxPow) and the
28
8/12/2019 WCDMA Enhanced UL Performance Evaluation.pdf
http://slidepdf.com/reader/full/wcdma-enhanced-ul-performance-evaluationpdf 31/80
power of the DPCCH (TxDPCCH).
Headroom = MaxPow
TxDPCCH (3)
At the NodeB using the known value of the UE maximum transmission power (MaxPow) and the
received power of the DPCCH (RxDPCCH) it is possible to calculate the path loss (PL)
experienced by that user.
Headroom = MaxPow
RxDPCCH ∗PL (4)
PL = MaxPow
RxDPCCH ∗Headroom (5)
There are different types of UE with different power capabilities so the NodeB must be able to get
information about the maximum transmission power of each UE. Since this parameter will not
change it can be signaled just once at the beginning of the connection.
3.2.5.2 %ownlin# Schedulin! in&oration
Dowlink signaling sent from the NodeB to the UEs is needed in order to control the use of the E-
DCH system resources. This type of signaling is called a Grant because the NodeB grants the UEs
with a certain amount of resources. Two types of Grants are specified Relative Grants and Absolute
Grants.
Relative Grants are transmitted on the E-RGCH and they can only take one of three values, “up”,
“down” or “hold”, indicating the UE to step up, step down or hold the index of its allowed TFC.
Neighboring NodeBs are allowed to use a non-serving Relative Grant that just takes the values
“down” and “hold” to indicate UE that are not under their control to adjust their transmitted rate.
Absolute Grants messages are sent on the E-AGCH from the serving cell and allows the NodeB
scheduler to directly adjust the resources of UEs under its control in one single command. With
absolute grants there is no ramp up or ramp down when giving or taking away large amount or
resources. The AG contains an Absolute Grant Value which indicates the maximum E-DCH traffic
29

8/12/2019 WCDMA Enhanced UL Performance Evaluation.pdf
http://slidepdf.com/reader/full/wcdma-enhanced-ul-performance-evaluationpdf 32/80
to pilot ratio (E-DPDCH/DPCCH) that the UE is allowed to use in the next transmission.
At the beginning of a connection a UE is configured with a E-TFCI table (Enhanced Transport
Format Combination Indicator table). Different tables are specified by the 3GPP in [12] for 2ms
TTI and 10ms TTI. The TFC indexes are mapped in this table to their corresponding transport block
size (TBS). Specifying the number of bits (the TBS) that can be transmitted per TTI (2ms or 10ms)
a TFC index will determine instantaneous bit rate at which a UE is allowed to transmit.
3.2.6 erformance of HSU"
The performance of the HARQ and the Fast Packet scheduling introduced for HSUPA has beenevaluated in terms of throughput in a system level simulator in [15]. The results of this work show
that using HARQ at the physical layer and a packet scheduler at the NodeB can provide a gain of
31% compared to a RNC packet scheduler with HARQ at the network layer. A Proportional Fair
Throughput Scheduler is introduced which allocate resources fairly to all the UEs keeping track of
their individual channel conditions and scheduling them when they experience good channel
conditions relative to their own average. The scheduler used in [15] shows an improvement in the
average throughput with a gain of 45.6% compared to the RNC packet scheduler.
There are several characteristics of the fast packet scheduler that contribute to the throughput gain
shown in [15]. In this work several schedulers will be implemented in order to focus on specific
characteristics that contribute to the better performance of the system. Analyzing results in terms of
total transmitted power, average delay and individual user throughput and delay measurements will
provide us with a good view of the contribution given by the scheduler enhancements and policies.
30
8/12/2019 WCDMA Enhanced UL Performance Evaluation.pdf
http://slidepdf.com/reader/full/wcdma-enhanced-ul-performance-evaluationpdf 33/80
4 Modeling of HSU"
To be able to implement the different techniques used in HSUPA as an extension to the Network
Simulator (ns-2) a model that simulates as close as possible to reality the behavior of this
techniques must be specified.
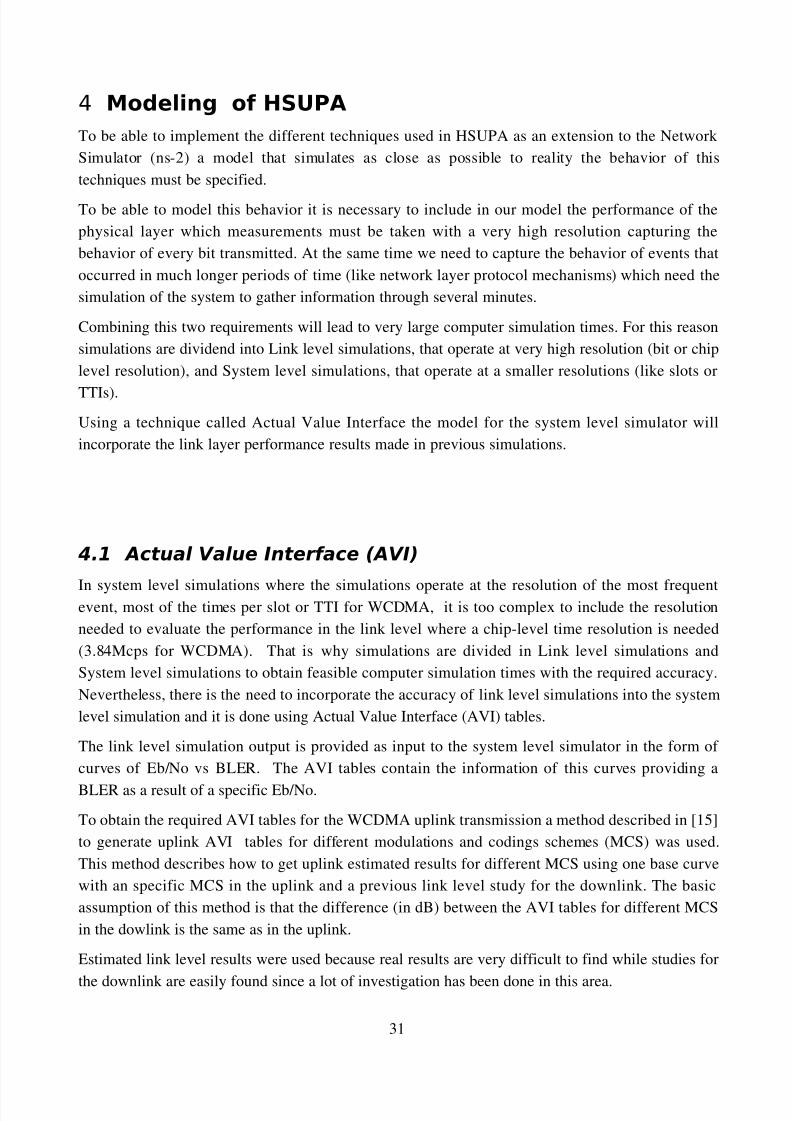
To be able to model this behavior it is necessary to include in our model the performance of the
physical layer which measurements must be taken with a very high resolution capturing the
behavior of every bit transmitted. At the same time we need to capture the behavior of events that
occurred in much longer periods of time (like network layer protocol mechanisms) which need the
simulation of the system to gather information through several minutes.
Combining this two requirements will lead to very large computer simulation times. For this reason
simulations are dividend into Link level simulations, that operate at very high resolution (bit or chip
level resolution), and System level simulations, that operate at a smaller resolutions (like slots or
TTIs).
Using a technique called Actual Value Interface the model for the system level simulator will
incorporate the link layer performance results made in previous simulations.
4.1 Actual 'alue (nter&ace )A'(*
In system level simulations where the simulations operate at the resolution of the most frequentevent, most of the times per slot or TTI for WCDMA, it is too complex to include the resolution
needed to evaluate the performance in the link level where a chip-level time resolution is needed
(3.84Mcps for WCDMA). That is why simulations are divided in Link level simulations and
System level simulations to obtain feasible computer simulation times with the required accuracy.
Nevertheless, there is the need to incorporate the accuracy of link level simulations into the system
level simulation and it is done using Actual Value Interface (AVI) tables.
The link level simulation output is provided as input to the system level simulator in the form of
curves of Eb/No vs BLER. The AVI tables contain the information of this curves providing a
BLER as a result of a specific Eb/No.
To obtain the required AVI tables for the WCDMA uplink transmission a method described in [15]
to generate uplink AVI tables for different modulations and codings schemes (MCS) was used.
This method describes how to get uplink estimated results for different MCS using one base curve
with an specific MCS in the uplink and a previous link level study for the downlink. The basic
assumption of this method is that the difference (in dB) between the AVI tables for different MCS
in the dowlink is the same as in the uplink.
Estimated link level results were used because real results are very difficult to find while studies for
the downlink are easily found since a lot of investigation has been done in this area.
31

8/12/2019 WCDMA Enhanced UL Performance Evaluation.pdf
http://slidepdf.com/reader/full/wcdma-enhanced-ul-performance-evaluationpdf 34/80
The first thing to be considered is that the dowlink curves are given in energy per symbol over
noise ratio (Es/No) which is a measurement taken before channel decoding. For the uplink AVI
tables the energy per bit over noise ration (Eb/No) after channel decoding is the needed
measurement. To calculate one using the other this formula is used:
Eb / No = Es/ No Rs
R
1
Rcoding(6)
where Rs is the symbol rate, R the information rate and Rcoding is the coding rate.
The uplink reference curve used as base is obtain from a BPSK modulation and coding rate 1/3.
With this reference and the previous formula a formula to obtain the offset between the reference
curve and the required curve is deduced:
Eb/ No= Eb/ No
req
Eb/ Noref
=
Es/ Noreq
Rs
R
1
Rcoding
Es/ Noref
1
1/3
= Es/ No N
3 Rcoding(7)
This equations expresses the offset between (Eb/No) of the required curve and the (Eb/No) of the
reference curve in terms of the offset of the (Es/No) of those curves, where N is the number of bits
per symbol of the modulation used and Rcoding is the coding rate.
The next step is to consider the use of a uplink control channel, the DPCCH. Depending on the rate
of the data channel (DPDCH) a ratio between the control channel and data channel is specified and
it must be considered in the acquisition of the (Eb/No) offset.
Eb/ No=
Es/ No N
3 Rcoding p
1 p
(8)
32

8/12/2019 WCDMA Enhanced UL Performance Evaluation.pdf
http://slidepdf.com/reader/full/wcdma-enhanced-ul-performance-evaluationpdf 35/80
In this equation p is the ratio between the control and the data channel for the a given rate.
Given the obtained offset considering the previous formula, the offset is added (in dB) to the
reference uplink AVI table to obtain the required curve.
Figure 4.1 shows an scheme of the required information needed to obtain the uplink estimated AVI
tables for different MCS.
Figure: 4.1. Estimating link level results for different MCS in the uplink.
Figure: 4.2. Estimating link level results for different MCS in the uplink.
33
One base curv e wit h specific
MCS in the Uplink
Despreading Channel Decoding
Es/NoEs/No Eb/No
Link level studies for
the downlink
Uplink est imated results
for different MCS
8/12/2019 WCDMA Enhanced UL Performance Evaluation.pdf
http://slidepdf.com/reader/full/wcdma-enhanced-ul-performance-evaluationpdf 36/80
Figure 4.2 shows an overview of the method to obtain uplink AVI tables from using the AVI tables
of a previous downlink study. The offset in the downlink AVI tables (∆d) is used to obtain the
offset in the uplink AVI tables (∆u) and calculate the required curve (k) from the reference curve
(m).
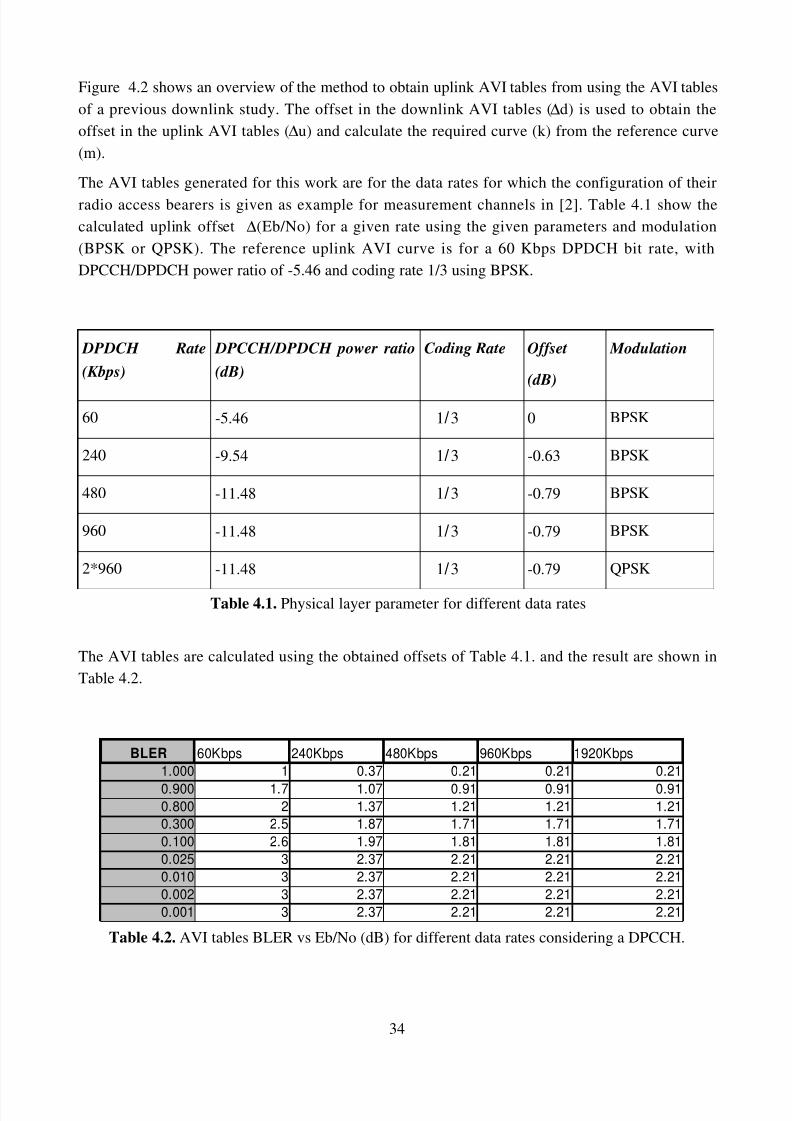
The AVI tables generated for this work are for the data rates for which the configuration of their
radio access bearers is given as example for measurement channels in [2]. Table 4.1 show the
calculated uplink offset ∆(Eb/No) for a given rate using the given parameters and modulation
(BPSK or QPSK). The reference uplink AVI curve is for a 60 Kbps DPDCH bit rate, with
DPCCH/DPDCH power ratio of -5.46 and coding rate 1/3 using BPSK.
DPDCH Rate
(Kbps)
DPCCH/DPDCH power ratio
(dB)
Coding Rate Offset
(dB)
Modulation
60 -5.46 1/3 0 BPSK
240 -9.54 1/3 -0.63 BPSK
480 -11.48 1/3 -0.79 BPSK
960 -11.48 1/3 -0.79 BPSK
2*960 -11.48 1/3 -0.79 QPSK
Table 4.1. Physical layer parameter for different data rates
The AVI tables are calculated using the obtained offsets of Table 4.1. and the result are shown in
Table 4.2.
Table 4.2. AVI tables BLER vs Eb/No (dB) for different data rates considering a DPCCH.
34
60Kbps 240Kbps 480Kbps 960Kbps 1920Kbps
1.000 1 0.37 0.21 0.21 0.21
0.900 1.7 1.07 0.91 0.91 0.910.800 2 1.37 1.21 1.21 1.21
0.300 2.5 1.87 1.71 1.71 1.71
0.100 2.6 1.97 1.81 1.81 1.81
0.025 3 2.37 2.21 2.21 2.21
0.010 3 2.37 2.21 2.21 2.21
0.002 3 2.37 2.21 2.21 2.21
0.001 3 2.37 2.21 2.21 2.21
BLER

8/12/2019 WCDMA Enhanced UL Performance Evaluation.pdf
http://slidepdf.com/reader/full/wcdma-enhanced-ul-performance-evaluationpdf 37/80
Figure 4.3. AVI tables (BLER vs Eb/No) for different data rates considering a DPCCH.
4.2 Modelin! o& $A+,
With HARQ different transmission of the same data frame received at the NodeB are combined to
increase the probability of correctly decoding the packet. The modeling of HARQ and soft
combining is done by a method described in [17] in which the received Eb/No is cumulated from all
the received transmission of the same packet. This cumulate Eb/No is used as an input of the AVI
tables to obtain the probability of error after combining. The accumulated Eb/No is just the
summation of all the Eb/No received, the Eb/No of the first packet plus the Eb/No of all theretransmissions. The method also include a loss that is added to the cumulated Eb/No, this indicates
that a perfect gain is not archived and a certain loss is produce depending on the combining
technique (chase combining or incremental redundancy). Since it was shown in [17] that combining
with incremental redundancy provides a small throughput gain compared to chase combining there
will be no differentiation between the two techniques in the modeling of HARQ and the loss
obtained by the combining technique will be kept constant. The values for that loss are given in [17]
for a QPSK modulation at 3Km/H Pedestrian-A and Vehicular-A profiles with different coding
rates. The value 0.93 (-0.32dB) was chosen for chase combining with no incremental redundancy
gain, coding rate 1/3 and Pedestrian-A profile which is the worst case that gives the higher loss.
35
0.900 0.800 0.300 0.100 0.025 0.010 0.002 0.001
0
0.25
0.5
0.75
1
1.25
1.5
1.75
2
2.25
2.5
2.75
3
AVI
BLER
E b / N o

8/12/2019 WCDMA Enhanced UL Performance Evaluation.pdf
http://slidepdf.com/reader/full/wcdma-enhanced-ul-performance-evaluationpdf 38/80
For this work the HARQ was modeled by adding the Eb/No of the retransmissions of the same
packet considering the combining loss. The cumulated Eb/No is then used to obtain the probability
of error form the AVI tables.
Figure 4.4. Modeling HARQ
In figure 4.4 is shown that the BLER will get lower when a retransmission is received and the
Eb/No of the first transmission is added to the Eb/No of the retransmission. The ideal gain gain is
not reach since the combining loss and the loss produce by the control channel are considered.
4.3 Modelin! o& -ode Pac#et Schedulin! Si!nalin!Packet Scheduler based in the NodeB must use certain signaling with the UE. In the uplink
direction the needed information is included as part of the MAC header and in the downlink
direction separate channel are used to transmit the grants and the HARQ acknowledgments. In this
model the uplink signaling overhead of the information included in the MAC header is taken into
account but the overhead of of the signal transmited in a separate dowlink channel is not taken into
account. The delay of these signaling is simulated considering the transmission time and processing
times in the NodeB and UE MAC layer.
The processing times were obtained from [23] which suggest 8 slots processing time in the NodeBfrom reception of E-DPCCH/E-DPCCH to the transmission of E-AGCH/E-HICH/E-RGCH. The
UE processing time is of 4 slots form the reception of a E-AGCH/E-HICH/E-RGCH to the
transmission the E-DPCCH/E-DPDCH.
The delay of signaling form the UE to the NodeB includes a transmission delay of one TTI (3 slots
for 2ms TTI) plus the NodeB processing time of 8 slots. The delay of the signaling form the NodeB
to the UE includes a transmission delay of one TTI (3 slots for 2ms TTI) plus the UE processing
time of 4 slots. Note that transmission are made every TTI so for example a grant reception at the
UE will be decoded in 4 slots but the start of the transmission will have to wait until the beginning
of the next TTI (after 6 slots for 2ms TTI). In the same way a reception of E-DPCCH/E-DPDCH at
36
Eb/No1st
BLER
1st +2nd -L
8/12/2019 WCDMA Enhanced UL Performance Evaluation.pdf
http://slidepdf.com/reader/full/wcdma-enhanced-ul-performance-evaluationpdf 39/80
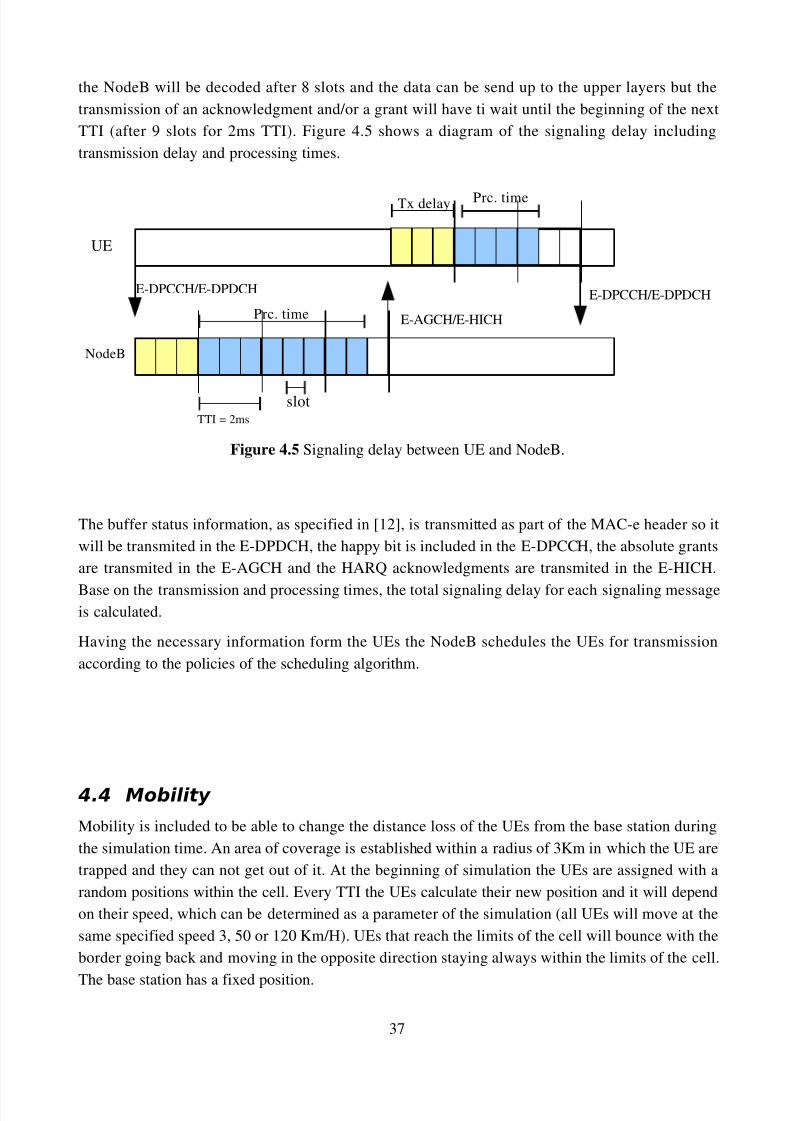
the NodeB will be decoded after 8 slots and the data can be send up to the upper layers but the
transmission of an acknowledgment and/or a grant will have ti wait until the beginning of the next
TTI (after 9 slots for 2ms TTI). Figure 4.5 shows a diagram of the signaling delay including
transmission delay and processing times.
Figure 4.5 Signaling delay between UE and NodeB.
The buffer status information, as specified in [12], is transmitted as part of the MAC-e header so it
will be transmited in the E-DPDCH, the happy bit is included in the E-DPCCH, the absolute grants
are transmited in the E-AGCH and the HARQ acknowledgments are transmited in the E-HICH.
Base on the transmission and processing times, the total signaling delay for each signaling messageis calculated.
Having the necessary information form the UEs the NodeB schedules the UEs for transmission
according to the policies of the scheduling algorithm.
4.4 Mo/ility
Mobility is included to be able to change the distance loss of the UEs from the base station during
the simulation time. An area of coverage is established within a radius of 3Km in which the UE are
trapped and they can not get out of it. At the beginning of simulation the UEs are assigned with a
random positions within the cell. Every TTI the UEs calculate their new position and it will depend
on their speed, which can be determined as a parameter of the simulation (all UEs will move at the
same specified speed 3, 50 or 120 Km/H). UEs that reach the limits of the cell will bounce with the
border going back and moving in the opposite direction staying always within the limits of the cell.
The base station has a fixed position.
37
Tx delay Prc. time
TTI = 2ms
slot
UE
NodeB
E-DPCCH/E-DPDCH
E-AGCH/E-HICHPrc. time
E-DPCCH/E-DPDCH
8/12/2019 WCDMA Enhanced UL Performance Evaluation.pdf
http://slidepdf.com/reader/full/wcdma-enhanced-ul-performance-evaluationpdf 40/80
The number of meters traveled in one TTI are calculated form the UE speed and the angle of the
movement direction is initialized with a random number at the beginning of the simulation and it
only changes when the UE reaches the border of the cell.
4.5 Path 0oss
The modeling of the path loss includes the distance attenuation, shadowing and fading. The distance
attenuation or distance loss (dl) is calculated using the Okumura-Hata propagation model for a
suburban macro cell with base station antenna height of 30m, mobile antenna height of 1.5m and
carrier frequency of 1950MHz [20]:
dl=129.435.2 log10d (9)
where d is the distance form the NodeB in Kilometers.
The shadowing modeling of the path loss is based in the study and simulation done in [21]. It is
calculated taking into account that its value is not independent form one location to another and
there is a correlation with respect to the location.
S x x =a⋅S x b⋅⋅ N (10)
a=exp − x/ D (11)
b2=1−a2 (12)
Here x is the distance to the NodeB and ∆x is the difference between the actual distance and the
distance measured at the previews calculation of the shadowing. The shadowing in the new positionS(x+∆x) depends on the shadowing of the previous position S(x). In the formula (11), D is the
correlation distance which is equal to 40m. In (10) is the standard deviation in suburban areas
which its typical value is 8dB and N is a random variable that satisfies the standard normal
distribution.
Multi-path fading is precalculated in a link level simulation for different environments and UE
speeds. The multi-path fading model of this link level simulation is described in [29] and assumes
the usage of an ideal Rake receiver. This simulations provide the values of the multi-path fading
contribution to the loss experienced by a UE for a period of 2000 seconds. The results of these
38

8/12/2019 WCDMA Enhanced UL Performance Evaluation.pdf
http://slidepdf.com/reader/full/wcdma-enhanced-ul-performance-evaluationpdf 41/80

8/12/2019 WCDMA Enhanced UL Performance Evaluation.pdf
http://slidepdf.com/reader/full/wcdma-enhanced-ul-performance-evaluationpdf 42/80
-uplinkTTI 2ms \
-Eul_Scheduling 1 \
-RP_Seed 31 \
-MaxRoT 6
set edch0 [$ns create-edch $ue1 $agent1]
This command creates the E-DCH in $ue1 and attach $agent1 to it.
After creating the channel the file which includes the fading values for the simulation must be
specified. This file must contain the fading values obtained for a specific environment and UE
speed.
$ue1 setErrorTrace-EUL 1 “Ped_A-3kmh-0m-2000s-Uenr1”
This command sets the file “Ped_A-3kmh-0m-2000s-Uenr1” for being used by the UE “ue1”, this
command must be repeated for all the UEs in the simulation, even if all them use the same file.
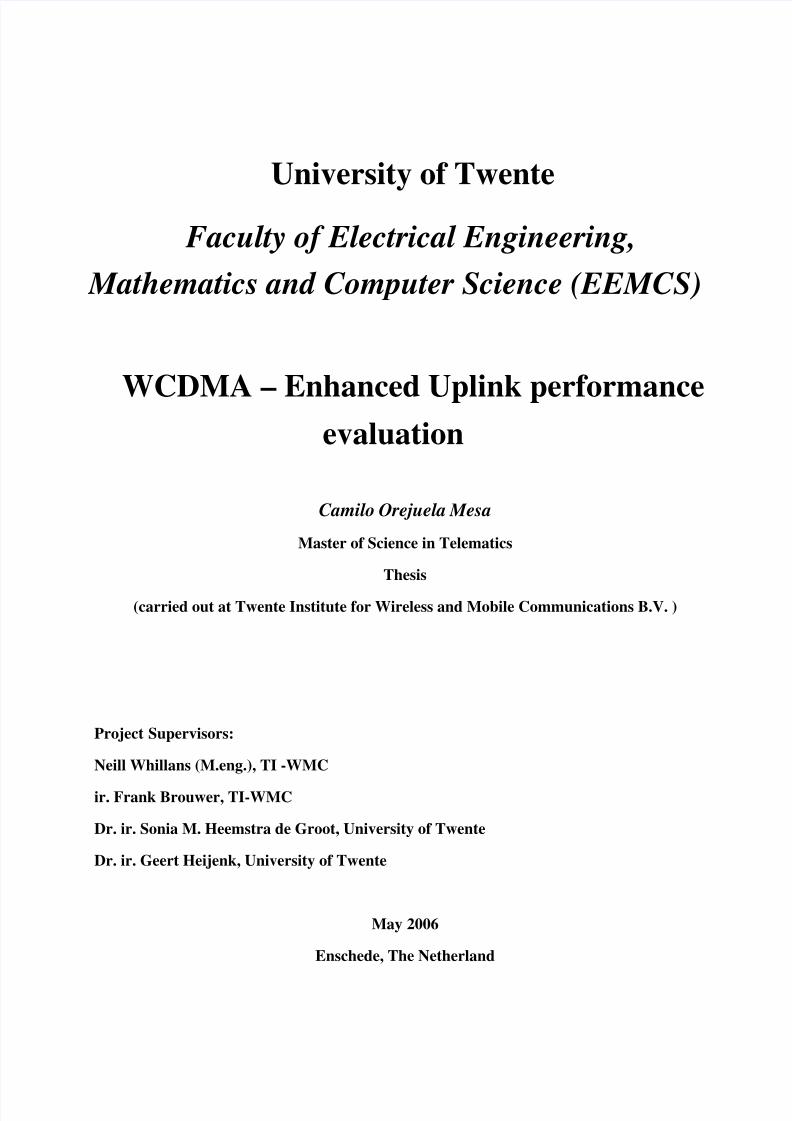
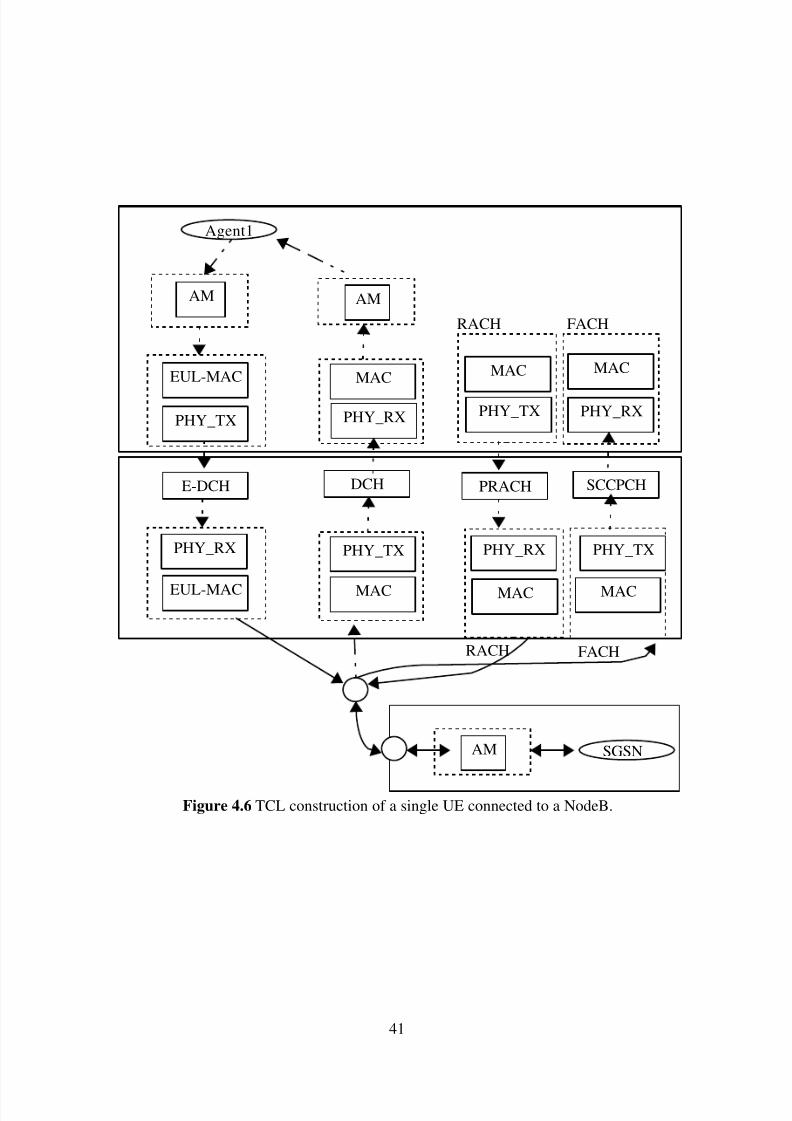
Figure 4.6 shows an example TCL construction of a single UE connected to a NodeB. The FACH
and RACH channel are created automatically and an agent is attaches to a E-DCH. A return channel
in the downlink direction is created automatically using a normal DCH.
40
8/12/2019 WCDMA Enhanced UL Performance Evaluation.pdf
http://slidepdf.com/reader/full/wcdma-enhanced-ul-performance-evaluationpdf 43/80
Figure 4.6 TCL construction of a single UE connected to a NodeB.
41
PHY_TXPHY_TX
MAC MAC
PHY_RX
RACH FACH
EUL-MAC
AM
Agent1
E-DCH
PHY_RX
MAC
AM
DCH SCCPCHPRACH
PHY_TX
MAC MAC
PHY_RX
RACH FACH
PHY_TX
EUL-MAC
PHY_RX
MAC
AM SGSN
8/12/2019 WCDMA Enhanced UL Performance Evaluation.pdf
http://slidepdf.com/reader/full/wcdma-enhanced-ul-performance-evaluationpdf 44/80
4.6.2 Trace Support
A new packet types where created in order to simulate the Enhanced uplink in ns-2. The “MacE”
packet type encapsulates all the AM data packets into a big frame which is transmited in the E-
DPDCH. A retransmission of this packet is defined as “MacE_HARQ” packet type. These packet
types can be visualize in the output trace file of the simulation.
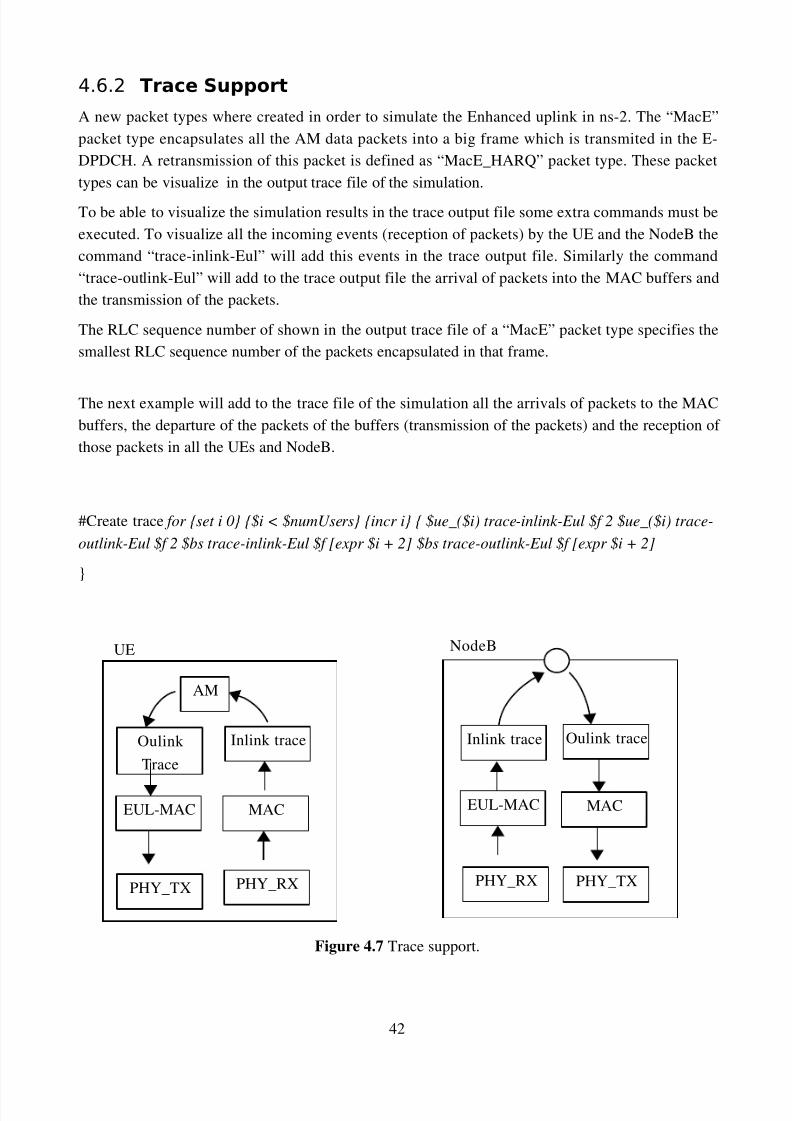
To be able to visualize the simulation results in the trace output file some extra commands must be
executed. To visualize all the incoming events (reception of packets) by the UE and the NodeB the
command “trace-inlink-Eul” will add this events in the trace output file. Similarly the command
“trace-outlink-Eul” will add to the trace output file the arrival of packets into the MAC buffers and
the transmission of the packets.
The RLC sequence number of shown in the output trace file of a “MacE” packet type specifies the
smallest RLC sequence number of the packets encapsulated in that frame.
The next example will add to the trace file of the simulation all the arrivals of packets to the MAC
buffers, the departure of the packets of the buffers (transmission of the packets) and the reception of
those packets in all the UEs and NodeB.
#Create trace for {set i 0} {$i < $numUsers} {incr i} { $ue_($i) trace-inlink-Eul $f 2 $ue_($i) trace-
outlink-Eul $f 2 $bs trace-inlink-Eul $f [expr $i + 2] $bs trace-outlink-Eul $f [expr $i + 2]
}
Figure 4.7 Trace support.
42
PHY_TX
EUL-MAC
AM
PHY_RX
MAC
Oulink
Trace
Inlink trace
PHY_TX
EUL-MAC
PHY_RX
MAC
Inlink trace Oulink trace
UE NodeB

8/12/2019 WCDMA Enhanced UL Performance Evaluation.pdf
http://slidepdf.com/reader/full/wcdma-enhanced-ul-performance-evaluationpdf 45/80

8/12/2019 WCDMA Enhanced UL Performance Evaluation.pdf
http://slidepdf.com/reader/full/wcdma-enhanced-ul-performance-evaluationpdf 46/80
rate for the last UE in the list will take place. If the minimum bit rate for a UE is reached that UE is
eliminated from that scheduling period and it will not be allowed to transmit during that TTI, a new
request for that UE is automatically generated at the NodeB to be taken into account in the next
TTI.
Upon the reception of a request for resources form the UEs the scheduler assigns each UE with a bit
rate. The assignation of bit rates to each UE can be done using an estimation of the maximum bit
rate that can be supported by each UE or can be just an assignation of the maximum allowed bit
rate, this assignation will depend on the scheduling mechanism used.
To have a measure of the amount of allocated resources to each user the load factor of each UE is
calculated:
= 1
1 W
Eb/ No⋅ R
(13)
where W is the chip rate, R is the assigned bit rate and Eb/No is the required energy per bit over
noise ratio for a specific block error rate (this value is taken from the AVI tables).
The total uplink load factor then is calculated as the sum of the load factors of the active UEs:
UL=1i ⋅∑ 1
1 W
Eb/ No⋅ R
(14)
The interference from other cells is included with the parameter i which is the other-to-owninterference ration. Since the simulator use a single-cell model, this parameters is kept constant
during the simulation.
Using the total uplink load factor the total received wideband interference power is calculated:
Itotal= PN
1−UL(15)
44
8/12/2019 WCDMA Enhanced UL Performance Evaluation.pdf
http://slidepdf.com/reader/full/wcdma-enhanced-ul-performance-evaluationpdf 47/80
where PN is the thermal noise.
Using the the total uplink interference power (Itotal) and the load factor of each UE the power that
each UE needs to transmit at the assigned bit rate is calculated:
Pj= Itotal⋅UL (16)
After the bit rate assignation the UEs are sorted in a list where its order will depend on the
scheduling mechanism policies. Since not all the UEs can be scheduled to transmit at the same TTI,
the order of the list will determine the priority of each UE to be scheduled for that particular TTI.
Two conditions must be satisfied during the allocation of resources by the scheduler. First,
considering the estimation of the interference that will be generated by all the UEs transmitting at
the assigned bit rates, the scheduler will calculate if the Eb/No requirements will be fulfilled by all
the UEs.
The scheduler can verify that each user meet the required Eb/No using its power (Pj) and the total
interference (Itotal):
Eb / No=W
R⋅ Pj
Itotal− Pj(17)
If one of the UEs does not meet this requirement the process of decreasing the bit rate of the UE at
the end of the scheduling list will take place. This process will continue and if the UE at the end of
the list is eliminated the process will continue with the next UE on the list. If at least one UE
doesn’t meet the Eb/No requirements this condition will fail.
The second condition is to keep the noise ratio below the established limit setup by the RNC. The
noise ratio is defined as the amount of interference generated over the thermal noise.
NR= Itotal
PN (18)
45

8/12/2019 WCDMA Enhanced UL Performance Evaluation.pdf
http://slidepdf.com/reader/full/wcdma-enhanced-ul-performance-evaluationpdf 48/80
The NR (noise ratio) is set as a fixed value of 6 dB. If the calculated NR is bigger than the specified
value the process of decreasing the bit rates of the last UE on the list will continue.
If the two conditions are satisfied all the UEs in the sorted list will be granted with the assigned bit
rates. If one of these conditions fails the scheduler will start the process of rate decreasing and UE
elimination.
The process of rate decreasing and UE elimination will be executed over the UE at the bottom of
the sorted list. This process will start decreasing the bit rate of this user trying to get to the point
where the two previous conditions are attained. When a UE reaches the minimum allowed bit rate
assignation this UE will be eliminated and will not be granted with resources for transmission
during that TTI and its request will be postponed for being considered in the next TTI. Depending
on the scheduling mechanism policies an eliminated UE could get a higher priority for beingscheduled in the next TTI.
Figure 5.1: Scheduling Algorithm Basic Functionality.
46
Receive Requests
Sort
NR=6dB
Decrease bit
rates
(1) Check Eb/No
requirements for all UEs.
(2) Check Noise Rise
limit (6dB).
1
Eliminate
UEs
Assign bit rates
Send Grants
fail fail
2
NR=6dB
NR=6dB

8/12/2019 WCDMA Enhanced UL Performance Evaluation.pdf
http://slidepdf.com/reader/full/wcdma-enhanced-ul-performance-evaluationpdf 49/80
5.2 Code+ate Schedulin!
The basic principal of the code or rate scheduling is to serve all users at the same time. As the
amount of users increase each user will be granted with a lower rate to be able to share the total
amount of resources between all the users.
The basic scheduling functionality is performed with some changes in the procedure of decreasing
of bit rates and user elimination. All the users that request for resources are assigned with the
maximum allowed data bit rate. If the required Eb/No of all the that have to be scheduled is not
satisfied or if the noise ratio exceeds the established limit the bit rate of the user at the bottom of the
scheduling list will be decreased. Immediately the unfortunate user will be positioned at the top of
the list so if the two scheduling conditions are still not satisfied another user will be the selected for
bit rate reduction. When many users request for transmission for the same TTI it is possible that all
of them reach the minimum allowed bit rate and still the scheduling conditions are not satisfied; in
that case elimination of users will take place in the same order as the bit rate reduction was being
executed.
5.3 +ound +o/in Schedulin!
The basic principal of the Round Robin scheduling is to give priority to a different user in a round
robin fashion every TTI. A pure time division scheduling giving all the resources to a single userwill be inefficient since UEs are not able to take advantage of the full channel capacity so more than
one user will be scheduled every TTI but one of them will have the priority to transmit at the
maximum allowed bit rate.
All the users that request for transmission will be assigned with the maximum allowed bit rate at the
beginning of the scheduling process. If the scheduling conditions are not satisfied the process of
rate reduction will be executed over the user at the end of the scheduling list, the priority of this
user will not change during that TTI and if the scheduling conditions are not yet satisfied the bit
reduction will continue affecting this user until it reaches the minimum allowed bit rate and its
eliminated for transmission during that TTI. A user affected by the bit reduction or elimination
process will have priority for the next TTI and will be positioned at the top of the scheduling list.
With this mechanism every TTI a different user will be granted to transmit at the maximum allowed
bit rate.
47

8/12/2019 WCDMA Enhanced UL Performance Evaluation.pdf
http://slidepdf.com/reader/full/wcdma-enhanced-ul-performance-evaluationpdf 50/80
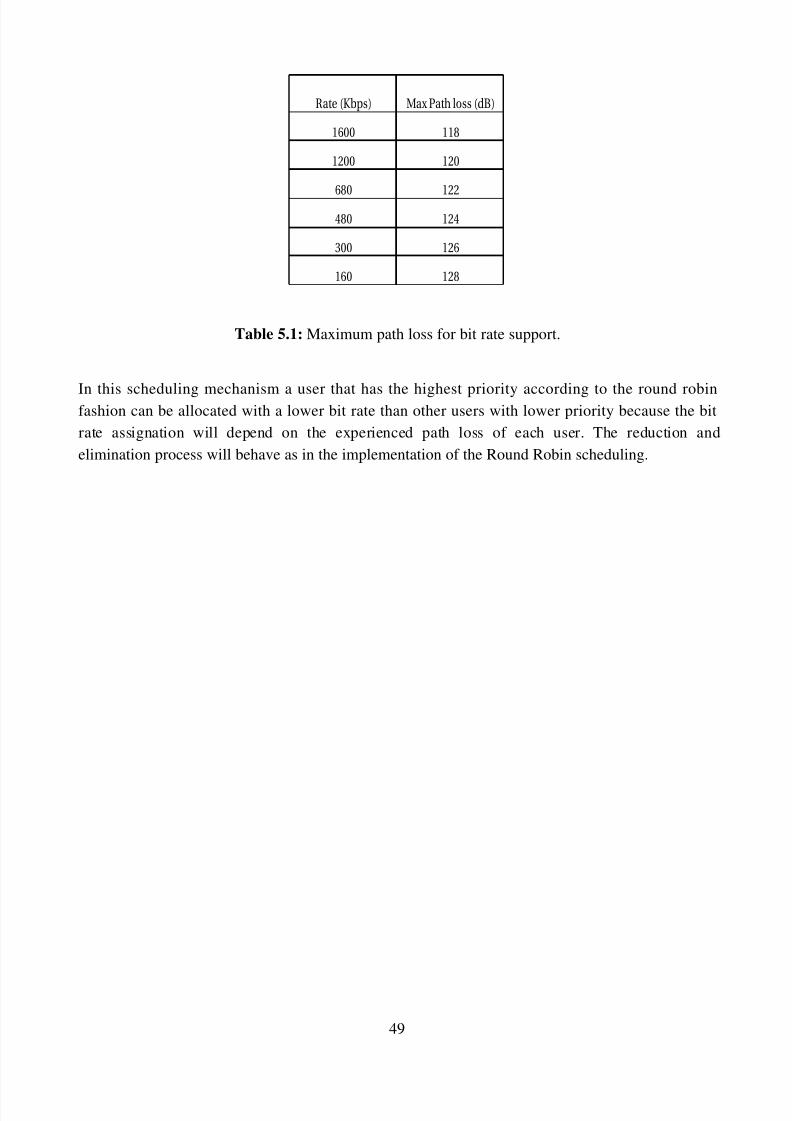
8/12/2019 WCDMA Enhanced UL Performance Evaluation.pdf
http://slidepdf.com/reader/full/wcdma-enhanced-ul-performance-evaluationpdf 51/80
Table 5.1: Maximum path loss for bit rate support.
In this scheduling mechanism a user that has the highest priority according to the round robinfashion can be allocated with a lower bit rate than other users with lower priority because the bit
rate assignation will depend on the experienced path loss of each user. The reduction and
elimination process will behave as in the implementation of the Round Robin scheduling.
49
Rate (Kbps) Max Path loss (dB)
1600 118
1200 120
680 122
480 124
300 126
160 128
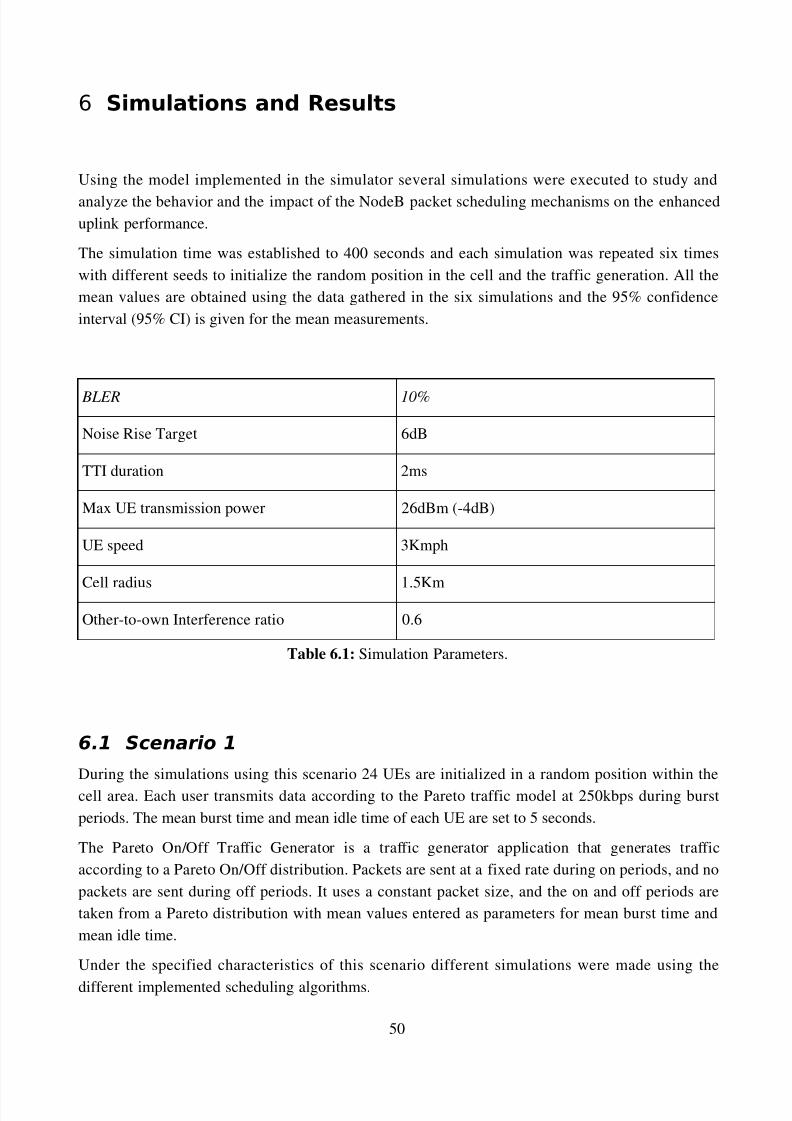
8/12/2019 WCDMA Enhanced UL Performance Evaluation.pdf
http://slidepdf.com/reader/full/wcdma-enhanced-ul-performance-evaluationpdf 52/80
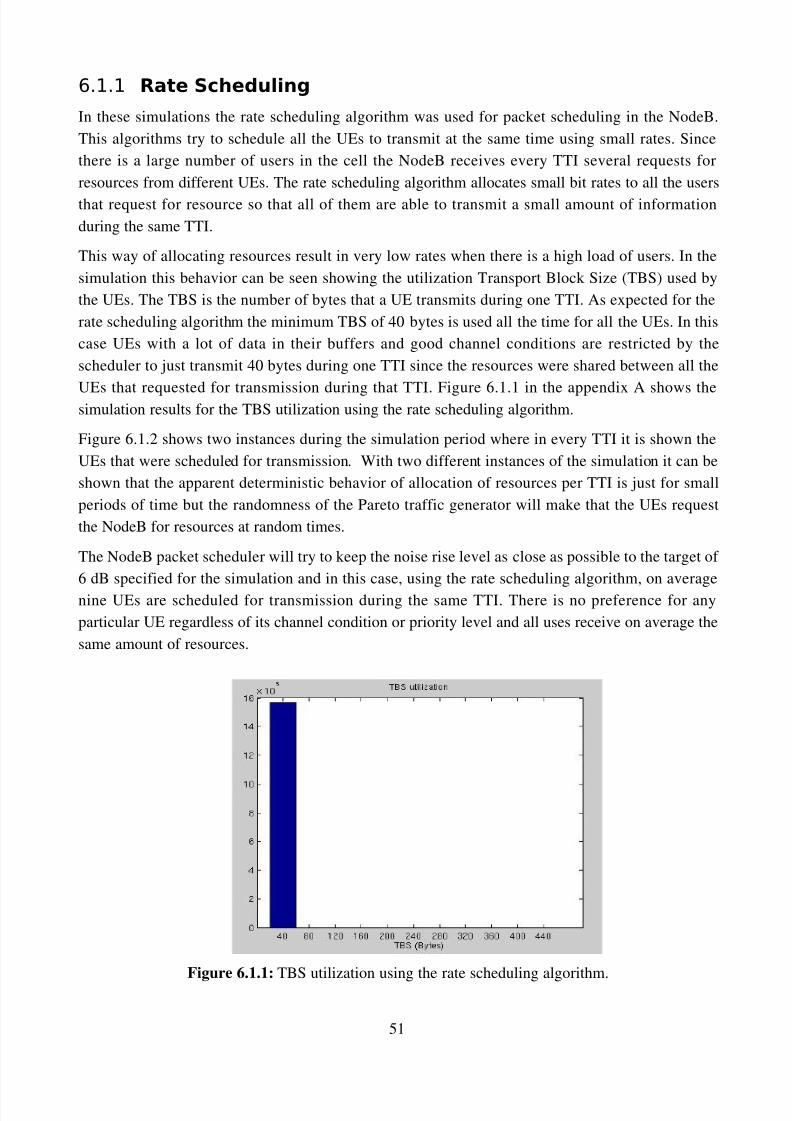
8/12/2019 WCDMA Enhanced UL Performance Evaluation.pdf
http://slidepdf.com/reader/full/wcdma-enhanced-ul-performance-evaluationpdf 53/80
6.1.1 Rate Scheduling
In these simulations the rate scheduling algorithm was used for packet scheduling in the NodeB.
This algorithms try to schedule all the UEs to transmit at the same time using small rates. Since
there is a large number of users in the cell the NodeB receives every TTI several requests for
resources from different UEs. The rate scheduling algorithm allocates small bit rates to all the users
that request for resource so that all of them are able to transmit a small amount of information
during the same TTI.
This way of allocating resources result in very low rates when there is a high load of users. In the
simulation this behavior can be seen showing the utilization Transport Block Size (TBS) used by
the UEs. The TBS is the number of bytes that a UE transmits during one TTI. As expected for the
rate scheduling algorithm the minimum TBS of 40 bytes is used all the time for all the UEs. In this
case UEs with a lot of data in their buffers and good channel conditions are restricted by the
scheduler to just transmit 40 bytes during one TTI since the resources were shared between all the
UEs that requested for transmission during that TTI. Figure 6.1.1 in the appendix A shows thesimulation results for the TBS utilization using the rate scheduling algorithm.
Figure 6.1.2 shows two instances during the simulation period where in every TTI it is shown the
UEs that were scheduled for transmission. With two different instances of the simulation it can be
shown that the apparent deterministic behavior of allocation of resources per TTI is just for small
periods of time but the randomness of the Pareto traffic generator will make that the UEs request
the NodeB for resources at random times.
The NodeB packet scheduler will try to keep the noise rise level as close as possible to the target of
6 dB specified for the simulation and in this case, using the rate scheduling algorithm, on average
nine UEs are scheduled for transmission during the same TTI. There is no preference for any
particular UE regardless of its channel condition or priority level and all uses receive on average the
same amount of resources.
Figure 6.1.1: TBS utilization using the rate scheduling algorithm.
51
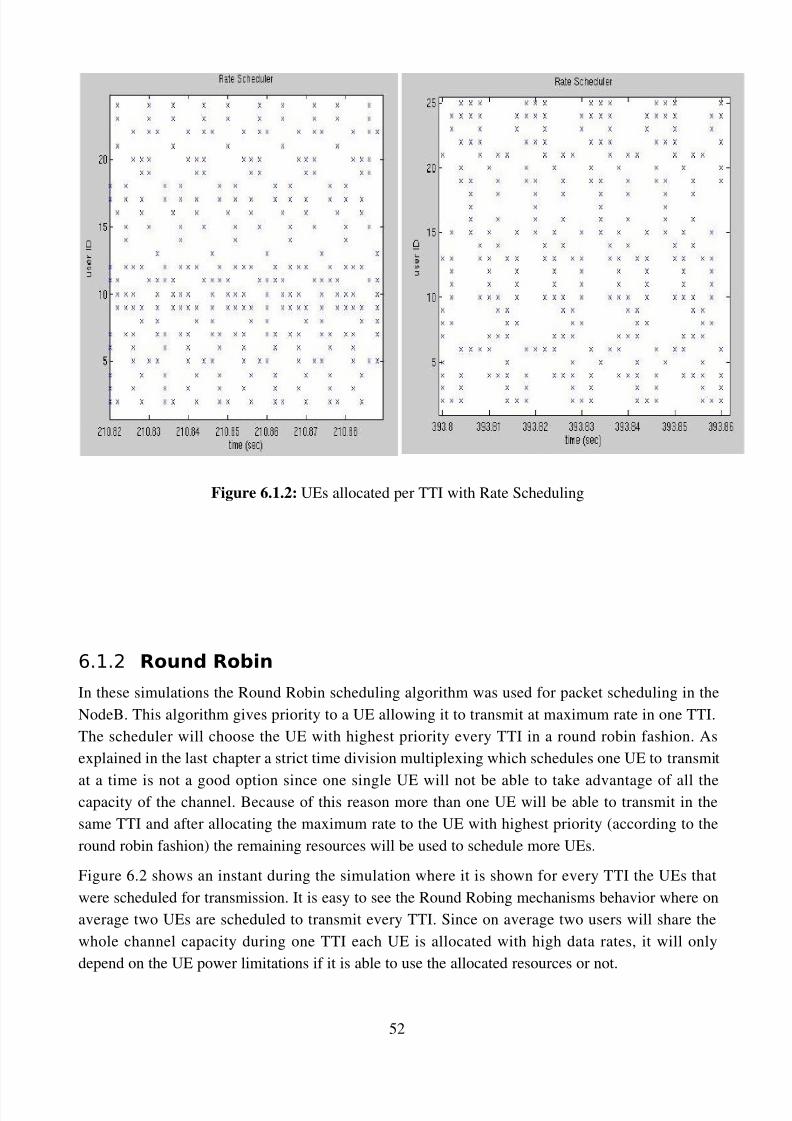
8/12/2019 WCDMA Enhanced UL Performance Evaluation.pdf
http://slidepdf.com/reader/full/wcdma-enhanced-ul-performance-evaluationpdf 54/80
Figure 6.1.2: UEs allocated per TTI with Rate Scheduling
6.1.2 Round Robin
In these simulations the Round Robin scheduling algorithm was used for packet scheduling in the
NodeB. This algorithm gives priority to a UE allowing it to transmit at maximum rate in one TTI.
The scheduler will choose the UE with highest priority every TTI in a round robin fashion. As
explained in the last chapter a strict time division multiplexing which schedules one UE to transmit
at a time is not a good option since one single UE will not be able to take advantage of all thecapacity of the channel. Because of this reason more than one UE will be able to transmit in the
same TTI and after allocating the maximum rate to the UE with highest priority (according to the
round robin fashion) the remaining resources will be used to schedule more UEs.
Figure 6.2 shows an instant during the simulation where it is shown for every TTI the UEs that
were scheduled for transmission. It is easy to see the Round Robing mechanisms behavior where on
average two UEs are scheduled to transmit every TTI. Since on average two users will share the
whole channel capacity during one TTI each UE is allocated with high data rates, it will only
depend on the UE power limitations if it is able to use the allocated resources or not.
52

8/12/2019 WCDMA Enhanced UL Performance Evaluation.pdf
http://slidepdf.com/reader/full/wcdma-enhanced-ul-performance-evaluationpdf 55/80
Figure 6.2: UEs allocated per TTI with Round Robin Scheduling.
In general high data rates will be allocate to each UE. Figure 6.3 shows the utilization of TBSduring the simulation and as expected the maximum allowed TBS of 400 bytes is the most highly
used. The TBS of 280 bytes has also a high utilization because it is the TBS that the UEs allocated
with the remaining resources will use. This TBS value of 280 bytes depends not only in the target
noise rise level but also in the inter-cell interference and in the packet size of the RLC packets
arriving to the Enhanced MAC (for these simulations the RLC packet size was setup to 40 bytes).
The minimum TBS was setup to allow the transmission of at least one RLC packet of 40 bytes plus
its corresponding header. TBS of 40 bytes is also highly used during the simulation because UEs
that fall into bad channel conditions caused by fading are not able to transmit at high rates any more
and they are just able to transmit a single RLC packet.
53

8/12/2019 WCDMA Enhanced UL Performance Evaluation.pdf
http://slidepdf.com/reader/full/wcdma-enhanced-ul-performance-evaluationpdf 56/80
Figure 6.3: TBS utilization using the Round Robin scheduling algorithm.
6.1.3 Scheduler based on UC-I1
In these simulations the a scheduler based on a uplink Channel Quality Indicator was used for
packet scheduling in the NodeB. This algorithm gives priority to the UEs with the best channel
condition during that TTI.
This is an unfair scheduling mechanism since the users with bad channel conditions will not get the
same amount of resources than users with good channel conditions. A bad channel condition user
will only be scheduled for transmission in a TTI where no user with better channel conditions
request for resources. This particular behavior will trigger a repeating request mechanism in the bad
channel conditions UEs. When a UE sends a request for resources the information about its buffer
status, headroom and UCQI are attached into the Enhanced MAC header. If after a period of time
the UE has not receive any grant from the NodeB the UE will repeat its request for resources
sending a packet without payload and just attaching the necessary information to the header. This
repetition of request is not likely to happen when using fair schedulers since the grant for a request
will usually arrive to the UE before the timer expires, but using unfair scheduler like the one base
on UCQI a bad channel condition user will have to wait until there are no more UEs asking for
resources or until its channel conditions improve. With a noise rise level of 6 dB this type of
scheduler will fulfill all the available resources with just two users at maximum rate but figure 6.4
shows that in some cases three or four UEs are scheduled for transmission during one TTI. The
54
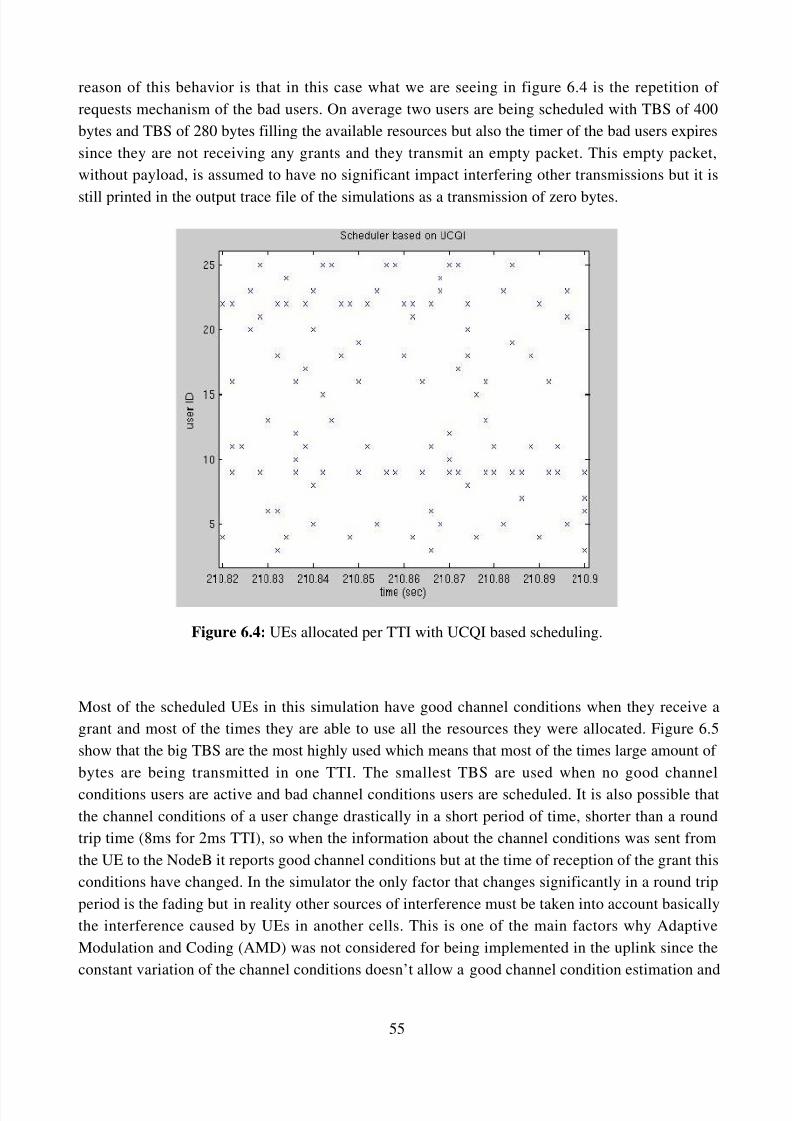
8/12/2019 WCDMA Enhanced UL Performance Evaluation.pdf
http://slidepdf.com/reader/full/wcdma-enhanced-ul-performance-evaluationpdf 57/80
reason of this behavior is that in this case what we are seeing in figure 6.4 is the repetition of
requests mechanism of the bad users. On average two users are being scheduled with TBS of 400
bytes and TBS of 280 bytes filling the available resources but also the timer of the bad users expires
since they are not receiving any grants and they transmit an empty packet. This empty packet,
without payload, is assumed to have no significant impact interfering other transmissions but it is
still printed in the output trace file of the simulations as a transmission of zero bytes.
Figure 6.4: UEs allocated per TTI with UCQI based scheduling.
Most of the scheduled UEs in this simulation have good channel conditions when they receive a
grant and most of the times they are able to use all the resources they were allocated. Figure 6.5
show that the big TBS are the most highly used which means that most of the times large amount of
bytes are being transmitted in one TTI. The smallest TBS are used when no good channel
conditions users are active and bad channel conditions users are scheduled. It is also possible that
the channel conditions of a user change drastically in a short period of time, shorter than a round
trip time (8ms for 2ms TTI), so when the information about the channel conditions was sent from
the UE to the NodeB it reports good channel conditions but at the time of reception of the grant this
conditions have changed. In the simulator the only factor that changes significantly in a round trip
period is the fading but in reality other sources of interference must be taken into account basically
the interference caused by UEs in another cells. This is one of the main factors why Adaptive
Modulation and Coding (AMD) was not considered for being implemented in the uplink since the
constant variation of the channel conditions doesn’t allow a good channel condition estimation and
55

8/12/2019 WCDMA Enhanced UL Performance Evaluation.pdf
http://slidepdf.com/reader/full/wcdma-enhanced-ul-performance-evaluationpdf 58/80
ruin the performance of AMD.
Figure 6.5: TBS utilization using the UCQI based scheduling algorithm.
6.1.4 Scheduler with Rate #stimation1
In these simulations the a scheduler use a rate estimation mechanism using the path loss
experienced by each user to calculate or estimate the maximum rate that it will be able to support.
This algorithm doesn’t give priorities to the UEs and they are scheduled in a Round Robin fashion
but their allocated rates will depend on the estimation of its maximum supported rate. With this
algorithm UEs will not be assign with more resources than what they are able to support in an ideal
condition with no interference of other users and no inter-cell interference.
In Figure 6.6 the Round Robin fashion can be noted. The difference between figure 6.6 and figure
6.2, which show a simple Round Robin scheduling with no rate estimation, is that more than two
UEs are scheduled for transmission during the same TTI. In this case the users are not sending an
empty packet repeating a request for resources, all users are being scheduled with at least the
minimum TBS but users that experience a higher path loss are allocated with smaller rates. The
allocation of smaller rates for some users allows the scheduler to allocate the remaining resources to
other users.
56

8/12/2019 WCDMA Enhanced UL Performance Evaluation.pdf
http://slidepdf.com/reader/full/wcdma-enhanced-ul-performance-evaluationpdf 59/80
Figure 6.6: UEs allocated per TTI with Rate Estimation scheduling.
The more accurate allocation of resources estimating the maximum rate that a UE is able to supportlead to a better utilization of the channel wasting less resources allocated to UEs that are not able to
use them. In figure 6.7 the TBS utilization shows an increment of the maximum TBS of 400 bytes
and a reduction of the minimum TBS of 40 bytes. Also an increment in the utilization of TBS of 80
bytes and 160 bytes is shown. These TBS were not likely to be used with the other schedulers
because the allocation of high rates to the users with more priority will not leave resources to
allocate small rates to other UEs. These TBS were only used when bad channel conditions users
were scheduled with high rates but their power limitations make them reduce the rate. With the rate
estimation algorithm users with bad channel condition or high path loss are allocated with small
rates by the scheduler.
57

8/12/2019 WCDMA Enhanced UL Performance Evaluation.pdf
http://slidepdf.com/reader/full/wcdma-enhanced-ul-performance-evaluationpdf 60/80
Figure 6.7: TBS utilization using the Rate Estimation scheduling algorithm.
6.1.5 Time $ela*1
Depending on the type of traffic it is very important to consider the delay experienced during the
data transmission. In some applications the destination is not expecting the data within a certain
time and basically the delay is not so important. Other application are sensitive to the delay and
they impose a limit of acceptable delay to achieve acceptable quality.
The behavior of the different scheduling mechanism affect the time delay experienced by the users.
The delay measurements are taken from the time at which a packet arrives from the RLC to the
MAC of the UE until that packet is delivered to the RLC by the MAC at the NodeB side.
Table 6.2 gives the mean and standard deviation for all the implemented schedulers during the
simulation time. Figure 6.8 show the delay experienced by all the received RLC PDUs during the
whole simulation for the different schedulers. The highest average delay is given by the Rate
Scheduling which allocating small rates to all the users doesn’t give enough resources to the UEs to
transmit large amounts of data. The data in their buffers is transmitted in small chunks every time
they receive a grant from the NodeB having to wait until the next grant to transmit again. The data
that arrives to MAC from the RLC also comes in bursts of packets, the first packets in this burst are
transmitted very quickly, using the first low rate grant given by the NodeB, but the last packets of
58

8/12/2019 WCDMA Enhanced UL Performance Evaluation.pdf
http://slidepdf.com/reader/full/wcdma-enhanced-ul-performance-evaluationpdf 61/80
the burst will have to wait a long time in the buffer before they are transmitted increasing the
average delay measurement and the standard deviation.
The UCQI based scheduler shows the smallest average delay but with the highest standard
deviation. The average delay is small because most of the times good channel conditions users are
scheduled with high rates which they use to transmit large amount of the data in their buffers
reducing the time they have to wait to be transmitted. The fact that the bad channel conditions users
are just scheduled when the good channel condition users are inactive makes that these bad users
experience large delays. In figure 6.8 large delay measurements are shown for the UCQI scheduler
when the bad users finally had the chance to transmit their data.
On the Round Robin and the Rate Estimation schedulers the UEs will have to wait until they get
their turn to transmit in the round robin fashion but when they get a grant they will be able to
transmit large amounts of data from their buffers, that is why the average delay of these schedulers
in higher than for the UCQI based scheduler but lower than for the Rate Scheduler. The
improvement in the more accurate allocation of resources of the Rate Estimation scheduler is shownas a smaller average delay and standard deviation compared to the Round Robin scheduler.
Table 6.2. delay measurements of different scheduling schemes.
59
Mean Std Mean 95% C!ate sc"ed#ling $.356 $.22 $.354 to $.35
$.222 $.16 $.21& to $.225
$.2$ $.14 $.2$1 to $.214
$.15 1.2 $.153 to $.16$
!o#d!obin
!ate 'stim Sc"(C)
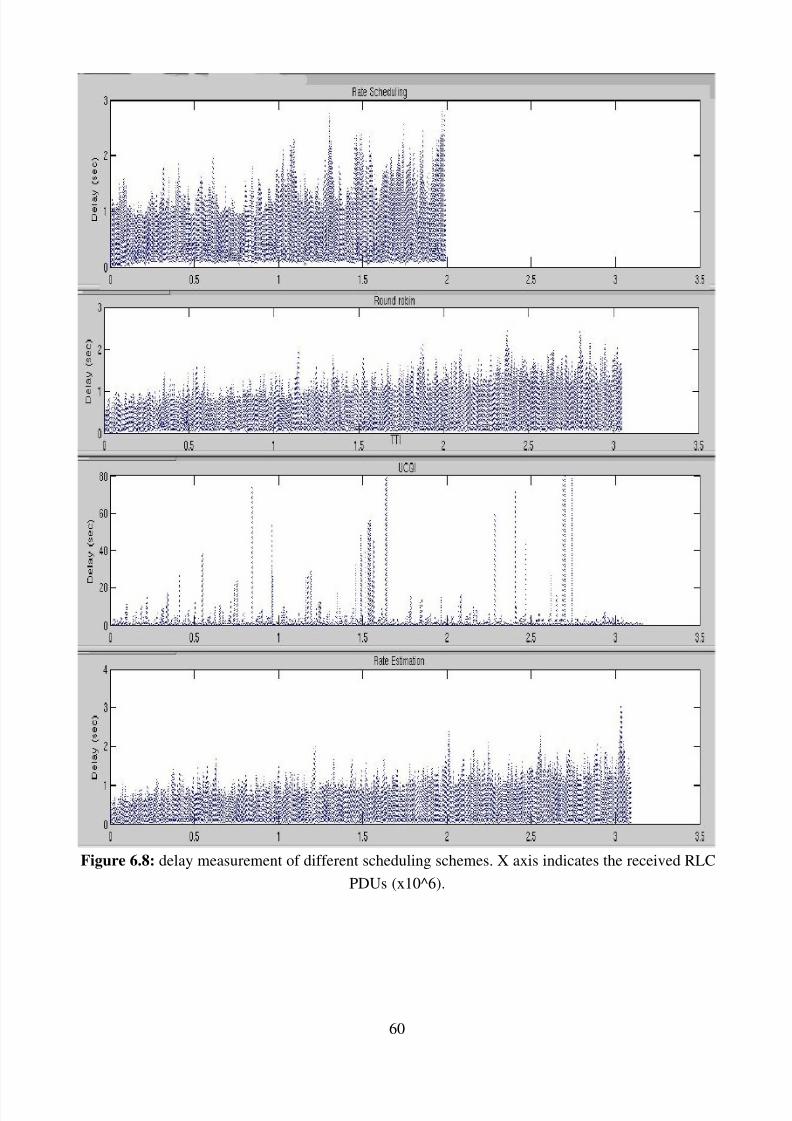
8/12/2019 WCDMA Enhanced UL Performance Evaluation.pdf
http://slidepdf.com/reader/full/wcdma-enhanced-ul-performance-evaluationpdf 62/80
Figure 6.8: delay measurement of different scheduling schemes. X axis indicates the received RLC
PDUs (x10^6).
60

8/12/2019 WCDMA Enhanced UL Performance Evaluation.pdf
http://slidepdf.com/reader/full/wcdma-enhanced-ul-performance-evaluationpdf 63/80
6.1.6 Total Transmitted ower1
The scheduling policies that rule the behavior of the different scheduler will have a big impact in
the performance regarding power consumption and interference generated to other cells. Measuring
the transmitted power of the UEs it is possible to get an overview of the impact of the differentschedulers in the power consumption and inter-cell interference.
Every TTI the power used by the UEs to transmit their data is measured. The total power (the
addition of the powers of all the UEs transmitting in the same TTI) is shown in figure 6.9. Table
6.3 show the average total power and standard deviation for the different schedulers.
The measurements are expressed in decibels so the most negative value implies a lower power
usage. As expected the UCQI based scheduler uses the lowest amount of power during the
simulation time since the users with best channel conditions will require less power to transmit
lager amounts of data. The other schedulers don’t take the channel condition into account so badchannel condition UEs will use more power to transmit their data. The Rate scheduling use the most
power since many users transmit their data at the same time causing more interference between
each other which means that they will need to transmit at higher power to reach their target Eb/No.
Also, the lower bit rates allocated in the Rate scheduler require a higher Eb/No and therefore a
higher power.
The Round Robin scheduler and the Rate estimation scheduler perform very similarly because in
both cases all the UEs will transmit in their corresponding turn in the round robin fashion regardless
if they require a high or a low power for their transmission. Since the Rate estimation scheduler
allocates resources to more than two users per TTI, depending if their rate estimation gives small
rates so that the remaining resources can be used by other users, the power used is a little higher
than the Round Robin scheduler. Nevertheless, the Rate Estimation scheduler have a gain in terms
of througput and delay compared to the Round Robin scheduler since the Rate Estimation scheduler
will not waste resource in UEs that can not use them.
In terms of power consumption the UEs will get benefit out of the UCQI scheduler. Basically, the
UEs that fall into bad condition because of the fading will not be scheduled for transmission
conserving their power during the bad conditions period and being scheduled for transmission
when their conditions get better. Also in the opposite way, when the fading contributes to the
correct reception of the data, the UCQI scheduler will schedule these UEs to transmit taking
advantage of the positive fading peak.
The low power usage of the UCQI scheduler also implies that on average the amount of
interference generated to other cell will be much lower than with the other schedulers. The whole
system will have a big gain in this aspect because receiving lower inter-cell interference will make
the UEs reach their Eb/No requirements with less power allowing them to transmit at higher rates
or save power.
61

8/12/2019 WCDMA Enhanced UL Performance Evaluation.pdf
http://slidepdf.com/reader/full/wcdma-enhanced-ul-performance-evaluationpdf 64/80
Table 6.3: Total transmitted power (dB) measurements of different scheduling schemes.
62
Mean Std Mean 95% C
!ate sc"ed#ling *3.59 2.5 *3.65 to *3.52
*5.46 3.$5 *5.536 to *5.3&
*9.5& .1 *9.&1$ to *9.35$*5.36 3.$4 *5.42 to *5.255
!o#d!obin
(C)!ate 'stim Sc"
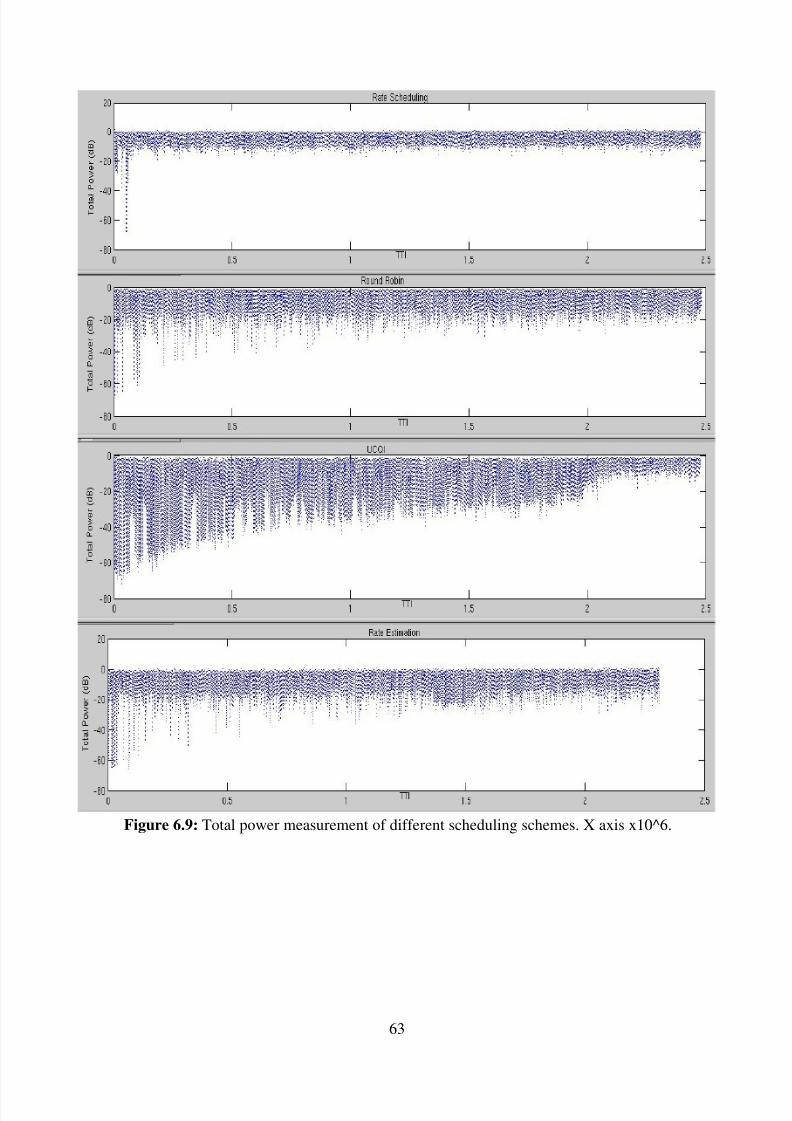
8/12/2019 WCDMA Enhanced UL Performance Evaluation.pdf
http://slidepdf.com/reader/full/wcdma-enhanced-ul-performance-evaluationpdf 65/80
Figure 6.9: Total power measurement of different scheduling schemes. X axis x10^6.
63
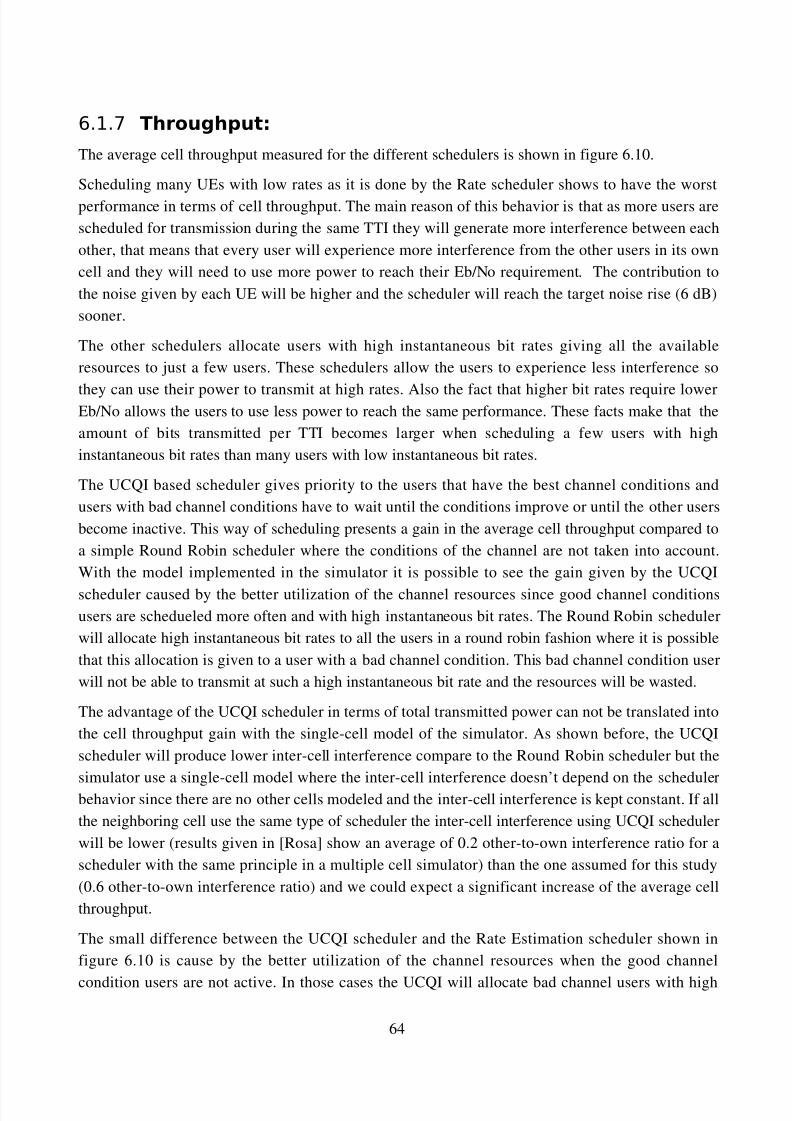
8/12/2019 WCDMA Enhanced UL Performance Evaluation.pdf
http://slidepdf.com/reader/full/wcdma-enhanced-ul-performance-evaluationpdf 66/80
6.1.% Throughput1
The average cell throughput measured for the different schedulers is shown in figure 6.10.
Scheduling many UEs with low rates as it is done by the Rate scheduler shows to have the worst
performance in terms of cell throughput. The main reason of this behavior is that as more users are
scheduled for transmission during the same TTI they will generate more interference between each
other, that means that every user will experience more interference from the other users in its own
cell and they will need to use more power to reach their Eb/No requirement. The contribution to
the noise given by each UE will be higher and the scheduler will reach the target noise rise (6 dB)
sooner.
The other schedulers allocate users with high instantaneous bit rates giving all the available
resources to just a few users. These schedulers allow the users to experience less interference so
they can use their power to transmit at high rates. Also the fact that higher bit rates require lowerEb/No allows the users to use less power to reach the same performance. These facts make that the
amount of bits transmitted per TTI becomes larger when scheduling a few users with high
instantaneous bit rates than many users with low instantaneous bit rates.
The UCQI based scheduler gives priority to the users that have the best channel conditions and
users with bad channel conditions have to wait until the conditions improve or until the other users
become inactive. This way of scheduling presents a gain in the average cell throughput compared to
a simple Round Robin scheduler where the conditions of the channel are not taken into account.
With the model implemented in the simulator it is possible to see the gain given by the UCQI
scheduler caused by the better utilization of the channel resources since good channel conditions
users are schedueled more often and with high instantaneous bit rates. The Round Robin scheduler
will allocate high instantaneous bit rates to all the users in a round robin fashion where it is possible
that this allocation is given to a user with a bad channel condition. This bad channel condition user
will not be able to transmit at such a high instantaneous bit rate and the resources will be wasted.
The advantage of the UCQI scheduler in terms of total transmitted power can not be translated into
the cell throughput gain with the single-cell model of the simulator. As shown before, the UCQI
scheduler will produce lower inter-cell interference compare to the Round Robin scheduler but the
simulator use a single-cell model where the inter-cell interference doesn’t depend on the scheduler
behavior since there are no other cells modeled and the inter-cell interference is kept constant. If all
the neighboring cell use the same type of scheduler the inter-cell interference using UCQI scheduler
will be lower (results given in [Rosa] show an average of 0.2 other-to-own interference ratio for a
scheduler with the same principle in a multiple cell simulator) than the one assumed for this study
(0.6 other-to-own interference ratio) and we could expect a significant increase of the average cell
throughput.
The small difference between the UCQI scheduler and the Rate Estimation scheduler shown in
figure 6.10 is cause by the better utilization of the channel resources when the good channel
condition users are not active. In those cases the UCQI will allocate bad channel users with high
64

8/12/2019 WCDMA Enhanced UL Performance Evaluation.pdf
http://slidepdf.com/reader/full/wcdma-enhanced-ul-performance-evaluationpdf 67/80

8/12/2019 WCDMA Enhanced UL Performance Evaluation.pdf
http://slidepdf.com/reader/full/wcdma-enhanced-ul-performance-evaluationpdf 68/80
The throughput of all the users are affected by their channel conditions but also by the scheduler
being used. Lets take user 14 as an example of a bad channel condition user and user 2 as a good
channel condition user. In the rate scheduling user 14 and user 2 don’t have a significant difference
compared to the difference in the UCQI based scheduler. Regardless of their channel conditions the
users in a Rate scheduling get similar small throughputs during the simulation. On the other hand,
users in a UCQI based scheduler get very high throughput measurements if they are in goodchannel conditions but very low throughput measurements if they have a bad channel condition.
In the Round Robin scheduler bad users are also affected by the fact that they have to wait for their
turn in the round robin fashion to transmit again while in the Rate scheduler they transmit more
often since they do it at the same time with many other users. But good users got benefit in the
Round Robin scheduler because when they receive a grant to transmit they can do it at a very high
instantaneous bit rate.
The Rate estimation schedule behaves in the same way as the Round Robin with a small gain given
by the better utilization of the resources caused by the prediction of the maximum rate that eachuser is able to support.
Table 6.5. Throughput measurements per UE in bits per second.
66
(ser !ate sc"ed#ling !o#d!obin !ate 'stim Sc" (C)1 59$41 53%63 56%6$ 432%52 614%9 116$$& 1313&1 1659$23 45341 3%26& 42125 &$&&4 66$36 1$5354 11193% 941925 3%93% 26%%4 291$1 9&136 52&14 92495 1$122$ 1513&6% 51$$& 1$34%9 114312 124$$3
& 456&3 %3$64 &5$43 &%1$49 62%6& &&2$3 %&116 6$55&1$ 4341% 56549 63&66 4%$4311 51219 1$6645 12%6$5 12392312 43621 41%3$ 44512 &26913 53$19 1$5155 124&&4 12996&14 35&61 2&414 295%& 542315 592&& 9133$ 1$4$12 1554&$16 5514$ 11312$ 112&11 1295461% 591$6 %1265 &%1$& 1$66391& 544&% 115$16 129&2% 11$%$519 4624& 55299 652&5 553362$ 594&& 1161$9 123&96 11652321 55436 41435 4692$ 246%922 59&3& 114594 12619& 11966&23 3564% 29665 323&& 969%24 &3&&2 1$4559 111%5$ 155242

8/12/2019 WCDMA Enhanced UL Performance Evaluation.pdf
http://slidepdf.com/reader/full/wcdma-enhanced-ul-performance-evaluationpdf 69/80
6.2 Scenario 2
During the simulations using this scenario 12 UEs are initialized in a random position within the
cell area. Each user transmits data according to the Pareto traffic model at 760kbps during burst
periods. The burst time and idle time of each UE is setup to 5 seconds.
Under the specified characteristics of this scenario different simulations were made using thedifferent implemented scheduling algorithms.
The simulation results using this scenario show concordance with the results with scenario 1. The
simulation results with lower amount of users but with a higher traffic load help us to ensure the
analysis of average cell throughput made for scenario 1. Figure 6.11 shows the results for the
average cell throughput for the different schedulers. A similar behavior compared to scenario 1 is
perceptible but with a small difference regarding the Rate estimation scheduler and the UCQI
scheduler. As explained for scenario 1 the difference between these two schedulers rises when the
good channel condition users are not active and the turn comes to the bad channel conditions to be
scheduled. In scenario 2 the high traffic implies that good channel conditions users will not have somuch idle periods during the simulation as in scenario 1 and the gain of the Rate estimation
scheduler will disappear in this case.
Figure 6.11: Average cell throughput for different schedulers. Scenario 2.
Table 6.6: Mean cell throughput and 95% CI
67
$
2$$
4$$
6$$
&$$
1$$$
12$$
14$$
16$$
1&$$
!ate sc"ed#ling
!o#d!obin
!ate 'stim Sc"
(C)
, " r o # g - # t . / b - s 0
Mean Mean 95% C
!ate sc"ed#ling 914 &9$ to 93&
1&$3 134 to 1&1
2$1$ 191 to 2$49
2$66 2$34 to 2$99
!o#d!obin
!ate 'stim Sc"(C)

8/12/2019 WCDMA Enhanced UL Performance Evaluation.pdf
http://slidepdf.com/reader/full/wcdma-enhanced-ul-performance-evaluationpdf 70/80
6.3 Scenario 3
During the simulations using this scenario 24 UEs are initialized in a random position within the
cell area. Each user transmits data in a constant bit rate at 64kbps. With a packet size of 2080 bytes
the MAC layer will receive bursts of 40 bytes every 26msec form the RLC layer.
The results of these simulations are governed by the particular and not very realistic parameters ofthis scenario.
Using this scenario with low traffic rates per UE the simulation results show a disadvantage of
using the UCQI scheduler. One of the reason for this behavior has to be with the fact that in the cell
area a bad condition user can still transmit a single packet of 40 bytes during one TTI. When the
traffic rate is very low there is not much difference, in terms of the amount of transmitted bits,
when scheduling a good or a bad user. When the good channel condition user is scheduled with
high instantaneous bit rate it will not use the resources since it just have a small amount of data in
its buffer. The bad channel condition user will not be able to transmit at a high rate because of its
power limitations but transmitting at a low rate it will be enough to transmit the small amount ofdata in its buffer. Because of this reason the UCQI and Round Robin scheduler will tend to perform
in a similar way.
Nevertheless, the results still show a small gain in the cell throughput of the Round Robin
compared to the UCQI scheduler. That behavior can also be attributed to the particular traffic
source. Good channel condition users in the Round Robin scheduler get some benefit because of the
peculiarity of the traffic source because while they wait for their scheduling turn more data arrives
to their buffer and they can make a single transmission at a high instantaneous bit rate rather than
many small transmission. The UCQI scheduler will keep scheduling good channel condition users
before their buffer gets bigger and they will only use the resources to transmit small amount of data
while the bad user accumulate data in their buffers but will still need many transmission since they
don’t have enough power capabilities to transmit lager amounts of data.
Table 6.7. Total transmitted power (dB) measurements for different scheduling schemes.
The gain of the UCQI regarding total transmitted power is still considerable in this scenario as
shown Table 6.7. This lower transmitted power implies lower interference generated to other cell.
With the model of the simulator is not possible to see that gain in terms of average cell throughput
but we should keep in mind that if the neighboring cell use also a UCQI scheduler the average cell
throughput of the UCQI scheduler will have a significant gain. Even if the neighboring cells use
68
Mean
!ate sc"ed#ling *3.41
!o#d!obin *5.&
!ate 'stim Sc" *6.5&
(C) *.&9

8/12/2019 WCDMA Enhanced UL Performance Evaluation.pdf
http://slidepdf.com/reader/full/wcdma-enhanced-ul-performance-evaluationpdf 71/80
another scheduler mechanism, the fact that they will receive lower inter-cell interference will allow
them to use less power which will also generate lower interference to other cells.
Figure 6.12: Average cell throughput for different schedulers. Scenario 3.
Table 6.8: Mean cell throughput and 95% CI
69
$
1$$
2$$
3$$
4$$
5$$
6$$
$$
&$$
9$$
1$$$
11$$
12$$
13$$
14$$
15$$
16$$
!ate sc"ed#ling
!o#d!obin
!ate 'stim Sc"
(C)
, " r o # g - # t . / b - s 0
Mean Mean 95% C
!ate sc"ed#ling 1311 13$$ to 13211553 153 to 156&
1551 153 to 1563
14 144 to 14&
!o#d!obin
!ate 'stim Sc"(C)

8/12/2019 WCDMA Enhanced UL Performance Evaluation.pdf
http://slidepdf.com/reader/full/wcdma-enhanced-ul-performance-evaluationpdf 72/80
6.4 Scenario 4
During the simulations using this scenario 24 UEs were initialized in a random position within the
cell area. Different traffic models are used and attached to the UEs. Eight UEs use the FTP traffic
model, eight UEs use the HTTP traffic model and eight UEs use a video traffic model.
Table 6.9 and figure 6.13 show some of the results. We can see that the Rate scheduling uses higher
power to transmit lower amount of data during the simulation time. On the other hand, the UCQI
uses lower power to transmit more data during the simulation. Without taking into account the
decrease of inter-cell interference, the UCQI scheduler shows an average cell-throughput similar to
the Round Robin scheduler but using less power.
In this scenario the video traffic source pumps bursts of data at regular intervals in a similar way
that the CBR traffic model. Since eight of the UEs use the video traffic source the results of the
different schedulers are determined mainly by this type of traffic. The average cell throughputresults in figure 6.13 are very similar to the ones obtain in scenario 3 using the CBR traffic model.
Table 6.9. Total transmitted power (dB) for different scheduling schemes.
Figure 6.13: Average cell throughput for different schedulers. Scenario 4.
70
Mean 95% C
!ate sc"ed#ling *.2 *.9& to *6.42
*1$.49 *1$.9& to *1$
*1$.6 *11.44 to *9.
*12.24 *12.&2 to *11.66
+riorit *11.$5 *11.94 to *1$.16
!o#d!obin
!ate 'stim Sc"
(C)
$
1$$
2$$
3$$
4$$
5$$
6$$
$$
&$$
9$$1$$$
11$$
12$$
13$$
14$$
15$$
!ate sc"ed#ling
!o#d!obin
!ate 'stim Sc"
(C)
+riorit
, " r o # g - # t . / b -
s 0

8/12/2019 WCDMA Enhanced UL Performance Evaluation.pdf
http://slidepdf.com/reader/full/wcdma-enhanced-ul-performance-evaluationpdf 73/80
Table 6.10: Mean cell throughput and 95% CI
6.5 Priority Scheduler
Having this combination of different flows is a more realistic scenario. It should be taken into
account that the different types of flows have different requirements. The FTP, for example, is not a
delay sensitive application so data being transmitted can wait longer stored in the buffers before its
transmission. More strict requirements have to be achieved while transmitting other types of flows
like video applications that are delay sensitive and the receiver is expecting the arrival of data
within a determine period of time. The scheduler used in the NodeB can affect the requirements of
those type of flows. For example the UCQI based scheduler will not allocate resources to a UE
using a video application and will give the resources to a FTP user which has a better channel
condition. Because of this reason it should be important to consider giving priorities to the differentflows.
Even doe it is not supported by the standards, an extra field was included in the header of the
Enhanced MAC in the simulator. This field carries information about the priority of the flow being
transmitted. With this information the scheduler can make a better decision to allocate resources to
the users with higher priority flows. A new scheduler was implemented modifying the UCQI
scheduler in a way that the sorting of the users depends on the new value for the priority included in
the header and not in the UCQI value.
Video application flows were ranked with the highest priority, the HTTP flows were ranked with a
lower priority and the lowest priority was given to the FTP flows. With this assignation of priorities
and the new scheduler, the video users will have the priority to be scheduled first and with the
highest allowed bit rate while FTP users will not be scheduled unless there are no high priority
users active.
Since this priority scheduler doesn’t consider the channel conditions, users with bad channel
conditions but with high priority will have the priority to be selected for transmission. Those bad
users are not able to transmit at a high rate and will use a high power to transmit small amounts of
data. This fact decrease the performance in terms of average cell throughput (see figure 6.13) and
total transmitted power (see table 6.9) but it will try to keep the quality of the service of the high
71
Mean 95% C
!ate sc"ed#ling &4 $ to &61
13& 13& to 1499
1366 1366 to 1545
1294 1294 to 1434
+riorit 1253 1253 to 1355
!o#d!obin
!ate 'stim Sc"
(C)

8/12/2019 WCDMA Enhanced UL Performance Evaluation.pdf
http://slidepdf.com/reader/full/wcdma-enhanced-ul-performance-evaluationpdf 74/80
priority users regardless of their channel conditions.
The average delay per user for the simulations done without changing the positioning seed are
given in table 6.11. The results show how the scheduler affects the delay experienced by each user.
As an example lets analyze user number 7 which on average experience good channel condition’s
and as a result it suffers a delay of 0.08sec when using the UCQI scheduler. The traffic flow of this
UE is of a FTP application which is not delay sensible and the resources used accomplishing such a
low delay could be used on more sensible traffic flows. User number 21 which on average
experience bad channel conditions suffers a high delay which will make the quality of its video
application unacceptable. If we compare the results of these two users in the UCQI scheduler and in
the Priority scheduler we can see that the FTP, beside having good channel conditions, experience a
higher delay since the FTP priority was established as the lowest priority and its UE will receive
lower amount of resources. The video application user, besides having a bad channel condition,
experience a lower delay in the Priority scheduler than in the UCQI since the video flow was
established as the highest priority. Figure 6.14 shows the comparison between this two users using
the UCQI and Priority scheduler. We can see the improvement in the PDF when a video flow with
bad channel condition use the priority scheduler instead of the UCQI scheduler and the the decline
of the PDF when a FTP flow with good channel conditions use these schedulers.
Table 6.11: Average delay (sec) experienced per user with different schedulers.
72
1 3.12 $.46 $.16 $.42 $.54
2 2.59 $.2 $.1& $.1 $.3
3 3.1 $.9 $.4 1 1.9 , 4 $.&5 $.13 $.12 $.1 $.23
+ 5 3.$3 $.14 $.2 $.1 $.4&
6 $.99 $.15 $.21 $.32 $.13
$.&3 $.1 $.$9 $.$& $.3&
& 3.19 $.1 $.23 $.3& $.34
9 1.5 $.12 $.1 $.11 $.46
1$ $.9 $.25 $.16 $.22 $.2
, 11 2.43 $.14 $.$& $.11 $.16
, 12 1.& $.2 $.51 $.2 $.5
+ 13 2.5 $.15 $.1 $.1 $.45
14 1.3 $.$& $.$& $.$5 $.$9
15 1.& $.$9 $.$9 $.1 $.1916 1.5 $.22 $.$& $.$6 $.12
1 2.9 $.46 $.13 $.52 $.15
1& 2.6 $.14 $.12 $.1 $.$&
19 3 $.3 $.21 $.&4 $.26
2$ 3.1 $.12 $.$& $.$& $.$
21 3.& $.& $.32 1.25 $.3
' 22 2.6 $.1 $.1 $.13 $.$&
23 3.$1 $.1 $.1 $.$5 $.$6
24 2.9 $.$9 $.$9 $.15 $.$&
('
!ate sc"ed#lingMean ela
!o#d!obinMean ela
!ate +edict Sc"Mean ela
(C) Meanela
+riortMean ela
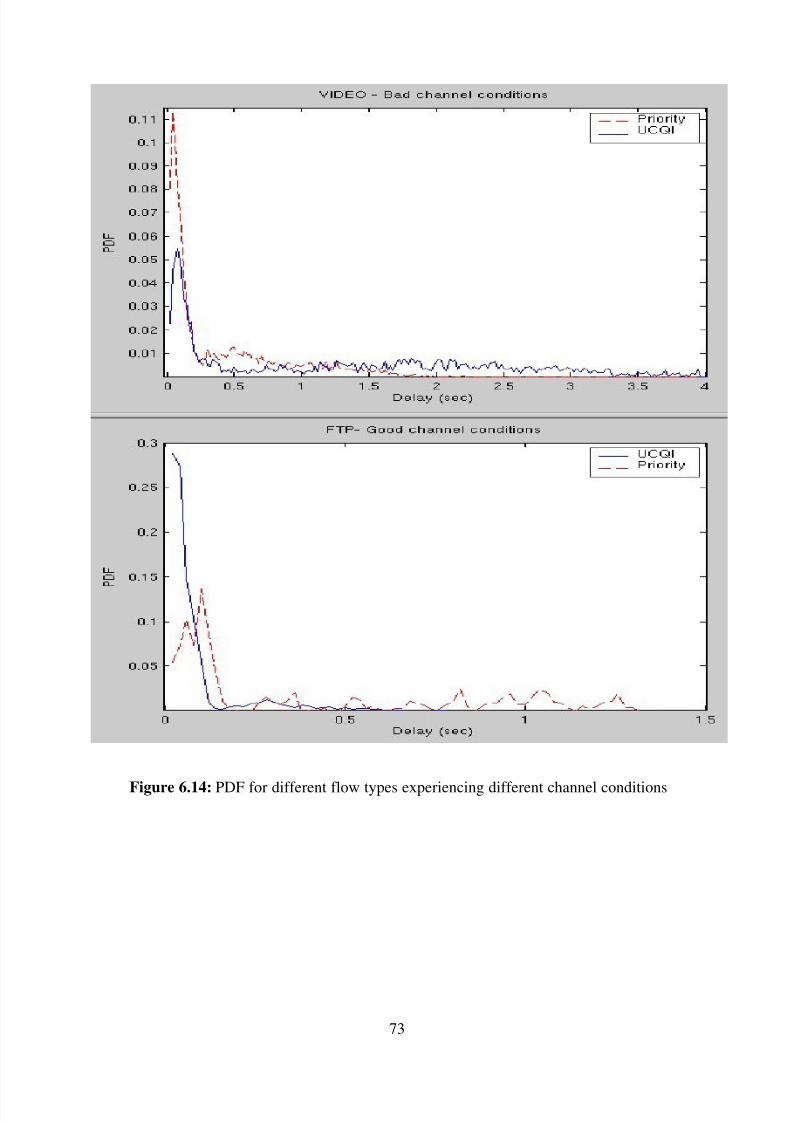
8/12/2019 WCDMA Enhanced UL Performance Evaluation.pdf
http://slidepdf.com/reader/full/wcdma-enhanced-ul-performance-evaluationpdf 75/80
Figure 6.14: PDF for different flow types experiencing different channel conditions
73

8/12/2019 WCDMA Enhanced UL Performance Evaluation.pdf
http://slidepdf.com/reader/full/wcdma-enhanced-ul-performance-evaluationpdf 76/80
6.6 %C$ and %C$ coparison
During this simulation study the conditions of Scenario 1 were repeated. 24 UEs were initialized in
a random position within the cell area. Each user transmitting data according to the Pareto traffic
model at 250kbps during burst periods. The mean burst time and mean idle time of each UE were
set to 5 seconds.
The aim of this simulation study is to compare and quantify the gain given by the enhancements
introduce by HSUPA. To be able to directly compare the two channels the TTI of 2ms of the E-
DCH was modified to 10ms since the DCH, as specified in Release 99, doesn't support 2ms TTI.
Also, the same scheduler mechanisms (Rate Scheduler) was used in the RNC for the DCH and in
the NodeB for the E-DCH. This scheduler doesn't take channel conditions into account so the gain
archived by the E-DCH in this simulation will be just given by the reduction in the scheduling delay
and by the rapid physical layer retransmission obtained with the HARQ technique.
The average cell throughput of the E-DCH and the DCH are shown in figure 6.15 where we can seea significant gain of 17%. As shown in the simulation results using different types of schedulers at
the NodeB, extra gain can be obtained when including channel conditions into account in the
scheduling mechanism and when using this information to estimate the amount of resources
(maximum rate) that a UE is able to support.
Table 6.12: Mean cell throughput (Kbps) and 95% CI
Figure 6.15: DCH and E-DCH average cell throughput.
74
Mean 95% C6&2 646 to 19& 91 to &$5
C
'*C
$
5$
1$$
15$
2$$
25$
3$$
35$
4$$
45$
5$$
55$
6$$
65$
%$$
%5$
&$$
C
'*C
, " r o # g - # t . / b - s 0

8/12/2019 WCDMA Enhanced UL Performance Evaluation.pdf
http://slidepdf.com/reader/full/wcdma-enhanced-ul-performance-evaluationpdf 77/80

8/12/2019 WCDMA Enhanced UL Performance Evaluation.pdf
http://slidepdf.com/reader/full/wcdma-enhanced-ul-performance-evaluationpdf 78/80
lower amount of interference is generated to other cells.
The Rate Estimation scheduler focus our attention in another aspect of the scheduler mechanisms.
This scheduler is not concern in giving any priorities to the users so it also grants all the users in a
round robin fashion but this time the assignation of bit rates is done considering the channel
conditions of each user. Each user is assigned with a corresponding bit rate related to its channel
condition so that the resources are not wasted in users that are not able to use them. The better
utilization of the channel of the Rate Estimation scheduler is reflected in the simulation results
achieving higher average cell throughput, using less power, achieving higher throughput per user
and lower delays. Regardless of the policies use to select which users should have the priority to
transmit, the rate estimation should be implemented so no resources are wasted in allocations to
users that are not able to support them.
The results also show that the different scheduling mechanisms can affect the quality of the service
experienced by applications. This lead to include priority assignation to the different types of flowsso that the scheduler could take this information into consideration when allocating resources. Even
doe the transmission of this type of priority information from the UE to the NodeB is not supported
by the standards it was included in the simulation for the purpose of the study. The results of the
simulations show that including priority to the different types of flows can improve the service
provided to high priority flows even when they experience a bad channel condition. Low priority
flows (which are assign to applications which doesn’t have strict requirements) are affected by the
scheduler mechanism but the quality will not be drastically affected since these types of
applications can afford a decrease in their rate or an increase of their transmission delay without
major impact in the quality experienced by the user. Adding signaling for priority differentiation ofthe flows give the scheduler more control for managing the quality and throughput balance.
76

8/12/2019 WCDMA Enhanced UL Performance Evaluation.pdf
http://slidepdf.com/reader/full/wcdma-enhanced-ul-performance-evaluationpdf 79/80
0ibliograph*
[1] 3GPP TR 25.896 v6; Feasibility Study for Enhanced Uplink for UTRA FDD.
[2] 3GPP TS 25.101 User Equipment (UE) radio transmission and reception (FDD) Release 7
[3] 3GPP TS 25.133 Requirements for support of radio resource management (FDD) Release 7
[4] 3GPP TS 25.211 V6.2.0 Release 6. Physical channels and mapping of transport channels
onto physical channels (FDD).
[5] 3GPP TS 25.212 Multiplexing and channel coding (FDD) (Release 6)
[6] 3GPP TS 25.213 Spreading and modulation (FDD) (Release 6)
[7] 3GPP TS 25.214 Physical layer procedures (FDD) (Release 6)
[8] 3GPP TS 25.215 Physical layer – Measurements (FDD) (Release 6)
[9] 3GPP TS 25.302 Services provided by the physical layer (Release 6)
[10] 3GPP TS 25.306 UE Radio Access capabilities (Release 6)
[11] 3GPP TS 25.309 v6.1.0; FDD Enhanced Uplink; Overall description.
[12] 3GPP TS 25.321 v6.5.0; Medium Access Contrl (MAC) protocol specification (Release 6).
[13] 3GPP TS 25.808 v1.1.1. Release 6. FDD Enhanced Uplink; Physical Layer Aspects.
[14] Bertinelli Massimo, Malkamaki Esa. HARQ for WCDMA Enhanced Uplik: Link Level
Performance In SHO. Nokia Research Center. Nokia Group, Helsinki Finland.
[15] Carnero Jose. Ph.D. Thesis. Uplink Capacit Enhancement in WCDMA; Multi Cell
Admission Control, Synchronised Schemes and Fast Packet Scheduling. Aalborg University,
Denmark, March 2004.
[16] Cosme Hurtado Andres Felipe. Master Thesis. UMTS Capacity simultion study. Universty
of Twente. Netherlands, October 2005.
[17] Federiksen Frank, Kolding Emil Troel. Performance and Modeling of WCDMA/HSDPA
Transmission/H-ARQ Schemes. Nokia Networks, Aalborg R&D, Denmark.
[18] Hamalainen Seppo. WCDMA Radio Network Performance. University of Jyvaskyla. 2003
[19] Holma Harry. A Study of UMTS Terrestrial Radio Access Performance. Helsinki
University. 2003.
[20] Holma Harri, Toskala Antti; WCDMA for UMTS, Radio access for third generation mobile
communications, third edition.
[21] I. De Bruin, G. Heijenk, M. El Zarki, L. Zan, “Fair Channel-Dependent Scheduling in
CDMA Systems”, Proceedings IST Mobile & Wireless Communications Summit 2003, Aveiro,
77

8/12/2019 WCDMA Enhanced UL Performance Evaluation.pdf
http://slidepdf.com/reader/full/wcdma-enhanced-ul-performance-evaluationpdf 80/80
Portugal, June 15-18, 2003, pp. 737 – 741.
[22] R1-041134, On Time Duration for Scheduling [23] R1-050087. EUL timing and the number
of HARQ processes.
[24] Ratasuk Rapeepat, Ghosh Amitava, Brown Tyler, Love Robert, Xiao Weimin. Predicting
Link Level Performance for Enhance Uplink.[25] Rosa Claudio. Ph.D. Thesis. Enhanced Uplink Packet Access in WCDMA; Combined
Performance of Advanced Packet Scheduling Techniques, Fast L1 HARQ, Interference Cancelation
and 4-Branch Atenna Diversity. Aalborg University, Denmark, December 2004.
[26] Seacorn Deliverable D3.2v2. End-to-end network model for Enhanced UMTS. October
2003.
[27] Srinivasulu Reddy Mule; Uplink Packet Scheduling Enhancements in High Speed Uplink
Packet Access (HSUPA): An evolution of 3G WCDMA Systems. Aalborg University.
[28] Tero Ojanpera, Ramjee Prasad. WCDMA: Towards IP Mobility and Mobile Internet
[29] F. Brouwer, Performance Analysis and Allocation Strategy for the WCDMA Second
Scrambling Code, IFIP-TC6 Ninth International Conference on Personal Wireless
Communications, Delft, 2004.