Embed Size (px)
Citation preview
WB/BM-74
U. S. DEPARTMENT OF COMMERCEMaurice H. Stans, Secretary
ENVIRONMENTAL SCIENCE SERVICES ADMINISTRATIONRobert M. White, AdministratorENVIRONMENTAL DATA SERVICE
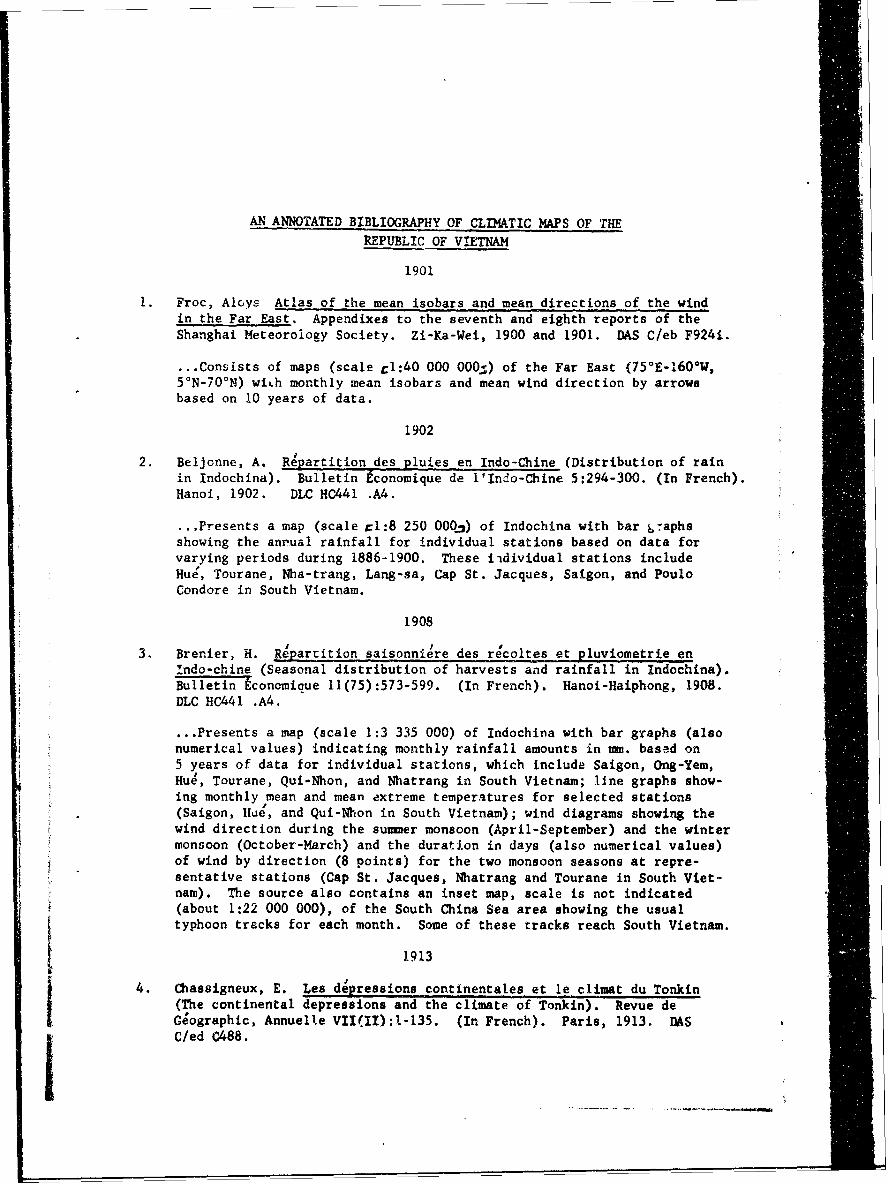
AN ANNOTATED BIBLIOGRAPHY OF CLIMATIC MAPS OF THE
REPUBLIC OF VIETNAM
j,. AtOF Co 4
Silver Spring, MarylandFebruary 1969
*j4 q0
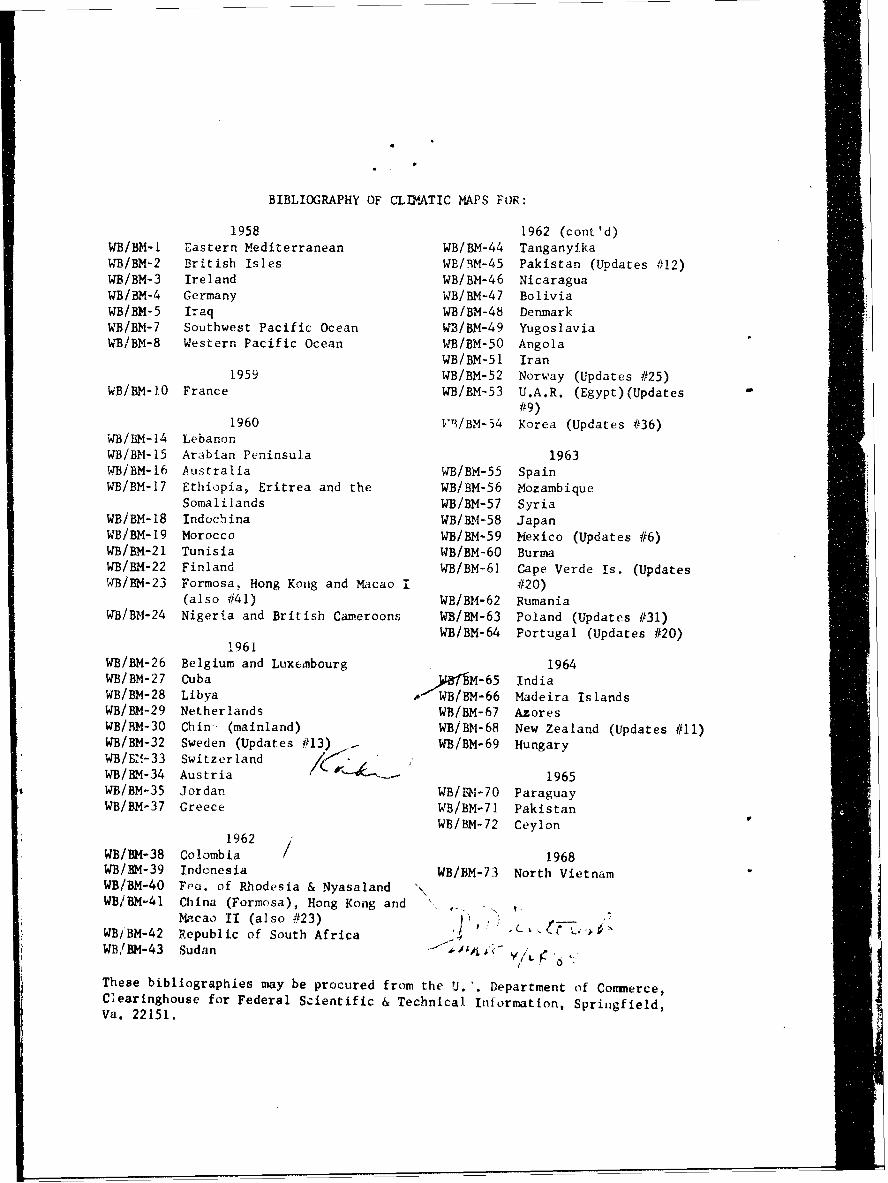
BIBLIOGRAPHY OF CLIMATIC MAPS FOR:
1958 1962 (cont'd)WB/BM-l Eastern Mediterranean WB/BM-44 Tanganyika6B/BM-2 British Isles WE/RM-45 Pakistan (Updates #12)WB/BM-3 Ireland WB!BM-46 NicaraguaWB/BM-4 Germany WB/BM-47 BoliviaWB/BM-5 Iraq WB/BM-48 DenmarkWB/BM-7 Southwest Pacific Ocean WB/BM-49 YugoslaviaWB/BM-8 Western Pacific Ocean WB/BM-50 Angola
WB/BM-51 Iran1959 WB/BM-52 Norway (Updates #25)
WB/BM-1O France WB/BM-53 U.A.R. (Egypt)(Updates
#9)1960 VT/BM-54 Korea (Updates #36)
WB/BM-14 Lebanon
WB/BM-15 Arabian Peninsula 1963WB/BM-16 Australia WB/BM-55 SpainWB/BM-17 Ethiopia, Eritrea and the WB/BM-56 Mozambique
Somalilands WB/BM-57 Syria
WB/BM-18 Indochina WB/BM-58 Japan!B/BM-19 Morocco WB/BM-59 Mexico (Updates #6)
WB/BM-21 Tunisia WB/BM-60 BurmaWB/BM-22 Finland WB/BM-61 Cape Verde Is. (Updates
WB/BM-23 Formosa, Hong Kong and Macao i #20)(also #41) WB/BM-62 Rumania
WB/BM-24 Nigeria and British Cameroons WB/BM-63 Poland (Updates #31)
WB/BM-64 Portugal (Updates #20)1961
WB/BM-26 Belgium and Luxembourg 1964WB/BM-27 Cuba yWttM-65 IndiaWB/BM-28 Libya 4""WB/BM-66 Madeira IslandsWB/BM-29 Netherlands WB/BM-67 AzoresWB/RM-30 Chin (mainland) WB/BM-68 New Zealand (Updates #11)WB/BM-32 Sweden (Updates #13) WB/BM-69 HungaryWB/E,1-33 SwitzerlandWB/BM-34 Austria 1965WB/BM-35 Jordan WB/B-70 ParaguayWB/BM-37 Greece WB/BM-71 Pakistan
WB/BM-72 Ceylon
1962WB/BM-38 Colombia / 1968WB/BM-39 Indonesia WB/BM-73 North VietnamWB/BM-40 Fea. of Rhodesia & Nyasaland \WB/BM-41 China (Formosa), Hong Kong and
Macao II (also #23)WBiBM-42 Republic of South AfricaWB/BM-43 Sudan bA<' s( Y/L 6
These bibliographies may be procured from the U.'. Department of Commerce,Clearinghouse for Federal Scientific & Technical Information, Springfield,Va. 22151.
U. S. DEPARTMENT OF COMMERCEMaurice H. Stans, Secretary
ENVIRONMENTAL SCIENCE SERVICES ADMINISTRATIONRobert M. White, Administrator
ENVIRONMENTAL DATA SERVICE
AN ANNOTATED BIBLIOGRAPHY OF CLIMATIC MAPS OF THE
REPUBLIC OF VIETNAM
ByAnnie E. Grimes
Atmospheric Sciences Library
&
Silver Spring, MarylandFebruary 1969
ii
UDC 551-582.3:912:016(59)(597-3)
551.5 lb*oralogy.582.CUMMImtic maps and charts
912 )bps.* atlaes,p @ee016. Bib11op'~s~t(59) Southeast Asia - XM~cblna(597-3) flep'lic or vietnam
' iii
I
TABLE OF CONTENTS
Page
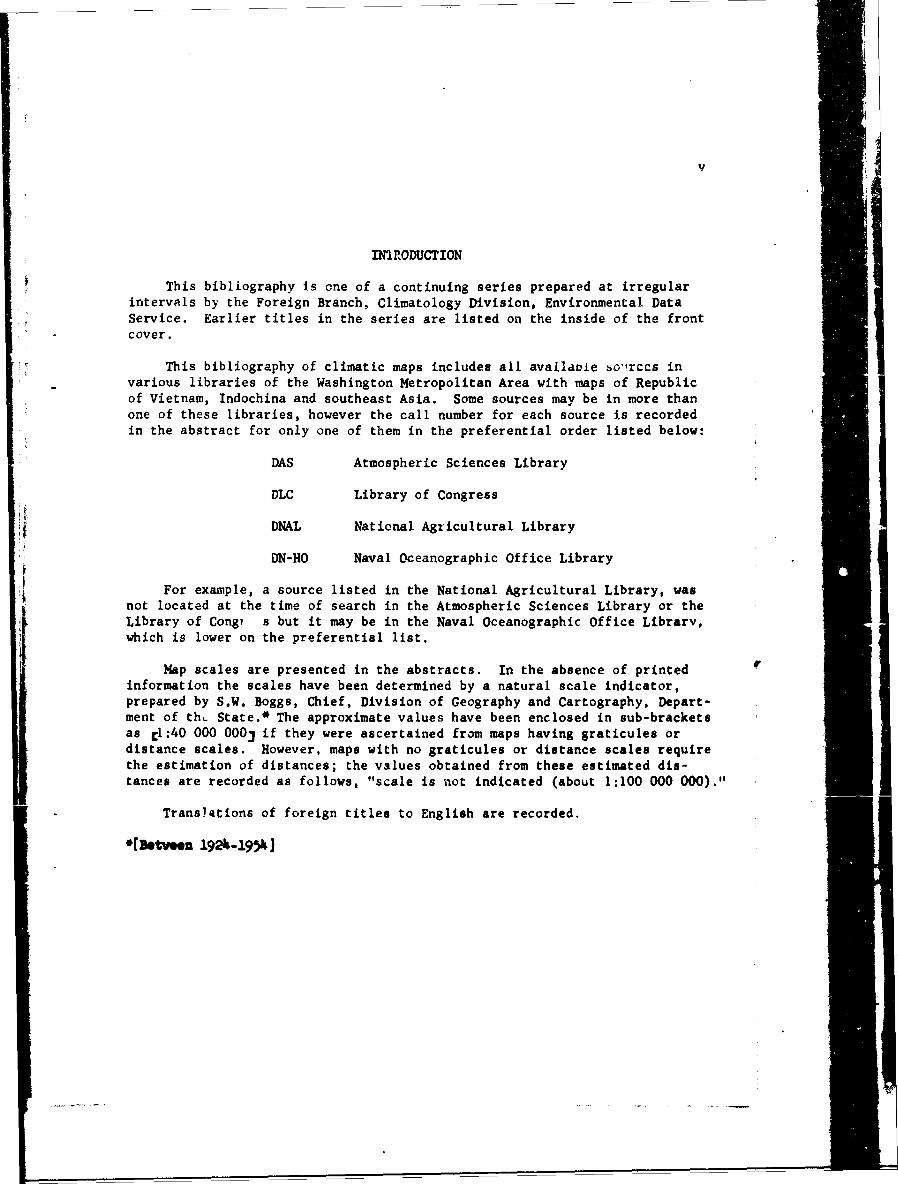
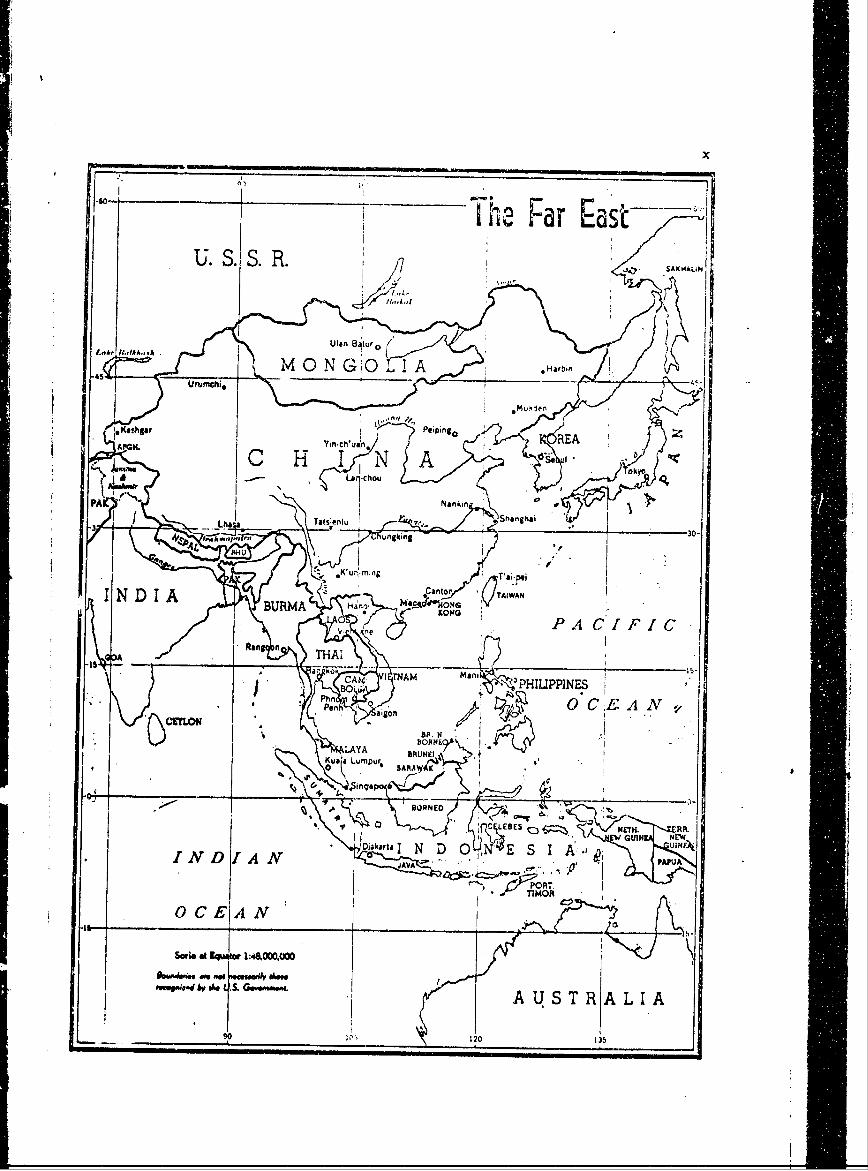
I. Introduction vII. Map of South Vietnam vii
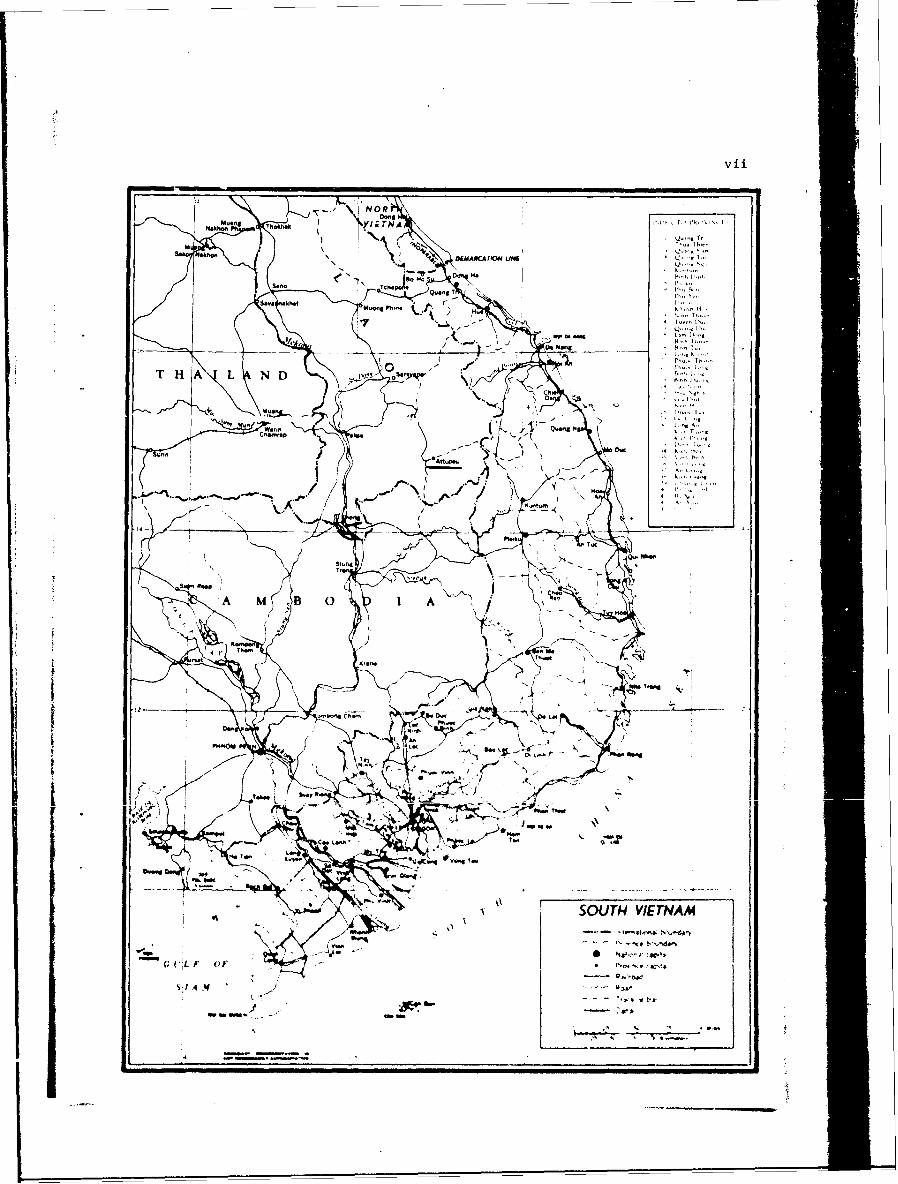
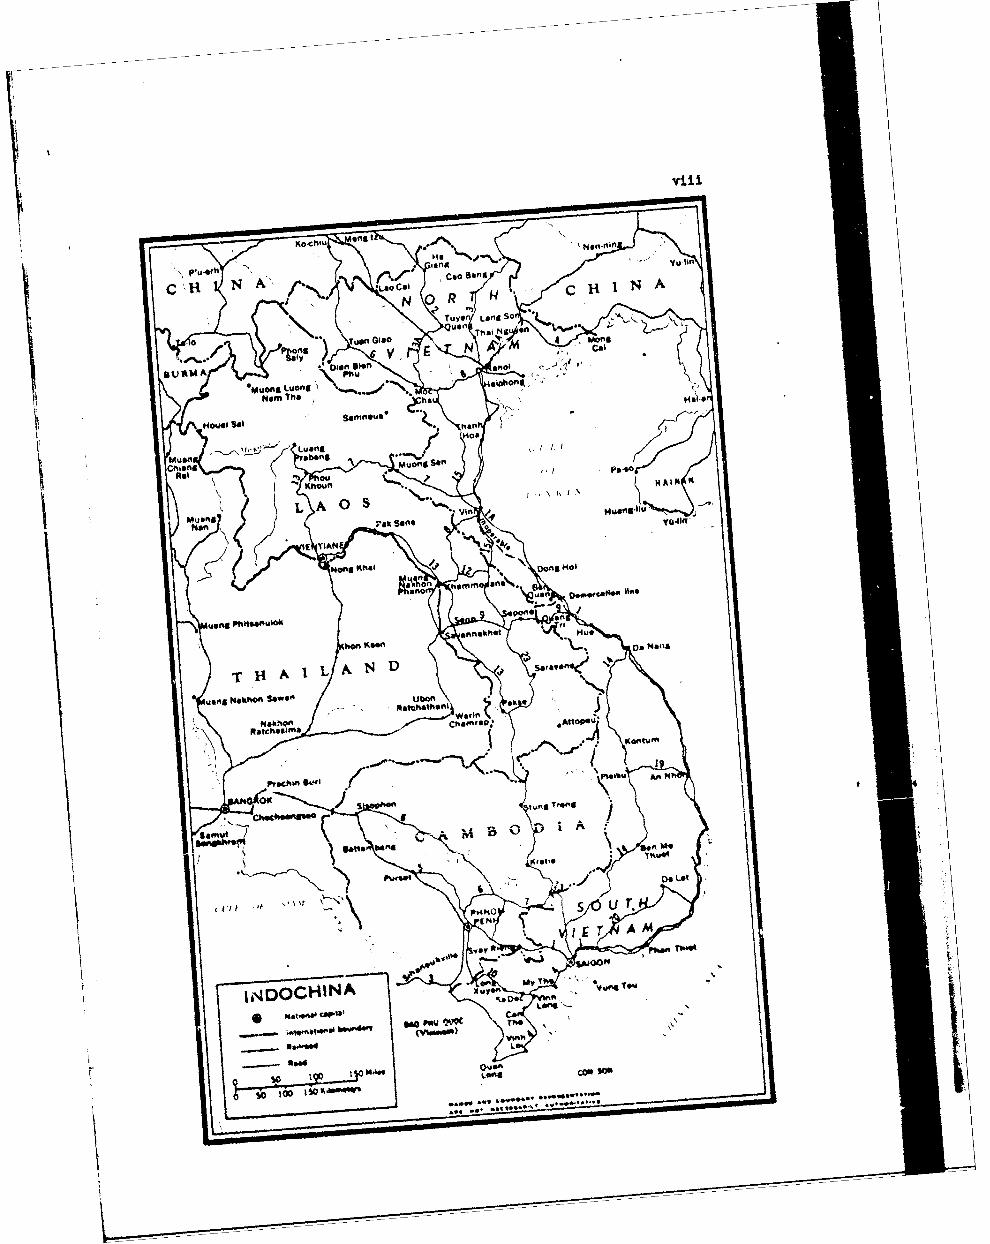
III. Map of Indochina viiiIV. Map of Southeast Asia ixV. Map of the Far East xVI. Sources with abstracts 1-37
VII. Author Index 39-41VIII. Subject Heading Index 43-46
V
INIRODUCTION
This bibliography is one of a continuing series prepared at irregularintervals by the Foreign Branch, Climatology Division, Environmental DataService. Earlier titles in the series are listed on the inside of the front
* - cover.
This bibliography of climatic maps includes all availavie bo'rccs in
various libraries of the Washington Metropolitan Area with maps of Republicof Vietnam, Indochina and southeast Asia. Some sources may be in more thanone of these libraries, however the call number for each source is recordedin the abstract for only one of them in the preferential order listed below:
DAS Atmospheric Sciences Library
DLC Library of Congress
DNAL National Agricultural Library
DN-HO Naval Oceanographic Office Library
For example, a source listed in the National Agricultural Library, wasnot located at the time of search in the Atmospheric Sciences Library or theLibrary of Cong7 s but it may be in the Naval Oceanographic Office Library,which is lower on the preferential list.
Map scales are presented in the abstracts. In the absence of printedinformation the scales have been determined by a natural scale indicator,prepared by S.W. Boggs, Chief, Division of Geography and Cartography, Depart-ment of th, State.* The approximate values have been enclosed in sub-bracketsas C1: 4 0 000 000j if they were ascertained from maps having graticules ordistance scales. However, maps with no graticules or distance scales requirethe estimation of distances; the values obtained from these estimated dis-tances are recorded as follows, "scale is not indicated (about 1:100 000 000)."
Translations of foreign titles to English are recorded.
*[Brtv.n 1924-19541
vii
NOR
N~~hho.h. Th-oh. -
'Vo DEMACArOO UNI
Me'h I'
Do Na.,g F" T
THA L N D ~*
V D.
wN ).n Mae T-,-
M, 0
/4
4 Th-
K % A M ~B ~\.14
se '
SOUTH4 VIETNAM
- v If ',
GCIL 1 F of
~I4'4 eve
viii
an& tKo hiu I Non-film
"a4snot yu It"
Coo someA' r- : A#Lao cR
TuY* Lane SOquan Th 16-wo,
T Gis* Mons
V N Cal
v it U A *Muong LuongMom Ths he
sam"ous" e.
No"I Sol il., han
01 HO&
Luang JMus" Ong SanCht no
fX K h cou'jn to tiAlh 14
yo41ff"Man
7"' Sane11 TIAN
Meng Khal Dome "a)
0 0 h*r"r"uark Dow""w0jo. Hoo
9 Parisuong Phft@Au$" fi
,"nekhOt Hu*hen KW 00 Mail&
A L A N D
usms Nakhon S-06" U a Ikk 0Itaftwhon'
Wall$,Mak" Chornr$P: Aftop
Pro Chin 900 MAIM Am Nli
10K wrts
Ufft
we go"Pt Ito
00 Lot
U T
A MOYO TW4
owl; THN A XwIlon -b-4 Doc q"4 D song'
plowAl M QkW Tfto
*vw"d L
Road
so Los%*
so
............... ..... ..... ..... ..... ..... ..... ..... ..... ..... ..... ..... ..........
...........................
ix
-l. - V
A of _!IN D
Cl4-
Ike"-
S-M
V-4 ft f-*..a.".. ~~* 0
a- --
-i
A Aw
9-0
x
T ha Far past- -1
Lumkur SAIkh-h
M 0 N G1 161AHr-
ModenA
OCEepinN ___ __ _
C H.dnf N A~ .A../k
' 120 10
AN ANNOTATED BIBLIOGRAPHY OF CLIMATIC MAPS OF THE
REPUBLIC OF VIETNAM
1901
1. Froc, Aloys Atlas of the mean isobars and mean directions of the windin the Far East. Appendixes to the seventh and eighth reports of theShanghai Meteorology Society. Zi-Ka-Wei, 1900 and 1901. DAS C/eb F9241.
...Consists of maps (scale cl:4 0 000 000;) of the Far East (75°E-160°W,5°N-70°N) wiLh monthly mean isobars and mean wind direction by arrowsbased on 10 years of data.
1902
2. Beljonne, A. Repartition des pluies en Indo-Chine (Distribution of rainin Indochina). Bulletin Economique de l'Indo-Chine 5:294-300. (In French).Hanoi, 1902. DLC HC441 .A4.
...Presents a map (scale r1:8 250 000,) of Indochina with bar &-aphsshowing the anrual rainfall for individual stations based on data forvarying periods during 1886-1900. These iidividual stations includeHue, Tourane, Nha-trang, Lang-sa, Cap St. Jacques, Saigon, and PouloCondore in South Vietnam.
1908
3. Brenier, H. Repartition saisonniere des recoltes et pluviometrie enIndo-chine (Seasonal distribution of harvests and rainfall in Indochina).Bulletin tconomique 11(75):573-599. (In French). Hanoi-Haiphong, 1908.DLC HC441 .A4.
...Presents a map (scale 1:3 335 000) of Indochina with bar graphs (alsonumerical values) indicating monthly rainfall amounts in mm. based on5 years of data for individual stations, which include Saigon, Ong-Yem,Hu , Tourane, Qui-Nhon, and Nhatrang in South Vietnam; line graphs show-
T ing monthly mean and mean extreme temperatures for selected stations(Saigon, llue, and Qui-Nhon in South Vietnam); wind diagrams showing thewind direction during the summer monsoon (April-September) and the wintermonsoon (October-March) and the duration in days (also numerical values)of wind by direction (8 points) for the two monsoon seasons at repre-sentative stations (Cap St. Jacques, Nhatrang and Tourane in South Viet-nam). The source also contains an inset map, scale is not indicated(about 1:22 000 000), of the South China Sea area showing the usualtyphoon tracks for each month. Some of these tracks reach South Vietnam.
1913
4. Chassigneux, E. Les depressions continentales et le climat du Tonkin(The continental depressions and the climate of Tonkin). Revue deGeographic, Annuelle VII(II):1-135. (In French). Paris, 1913. DASC/ed C488.
2
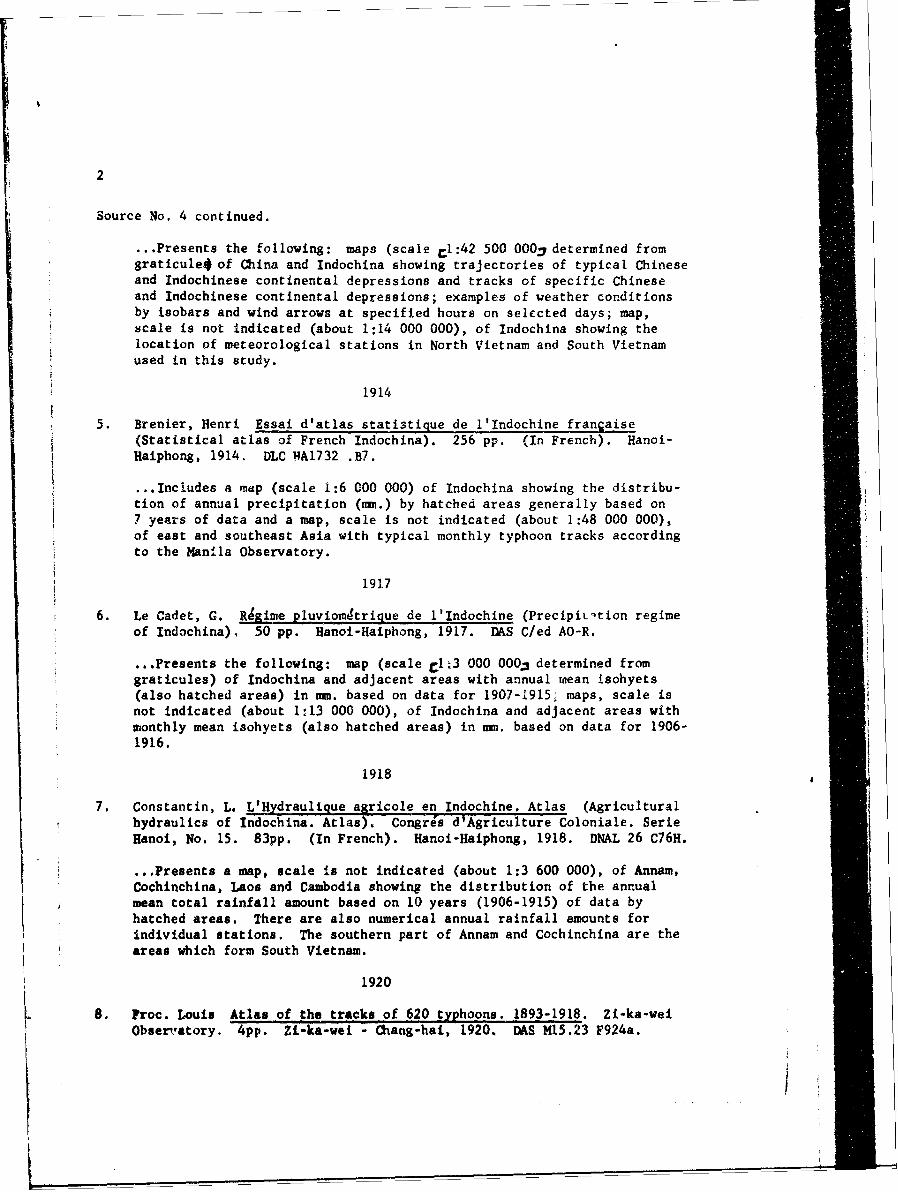
Source No. 4 continued.
...Presents the following: maps (scale rl: 42 500 0002 determined fromgraticule* of China and Indochina showing trajectories of typical Chineseand Indochinese continental depressions and tracks of specific Chineseand Indochinese continental depressions; examples of weather conditionsby isobars and wind arrows at specified hours on selccted days; map,scale is not indicated (about 1:14 000 000), of Indochina showing thelocation of meteorological stations in North Vietnam and South Vietnamused in this study.
1914
5. Brenier, Henri Essai d'atlas statistique de l'Indochine franjaise(Statistical atlas of French Indochina). 256 pp. (In French). Hanoi-Haiphong, 1914. DLC VA1732 .B7.
...Includes a map (scale 1:6 000 000) of Indochina showing the distribu-tion of annual precipitation (mm.) by hatched areas generally based on7 years of data and a map, scale is not indicated (about 1:48 000 000),of east and southeast Asia with typical monthly typhoon tracks accordingto the Manila Observatory.
1917
6. Le Cadet, G. R~gime pluviom4trigue de l'Indochine (PrecipiL'tion regimeof Indochina). 50 pp. Hanoi-Haiphong, 1917. DAS C/ed AO-R.
...Presents the following: map (scale rl3 000 000. determined fromgraticules) of Indochina and adjacent areas with annual mean isohyets(also hatched areas) in mn. based on data for 1907-1915, maps, scale isnot indicated (about 1:13 000 000), of Indochina and adjacent areas withmonthly mean isohyets (also hatched areas) in mm. based on data for 1906-1916.
1918
7. Constantin, L. L'Hydraulique agricole en Indochine. Atlas (Agriculturalhydraulics of Indochina. Atlas). Congris d'Agriculture Coloniale. SerieHanoi, No. 15. 83pp. (In French). Hanoi-Haiphong, 1918. DNAL 26 C76H.
...Presents a map, scale is not indicated (about 1:3 600 000), of Annam,Cochinchina, Laos and Cambodia showing the distribution of the annualmean total rainfall amount based on 10 years (1906-1915) of data byhatched areas. There are also numerical annual rainfall amounts forindividual stations. The southern part of Annam and Cochinchina are theareas which form South Vietnam.
1920
8. Froc. Louis Atlas of the tracks of 620 typhoons. 1893-1918. Zi-ka-weiObservatory. 4pp. Zi-ka-wel - hang-hai, 1920. DAS M15.23 F924a.
Ii
3
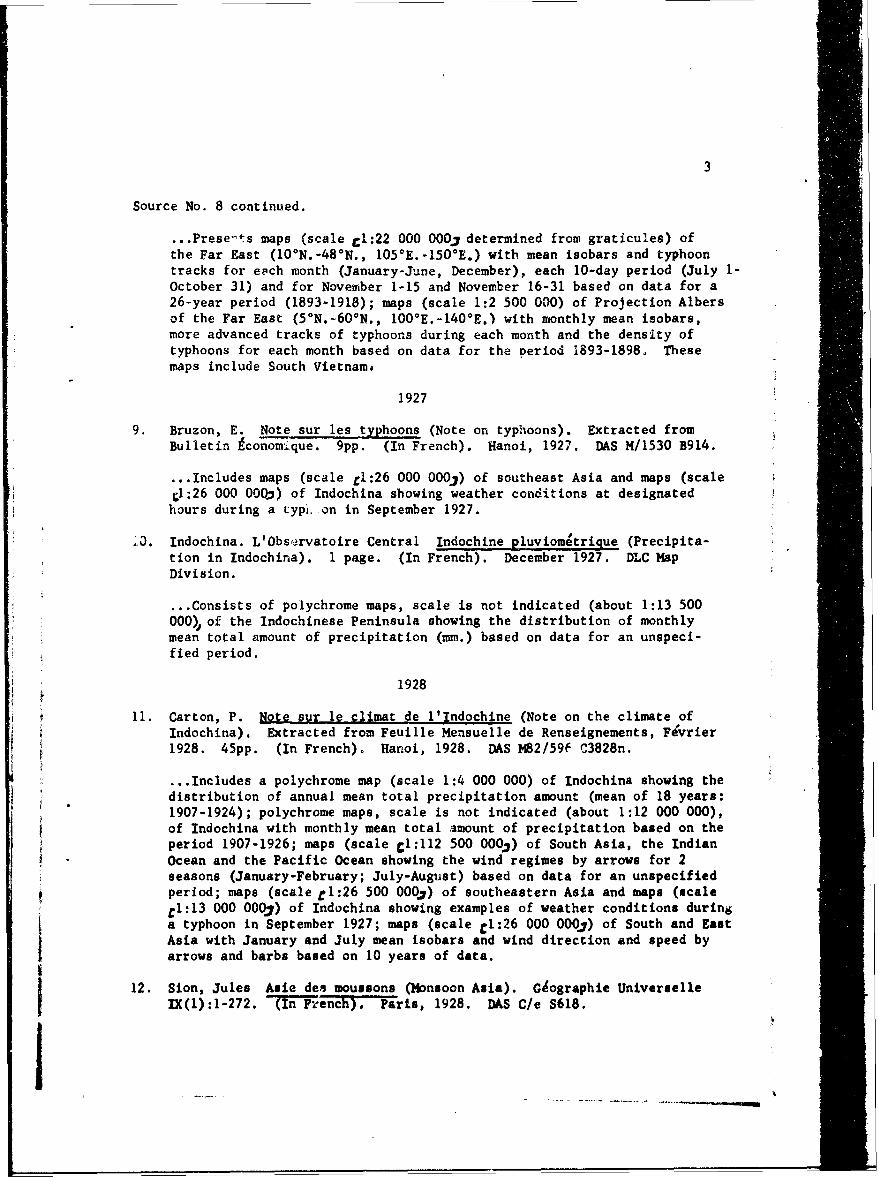
Source No. 8 continued.
...Prese-ts maps (scale C1:22 000 000. determined from graticules) ofthe Far East (10°N.-480N., 105 0E.-150°E.) with mean isobars and typhoontracks for each month (January-June, December), each 10-day period (July 1-October 31) and for November 1-15 and November 16-31 based on data for a26-year period (1893-1918); maps (scale 1:2 500 000) of Projection Albersof the Far East (50N.-60 0N., 100°E.-140°E.) with monthly mean isobars,more advanced tracks of typhoons during each month and the density oftyphoons for each month based on data for the period 1893-1898. Thesemaps include South Vietnam,
1927
9. Bruzon, E. Note sur les typhoons (Note on typhoons). Extracted fromBulletin conomi.que. 9pp. (In French). Hanoi, 1927. DAS M/1530 B914.
...Includes maps (scale rl:26 000 0003) of southeast Asia and maps (scaleC1:26 000 00QO ) of Indochina showing weather conditions at designatedhours during a typi. on in September 1927.
3. Indochina. L'Observatoire Central Indochine pluviometrigue (Precipita-tion in Indochina). 1 page. (In French). December 1927. DLC MapDivision.
...Consists of polychrome maps, scale is not indicated (about 1:13 500000). of the Indochinese Peninsula showing the distribution of monthlymean total amount of precipitation (mm.) based on data for an unspeci-fied period.
1928
11. Carton, P. Note sur le climat de l'Indochine (Note on the climate ofIndochina). Extracted from Feuille Mensuelle de Renseignements, Fevrier1928. 45pp. (In French). Hanoi, 1928. DAS M82/59f 03828n.
...Includes a polychrome map (scale 1:4 000 000) of Indochina showing thedistribution of annual mean total precipitation amount (mean of 18 years:1907-1924); polychrome maps, scale is not indicated (about 1:12 000 000),
of Indochina with monthly mean total amount of precipitation based on theperiod 1907-1926; maps (scale Cl: 112 500 0003) of South Asia, the IndianOcean and the Pacific Ocean showing the wind regimes by arrows for 2
seasons (January-February; July-August) based on data for an unspecifiedperiod; maps (scale o1:26 500 000) of southeastern Asia and maps (scalerl:1 3 000 0007) of Indochina showing examples of weather conditions duringa typhoon in September 1927; maps (scale Cl: 26 000 000j) of South and EastAsia with January and July mean isobars and wind direction and speed byarrows and barbs based on 10 years of data.
12. Sion, Jules Asie des moussons (Monsoon Asia). G4ographie UniverselleIX(l):l-272. (In French). Paris, 1928. DAS C/e S618.
IIIIII
4
Source No. 12 continued.
...Includes the following for Monsoon Asia (India, Pakistan, Burma,Thailand, Cambodia, Laos, North Vietnam, South Vietnam, China, Korea,Japan, Taiwan, the Philippine Islands, Java, Sumatra, Borneo and theCelebes): maps (scale 1:55 000 000) with mean isobars (mm.) and windby arrows for January and June, annual mean total rainfall amount (mm.)by hatched areas and climatic regions by hatched areas; maps (scale1:85 000 000) showing continental depression and typhoon trajectories inJanuary and June. Period of record is not specified.
1929
13. Indo China. Service G~ographique Croquis relatifs a la frequence 'a lamarche des typhoons pendant la pdriode de 1.911 a 1929 (Surveys relativeto the frequency and the path of typhoons during the period 1911-1929).(In French). DLC Map Division.
...Presents maps, scale is not indicated (about 1:15 000 000), of theChina Sea and Indochina showing the typhoon tracks for each month (May-December) based on data for the period 1911-1929.
1930
14. Bruzon, E. and Carton, P. Le climat de l'Indochine et les typhons de laHer de Chine (The climate of Indochina and the typhoons of the ChinaSea). 310 pp. (In French). Hanoi, 1930. DAS M82/596 B9!4ci.
...Contains the following: map (scale r1:9 350 000_ determined fromgraticules) of Indochina showing the location of the climatologicaland meteorological stations in 1930; maps (scale rl:7 100 0002 determinedfrom graticules) of Indochina showing the distribution of stations of theprecipitation network in 1930 and the seasonal (summer monsoon and wintermonsoon) wind regime by arrows; maps (scale cl:37 500 000.3 determinedfrom graticules) of the Far East (Mongolia, Manchuria, China, Japan,Korea, Philippine Islands and Indochina) with January and July mean iso-bars at 2200 GMf based on data for an unspecified period; maps (scaleC1:12 750 002 determin ' from graticules) of Indochina showing examplesof isobaric situatior during the crachin period, the winter monsoon andthe sumner monsoon; polychrome maps, scale is not indicated (about 1:9000 000). of Indochina showing the monthly distribution of rainfallamount in mm. and number of days with m~asurable rain for the period 1907-1929; polychrome map, scale is not indicated (about 1:7 050 000), showingthe annual distribution of rainfall amount in mm. and number of dayswith measurabie rain for the period 1907-1929; map (scale rl:46 000 000.determined from graticules) of the Far East showing mean tracks of typhoonsbased on data during the period 1865-1901; polychrome map (scale 1:1 000000) of the lWkong, Son&-84 and Dong-Nai area showing the annual distribu-tion of rainfall; polychrome map (scale 1:1 000 000) of the Kontum-Darlacarea showing the annual distribution of rainfall; map (scale C1:4 6 000 001determined from graticules) of the Far East showing the mean tracks oftyphoons based on data during the period 1865-1901; map (scale Cl: 14 000000j determined from graticules) of the China Sea and adjacent coastal
5
Source No. 14 continued.
and island areas showing the typhoon tracks (1911-1929) for each month(May-January); maps (scale t:26 500 000 determined from graticules)of China, Indochina and the Philippines showing daily isobaric conditionsduring the passage of a typhoon in the South China Sea.
15. Carton, P. La me'teorologie agricole en Indochine (Agricultural meteorologyin Indochina). 15 pp. (In French). Hanoi, 1930. DAS M/1710 C328ma.
...Presents maps (scale c1:9 375 000.3) of Indochina showing the climato-logical and meteorological network of stations for 1930 and the expectednetwork for 1931-1932. The source also contains a map (scale E1: 7 100000:) of Indochina showing the rainfall network in 1930.
16. Indochina. Service Meteorologique Atlas (Atlas). 42 pp. (In French).Hanoi, 1930. DAS M82.3/596 I51at.
...Consists of the following: maps (scale C1:7 100 0007 determinedfrom graticules) of Indochina showing the climatological and meteor-ological network in 1926 and 1930, pluviometrical network in 1926 and1930, the climatological and meteorological network planned for 1932,networks for the transmission (reception and broadcast) of meteorologicalinformation, and network for the transmission of meteorological infor-mation planned for 1932; map (scale rl:1 2 750 000 determined fromgraticules) showing the network for the transmission of meteorologicalinformation in the Far East (Siberia, Japan, Korea, Manchuria, China,Formosa, Philippine Islands, Indochina, Palau, and Ryukyu Islands);maps (scale L:3 7 500 O00J determined from graticules) of the Far East(Indochina, Philippines, China, Korea, Ryukyu Islands, Manchuria, andMongolia) with monthly mean isobars at 2200 GMT based on data for anunspecified period; maps (scale C1: 15 000 0003 determined from graticules)of Indochina, Formosa, Philippine Islands and the China Sea showing themonthly typhoon trajectories (1911-1929); map(scale C1: 7 100 0003 deter-mined from graticules) of Indochina showing the summer monsoon and wintermonsoon wind regimes by arrows based on data for an unspecified period;maps, scale is not indicated (about 1:25 800 000), of IndochLina withmonthly mean isotherms based on data for an unspecified period; polychromemaps, scale is not indicated (about 1:18 220 000), of Indochina showingthe monthly distribution of rainfall amount (m.) and number of days withmeasurable rain based on data for the period i907-1929; polychrome maps,scale is not indicated (about 1:7 100 000), of Indochina showing the annualdistribution of rainfall amount (mm.) and number of days with measurablerain babed on 23 years (1907-1929) of data.
17. Indo-China. Service Meteorologique Bulletin p luviometrique (Precipita-tion bulletin). 1906-1930. Phu-litn. tAS C/ed AO (91-1928) and C/edAO-a (1929 and 1930 as supplement to Annales du Service Mitiorologique).
...Contains maps (scale rl:3 000 000_V of Indochina shoving the locationof meteorological stations for 1906-1909 and with mean isohyets for eachyear (1906-1925), a polychrome map (xcale Cl:5 250 0007) of Indochina
I ~ -____
6
Source No. 17 continued.
showing the distribution of precipitation in 1906, a map (scale .1:12000 00.) of the China Sea and adjacent land areas showing tie trajectoriesof typhoons in 1912, polychrome maps (scale 1:3 200 000) of Indochinashowing the distribution of precipitation for each year (1926-1928), amap (scale r1:14 750 003) of the China Sea and adjacent land areasshowitzg the trajectories of typhoons and depressions in 1928 and a map(scale rI:8 750 000,) of Indochina showing the distribution of precipi-tation stations at the end of 1928.
18. Rapport au Gouverneur General sur la pe'riode de 1928-29. (Report to theGovernor General on the period 1928-29). Bulletin conomique de l'Indo-chine, Section B, 33(l):1-82. (In French). Hanoi, 1930. DLC HC441 .A4.
...Includes maps (scale Cl:8 750 0002) of Indochina showing the precipi-tation network and the climatological network at the end of 1929.
1931
19. Braak, C. Klimakunde von Hinterindien und Insulinde (Climate of theEast India Islands and Southeast Asia). Handbuch der Klimatologie,Band IV, Teil R. 125 pp. (In German - translard into English in 1943by A.A.F.) Berlin, 1931. DAS M H236h.
...Contains the following based on data for unspecified periods: maps(scale C1:65 000 0003 determined from graticules) of Southeast Asia andthe East Indies with mean isubars (m.), numerical mean pressure (mm.)values at individual stations and wind direction by arrows for Januaryand July; maps (scale Cl:40 000 000j determined from graticules) of South-east Asia and the East Indies with bimonthly (January-November) and annualmean isohyets (also hatched areas) in m., distribution of months withgreatest and least amounts of rainfall, and mean isonephs (tenths) forJanuary and July; maps (scale e,':65 000 O00J determined from graticules)of Southeast Asia and the East Indies with bimonthly (January-November)mean isotherms ('C.) at sea level and numerical values of mean tempera-ture at selected st-tions. The text also present a map, scale is notindicated (about 1:19 500 000), of Indochina and the South China Seawith typhoon tracks for 1911-1928 and maps (scale C.:67 000 0OM deter-mined from graticules) of Southeast Asia south of 20N. and the EastIndies with mean isobars (ma), numerical values of mean pressure (m.)at selected stations and wind direction by arrows for Nay and November.
20. Gherzi, Z., Zi-Ka-WeI Observatory The Winds and upper air currentsalons the Cbina coast and in the Iangtse Valley. 240 pp. Shanghai,1931. OS C/eb G417w.
...Presents maps (scale 1:25 000 000) on Albers projection of the Farlast (105E.-150E., 5"X.-50N.) showing the monthly prevailing winddirections by arrows.
i!K,__ ___ __
7
21. Russier, Henri with the collaboration of Henri Gourdon and EdouardRussier L'Indochine frantaise (French Indochina). 123 pp. (In French).Hanoi-Haiphong, 1931. DLC DS534 .R8.
...Includes a polychrome map (scale 1:20 000 000) of Indochina showingthe annual distribution of precipitation (m.) based on data for anunspecified period.
1933
22. U.S. Navy Department Aerological charts for the Siberia, Japan, FrenchIndochina, India, Philippine Islands and China area. C1933.. D.S M2.3/266.5 U585a.
...Includes maps (scale rl:15 500 Oft determined from gratLcules) ofsoutheast Siberia, Japan, east China, Laos, Cambodia, North Vietnam,South Vietnam and the Philippine Islands with the following data:monthly mean number of rainy days by isolines; monthly mean isobars(mm.) and estimated prevailing wind direction by arrows at a height of3000 meters (9842.5 ft.). Period of record was not specified.
1934
23. Carton, P. Le c'.imat de l'Indochine (The climate of Indochina).Extracted from Bulletin gen~ral de l'Instruction publique, No. 2, 1934.31 pp. (In French). October 1934. DAS M82/596 C328c.
...Contains a map (scale Cl:8 750 OOOj) of the Indochinese Peninsulawith prevailing winds for summer and winter; maps (scale C1:112 500 OOO )of rnuth Asia, the Indian Ocean and the Pacific Ocean showing the windrcimes by arrows for 2 periods (January-February; July-August). Thesemaps are based on data for unspecified periods.
24. Carton, P. Nouvelle classification des climats; Application l'Indo-chine (New classification of climates; application to Indochina'.Bulletin Economique de l'Indochine 37:1155-1168. (In French). Hanoi,November-December 1934. [LC H0441 .A4.
...Presents maps (scale r1: 8 750 0003) of Indochina showing the summerand winter wind regimes by arrows and the distrihution of climatologicalstations and precipitation stations. There is also a polychrome p(scale C1: 5 000 000r) showing the different climates of Indochina.
25. Chevy, P. and Carton, P. Les courants de la mar Chin, meridionals atleurs rapporta avec le climat de l'Indochine. (Currents of the SothChina Sea and their relation to the climate of Indochina). InstitutOcianographique de l'Indochine, Note 26. (In French). Hanoi, 1934.DN-Ho SM07 I6N5.
...Presents a map (scale rl:8 750 000t) of Indochina shoving the windregime during the summer monsoon and the winter monsoon by arrows; mps(scale rl:9 250 OOQ) of Indochina v'ch mean isotherms during the northeastor winter monsoon (represented by November means) and the sumer monsoon(May-September) and lines at an equal degree of continentality. U
-- I II
8
26. Hubert, Henry Etude comparative des climate des colonies francaises(Comparative study of climates of the French colonies). Annales dePhysique du Globe de la France d'Outre-Her 1(2,3):33-62, 69-96. (InFrench). Paris, April and June 1934. DAS P.
...Presents a map (scale Cl: 9 000 0003 determined from graticules) ofIndochina showing the distribution of climates on that peninsula.
27. Indo-China. Service Meteorologique Cartes pluviometrigues mensuelles de1934 (Monthly precipitation charts for 1934). (In French). DASM.2.3/596 141c.
...Contains maps (scalej:2 700 00j determined by distance scale inkim) of Cochinchina (southern part of South Vietnam) and Cambodia withmonthly (February-December) total rainfall amount (nun.) and monthlyrainfall amount as . of mean for 1934 by hatched and stippled areas.The maps also show the location of meteorological, climatological andrainfall stations.
28. Mot-in, Henry G. S. and Carton, P. Contribution a l'tude de 1'influencedes facteurs climatiques sur la repartition de l'endhmie palustre enIndochine (Contribution to the study of the influence of climaticfactors on the uistribution of endemic swamp diseases in Indochina).Bulletin iconomique de l'Indochine, N.S. 37:459-480. (In French). May-June 1934. DAS M/1730 M858.
...Includes a map (scale Cl: 9 500 00(b determined from graticules) ofIndochina showing the degree of continentality by isolines.
1935
29. Ajard, A. L'Union Indochinoise Fran~aise ou Indochine Orientale.Regions naturelles et geographie conomigue (The French Indochi7.ecUnion or eastern Indochina. Natural regions and economic geography).370 pp. (In French). Hanoi, 1935. DLC HC442 .A6.
...Contains a polychrowe map, scale is not indicated (about 1:8 000 000),of Indochina, part of China, and part of Thailand shoving the annualdistribution of precipitation (me.) based on 23 years (1907-1929) ofdata (after Bruzon and Carton).
30. Carton, P. Carte. pluviomAriques moyennes mensuelles at annuelles -annie moyenne 1907-1924 - du Tonkin et du Nord-Anraw, de Ia Cochinchineet du Cambodite (Haan monthly and annual precipitation charts - yearlysean 1907-1924 - for Tonkin and North Annam, for Cochin China andCamodia). Supplement to Bulletin economique de l'Indochine, 1935.pp. 1-4. (In French). Hanoi, 1936. OAS P77/596 C328p.
,.,Includes polychrome maps (scale d:2 300 OOQ) of Cochin China andCambodia showing the monthly and annual distribution of precipitation(m.) base" on data summrized over the period 1907-1924.
9
31. Hubert, Henry Gen~ralities sur la visibilit4 horizontale aux colonies(Generalities on horizontal visibility in the colonies). Annales dePhysique du Globe de la France d'Outre-Mer 2(11):129-132, 141-146. (InFrench). Paris, October 1935. D&S P.
...Presents maps (scale rl:8 750 000j) of Indochina with pie graphsshowing the frequency (0, 1-4, 5-9, 10-20, and >20 days) of horizontalvisibility <2 km. for each month in 1934 at individual stations inNorth Vietnam, South Vietnam, Cambodia and Laos.
32. Robequain, Charles L'Indochine francaise (French Indochina). CollectionArmand Colin (Section de G~ographie). (In French). Paris, 1935. DNAL280.186 R54.
...Presents a map (scale C1:13 000 O003) of Indochina showing the annual
distribution of rainfall amount by hatched areas.
1936
33. Bruzon, E. La periode du crachin sur lea regions du golfe du Tonkin(The "crachin" season in tne Gulf of Tonkin region). Annales dePhysique du Globe de la France d'Outre-Mer 3(17):129-133, 139-142.(In French). Paris, October 1936. DAS P.
...Contains a map, scale is not indicated (about 1:12 500 000), of the
Gulf of Tonkin region showing the location of stations used in this study.
1937
34. Great Britain. Meteorological Office. Weather in the China Seas and thewestern part of the Ncrth Pacific Ocean. Volume II, Part 3. Centralportion of the China Sea. pp. 131-167. London, 1937. W M82/512.3G786w.
...Presents maps (scale C1:21 500 000j) of China Sea area with monthlysurface winds at individual stations (Cape St. Jaces and Quang Tri inSouth Vietnam); maps (scale C1: 19 000 O00j) of his Sea area with stepdiagrams showing the monthly distribution of mean number of days wi0hfog, mean number of days with rsin, mean cloud amount and mean totalrainfall amount for selected stations ( i pe St. James and Quang Tr inSouth Vietnam). These maps are based on 6-27 years of data.
1938
35. Tu, Chang-Wang A preliminary study on the mean air currents and fronts
of China. Memoir of the National Re.5earch Institute of Meteorology,Academia Sinica XI(3):l-12. Nanking, September 1937. DAS M(055) A1630.
...Includes maps (scale C1:62 500 OOQJ determined from graticules; re-duced from scale 1:28 100 000) of China and adjacent areas with monthlymean air currents. These maps include North Vietnam, Laos, Cambodia andmost of South Vietnam.
* 10
36. U.S. Weather Bureau Climatic features of the Philippine Island region.82 pp. rlq373 . DAS M82/914 U587c.
...Presents a map (scale C1:15 500 0003) of the Philippine regions withdiminutive graphs and numerical values of mean monthly rainfall amounts(inches). The map includes data for Nhatrang in South Vietnam.
1938
37. Deppermann, carles E. Typhoons originating in the China Sea. 51 pp.Manila, 1938. DAS M15.2/5123 P552t.
...Includes maps, scale is not indicated (about 1:24 000 000), of theChina Sea and adjacent land areas with isobars, streamlines and plotteddata for individual stations (about 2-5 stations in South Vietnam;
station names are not indicated on maps) at specified hours duringtyphoons witnin t'ie period 1929-1931. The number of maps showing weatherconditions during each typhoon varies from 1 to 13.
38. Gherzi, E. Air masses acting over China and the adjoining seas. Beitragezur Physik der .reien AtmosphEre 24:45-52. Leipzig, 1938. I)AS M(05)D422.
...Presents maps, scale is not indicated (about 1:50 000 000), of China,Indochina and adjacent areas showing the seasonal tracks of air masses.
39. Great Britain. riteorological Office Weather in the China Seas and in thewestern part of the North Pacific Ocean. Volume I. Part 1. Generalinformatiin. Part 2. Typhoons. )co. 404a. 165 pp. and 45 pp. respec-tively. London, 1938. DAS M82/512.3 G786w.
...Part I of the source presents maps (scale CiL:2 40 000 0OO3 determinedfrom graticules) of east Asia (20"S.-70"N., 90*E.-160'E.) with monthlynormal sea isobars (mb.) and mean isobars for the 16th day of eachmonth (Octoer 1931-September 1935) for comparison; map (scale rJ:85 000Oftb determined from graticules) of east Asia (0*-50°N., 105°E.-180"E.)with mean isotherms ('F) for February and August; map (scale CI:46 00000QO determined from graticules) of east Asia and the North Pacific(0"-55N., 95"E.-170W.) with annual mean ieohyets (n.); maps (scaleCl1:49 000 OQ determined from graticules) of east Asia (lO0eE.-170*E.)with graphs shoving monthly mean total amount of precipitation ("u.) andmean number of rain-days for individual station.s (Quang-Tri in SouthVietnam); maps (scale r1: 8 0 000 00( determined from graticules) of eastAsia with man isonephs for February and August; map (scale C1: 4 0 000 00jdetermined from graticules) of east Asia wich graphs showing the monthlyfrequency (% and days) of fog for individual stations (Quang-Tri and CapeSt. Jomes in South Victnam); map (scale gi:50 000 0003 determined fromgraticules) of east Asia with graphs showing the monthly frequency (days)of thunder or thunderstorm. for individual stations (Quang-Tri in SouthVietnam). Part 2 on typhoons contains maps (scale ri:5 0 000 OOj deter-mined from graticules) of east Asia (0-3ON., !00°E.-140°E.) shoving thedevelopment of a typhoon in the China Sea (May 13-19, 1930); maps (scale
Source No. 39 continued.
Cl:6 0 000 000- determined from graticules) of east Asia (0*-50°N., 90*E.-150*E.) showing the areas in which typhoons may be encountered in eachmonth of the year based on 38 years of data by crosshatching, meanisobars 4nd numerical monthly frequencies of typhoons for individualareas based on 29 years (1893-1918, 1929-1931) of data; maps (scaleri: 6 7 500 0002 determined from graticules) of east Asia (0*-50*N., 95*E.-150'E.) showing examples of weather conditions during typhoons. Periodsof record have been recorded ir -his abstract when specified in source.
40. Great Britain. Meteorological Office Weather in the China Seas and inthe western part of the North Pacific Ocean. Volume III. Aids toforecasting. M.O. 404c. 170 pp. London, 1938. DAS M82/512.3 G786w.
... Contains maps (scale rl:5 5 000 000_ determined from graticules) ofthe equatorial belt (00-250N., 650E.-125°E.) showing the more persistenttypes of pressure distribution for the season June-September; maps (scaleC1: 55 000 0001 determinee )m graticules) of the equatorial belt (5°S.-25°N., 850E.-125°E.) showing the more persistent types of pressuredistribution for September - October, November - February or March,December - January, January - February and March - May; maps (scale C1: 32
500 OOQJ determined from graticules) of east Asia (0*-50°N., 95°E.-150°E.)presenting the development of meteorological situations typical of somespecial aspects of the weather of the Ctina station.
1939
41. Indo-China. Service Wteorologique Annales (Yearboo s). 1928-1939.Hanoi. DAS C/ed AO-a.
...Presents maps (scale C1: 8 500 OOOj) of Indochina showing the climato-logical and meteorological network (1928-1932) and the precipitationnetwork (1928-1930) for each year; polychro~maps, scale is not indicated(about 1:12 800 000), of Indochina with aonth' mean isohyets (o.)based on data for t period 1907-1926 in tht 1928 volume; polychromemaps (scale r1:3 200 000) of Tndochina with arnual mean isohyets foreach year (1928 and 1929); maps (..calc C1:1 4 JO0 0Of) of the China Seaand adjacent land areas showing "ie tracks of typhoons or depressionswhich developed in the China Sea and those which developed in the PAcificOcean for each year (1928-1939).
42. Iyer, V. Doraiewamy Typhoons and Indian weather. India MetecroiogicalDepartment, Memoirs XXVI(VI):93-130. Delhi, 1939. DAS M(055) 139m.
...Presents maps (scale rl:40 000 OOJ determined from graticules) ofsouth Asia and the West Pacific (10"-3N., 60*-140"E.) with the tracksof typhoons which struck the coast of Indo-China or south China andmoved westward redeveloping into storms or depressions in India foreach month (July-Rovember) during the period 1884-1930.
*12
43. Lu, Alfred The monthly pressure distribution and the surface winds inthe Far East. Memoir of the National Research Institute of MeteoroiogyjAcademia Sinica 12(4):1-25. Chungking, 1939. DAS M(055) A168m.
...Contains maps (scale gl:32 500 0003 determined from marginal graticuleticks)of the Far East with monthly and annual mean isobars (mm.) and pre-vailing winds by arrows. These maps include North and South Vietnam, partof Cambodia and part of Laos.
1940
44. Carton, P. Le climat de l'Indochine (The climate of Indochina). LeClimat de l'Indochine et les typhoons de la Mer de Chine par E. Bruzon,P. Carton et A. Romer, Tome I. 211 pp. (Ir Frencl). Hanoi, 1940. DASM82/596 B914cl.
...Includes the following, based on data for unspecified periods: maps(scale C1:9 500 OOOJ determined from graticules) of Indochina showing themeteorological and climatological network, the precipitation network, thedistribution of mean isotherms for the coldest month (January), the degreef continentality by isolines and the annual amplitude of temperature by
isolines; maps (scale C1: 37 500 OOQ1 determined from graticules) of Indo-china, China, Mongolia, Manchuria, Japan, Korea and the Philippines withmean isobars at 2200 G.M.T. for January and July; maps (scale C1: 12 250000J determined from graticules) of Indochina showing examples of isobaricconditions with plotted data for individual stations (8-9 stations inSouth Vietnam - some of the station names are not recorded ) during awinter monsoen and a summer monsoon; polychrome maps, scale is not indi-cated (about 1:20 000 000), of Indochina and Thailand east of 100°E. withmonthly rainfall amounts (mm.); map (scale El:12 750 0003 determined fromgraticules) of Indochina showing an example of isobaric conditions withplotted data for specified stations (Hatien, Cap St. Jacques, Padaran,Nha-Trang, Qui-Nhon, Quang-Ngai, and Quang-Tri in South Vietnam) duringthe crachin period; map (scale C1:12 750 0003 determined from graticules)of Indochina showing an example of isobaric conditions with plotted winddata for individual stations (6 or 7 stations in South Vietnam - stationnames are not recorded) during a typhoon; maps (scale C1: 2 300 000j deter-mined from distance scale in Km.) of Cochin China and Cambodia showingthe distribution of monthly and annual rainfall amounts by hatched andstippled areas. The source also contains a polychrome map (scale 1:4000 000) of Indochina and Thailand east of 100°E showing the annualdistribution of rainfall amount (mm.) based on data for the period 1907-1934.
45. Deppermann, Charles E. Upper air circulation (1-6 km.) over the Philip-pines and adjacent region&. 85 pp. Manila, 1940. DAS M57/914 P552u.
...Presents the following for the Philippines, southeast Asia and the EastIndies: map (scale tl:19 500 0003 determined from graticules) showing thedistribution of stations (Tourane, Nhatrang, and Saigon in South Vietnam)
with pilot balloon data; maps (scale [1:21 500 0003 determined from
13
Source No. 45 continued.
graticules) showing the wind direction and speed by arrows and barbs forthe main air streams (Northers, North Pacific Trade, South Pacific Trade,North Indian Westerlies, South Indian Westerlies, and Temperate ZoneWesterlies) at surface and at heights of 1, 2, 3, 4, 5 and 6 km. forJanuary, April, July and October based on data for an unspecified periodfor almost all of the areas; maps (scale 0l:76 000 O00 determined fromgraticules) without outlines of land areas giving examples of (1) shallowtriple-point storm-northers less than 2 km. deep, (2) striking ejectionwith height of south Pacific trade by Indian westerlies, (3) change ofPhilippine circulation aloft in one day, (4) pincer-ovement of northersand South Pacific trade on Indian westerlies, (5) gradual intrusion ofIndian westerlies, (6) encircling motion of northern trade increasing withaltitude, (7) typhoon pushed eastward by temperate zone westerlies and(8) complex changes of typhoon air masses with height.
1941
46. Taiwan (Formosa). Weather Bureau Flight weather report for FrenchIndo-China. Thailand and Dutch East Indies. 2 Volumes. (In Japanese).Taihoku, January 1941. DAS HS2.2/596 T135f.
...Contains maps (scale Cl: 12 000 0003) of Indochina with monthly andannual mean isobars (mm.) and numerical values of mean pressure forindividual stations; mean isotherms (°C) and numerical values of meantemperature for individual stations; mean isohumes (%) and numericalvalles of mean relative humidity for representative stations; meanisonephs (tenths) and numerical values of mean cloud amount at specifiedstations; mean isohyets (mm.) and numerical values of mean amount ofprecipitation at individual stations; mean number of days with precipi-tation by isolines and numerical values for representative stations.There are also climatic maps (scale C1:12 000 O00J) of Indochina basedon data summarized over an unspecified period at 0900 and 1500 withmonthly prevailing wind direction by arrows and numerical values forindividual stations; monthly wind roses at representative stations;monthly and annual wind speed (mps) by isolines and numerical values atselected stations; monthly and annual mean isonephs (total and low clouds)and numerical total and low cloudiness values at designated stations;monthly and annual mean low cloud heights by isolines and numerical valuesat individual stations; annual mean number of clear and overcast days byisolines and numerical values at representative stations; monthly andannual number of days with fog, haze and thunderstorms by isolines andnumerical values at selected stations; monthly and annual mean visibilityby isolines and numerical values at individual stations.
47. U.S. Army Air Forces The Climate of Pacific Asia. DAS M82.1/5 U58c.
...Includes maps (scale C1: 40 000 O00J) of southeast Asia (10°N.-45*N.,100°E.-I50°E.) with selected types of pressure distributions and maps(scale Cl:30 000 0003) of approximately the same area with mean isobarsand prevailing wind direction for January and July. 4
14
1942
48. Great Britain. Meteorological Office. Weather in the Indian Ocean.Volume III. Aids to forecasting. M.O. 451c(l). London, 1942. DASM82/267 G786w.
...Presents synoptic charts (scale fl:33 000 000)) illustrating typicalweather situations in the different seasons for the Indian Ocean andadjacent land areas extending from 40°S to 40*N and from 15*E to 125*E.These typical illustrations include cyclonic disturbances, the advanceand retreat of the monsoons and seasonal movements of the intertropicalfront.
49. U.S. Weather Bureau Southeastern Asia, India. Farther India and theEast Indies. P.R.5. 236 pp. Washington, 1942. DAS M82 U587p.
.,$Includes the following: map (scale C1:8 750 0003 determined fromgraticules) of Indochina showing the prevailing wind directions byarrows for summer and winter; maps (scale cl:40 000 000j determinedfrom graticules) of southeast Asia and the East Indies with mean iso-nephs (tenths) for January and July; maps (scale r1:89 000 OO0 deter-mined from graticules) of southeast Asia, East Indies and northernAustralia with January and July mean isobarj prevailing wind directionby arrows and the position of the intertropic front; map (scale V1:89000 000.2 determined from graticules) of southeast Asia, East Indies andnorthern Australia with January and July streamlines at 10,000 ft. andthe position of the intertropic front; map (scale C1:89 000 0002 deter-mined from graticules) of southeast Asia, East Indies and northernAustralia showing the monthly mean position of the intertropic front;maps (scale 1:10 000 000) of India, Farther India (Thailand, Indochina,Malaya and Andaman Islands), China and East Indies with January andJuly mean isobars and prevailing wind direction by arrows at surface,mean streamlines at 10,000 and 20,000 ft., and plotted prevailing winddirection and mean force (Beaufort) at 10,000 and 20,000 ft.
1943
50. Great Britain. Meteorological Office Weather in the Indian Ocean.Volume II. General information. M.O. 451a. London, 1943. DAS M82/267G786w.
...Presents the following for the Indian Ocean and adjacent land areasincluding South Vietnam: maps (scale rl:57 500 0003 determined fromgraticules) t±th mean isobars (mb.) and for the sea area only resultantwinds by arrows for January-February, April, May, July-August, October,and November; maps (scale CL:85 000 0002 determined from graticules)with resultant winds by arrows at heights of 1, 2, 3, 4, 6 and 8 km. forwinter (December-February) and summer (June-August).
15
51. India. Meteorological Department Climatic charts of India and neighbour-hood for meteorologists and airmen. New Delhi, 1943. DAS }2.3/54 I39c.
...Consists of the following: map (scale C1:22 000 0003 determined fromgraticules) of India and neighboring areas (0*-40*N., 45'-I15*E.) withannual mean isohyets (also hatched areas) in inches; map (scale 1:120000 000) of India and adjacent areas (0-40°N., 450 -115°E.) with monthlymean isobars (mb. and in.) and prevailing wind direction by arrows, meantracks of storms and depressions and normal mean isohyets (also hatchedareas) in inches, number of days with thunder and fog (numerical valuesfor possibly 12 stations in South Vietnam - station names are not designa-ted) based on data for about 4-6 years, plotted resultant wind directionand force for individual stations (possibly 3 in South Vietnam - stationnames are not recorded) at specified heights (1, 2, 3, 4, 6 and 8 km.)based on data for 1938-41, mean streamlines and mean isotachs (mph)irrespective of direction at specified heights (1, 2, 3, 4, 6, and 8 km.)based on data for 1938-41 with plottted resultant wind direction and force.Specified periods of record for Indochinese data are included in thisabstract. Additional maps in this source do not contain data for SouthVietnam.
52. India. Meteorological Department Climatological atlas for airmen. 100pp. Poona, 1943. DAS M82.3/54 139ca.
...Contains the following for India and adjacent areas (0'-40-N., 40O-
115°E.): map (scale C1:28 000 000 determined from graticules) withannual mean isohyets (also hatched areas) in inches; mapq (scale 01:40000 0003 determined from graticules) with monthly mean isobars (mb. andin.) and prevailing wind direction by arrows, mean isohyets (also hatchedareas) in inches and mean tracks of storms and depressions, mean numberof rainy days by isolines and hatched areas, mean number of days withthunder and fog by isolines and hatched areas for India and by numericalvalues for adjacent areas (possibly 12 stations in South Vietnam - stationname3 are not designated) based on data for about 4-6 years; maps (scaleC1:40 000 0003 determined from graticules)with monthly plotted resultantwind direction and force (mph) for individual stations (possibly 3 inSouth Vietnam - station names are not designated),mean streamlines andmean isotachs (mph) irrespective of direction at 1.0, 2.0, 4.0, 6.0,and 8.0 km. based on data for 1.938-1941. Specified periods of recordfor Indochinese data are inc! ais abstract. Additional maps inthe source do not present data to. uth Vietnam.
53. Miller, L. C. Flying conditions in Indo China. U.S. Weather Bureau,Special Report No. 313. 68 pp. 1943. DAS H82.2 U587s.
...Contains maps (scale C1: 18 250 0002 determined from graticules) ofIndochina showing the location of climatic stations and presenting graphsfor individual stations (Hue, Tourane, Nbatrang, Dalat, Cap St. Jamesand Saigon) showing the monthly mean amount (in.) of precipitation andthe mean number of days with precipitation >.011" based on data for anunspecified period. The source also includes maps (scale r1: 4 3 000 O00Jdetermined from graticules) of the China Sea area, which includes the
-m
16
Source No. 53 continued.
Indochinese Peninsula, showing the prevailing wind direction and speedby barbs for January, April, July and October at surface and heights of1, 2, 3, 4, 5 and 6 kilometers.
54. Russier, Henri L'Indochine franyaise (French Indochina). Dix-neuvi~meedition. (In French). Hanoi, 1943. DLC DS534 .R8.
...Presents a map (scale 1:10 000 000) of Indochina showing the monsoonwind directions by arrows.
55. U.S. Army Air Forces Preliminary climatic atlas of the world. SpecialSeries No. 1 (Revised). July 1943. DAS N82.3 U585s.
...Includes maps (scale Cl:18 000 000j determined from graticules) ofthe Far East (15'S.-50*N., 80°E-140*E.) with mean isobars (mb.) andwind roses for individual stations (names are not designated, however1 or 2 stations are in South Vietnam) for January, April, July andOctober; graphs showing monthly values of mean amount of precipitatin(inches) at selected stations (Dalat and Hue in South Vietnam); graphsshowing monthly values of mean number of days with precipitation, meantemperature (*F) and mean cloud amount (%) at representative stations(Saigon and Nha Trang in South Vietnam); graphs showing monthly valuesof mean number of days with thunderstorms for selected stations (Hue inSouth Vietnam); graphs showing monthly values of mean daily maximum andminimum and absolute maximum and minimum temperatures (*F) for specifiedstations (Nha Trang in South Vietnam).
56. U.S. Army Air Forces Preliminary climatic atlas of the world. SpecialSeries, No. 1 (Supplement). July 1943. DAS M82.3 U585s.
...Contains maps (scale tl:18 500 00031 determined from graticules)of the Far East (10S.-500 N., 850E.-140°E.) with graphs showing monthlyvalues of mean daily maximum and minimum and absolute maximum and minimumtemperatures (*F.) based on data for an unspecified period at individualstations (Nha Trang in South Vietnam).
57. U.S. Department of the Air Force Weather conditions affecting the targetarea of Indo-China. Thailand. Burma, Malay States, and occupied southernChina. Air Weather Service Special Study No. 16. 10 pp. November 1943.DAS M(055) U58s.
...Presents the following for Indo-China, Thailand, Burma, Malay Statesand southern China: maps (scale C1:32 500 0003 determined from graticules)showing the topography and routes along which vertical ct ss sectionsare given in text, dates of onset of NE monsoon by isolines and dates ofonset of SW monsoon by isolines; maps (scale C1:32 500 OOQ determinedfrom marginal graticule ticks) showing the surface air flow by arrows,10,000 ft. air flow by arrows, mean cloud amount (<0.1, 0.1-0.4, 0.4-0.7,and >0.7) by croashatching and mean number of days with rainfall by iso-lines for January showing generally prevailing conditions during the north-east monsoon (winter) season and for July showing generally prevailingconditions during the southeast monsoon (sumar) season.
T
17
58. U.S. Weather Bureau Northern Hemisphere pressure center summaries.Washington, C1 94 3a. DAS W2.3 U587no.
...The summaries are based on data taken from the maps of pressure centertracks which have been plotted from Historical Northern H isphere sea-level maps. In the section on the Asiatic theater the following numericaldata are presented for each 50 square in Southeast Asia on charts (scalef:30 000 0003 determined from graticules): monthly frequency of lowsat 1300 G.M.T., monthly frequency of highs at 1300 G.M.T., monthly dis-tribution of intensities of lows at 1300 G.M.T., monthly distribution ofintensities of highs at 1300 G.M.T. and monthly frequency distributionof number of lows summarized over the period 1929-1938. In supplementI the source contains charts (scale rl:40 000 0003, with numerical monthlytotal frequency of lows from Japanese Kobe maps for k200 to 0500 G.M.T.and monthly total frequency of lows from Northern Hemisphere HistoricalMaps for Southeast Asia, east of 105°E., based on the period 1929-1936.
1944
59. Gherzi, Ernest, Zikawei Observatory Climatological atlas of east Asia.175 pp. Shanghai, 1944. DAS M2.3/5 Z68.
...Presents maps (scale l-12 000 000) of east Asia with monthly andannual mean isotherms (06 annual absolute extreme isotherms (*C), annualmean range of temperature by isolines, monthly and annual mean isohumes,monthly and annual mean isohyets, monthly and annual mean number of rainydays by isolines, monthly and annual mean isobars (ms.) and wind directionby arrows, selected tracks of typhoons which give a rather good idea ofthe possible and probable yearly distribution of these dangerous tropicilcenters, typical weather maps for each season and main climatic regions.East Asia includes Indochina, Thailand, China, Mongolia, southern Siberia,Formosa (Taiwan), Korea, Japan and the Philippines.l
60. Great Britain. Meteorological Office Rainfall maps of the Far East.M.O.M. 471. London, 1944. IAS W42.3/5 G786r. Oversize.
...Contains maps (scale rl:18 000 0003) of the Far East (98°E.-152*E.,*20*S.-45*N.) shoiing the topography; mean isohyets (inches) for January,
April, July and October; monthly mean total amount of rainfall by stepdiagrams for individual stations (Quangtri and Cape St. James in SouthVietnam).
61. Hare, F.K. The crachin. Synoptic Divisions Technical Memorandum No. 87o Great Britain Meteorological Office. 7 pp. 1944. MS M(055) G786s.
...Contains a map (scale ri:50 000 0003 determined from graticules) ofthe Par East (China, Indo-China, Korea, Japan and eastern Siberia) withapproximate streamlines during periods of the full winter monsoon; maps(scale L1:16 000 000) determined from marginal graticule ticks) of Indo-China and South China showing synoptic conditions during a crachin spellin January 1938; maps (scale c1 50 000 O00 determined from graticules)of the Far East (China, Indo-sia, Korea, Japan and eastern Siberia)stowing the general pressure conditions at the beginning and end of thecrachin period in 1938.
A
i8
62. India. Meteorological Department Upper wind roses. Supplement to Cli-matic Charts of India and Neighbourhood for Meteorologists and Airmen.Poona, 1944. DAS M2.3/54 139c.
...Presents maps (scale 1:20 000 000) of India and neighborhood (5*S.-42"N.,40*E.-11l*E.) with roses showing the monthly percentage frequencies ofdirections and speeds of upper winds at levels of 1, 2, 3, 4 and 6 km. forthe morning at individual stations (names are not recorded, however 2 or 3stations are in South Vietnam) with 10 or more observations per month.Although the maps indicate AM summaries the roses for the Russian and Indo-chinese statiot are based on available data irrespective of time of ascent.Periods of record are not specified.
63. McIntosh, D.H. Tropical weather forecasting, with particular reference toN.E. India, Burma and the Bay of Bengal. Synoptic Division TechnicalMemorandum No. 123, pt. 3 of Great Britain Meteorological Office. 1944.DAS M(055) G786s.
Contains charts, scale is not indicated (about 1:100 000 000), of India,Pakistan, Burma, Ceylon, Thailand and Indo-China with normal air flownear surface during N.E. monsoon season; normal air flow in the lowestlayers of the atmosphere in the post monsoon season; typical air flownear surface in pre-monsoon season; illustration of the formation of atypical disturbance in the N.E. monsoon season; distribution of windsand air masses in a western disturbance.
64. U.S. Weather Bureau Tropospheric weather factors likely to affect super-refraction of VW-SIV radio propagation as applied to the tropical WesternPacific. Report RP-I. 100 pp. Washington, July 1944. DAS N82.1/91U387tr.
...Presents maps (scale E1:48 000 0003) of the tropical Western Pacific(30-S.-30-N., 94*E.-170*W. ) with streamlines showing the major windsystems of January and July, seasonal frequency of rain(showers, steadyrain, etc.) by isolines and normal monthly position of the IntertropicConvergence Zone.
1945
65. Dobby, E.H.G. Winds and fronts over southeast Asia. GeographicalR oeviw XXXV:2o4-2l8. Vow York, 1945. AS P.
...Presents map (scale L1:130 000 0003 determined from maps with partialgraticules) of southeast Asia with monthly normal trajectories of windand monthly position of the intertropical fronts.
66. Great Britain. Meteorological Office Meteorological report cn China.. Aviation Met. Report No. 24. m.O.m. 365/24.
18pp 145 i7 2 G786.
... Contains maps (scale 6 :38 000 00(b) of East and Southeast Asia withapproxiate streamlines during periods of full winter monsoon, fronto-
genesis over North China during a lull in the winter monsoon and circulin
19
Source No. 66 continued.
associated with wave development during a lull in the winter monsoon.The source also presents maps (scale Cl: 12 000 0002) of Indochina showingdynamically formed lee depression over the Gulf of Tongking for July 1938at 0600 L.M.T.
67. India. Meteorological Department. Climatological charts of the Indianmonsoon area. Poona, 1945. DAS M82.3/54 139cl.
...Contains maps (scale C1:40 000 0003 determined from graticules) ofthe Indian monsoon area (40*S.-40°N., 200E.-130°E.) with monthly meanisobars (mb.), monthly mean strea,-lines and upper wind roses for indi-vidual stations (names are not recorded, however 2 are in South Vietnam)at levels of 0.5, 1, 2, and 3 km.; monthly mean rainfall amount (inches)by hatched areas and cyclone tracks. The period of record is not speci-fied for climatic elements presented on these maps.
68. India. Meteorological Department Seasonal chart of prevailing wind andrainfall. Far Eastern and Pacific theatre. 194? DAS M78.1 139se.
...Consists of polychrome maps (scale C1:65 000 0003 determined fromgraticules) of the Far Eastern and Pacific theatre (40°S.-40*N., 40*E.-70*W.) showing the distribution of wind force <2 for >10 days per month,wind force >7 for 5-10 days and >10 days, and mean total rainfall amount(inches) for January, April, July and October. The maps also presentprevailing wind direction for the sea areas. Periods of record are notspecified.
;946?
69. John, I.G. and Hare, F. K. Winter circulation over Burma. Thailand,and Indo-China. Synoptic Divisions Technical Memorandum No. 120 ofGreat Britain Meteorological Office. 10 pp. 19467. DAS M(055) G7868.
...Presents synoptic maps (scale CI:16 000 000.1 determined from marginalgraticule ticks) of Burma, Assam, Thailand, Indo-China and Tenasserim)for selected days at 1000 C.M.T. in January 1938 (data are plotted for
*several stations in South Vietnam - station names are not designated onmaps); maps (scale [1:36 000 000. determined from graticules) of south-
east and east Asia 0*-50"N., 90"-160".) showing general synopticsitutations during the evening for selected days in January 1938.
1947
70. Garbb,1l, Maurice A. Tropical and equatorial meteorology. 237 pp. NewYork-iicago, 1947. LlkS M G213t.
... Includes the fo 'uwing: map (scale L1:50 000 000] determined fromgra icules) of emate-n Asia (8'-60°N., lO0-150*E.) shoving the 4principal mokdificstion routes of p lar-continental air masses; mps(scalN CI:65 000 0001 derermined from graticules) of southeast Asia(t,0QS.-25*N,, 90"'-145°,) shoding the general flow patterns at surface
I
20
Source No. 70 continued.
and specified heights (1, 2, 3, 4 and 6 km.) for January, April, Julyand October; maps (scale C:110 000 000J determined from graticules)of southeast Asia (00-450N., 100°-140*E.) showing four typical synopticconfigurations affecting the weather of subtropical and tropical easternAsia (southern-solstice season). Additional maps are for larger areas.
71. Guilmet, Bernard Le temps en Indochine " l'usage des navigateurs ae'riens(Weather in Indochina for the use of aircraft navigators). 24 pp. (InFrench). circa 1947. DAS PF2924.
...Contains rough maps, scale is not indicated (about 1:42 000 000), ofsoutheast Asia with wind trajectories at the surface and heights of1000, 2000, 3000, 4000 and 6000 meters for January, April, July andOctober.
1948
72. Jong, Pin-chen Chinese air mass analysis. riemoirs of the Institute ofMeteorology, Academia Sinica 15(3):1-17. Nanking, 1948. DAS M(035)A168m.
...Although this is a study on Chinese air masses the maps include datafor North and South Vietnam, Laos and Cambodia. These maps (scaletl:4 7 500 0003 determined from graticules) of east and southeast Asia,Japan and the Philippines present mean air streams at 7000 feet and 10,000feet for January and July based on data for an unspecified period.
73. Kao, Y.S. general circulation of the lover atmosphere over the Far East.lEmoirs of the Institute of Meteorology,Academia Sinica 16(l):1-7. Nanking,July 1948. DAS M(055) A168m.
...Presents maps (scale C1:50 000 0003 determined from graticules) ofChina, Japan, the Philippines, Malaya, Burma, Laos, Cambodia, NorthVietnam, South Vietnam, Thailand, East Pakistan and northeast India withmonthly mean air stream at 10,000 feet level based on data for an un-specifieJ period.
74. Tao, Sh-yen The mean surface air circulation over China. Memoirs ,fthe Institute of Meteorology, Academia Sinica 15(4):1-7. Nanking, July1%4. D M P(055) A168m.
...Includes maps (scale tl:65 OW 00O0 determined from graticules) of
part of Siberia, China, Japan, the Philippines, Laos, Cambodia, NorthVietnam, South Vietnam, Thailand, Burma and East Pakistan with monthlyman surface streamlines based on observations during the period 1931-1936.
III
21
1949
75. India. Meteorological Department Meteorology for airmen in India.Part I. General meteorological features. 58 pp. Bombay, 1949.
M82.1/54 139m.
...Contains a map (scale C1: 3 6 500 0003 determined from graticules)of South Asia (5*-40°N., 45°-1150 E.) with annual mean isohyets (alsohatched areas) in inches based on data for an unspecified period; maps(scale C1: 4 0 000 OO1 determined from graticules) of South Asia (0-40"N.,40-1I0%..) with streamlines and wind roses for individual stations(station names are not recorded - 2 or 3 stations are located in SouthVietnam) at heights of 1 and 3 km. for January, April, July, and Octoberbased on data for an unspcified period; map (scale rl:36 500 000j deter-
mined from graticules) of South Asia (5*-25*N., 45*-110"E.) shovingtypical storm tracks (2 crossed South Vietnam) for April, May, Octoberand November with dates of occurrence.
1950
76. Air Attache, Saigon, Indo-china Weather in Indo-china as pertains to
aerial navigation. Translation from the French of a complete report ofweather in Indo-Chi.a. IR-86-50. September 16, 1950. rI-O-QC.90 Indo-china IR-86-50.
i...This is a translation of "Le temps en Indochine a l'usage desnavigateurs se'riens" by Bernard Guilmet. See abstract under author.
77. Bruzon, E., Carton, P.; Romer, A. Apersu ge'ne'ral sur le climat dol'Indochine (General outline of the climate of Indochina). Le Climatdel'Indochine, Premiere Partie, pp. 1-99. (In French). January 1950.DAS MB2.2/596 141c.
...Contains a mAp (scale C1: 8 750 00) of Indochina with prevailing windsby arrows for suer and winter and a sap (scale C1:9 500 0002) of Ineo-china showing the locations of meteorological stations.
78. Dobby, £.I.G. Southeast Asia. 415 pp. London, 1950. OC DSSO .DS.
...Includes a map (sca! - r,1:I0 200 000j) of Indochina shoving the distri-bution of the annual amount (inches) of precipitation by hatched areas.
The source also contains the folloving: ap. scale is not indicated(about 1:42 000 000) of Soutneast Asia shoving an examle of a dailyveather chart (synoptic chart); maps, scale is not indicated (about 1-150000 000), of South and Southeast Asia shoving the positions of the inter-tropical front for each month with arrows showing diagrmatically themanner in which the air *asses move; map, scale is not indicated (about1:45 000 000) of Southeast Asia showing areas distinctly dry, rainfall>0" and rainfall <60'; map, scale is not indicated (about 1:39 O00 000),-f southeast Asia and the South China Sea showing normal typhoon tracks;map (scale C1:45 000 000j) of Southeast Asia shoving Mppen's climaticregions.
22
79. Roner, A. Le rgime des vents en Indochine (Wind reg'vne in Indochina).Le Climat de 1'Indochine, Deuxiime Partie, pp. 101-158. (In French).January 1950. DAS 182.2/596 141c.
...Presents maps (scale 1:16 000 00j) of southeast Asia showingtypical pressure and wina situations during the winter monsoon and thesumer monsoon.
80, United Nations. Economic Comission for Asia and the Far East Flooddamage and flood control activities in Asia and the Far East. FloodControl Series, No. 1. 81 pp. Bangkok, October 1950. DAS M79.7 U58t.
.Presents maps (scale 11:55 000 003 determined from graticules) of
Asia and the Far East (IOS.-45°N., 60'-150°E.) with mean sea levelisobars (millibars) and surface wind by arrows for January and July;general extratropical cyclones tracks; general tropical cyclone tracks.
81. Venkiteshwaran, S.P. Winds at 10 kma. and above over India and itsneighbourhood. Memoirs of the India Meteorological Department XXVIII(2):55-120. Delhi, 1950. DAS M(055) 139m.
...Includes maps (scale Cl: 2 9 000 0003 determined from graticules) ofIndia and adjacent areas extending from 0° to 35°N. and from 450 tolI0"E. with lines showing the general flow of air and plotted winds atthe different pilot balloon stations at specified heights (10, 12, 14, 16,
18 and 20 kms.) for each month. The source does not contain plotted datafor Indochina. The lines showing the general flow of air are based onavailable data for the area for the period 1920-1941.
1951
82. Image, C.S. Analysis and forecasting of summer weather over and in theneighbourhood of South China. Journal of Meteorology 8:289-299. Lancaster,October 1951. OAS N(05) A5I2j.
...Contains a map (scale 1:60 009 000 determined from graticules) ofIndochina, South China and adjacent regions showing area included in rhiistudy and designating the pltces mentioned. The source also presentssmps, scale is not indicated (ahout 1:37 000 000), of Indochina, South
China and adjacent areas 1llustroting the four summer weather patterns.These patterns include tropical storms, pressure wave, broad deep south-vesterlies - the lai-U stream, and wedge from the North Pacific anti-cyclone and cyclonic cill.
63. Strahler, Arthur N. Physical Seolraphy. 442 pp. New York-London, 1951.OU 551.4 S896p.
... Cotains maps (scale t1:100 000 OO2 determined from graticules) forsouth and southeast Asia (20"S.-40"N., approximately 64*-130"E.) illus-trating onse interpretation of the airmass source regions and circulationpatterns which govern the equatorial and tropical cliates.
23
84. Thompson, B.W. An essay on the general circulation of the atmosphereover South-East Asia and the West Pacific. Quarterly Journal of theRoyal Meteorological Society 77(334):569-597. London, October 1951.DAS M(0) R888q.
...Presents maps (scale rl:75 000 000 determined from graticules) of.uth-East Asia and the West Pacific showing the most common flowpaiterns at 2,000 ft. and 10,000 ft. from November-March, the airflowsof May and their inter-relationship at 2,000 ft. and 10,000 ft., thegeneral flow patterns in June at 2,000 ft. and at 10,000 ft. duringlate July, classic picture of the intertropical front in July, thecommon flow pattern at 10,000 ft. in September and examples of flowpatterns associated with various weather conditions. These maps arebased on data since September 1947.
85. Thompson, B.W. The upper-level flow-structure near typhoons. QuarterlyJournal of the Royal Meteorological Society 77(332):272-282. London,April 1951. DAS M(05) R888q.
...Presents the following: maps (scale rl:46 000 OO03 determined fromgraticules) of the Southwest Pacific and adjacent land areas, whichinclude North and South Vietnam showing at 10,000 ft. examples of atyphoon development at an airflow discontinuity, a typhoon developmentwithin N. Pacific Trades, and a typhoon moving northwards with narow-ing sector of equatorial Westerlies; map (sarle r1:46 000 OO determinedfrom graticules) of Southeast Asia (8'N.-40°N , 100°E.-125"E.) presentingan example at 10,000 ft. of i tropical storm development &t an airflowdiscontinuity; map (scale rl:50 000 0003 det rmined from graticules) ofthe Southwest Pacific and adjacent land areasi, whtich include the easternpart of Nvrth and South Vietnam with a typici, midsummer pressure-patternwhich is frequently the birthplace of typhoons; maps (scalt £1:60 000 000determined from graticules) of Southeast Asia (0"-30*K., 00 E.-140"E.)with examples at 10,000 ft. of a typhoon with flows of N. and S. PacificTrades, a secondary convergence zone between S. Pacific Trades and equa-torial Westerlies feeding into the southern rector of a typhoon into whichcontinental air is also fed and a typhoon with flow3 of equatorial or N.Indian Westerlie and N. Pacific Trades only.
86. U.S. Department of the Air Force Weather conditions on a southern Pacitleair route. Travis AFB to Saigon, French Indo-China. Air Weather ServiceSpecial Study 105-44. 10 pp. Washington, April 1951. DAS H(055) U51s.
...Presents the follcwing along the route from Travis AFB to Sailgon:maps (scaae C1:8 000 00J determiined from partial graticules) withgraphs for each of the terminals showing the seasonal percentage fre-quency of specified flying weather (contact, instrument, clo~ed, instru-sent and/or clcsed), seasonal mean number of days with ceiling <450 ft.at specified hours (0600, .400, and 2200), seascnal mean number of daysI with ceiling <1000 feet at ipecified hours (0600, 1400, and 2200), seasonalman number of days with visibil'ty <1 mile at specified hours (0600.1400, and 2200); maps (scale C1: 68 000 0003 determined from graticules)showing typical seasonal sur ,ce synoptic types and typical seasonal
500 ab. synoptic type; map (scale cl:8 5 000 0003 determined from partial
24
Source No. 86 continued.
graticules) with graphs showing seasonal net headwind or tailwind compo-nents (knots) for flights at 10,000 and 20,000 feet.
1952
87. Ramage, C.S. Relationship of general circulation to normal weatherover southern Asia and the West-n Pacific during the cool season.Journal of Meteorology 9(6):403-408. Lancaster, December 1952. DASM(05) A512j.
..Presents a mcp (scale El:60 000 000j determined from graticules) ofsouthern Asia and the western Pacific, an area extending from 0°-30*N.and 80°-160°E., showing the geographical frequency of the formation ofdepressions by isolines for the season November-April based on data forthe period 1932-1937.
1953
88. Ca-ada. Department of Mines and Technical Surveys. ieographical Branch.Indo-China. Foreign Geography Information Series No. 6. pp. 16-18.Ottawa, 1953. DLC DS534 C34.
...Contains maps (scale Cl: 7 125 000 determined from partrfl graticules)of Indochina with summer and winter monsoon winds by arrows; mean iso-therme (*F.) for January, April, July an( October; annual mean totalprecipitation amount (in.) by hatched areas; climatic regions by hatchedareas.
89. Indochina, French. Service Mete'orologique Resume' mensuel du temps enIndochine (Monthly weather summary in Indochina). 1949-1953. (InFrench). DAS M06.1/596 V666r.
...See abstract under "Vi _nam. Directicn de la Mhteorologie, Bulletinmensuel du temps."
90. U.S. Quartermaster Research and Development Center, Natick, Mass.Environment of Southeast Asia. Environmental Protec ion Division ReportNo. 219. 45 pp. August 1953. DAS M86 U585r.
...Contains the following: polychrome maps (scale C1:14 500 0003 deter-mined from partial graticules) of So.,theast Asia (Burma, Thailand, Laos,Cambodia, South Vietnam, North Vietnam and Malaya) witai summer (June-August) and winter (December-February) mean total amount (inches) ofprecipitation and prevailing winds by arrows based on data for an un-specifici period; map (scale r1: 14 500 000" determined from partialgrati:ules) of Southeast Asia with graphs showing the monthly mean andmean daily maxitum and minimum temperatures at individual stationswhich include Saigon, Cap Padaran and Quang Tri in South Vietnam.
25
1954
91. Indo-China, French. Service cte'orologique Bulletin lWteorolosique(Meteorological bulletin). 1953 and 1954. Title varies: Bulletinjournalier prior to November 1953. (In French). DAS M09.2/596 141b.
...This source, superseded by "Vietgam. Service Meteorologique, Cartegenerale, 00 11," presents surface daily weather maps (scale 1:30 000000 at 60*N., stereographic projection for January 1953-April 1954,November and December 1954; scale 1:20 000 000 at 22033'N., Mercatorprojection for May-November 1954) of Indochina and adjacent areas withisobars and pl'trted data (temperature, total cloud amount, wind directionand speed, pressure, dew point temperature, present weather, precipitationin 24 hours, height of the base of clouds lower than 2500 m. and amountof clouds with height of base lower than 2500 m.) for individual stationsat OOOOZ; daily maps (scale 6:30 000 OOQ for January 1953-April 1954,November and December 1954; scale rl:40 000 000 for May-November 1954)of Indochina and neighboring regions with plotted pilot balloon data(wind direction and speed) at 1-2 specified hours at heights of 300,900 and 1500 m. at individual stations, daily maps (scale Cl: 25 000 0003for January 1953-April 1954, November and December 1954; scale C1:2 1 50000 for May-November 1954) of Indochina and neighboring areas withisohypses at 0300 and 150OZ, isotherms at 0300 and 1500Z, plotted rawin-sonde and/or pilot balloon observations (wind direction and speed) at1-2 specified hours at individual stations and plotted radiotheodoliteobservations (geopotential height, temperature and dew point temperature)at 0000 or 0200Z at Hanoi in North Vietnam and Saigon in South Vietnamat levels of 700 and 500 mb.
92. Sanderson, Robert W. Notes on the climate of Indochina. Weatherwise7(3):56-59, 69. Boston, June 1954. MS M(05) W362.
...Presents maps (scale L1:19 000 000j determined from marginal graticuleticks) of Indochina showing the prevailing surface wind flow by arrowsfor summer monsoon (June-August) and winter monsoon (December-February)based on data for an unspecified period; distribution of mean amount ofprecipitation by crosshatching for summer (June-August)and winter (Decem-ber-February) based on data for an unspecified period. The source alsocontains maps (scale C1:64 000 0003 determined from marginal graticuleticks) of Indochina and adjacent sea area with isolines showing thenumber of occurrences of typhoons per 2° square in a 25-year period forsuumaer~ne-August) and autumn (September-November).
93. U.S. Air Weather Service. Weather and climate of Indochina. 101 pp.June 1954. DAS 82.2/596 U5815w.
...Presents maps (scale r1:7 300 000. determined from partial graticules)of Indochina showing the topography; location of stations; seasonal (June-August, December-February) mean wind speed and prevailing direction byarrows and numerical values for individual stations (Tourane, Qui N1hon,Nha Trang, Cap Padaran, Saigon and Ile Poulo Obi in South Vietnam), pre-vailing surface wind flow by arrows, areas with >70% cloud cover andareas with >45" of rain for June-August and with >10"1 of rain for November-
26
Source No. 93 continued.
January. The source also contains maps (scale rl:7 500 00.3 determinedfrom graticules) of Indochina with graphs showing monthly mean numberof days with thunderstorms for individual stations (Tovraae, Nha Trangand Saigon in South Vietnam) based on data for an unspecified period,monthly mean and mean extreme temperatures (*F.) at representativestations for specified periods (Quang Ngai - 33 years, Nha Trang - 33years and Saigon - 31 years in South Vietnam), monthly mean relativehumidity at selected stations for designated period- (Quang Ngai - 10years, Saigon - 21 years and Nha Trang - 13 years in South Vietnam),monthly mean total amount (inches) of precipitation at selected stationsfor specified periods (Quang Ngai - 33 years, Nha Trang - 33 years andSaigon - 33 years in South Vietnam), monthly mean number of days withprecipitation >0.004" at individual stations (Quang Ngai, Nha Trang andSaigon based on data for 34 years), monthly mean cloud coverat specifiedstations (Quang Fgai, Nha Trang and Saigon in South Vietnam based on33 years of data), bimonthly mean frequency (%) of observations withceilings <3280 and <655 ft. at 0600 and 1300 LST at selected stations(Tourane, Qui Nhon, Cap Padaran and Saigon in South Vietnam) based ondata for an unspecified period, bimonthly mean frequency (%) of obser-vations with visibility <2.5 and-C.5 mi. at 0600 and 1300 LST for repre-sentative stations (Tourane, Qui Nhon, Cap Padaran and Saigon in SouthVietnam) based on data for an unspecified period, monthly mean numberof days with haze at 0600 and 1300 LST at selected stations (Tourane,and Saigon based on 7-8 years of data), and monthly mean number of dayswith specified operational weather conditions (contact flying, mediumlevel operations and high level operations) at 0600 and 1300 LST atindividual stations (Tourane, Nha Trang and Saigon in South Vietnam basedon periods of 7-8 yearq maps (scale L1: 7 300 0001 determined fromgraticules) with descriptive data on the geography of the Indochinacoastal region; maps (scale Cl:7 500 000. determine" from partial grati-cules) of Indochina showing the distribution of months with low waterand high water in streams; map (scale Cl: 3 950 O00W determined fromgraticules) of Indochina showing the location of weather stations andairports.
94. Vietnam. Service Mtorologique ResumA mensuel du temps en Indochine(Monthly weather summary in Indochina). 1954. (In French). DASM06.1/596 V666r.
...See abstract under "Vietnam. Direction de la Mitiorologie, Bulletin
mensuel du temps."
1955
95. Ramage, C.S. The cool-season tropical disturbances of Southeast Aia.Journal of Meteorology 12(3):252-262. Lancaster, 1955. DAS X(05) A512j.
...Contains maps (scale cl:75 000 0003 determined from marginal coordi-nates) of India and southeast Asia showing the positions of a tropcaltrough on March 25, 27, 29 and 31, 1953 and on April 2, 1953 as it
F ____
27
Source No. 95 continued.
moved eastward from India across the Bay of Bengal, Indochina, westernpart of the China Sea and the central part of the China Sea.
96. Watts, I.E.M. Eguatorial weather with particular reference to SoutheastAsia. 224 pp. New York, 1955. DAS M82 W349e.
...Includes a map (scale rl:64 500 000j determined from graticules) ofSoutheast Asia with mean dates of onset of northeast monsoons by isolines;maps (scale Cl: 65 000 000. determined from marginal graticule Licks) ofSoutheast Asia south of approximately 20*N. with surface streamlines forJanuary, April, July, and October; maps (scale C1: 30 000 0003 determinedfrom partial graticules) of Southeast Asia with mean rainfall amount(inches) by hatched areas for January, April, July and October; map(scale Cl: 22 500 000 determined from partial graticules) of SoutheastAsia south of 15*N. with annual rainfall amount (inches) by hatchedareas; maps (ccale rl:55 000 0003 determined from marginal graticuleticks) of Southeast Asia south of 15*N. showing wind streams at 20,000 ft.for summer and winter and at 30,000 ft. for winter.
1957
97. Thailand. Meteorological Departme- Monthly and annual rainfall ofThailand for 1955. (In Thai and English). Bangkok, January 1957.DAS M06.1/593 T364mr.
...Presents maps (scale C1: 21 500 O00J determined from graticules) ofSoutheast and East Asia and adjacenL sea areas showing the typhoon anddepression tracks in 1955. Several of these crossed the Indochinesecoast and at least one of them entered South Vietnam.
98. U.S. Hydrographic Office. Sailing directions for the western shoresof the South China Sea froj singapore Strait to and including Hong Kong.H.O. Pub. No. 125. Fifth edition. 458 pp. Washington, 1957. DSM82/512.3 U58s.
...Includes a map (scale C1: 27 000 000;) of the western Pacific Ocean andcoastal areas with typical typhoon tracks.
99. U.S. Office of Naval Operations Marine climatic atlas of the world.Volume III. Indian Ocean. N&VAER 50-lC-530. Washington, September 1957.DS K82.3 U585m Oversize.
...Includes maps (scale C1: 4 0 000 0003) of the Indian Ocean area withcircular tables showing for individual stations the seasonal frequencyof wtnd component aiding (increasing) aircraft ground speed by specifiedspeeds (>20, >40, >60, >80 and >100 knots) at levels of 850, 700 and 500mb.; circular tables showing the seasonal percentage frequency of windcomponent retarding (decreasing) aircraft ground speed by specified speeds(>20, >40, >60, >80 and >100 knots) at levels of 850, 700 and 500 mb.;seasonal wind roses at 850, 700 and 500 mb. Data are recorded for Saigon I
28
Source No. 99 continued.
(Tan-Son-Nhut Airport) based on data for the period January 1951-November 1955.
1958
100. Chin, P.C. Tropical cyclones in the western Pacific and China Sea area.Hong Kong, 1958. DAS M15.2 C539tr.
...Includes maps (scale rl:12 500 0007) of the area bounded by latitudes5'N. to 30°N. and longitudes 105*E. to 1500E. with the tracks of tropicalcyclones for each month, the tracks of tropical cyclones which gave riseto persistent gales at the Royal Observatory at Hong Kong for each month(June-November), abnormal typhoon tracks, typical typhoon tracks, fre-quencies of occurrence of tropical cyclones by isolines for each month(June-November),graphs showing the number of occurrences of tropicalcyclones for each 2-1/2* square by months, monthly and annual rosesshowing the percentage frequency distribution of the direction of motionof tropical cyclones for each 2-1/2* square and graphs showing the per-centage frequency distribution of the speed of motion of tropicalcyclones for each 2-1/2 ° square for each month (June-December). Thesemaps are based on data for the period 1884-1953.
101. Thompson, Will F. Analogs of Canal Zone climate in India and SoutheastAsia. U.S. Quartermaster Research and Engineering Center, Natick, Mass.Technical Report EP-91. 24 pp. June 1958. DAS M86 U585t.
...Presents maps (scale rl:16 875 0002 determined from graticules) ofIndia and Southeast Asia with the location of stations; numerical valuesof mean relative humidity for the driest month at individual stations;numerical values of mean cloud amount (tenths) and mean wind speed (mph)for the wettest month at individual stations; numerical values at indi-vidual stations and crosshatching of areas closely analogous with BalboaHeights and Cristobal of mean temperature for the warmest month and forthe coldest month, mean daily maximum temperature and mean daily rangeof temperature for the warmest month, mean daily minimum temperature forthe coldest month, annual mean total precipitation amount, mean totalprecipitation amount for the wettest month, and number of wet months;composite of areas closely analogous with Balboa Heights and withCristobal by crosshatching. Warmest, coldest, driest and wettest monthsvary by station. The individual stations include 19 stations in SouthVietnam. The period of record is not specified.
102. United Nations Location of hydrologic and rainfall stations. No. 1.Map No. 1074X. May 1958. DLC Map Division.
... Is a map (scale rl:4 900 000.) of Laos, Cambodia and part of SouthVietnam showing the location of the existing recording rainfall stationsand the proposed rainfall stations.
29
103. Vietnam. Service Meteorologique Climatic charts. Average precipita-tion in Vietnam, Laos and Cambodia. (In Vietnamese and English). DSM06.1/596 V666ci.
...Consists of polychrome maps (scale r1:72 000 OOOJ) of North Vietnam,South Vietnam, Laos, and Cambodia showing the distribution of the monthlyand annual amount of precipitation (mm.) based on data summarized overan unspecified period.
104. Vietnam. Service Meltgorologique Typhoon tracks. Approximate tracks oftyphoons which entered the southern China Sea (from 1948 to &9571-
(In Vietnamese and English). 1958. DAS M15 "3 V666ty.
...Consists of maps (scale C1: 19 500 000j) showing the monthly typhoontracks which entered the southern China Sea from 1948 to 1957. Someof these dissipated on land areas of North Vietnam, South Vietnam,Laos, and Cambodia.
1959
105. France. Service Hydrographique Instructions nautiques. Detroit de
Malacca, PresquIlle de Malacca, Indochine (Sailing directions. MalaccaStraits, Malacca Peninsula, Indochina). Sgrie K(IV). 403 pp. (iiFrench). Paris, 1959. M-HO FR VK 905 v.1 1959.
...Includes maps (scale rl:165 000 000j) of South Asia and Australiawith mean isobars and wind by arrows for January and July based ondata summarized over an unspecified period and maps (scale 1:27 500 000 )of Indochina and the South China Sea showing typhoon trajectories basedon data for the period (1911-1929) for each month (August, October andDecember).
106. U.S. Operations Mission to Vietnam, Division of Agriculture ano Natural
Resources Vietnamese agricultural statistics. 55 pp. Saigon, March1959. DNAL 173.2 IN8Vi.
...Includes a map, scale is not indicated (about 1:6 000 000), of SouthVietnam with annual mean amount (inches) of rainfall by hatched areas andmaps, scale is not indicated (about 1:14 000 000), of South Vietnam withmean amount (inches) of rainfall by hatched areas for January, April,July and October.
1960
107. Ramage, CS. (ed.) Notes on the meteorology of the tropical Pacificand southeast Asia. U.S. Air Force, Cambridge Research Center, Geo-physics Research Directorate, Air Force Surveys in Geophysics, No. 126.174 pp. Bedford, Massachusetts, June 1960. DAS M(055) U58as.
...Includes the following: maps (scale L1: 38 000 000. determined frommarginal graticule coordinates) of southeast Asia (5-40"N., 65°-140E.)showing mean resultant 30,000 ft. winds (direction by arrows; isotachs
in knots) and axis of southern jet stream for winter; maps (scale
B _ _ _ _ _
I
30
Source No. 107 continued.
r1:37 000 OOOj determined from marginal graticule ticks) of southeastAsia (00-350N., 95*-145°E.) with mean isonephs (oktas) for December,March, May and August. The appendices consist of reprints of articlesby C.S. Ramage. Abstracts of these articles which contain maps ofsoutheast Asia appear in this bibliography
108. VitvitskiY, G.N. Klimaty zarubezhnoY Azii (Climates in Asia outsidethe U.S.S.R.). 396 pp. (In Russian). Moscow, 1960. DAS MB2.1/5 V854kl.
...Includes maps (scale C1:80 000 000 determined from graticules) ofsoutheast Asia (5°-40*N., 80*-145*E,) showing the air current -t theheight of 3 km. by arrows for April, second half of June and fi.st halfof July, second half of July, and August; map (scale l:ll 200 0003determined from graticules) of Indochina showing the annual distributionof mean total amount of precipitation (mm.) by hatched areas. Thesemaps are based on data for an unspecified period. Additional maps inthe source are for larger areas.
1961
109. Bunnag, C.V. and Buajitti, K. Upper wina over southeast Asia andneighboring areas. 48 pp. Bangkok, August 1961. DAS M57.2 B942 upOversize.
...Presents maps (scale e1:30 000 000J) of southeast Asia (60°E.-150E.,100S.-450N.) with monthly mean streamlines at heights of 5,000 and10,000 feet based on data for the period 1956-1958.
110. Chambers, Jack V. An environmental comparison of southeast Asia and theisland of Hawaii. U.S. Quartermaster Research and Engineering Command,Natick, Massachusetts, Research Study Report RER-38. January 1961.
EDS-Foreign Branch files.
...Includes polychrome maps (scale Cl: 14 500 0003) of Southeast Asiawith annual mean isohyets (inches) and seasonal (June-August; December-
February) mean isohyets and prevailing surface wind direction by arrows.
111. Dobby, E.H.G. Monsoon Asia. 381 pp. Chicago, 1961. DAS 915 D632mo.
... Presents maps (scale C1: 9 0 000 000j determined from graticules)
showing the air masses and movements over Monsoon Asia at the year-endand at mid-year based on data for an unspecified period.
112. Kendrew, W.C. The climate of the continents. Fifth edition. 608 pp.
Oxford, 1961. DAS NO K33c.
*..Presents the following: map (scale C1:120 000 Oflldetermined frompartial graticules) of southeastern Asia showing the trajectories ofdominant air-masses on page 194; map (scale 6 :80 000 0003 determinedfrom graticules) of southeastern Asia and Indonesia with January andJuly mean isobars (inches) and streamlines on page 215; map (scale
31
Source No. 112 continued.
El:60 000 000j determined from graticules) of southeastern Asia andadjacent sea areas with monthly generalized typhoon tracks.
113. Vietnam. Direction de la W4teorologie Resume mensuel du camps (Monthlyweather summary). 1955-1961. (In French). Saigon. DAS 1406.1/596V666r.
...See abstract under 'Vietnam. Direction de Ia Meteorologie, Bulletinmensuel du temps."
114. Vietnam. Service Mteorologique Bulletin mteorologique Journalier(Daily meteorological bulletin). 1955-1961. (In French). Saigon.DAS M09.2/596 V666b.
...See abstract under "Vietnam. Direction de ia ?4 teorologie, Cartegen~rale 00 UT."
1962
115. !achigan. University. Department of Geography Analysis of geographicand climatic factors in coastal southeast Asia. Report No. 04231-1-F.178 pp. Ann Arbor, Michigan, March 1962. S M(051) M624ana.
...Presents the following: maps (scale C1:14 250 0007 determined frompartial graticules) of southeast Asia with mean isohyets (also hatchedareas) in inches and prevailing surface wind direction by arrows based
on data for an unspecified period for 2 seasons (June-August; December-
February); map (scale r1:12 125 000) determined from marginal graticuleticks) of southeast Asia with graphs showing monthly amounts of preci-pitation and numerical annual amounts in inches for individual stations(Saigon, Dalat, Nha Trang and Hue in South Vietnam) based on data foran unspecified period; map (scale C1: 12 125 0003 determined frommarginal graticule ticks) of southeast Asia showing the precipitationregions and location of weather stations (16 stations in South Vietnam);maps, scale is not indicated (about 1:55 000 OO0), of Indo-China andthe South China Sea with monthly (May-January) typhoon tracks during1911-1929.
116. Vietnam. Direction de la Mte orologie Bulletin mensuel du teMs(Monthly weather bulletin). 1949-...(December 1962). Title andissuing office vary: Indochina, French. Service Miteorologique, R4*wsemensuel du temps en Indochine for 1949-1953; Vietnam. Service Mlteorolo-gique, Re'sum mensuel du temps en Indochine for 1954; Vietnam. Directionde la MHteorologie, Resume mensuel du temps for 1955-1961. (In Vietnameseand French). Saigon. MS M06.1/96 V666r.
...Presents maps (scale 1:5 750 000j) of Indochina showing monthlynumerical values of total a mount of precipitation, departure of totalprecipitation from the mean, total number of days with precipitationand departure of total number of days with precipitatio- from the
mean for each year 1952-1954; maps (scale c :5 750 O00.) of Indochina
32
Source No. 116 continued.
showing the position of precipitation stations for individual yearsduring the period 1952-1962; maps (scale 1:7 500 000) of Mercatorprojection showing the position of Indochinese precipitation stationsfor each year (1949-1951); maps (scale rl:5 750 000j) of Indochinashowing network of meteorological stations for individual years duringthe period 1954-1962; maps (scale CI:20 000 000) of China Sea areashowing the trajectories of tropical disturbances and cyclones forindividual years during the period 1953-1962; maps, scale is not indi-cated (about 1:13 000 000), of Indochina with monthly wind roses atheights of 500, 1500, 3000 and 5000 m. at 0600 or 0800 for individualstations and monthly surface wind roses at specified hours for designatedstations for 1956-1958. The volumes with data for 1960 and 1961 werenot available for this survey.
1963
117. Gabites, J.F. The origin of tropical cyclones. Technical Report ofthe Japan Meteorological Agency, No. 21. Proceedings of the Inter-regional Seminar on Tropical Cyclones in Tokyo, 18-31 January 1962.pp. 53-58. Tokyo, March 1963. DAS M(055) J35rep.
...Includes maps (scale Cl:135 000 000) of the tropical Pacific andsoutheast Asia showing the depths of the main air streams in Februaryand August, constructed from monthly mean data and charts for the850, 700, 500, 300 and 200 mb. surfaces by C.J. Wiederanders.
118. Vietnam. C.ng-Hba. NbA Giam-D6c Khf-tvong 4D#i-lubc thk-tit n~m(Annual weather summary). 1961-1963. (In Vietnamese). Saigon. DAS.
...fPresents maps (scale Cl: 14 000 0001) of the China Sea area (7°N.-29*N., 98°E.-133*E.) showing the trajectories of tropical depressionsand typhoons for each year (1961-1963).
1964
119. bucknell, J. Climatology. 163 pp. London, 1964. DAS M8 B925c.
...Includes maps, scale is not indicated (about 1:45 000 000), ofIndochina and the Philippines showing the summer and winter winddirections by arrows on page 69.
120. U.S. Air Weather Service. Climatic atlas of Indochina (excluding Malayaand Barma), Special Study 105-6. San Francisco, December 1964. DASM(O5S5)U.
... Presents maps (scale Cl:9 250 0002) of Indochina (Cambodia, Laos,Thailand, South Vietnam and North Vietnam) with monthly mean maximumand man minaam isotherms (*F.), mean isohumes (%), mean number ofdays with precipitation by isolines, maximum and minimum isohyets(inches), man isohy*ts (inches), maximum amount of precipitation (inches)in 24 hours by isolines, mean number of days with thunderstorms by isolines,
33
Source No. 120 continued.
mean number of days with fog by isolines, mean isonephs (%), mean numberof days th total cloud cover <3/10 and >7/10 by isolines, mean numberof days th total cloud cover <3/10 and visibility 22-1/2 miles at 0600and 1300 LST by isolines, mean number of days with cloud cover below10,000 feet <3/10 and visibility >2-1/2 miles at 0600 and 1300 LST byisolines, mean number of days with ceiling >1000 feet and visibility>2-1/2 miles at 0600 and 1300 LST by isolines, mean number of dayswith ceiling >1000 feet and visibility >2-1/2 miles and wind <10 knotsat 0600 and 1300 LST by isolines and mean isobars (m':s.). There isalso a topography map (scale Cl:9 000 000j) of the same area. Themaps are based on data for 2-50 years.
121. U.S. Operations Mission. Civil Aviation Assistance Group. Directorateof Meteorology Climatological information for meteorological stationsof the Republic of Vietnam. March 1964. DAS M82.3/596 U58cl.
... Presents maps, scale is not indicated (about 1:6 600 000) of SouthVietnam, North Vietnam, Laos and Cambodia with monthly and annual mean 5
isohyets (in.) based on Average Precipitation Charts published byDirection of Meteorology, Republic of Vietnam, 1958.
122. Vietnam. Direction de la Meteorologie Carte g~n~rale 00 UT (Generalmap at OOZ). 1955-...(December 1964). Title and issuing office vary:Vietnam. Service M~teorologique, Bulletin meteorologique journalierprior to 1961. (In French). Saigon. OAS Oversize maps.
.Supersedes "Indochina, French. Service Meteorologique, Bulletinmeteorologique," 1953 and 1954. This source contains daily weathermaps (scale C1: 30 000 0003, stereographic projection) with mean iso-bars, fronts and plotted data (r'p... ., dew poi-t temperature,low cloud types, middle cloud types, wind direction and speed, totalcloud amount, present weather and past weather) for individual stationsat OOOOZ for 1955-1964 and maps (scale r1: 30 000 0007, stereographicprojection) with isohypse at 0300 and 150OZ, isotherms at 0300 and150OZ and plotted wind data for individual stations for January 1955-June 1956. The section of Asia covered by these maps varies but withinthe general area of 0"-550 N., 70'E.-160"E.
1965
123. Ohman, Howard L. Climatic atlas of Southeast Asia (Temperture, rain-fall, temperature-humidity index). U.S. Army Natick Laboratories,Natick, Massachusetts, Technical Report ES-19. 94 pp. December 1965.AS M(055) U586te ES-19.
...Consist, polychrome maps (scale C1: 6 600 0003) of Southeast Asiashowing the location of stations, the distribution of monthly meantemperatures (*F.), the distribution of monthly mean daily maxisam andminimum temperatures ('F.), the distribution of absolute saxmim andminimum temperatures (F.), the distribution of monthly and annual meantotal precipitation amounts (inches), the distribution of monthly meannumber of rainy days and the distribution of the temperature-humidityindex.
34
124. U.S. Air Wenthir Service Climate of Republic of Vietnam. SpecialStudy 105-9. 118 pp. APO San Francis , 1965. OAS M(055) U58s 105-9.
...Includes a map, scale is not indicated (about 1:5 000 000), of theRepublic of Vietnam showing the location of stations; maps, scale isnot indicated (about 1:10 000 000), showing tle tracks of typhoonsand tropical storms affecting the Repuhlic of Vietnam during theperiod 1947-1964 for each month (April, June, September, October,November and December); maps, scale is not indicated (about 1:8 000 000)of the Republic of Vietnam showing the distribution of January, April,July and October mean maximum and minimum temperatures ('F.), meanrelative humidity (%), mean total amount of precipitation (inches),mean number of days with precipitation, mean number of days withthunderstorms, mean number of days with total cloud cover <3/10 andmean number of days with fog; maps, scale is not indicated (about1:12 000 000), of the Republic of Vietnam with isolines showing theJanuary, April, July and October distribution of peLent of time withceilings, percent of time with ceilings below 30,000 ft., percent oftime with ceilings below 10,000 ft., percent of time with ceilingsbelow 3,000 ft., percent of time with ceilings between 5,000 and10,000 ft., percent of time with ceilings between 10,000 and 15,000ft., percent of time with ceilings between 20,000 and 25,000 ft.,percent of time with ceilings between 25,000 and 30,000 ft., andpercent of time with visibilities < 5 miles and < I mile for specifiedintervals (0300-0800 and 0900-1400); maps, scale is not indicated(about 1:8 000 000), of the Republic of Vietnam with January, April,July and October mean number of days with ceilings >1000 ft. andvisibility >2-1/2 miles at 0600 and 1300 LST; map, scale is not indi-cated (about 1:9 000 000), of the Republic of Vietnam with January,April, July and October prevailing surface streamlines.
125. U.S. Air Weather Service Climatic brief for the Republic of Vietnam.12 pp. Det. 14, 30th Weather Squadron, APO San Francisco, July 1965.DAS M82.1/592 U581cl.
...Presents a map (scale rl:ll 875 003) of the Indochinese Peninsul&showin the distribution of months of wet season.
126. U.S. Air Weather Service Climatic summary, Republic of Vietnam, NorthVitrna. laos. March. Aril. June and July. APO San Franci:co, 1965.
lIS M02.2/592 U581cl.
...Presents for each month (March, April, June and July) maps (scaleCl, 500 0003) showing the distribution of high water periods ofstream in Indochina; maps (scale rl:7 800 O00) of Intl-china showingthe distribution of mean total amcunt of precipitation and mean numberof days with precipitation; maps (scale CI:ll 600 000j) of SoutheastAsia showing the distribution of the . frequency of occurrences ofvisibilfty g miles at 0700 and 1300 LST by isolines; maps (scaleC1: 9 200 00O0) of Southeast Asia with mean daily maximum isothermsand ntrial values of record high temperatures for selected stationsand mean da ly minimum isotherms with numerical values of reco . low
teperatures at selected stationt; maps (scale rl:ll 500 OO0"J) of
35
Source No. 126 continued.
Indochina showing the distribution of the wet season (months); mapt(scale ri: 11 000 0001) of Southeast Asia showing mean wind flow atlow level (2000 ft.) a4 I at 850, 700, 500, 400, 300 and 200 mb. levelsby arrows; maps (scal, Li: 11 500 000:) of coastal waters of NorthVietnam and the Rep blic of Vietnam with mean sea surface isotherms.There are also maps, scale is not indicated (about 1:11 750 000),showing the distribution of mean number of days favorable for lowlevel operations (ceilings >1500 ft. with visibility >3 miles) andmedium level operations (ceilings >5000 ft. with visibility >5 riles)for June and July; map, scale is not indicated (about 1:15 000 000),for Ap. and maps (scale C1: 7 dO0 0002) for June and July showingthe distribution of mean number of days with thunderstorms.
127. Vietnam. Ceng-h'a Ri-ldtc thbi-tiet th~ng (Monthly weather suimnary).February 1962, January 1963-November 1964 January 1965. (In Vietnamese;leginring in June 1963 table headings are in English). Saigon. DSM06.4/592 V666da.
...Contains maps (scale C1:14 000 000) of the China Sea area (7R .-
29"N., 98*E.-129*E.) showing the trajectories of typhoons and tropicaldisturbances in September, October and November 1964 and January 1965.
1966
128. Fujioka, Yoshikazu An outline of climate of Southeast Asia. WaterResource Utilization in Southeast Asia, Symposium Series III, pp. 51-54. Kyoto University, 1966. DAS M(055) K99sv No. 3.
...ContLinb maps, scale is not indicated (about 1:87 500 000), ofSoutheast Asia, the Philippines and the East Indies with January andJuly mean isobars (mb.) and wind direction by arrows; a map, scale isnot indicated (about 1:50 000 000), of Southeast Abia northernAustralia, East Indies and the Philippines showing the annual distribu-tion of precipitation; maps, scale is not indicated (abouttl:125 000 000]),of Southeast Asia, northern Australia 4nd the Philippines with Januaryand July mean isotherms (*C.).
129, Takenouchi, Toshio A hydrologic study of the Mekon Basin. WaterResource Utilization in Soitheast Asia, Symposium Series III, 4p. 55-66. Kyoto University, 1966. DAS M(055) K99sy No. 3.
...Includes a map, s~ale is not indicated (about 1:9 500 000), ofIndochina showing the distribution of annual mean total precipitationamount (m ) in the lower Me) ong basin area.
130. U.S. Air Weather Service Ceiling/visibility fcr Southeast Asia (50005). Special Study 105-12/2. Various paging#. APO San Francisco,
May 1966. DAS M(C55) U58s 105-12/2.
...Consists of maps (scale r1: 86 000 0003) of Southeast Asia showing
the distribution of monthly mean number of days with cei!'lngs >5000 ft.
36
Source No. 130 continued.
and visibility >5 miles at 0700, 1000, 1300, 1600 and 1900 LST byisolines based on data for 2-10 years.
131. U.S. Air Weather Service Ceilingivisibility atlas for Southeast AsiaJ(1000 & 2-1/2). Special Study 105-12/1. Various pagings. APO SanFrancisco, April 1966. DAS M(055) U58s 105-12/1.
...Consists of maps (scale CI: 87 000 000j) of Southeast Asia showingthe distribution of mean number of days with ceilings >1000 ft. andvisibility 22-1/2 miles at 0700, 1000, 1300, 1600 and 1900 LST byisolines based on data for 2-10 years.
132. U.S. Air Weather Service. Climate of Southeast Asia. Special Study1C5-11/1-12. 12 volumes. APO San Fran-isco, 1965-1966. DAS M(055)U58s 105-11/1-12.
..Presents maps (scale .1:9 000 00Q2) of Southeast Asia showing themonthly distribution of mean number of days with precipitation byisolines, mear )hyets (inches), maximum and minimum monthly amounts(inches) of prz..pitation by isolines, maximum amount of precipitationin 24 hours by isolines, mean number of days with thunderstorms byisolines, mean isonephs (%), mean number of days with total cloudcover <3/10 by isolines, mean frequency of visibility <2 miles at0700 and 1300 by isolines, mean* number of days with fog by isolines,mean maximum and minimum temperatures by isolines, mean isohumes (74,mean position of polar front, mean air flow (knots) at specifiedheights (2000, 5000, 10,000, 20,000, 30,000 and 40,000 ft) prevailingsurface streamlines (April-December), mean number of favorable daysfor low level operations (ceiling >2000 feet and visibility >3 miles),mean number of favorablt days for mid level operations (ceiling >5000feeL and visibility >5 miles), mean number of favorable days for highlevel operatiors (<378 cloud cover below 10,000 feet and visibility>5 miles), mean surplus/deficit rainfall by isolines and mean traction-ability; map (scale rl:11 000 0003) of Southeast Asia with mean seacurrents (knots) and mean sea surface temperatures (*F.); map, scaleis not indicated (about 1:11 000 000), of North Vietnam and Republic ofVietnam with mean frequencies of breakers, sea and swell during north-east monsoon.
133. U.S. Air Weather Service Sky cover/visibility atlas for Southeast Asia(3/10 & 2-1/2). Special Study 105-12/3. Various pagings. APO SanFrancisco, August 1966. DAS M(055) U58s 105..12/3.
...Consists of maps (scale 6l:88 000 0003) of Southeast Asia (3/10 &2-1/2) showing the distribution of monthly mean number of days withtotal sky cover <3/10 and visibility 22-1/2 miles at 0700, J,000, 1300,1600 and 1900 LST based on data for 2-10 years.
37
1967
134. Chang, Jen-hu The Indian sumer monsoon. The Geographical Review57(3):373-396. New York, July 1967. DAS P.
...Presents maps (scale rl:60 000 000v) of Monsoon Asia with meanresultant winds at 700 mb. in April and at 200 mb. in June and meanisotherms at 500 mb. in July.
135. Schutz, C. Monsoonal influences on wind, rain and cloud throughoutsoutheast: A study covering the peninsula and archipelago. ResearchMemorandum 5418-PR. 152 pp. The Rand Corporation, Santa Monica,California, October 1967. DAS 507.2 R186r No. 5418-PR.
...Presents maps (scale rl:97 500 000j) of southeast Asia showing theseasonal mean position of the Intertropical Convergence Zone andtypical surface streamlines for January, April, July and October.There are also maps (scale Cl: 9 300 000) of southeast Asia (Burma,Laos, Thailand, Cambodia and North and South Vietnam) with seasonalwind roses for individual stations; seasonal cloud clocks showingthe frequency of clear days (<1/8-4/8), broken sky (5/8-7/8) and over-cast (8/8) for morning, midday and evening for individual stations;seasonal distribution of precipitation amounts by hatched areas.
136. U.S. Air Weather Service Low level persistency analysis for SoutheastAsia (2000 a/o 3). Special Study 105-13/2. Various pagings. APO SanFrancisco, March 1967. DAS M(055) U58s 105-13/2.
...Consists of maps (scale 61:87 500 0002) of Southeast Asia showing themonthly distribution of percent frequency of ceilings <2000 ft. and/orvisibility <3 mi at 0700, 1300 and 1900 LST; probability of ceilings<2000 ft. and/or visibility <3 mi. at 0700 LST and continuing to 1000LST; probability of ceilings <2000 ft. and/or visibility <3 mi. at 0700LST continuing to 1300 LST; probability of ceilings <2000 ft. and/or visi-bility <3 mi. at 0700 LST continuing to 1600 LST; probability of ceilings<2000 ft. and/or visibility <3 ml. at 0700 LST continuing to 1900 LST;probability of ceilings <2000 ft. and/or visibility <3 mi. at 0700 LST
~continuing to 0700 LST the following day; probability of ceilings <2000ft. and/or visibility <3 mi. at 1300 LST continuing to 1600 LST; proba-bility of ceilings <2000 ft. and/or visibiliLy <3 mi. at 1300 LST continu-ing to 1900 LST; probability of ceilings <2000 ft. and/or visibility <3mi. at 1300 LST continuing to 0700 LST the following day; probability ofceilings <2000 ft. and/or visibility <3 ml. at 1900 LST continuing to 0700LST the following day. The period of record varies from 2-10 yeArs.
137. U.S. Air Weather Service Sky cover/visibility atla3 for Southeast Asia(110 below 10,000 & >5). Special Study 105-12/4. Various pagings.APO San Francisco, January 1967. DAS M(055) U58s 105-12/4....Consists of maps (scale .1:88 000 0002) of Southeast Asia showing the
distribution of the monthly mean number of days with <3/10 sky coverbelow 10,000 ft. and visibility >5 miles at 0700, 1000, 1300, 1600 and1900 LST by isolines. The period of record varies from 2 to 10 years.
39
AUTHOR INDEX
Source Number with Publication Date
Agard, A. 29(1935)*Air Attache, Saigon, Indo-china 76(1950)
Beijonne, A. 2(1902)Braak, C. 19(1931)Brenier, H. 3(1908)Brenier, Henri 5(1914)Bruzon, E. 9(1927), 14(1930), 33(1936):
77(1950)Buajitti, K. 109(1961)Bucknell, J. 119(1964)Bulletin Aconomique de 1'Indochine 18(1930)Bunnag, C.V. 109(1961)
Canada, Department of Hines andTechnical Surveys. GeographicalBranch 88(1953)
Carton, P. 11(1928), 14(1930), 15(1930),23(1934), 24(1934), 25(1934)028(1934), 30(1935), 44(1940),77(1950)
Chambers, Jack C. 110(1961)Chang, Jen-hu 134(1967)Chassigneux, E. 4(1913)Chevy, P. 25(1934)Chin, P.C. 100(1958)Constantin, L. 7(1918)
*Deppermann, Charles E. 37(1938), 45(1940)*Dobby, E.H.G. 65(1945), 78(1950), 111(1961)
France. Service Hydrographique 105(1959)Froc, Aloys 1(1901)Froc, Louis 8(1920)Fujioka, Yoshikazu 128(1966)
Gabites, JF. 117(1963)Garbell, Maurice A. 70(1947)Gherzi, E. 20(1931), 38(1938), 59(1944)Gourdon, Henri 21(1931)Great Britain. Meteorological Office 34(1937), 39(1938), 40(1938),
48(1942), 50(1943), 60(1944),66 (1945)
Guilmet, Bernard 71(1.947)
Hare, F.K. 61k1944), 69(1946?)Hubert, Henry 26(1.934), 31(1935)
40
AUTHOR INDEX (Continued)
Source Number with Publication Date
India. Meteorological Department 51(1943), 52(1943), 62(1944),67(1945), 68(19457), 75(1949)
Indochina. L'Observatoire Central 10(1927)Indo China. Service Geographique 13(1929)Indochina, Service Mhteorologique 16(1930), 17(1930), 27(1934),
41(1939), 89(1953), 91(1954)Indo-China, French. ServiceMeteorologique See Indochina. Service Mete'orologique
Iyer, V. Doraiswamy 42(1939)
j.hn', 6 9(1946?)Jong, Pin-chen 72(1948)
Kao, Y.S. 73(1948)Kendrew. W.G. 112(1961)
Le Cadet, G. 6(1917)Lu, Alfred 43(1939)
McIntosh, D.H. 63(1944)Michigan. University. Department of
Geography 115(1962)Miller, L.C. 53(1943)Morin, Henry G.S. 28(1934)
Ohman, Howard L. 123(1965)
Ramage, C.S. 82(1951), 87(1952), 95(1955),107(1960)
Robequain, Charles 32(1935)Romer, A. 77(1950), 79(1950)RuEsier, Idouard 21(1931)Russier, Henri 21(1931), 54(1943)
Sanderson, Robert W. 92(1954)Schutz, C. 135(3967)Sion, Jules 12(1928)Strahler, Arthur N. 83(1951)
Taiwan(Formosa). Weathei Bureau 46(1941)Takenouchi, Toshio 129(1966)Tao, Shih-Yen 74(1948)Thailand. Meteorological Department 97(1957)Thompson, B.W. 84(1951), 85(1951)Thompson, Will F. 101-1958)Tu, Chang-Wang 35(1937)
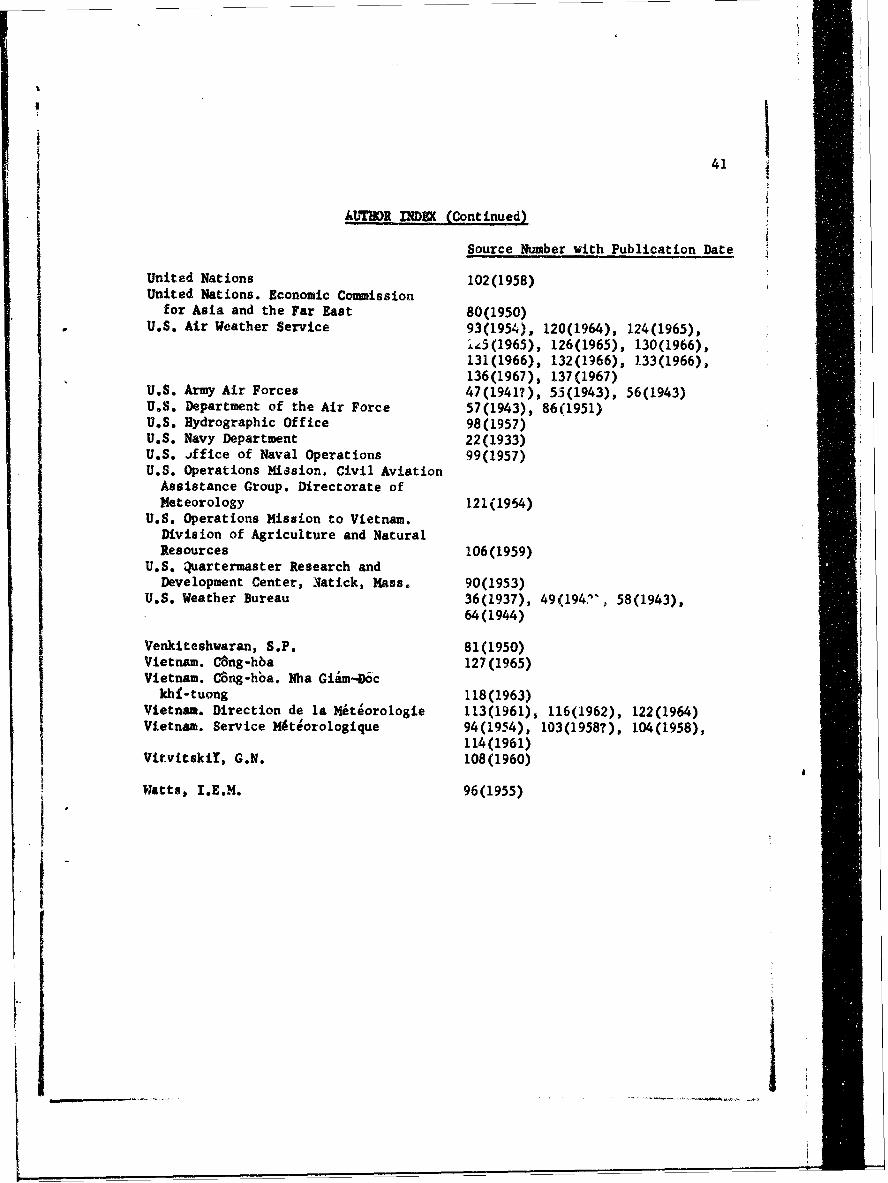
41
AUTHDR INDEX (Continued)
Source Number with Publication Date
United Nations 102(1958)United Nations. Economic Commission
for Asia and the Far East 80(1950)U.S. Air Weather Service 93(19541), 120(1964), 124(1965),
±.Z3(1965), 126(1965), 130(1966),131(1966), 132(1966), 133(1966),136(1967), 137(1967)
U.S. Army Air Forces 47(1941?), 5.5(1943), 56(1943)U.S. Department of the Air Force 57(1943), 86(1951)U.S. Hydrographic Office 98(1957)U.S. Navy Department 22(1933)U.S. .iffice of Naval Operations 99(1957)U.S. Operations Hiasion. Civil AviationAssistance Group. Directorate ofMeteorology 121(1964)
U.S. Operations Mission to Vietnam.Division of Agriculture and NaturalResources 106(1959)
U.S. Quartermaster Research andDevelopment Center, .1atick, Mass. 90(1953)
U.S. Weather Bureau 36(1937), 49(1W4', 58(1943),64(1944)
Venkiteshwaran, S.F. 81(1950)Vietnam. C~ng-hba 127 (1965)Vietnam. C5ng-hoa. Nha Giim-06ckhf-tuong 118(1963)
Vietnam. Direction de la Mitiorologie 113(1961), 116(1962), 122(1964)Vietnam. Service M~tiorologique 94(1954), 103(1958?), 104(1958),
114(1961)VitvitskiY, G.N. 108(1960)
Watts, I.E.M. 96(1955)
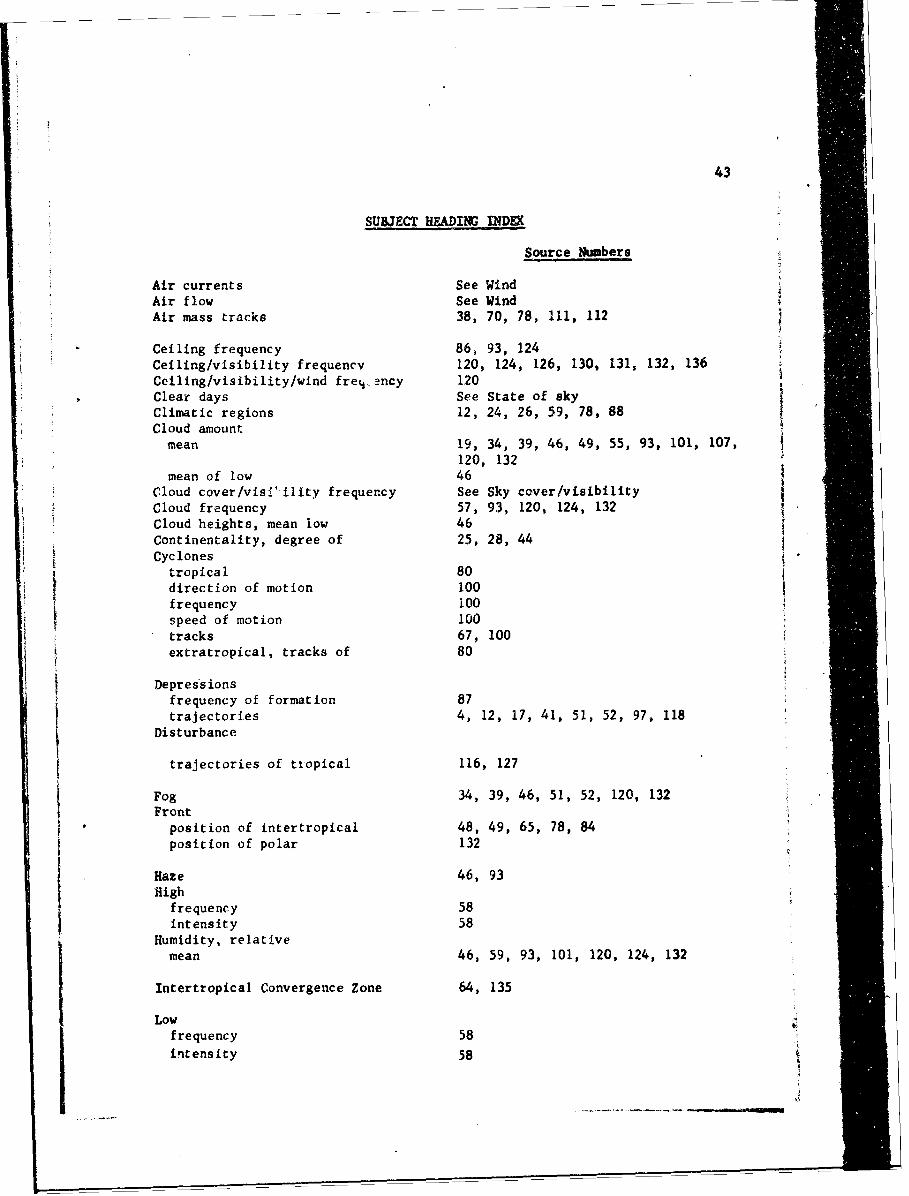
43
SUBJECT HEADING INDEX
Source Numbers
Air currents See Wind
Air flow See WindAir mass tracks 38, 70, 78, 111, 112
Ceiling frequency 86, 93, 124Ceiling/visibility frequency 120, 124, 126, 130, 131, 132, 136Ceiling/visibility/wind freq-ancy 120Clear days See State of skyClimatic regions 12, 24, 26, 59, 78, 88Cloud amountmean 19, 34, 39, 46, 49, 55, 93, 101, 107,
120, 132mean of low 46
Cloud cover/visl' ility frequency See Sky cover/visibilityCloud frequency 57, 93, 120, 124, 132
iCloud heights, mean low 46
Continentality, degree of 25, 28, 44Cyclones
tropical 80direction of motion 100
frequency 100speed of motion 100tracks 67, 100extratropical, tracks of 80
Depressionsfrequency of formation 87trajectories 4, 12, 17, 41, 51, 52, 97, 118
Disturbance
trajectories of tropical 116, 127
Fog 34, 39, 46, 51, 52, 120, 132Front
position of intertropical 48, 49, 65, 78, 84
position of polar 132
Haze 46, 93High
frequency 58intensity 58
Humidity, relativemean 46, 59, 93, 101, 120, 124, 132
Intertropical Convergence Zone 64, 135
Lowfrequency 58intensity 58
I.
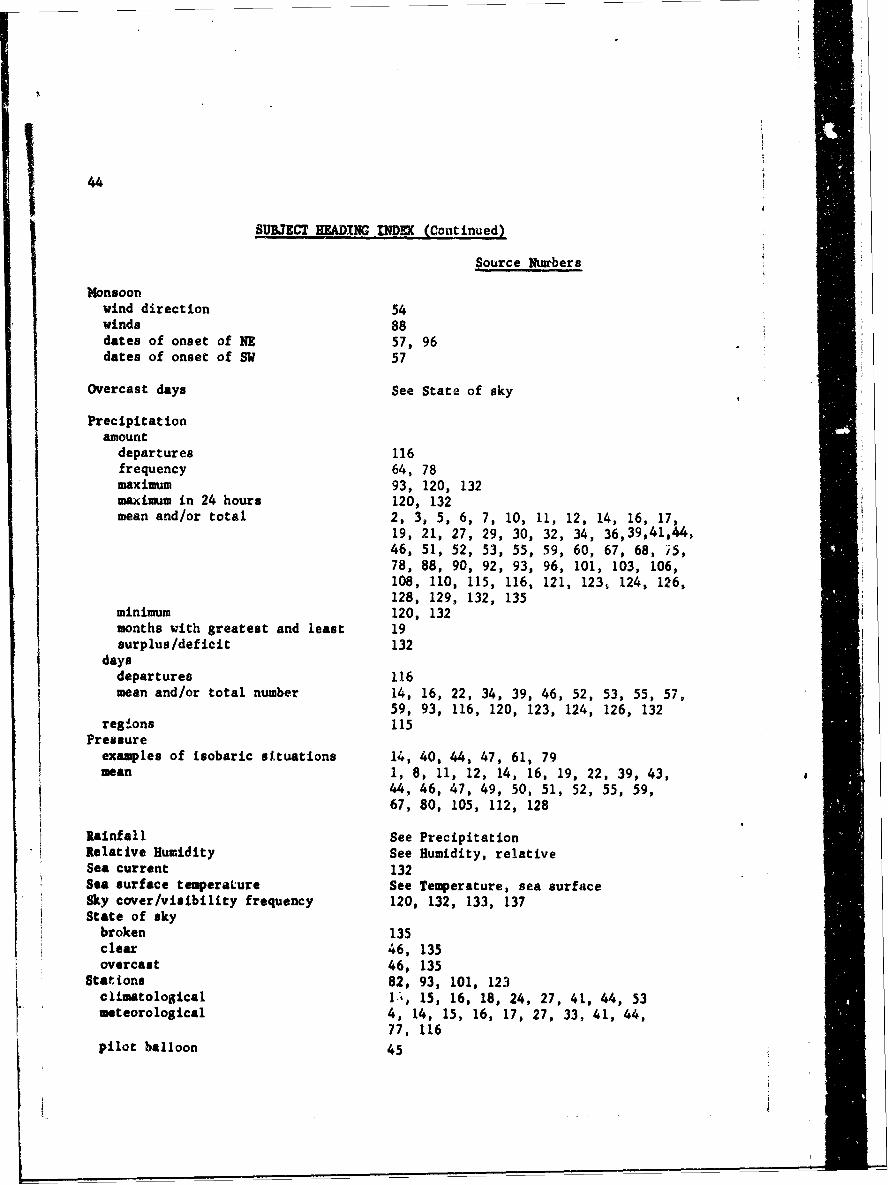
44
SUBJECT HEADING INDEX (Continued)
Source Nurbers
Monsoonwind direction 54winds 88dates of onset of NE 57, 96dates of onset of SW 57
Overcast days See State of sky
Precipitationamountdepartures 116frequency 64, 78maximum 93, 120, 132maximum in 24 hours 120, 132mean and/or total 2, 3, 5, 6, 7, 10, 11, 12, 14, 16, 17,
19, 21, 27, 29, 30, 32, 34, 36,39,41,44,46, 51, 52, 53, 55, 59, 60, 67, 68, 5,78, 88, 90, 92, 93, 96, 101, 103, 106,108, 110, 115, 116, 121, 123, 124, 126,128, 129, 132, 135
minimum 120, 132months with greatest and least 19surplus/deficit 132
daysdepartures 116mean and/or total number 14, 16, 22, 34, 39, 46, 52, 53, 55, 57,
59, 93, 116, 120, 123, 124, 126, 132regions 115
Pressureexamples of isobaric situations 14, 40, 44, 47, 61, 79mean 1, 8, 11, 12, 14, 16, 19, 22, 39, 43,
44, 46, 47, 49, 50, 51, 52, 55, 59,67, 80, 105, 112, 128
Rainfall See PrecipitationRelative Humidity See Humidity, relativeSea current 132Sea surface temperature See Temperature, sea surfaceSky cover/visibility frequency 120, 132, 133, 137State of skybroken 135clear 46, 135overcast 46, 135
Statitons 82, 93, 101, 123climatological 1. , 15, 16, 18, 24, 27, 41, 44, 53meteorological 4, 14, 15, 16, 17, 27, 33, 41, 44,
77, 116pilot balloon 45
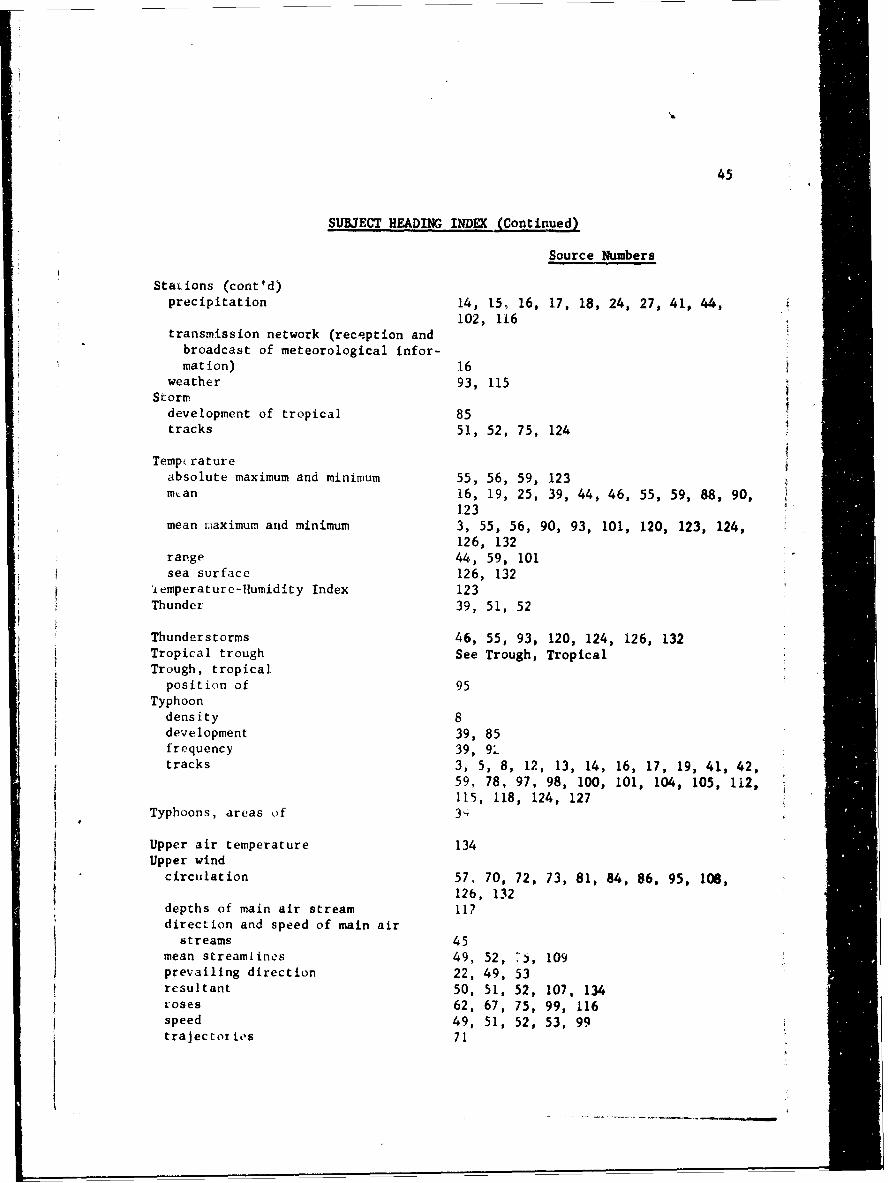
45
SUBJECT HEADING INDEX (Continued)
Source Numbers
Stations (cont'd)precipitation 14, 15, 16, 17, 18, 24, 27, 41, 44,
102, 116transmission network (reception andbroadcast of meteorological infor-mation) 16
weather 93, 115Stormdevelopment of tropical 85tracks 51, 52, 75, 124
Temp ratureabsolute maximum and minimum 55, 56, 59, 123man 16, 19, 25, 39, 44, 46, 55, 59, 88, 90,
123mean liaximum and minimum 3, 55, 56, 90, 93, 101, 120, 123, 124,
126, 132range 44, 59, 101sea surface 126, 132
lemperature-Humidity Index 123Thunder 39, 51, 52
Thunderstorms 46, 55, 93, 120, 124, 126, 132Tropical trough See Trough, TropicalTrough, tropicalposition of 95
Typhoondensity 8development 39, 85frequency 39, 9tracks 3, 5, 8, 12, 13, 14, 16, 17, 19, 41, 42,
59, 78, 97, 98, 100, 101, 104, 105, 112,115, 118, 124, 127
Typhoons, areas of 3i
Upper air temperature 134Upper windcirculation 57, 70, 72, 73, 81, 84, 86, 95, 106,
126, 132depths of main air stream 117direction and speed of main air
streams 45mean streamlines 49, 52, 7J, 109prevailing direction 22, 49, 53resultant 50, 51, 52, 107, 134roses 62, 67, 75, 99, 116speed 49, 51, 52, 53, 99trajectories 71
II
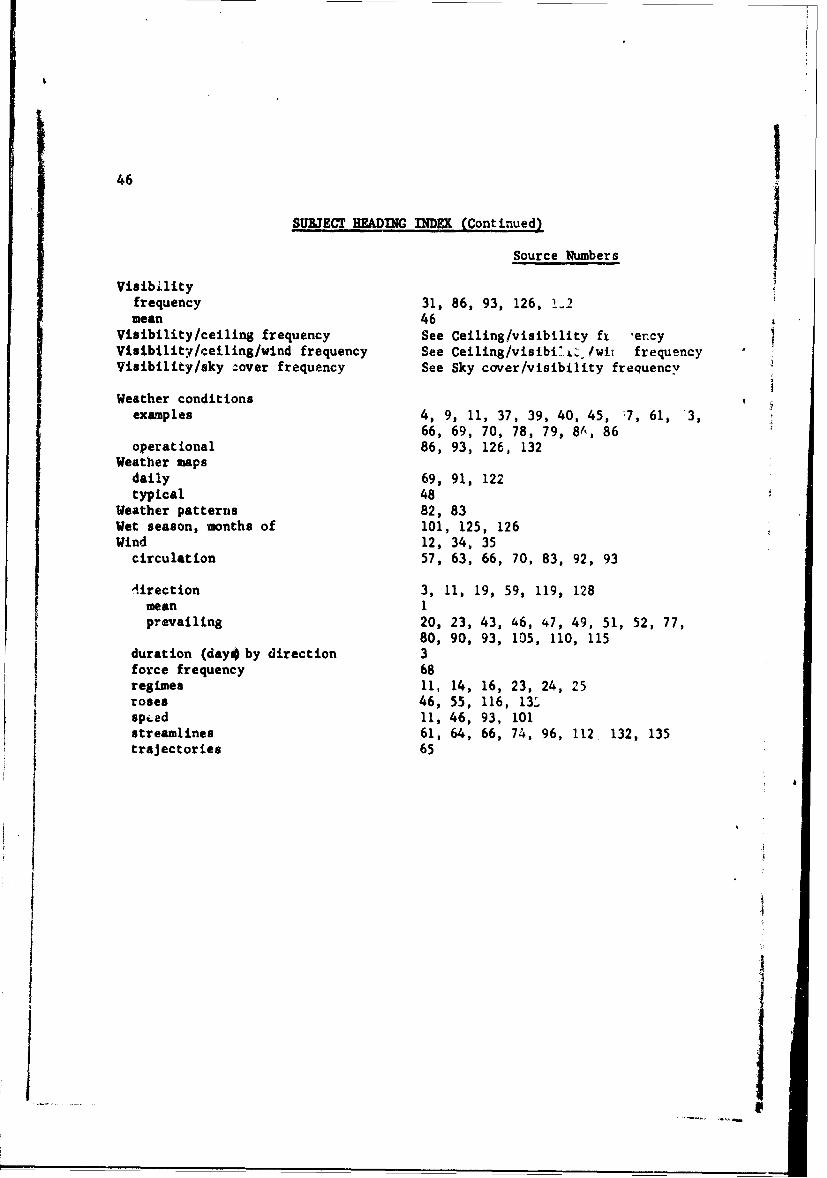
46
SUBJECT HEADING INDEX (Continued)
Source Numbers
Visibilityfrequency 31, 86, 93, 126, !,2mean 46
Visibility/ceiling frequency See Ceiling/visibility fx 'encyVisibility/ceiling/wind frequency See Ceiling/visibi>L ' /wi, frequencyVisibility/sky zover frequency See Sky cover/visibility frequency
Weather conditionsexamples 4, 9, 11, 37, 39, 40, 45, 7, 61, -3,
66, 69, 70, 78, 79, 8A, 86operational 86, 93, 126, 132
Weather mapsdaily 69, 91, 122typical 48
Weather patterns 82, 83Wet season, months of 101, 125, 126Wind 12, 34, 35
circulation 57, 63, 66, 70, 83, 92, 93
direction 3, 11, 19, 59, 119, 128mean 1prevailing 20, 23, 43, 46, 47, 49, 51, 52, 77,
80, 90, 93, 105, 110, 115duration (daym by direction 3force frequency 68regimes 11, 14, 16, 23, 24, 25roses 46, 55, 116, 13sped 11, 46, 93, 101streamlines 61, 64, 66, 74, 96, 112, 132, 135trajectories 65
a