Embed Size (px)
Citation preview
Segura et al. BMC Bioinformatics 2012, 13:222http://www.biomedcentral.com/1471-2105/13/222
RESEARCH ARTICLE Open Access
Wavelet-based detection of transcriptionalactivity on a novel Staphylococcus aureus tilingmicroarrayVıctor Segura1*, Alejandro Toledo-Arana2, Maite Uzqueda1, Inigo Lasa2 and Arrate Munoz-Barrutia3
Abstract
Background: High-density oligonucleotide microarray is an appropriate technology for genomic analysis, and isparticulary useful in the generation of transcriptional maps, ChIP-on-chip studies and re-sequencing of thegenome.Transcriptome analysis of tiling microarray data facilitates the discovery of novel transcripts and theassessment of differential expression in diverse experimental conditions. Although new technologies such asnext-generation sequencing have appeared, microarrays might still be useful for the study of small genomes or forthe analysis of genomic regions with custom microarrays due to their lower price and good accuracy in expressionquantification.
Results: Here, we propose a novel wavelet-based method, named ZCL (zero-crossing lines), for the combineddenoising and segmentation of tiling signals. The denoising is performed with the classical SUREshrink method andthe detection of transcriptionally active regions is based on the computation of the Continuous Wavelet Transform(CWT). In particular, the detection of the transitions is implemented as the thresholding of the zero-crossing lines. Thealgorithm described has been applied to the public Saccharomyces cerevisiae dataset and it has been compared withtwo well-known algorithms: pseudo-median sliding window (PMSW) and the structural change model (SCM). As aproof-of-principle, we applied the ZCL algorithm to the analysis of the custom tiling microarray hybridization results ofa S. aureus mutant deficient in the sigma B transcription factor. The challenge was to identify those transcripts whoseexpression decreases in the absence of sigma B.
Conclusions: The proposed method archives the best performance in terms of positive predictive value (PPV) whileits sensitivity is similar to the other algorithms used for the comparison. The computation time needed to process thetranscriptional signals is low as compared with model-based methods and in the same range to those based on theuse of filters. Automatic parameter selection has been incorporated and moreover, it can be easily adapted to aparallel implementation. We can conclude that the proposed method is well suited for the analysis of tiling signals, inwhich transcriptional activity is often hidden in the noise. Finally, the quantification and differential expression analysisof S. aureus dataset have demonstrated the valuable utility of this novel device to the biological analysis of the S.aureus transcriptome.
*Correspondence: [email protected], Proteomics and Bioinformatics Unit, Center for Applied MedicalResearch, University of Navarra, Pamplona, SpainFull list of author information is available at the end of the article
© 2012 Segura et al.; licensee BioMed Central Ltd. This is an Open Access article distributed under the terms of the CreativeCommons Attribution License (http://creativecommons.org/licenses/by/2.0), which permits unrestricted use, distribution, andreproduction in any medium, provided the original work is properly cited.

Segura et al. BMC Bioinformatics 2012, 13:222 Page 2 of 16http://www.biomedcentral.com/1471-2105/13/222
BackgroundThe complete deciphering of the information contained inthe genome would be helpful to improve our understand-ing of the biological processes occurring in living organ-isms. High-density oligonucleotide-based whole-genomemicroarray is an extensively used technology to detect theexpression of all RNA species including protein codingRNAs and non-coding RNAs. It is particularly suitable forthe analysis of whole small-sized genomes such as thosecorresponding to bacteria. For these organisms high res-olution can be achieved with the microarrays currentlyprovided by the manufactures.
Applications of tiling array technology include thegeneration of transcriptional maps and annotations ofgenomes, the identification of transcription factor bind-ing sites, the analysis of alternative splicing events, theanalysis of methylation states, the discovery of geno-typing and polymorphism, and the re-sequentation ofgenomes [1].
The emerging high-throughput next generation DNAsequencing (NGS) technologies [2] have revolutionizedtranscriptomics by allowing RNA analysis through cDNAsequencing on a massive scale (RNA-seq). Several limita-tions inherent to microarray technologies are overcomeby NGS technologies, in particular, it is not necessary todesign appropriate probes and the experimental repro-ducibility is guaranteed. However, the microarray designpresented in [3] allowed a comprehensive examination ofgene expression and genome-wide identification of alter-native splicing as well as detection of coding and non-coding transcripts. This microarray (Affymetrix GG-Harray) was compared with RNA-seq in [3]. The repro-ducibility in the estimation of gene and exon abundancewas high and even more sensitive than RNA-seq at theexon level. This microarray design contains as targets near50000 highly transcribed fragments of unknown func-tions from Affymetrix tiling microarray data [4]. TheNGS experiments highlighted that 49% of these fragmentshad uniquely mapped reads, revealing a high degree ofconcordance between both technologies.
The analysis of a tiling microarray experiment startswith a two-step process that generates a discrete signal.First, the DNA or RNA samples are hybridized in the cus-tom designed tiling array. Second, for each probe, the rawintensities are converted to a score [5]. The result is adiscrete intensity signal with a value per probe.
The workflow shown in Figure 1 summarizes themethodology. It consists of four basic blocks: (1) sig-nal pre-processing (DNA normalization, non-uniform touniform resampling and de-noising); (2) segmentation todetect abrupt intensity changes; (3) definition of tran-scriptionally active regions (TARs) and (4) biologicalknowledge extraction (for example, differential expressionanalysis of genes).
Transcriptome analysis refers to the detection of seg-ments where the noisy tiling signal is constant. Thestart and end points of these segments correspond totranscript start and end sites. Several approaches havebeen deployed in the segmentation of tiling signals:pseudo-median or Hodges-Lehmann estimator [6,7], localnon parametric smoothing [8,9], hidden Markov models[10-13], circular binary segmentation [14] and structuralchange model [15,16].
Wavelet analysis using the Discrete Wavelet Transform(DWT) [17] has demonstrated excellent performance inthe analysis of ChIP-chip experiments using tiling arraytechnology [18,19]. In this paper, we propose a wavelettransform based method for the identification of TARsin tiling signals (ZCL). We have chosen the SUREShrinkalgorithm for denoising and a method based on the com-putation of the Continuous Wavelet Transform (CWT)for detection of transcription start and end sites. In partic-ular, the sharp transitions of the tiling signal are identifiedas the zero-crossing lines of a multiresolution decompo-sition using as the mother wavelet the second derivativeof a Gaussian [20]. We applied the proposed analysisto the public Saccharomyces Cerevisiae dataset to val-idate our analytical approach. The novel identificationalgorithm was compared with two well-known methods:pseudo-median sliding window (PMSW) and structuralchange model (SCM). The absence of a biologically val-idated ground truth to evaluate the resulting segmen-tations prevent the use of specificity and sensitivity asperformance metrics. Consequently, the evaluation hasbeen made in terms of positive predictive value (PPV),sensitivity and computation time. We also evaluated thesegmentation quality resulting from the combination ofthe TARs detected by several of the methods understudy.
We also used this algorithm for the identification ofthe subset of transcripts whose expression decreasesin a S. aureus strain deficient in the sigma B tran-scription factor. SigB has been shown to be involvedin the stress response to different stimuli, the regula-tion of sarA, sarH1, and agr that control a wide arrayof virulence factors, biofilm formation, the ability ofS. aureus to bind to various host-cell matrix proteinssuch as fibrinogen and fibronectin, and in the devel-opment of resistance to the antibiotics methicillin andteicoplanin [21-26].
We applied the segmentation methods to this highquality dataset and we have demonstrated its useful-ness for the analysis of the tiling array derived tran-scriptome map. The results demonstrate that ZCLnot only allows a rapid identification of the tran-scripst based on the segmentation procedure but alsoa more accurate estimation of the expression level ofeach transcript.

Segura et al. BMC Bioinformatics 2012, 13:222 Page 3 of 16http://www.biomedcentral.com/1471-2105/13/222
Figure 1 Wavelet-based processing of tiling signals. Workflow for the analysis of the tiling signal based on the computation of the ContinuousWavelet Transform (CWT).
Results and discussionAll the steps needed to obtain a trancriptional map fromthe raw data (read the CEL files, normalize, denoise andsegment the tiling signal) have been implemented usingthe statistical language R/Bioconductor [27]. The CRANpackages Rwave, wavethresh and wmtsa have been usedfor wavelet analysis. All the R functions described areavailable as Supplementary Material (Additional file 1,Additional file 2 and Additional file 3). The R code toperform the example analyses and the generation of thefigures included in the paper can also be found as Supple-mentary Material. The results show that wavelets comparewell with the rest of methods in terms of segmentationaccuracy and time consumed in the analysis.
Experimental datasetsSaccharomyces cerevisiae datasetThe dataset is described in [16]. An oligonucleotide arrayfor S. cerevisiae was developed. It contains 6.5 millionprobes and interrogates both strands of the full genomicsequence with 25-mer probes tiled at an average of 8nucleotide intervals on each strand and 4 nucleotide tileoffset between strands. The first-strand cDNA was syn-thesized using random primers from poly(A) and totalRNA. A set of genomic DNA was also hybridized fornormalization purposes [15]. Their analysis of the tran-scription map identified the transcript boundaries, itsstructure and the intensity level of coding and non-codingtranscripts [16]. All data (CEL files, bmap files for both
strands and annotation file) was deposited in ArrayEx-press database with accession number E-TABM-14.
Staphylococcus aureus datasetThe Staphylococcus aureus custom tiling microarray (NA-Staph-b520729F) was designed in collaboration withAffymetrix (Santa Clara, CA, USA). Specifically, themicroarray (format 49-7875 with 11 μm features) con-tains a total of 522,406 probes, divided into two parts. Thefirst part corresponds to the tiling array containing a totalof 384,932 probes (25-mer), which are further dividedinto eight sets. The set used in our analysis covers bothstrands of the S. aureus NCTC 8325 genome (2,821,347 bpcovered by 363,127 probes). Each 25-mer probe wastiled each 14-nt across the whole genome, resulting in11-nt overlaps and a 7-nt tile offset between strands. Themicroarray design has been deposited in the ArrayExpressArchive at EMBL-EBI (http://www.ebi.ac.uk/microarray-as/ae/), ArrayExpress accesion no. A-AFFY-165.
Before cDNA synthesis, RNA integrity from eachsample was confirmed on Agilent RNA Nano LabChips(Agilent Technologies). 10 μg of RNAs extractedfrom bacterial strains grown until exponential phase(OD600nm = 0.8) were reverse transcribed usingSuperScript II reverse transcriptase (Invitrogen LifeTechnologies). They were processed following the pro-tocol of the Affymetrix GeneChip Expression AnalysisTechnical Manual (P/N 702232 Rev. 2) in the presenceof 6 ng/ml Actinomycin D to avoid spurious second-strand cDNA synthesis during the reverse transcription

Segura et al. BMC Bioinformatics 2012, 13:222 Page 4 of 16http://www.biomedcentral.com/1471-2105/13/222
reaction [28]. Sense RNA corresponding to B. subtilispoly-A lys, phe, thr, trp, dap genes were spiked intosample RNA as a control for the labeling and hybridiza-tion steps. cDNA was digested by DNase I (PIERCE) in10X DNAse I buffer (USB-Affymetrix) and the size ofdigestion products was analyzed in the Agilent Bioanal-yser 2100 using RNA Nano LabChips to ensure that thefragmentation resulted in a majority of products in therange of 50 to 200 base-pairs. The fragmented cDNAwere then biotinylated using terminal deoxynucleotidyltransferase (Promega) and the GeneChip DNA label-ing reagent (Affymetrix) following the manufacturer’srecommendations. Biotinylated cDNA (5 μg per array)were hybridized for 16 hours according to the Affymetrixprotocol in a total volume of 200 μl per hybridizationchamber. Following incubation, the arrays were washedand stained in the Fluidics station 450 (Affymetrix) usingthe protocol FS450 0005. The arrays were then scannedusing the GeneChip scanner 3000 (Affymetrix). Theintensity signals of each probe cell were computed by theGeneChip operating software (GCOS) and stored in cellintensity files (.CEL extension) before preprocessing andanalysis. All microarray data described in this study havebeen deposited in the ArrayExpress Archive at EMBL-EBI(http://www.ebi.ac.uk/microarray-as/ae/), ArrayExpressaccesion no. E-MEXP-2778.
Probe annotation and normalizationThe annotation of the PM probe sequences was obtainedwith the alignment to the genome sequence of S. cere-visiae strain S288c (SGD of August 7, 2005) as providedin the package davidTiling of Bioconductor. Available datacorrespond to 3 replicates of poly(A), 2 replicates of totalRNA and 3 replicates of genomic DNA. The CEL fileswere read and the normalized signals (poly(A) and totalRNA) were obtained using Equation 4. The analysis steps(denoising, segmentation and detection of TARs) wereperformed on the poly(A) signal as it showed an improvedhybridization quality [16]. Once the signal is constructedfrom CEL and annotation files we used tilingArray pack-age functions to obtain equally-spaced samples. Otherresampling methods can be applied without loss ofgenerality.
The annotation files for S. aureus microarray are pro-vided in the ArrayExpress database (A-AFFY-165). Themicroarrays of the experiment correspond to three repli-cates of genomic DNA, three replicates of RNA of the15981 wild-type strain, and three replicates of the sigBdeletion. All the preprocessing steps were performed aspreviosly described for S. cerevisiae dataset.
DenoisingThe denoising was evaluated using the signal to noise ratio(SNR), a quantitative measure of its performance. In order
to compare the results obtained with those from Huberet al. [15] based on a variance stabilization and normaliza-tion transformation, the same definition of SNR was used.We looked at a set of control regions, two positive con-trol regions (pos) within the ORFs of RPN2 and SER33 atcoordinates 217860 − 220697 and 221078 − 222487 andtwo negative control regions (neg) in the background atcoordinates 216800 − 217700 and 222800 − 227000 of S.cerevisiae (see Figure 2). We assumed (as in [15]) that thedifferences between positive and negative controls give anestimation of the signal level, whereas variations from themean intensity within each region are due to noise.
The SNR was computed as
SNR = �μ
σ= 1
σ
⎛⎝ ∑
r∈pos
μr|pos| −
∑r∈neg
μr|neg|
⎞⎠ , (1)
with the noise standard deviation σ calculated as the aver-age of the differences between 0.975 and 0.025 quantilesof the data within each of the control regions. Namely,
σ =∑
r∈pos,neg(Q0.975r − Q0.025
r )
(Q0.975N − Q0.025
N )(|pos| + |neg|) (2)
where the symbol r counts over the different regions andQN refers to the standard normal distribution N (0, 1).Table 1 shows the SNR of the normalized signal and thewavelet-based denoised signal using Donoho’s method[29] and the SUREShrink approach [30] in relation tothe best SNR obtained in [15]. We observe that the useof wavelets for denoising results in a large increase inthe SNR (18.94% with Donoho’s method and 30.63% withSUREShrink approach), especially when the SUREShrinkdenoising is applied. This could be due to the eliminationof most part of the non-Gaussian noise component andthe consequent reduction in the estimated variance. In therest of the paper, the SUREShrink is the method appliedfor denoising.
SegmentationA descriptive example of the denoising and segmentationfor S. cerevisiae is shown in Figure 3. The analysis cor-responds to a 140 Kb segment of chromosome 1 fromposition 20000 to position 160000. The results are givenfor the three algorithms compared (SCM, PMSW, ZCL).The CWT computation of ZCL used as mother waveletthe second derivative of a Gaussian with 100 scales. Zero-crossing lines were calculated and only those with a lengthgreater than a pre-defined threshold were considered tocorrespond to signal transitions.
The TAR start and end positions were defined as thetransition locations for which the difference between themean intensity of neighboring segments is greater than10% of the dynamic range of the tiling signal. Moreover,the inspection of the intensity histogram of chromosome

Segura et al. BMC Bioinformatics 2012, 13:222 Page 5 of 16http://www.biomedcentral.com/1471-2105/13/222
(a) Normalized signal
(b) Wavelet denoised signal (Donoho)
(c) Wavelet denoised signal (SURE)
216000 218000 220000 222000 224000 226000 228000
RPN2 SER33 SPO22
N NS S
Figure 2 Signal to noise ratio of different filtering methods. Portion of the tiling signal used to evaluate the Signal to Noise Ratio (SNR). Weconsider two signal regions (S) and two noise regions (N). (a) Normalized signal. (b) Denoised signal using Donoho’s threshold. (c) Denoised signalusing the SUREShrink threshold.
1 forward strand was used to set the minimum normal-ized transcription level value to −2. The same parameterswere adopted to process the other strands of the organism.The R function segmentZCL (provided as SupplementaryMaterial) implements the whole segmentation procedure.
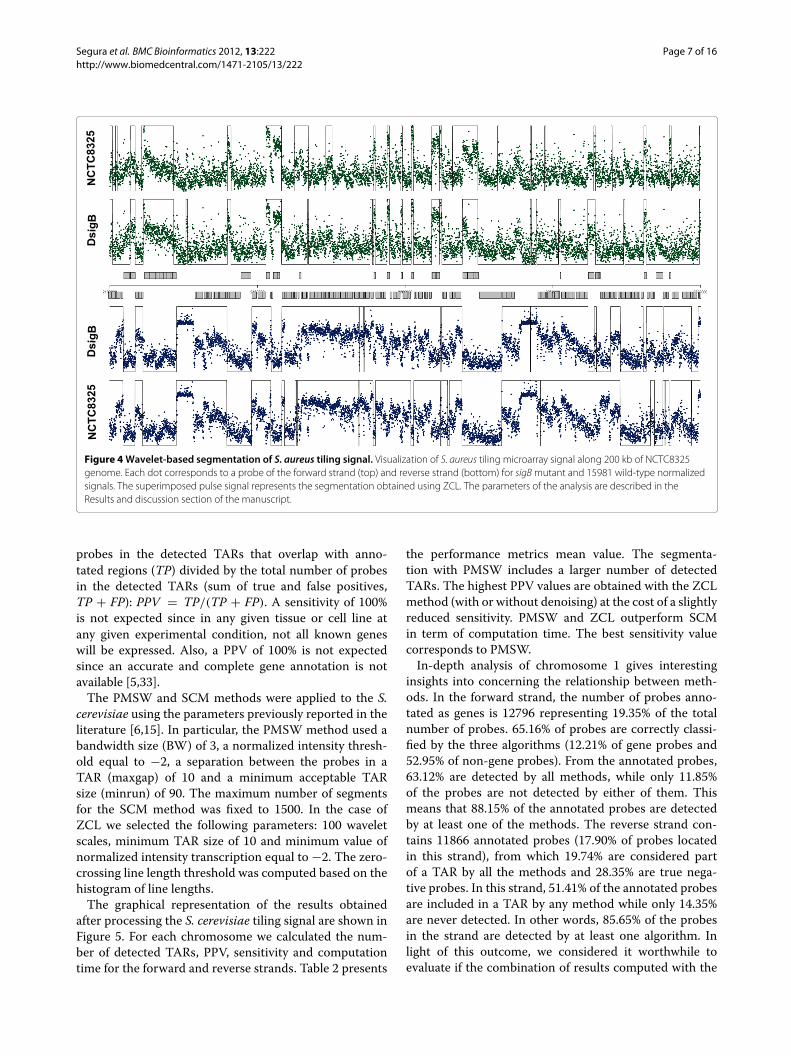
Another representative example of segmentation resultsis given in Figure 4. In this case, the S. aureus signal of15981 and sigB mutant were segmented using ZCL andfixing only the number of scales to 100. No denoising wasapplied prior to the segmentation. The figure represent afragment of the signals from position 2.1 Mb to 2.3 Mb.In Additional file 4: Figure S1 and Additional file 5: FigureS2, the results for the PMSW algorithm are shown. InAdditional file 6: Figure S3 and Additional file 7: Figure S4,the results for the SCM algorithm are presented.
Segmentations comparison using S. cerevisiae datasetThe results from the ZCL segmentation were compared tothose obtained with PSMW [6] and SCM [15]. The robustPMSW method is based on the calculation of a pseudo-median within a sliding window. The local expression levelis computed with the Hodges-Lehmann estimator [31] onthe RNA normalized signal. To be able to do this, theTilescope pipeline [7] was implemented. Once the candi-date transcript regions were determined, the TARs wereassembled by the combination of a normalization inten-sity threshold and a max-gap and min-run criteria. Theformer is defined as the maximum distance below whichtwo adjacent transcribed probes are included in the sameTAR. The later as the minimum length of a feature to beclassified as a transcribed region.

Segura et al. BMC Bioinformatics 2012, 13:222 Page 6 of 16http://www.biomedcentral.com/1471-2105/13/222
Table 1 Estimated SNR values of the tiling signal shown inFigure 3
SNR results
Signal SNR
Best SNR in [15] 4.58
Normalized signal 4.28
Wavelet denoising (Donoho’s) 5.28
Wavelet denoising (SUREShrink) 6.17
Estimated SNR values of the tiling signal. The normalized and the waveletdenoised signal using Donoho´s and SUREShrink on which the calculation wasperformed are shown in Figure 3.
Huber’s method is based on the structural change model(SCM). The SCM model [15,16] is used in econometricsfor the modeling of sharp transitions in financial timeseries. It has been applied to the segmentation of compar-ative genomics hybridization (CGH) data [32]. The signal
is modeled as a piecewise constant function of chromo-somal coordinates described using the segment bound-aries, the maximum number of segments and the meansignal value for each segment. The method is appliedindependently to each chromosome and, if the signal isstrand-specific, to each of its two strands. A dynamic pro-gramming algorithm part of the tilingArray package ofBioconductor computes a globally optimal set of parame-ters for segmentations of increasing number of segments.
Due to the lack of a biologically validated ground truthto evaluate the outputs, we compared the methods interms of two metrics, sensitivity and positive predictivevalue (PPV) at probe-level. We define sensitivity as thenumber of probes in the detected TARs that overlap withannotated regions (true positives, TP) divided by the totalnumber of probes in the annotated regions (sum of truepositives and false negatives, TP + FN): Sensitivity =TP/(TP + FN). The PPV is defined as the number of
Figure 3 Wavelet-based segmentation of S. cerevisiae tiling signal. Visualization of S. cerevisiae tiling microarray signal along 140 kb ofchromosome 1. Each dot corresponds to a probe of the forward strand (top) and reverse strand (bottom). The superimposed pulse signal representsthe segmentation obtained using the different methods (PMSW, SCM, ZCL). The parameters of the different analysis are described in theResults and discussion section of the manuscript.
Segura et al. BMC Bioinformatics 2012, 13:222 Page 7 of 16http://www.biomedcentral.com/1471-2105/13/222
Figure 4 Wavelet-based segmentation of S. aureus tiling signal. Visualization of S. aureus tiling microarray signal along 200 kb of NCTC8325genome. Each dot corresponds to a probe of the forward strand (top) and reverse strand (bottom) for sigB mutant and 15981 wild-type normalizedsignals. The superimposed pulse signal represents the segmentation obtained using ZCL. The parameters of the analysis are described in theResults and discussion section of the manuscript.
probes in the detected TARs that overlap with anno-tated regions (TP) divided by the total number of probesin the detected TARs (sum of true and false positives,TP + FP): PPV = TP/(TP + FP). A sensitivity of 100%is not expected since in any given tissue or cell line atany given experimental condition, not all known geneswill be expressed. Also, a PPV of 100% is not expectedsince an accurate and complete gene annotation is notavailable [5,33].
The PMSW and SCM methods were applied to the S.cerevisiae using the parameters previously reported in theliterature [6,15]. In particular, the PMSW method used abandwidth size (BW) of 3, a normalized intensity thresh-old equal to −2, a separation between the probes in aTAR (maxgap) of 10 and a minimum acceptable TARsize (minrun) of 90. The maximum number of segmentsfor the SCM method was fixed to 1500. In the case ofZCL we selected the following parameters: 100 waveletscales, minimum TAR size of 10 and minimum value ofnormalized intensity transcription equal to −2. The zero-crossing line length threshold was computed based on thehistogram of line lengths.
The graphical representation of the results obtainedafter processing the S. cerevisiae tiling signal are shown inFigure 5. For each chromosome we calculated the num-ber of detected TARs, PPV, sensitivity and computationtime for the forward and reverse strands. Table 2 presents
the performance metrics mean value. The segmenta-tion with PMSW includes a larger number of detectedTARs. The highest PPV values are obtained with the ZCLmethod (with or without denoising) at the cost of a slightlyreduced sensitivity. PMSW and ZCL outperform SCMin term of computation time. The best sensitivity valuecorresponds to PMSW.
In-depth analysis of chromosome 1 gives interestinginsights into concerning the relationship between meth-ods. In the forward strand, the number of probes anno-tated as genes is 12796 representing 19.35% of the totalnumber of probes. 65.16% of probes are correctly classi-fied by the three algorithms (12.21% of gene probes and52.95% of non-gene probes). From the annotated probes,63.12% are detected by all methods, while only 11.85%of the probes are not detected by either of them. Thismeans that 88.15% of the annotated probes are detectedby at least one of the methods. The reverse strand con-tains 11866 annotated probes (17.90% of probes locatedin this strand), from which 19.74% are considered partof a TAR by all the methods and 28.35% are true nega-tive probes. In this strand, 51.41% of the annotated probesare included in a TAR by any method while only 14.35%are never detected. In other words, 85.65% of the probesin the strand are detected by at least one algorithm. Inlight of this outcome, we considered it worthwhile toevaluate if the combination of results computed with the

Segura et al. BMC Bioinformatics 2012, 13:222 Page 8 of 16http://www.biomedcentral.com/1471-2105/13/222
a b
c d
e f
g h
Figure 5 Results for the identification of TARs. Number of detected TARs, probe-level PPV and sensitivity, and computation time for theproposed (solid line), PMSW (dashed line) and SCM (dotted line) methods. The analysis was performed for the forward (left) and the reverse (right)strands of all chromosomes of S. cerevisiae tiling microarray data.

Segura et al. BMC Bioinformatics 2012, 13:222 Page 9 of 16http://www.biomedcentral.com/1471-2105/13/222
Table 2 Evaluation metrics for S. cerevisiae dataset
Evaluation metrics (S. cerevisiae)
Method TARs PPV Sensitivity Time (min)
PMSW 22114 0.7416 0.4700 2.88
SCM 11246 0.7847 0.3904 79.09
ZCL 18209 0.8486 0.3760 13.02
ZCLSure 22513 0.8547 0.3686 10.70
Mean number of detected TARs, probe-level PPV, probe-level sensitivity and computational time for PMSW, SCM and ZCL methods (all chomosome and strands of S.cerevisiae).
different methods would improve the performance of thesegmentation.
Combination of TAR probes candidatesWe evaluated the improvement in performance obtainedby the combination of the different segmentations. Wechose different strategies to define the sets (intersection oftwo or three methods and majority voting system). After adecision is taken on the candidates, TARs are constructedto create the transcriptional map. In Table 3, we give eval-uation metrics (PPV and sensitivity) for both strands ofS. cerevisiae chromosome 1. As individual methods, ZCLgives the best PPV and the best sensitivity for the reversestrand. The best performing combination considering acompromise between PPV and sensitivity is given by themajority voting system.
Computational performanceS. cerevisiae analyses were executed in an Intel(R) Xeon(R)processor server (64 bits, 4 cores, 2 GHz) with 32 Gbinstalled memory running Red Hat Enterprise Linux ASrelease 4 and R 2.13.0. Computing times needed to pro-cess each chromosome strand with the described methodsare shown in Figure 5. For the same signal length, longercomputation time is required for SCM, while comparabletimes are needed for PMSW and ZCL. The mean time to
segment the whole transcriptome is 2.88 mins for PMSW,13.02 mins for ZCL and 79.09 mins for SCM.
Differential expression analysis of S. aureus sigmaB mutantComparative segmentation analysis using ZCL andPMSW and SCM algorithms was applied for thehybridization data obtained with a custom designedAffymetrix tiling array of S. aureus. Segmentation resultsfor S. aureus are summarized in Table 4. In this case, theperformance measures are almost identical for all meth-ods. These results suggest that the performance of themethods depends on the quality of the signals, decreas-ing for PMSW and SCM algorithms as the SNR of thesignal get worse. In spite of this, other advantages suchas computation time, automatic selection of parametersand the possibility of parallel computation makes ZCL ourpreferred option to segment tiling signals.
The most frequent transcriptional analysis is the detec-tion of genes that have changed their expression in theconditions under study (differential expression analysis).As sigma B affects the expression of more than one hun-dred genes, we decided to test whether it is possible to usethe intensity of all the probes included in each detectedTAR with the ZCL segmentation procedure to calculatethe expression level of the transcript in a particular envi-ronmental condition. In order to carry out this analysis
Table 3 Evaluation of segmentation combinations for both strand of chromosome 1
Integrative transcriptional analysis
Method PPV Forward Sensitivity Forward PPV Reverse Sensitivity Reverse
PMSW 0.6511 0.5873 0.5811 0.2073
SCM 0.7188 0.4390 0.6968 0.2146
ZCL 0.8675 0.3821 0.8220 0.2208
PMSW⋂
SCM⋂
ZCL 0.6312 0.5984 0.5441 0.2030
PMSW⋂
ZCL 0.6448 0.5921 0.5744 0.2076
PMSW⋂
SCM 0.6370 0.5957 0.5504 0.2043
SCM⋂
ZCL 0.7053 0.4409 0.6626 0.2116
Majority voting 0.7247 0.4396 0.6993 0.2164
PPV and sensitivity for both strand of chromosome 1 using individual TAR detection algorithms and the combination of their results.

Segura et al. BMC Bioinformatics 2012, 13:222 Page 10 of 16http://www.biomedcentral.com/1471-2105/13/222
Table 4 Evaluation metrics for S. aureus dataset
Evaluation metrics (S. aureus)
Tiling Signal Metric PMSW SCM ZCL ZCLSure
WT Forward PPV 0.6298 0.6498 0.6248 0.6407
WT Forward Sens 0.8657 0.8766 0.8715 0.8719
WT Reverse PPV 0.6867 0.6993 0.7050 0.6989
WT Reverse Sens 0.8506 0.8560 0.8388 0.8535
�sigB Forward PPV 0.6238 0.6388 0.6227 0.6308
�sigB Forward Sens 0.9054 0.9035 0.9027 0.9036
�sigB Reverse PPV 0.6664 0.6815 0.6765 0.6748
�sigB Reverse Sens 0.8697 0.8684 0.8667 0.8515
Mean number of detected TARs, probe-level PPV, probe-level sensitivity and computational time for PMSW, SCM and ZCL methods.
using tiling microarrays we need to compress the inten-sity of all the probes included in each detected TAR intoone value. Standard methods for microarray normaliza-tion can be applied, for example RMA (Robust MultichipAverage) algorithm in the case of Affymetrix microarrays[34]. This processing can be performed using the packagesaffxparser, affy and limma of Bioconductor for CDF (chipdefinition file) generation, normalization and differentialexpression analysis.
We introduced a simple analytical tool to be used inde-pendently of the microarray platform to measure the geneexpression level based on the median value of the TARprobe intensities. We calculated this value for each wild-type and sigmaB mutant sample. We applied a statisticalanalysis (t-test) to obtained the p-value associated withthe expression change taking into account the biologicalvariability of the samples. Considering well-defined TARsin the S. aureus annotation, we found previously describedalterations in several genes [21]. In Figure 6, we show theboxplots that represents these expression level changes.We confirmed the down-regulation of sigB and other σ B-regulated genes, as the alkaline shock protein 23 (asp23)[22,23] and lysine-specific permease (lysP) [21], althoughthe latter is not statistically significant (p > 0.05). Wealso found genes up-regulated in the sigmaB mutant, asthe staphylococcal nuclease (nuc) [23,24], the zinc metal-loprotease aureolysin (aur) [24,25] and the α-hemolysin(hla) [24,26], the latter without a statistically significantp-value.
ConclusionsTranscriptomics is a powerful technology for thestudy of gene structures and RNA-based regulation inany organism. Genome-wide transcriptome analysis ofprokaryotes can be carried out with any of these two tech-niques: RNA-seq and genomic tiling arrays [35]. High-resolution tiling arrays have been used, among others, to
study the transcriptomes of Caulobacter crescentus [36],Escherichia coli and [37], Listeria monocytogenes [38].
In this paper, we propose a combined WT-basedmethod for the denoising and segmentation of tiling sig-nals. For illustrative and evaluative purposes, we appliedthe proposed analysis to the public S. cerevisiae. Ourdenoising results show an increase in the SNR of the fil-tered signal with respect to Huber’s method [15]. Webelieve it is advisable to properly denoise the tiling sig-nal before segmentation as the number of false positivesinduced by signal variability is thus reduced. Even whenconstructing a manual segmentation, it seems an advis-able choice to mark the transitions on the denoised signal,as its improved quality could help the expert to bet-ter discriminate between low expression transcripts andnoise.
Our segmentation algorithm (ZCL) calculates all thepossible break points based on the zero-crossing linesof the second derivative of the Gaussian wavelet. Theresults show that our method achieves the best compro-mise between accuracy (evaluated in terms of PPV andsensitivity) and computation time. The R code providedcan be used to apply our algorithm as well as to combinethe resulting segmentation with other methods as PMSWand SCM.
We also designed a new tiling microarray for the anal-ysis of S. aureus genome, publicly available in the Array-Express database (accession number A-AFFY-165). Thisplatform has been used for the comparison of the geneexpression pattern of the S. aureus 15981 wild type and itsisogenic sigB mutant. We selected this mutant because itis one of the most study staphylococcal regulatory factorsand consequenctly it was a useful gold standard to com-pare the accuracy of our algorithms. The relevance of thesegmentation results comes from the fact that a correctanalysis of the tiling signals could improve the matchingbetween the probes and the corresponding transcriptionalunits. In particular, it could help to more precisely localize

Segura et al. BMC Bioinformatics 2012, 13:222 Page 11 of 16http://www.biomedcentral.com/1471-2105/13/222
Figure 6 Differential expression analysis of S. aureus sigB mutant. Boxplots of median gene expression intensities. The expression of theselected genes has been previously reported to change in response to sigB repression.
Segura et al. BMC Bioinformatics 2012, 13:222 Page 12 of 16http://www.biomedcentral.com/1471-2105/13/222
the start and end transcription sites or even, include unitsthat are not annotated in the current genome definition.
Once the TARs are properly detected, differentiallyexpressed transcripts can be identified by well-knownmethods (such as Linear Models for Microarray Data(LIMMA) [39]) with a previous probe summarizationalgorithm to generate the transcript annotation (using,for example, Robust Microarray Analysis (RMA) [34]).In practice, this means that differential gene expressionanalysis could benefit from an enhanced analysis of tilingsignals such as the one proposed here. To confirm theaccuracy of the proposed method, we introduced a sim-ple measure based on the median of TAR probe intensity.Using this approach, known up-regulated (nuc, aur, hla)and down-regulated (asp23, lysP) genes in sigB mutantwere verified.
In conclusion, we present a novel method for denois-ing and segmentation of tiling microarray signals basedon wavelet multiresolution analysis that outperforms pre-vious methods in terms of SNR, positive predictive valueand computation time. The R code that implements themethod is given as supplementary material and can beeasily adapted to a parallel computing schema. Also, wehave introduced the possibility of combining the resultsof ZCL with those obtained with other two well-knownapproaches (PMSW and SCM) for the segmentation oftiling signals.
MethodsWT-based analysisThe CWT of a continuous signal s(x) is defined as [40]
CWT(a, b) = 1√a
∫ +∞
−∞s(x)ψ∗
(b − x
a
)dx (3)
where a ∈ R+ − {0} is the scale, b ∈ R is the translation,
ψ(x) is the mother wavelet, ψ∗((b − x)/a) is the com-plex conjugated, scaled and translated wavelet and CWTis the 2D matrix of wavelet coefficients. The continuousinput signal s(x) interpolates the discrete input sampless[ k] , k = 1, . . . , n where n is the length of the signal.
The CWT can be interpreted as the correlation of theinput signal with a position reversed version of ψ rescaledby a factor a. For an 1D input signal, the result is a 2Ddescription of the signal with respect to the position band scale a and shifted by b. The scale a is inversely pro-portional to the central frequency of the dilated waveletψa = ψ(x/a), which is typically a bandpass function; brepresents the position location at which we analyze thesignal. The larger the scale a, the wider the analyzing func-tion ψa, and hence the smaller the corresponding ana-lyzed frequency. The output value is maximized when thefrequency of the signal matches that of the correspond-ing dilated wavelet. The CWT computation for arbitrary
scales can be easily adapted to a parallel implementationwith a linear computational complexity [41].
Mallat’s fast wavelet algorithm [42] uses the multireso-lution properties of the wavelet to compute the CWT atdyadic scales a = 2i and time shifts b = 2ik, k ∈,Z, result-ing in what is known as DWT. For additional informationabout the wavelet transform and its properties the readeris referred to [17].
Normalization of tiling microarray dataThe analysis starts with background correction and quan-tile normalization as describe by the RMA algorithm [34].Next, we calculate the geometric mean of the RNA inten-sities and the geometric mean of the DNA replicates toget a signal score s[ k] at position k proportional to thetranscription level in the reference genome [16]
s[ k] =∑n
j=1 log RNAj[ k]∑mj=1 log DNAj[ k]
, (4)
where n is the number of RNA samples and m is thenumber of DNA samples.
WT-based denoisingOne of the most established methods of wavelet-baseddenoising was proposed by Donoho and Johnstone [29]and it is based on the thresholding of the DWT coeffi-cients at scale a = 2. This method is composed of threesteps: (i) calculate the DWT of the tiling signal s[ k] atscale a = 2; (ii) threshold the wavelet coefficients; (iii)compute the inverse wavelet transform of the thresholdedcoefficients. A universal threshold, T , is proposed [29] toremove white noise which it is given by
T = σ√
2 log(n) with σ = MAD/0.6745, (5)
where n is the length of s, σ is the noise level and MAD isthe estimated median absolute deviation in the first scale.An important issue is the selection of a suitable waveletfunction. As the signal can be roughly approximated to azero-order polynomial, a boxcar-like function such as theHaar wavelet gives a reasonable level of correlation (i.e., agood pattern matching) with the target signal.
Another well established method of wavelet shrinkageis SUREShrink [30]. This is based on Stein’s UnbiasedEstimator for Risk (SURE). A subband adaptive thresholdis applied. If the wavelet coefficients in the jth subbandare {xi : i = 1, . . . , n}, we consider a soft thresholdingprocedure and apply Stein’s result. The quantity
SURE(T ; x) = n − 2 · �{i : |xi| ≤ T} +n∑
i=1(xi ∧ T)2 (6)

Segura et al. BMC Bioinformatics 2012, 13:222 Page 13 of 16http://www.biomedcentral.com/1471-2105/13/222
is an unbiased estimate of risk, where T is the thresholdand xi ∧ t = min(xi, T). This estimator can be used toselect a threshold:
TSURE = argmin0≤T≤√2lognSURE(T ; x) (7)
For a large dimension n the law of large numbers willensure that TSURE will be almost the optimal threshold[30].
WT-based segmentationAn important issue in signal processing is to define anappropriate representation able to compress most of the
signal information into few representative features. Sharpvariations in amplitude (i.e., transitions and peaks) areamong the most meaningful features of a signal. For thatreason, many segmentation algorithms rely on their detec-tion. Previous studies have detected the peaks in massspectrometry data using either the ridge lines [43] or thezero-crossing lines [44] in a multi-scale decomposition ofthe signal. Zero-crossing lines seems a more consistentdescription as they belong to connected curves, are morerobust to noise and easier to detect that ridge lines [44].
It has been previously shown that the position ofmultiscale sharp transitions can be obtained from the
0 100 200 300 400 500 600 700
−2
02
46
Simulated TAR
Wavelet transform
Position
Sca
le
z
0
18.85
37.7
56.56
75.41
Zero-crossing lines
Position
Sca
le
a
b
c
Figure 7 Zero-crossing lines of the second derivative Gaussian wavelet. An illustration of zero crossing lines detection. (a) Box signalcontaminated with additive Gaussian noise (standard deviation = 0.5). (b) Absolute values of the CWT coefficients. The second derivative of theGaussian was used as the mother wavelet. (c) All zero-crossing lines are shown. Note how the two longest lines correspond to the two sharptransitions of the box signal.

Segura et al. BMC Bioinformatics 2012, 13:222 Page 14 of 16http://www.biomedcentral.com/1471-2105/13/222
zero-crossings of the signal convolved with the Laplacianof a Gaussian [45]. We define a wavelet at scale a as
ψ(x) = d2θa(x)
dx2 (8)
where θa is a Gaussian function dilated by a factor a. Sincethe wavelet transform can be represented as
CWT(a, b) = (s ∗ ψa)(x)|x=b (9)
we derive that
CWT(a, b) =[
s ∗(
a2 d2θadx2
)](x)
∣∣x=b
= a2 d2
dx2 (s ∗ θa)(x)|x=b
(10)
Hence, the wavelet transform of s(x) is proportionalto the second derivative of s(x) smoothed by θa(x). Thezero-crossings of CWT(a, b) correspond to the inflec-tion points of s ∗ θa. The identification of transcriptstart and end sites is achieved by computation of theredundant CWT over a wide scale range followed by zero-crossing line detection and length thresholding. The cho-sen mother wavelet is the second derivative of a Gaussian.The redundancy of the CWT yields enhanced informationon the position-scale localization of the features of interest(in this case, the transitions) [46].
An illustrative example is given in Figure 7. We gener-ated a simulated transcriptional unit with a rectangularpulse signal of 721 samples with additive Gaussian noise(mean 0 and standard deviation 0.5) (see Figure 7(a)). Theabsolute values of the wavelet transform coefficients andthe zero crossing lines are shown in Figure 7(b) and (c),respectively. Observe how the position of these lines cor-responds to abrupt intensity transitions in the noisy signaland the longest connected curves identify the start andend points of the rectangular pulse. The R functions pro-vided as supplementary material detect the zero-crossinglines and identify them as transcription start sites (TSS)and transcription end sites (TES) depending on the slopesign.
Identification of transcriptional active regionsThe candidates start and end sites detected as describedin the previous section, are filtered to remove incorrectassignments. The purpose of this procedure is to filterthose transitions that do not correspond to variations insignal intensity. For the generation of TARs we consid-ered the signal transitions in which variation in intensityis at least 10% of the dynamic range of the analyzed sig-nal. We also eliminate from the list of detected TAR allthe start and end points that are not correctly paired off.We use the sign of the zero-crossing lines to separatestart and end points and we match each start site with itscorresponding end site. Finally, we define the minimum
normalized intensity threshold required for the segmentsto be considered as transcriptional active regions. Thisvalue is calculated as the median of the signal intensitydistribution, but this threshold can also be user-defined.In order to improve the definition of TARs, we clus-ter together consecutive segments for which the meannormalized intensity value is over the threshold.
Additional files
Additional file 1: R code: Segmentation and visualization functions.Implemented functions in R language to perform PMSW and SCMsegmentation and the proposed wavelet-based method for denoising andsegmentation. In addition, functions are provided for proper visualizationof data, integration of analysis results and evaluation of the obtainedtranscriptional maps.
Additional file 2: R code: Segmentation analysis of S. cerevisiae. Rscript for segmentation of the S. cerevisiae dataset and the generation ofthe figures included in the manuscript.
Additional file 3: R code: Segmentation analysis of S. aureus). R scriptfor the segmentation of the S. aureus dataset and the generation of thefigures included in the manuscript.
Additional file 4: Figure S1. Visualization of S. aureus tiling microarraysignal along 200 kb of NCTC8325 genome. Each dot corresponds to aprobe of the forward strand (top) and reverse strand (bottom) forNCTC8325 wild-type normalized signal. Superimposed pulse signalrepresents the segmentation obtained using PMSW method. Theparameters of the analysis are described in the Results and discussionsection of the manuscript.
Additional file 5: Figure S2. Visualization of S. aureus tiling microarraysignal along 200 kb of NCTC8325 genome. Each dot corresponds to a probeof the forward strand (top) and reverse strand (bottom) for sigmaB mutantnormalized signal. Superimposed pulse signal represents the segmentationobtained using PMSW method. The parameters of the analysis aredescribed in the Results and discussion section of the manuscript.
Additional file 6: Figure S3. Visualization of S. aureus tiling microarraysignal along 200 kb of NCTC8325 genome. Each dot corresponds to a probeof the forward strand (top) and reverse strand (bottom) for NCTC8325wild-type normalized signal. Superimposed pulse signal represents thesegmentation obtained using SCM method. The parameters of the analysisare described in the Results and discussion section of the manuscript.
Additional file 7: Figure S4. Visualization of S. aureus tiling microarraysignal along 200 kb of NCTC8325 genome. Each dot corresponds to aprobe of the forward strand (top) and reverse strand (bottom) for sigmaBmutant normalized signal. Superimposed pulse signal represents thesegmentation obtained using SCM method. The parameters of the analysisare described in the Results and discussion section of the manuscript.
Competing interestsThe authors declare that they have no competing interests.
Authors’ contributionsVS and AMB conceived the idea, developed the methods and implementedthe software. ATA and IL design the NA-Staph-b520729F microarray and MUand ATA carried out the processing and hybridization of samples. ATA, IL andVS made the biological interpretation of the results. All authors participated inwriting and revising the manuscript.
AcknowledgementsWe thank Prof. Fernando J. Corrales and Lourdes Ortiz (Genomics Core Facility)for technical support and all the useful comments about the manuscript. Thiswork was supported by the spanish Torres-Quevedo fellowship[PTQ-08-03-07769] to VS. ATA and AMB were supported by Spanish Ministry ofScience and Innovation ‘Ramon y Cajal’ contracts. This work was supported by

Segura et al. BMC Bioinformatics 2012, 13:222 Page 15 of 16http://www.biomedcentral.com/1471-2105/13/222
the Spanish Ministry of Science and Innovation Grants BIO2008-05284-C02-01,BFU2011-23222, ERA-NET Pathogenomics PIM2010EPA-00606 and theagreement between ‘Fundacion para la Investigacion medica aplicada’ (FIMA)and the ’UTE project CIMA’.
Author details1Genomics, Proteomics and Bioinformatics Unit, Center for Applied MedicalResearch, University of Navarra, Pamplona, Spain. 2Laboratory of MicrobialBiofilms, Instituto de Agrobiotecnologıa, Universidad Publica deNavarra-Consejo Superior de Investigaciones Cientıficas-Gobierno de Navarra,Pamplona 31006, Spain. 3Cancer Imaging Laboratory, Center for AppliedMedical Research, University of Navarra, Pamplona, Spain.
Received: 27 June 2012 Accepted: 16 August 2012Published: 5 September 2012
References1. Mockler TC, Chan S, Sundaresan A, Chen H, Jacobsen SE, Ecker JR:
Applications of DNA tiling arrays for whole-genome analysis.Genomics 2005, 85:1–15.
2. Ozsolak F, Milos PM: RNA sequencing: advances, challenges andopportunities. Nat Rev Genet 2011, 12(2):87–98.
3. Xu W, Seok J, Mindrinos MN, Schweitzer AC, Jiang H, Wilhelmy J, Clark TA,Kapur K, Xing Y, Faham M, Storey JD, Moldawer LL, Maier RV, TompkinsRG, Wong WH, Davis RW, Xiao W, the Inflammation and Host Response toInjury Large-Scale Collaborative Research Program: Humantranscriptome array for high-throughput clinical studies. Proc NatlAcad Sci U S A 2011, 108(9):3707–3712.
4. Kapranov P, Cheng J, Dike S, Nix DA, Duttagupta R, Willingham AT, StadlerPF, Hertel J, Hackermuller J, Hofacker IL, Bel lI, Cheung E, Drenkow J,Dumais E, Patel S, Helt G, Ganesh M, Ghosh S, Piccolboni A,Sementchenko V, Tammana H, Gingeras TR: RNA maps reveal new RNAclasses and a possible function for pervasive transcription. Science2007, 316(5830):1484–1488.
5. Emanuelsson O, Nagalakshmi U, Zheng D, Rozowsky JS, Urban AE, Du J,Lian Z, Stolc V, Weissman S, Snyder M, Gerstein MB: Assessing theperformance of different high-density tiling microarray strategiesfor mapping transcribed regions of the human genome. Genome Res2007, 17(6):886–897.
6. Kampa D, Cheng J, Kapranov P, Yamanaka M, Brubaker S, Cawley S,Drenkow J, Piccolboni A, Bekiranov S, Helt G, Tammana H, Gingeras TR:Novel RNAs identified from an in-depth analysis of thetranscriptome of human chromosomes 21 and 22. Genome Res 2004,14(3):331–342.
7. Zhang ZD, Rozowsky J, Lam HY, Du J, Snyder M, Gerstein M: Tilescope:online analysis pipeline for high-density tiling microarray data.Genome Biol 2007, 8(5).
8. Royce TE, Carriero NJ, Gerstein MB: An efficient pseudomedian filter fortiling microrrays. BMC Bioinformatics 2007, 8:186–186.
9. Wang LY, Abyzov A, Korbel JO, Snyder M, Gerstein M: MSB: amean-shift-based approach for the analysis of structural variation inthe genome. Genome Res 2009, 19:106–117.
10. Ji H, Wong WH: TileMap: create chromosomal map of tiling arrayhybridizations. Bioinformatics 2005, 21(18):3629–3636.
11. Du J, Rozowsky JS, Korbel JO, Zhang ZD, Royce TE, Schultz MH, Snyder M,Gerstein M: A supervised hidden markov model framework forefficiently segmenting tiling array data in transcriptional andchIP-chip experiments: systematically incorporating validatedbiological knowledge. Bioinformatics 2006, 22(24):3016–3024.
12. Toyoda T, Shinozaki K: Tiling array-driven elucidation oftranscriptional structures based on maximum-likelihood andMarkov models. Plant J 2005, 43(4):611–621.
13. Nicolas P, Leduc A, Robin S, Rasmussen S, Jarmer H, Bessieres P:Transcriptional landscape estimation from tiling array data using amodel of signal shift and drift. Bioinformatics 2009, 25(18):2341–2347.
14. Olshen AB, Venkatraman ES, Lucito R, Wigler M: Circular binarysegmentation for the analysis of array-based DNA copy numberdata. Biostatistics 2004, 5(4):557–572.
15. Huber W, Toedling J, Steinmetz LM: Transcript mapping withhigh-density oligonucleotide tiling arrays. Bioinformatics 2006,22(16):1963–1970.
16. David L, Huber W, Granovskaia M, Toedling J, Palm CJ, Bofkin L, Jones T,Davis RW, Steinmetz LM: A high-resolution map of transcription in theyeast genome. Proc Natl Acad Sci U S A 2006, 103(14):5320–5325.
17. Mallat S: A Wavelet Tour of Signal Processing. San Diego: Academic Press;1998.
18. Karpikov A, Rozowsky J, Gerstein M: Tiling array data analysis: amultiscale approach using wavelets. BMC Bioinformatics 2011,12:57–57.
19. Buck MJ, Lieb JD: ChIP-chip: considerations for the design, analysis,and application of genome-wide chromatin immunoprecipitationexperiments. Genomics 2004, 83(3):349–360.
20. Mallat S: Zero-crossings of a wavelet transform. IEEE Trans Info Th 1991,37(4):1019–1033.
21. Bischoff M, Dunman P, Kormanec J, Macapagal D, Murphy E, Mounts W,Berger-Bachi B, Projan S: Microarray-based analysis of theStaphylococcus aureus sigmaB regulon. J Bacteriol 2004,186(13):4085–4099.
22. Gertz S, Engelmann S, Schmid R, Ohlsen K, Hacker J, Hecker M:Regulation of sigmaB-dependent transcription of sigB and asp23 intwo different Staphylococcus aureus strains. Mol Gen Genet 1999,261(3):558–566.
23. Kullik I, Giachino P, Fuchs T: Deletion of the alternative sigma factorsigmaB in Staphylococcus aureus reveals its function as a globalregulator of virulence genes. J Bacteriol 1998,180(18):4814–4820.
24. Ziebandt AK, Weber H, Rudolph J, Schmid R, Hoper D, Engelmann S,Hecker M: Extracellular proteins of Staphylococcus aureus and therole of SarA and sigma B. Proteomics 2001, 1(4):480–493.
25. Karlsson A, Arvidson S: Variation in extracellular protease productionamong clinical isolates of Staphylococcus aureus due to differentlevels of expression of the protease repressor sarA. Infect Immun2002, 70(8):4239–4246.
26. Giachino P, Engelmann S, Bischoff M: Sigma(B) activity depends onRsbU in Staphylococcus aureus. J Bacteriol 2001, 183(6):1843–1852.
27. Gentleman R, Carey V, Huber W, Irizarry R, Dudoit S: Bioinformatics andComputational Biology Solutions Using R and Bioconductor (Statistics forBiology and Health). Secaucus, NJ, USA: Springer-Verlag New York, Inc.;2005.
28. Perocchi F, Xu Z, Clauder-Munster S, Steinmetz LM: Antisense artifactsin transcriptome microarray experiments are resolved byactinomycin D. Nucleic Acids Res 2007, 35(19):e128.
29. Donoho D, Johnstone I, Johnstone IM: Ideal Spatial Adaptation byWavelet Shrinkage. Biometrika 1993, 81:425–455.
30. Donoho D, Johnstone IM: Adapting to Unknown Smoothness viaWavelet Shrinkage. J Am Stat Assoc 1995, 90(432):1200–1224.
31. Hollander M, Wolfe DA: Nonparametric Statistical Methods, 2nd Edition:Wiley-Interscience;1999.
32. Picard F, Robin S, Lavielle M, Vaisse C, Daudin JJ: A statistical approachfor array CGH data analysis. BMC Bioinformatics 2005,6:27–27.
33. Kim Y, Bekiranov S, Lee JK, Park T: Double error shrinkage method foridentifying protein binding sites observed by tiling arrays withlimited replication. Bioinformatics 2009, 25(19):2486–2491.
34. Irizarry RA, Bolstad BM, Collin F, Cope LM, Hobbs B, Speed TP: Summariesof Affymetrix GeneChip probe level data. Nucleic Acids Res 2003,31(4):e15.
35. Sorek R, Cossart P: Prokaryotic transcriptomics: a new view onregulation, physiology and pathogenicity. Nat Rev Genet 2010,11:9–16.
36. Landt SG, Abeliuk E, McGrath PT, Lesley JA, McAdams HH, Shapiro: Smallnon-coding RNAs in Caulobacter crescentus. Mol Microbiol 2008,68(3):600–614.
37. Cho BK, Zengler K, Qiu Y, Park YS, Knight EM, Barrett CL, Gao Y, Palsson BØ:The transcription unit architecture of the Escherichia coli genome.Nat Biotechnol 2009, 27(11):1043–1049.
38. Toledo-Arana A, Dussurget O, Nikitas G, Sesto N, Guet-Revillet H,Balestrino D, Loh E, Gripenland J, Tiensuu T, Vaitkevicius K, Barthelemy M,Vergassola M, Nahori MA, Soubigou G, Regnault B, Coppee JY, Lecuit M,Johansson J, Cossart P: The Listeria transcriptional landscapefrom saprophytism to virulence. Nature 2009,459(7249):950–956.
Segura et al. BMC Bioinformatics 2012, 13:222 Page 16 of 16http://www.biomedcentral.com/1471-2105/13/222
39. Smyth GK: Linear models and empirical bayes methods for assessingdifferential expression in microarray experiments. Stat Appl Genet MolBiol 2004, 3:Article3.
40. Daubechies I: Ten Lectures on Wavelets (CBMS-NSF Regional ConferenceSeries in Applied Mathematics). 1edition. SIAM: Society for Industrial andApplied Mathematics; 1992.
41. Munoz Barrutia, A, Ertle R, Unser M: Continuous Wavelet Transformwith Arbitrary Scales and O(N) Complexity. Signal Processing 2002,82(5):749–757.
42. Mallat SG: A theory for multiresolution signal decomposition: thewavelet representation. Pattern Anal and Machine Intelligence, IEEE Transon 1989, 11(7):674–693.
43. Du P, Kibbe WA, Lin SM: Improved peak detection in mass spectrumby incorporating continuous wavelet transform-based patternmatching. Bioinformatics 2006, 22(17):2059–2065.
44. Nguyen N, Huang H, Oraintara S, Vo A: Mass spectrometry dataprocessing using zero-crossing lines in multi-scale of Gaussianderivative wavelet. Bioinformatics 2010, 26(18):659–665.
45. Marr D, Hildreth E: Theory of Edge Detection. Proc R Soc London Ser B1980, 207:187–217.
46. Rioul O, Vetterli M: Wavelets and signal processing. IEEE Signal ProcessMag 1991, 8(4):14–38.
doi:10.1186/1471-2105-13-222Cite this article as: Segura et al.: Wavelet-based detection of transcrip-tional activity on a novel Staphylococcus aureus tiling microarray. BMCBioinformatics 2012 13:222.
Submit your next manuscript to BioMed Centraland take full advantage of:
• Convenient online submission
• Thorough peer review
• No space constraints or color figure charges
• Immediate publication on acceptance
• Inclusion in PubMed, CAS, Scopus and Google Scholar
• Research which is freely available for redistribution
Submit your manuscript at www.biomedcentral.com/submit