Embed Size (px)
Citation preview

Watson Pharmaceuticals, Inc. Company Valuation
Sixuan Chen
Advanced Corporate Finance
Prof. Satya Gabriel
April. 11, 2006

Presentation Overview Industry profile Current situation: company profile Forward looking: strategic plans Business environment: customers and
competitors Financial performance Valuation (assumptions, merger analysis)
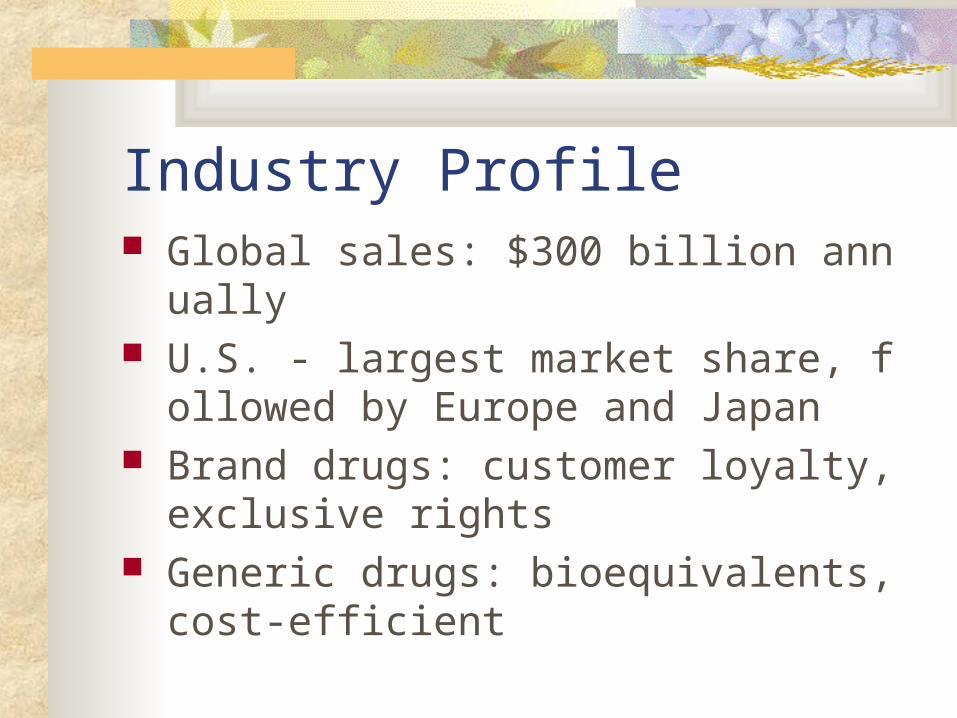
Industry Profile Global sales: $300 billion annually U.S. - largest market share, followed by Eu
rope and Japan Brand drugs: customer loyalty, exclusive ri
ghts Generic drugs: bioequivalents, cost-efficien
t
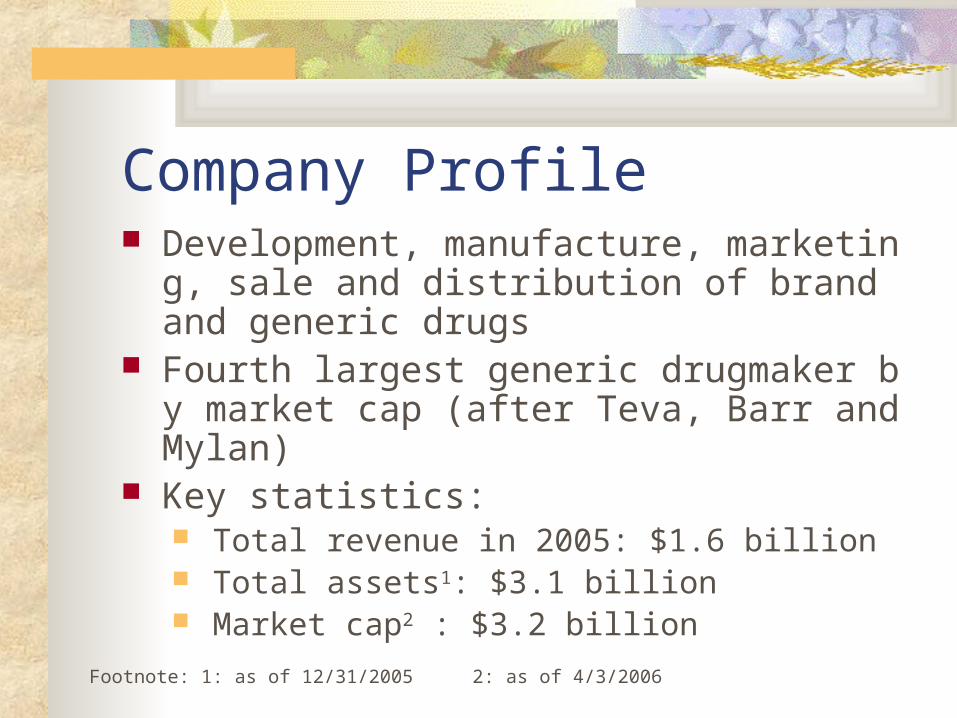
Company Profile Development, manufacture, marketing, sale
and distribution of brand and generic drugs Fourth largest generic drugmaker by market
cap (after Teva, Barr and Mylan) Key statistics:
Total revenue in 2005: $1.6 billion Total assets1: $3.1 billion Market cap2 : $3.2 billion
Footnote: 1: as of 12/31/2005 2: as of 4/3/2006

Generic vs. Brand segment 76% of total revenue More than 125 generi
c products 47 ANDAs on file Development in 2005:
six new launches
24% of total revenue More than 20 brand
products Two sales groups:
Specialty Products Nephrology

Branded Product PipelineBranded Product
Disease Market
Alliance Status
SilodosinTM Benign-Prostatic Hyperplasia
Kissei Late Stage
2nd Generation Oxybutynin
Overactive Bladder
Early Stage
Trelstar® line extension
Urology Early Stage
IntrinsaTM Female Sexual Dysfunction
P&G Filed
EmSamTM Depression Somerset-BMS
Approved

Strategic Alliances and Collaborations Somerset Pharmaceuticals, 50-50 JV with
Mylan (agreement w/ BMS) Feb. 2006, FDA approval for Emsam®
Generics development alliance with Cipla Citalopram (Q4, 2004)
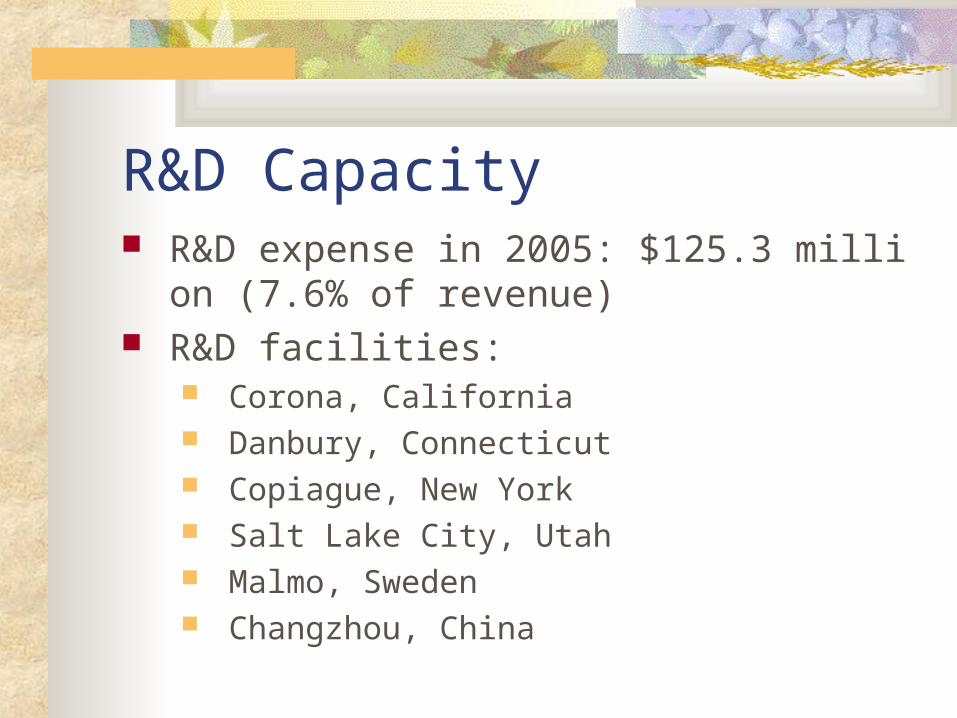
R&D Capacity R&D expense in 2005: $125.3 million (7.6% of r
evenue) R&D facilities:
Corona, California Danbury, Connecticut Copiague, New York Salt Lake City, Utah Malmo, Sweden Changzhou, China

Strategic PlansGeneric: Development of generic dru
gs that are difficult to formulate
Market generic alternatives to brand products
Distribute generic versions of third-party brands
“Watson Lab”, “Watson Pharma”, “Rugby”
Brand: 2005 launches:
Trelstar® and Oxytrol®
Higher profit margin Continue to expand through
Internal product development
Strategic alliances and acquisitions
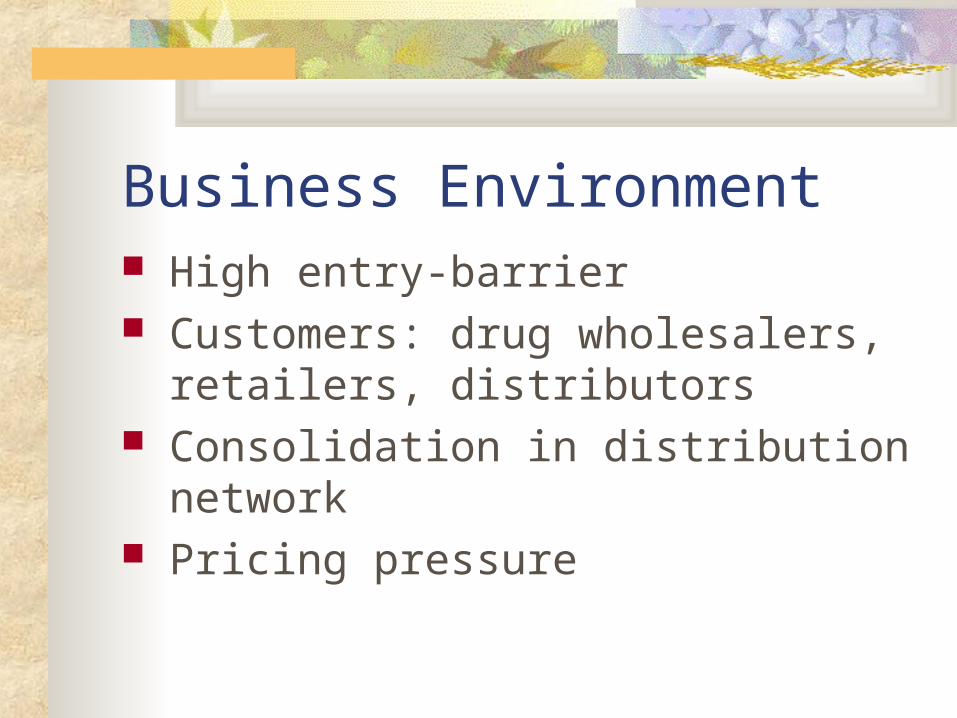
Business Environment High entry-barrier Customers: drug wholesalers, retailers,
distributors Consolidation in distribution network Pricing pressure

Competitive Landscape Brand products:
J&J, Novartis, Pfizer No competitive advantage
Generic products Teva, Barr, Mylan, brand name companies in
the generic market Key: timing of product’s regulatory approval
and launch

Financial Performance Revenue growth 5-year CAGR: 9.13% In 2005, total revenue growth 0.34%
Generics: -2.51% Price declines on nicotine gum due to entry of a competito
r Increase in R&D expenses
Brand: 4.37% Specialty - Trelstar®
Nephrology - Ferrlecit®
Impairment charge: $25.1 million (2005)

Stock Performance
Source: Datastream, Yahoo!-Finance

1-year Stock Performance
WPI vs. Industry
1-year Stock Performance
WPI vs. S&P 500
Source: Datastream, Yahoo!-Finance

Valuation – DCF Key assumptions:
Operations: Organic revenue growth Gross/operating margin
CapEx, Depreciation Working capital

Valuation – DCF (cont’d) CAPM model:
Risk free rate: 4.86% Market risk premium: 6.00% Beta: 1.55 Default spread: 2.00% (Bond rating: BBB-) Debt ratio: 15.47% Tax rate: 37%
WACC = 12.65%

Valuation – DCF Result 5-year top-line growth: 6% Continued growth: 5% Price per share: $30.45 Current share price1: $29.01 Consensus estimates:
Valueline 3-5 year price range: $45-$65 Thompson 12-month target price: $32
1: Share price as of April 3, 2006

Valuation – DCF Sensitivity Analysis
Continued growth rate
5-year top-line growth
6% 5% 4%
Management prediction
9.25% $34.91 $31.16 $28.27
Valueline estimate
6.00% $34.02 $30.45 $27.70
Worst-case estimate
4.00% $33.37 $29.91 $27.26

Valuation – DCF Sensitivity Analysis (cont’d)
Continued growth rate
WACC 6% 5% 4%
10% $59.12 $48.62 $41.61
11% $46.97 $40.21 $35.39
12% $38.88 $34.22 $30.73

Valuation – Comps Brand: Pfizer, J&J, Glaxosmithkline, Nova
rtis, Bayer Generic: Teva, Barr, Mylan, King, Alphar
ma, Par Forward P/E1: $27.21 Forward Price/Sales1: $44.14
1: For both P/E and Price/Sales used Generic Median; Sales and EPS estimates from Thompson One

Potential Merger Analysis WPI agreed to acquire Andrx for $1.9 billi
on in cash ($25 per share, 32% premium) Andrx – Drug delivery
Total revenue in 2005: $1 billion Total assets: $1.2 billion Total market cap: $1.7 billion Current P/E: 27.9x Drug distribution (65%), manufacture (35%)

Potential Merger Analysis (cont’d) Merger positives
Third-largest generic drug maker, 60 generic drugs in pipeline
Synergies in SG&A Distribution network
Merger negatives Potential opposition Creditwatch by S&P Andrx production halted by FDA

SUMMARY DCF valuation range: $27-35 Potential upside Merger impact Industry prospect: aging population Recommendation: cautious buy at low

THANK YOU!
Questions?