Embed Size (px)
Citation preview

Centre Pivot
Page 1 1
WaterWise on the Farm
Introduction toIrrigation Management
Evaluating your pressurised system
System 3
Centre pivots
150501

Centre Pivot
Page 2 2
This evaluation method has been developed by members of the Water ManagementProgram team including Rob Hoogers and Peter Smith.copyright: NSW Agriculture 2001This version May 15 2001CONTENTS
Aims 3Overview of centre pivot irrigators 3Equipment needed 4Evaluation method 5
Occupational Health and Safety 5Centre pivot data sheet (sample data) 6Application Results table 7Pressure and flow record sheet (example) 8Field data sheet (example) 9Calculating the mean application per pass 10Calculating distribution uniformity 11
Table 1 Converting mL to mm of irrigation 12Blank evaluation sheets 13Centre pivot data sheet (sample data) 14Application results table 15Pressure and flow record sheet (example) 16Field data sheet 17Calculating the Mean Application per pass 18Calculating Distribution Uniformity 19
Table 1 Converting mL to mm of irrigation 20

Centre Pivot
Page 3 3
AimsThe aim of this workshop is to evaluate your centre pivot irrigation system. To do this youneed to determine the rate that water is being applied, and how uniformly that water is beingdistributed over your irrigation area. To check these you need to know the mean application(MA) and distribution uniformity (DU) for your system. These worksheets outline theequipment and procedure needed for you to complete these tasks.
Overview of centre pivot irrigatorsA centre pivot is a travelling irrigation line that pivots at one end and rotates in a circle. It ismade up of towers (commonly 4 to 12) that support the irrigation pipe and spray outlets.They have a pair of wheels at the junction of each tower that is driven by electric motors orhydraulic motors (oil or water). The speed of the pivot system is usually set on the outsidewheels with the other drive points engaging when they get behind or a valve is adjusted withthe angle of that joint.
The size of the sprinkler outlets increases because the outer sections of the pivot arecovering a larger area than the centre sections. This means that the longer a pivot is, thegreater the application rate needed at the end.A major advantage of centre pivots is that they can operate at quite low pressures, thusreducing pumping cost. If the site is undulating, pressure regulators are fitted to eachsprinkler outlet to equalise the output at varying heights. Most modern centre pivots operateat only 100 kPa. With pipes from the centre to the pump site, the total pressure required canbe as low as 300 kPa.

Centre Pivot
Page 4 4
Equipment neededTo measure pressure:
• an accurate pressure gauge with an appropriate scale so it works mid-range at yournormal pressures (say 0 to 600 kPa)
• a pitot tube attachment (pronounced pit-oh), or a threaded 15 mm PVC tee andfittings such as reducing bushes for small low-level sprinklers, or a Schrader valve.
Figure 1 (a and b)
To measure sprinkler coverage:
• catch cans
• gravel pieces to place in cans to stop them blowing away• 30 metre tape for measuring distances in laying out the container row and estimating
the machine’s speed
• stop watch
• manufacturer’s nozzle specifications giving pressure and flow, and instructions forsetting machine speed
• a measuring cylinder or jug with graduations in millilitres
• a calculator, a pen and record sheets

Centre Pivot
Page 5 5
Evaluation methodTo assess the performance of your centre pivot system, you need to measure the pressureand flow at various points in the system, the operating speed at the far end, and the outputof the sprinklers using catch cans. From these you will be able to calculate the applicationand uniformity. To do this, work through the following procedure.
Occupational Health and Safety
Whilst working with your centre pivot irrigator you, and anyone assistingyou, should at all times be aware of the inherent dangers associated withworking near moving machinery. Safety should be the primary concern atall times.
1. Fill out the first sections of the centre pivot data sheet with details about the crop, soilsand the centre pivot. You will need to measure the length of each span and the distanceto the last wheel track (where the travel speed will be measured).
Speed measurement
Note that the pivot must be moving (at its normal speed) throughout the test, otherwise thedifference in flow rates between the inboard and outboard sprinklers will give you incorrectresults. If all is correct, the depths in all of the catch cans will be similar.2. Measure the pivot's speed by staking out a measured distance (10 m) around the outer
wheel track and recording the time required for the end drive unit to travel between thestakes. Record the time and distance on the data sheet.
Water output measurement
3. Place the catch cans at equal spacings (5 m to 10 m) to cover the whole wetted length ofthe pivot. (The number used doesn't matter, but they must be evenly spaced.)
4. Measure the width of the wetting pattern near the end drive unit and record this.5. After the system has passed all catch cans, and no more water is landing in them,
measure the volumes in the catch cans and record these on the catch can sheet.Measuring pressure and flow6. Measure and record the pressure and flow at outlets near the start and end of the pivot
and also at other positions on towers along the pivot.Calculating the results7. After taking all measurements, you can move inside to complete the calculations.
Because the calculations for a centre pivot are quite complex, it is best to put the figuresinto a computer spreadsheet and let it work out the results. Your trainer should have theappropriate program. If you are doing the evaluation at home, ask for a copy of theprogram or get your local irrigation adviser to assist you. The program may be availableto download from the WaterWise web pages on NSW Agriculture's web site.
8. Record the results in the application results table. If you are happy to use a calculator,the procedure is fully detailed at the end of these notes.
Centre Pivot
Page 6 6
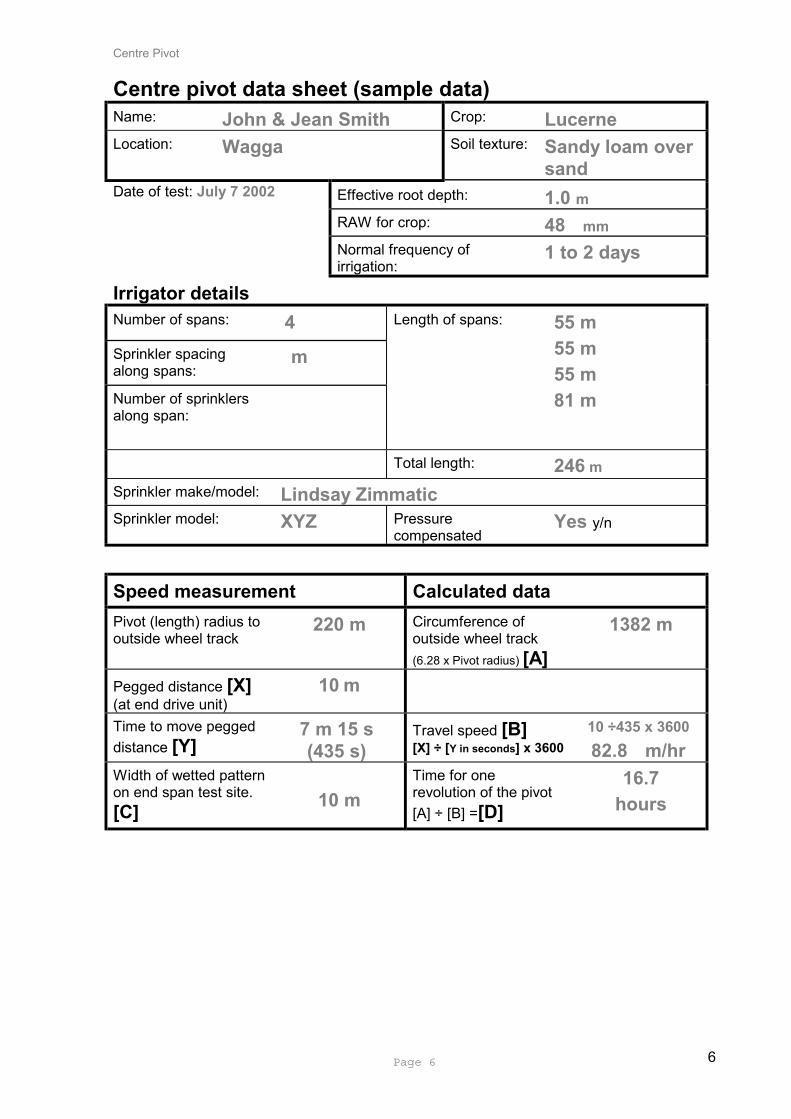
Centre pivot data sheet (sample data)Name: John & Jean Smith Crop: LucerneLocation: Wagga Soil texture: Sandy loam over
sandEffective root depth: 1.0 mDate of test: July 7 2002
RAW for crop: 48 mmNormal frequency ofirrigation:
1 to 2 days
Irrigator detailsNumber of spans: 4Sprinkler spacingalong spans:
m
Number of sprinklersalong span:
Length of spans: 55 m55 m55 m81 m
Total length: 246 mSprinkler make/model: Lindsay ZimmaticSprinkler model: XYZ Pressure
compensatedYes y/n
Speed measurement Calculated dataPivot (length) radius tooutside wheel track
220 m Circumference ofoutside wheel track(6.28 x Pivot radius) [A]
1382 m
Pegged distance [X](at end drive unit)
10 m
Time to move peggeddistance [Y]
7 m 15 s(435 s)
Travel speed [B][X] ÷ [Y in seconds] x 3600
10 ÷435 x 360082.8 m/hr
Width of wetted patternon end span test site.[C] 10 m
Time for onerevolution of the pivot[A] ÷ [B] =[D]
16.7hours

Centre Pivot
Page 7 7
Application results tableExample Your data
Mean application per pass:From computer program OR your owncalculations using procedure at end ofthese notes.
9.8 mm
The application per pass should be compared to the rootzone RAW on the data sheet. Forthe example, the application depth is one quarter of the RAW.
Lower quarter output per passFrom computer program OR your owncalculations using procedure at end ofthese notes.
8.0 mm
Distribution uniformityFrom computer program OR your owncalculations using procedure at end ofthese notes.
81 %
A distribution uniformity above 75% is quite acceptable for field crops. If the DU is too low,this means that at least 25% of the area being irrigated is receiving less water than the rest.
Centre Pivot
Page 8 8
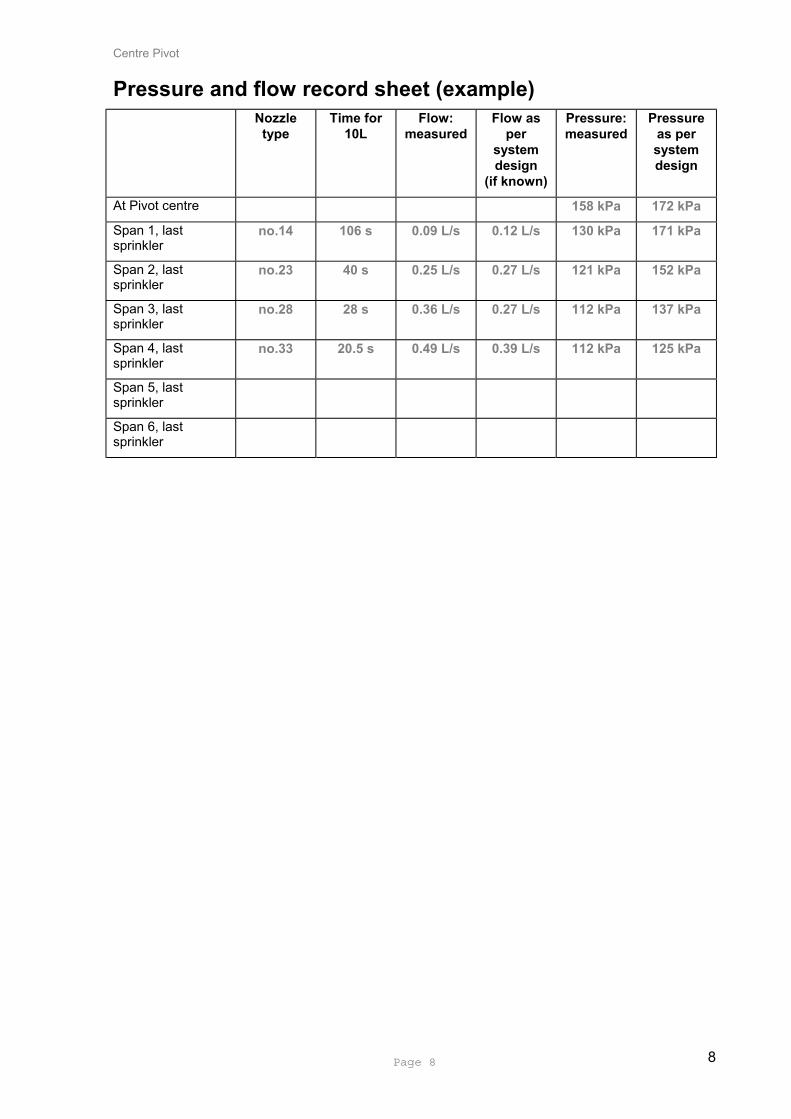
Pressure and flow record sheet (example)Nozzle
typeTime for
10LFlow:
measuredFlow as
persystemdesign
(if known)
Pressure:measured
Pressureas persystemdesign
At Pivot centre 158 kPa 172 kPa
Span 1, lastsprinkler
no.14 106 s 0.09 L/s 0.12 L/s 130 kPa 171 kPa
Span 2, lastsprinkler
no.23 40 s 0.25 L/s 0.27 L/s 121 kPa 152 kPa
Span 3, lastsprinkler
no.28 28 s 0.36 L/s 0.27 L/s 112 kPa 137 kPa
Span 4, lastsprinkler
no.33 20.5 s 0.49 L/s 0.39 L/s 112 kPa 125 kPa
Span 5, lastsprinkler
Span 6, lastsprinkler

Centre Pivot
Page 9 9
Catch can sheet (example)If you have access to the computer program you only need to fill in columns 2 and 3 of thistable. The computer will do the rest.
Property location: Singleton, Centre pivot - no end gun, 16th Aug 2000Span # Catch can
positionnumber
Volumecollected
in canmL
Weightedcatch
Column 2 x Column 3
1 1 ignore 01 2 65 1301 3 80 2401 4 52 2081 5 81 4052 6 80 4802 7 78 5462 8 91 7282 9 83 7472 10 88 8803 11 126 13863 12 80 9603 13 140 18203 14 105 14703 15 95 14254 16 88 14084 17 96 16324 18 108 19444 19 128 24324 20 93 18604 21 85 17855 22 96 2112
23 dry 024 dry 025 dry 026 dry 027 dry 028 dry 029 dry 030 dry 031 dry 032 dry 033 dry 034 dry 035 dry 036 dry 0

Centre Pivot
Page 10 10
Calculating the mean application (MA) per passFill in column 4 of the table by multiplying column 2 by column 3 for each can position.Total of all the used positionnumbersAdd up the numbers in Column 2where water was collected in the canIgnore empty can numbers.
252 [TN]
Total of all weighted catchesAdd up the numbers in column 4.
24598[TC]
Weighted average = TC ÷ TN = 24598 ÷ 252mL= 97.6 mL
Use the catch can conversion table toconvert mL to mm(113mm can used for example)
=9.76 mmSay 9.8 mm [MA]
Transfer the MA figure to the application results table (earlier).

Centre Pivot
Page 11 11
Calculating distribution uniformityCalculate ¼ of the weighted catches = TC ÷ 4
= 24598 ÷ 4
= 6149 [LQ]
• Look through column 3 (the volumes) and rank the lowest amounts, 1st, 2nd 3rd etc.Do this for about one third of the cans..
• Add up the figures in column 4 starting at the lowest rank (1st) and as you add eachfigure note the total.
• As soon as the total exceeds the figure for LQ above stop and remove the last figure- so the total is less than LQ.
• The figures you have added are your LQ catches- shade or highlight them on yourtable.
Total the position numbers (column 2)for the shaded cans. [TNLQ]
= 69
Add up the weighted catches for theshaded cans [TCLQ]
= 5501
Weighted LQ average =TCLQ ÷ TNLQ
= 5501 ÷ 69 mL= 80.0 mL
Use the catch can conversion table toconvert mL to mm [LQDepth](113mm can used for example)
= 8.0 mm
Distribution Uniformity [DU] = LQDepth ÷ MA
= 8 ÷ 9.8
= 0.81
= 81 %
Transfer the DU figure to the Application Results Table (earlier)

Centre Pivot
Page 12 12
Converting mL to mm
Diameter of catchcan (mm)
Figure to divide thecollected amount by
75 4.480 5.090 6.4
100 7.9102 8.2104 8.5106 8.8108 9.2110 9.5112 9.9113 10.0114 10.2115 10.4120 11.3125 12.25145 16.5165 21.3200 31.4220 38.0
Table 1 Converting mL to mm of irrigation
For catch-cans of 110 to 115 mm diameteracross the top, just divide the collectedamount by 10 to get mm of irrigation.For instance if you collected674 mL, this is equivalent to adepth of 67.4 mm.
If the size of the catch cans isdifferent, or you wish to be moreaccurate, use the tablealongside.Divide the amount caught by thefigure in the right hand column.For instance, if the diameter is110 mm and you catch 674 mLthis is 674 ÷ 9.5 = 71 mm
If you use 4 litre square plastic ‘ice cream’containers, 1 litre collected in one of these isequivalent to 25 mm of irrigation. On acalculator, use“water collected in mL” ÷ 40 = mm

Centre Pivot
Page 13 13
Blank evaluation sheets

Centre Pivot
Page 14 14
Centre pivot data sheet (sample data)Name: Crop:
Location: Soil texture:
Effective root depth: mDate of test:
RAW for crop: mmNormal frequency ofirrigation:
days
Irrigator detailsNumber of spans:
Sprinkler spacingalong spans:
m
Number of sprinklersalong span:
Length of spans: .. m.. m.. m.. m.. m.. m
Total length: …. mSprinkler make/model:
Sprinkler model: Pressurecompensated
…. y/n
Speed measurement Calculated dataPivot (length) radius tooutside wheel track
….. m Circumference ofoutside wheel track(6.28 x Pivot radius) [A]
……m
Pegged distance [X](at end drive unit)
… m
Time to move peggeddistance [Y]
.. m … s….. s
Travel speed [B][X] ÷ [Y in seconds] x 3600 ……m/hr
Width of wetted patternon end span test site.[C] ….. m
Time for onerevolution of the pivot[A] ÷ [B] =[D]
…..hours

Centre Pivot
Page 15 15
Application results tableExample Your data
Mean Application per pass:From computer program OR your owncalculations using procedure at end ofthese notes
9.8 mm
The application per pass should be compared to the Rootzone RAW on the data sheet.For the example the application depth is one quarter of the RAW.
Lower quarter output per passFrom computer program OR your owncalculations using procedure at end ofthese notes
8.0 mm
Distribution UniformityFrom computer program OR your owncalculations using procedure at end ofthese notes
81 %
A Distribution Uniformity above 75% is quite acceptable for field crops If the DU is too low,this means that at least 25% of the area being irrigated is receiving less water than therest.

Centre Pivot
Page 16 16
Pressure and flow record sheet (example)Nozzle
typeTime for
10LFlow -
measured
Flow asper
systemdesign
(ifknown)
Pressure–
measured
Pressureas persystemdesign
At Pivot centre … kPa …. kPaSpan 1, lastsprinkler
no… …. s …. L/s …..L/s … kPa …. kPa
Span 2, lastsprinkler
no…. … s ….. L/s …. L/s …. kPa … kPa
Span 3, lastsprinkler
no…. …s …..L/s ….. L/s …. kPa … kPa
Span 4, lastsprinkler
no…. .. s ….. L/s ….. L/s …. kPa …. kPa
Span 5, lastsprinkler
Span 6, lastsprinkler

Centre Pivot
Page 17 17
Catch can sheetIf you have access to the computer program you only need to fill in columns 2 and 3 of thistable. The computer will do the rest.
Property location:
Date:Span # Catch can
positionnumber
Volumecollected
in canmL
WeightedCatch
Column 2 x Column 3
123456789101112131415161718192021222324252627282930313233343536

Centre Pivot
Page 18 18
Calculating the Mean Application per passFill in column 4 of the table by multiplying column 2 by column 3 for eachcan position.Total of all the used positionnumbersAdd up the numbers in Column 2where water was collected in thecan Ignore empty can numbers.
252 [TN]
Total of all weighted catchesAdd up the numbers in column 4
24598[TC]
Weighted average = TC ÷ TN = 24598 ÷ 252mL= 97.6 mL
Use the catch can conversiontable to convert mL to mm(113mm can used for example)
=9.76 mmSay 9.8 mm [MA]
Transfer the MA figure to the Application Results table (earlier)

Centre Pivot
Page 19 19
Calculating Distribution Uniformity
Calculate ¼ of the weighted catches = TC ÷ 4
= 24598 ÷ 4
= 6149 [LQ]
Look through column 3 (the volumes) and rank the lowest amounts, 1st, 2nd 3rd etc.Do this for about one third of the cans..
Add up the figures in column 4 starting at the lowest rank (1st) and as you add eachfigure note the total.
As soon as the total exceeds the figure for LQ above stop and remove the last figure,so the total is less than LQ.
The figures you have added are your LQ catches- shade or highlight them on yourtable.
Total the position numbers (column 2)for the shaded cans. [TNLQ]
= 69
Add up the weighted catches for theshaded cans [TCLQ]
= 5501
Weighted LQ average =TCLQ ÷ TNLQ
= 5501 ÷ 69 mL= 80.0 mL
Use the catch can conversion table toconvert mL to mm [LQDepth](113mm can used for example)
= 8.0 mm
Distribution Uniformity [DU] = LQDepth ÷ MA
= 8 ÷ 9.8
= 0.81
= 81 %Transfer the DU figure to the Application Results table (earlier).

Centre Pivot
Page 20 20
Converting mL to mmDiameter of catch
can (mm)Figure to divide thecollected amount by
75 4.480 5.090 6.4
100 7.9102 8.2104 8.5106 8.8108 9.2110 9.5
112 9.9113 10.0114 10.2115 10.4120 11.3125 12.25145 16.5165 21.3200 31.4220 38.0
Table 1 Converting mL to mm of irrigation
For catch-cans of 110 to 115 mmdiameter across the top, just divide thecollected amount by 10 to get mm ofirrigation.For instance if you collected 674 mL,this is equivalent to a depth of 67.4 mm.If the size of the catch cans isdifferent, or you wish to bemore accurate, use the tablealongside.Divide the amount caught bythe figure in the right handcolumn. For instance, if thediameter is 110 mm and youcatch 674 mL this is 674 ÷ 9.5= 71 mm
If you use 4-litre square plastic icecream containers,
1 litre collected in one of these isequivalent to 25 mm of irrigation.
On a calculator, use “watercollected in mL” ÷ 40 = mm