Embed Size (px)
Citation preview
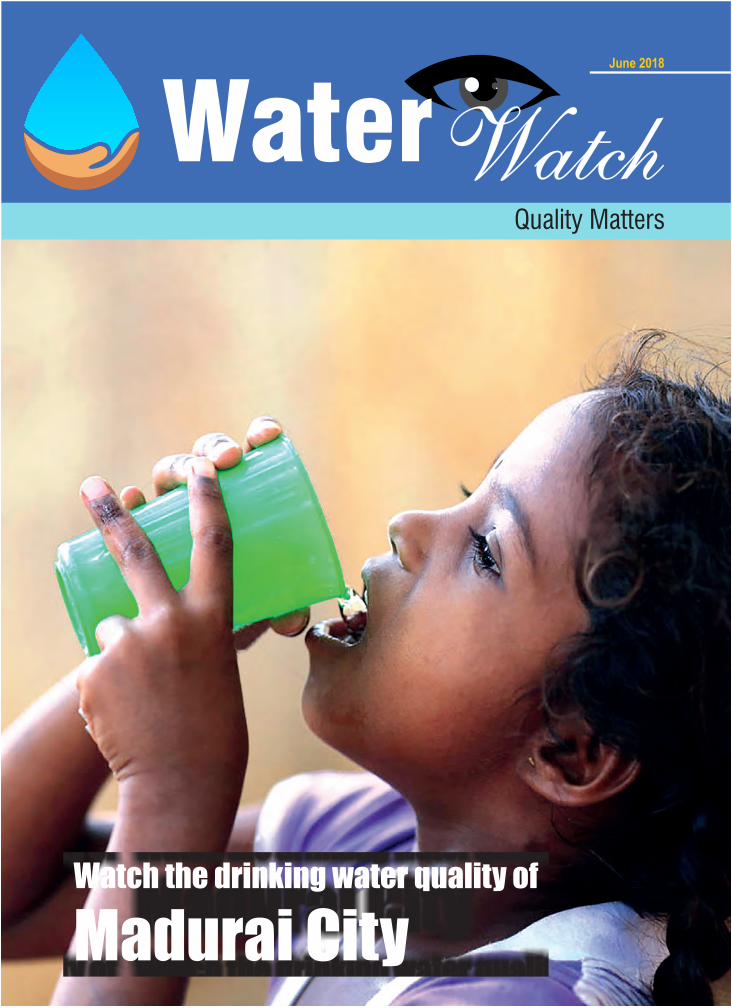
June 2018
WatchWaterQuality Matters
Watch the drinking water quality of
Madurai City
Monthly Water update from CURE
Vol. I Issue 1 June 2018
Contents
1. Quality Matters 1
2. Water supply by Madurai Corporation 2
3. Baseline Assessment and Scenario Analysis 3
4. Know about parameters 5
5. Results of various drinking water source 7
6. Analysis of Mitigation option 15
7. Governance Reflection 16
WatchWater
Centre for Urban Water Resource (CURE)
DHAN Vayalagam (Tank) Foundation1A, Vaidyanathapuram East
Kennet Cross Road
Madurai 625 016. Tamil Nadu, INDIA
Tel.: +91 452 2302500; Fax: 2602247
Email: [email protected]
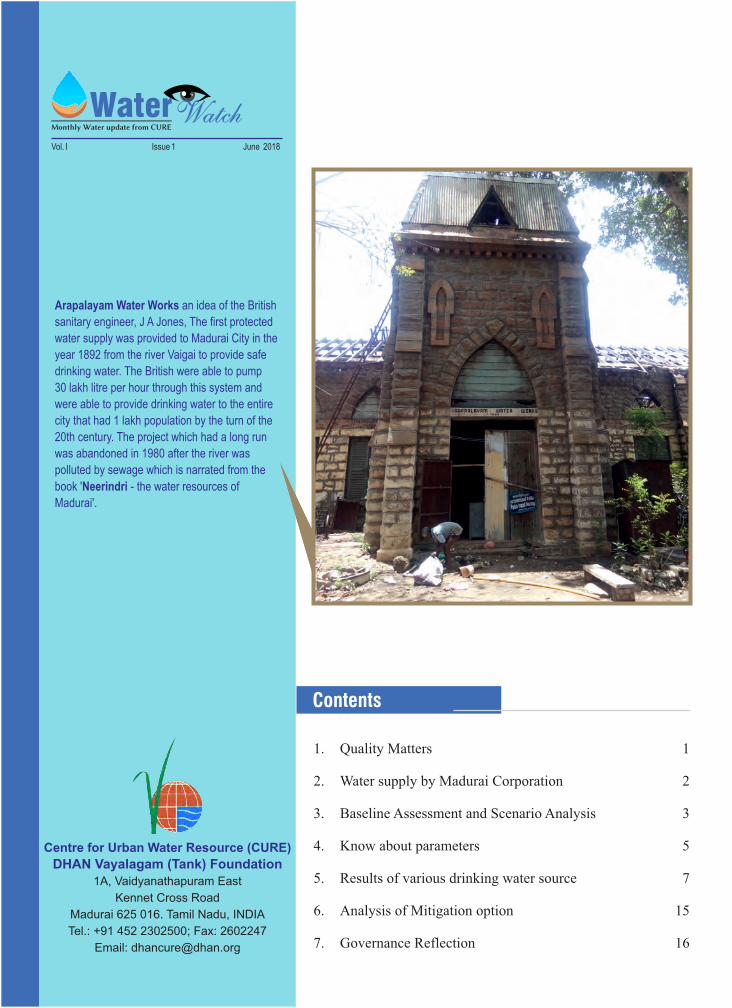
Arapalayam Water Works an idea of the British
sanitary engineer, J A Jones, The first protected
water supply was provided to Madurai City in the
year 1892 from the river Vaigai to provide safe
drinking water. The British were able to pump
30 lakh litre per hour through this system and
were able to provide drinking water to the entire
city that had 1 lakh population by the turn of the
20th century. The project which had a long run
was abandoned in 1980 after the river was
polluted by sewage which is narrated from the
book 'Neerindri - the water resources of
Madurai'.
Water Watch June 2018 1
Quality Matters!
Access to safe drinking-water is essential to health, a basic human right and a component of effective
policy for health protection.
The world is facing a water quality challenge. Serious and increasing pollution of fresh water in urban areas poses a growing risk to public health, food security, biodiversity and other ecosystem services. Without a preliminary assessments of the current water quality situation, the magnitude of the challenge is still unknown. Quality of drinking water is a serious concern in urban areas of India, with cities facing problems of water contamination time to time. Better information is required on where the issues lie and what is needed to effectively and efficiently take action to protect and improve water quality.
844 MillionPeople don’t have
clean water. (Source: WHO/UNICEF Joint
Monitoring Programme (JMP)
Report 2017)
Every 2 minutesDiarrhoea caused by dirty water and poor toilets kills a child
under 5. (Source: WASHWatch.org)
$1=$4Every $1 invested in water returns an average
of $4 in increased productivity. (Source: WHO, 2012)
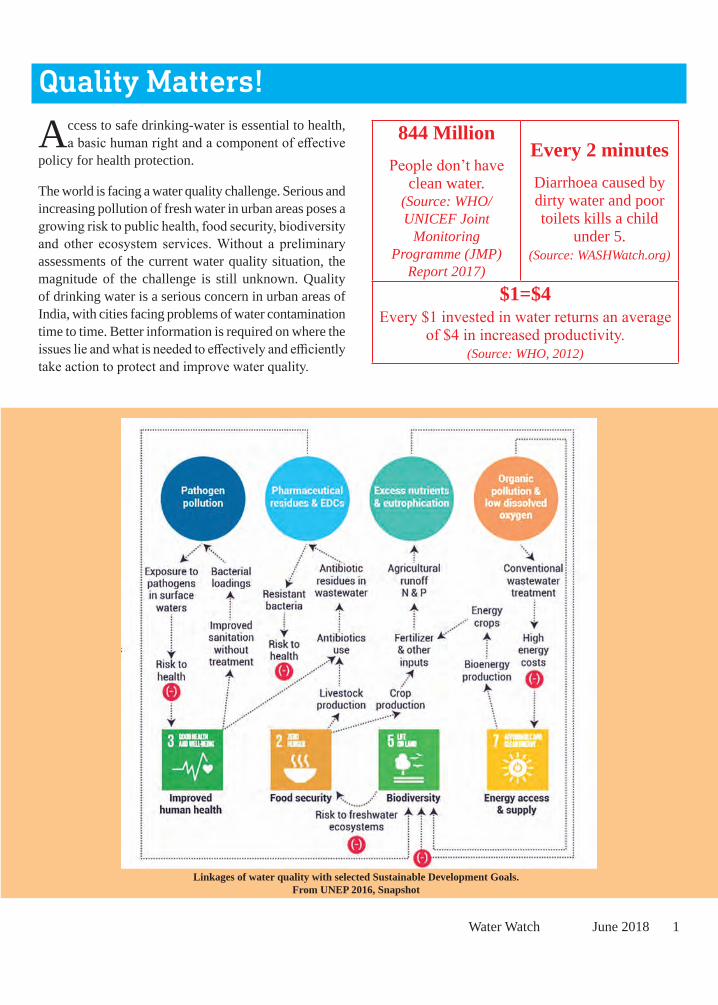
Linkages of water quality with selected Sustainable Development Goals. From UNEP 2016, Snapshot
Objective
yy More data are urgently needed in order to better understand the Madurai’s water quality challenge, which is affecting key freshwater ecosystem services such as drinking water, health, biodiversity and food security.yy This water quality assessment would provide
policymakers and other stakeholders with information they need in order to make informed decisions to address this issue.
Waterwatch Answers
An assessment of the Madurai water quality situation is needed to address many different important questions.
Such as yy What is the water quality situation in different parts
of the Madurai with regards to different water quality parameters?yy What is the trend of water quality, and what are the
main drivers of these trends?yy For a particular location, what is the relationship
between pressures, impacts, and responses to water quality degradation?yy What are the various alternatives for technical
measures or management strategies to protect good water quality or reduce water pollution?yy What is the role of governance in maintaining or
restoring water quality?
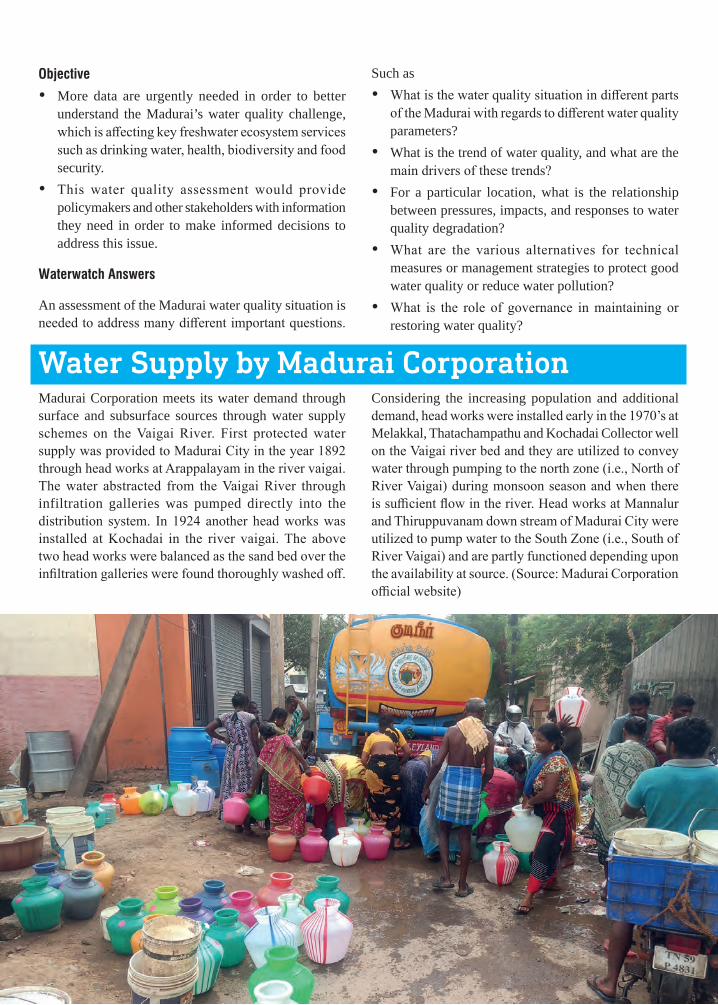
Madurai Corporation meets its water demand through surface and subsurface sources through water supply schemes on the Vaigai River. First protected water supply was provided to Madurai City in the year 1892 through head works at Arappalayam in the river vaigai. The water abstracted from the Vaigai River through infiltration galleries was pumped directly into the distribution system. In 1924 another head works was installed at Kochadai in the river vaigai. The above two head works were balanced as the sand bed over the infiltration galleries were found thoroughly washed off.
Water Supply by Madurai CorporationConsidering the increasing population and additional demand, head works were installed early in the 1970’s at Melakkal, Thatachampathu and Kochadai Collector well on the Vaigai river bed and they are utilized to convey water through pumping to the north zone (i.e., North of River Vaigai) during monsoon season and when there is sufficient flow in the river. Head works at Mannalur and Thiruppuvanam down stream of Madurai City were utilized to pump water to the South Zone (i.e., South of River Vaigai) and are partly functioned depending upon the availability at source. (Source: Madurai Corporation official website)
Water Watch June 2018 3
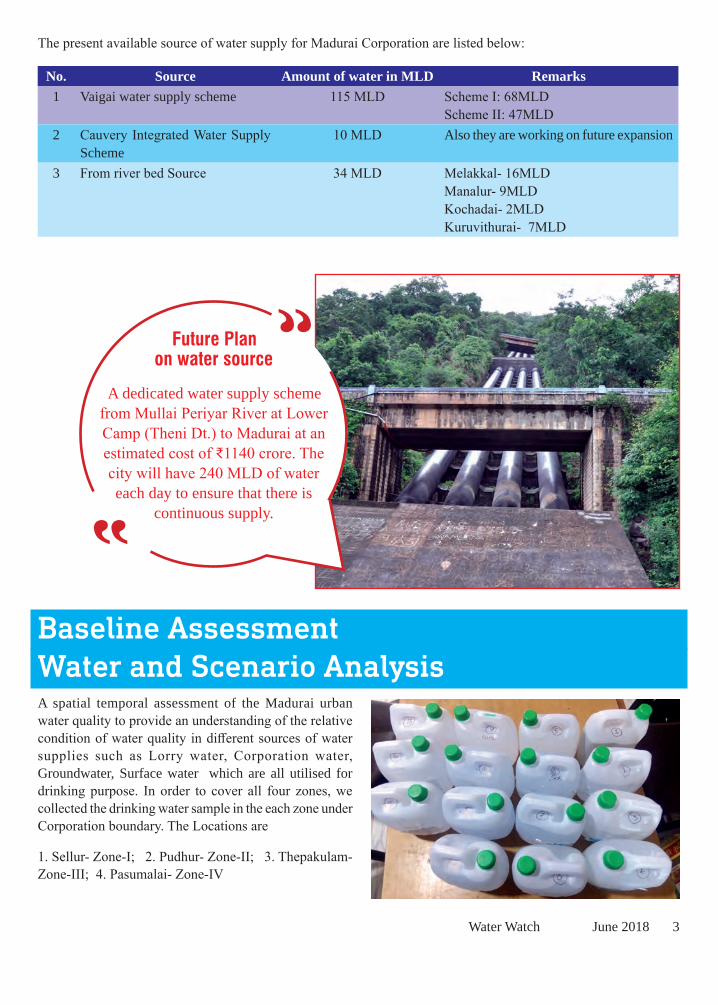
Future Plan on water source
A dedicated water supply scheme from Mullai Periyar River at Lower Camp (Theni Dt.) to Madurai at an estimated cost of ₹1140 crore. The city will have 240 MLD of water each day to ensure that there is
continuous supply.
The present available source of water supply for Madurai Corporation are listed below:
No. Source Amount of water in MLD Remarks1 Vaigai water supply scheme 115 MLD Scheme I: 68MLD
Scheme II: 47MLD2 Cauvery Integrated Water Supply
Scheme10 MLD Also they are working on future expansion
3 From river bed Source 34 MLD Melakkal- 16MLDManalur- 9MLDKochadai- 2MLDKuruvithurai- 7MLD
Baseline Assessment Water and Scenario AnalysisA spatial temporal assessment of the Madurai urban water quality to provide an understanding of the relative condition of water quality in different sources of water supplies such as Lorry water, Corporation water, Groundwater, Surface water which are all utilised for drinking purpose. In order to cover all four zones, we collected the drinking water sample in the each zone under Corporation boundary. The Locations are
1. Sellur- Zone-I; 2. Pudhur- Zone-II; 3. Thepakulam- Zone-III; 4. Pasumalai- Zone-IV
“
“

4 June 2018 Water Watch
Based on literature reviews and from expert guidance, we categorise the different source of drinking water so we collected more than 16 samples with in Corporation boundary where In each demographical zone we collected four samples of different sources.
Sampling Locations
Water Watch June 2018 5
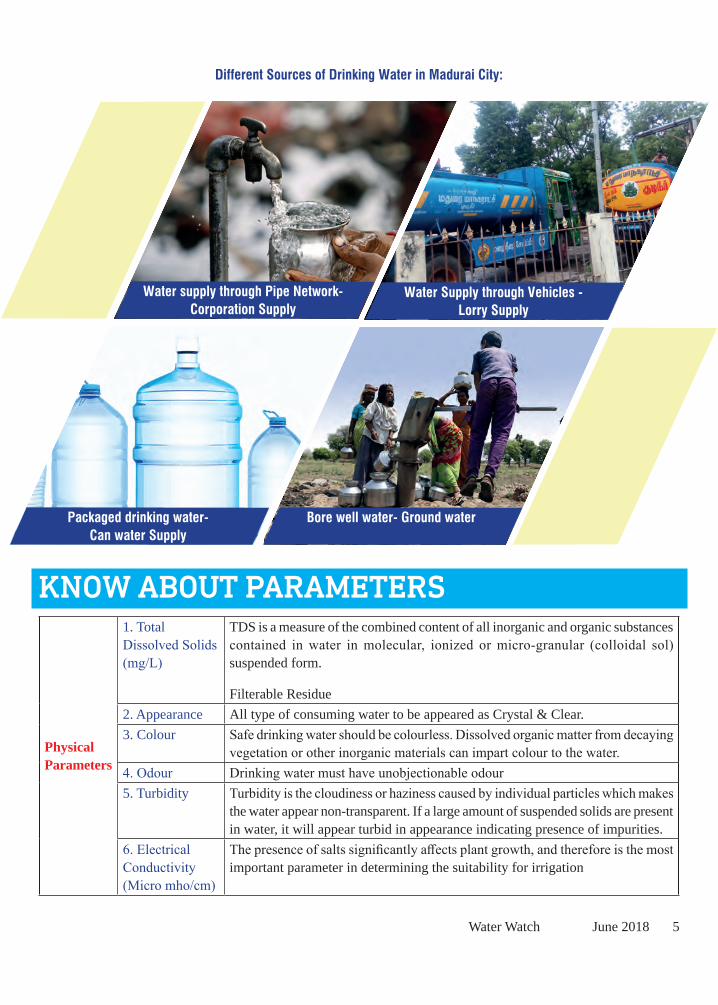
Different Sources of Drinking Water in Madurai City:
Water supply through Pipe Network-Corporation Supply
Water Supply through Vehicles - Lorry Supply
Packaged drinking water- Can water Supply
Bore well water- Ground water
KNOW ABOUT PARAMETERS
Physical Parameters
1. Total Dissolved Solids (mg/L)
TDS is a measure of the combined content of all inorganic and organic substances contained in water in molecular, ionized or micro-granular (colloidal sol) suspended form.
Filterable Residue2. Appearance All type of consuming water to be appeared as Crystal & Clear.3. Colour Safe drinking water should be colourless. Dissolved organic matter from decaying
vegetation or other inorganic materials can impart colour to the water.4. Odour Drinking water must have unobjectionable odour5. Turbidity Turbidity is the cloudiness or haziness caused by individual particles which makes
the water appear non-transparent. If a large amount of suspended solids are present in water, it will appear turbid in appearance indicating presence of impurities.
6. Electrical Conductivity (Micro mho/cm)
The presence of salts significantly affects plant growth, and therefore is the most important parameter in determining the suitability for irrigation
6 June 2018 Water Watch
Chemical Parameters
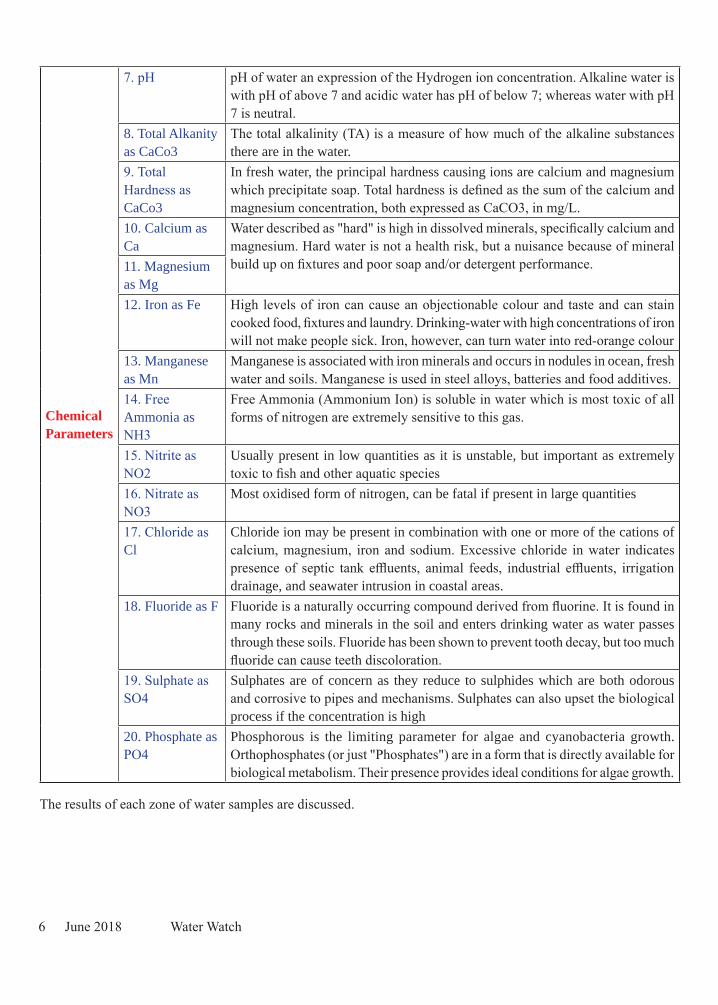
7. pH pH of water an expression of the Hydrogen ion concentration. Alkaline water is with pH of above 7 and acidic water has pH of below 7; whereas water with pH 7 is neutral.
8. Total Alkanity as CaCo3
The total alkalinity (TA) is a measure of how much of the alkaline substances there are in the water.
9. Total Hardness as CaCo3
In fresh water, the principal hardness causing ions are calcium and magnesium which precipitate soap. Total hardness is defined as the sum of the calcium and magnesium concentration, both expressed as CaCO3, in mg/L.
10. Calcium as Ca
Water described as "hard" is high in dissolved minerals, specifically calcium and magnesium. Hard water is not a health risk, but a nuisance because of mineral build up on fixtures and poor soap and/or detergent performance.11. Magnesium
as Mg12. Iron as Fe High levels of iron can cause an objectionable colour and taste and can stain
cooked food, fixtures and laundry. Drinking-water with high concentrations of iron will not make people sick. Iron, however, can turn water into red-orange colour
13. Manganese as Mn
Manganese is associated with iron minerals and occurs in nodules in ocean, fresh water and soils. Manganese is used in steel alloys, batteries and food additives.
14. Free Ammonia as NH3
Free Ammonia (Ammonium Ion) is soluble in water which is most toxic of all forms of nitrogen are extremely sensitive to this gas.
15. Nitrite as NO2
Usually present in low quantities as it is unstable, but important as extremely toxic to fish and other aquatic species
16. Nitrate as NO3
Most oxidised form of nitrogen, can be fatal if present in large quantities
17. Chloride as Cl
Chloride ion may be present in combination with one or more of the cations of calcium, magnesium, iron and sodium. Excessive chloride in water indicates presence of septic tank effluents, animal feeds, industrial effluents, irrigation drainage, and seawater intrusion in coastal areas.
18. Fluoride as F Fluoride is a naturally occurring compound derived from fluorine. It is found in many rocks and minerals in the soil and enters drinking water as water passes through these soils. Fluoride has been shown to prevent tooth decay, but too much fluoride can cause teeth discoloration.
19. Sulphate as SO4
Sulphates are of concern as they reduce to sulphides which are both odorous and corrosive to pipes and mechanisms. Sulphates can also upset the biological process if the concentration is high
20. Phosphate as PO4
Phosphorous is the limiting parameter for algae and cyanobacteria growth. Orthophosphates (or just "Phosphates") are in a form that is directly available for biological metabolism. Their presence provides ideal conditions for algae growth.
The results of each zone of water samples are discussed.
Water Watch June 2018 7
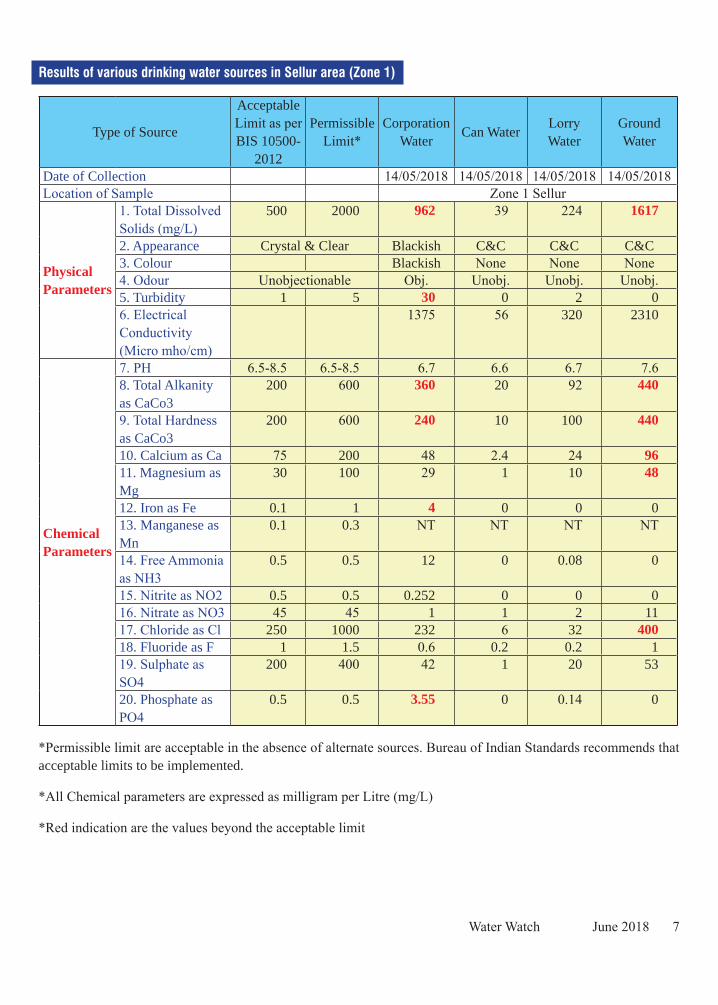
Results of various drinking water sources in Sellur area (Zone 1)
Type of Source
Acceptable Limit as per BIS 10500-
2012
Permissible Limit*
Corporation Water Can Water Lorry
WaterGround Water
Date of Collection 14/05/2018 14/05/2018 14/05/2018 14/05/2018Location of Sample Zone 1 Sellur
Physical Parameters
1. Total Dissolved Solids (mg/L)
500 2000 962 39 224 1617
2. Appearance Crystal & Clear Blackish C&C C&C C&C3. Colour Blackish None None None4. Odour Unobjectionable Obj. Unobj. Unobj. Unobj.5. Turbidity 1 5 30 0 2 06. Electrical Conductivity (Micro mho/cm)
1375 56 320 2310
Chemical Parameters
7. PH 6.5-8.5 6.5-8.5 6.7 6.6 6.7 7.68. Total Alkanity as CaCo3
200 600 360 20 92 440
9. Total Hardness as CaCo3
200 600 240 10 100 440
10. Calcium as Ca 75 200 48 2.4 24 9611. Magnesium as Mg
30 100 29 1 10 48
12. Iron as Fe 0.1 1 4 0 0 013. Manganese as Mn
0.1 0.3 NT NT NT NT
14. Free Ammonia as NH3
0.5 0.5 12 0 0.08 0
15. Nitrite as NO2 0.5 0.5 0.252 0 0 016. Nitrate as NO3 45 45 1 1 2 1117. Chloride as Cl 250 1000 232 6 32 40018. Fluoride as F 1 1.5 0.6 0.2 0.2 119. Sulphate as SO4
200 400 42 1 20 53
20. Phosphate as PO4
0.5 0.5 3.55 0 0.14 0
*Permissible limit are acceptable in the absence of alternate sources. Bureau of Indian Standards recommends that acceptable limits to be implemented.
*All Chemical parameters are expressed as milligram per Litre (mg/L)
*Red indication are the values beyond the acceptable limit
8 June 2018 Water Watch
Inference from the Zone 1 result
S.No Parameter Inference
1 Turbidity and Iron/Corporation water
Corporation water sample is chemically ‘NON-POTABLE’ since turbidity and Iron are exceeds the maximum allowable limits
2 Ammonia/ Corporation water Due to inflow of waste water in the drinking water pipeline leads corporation water with objectionable odour and indicate the ammonia pollution
3 TDS/ Ground water Sellur region having high dissolved solids. May be due to mismanaged surfaced water body and insufficient recharge.
4 Minerals/Can water Due to Reverse Osmosis Technology (RO), The drinking water is almost demineralised.
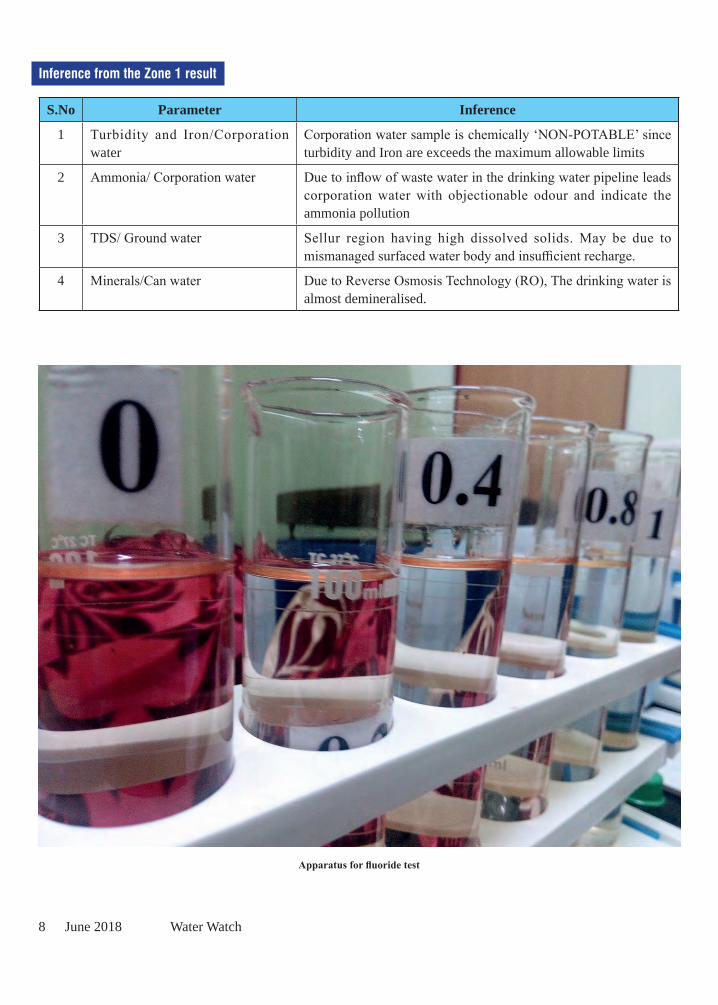
Apparatus for fluoride test
Water Watch June 2018 9
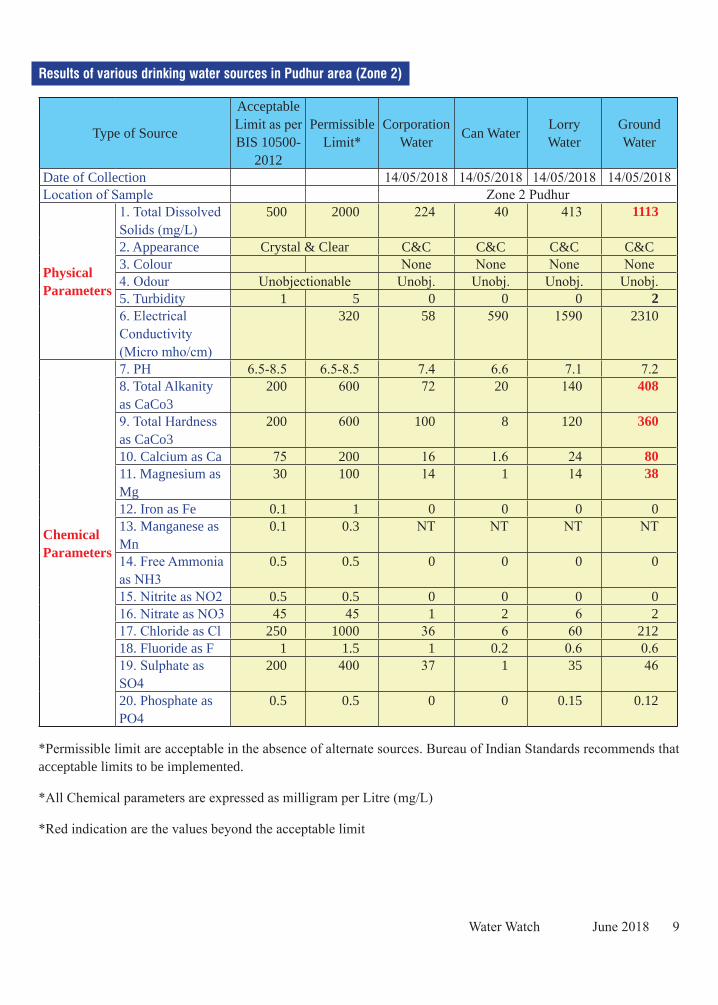
Results of various drinking water sources in Pudhur area (Zone 2)
Type of Source
Acceptable Limit as per BIS 10500-
2012
Permissible Limit*
Corporation Water Can Water Lorry
WaterGround Water
Date of Collection 14/05/2018 14/05/2018 14/05/2018 14/05/2018Location of Sample Zone 2 Pudhur
Physical Parameters
1. Total Dissolved Solids (mg/L)
500 2000 224 40 413 1113
2. Appearance Crystal & Clear C&C C&C C&C C&C3. Colour None None None None4. Odour Unobjectionable Unobj. Unobj. Unobj. Unobj.5. Turbidity 1 5 0 0 0 26. Electrical Conductivity (Micro mho/cm)
320 58 590 1590 2310
Chemical Parameters
7. PH 6.5-8.5 6.5-8.5 7.4 6.6 7.1 7.28. Total Alkanity as CaCo3
200 600 72 20 140 408
9. Total Hardness as CaCo3
200 600 100 8 120 360
10. Calcium as Ca 75 200 16 1.6 24 8011. Magnesium as Mg
30 100 14 1 14 38
12. Iron as Fe 0.1 1 0 0 0 013. Manganese as Mn
0.1 0.3 NT NT NT NT
14. Free Ammonia as NH3
0.5 0.5 0 0 0 0
15. Nitrite as NO2 0.5 0.5 0 0 0 016. Nitrate as NO3 45 45 1 2 6 217. Chloride as Cl 250 1000 36 6 60 21218. Fluoride as F 1 1.5 1 0.2 0.6 0.619. Sulphate as SO4
200 400 37 1 35 46
20. Phosphate as PO4
0.5 0.5 0 0 0.15 0.12
*Permissible limit are acceptable in the absence of alternate sources. Bureau of Indian Standards recommends that acceptable limits to be implemented.
*All Chemical parameters are expressed as milligram per Litre (mg/L)
*Red indication are the values beyond the acceptable limit
10 June 2018 Water Watch
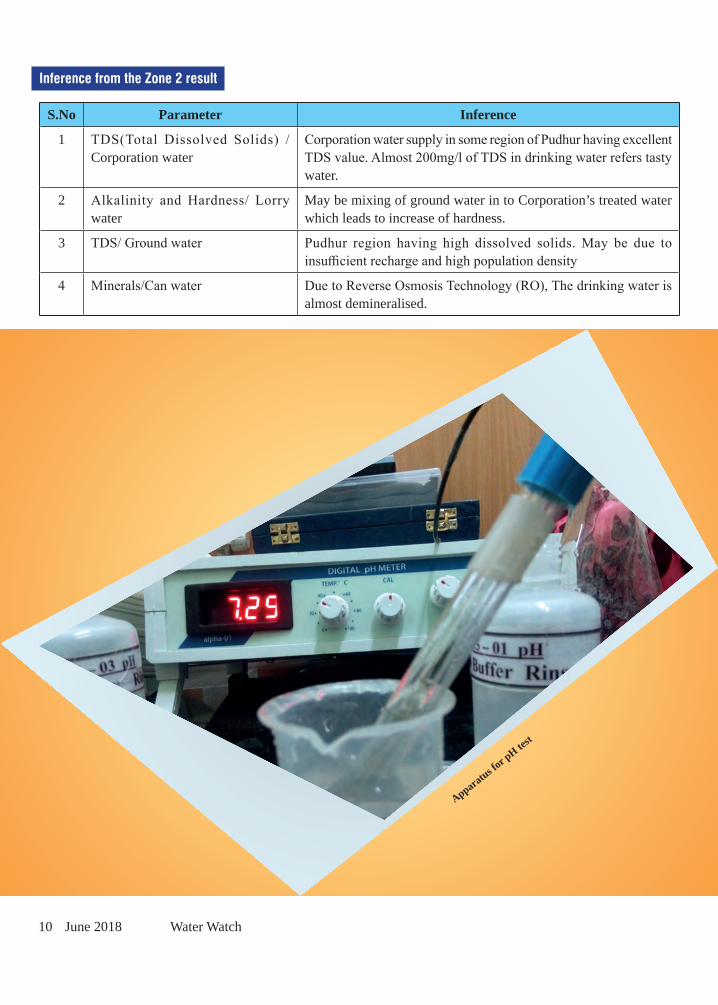
Inference from the Zone 2 result
S.No Parameter Inference
1 TDS(Total Dissolved Solids) /Corporation water
Corporation water supply in some region of Pudhur having excellent TDS value. Almost 200mg/l of TDS in drinking water refers tasty water.
2 Alkalinity and Hardness/ Lorry water
May be mixing of ground water in to Corporation’s treated water which leads to increase of hardness.
3 TDS/ Ground water Pudhur region having high dissolved solids. May be due to insufficient recharge and high population density
4 Minerals/Can water Due to Reverse Osmosis Technology (RO), The drinking water is almost demineralised.
Apparatus for p
H test
Water Watch June 2018 11
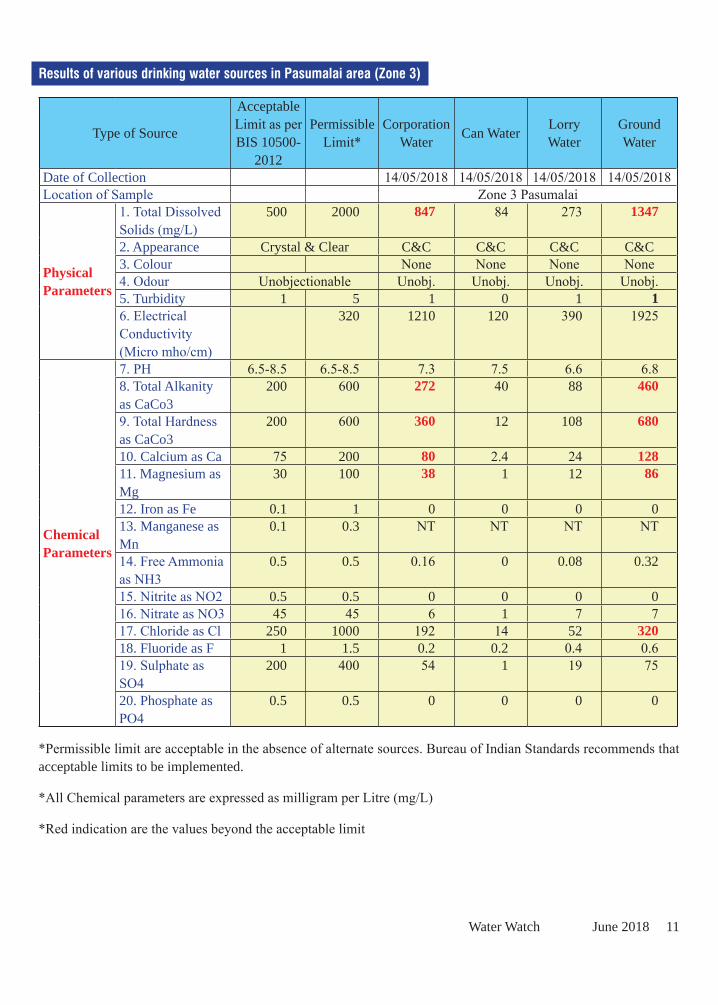
Results of various drinking water sources in Pasumalai area (Zone 3)
Type of Source
Acceptable Limit as per BIS 10500-
2012
Permissible Limit*
Corporation Water Can Water Lorry
WaterGround Water
Date of Collection 14/05/2018 14/05/2018 14/05/2018 14/05/2018Location of Sample Zone 3 Pasumalai
Physical Parameters
1. Total Dissolved Solids (mg/L)
500 2000 847 84 273 1347
2. Appearance Crystal & Clear C&C C&C C&C C&C3. Colour None None None None4. Odour Unobjectionable Unobj. Unobj. Unobj. Unobj.5. Turbidity 1 5 1 0 1 16. Electrical Conductivity (Micro mho/cm)
320 1210 120 390 1925
Chemical Parameters
7. PH 6.5-8.5 6.5-8.5 7.3 7.5 6.6 6.88. Total Alkanity as CaCo3
200 600 272 40 88 460
9. Total Hardness as CaCo3
200 600 360 12 108 680
10. Calcium as Ca 75 200 80 2.4 24 12811. Magnesium as Mg
30 100 38 1 12 86
12. Iron as Fe 0.1 1 0 0 0 013. Manganese as Mn
0.1 0.3 NT NT NT NT
14. Free Ammonia as NH3
0.5 0.5 0.16 0 0.08 0.32
15. Nitrite as NO2 0.5 0.5 0 0 0 016. Nitrate as NO3 45 45 6 1 7 717. Chloride as Cl 250 1000 192 14 52 32018. Fluoride as F 1 1.5 0.2 0.2 0.4 0.619. Sulphate as SO4
200 400 54 1 19 75
20. Phosphate as PO4
0.5 0.5 0 0 0 0
*Permissible limit are acceptable in the absence of alternate sources. Bureau of Indian Standards recommends that acceptable limits to be implemented.
*All Chemical parameters are expressed as milligram per Litre (mg/L)
*Red indication are the values beyond the acceptable limit
12 June 2018 Water Watch
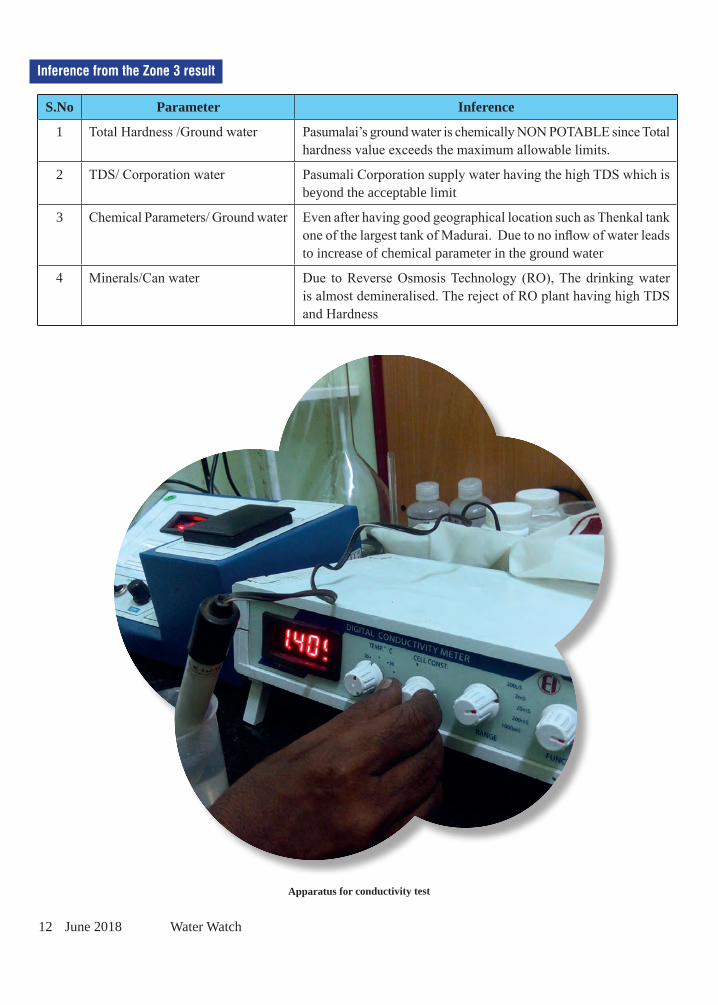
Inference from the Zone 3 result
S.No Parameter Inference
1 Total Hardness /Ground water Pasumalai’s ground water is chemically NON POTABLE since Total hardness value exceeds the maximum allowable limits.
2 TDS/ Corporation water Pasumali Corporation supply water having the high TDS which is beyond the acceptable limit
3 Chemical Parameters/ Ground water Even after having good geographical location such as Thenkal tank one of the largest tank of Madurai. Due to no inflow of water leads to increase of chemical parameter in the ground water
4 Minerals/Can water Due to Reverse Osmosis Technology (RO), The drinking water is almost demineralised. The reject of RO plant having high TDS and Hardness
Apparatus for conductivity test
Water Watch June 2018 13
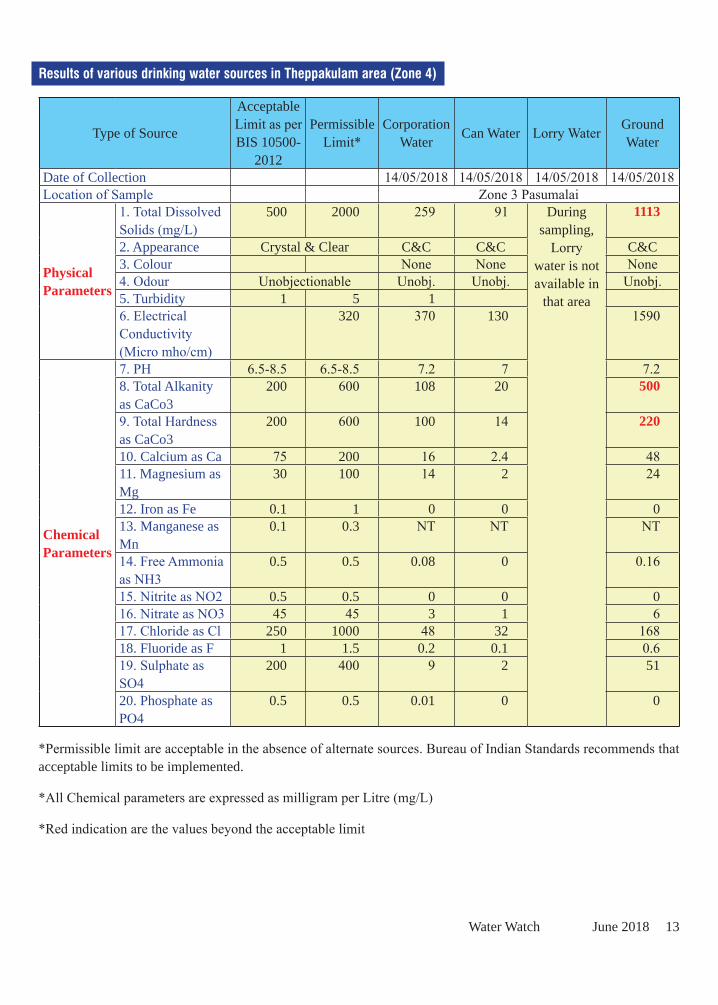
Results of various drinking water sources in Theppakulam area (Zone 4)
Type of Source
Acceptable Limit as per BIS 10500-
2012
Permissible Limit*
Corporation Water Can Water Lorry Water Ground
Water
Date of Collection 14/05/2018 14/05/2018 14/05/2018 14/05/2018Location of Sample Zone 3 Pasumalai
Physical Parameters
1. Total Dissolved Solids (mg/L)
500 2000 259 91 During sampling,
Lorry water is not available in
that area
1113
2. Appearance Crystal & Clear C&C C&C C&C3. Colour None None None4. Odour Unobjectionable Unobj. Unobj. Unobj.5. Turbidity 1 5 16. Electrical Conductivity (Micro mho/cm)
320 370 130 1590
Chemical Parameters
7. PH 6.5-8.5 6.5-8.5 7.2 7 7.28. Total Alkanity as CaCo3
200 600 108 20 500
9. Total Hardness as CaCo3
200 600 100 14 220
10. Calcium as Ca 75 200 16 2.4 4811. Magnesium as Mg
30 100 14 2 24
12. Iron as Fe 0.1 1 0 0 013. Manganese as Mn
0.1 0.3 NT NT NT
14. Free Ammonia as NH3
0.5 0.5 0.08 0 0.16
15. Nitrite as NO2 0.5 0.5 0 0 016. Nitrate as NO3 45 45 3 1 617. Chloride as Cl 250 1000 48 32 16818. Fluoride as F 1 1.5 0.2 0.1 0.619. Sulphate as SO4
200 400 9 2 51
20. Phosphate as PO4
0.5 0.5 0.01 0 0
*Permissible limit are acceptable in the absence of alternate sources. Bureau of Indian Standards recommends that acceptable limits to be implemented.
*All Chemical parameters are expressed as milligram per Litre (mg/L)
*Red indication are the values beyond the acceptable limit
14 June 2018 Water Watch
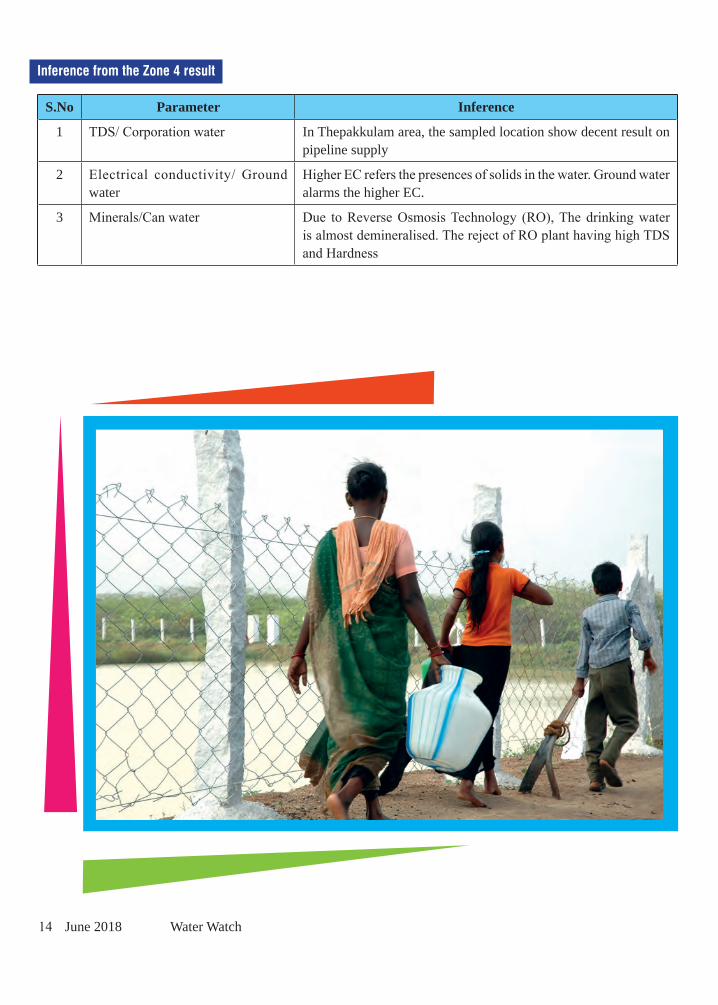
Inference from the Zone 4 result
S.No Parameter Inference
1 TDS/ Corporation water In Thepakkulam area, the sampled location show decent result on pipeline supply
2 Electrical conductivity/ Ground water
Higher EC refers the presences of solids in the water. Ground water alarms the higher EC.
3 Minerals/Can water Due to Reverse Osmosis Technology (RO), The drinking water is almost demineralised. The reject of RO plant having high TDS and Hardness
Water Watch June 2018 15
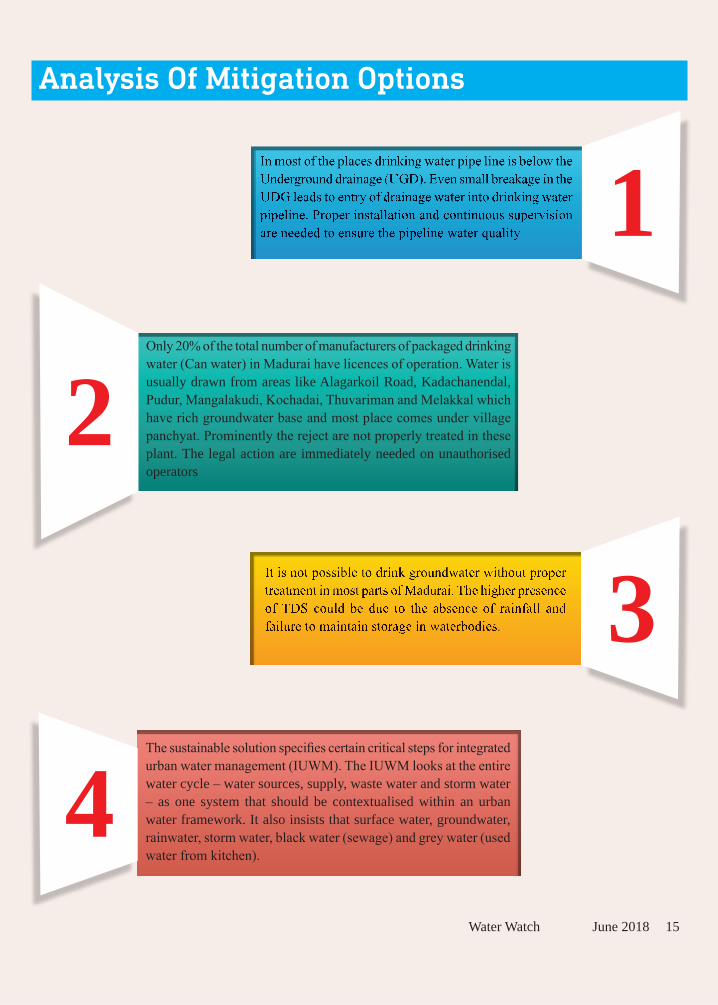
Analysis Of Mitigation Options
Only 20% of the total number of manufacturers of packaged drinking water (Can water) in Madurai have licences of operation. Water is usually drawn from areas like Alagarkoil Road, Kadachanendal, Pudur, Mangalakudi, Kochadai, Thuvariman and Melakkal which have rich groundwater base and most place comes under village panchyat. Prominently the reject are not properly treated in these plant. The legal action are immediately needed on unauthorised operators
The sustainable solution specifies certain critical steps for integrated urban water management (IUWM). The IUWM looks at the entire water cycle – water sources, supply, waste water and storm water – as one system that should be contextualised within an urban water framework. It also insists that surface water, groundwater, rainwater, storm water, black water (sewage) and grey water (used water from kitchen).
1
2
3
4
16 June 2018 Water Watch
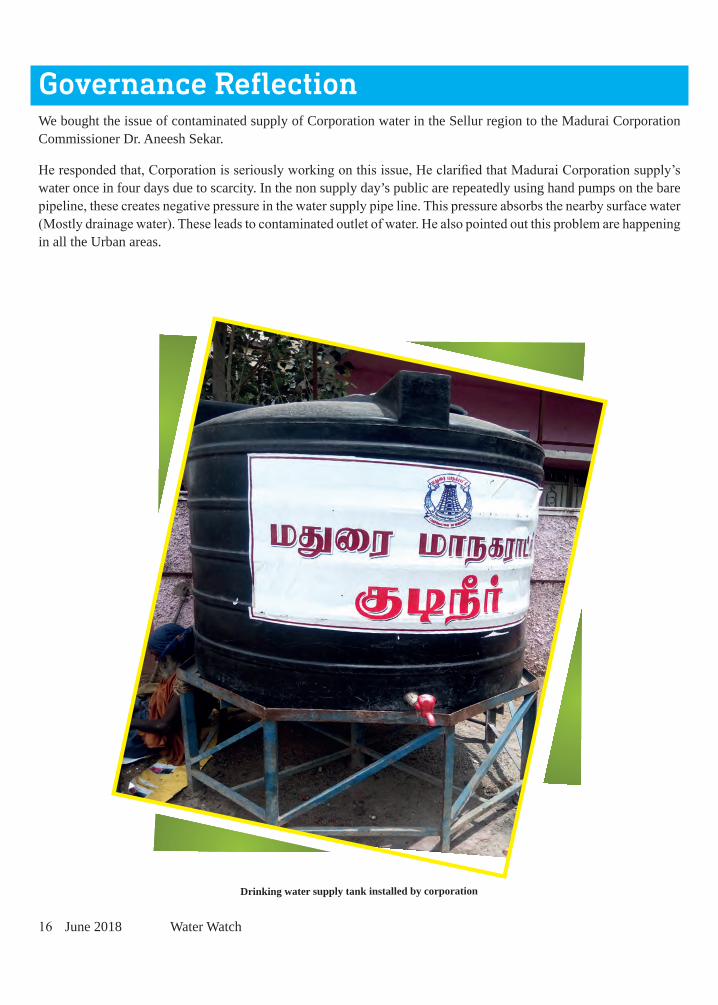
Governance ReflectionWe bought the issue of contaminated supply of Corporation water in the Sellur region to the Madurai Corporation Commissioner Dr. Aneesh Sekar.
He responded that, Corporation is seriously working on this issue, He clarified that Madurai Corporation supply’s water once in four days due to scarcity. In the non supply day’s public are repeatedly using hand pumps on the bare pipeline, these creates negative pressure in the water supply pipe line. This pressure absorbs the nearby surface water (Mostly drainage water). These leads to contaminated outlet of water. He also pointed out this problem are happening in all the Urban areas.
Drinking water supply tank installed by corporation
Centre for Urban water Resources (CURE)DHAN Vayalagam (Tank) Foundation1A, Vaidyanathapuram East, Kennet Cross RoadMadurai 625 016. Tamil Nadu, INDIATel: +91 452 2302500 Fax: 2602247Email: [email protected]
For Suggestion/Comments please write us on
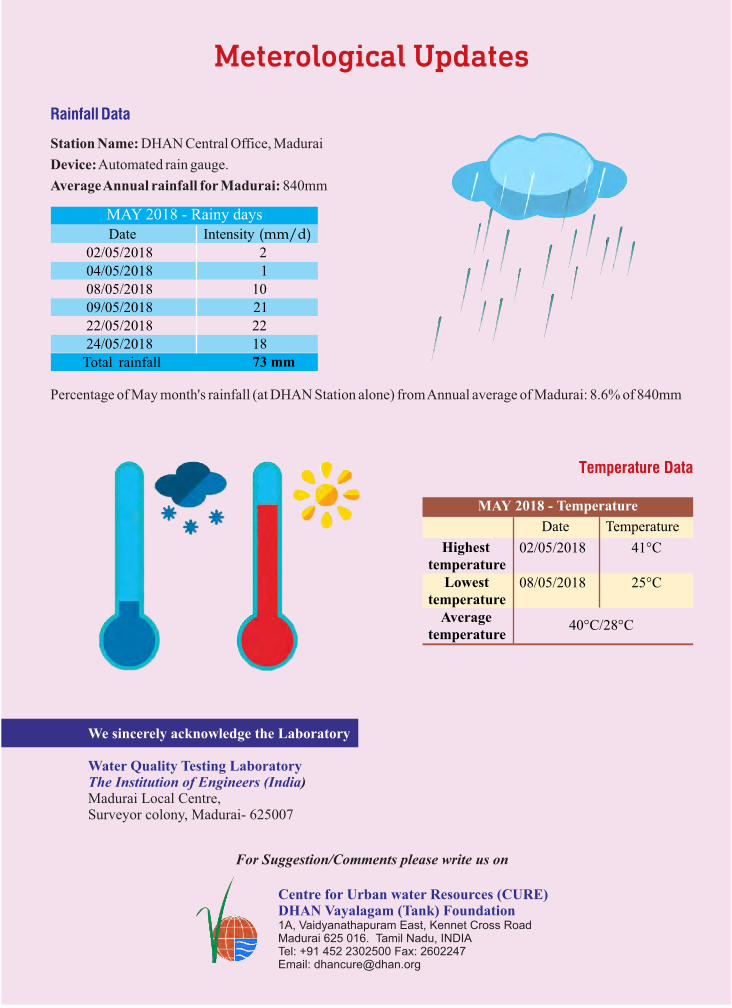
Meterological Updates
Rainfall Data
Station Name: DHAN Central Office, Madurai
Device: Automated rain gauge.
Average Annual rainfall for Madurai: 840mm
Percentage of May month's rainfall (at DHAN Station alone) from Annual average of Madurai: 8.6% of 840mm
Temperature Data
We sincerely acknowledge the Laboratory
Water Quality Testing LaboratoryThe Institution of Engineers (India)Madurai Local Centre,Surveyor colony, Madurai- 625007
MAY 2018 - Rainy days Date Intensity (mm/d)
02/05/2018 2
04/05/2018 1
08/05/2018 10 09/05/2018 21
22/05/2018 22 24/05/2018 18
Total rainfall 73 mm
MAY 2018 - Temperature
Date Temperature
Highest temperature
02/05/2018 41°C
Lowest temperature
08/05/2018 25°C
Average temperature
40°C/28°C