Embed Size (px)
Citation preview
Watershed Model Structure
Dave Montali WV DEP
Gary Shenk CBPO
WQGIT 10/7/2014
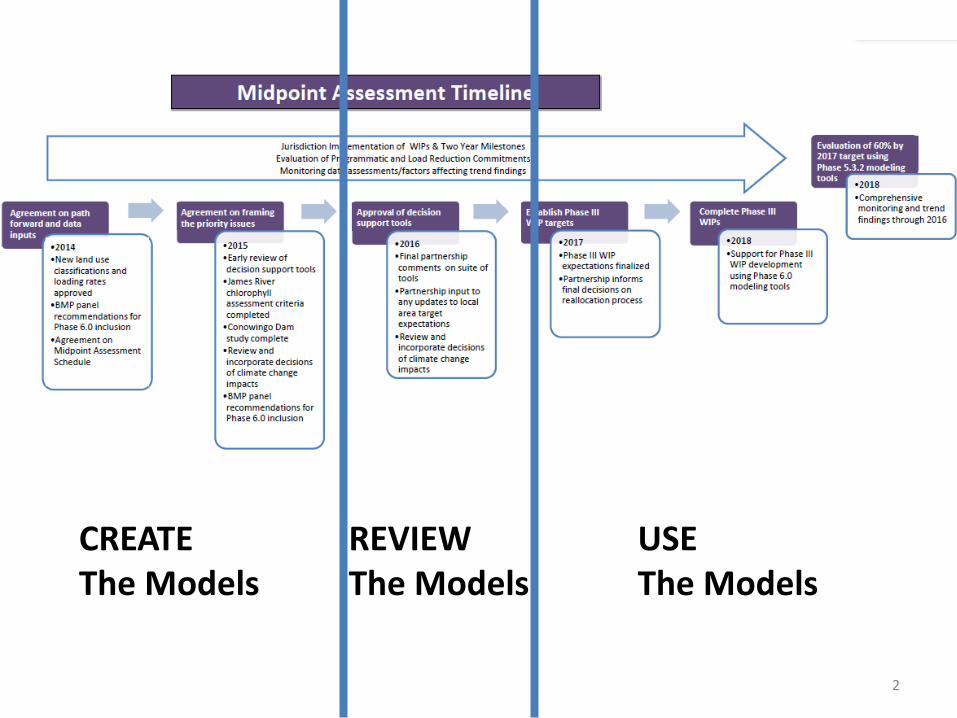
2
REVIEWThe Models
CREATEThe Models
USEThe Models

A way to think about model updates
• Model Structure – simulating the physical processes (Converting inputs to outputs -sensitivities)
• Model Inputs – The amount of manure, fertilizer, atmospheric deposition, land type, etc. (changes in inputs result in changes in outputs)
• Calibration – Making sure the outputs agree with observations (Setting land loading targets and reaching agreement with monitored river loads)
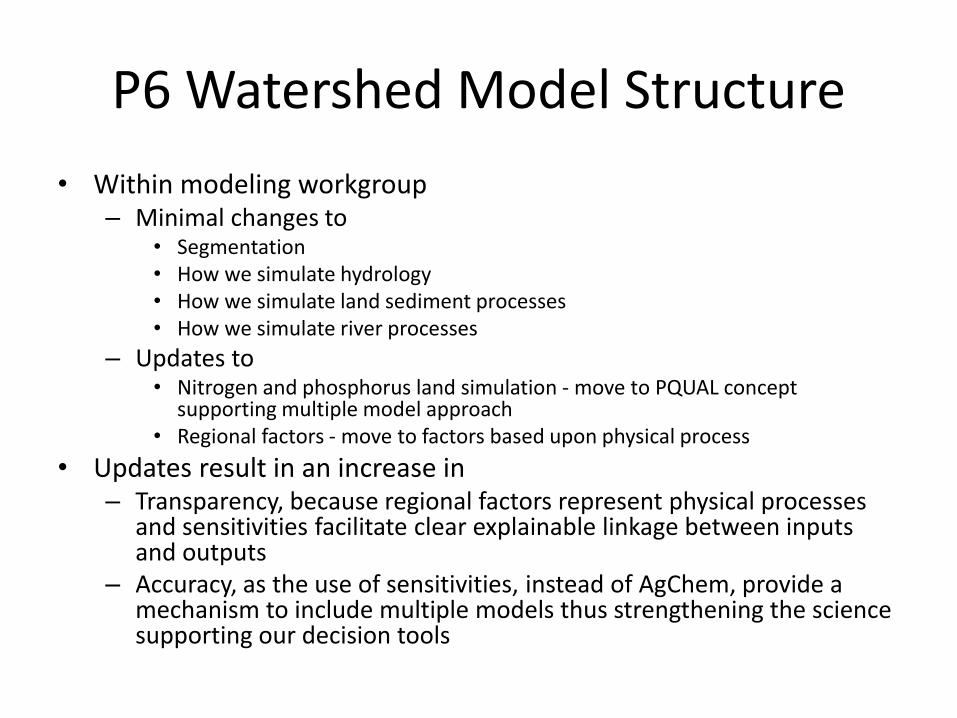
P6 Watershed Model Structure
• Within modeling workgroup– Minimal changes to
• Segmentation• How we simulate hydrology • How we simulate land sediment processes• How we simulate river processes
– Updates to • Nitrogen and phosphorus land simulation - move to PQUAL concept
supporting multiple model approach• Regional factors - move to factors based upon physical process
• Updates result in an increase in – Transparency, because regional factors represent physical processes
and sensitivities facilitate clear explainable linkage between inputs and outputs
– Accuracy, as the use of sensitivities, instead of AgChem, provide a mechanism to include multiple models thus strengthening the science supporting our decision tools

Watershed model
Precipitation/MetMod WG
Ag Census Fertilizer/ Manure
Agr WG
Atmospheric DepositionMod WG
LanduseLanduse WG
BMPsWTGW
LandHydrology
LandSediment
LandPhosphorus
Land Nitrogen
River to Estuary
Land to Stream
Stream to River
Phase 5.3.2 regional factors
Watershed Model Inputs and Structure
InputsStructure - processes
PQUAL
Point SourcesPS WG
SepticPS WG
ImpoundmentstreamsMod WG
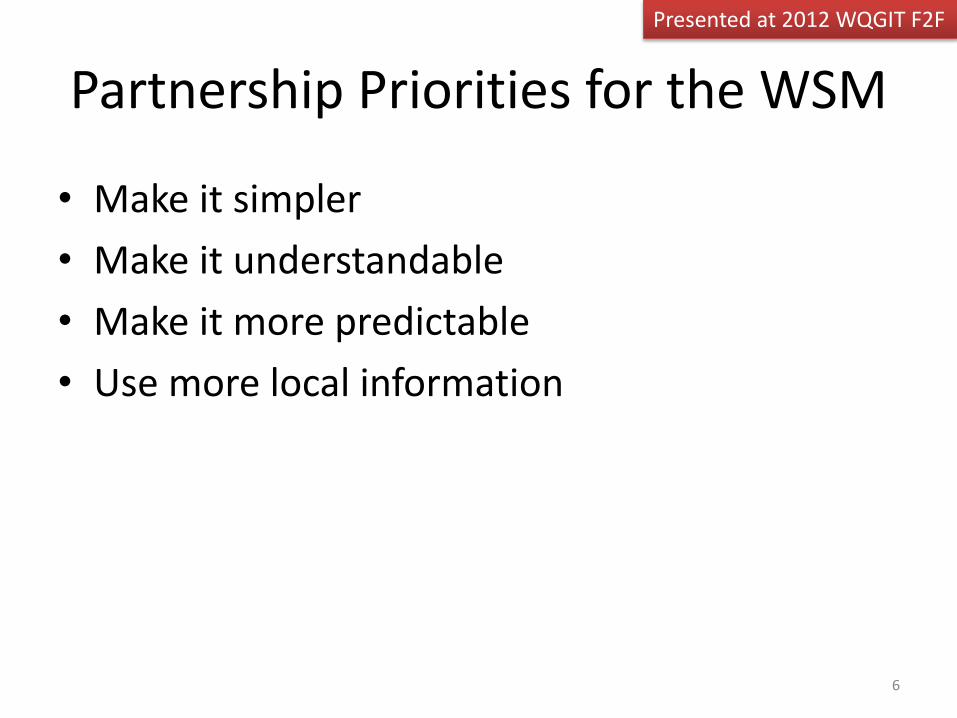
Partnership Priorities for the WSM
• Make it simpler
• Make it understandable
• Make it more predictable
• Use more local information
6
Presented at 2012 WQGIT F2F
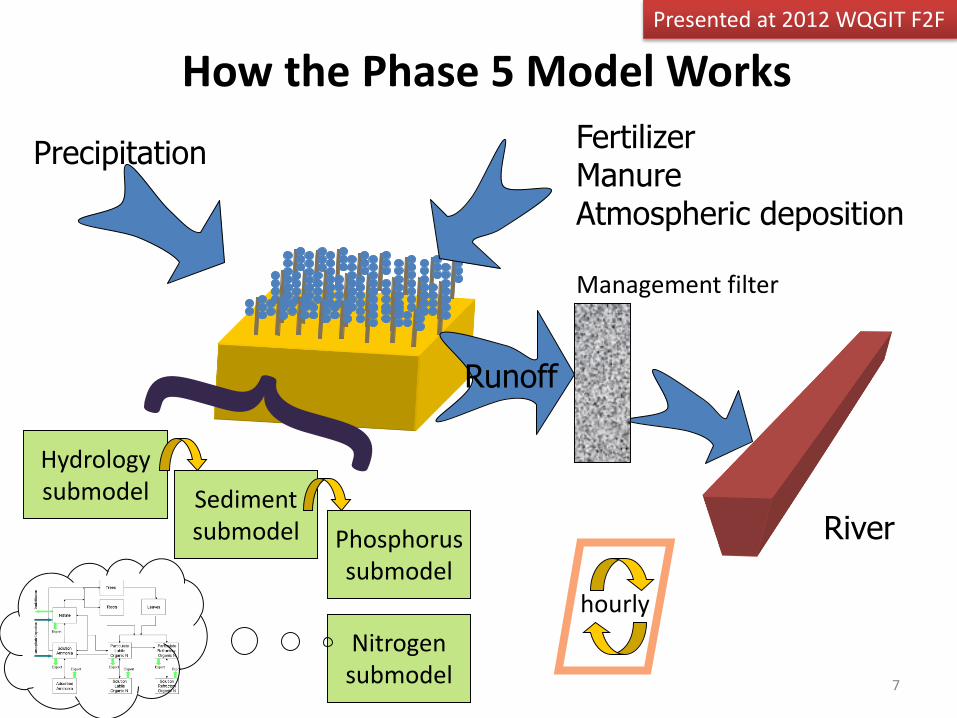
7
PrecipitationFertilizerManureAtmospheric deposition
Runoff
How the Phase 5 Model Works
Hydrologysubmodel
Management filter
RiverSedimentsubmodel Phosphorus
submodel
Nitrogensubmodel
hourly
Presented at 2012 WQGIT F2F

Possible Re-configuration
Current
• CAST
• SB
• WSM
Proposed
• CAST
• SB
• WSM
• SPARROW, PIMH, CEAP, WSM, Others
Accounting Tool
Load WQM
Discovery
MatchesPretty well
Load WQM
Discovery
Accounting Tool
Matchesprecisely
8
Presented at 2012 WQGIT F2F

9
Precipitation
FertilizerManureAtmospheric
deposition(…)
Phase 6
Hydrologysubmodel River
Sedimentsubmodel
NutrientSubmodels
TemporalNutrientmodel
BMP FilterHSPF
10
FertilizerManureAtmospheric
deposition(…)
CAST
NutrientSubmodels
BMP Filter
RiverAttenuation
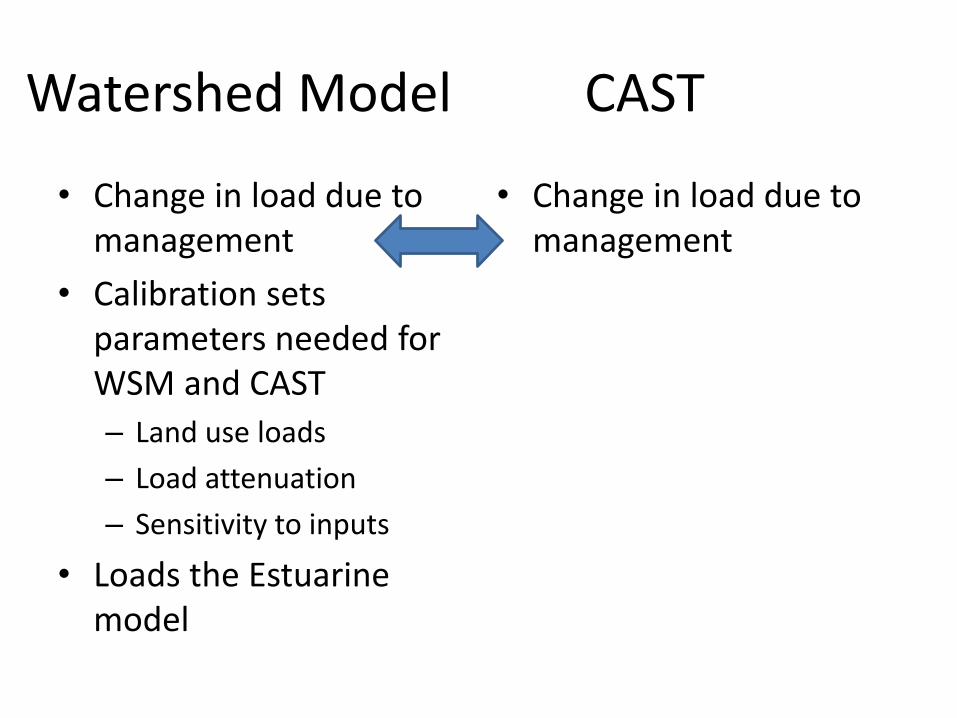
Watershed Model CAST
• Change in load due to management
• Calibration sets parameters needed for WSM and CAST
– Land use loads
– Load attenuation
– Sensitivity to inputs
• Loads the Estuarine model
• Change in load due to management

12
Precipitation
FertilizerManureAtmospheric
deposition(…)
Phase 6
Hydrologysubmodel River
Sedimentsubmodel
NutrientSubmodels
TemporalNutrientmodel
BMP Filter
NutrientSubmodels
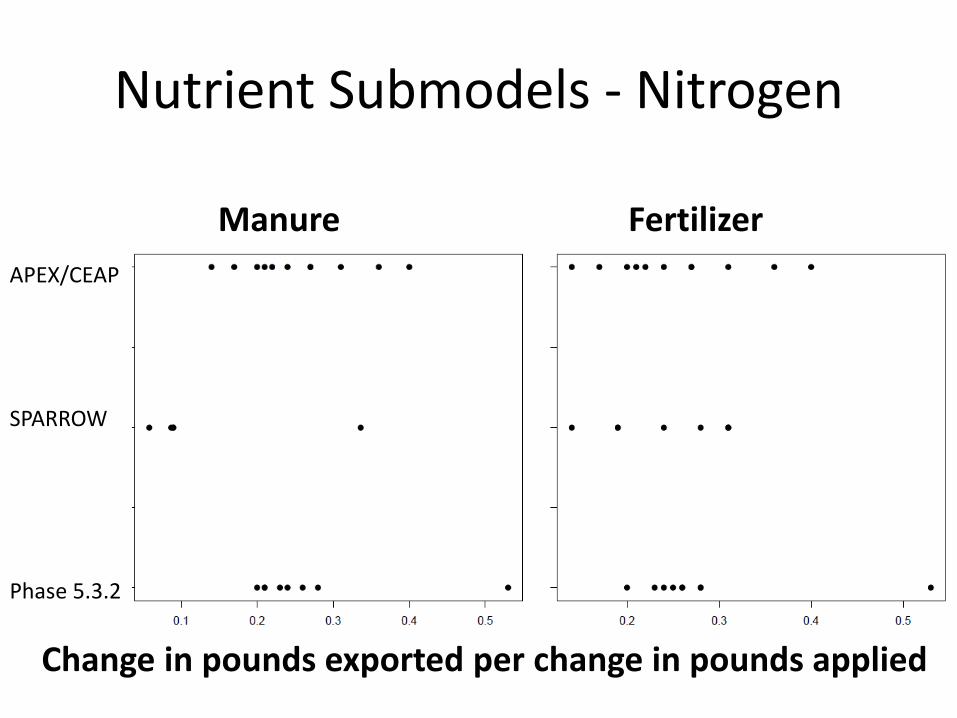
Nutrient Submodels - Nitrogen
APEX/CEAP
SPARROW
Phase 5.3.2
Manure Fertilizer
Change in pounds exported per change in pounds applied

Nutrient Submodels - Phosphorus
APLE
APEX/CEAP
SPARROW
Phase 5.3.2
Manure Fertilizer
Change in pounds exported per change in pounds applied

Nitrogen
Inputs
Field
output
BMPs
Load• Gather Soil Data
• Adjust Simulation – Investigating APLE
Phosphorus
Inputs
Soil storage
output
BMPs
Load
STAC Phosphorus Report
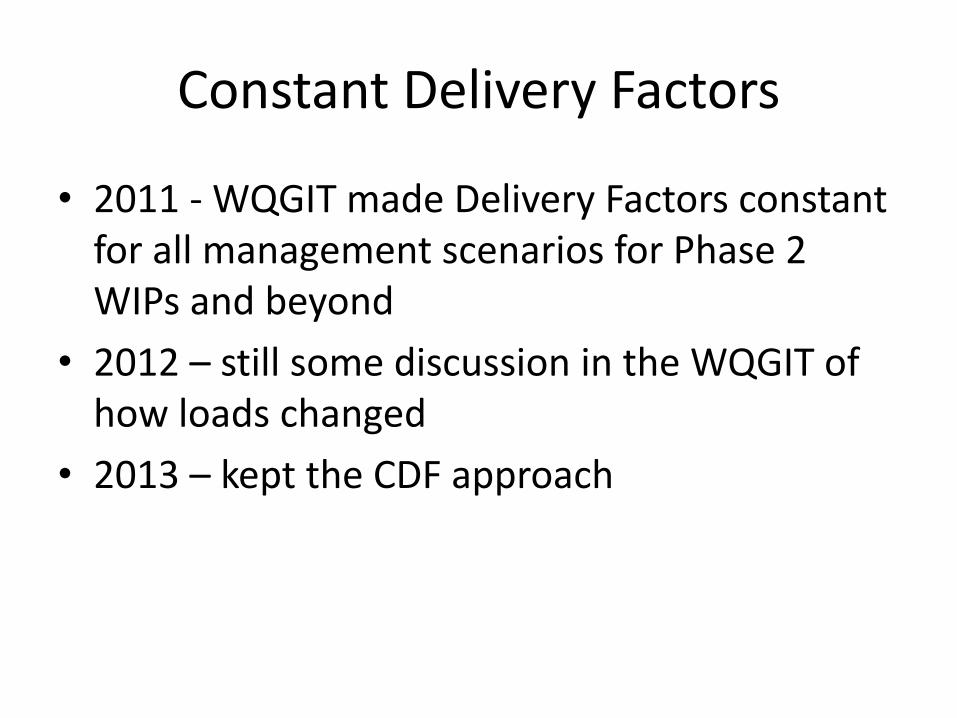
Constant Delivery Factors
• 2011 - WQGIT made Delivery Factors constant for all management scenarios for Phase 2 WIPs and beyond
• 2012 – still some discussion in the WQGIT of how loads changed
• 2013 – kept the CDF approach
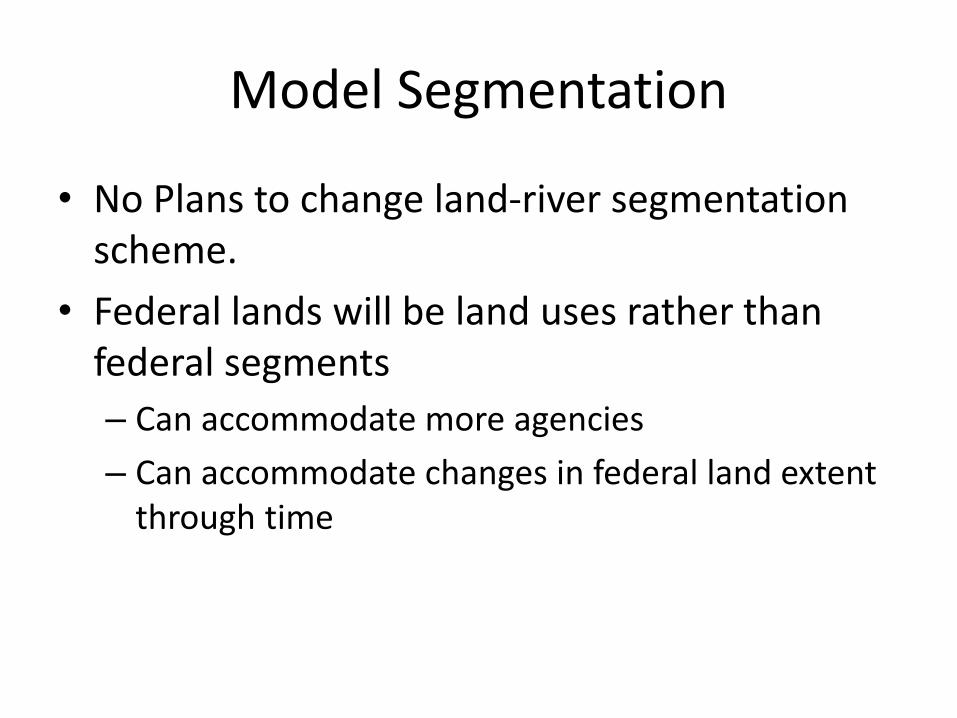
Model Segmentation
• No Plans to change land-river segmentation scheme.
• Federal lands will be land uses rather than federal segments
– Can accommodate more agencies
– Can accommodate changes in federal land extent through time

18
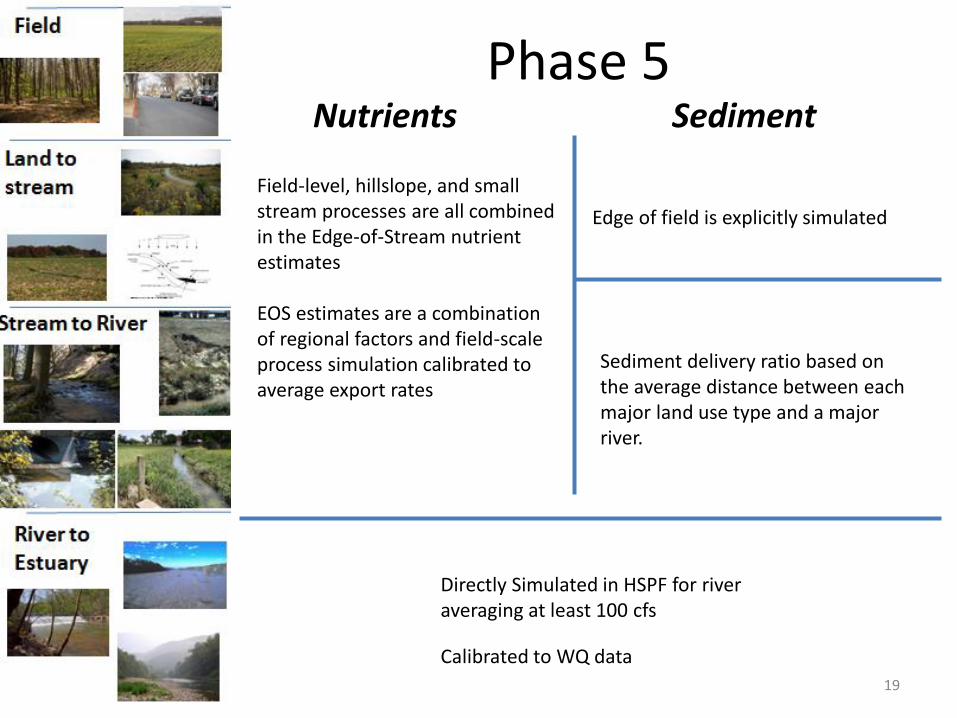
Phase 5
19
Nutrients Sediment
Edge of field is explicitly simulated
Field-level, hillslope, and small stream processes are all combined in the Edge-of-Stream nutrient estimates
EOS estimates are a combination of regional factors and field-scale process simulation calibrated to average export rates
Sediment delivery ratio based on the average distance between each major land use type and a major river.
Directly Simulated in HSPF for river averaging at least 100 cfs
Calibrated to WQ data
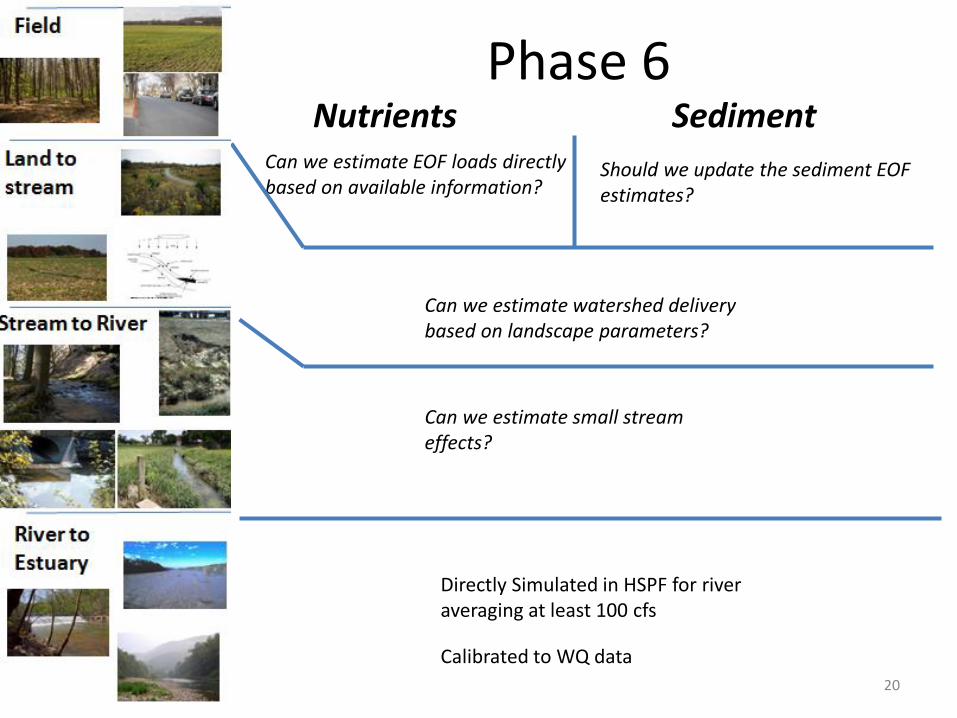
Phase 6
20
Nutrients Sediment
Directly Simulated in HSPF for river averaging at least 100 cfs
Calibrated to WQ data
Can we estimate EOF loads directly based on available information?
Should we update the sediment EOF estimates?
Can we estimate watershed delivery based on landscape parameters?
Can we estimate small stream effects?
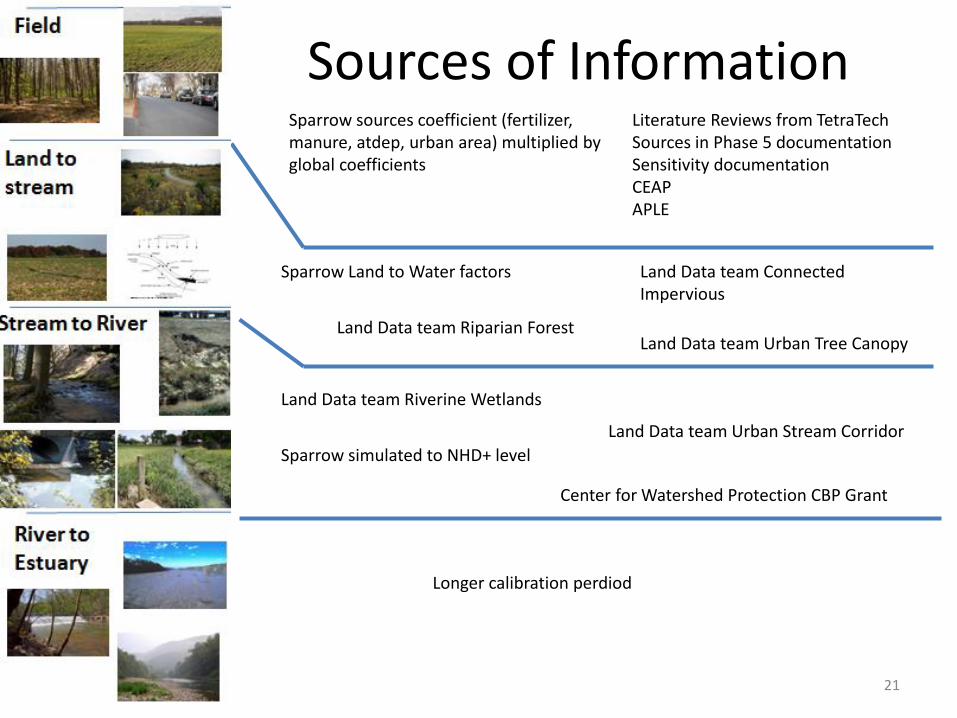
Sources of Information
21
Land Data team Urban Stream Corridor
Land Data team Riparian Forest
Land Data team Riverine Wetlands
Center for Watershed Protection CBP Grant
Longer calibration perdiod
Sparrow sources coefficient (fertilizer, manure, atdep, urban area) multiplied by global coefficients
Sparrow Land to Water factors
Sparrow simulated to NHD+ level
Literature Reviews from TetraTechSources in Phase 5 documentationSensitivity documentationCEAPAPLE
Land Data team Connected Impervious
Land Data team Urban Tree Canopy
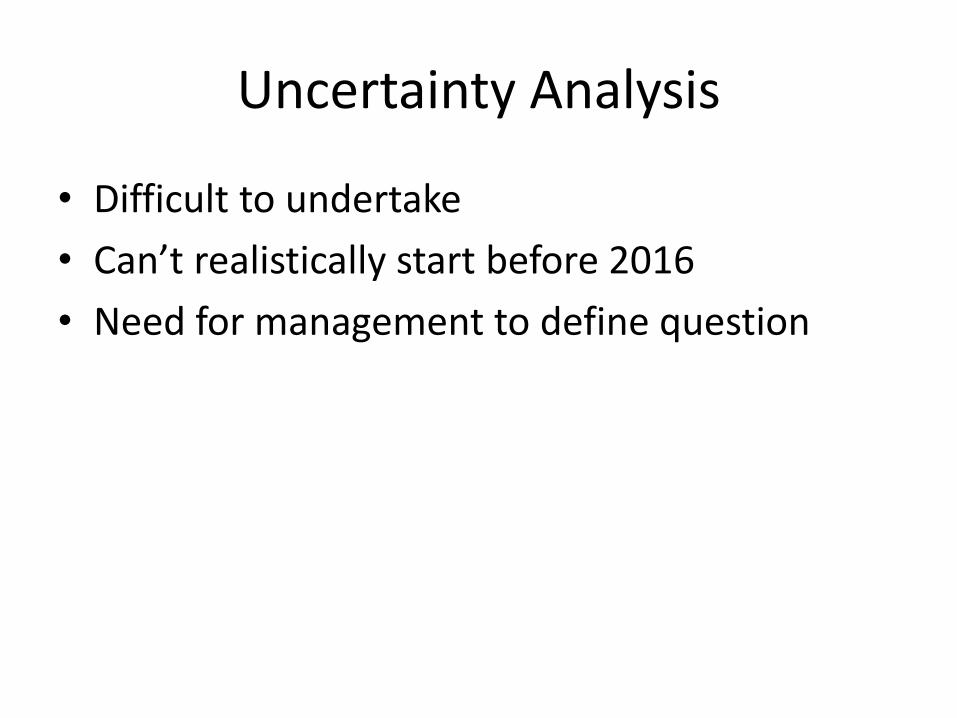
Uncertainty Analysis
• Difficult to undertake
• Can’t realistically start before 2016
• Need for management to define question
23
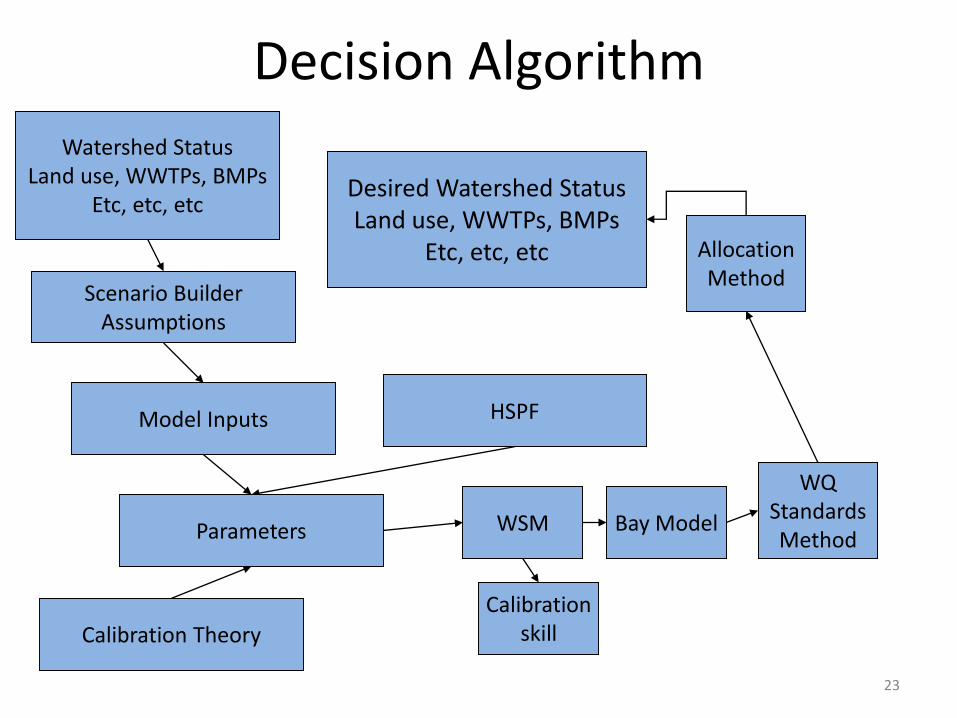
Decision Algorithm
Watershed StatusLand use, WWTPs, BMPs
Etc, etc, etc
Scenario BuilderAssumptions
HSPF
Calibration Theory
Bay Model
WQStandardsMethod
AllocationMethod
WSM
Calibrationskill
Model Inputs
Parameters
Desired Watershed StatusLand use, WWTPs, BMPs
Etc, etc, etc

24
Traditional Uncertainty Analysis
Watershed StatusLand use, WWTPs, BMPs
Etc, etc, etc
Scenario BuilderAssumptions
HSPF
Calibration Theory
Bay Model
WQStandardsMethod
AllocationMethod
WSM
Calibrationskill
Model Inputs
Parameters
Desired Watershed StatusLand use, WWTPs, BMPs
Etc, etc, etc
Calibrationskill
Parameters

25
Decision Algorithm
Watershed StatusLand use, WWTPs, BMPs
Etc, etc, etc
Scenario BuilderAssumptions
HSPF
Calibration Theory
Bay Model
WQStandardsMethod
AllocationMethod
WSM
Calibrationskill
Model Inputs
Parameters
Desired Watershed StatusLand use, WWTPs, BMPs
Etc, etc, etc

Review and Validation
• Continual Review in WQGIT Workgroups
• Continual Review in Modeling Workgroup
• STAC review in early 2016
• Year of partnership review in 2016
• Validation to follow reserved data method recommended by STAC in 2008

Documentation
• During Development
– Midpoint Assessment Model Webpage
– Workgroup Minutes
– Presentations
• Evaluation Period
– Create full documentation in 2016

28
MPA Web Site• Web site to keep the Partnership up-to-date
on model development
• Continual updates
• Your name is on the page
– You own the content.
29

30

31