Embed Size (px)
Citation preview
ABSTRACT
SMITH, KURT W. Watershed Management Networks, Watershed Plans, and Water Quality Improvement in Urbanizing Counties in North Carolina. (Under the direction of Dr. Fred Cubbage). North Carolina continues to grow at a rapid rate. The rise of negatively impacted streams, particularly
in North Carolina’s urbanizing counties, continues to expand at an aggressive pace. Much effort and
public funds are spent through a variety of agencies that attempt to deal with the problem on both an
individual and on a collaborative basis through policy networks. A study using both surveys and a
plan quality rating tool was conducted to determine the strength of these networks, the quality of the
plans they produce, and finally if those plans lead to improved water quality. Some correlations were
observed between plan quality and the strength of networks, and some areas are suggested as
improvements to the functioning of networks and planning efforts directed toward water quality
improvement.

© Copyright 2012 by Kurt W. Smith
All Rights Reserved
Watershed Management Networks, Watershed Plans, and Water Quality Improvement in Urbanizing Counties in North Carolina
by Kurt W. Smith
A dissertation submitted to the Graduate Faculty of North Carolina State University
in partial fulfillment of the requirements for the degree of
Doctor of Philosophy
Forestry and Natural Resources
Raleigh, North Carolina
2012
APPROVED BY:
_______________________________ ______________________________ Dr. Melissa McHale Dr. Greg Jennings
____________________________ ______________________________ Dr. Fred Cubbage Dr. James Swiss Committee Chair
ii
BIOGRAPHY
I am the fourth child of George and Rusty Smith, born on November 28th, 1960 in Geneva, Illinois, a
suburb of the Chicago area. From there my family moved to New Orleans, Louisiana, and on to
Norwalk, Connecticut where I attended Brien McMahon High School, graduating in 1978.
Upon graduating from high school I moved to Oregon and attended Rogue Community College while
working in the logging industry. In 1980 I received a degree in Forestry from that institution, and
moved to Corvallis Oregon to pursue a bachelor’s degree and play football at Oregon State
University. Upon graduating from that institution I worked in forestry briefly and moved to North
Carolina to work for the Forestry Service there. I also began work on a Master of Public
Administration Degree from North Carolina State University at about the same time.
Shortly after graduating from the program in 1988, I married Laura Lynn Pate and moved to
Philadelphia, Pennsylvania and worked as a District Manager in the Fairmount Park System for the
Philadelphia Ranger Corps. Around 1992 Laura and I moved back to North Carolina where I worked
briefly for the City of Fayetteville as a naturalist for the park system. Laura began to practice as an
eye doctor in rural Lillington, North Carolina, where we still make our home today. I eventually moved
on to work with Wake County where I have worked as a park manger, oversaw the open space
acquisition program, worked as the Director of the Wake County Soil and Water Conservation
Service, helped set up the county stream monitoring program, and where I currently work as a
planner in watershed management.

iii
ACKNOWLEDGMENTS
I would certainly like to acknowledge the love, help and support of my family, if not for them, I would
not have been able to press on and complete this degree. There humor, forbearance, and
unwavering confidence that I could accomplish this task, as well as the knowledge that all these
things would still be present should I fail, have kept me going for these many years.
I’m also grateful to the North Carolina State University system that works so well at moving people
like me along at a pace that is set by my interest and resolve, which made my journey into the
doctoral program possible.
I’m enormously grateful to Dr. Fred Cubbage who has guided me very patiently through this process.
I am confident that Fred’s wise help, steadfast encouragement, and kind and helpful demeanor
helped lead to my success. Both Fred and Dr. James Swiss from my committee, and teacher in my
master’s program, demonstrate and embody to me all that is good and excellent within academia. I’d
also like to thank Dr. McHale, and Dr.Jennings for their willingness to invest time with me in serving
on my committee.
iv
TABLE OF CONTENTS
LIST OF TABLES ..................................................................................................................... vii LIST OF FIGURES ................................................................................................................ viii Chapter 1 Introduction ......................................................................................................... 1
1.1 North Carolina and Watershed Management .............................................. 1
1.2 History of the Clean Water Act ..................................................................... 2
1.3 National Pollutant Discharge Elimination System (NPDES) (CWA) ............ 5
1.4 Types of Permits ........................................................................................... 7
1.5 Overview of Permitting Process .................................................................. 9
1.6 Roles and Responsibilities of State and Federal Authorities .................... 12
1.7 Section 303 (d) of the Clean Water Act ..................................................... 14
1.8 Sedimentation and Erosion Control Laws (CWA) (Soil Conservation Act)
(North Carolina Sedimentation Pollution Contral Act of 1973) ................... 16
Chapter 2 Objectives, Hypothesis and Methods ............................................................ 19
2.1 Introduction to Objectives .............................................................................. 19
2.2 General Objectives ........................................................................................ 22
2.3 Hypothesis ..................................................................................................... 24
2.4 Model .......................................................................................................... 25
2.5 Overview of Methods ..................................................................................... 26
2.6 Case Study Counties ..................................................................................... 27
2.7 Survey .......................................................................................................... 28
2.8 Survey Instrument ......................................................................................... 29
2.9 Plan Rating .................................................................................................... 32
2.10 Measurement and Plan Quality Rating Tool ................................................. 32
2.11 303d Listing .................................................................................................... 37
2.12 Data Analysis ................................................................................................. 38
Chapter 3 Literature Review ........................................................................................... 39
3.1 Networks and Policy Formation ..................................................................... 39
3.1.1 Network Definitions ........................................................................... 39
3.1.2 Public Networks ................................................................................ 41
3.1.3 Organizational Networks .................................................................. 43
3.1.4 Watershed Planning Networks ......................................................... 44
3.1.5 Network Theory Utility for Local Governments ................................. 44
3.1.6 Wake County Watershed Network Examples .................................. 45
3.1.7 Analytical Implications ...................................................................... 47
3.2 Planning Literature ............................................................................................ 49
3.2.1 Sustainable Development ................................................................ 50
3.2.2 Watershed Planning ......................................................................... 53
v
3.3 Water Quality Literature ...................................................................................... 54
Chapter 4 Results .......................................................................................................... 58
4.1 County Network Structure Overview ............................................................. 60
4.2 Major Agencies and Missions of the Watershed Networks ........................... 62
4.3 Survey of Network Strength .......................................................................... 75
4.4 Plan Quality Data ........................................................................................... 84
4.5 Water Quality Data ........................................................................................ 90
4.6 Correlation Data ............................................................................................ 93
4.7 Summary of Results ...................................................................................... 96
Chapter 5 Conclusions ................................................................................................. 102
5.1 Hypothesis ................................................................................................... 102
5.2 Additional Lessons and Areas of Inquiry ..................................................... 103
5.3 Integrated Conclusions ................................................................................ 107
5.3.1 Networks and Plans ........................................................................ 107
5.3.2 Planning Improvements .................................................................. 109
5.3.3 Management Implications .............................................................. 110
5.4 Additional Areas of Research ...................................................................... 112
Works Cited ........................................................................................................................... 114
Appendix ............................................................................................................................... 119
vi
LIST OF TABLES
Table 1 Plan Rating Characteristics and Measures ................................................................ 34
Table 2 General Comparisons/Rankings of Counties ............................................................. 58
Table 3 County Statistics ......................................................................................................... 60
Table 4 Survey Response Rates ............................................................................................. 75
Table 5 Wake County Survey Ratings-Network ...................................................................... 76
Table 6 Mecklenburg County Survey Ratings-Network ........................................................... 77
Table 7 Forsyth County Survey Ratings-Network ................................................................... 78
Table 8 Guilford County Survey Ratings-Network ................................................................... 79
Table 9 Multi-Jurisdictional Survey Ratings-Network .............................................................. 80
Table 10 All Respondents Survey Ratings-Network .................................................... 81
Table 11 Types of Network Collaboration .................................................................... 82
Table 12 Wake County Plan Ratings ............................................................................ 84
Table 13 Mecklenburg County Plan Ratings ................................................................ 85
Table 14 Forsyth County Plan Ratings ......................................................................... 86
Table 15 Guilford County Plan Ratings ........................................................................ 86
Table 16 County Plan Ratings-All Plan Types ............................................................. 88
Table 17 All County Plan Grades ................................................................................. 89
Table 18 County Survey-Planning Perception ............................................................. 90
Table 19 County Survey-Water Quality Perception ...................................................... 91
Table 20 County 303d Listing/Population 2006-2010 ................................................. 92
Table 21 All Respondents Survey Correlations ............................................................ 94
Table 22 Survey Correlations: Networks, Plans, Water Quality ................................... 95
vii
LIST OF FIGURES
Figure 1 Water Quality Based Approach-Clean Water Act.......................................... 15
Figure 2 Wake County Watershed Interactions ........................................................... 23
Figure 3 Hypotheses Model ......................................................................................... 25
Figure 4 Research Model ............................................................................................ 59
Figure 5 Wake County Watershed Management Network .......................................... 71
Figure 6 Mecklenburg County Watershed Management Network ............................... 72
Figure 7 Forsyth County Watershed Management Network ....................................... 73
Figure 8 Guilford County Watershed Management Network ....................................... 74
1
Chapter 1 Introduction
1.1 North Carolina and Watershed Management
Watershed management is not a new idea, it was first proposed in the United States by John Powell
in the 1880s, as he envisioned organizing and governing according to watershed boundaries rather
than political boundaries in the expanding west (McGinnis, Wooley, Gamman 1999). In the modern
era of watershed management however it is a sometimes odd mix of both watershed boundaries and
political realties in which most management decisions must be made. Within North Carolina the
agencies/stakeholder groups most commonly involved are the Environmental Protection Agency, The
North Carolina Division of Water Quality, the Department of Environment and Natural Resources, the
Soil and Water Conservation Service, NC Cooperative Extension, NC State University, local
governments of every size utilizing sediment and erosion control and stormwater management
programs, the NC Ecosystem Enhancement Program, State and Federal Fish and Wildlife Services,
land trusts, regional councils of governments, and clean water advocacy groups, industry, and the
development community. This list is not inclusive with every county adding and subtracting to this
core group that constitutes a watershed management network, working on water resources in North
Carolina counties.
Understanding this network, how it operates in its strengths, weaknesses, and its effectiveness at
protecting and improving water quality are in a broad sense the purpose of this study. Moving beyond
an understanding of the composition of the network, is a necessity to understand the quality, purpose
and outcomes of the plans these networks produce. Plans produced collaboratively in the watershed
are the clearest signal of intention and agreement within the network. How well these intentions
articulated in plans are carried out should tell us something about the effectiveness of the networks,
and ultimately says something about what is being accomplished to protect and improve water quality
in North Carolina’s urbanizing areas. To better understand objectively about the networks and their
plans in urbanizing North Carolina, a number of available measures have been employed. The study
will make use of web based research, a plan quality measurement tool, and original survey data to
determine if strong networks produce strong plans, which in turn lead to improved water quality.
Water quality will be measured by proxy in the survey instrument, as well as the EPA’s list of 303d
listed waters. These are waters that are not living up to their intended purpose and ultimately will
require attention to correct. The data will show correlations, efficiencies, deficiencies and suggests
improvements, as well as areas of further inquiry. The overall aim of the study will be to advance the
2
knowledge of watershed management as it pertains to counties in North Carolina and also to suggest
ways to assess the efficiency and effectiveness for practitioners within the network.
Unlike some resources watersheds are more difficult for the public at large to grasp. Unless there is a
significant problem with drinking water, sewer capacity, or a major impediment to recreational
interests, watershed management often escapes public scrutiny in a way other governmental services
do not, like public safety, and transportation. While many non-profits and other interests conduct
laudable efforts at protecting valuable ecosystem services like watersheds, it is the legal architecture
provided through the Clean Water Act and other legislation that provides the platform for much of the
modern effort, which drives involvement by a wide array of interest groups, in protecting our
watersheds. Legislative mandates provide the drivers that operate in the four urbanizing counties in
this study. These mandates create the reason for the networks, and it produces the need and
resources for planning, as well as funding for remedies expressed in the plan aimed at provide uplift
in the watersheds and ultimately improvement in water quality.
Legislation is the biggest driver that today’s watershed management programs rely upon for goals,
mission, and funding. Key legislation has brought about through implementation tangible
improvements in the waters of the United States. Twenty-five years ago, only a third of the nation's
waters were safe for fishing and swimming. Wetland losses were estimated at 460,000 acres
annually. Agricultural run-off, resulted in the erosion of 2.25 billion tons of soil and the deposit of large
amounts of phosphorus and nitrogen into many waters. Sewage treatment plants served only 85
million people (ncdenr.org/web/ps/mtu/tmdl). In contrast, as a result of significant efforts over the last
25 years, the quality of rivers, lakes and bays has improved dramatically due to cooperative efforts by
federal, state, tribal and local governments and communities to implement the public health and
pollution control programs. Today, two-thirds of the nation's surveyed waters are safe for fishing and
swimming. Wetland losses are estimated at 70,000 to 90,000 acres annually. The amount of soil lost
due to agricultural runoff has been reduced by one billion tons annually, and phosphorus and nitrogen
levels in water sources have decreased. The number of people served by modern wastewater
treatment facilities has more than doubled to 173 million people (ncdenr.org/web/ps/mtu/tmdl).
1.2 History of the Clean Water Act Present government water pollution programs were initiated by the 1948 Water Pollution
Control Act, which focused on protection of human health, not the environment. The Act
3
allotted funds to state and local governments for water pollution control, placing emphasis on the
States' role in controlling and protecting water resources, with few, if any, federal goals, objectives,
limits, or guidelines (epa.gov/lawsregs/lawsguidance/cwa/tmdl/intro.cfm).
Congress became increasingly interested in water quality degradation from 1956 through 1966, and
passed four laws to strengthen the federal role in water pollution control, including the Water Pollution
Control Act Amendments of 1956, and the Federal Water Pollution Control Act Amendments of 1961.
These initiatives focused on giving additional funding to municipalities for constructing wastewater
treatment works (epa.gov/lawsregs/lawsguidance/cwa/tmdl/intro.cfm).
The Water Quality Act of 1965 represented a major regulatory advancement in water pollution control
by requiring States to develop water quality standards for interstate waters by 1967. The
Water Quality Act also called for States to develop waste load allocations to quantify pollutant
loadings that could be discharged without exceeding the water quality standards. Despite increasing
public concern and increased public spending, only about half of the States developed water quality
standards by 1971. Enforcement of the federal legislation was with the Office of Wastewater
Management. Enforcement was minimal because the regulatory agencies had to prove that pollutant
loadings had an impact on human health or violated water quality standards in order to take action.
Additionally, there were no criminal or civil penalties to enforce the regulation
(epa.gov/lawsregs/lawsguidance/cwa/tmdl/intro.cfm).
The lack of success in developing adequate water quality standards programs, along with growing
concern about the environment, prompted the President to form the United States
Environmental Protection Agency (EPA) in 1970 to enforce environmental compliance and
consolidate federal pollution control activities. The Refuse Act Permit Program (RAPP) was
developed, under the 1899 Rivers and Harbors Act, as a new permitting program to control water
pollution. RAPP required any facility discharging wastes into public waterways to obtain a federal
permit specifying abatement requirements from the Army Corps of Engineers. The
Administrator of the EPA endorsed the joint program with the Corps of Engineers, and on
December 23, 1970, the permit program was mandated through Presidential Order. EPA and the
Corps rapidly began to prepare the administrative and technical requirements for the permit program,
but the effluent limits were more or less arbitrarily determined
(epa.gov/lawsregs/lawsguidance/cwa/tmdl/intro.cfm).
In December 1971, RAPP was struck down by a decision of the Federal District Court in Ohio (Kalur
vs. Resor). Although RAPP was struck down, the concept of a permit program survived. In November
4
1972, Congress passed a comprehensive re-codification and revision of federal water pollution
control law, known as the Federal Water Pollution Control Act (known today as the Clean Water Act
or CWA) Amendments of 1972, marking a distinct change in the philosophy of water pollution control
in the United States. The Amendments maintained the requirements for water quality-based controls,
but added an equal emphasis on technology-based, or end-of-pipe, control strategies. The FWPCA
Amendments (Clean Water Act 1972) set ambitious goals in its Section 101(a), including:
"it is the national goal that the discharge of pollutants into navigable waters be eliminated
by 1985";
"it is the national goal that wherever attainable an interim goal of water quality which
provides for the protection and propagation of fish, shellfish, and wildlife and provides for
recreation in and on the water be achieved by July 1, 1983"; and
"it is the national policy that the discharge of toxic pollutants in toxic amounts be
prohibited".
The FWPCA Amendments (Clean Water Act) contained four other important principles:
1. The discharge of pollutants to navigable waters is not a right.
2. A discharge permit is required to use public resources for waste disposal and limits the
amount of pollutants that may be discharged.
3. Wastewater must be treated with the best treatment technology economically achievable,
regardless of the condition of the receiving water.
4. Effluent limits must be based on treatment technology performance, but more stringent
limits may be imposed if the technology-based limits do not prevent violations of water
quality standards in the receiving water . (epa.gov/lawsregs/lawsguidance/cwa/tmdl/intro.cfm)
The FWPCA instituted mandatory requirements for water quality, enforceable with civil and criminal
penalties. It established a mandate to control point and non-point sources, protect wetlands, and
require permits and planning for point source discharge through the National Pollution and Discharge
Elimination System.
5
1.3 National Pollutant Discharge Elimination System (NPDES) (CWA) The National Pollutant Discharge Elimination System (NPDES) program was established under the
authority of the 1972 Clean Water Act. This stormwater management program placed requirements
on communities to manage their stormwater through a permitting process designed to protect waters
from the impacts of development. The federal government delegated its authority to manage and
enforce the NPDES to states submitting qualifying plans. The NC Division of Water Quality performs
this function in North Carolina (ncdenr.org/web/ps/mtu/tmdl).
SCOPE OF THE NPDES PROGRAM
Under the NPDES Program, all facilities that discharge pollutants from any point source into
waters of the United States are required to obtain an NPDES permit. Understanding how each of the
key terms ("pollutant," "point source," and "waters of the United States") have been defined and
interpreted by the regulations is the key to defining the scope of the NPDES Program
(epa.gov/lawsregs/lawsguidance/cwa/tmdl/intro.cfm).
Pollutant
The term pollutant is defined very broadly by the NPDES regulations and litigation and includes
any type of industrial, municipal, and agricultural waste discharged into water. For regulatory
purposes, pollutants have been grouped into three general categories under the NPDES Program:
conventional, toxic, and non-conventional. There are five conventional pollutants (mentioned above
and defined in Section 304(a)(4) of the CWA). Toxic pollutants, or priority pollutants, are those
defined in Section 307(a)(1) of the CWA and include metals and manmade organic compounds. Non-
conventional pollutants are those which do not fall under either of the above categories, and include
such parameters as ammonia, nitrogen, phosphorus, chemical oxygen demand (COD), and whole
effluent toxicity (WET) (epa.gov/lawsregs/lawsguidance/cwa/tmdl/intro.cfm).
Point Source
Pollutants can enter waters of the United States from a variety of pathways including
agricultural, domestic, and industrial sources. For regulatory purposes these sources are generally
categorized as either point sources or non-point sources. Typical point source discharges include
discharges from publicly owned treatment works (POTWs), discharges from industrial facilities, and
discharges associated with urban runoff. While provisions of the NPDES Program do address certain
specific types of agricultural activities (i.e., concentrated animal feeding operations), the majority of
agricultural facilities are defined as non-point sources and are exempt from NPDES regulation.
6
Pollutant contributions to waters of the United States may come from both direct and indirect sources.
Direct sources discharge wastewater directly into the receiving water body, whereas indirect sources
discharge wastewater to a POTW, which in turn discharges into the receiving water body. Under the
national program, NPDES permits are issued only to direct point source discharges. Industrial and
commercial indirect dischargers are addressed by the National Pretreatment Program and also need
NPDES permits. As indicated above, the primary focus of the NPDES permitting program is municipal
and non-municipal (industrial) direct dischargers. Within these major categories of dischargers,
however, there are a number of more specific types of discharges that are regulated under the
NPDES Program (epa.gov/lawsregs/lawsguidance/cwa/tmdl/intro.cfm).
Municipal Sources
Municipal sources are POTWs that receive primarily domestic sewage from residential and
commercial customers. Larger POTWs will also typically receive and treat wastewater from
industrial facilities (indirect dischargers) connected to the POTW sewerage system. The types of
pollutants treated by a POTW will always include conventional pollutants, and may include
non-conventional pollutants and toxic pollutants depending on the unique characteristics of the
commercial and industrial sources discharging to the POTW.The treatment provided by POTWs
typically includes physical separation and settling (e.g.,screening, grit removal, primary settling),
biological treatment (e.g., trickling filters, activated sludge), and disinfection (e.g., chlorination, UV,
ozone). These processes produce the treated effluent (wastewater) and a biosolids (sludge) residual,
which is managed under the Municipal Sewage Sludge Program. Some older POTWs have an
additional concern of combined sewer overflow (CSO) systems that can release untreated effluent
during storm events. CSOs were an economic way for municipalities to collect both sanitary sewage
and storm water and are controlled under the NPDES program. A number of municipalities have
municipal sewer systems (MS4s) that are also subject to NPDES requirements. Specific NPDES
program areas applicable to municipal sources are:
National Pretreatment Program,
Municipal Sewage Sludge Program,
Combined Sewer Overflows (CSOs), and
Office of Wastewater Management - Water Permitting
Municipal Storm Water Program.
(epa.gov/lawsregs/lawsguidance/cwa/tmdl/intro.cfm)
7
Non-municipal Sources
Non-municipal sources, which include industrial and commercial facilities are unique, with
respect to the products and processes present at a waste treatment facility. Unlike municipal sources,
at industrial facilities the types of raw materials, production processes, treatment technologies
utilized, and pollutants discharged vary widely and are dependent on the type of industry and specific
facility characteristics. The operations at industrial facilities are generally carried out within a clearly
defined plant area; thus, the collection systems are typically less complex than those for POTWs.
Industrial facilities may have storm water discharges contaminated by manufacturing activities,
contact with raw materials or product storage activities, and may have non-process wastewater
discharges such as non-contact cooling water. The NPDES Program addresses these potential
wastewater sources for industrial facilities. Residuals (sludge) generated by industrial facilities are not
currently regulated by the NPDES Program. Specific NPDES program areas applicable to industrial
sources are:
Process Wastewater Discharges, Non-process Wastewater Discharges, and Industrial Storm Water Program. (epa.gov/lawsregs/lawsguidance/cwa/tmdl/intro.cfm)
Phase I Communities (CWA) This first phase covered industrial activities, and construction activities which disturbed five or more
acres, and municipalities with populations of 100,000 or more that owned or operated a municipal
stormwater sewer system.
Phase II Communities (CWA) This second phase of the program expanded permit requirements to construction disturbing an acre
or more, and to smaller NPDES communities of less than a population of 100,000.
1.4 Types of Permits
A permit is typically a license for a facility to discharge a specified amount of a pollutant into a
receiving water under certain conditions; however, permits may also authorize facilities to
process, incinerate, landfill, or beneficially use sewage sludge. The two basic types of NPDES
permits issued are individual and general permits.
8
An individual permit is a permit specifically tailored to an individual facility. Once a facility
submits the appropriate application(s), the permitting authority develops a permit for that
particular facility based on the information contained in the permit application (e.g., type of
activity, nature of discharge, receiving water quality). The authority issues the permit to the
facility for a specific time period (not to exceed five years) with a requirement that the facility
reapply prior to the expiration date.
A general permit covers multiple facilities within a specific category. General permits may offer
a cost-effective option for permitting agencies because of the large number of facilities that can
be covered under a single permit. According to the NPDES regulations at 40 CFR §l22.28,
general permits may be written to cover categories of point sources having common elements,
Storm water point sources
Facilities that involve the same or substantially similar types of operations; Facilities that discharge
the same types of wastes or engage in the same types of sludge use or disposal practices; Facilities
that require the same effluent limits, operating conditions, or standards for sewage sludge use or
disposal; and facilities that require the same or similar monitoring. General permits, however, may
only be issued to dischargers within a specific geographical area such as city, county, or state
political boundaries; designated planning areas; sewer districts or sewer authorities; state highway
systems; standard metropolitan statistical areas; or urbanized areas. By issuing general permits, the
permitting authority allocates resources in a more efficient manner to provide timely permit coverage.
For example, a large number of facilities that have certain elements in common may be covered
under a general permit without expending the time and money necessary to issue an individual permit
to each of these facilities. In addition, using a general permit ensures consistency of permit conditions
for similar facilities (epa.gov/lawsregs/lawsguidance/cwa/tmdl/intro.cfm).
Major Components of a Permit All NPDES permits, at a minimum, consist of five general sections: 1. Cover Page - Typically contains the name and location of the permittee, a statement
authorizing the discharge, and the specific locations for which a discharge is authorized.
2. Effluent Limits - The primary mechanism for controlling discharges of pollutants to
receiving waters. Permit writers spend a majority of their time deriving appropriate
effluent limits based on applicable technology-based and water quality-based standards.
9
3. Monitoring and Reporting Requirements - Used to characterize waste streams and
receiving waters, evaluate wastewater treatment efficiency, and determine compliance
with permit conditions.
4. Special Conditions - Conditions developed to supplement effluent limit guidelines.
Examples include: best management practices (BMPs), additional monitoring activities,
ambient stream surveys, and toxicity reduction evaluations (TREs).
5. Standard Conditions – Pre-established conditions that apply to all NPDES permits and
delineate the legal, administrative, and procedural requirements of the permit.
Every permit contains these five basic sections, but the contents of sections will vary depending
on whether the permit is issued to a municipal or industrial facility and whether the permit will
be issued to an individual facility or to multiple dischargers (i.e., a general permit)
(epa.gov/lawsregs/lawsguidance/cwa/tmdl/intro.cfm). 1.5 Overview of the Permitting Process
While the limits and conditions in an individual NPDES permit are unique to the permittee, the
process used to develop the limits and conditions and issue the permit generally follows a
common set of steps. The order of these steps may vary depending on whether the permit is an
individual or general permit. A general description of permitting process for individual and
general permits is presented below. Additionally, the future consideration of permitting on a
watershed basis is discussed.
Individual Permits
As specified in 40 CFR §124, the major steps for seeking and having issued a permit
are:
1. Receive application from permittee.
2. Review application for completeness and accuracy.
3. Request additional information as necessary.
4. Develop technology-based effluent limits using application data and other sources.
5. Develop water quality-based effluent limits using application data and other sources.
10
6. Compare water quality-based effluent limits with technology-based effluent limits and
choose the more stringent of the two as the effluent limits for the permit.
7. Develop monitoring requirements for each pollutant.
8. Develop special conditions.
9. Develop standard conditions.
10. Consider variances and other applicable regulations.
11. Prepare the fact sheet, summarizing the principal facts and the significant factual legal,
methodological and policy questions considered in preparing the draft permit including
public notice of the draft permit, and other supporting documentation.
12. Complete the review and issuance process.
13. Issue the final permit.
14. Ensure permit requirements are implemented.
The NPDES permitting process begins when the operator of the facility (permittee) submits an
application. After receiving the application and making a decision to proceed with the permit,
the permit writer reviews the application for completeness and accuracy. When the application is
complete, the permit writer, using the application data, begins to develop the draft permit and the
justification for the permit conditions (referred to as the fact sheet or statement of basis).
The first major step in the development process is deriving technology-based effluent limits based on
state statutes and regulations as well as water quality conditions derived from data derived in the
field.
The permit writer derives effluent limits that are protective of state water quality standards (i.e., water
quality-based effluent limits). The permit writer then compares the technology-based effluent limits
with the water quality-based effluent limits and applies the more stringent limits in the permit. The
decision-making process for deriving limits is documented in the permit fact sheet. It is quite possible
that a permit may have limits that are technology-based for some parameters and water quality-based
for, others. For example, a permit may contain an effluent limit for TSS based on national effluent limit
guidelines (technology-based), a limit for ammonia based on prevention of aquatic toxicity (water
quality-based), and a BOD5 limit based for part of the year on effluent limit guidelines (technology-
based) and for the remainder of the year on water quality considerations.
Following the development of effluent limits, the permit writer develops appropriate monitoring and
reporting conditions, facility-specific special conditions, and includes standard conditions that are the
same for all permits. After the draft permit is complete, the permitting authority provides an
11
opportunity for public participation in the permit process. A public notice announces the permit and
interested parties may submit comments regarding the draft permit. Based on the comments, the
permitting authority then develops the final permit, with careful attention to documenting the process
and decisions for the administrative record, and issues the final permit to the facility
(epa.gov/lawsregs/lawsguidance/cwa/tmdl/intro.cfm).
General Permits The process for developing and issuing general NPDES permits is similar to the process for
individual permits, however, there are certain differences in the order of events. The permitting
authority first identifies the need for a general permit by collecting data demonstrating that a
group, or category, of dischargers has similarities that warrant a general permit. In deciding
whether to develop a general permit, permitting authorities consider the following:
-Are there a large number of facilities to be covered?
-Do the facilities have similar production processes or activities?
-Do the facilities generate similar pollutants?
-Do only a small percentage of the facilities have the potential for violations of water
quality standards?
The remaining steps of the permit process are the same as for individual permits. The permitting
authority develops the draft permit and fact sheet, issues a public notice, addresses public
comments, documents the issues for the administrative record, and issues the final permit. After
the general permit has been issued, facilities that wish to be covered under the general permit
generally submit a Notice of Intent (NOI) to the permitting authority. The permitting authority
may then either request additional information describing the facility, notify the facility that it is
covered by the general permit, or require the facility to apply for an individual permit.
(epa.gov/lawsregs/lawsguidance/cwa/tmdl/intro.cfm)
Watershed Permitting Recently, EPA has focused on the goal of integrating the NPDES program further into the
concept of watershed planning. This process involves examining the core functions of the
NPDES program, as described in this paper, and assessing how to adapt the program to better
promote community-based water resource management rather permitting on a source-by-source
basis. EPA is gaining insight into the best way to refine the NPDES framework to make

12
decisions based on a watershed analysis and to engage local leadership in planning and non-point
sources in pollution control, while maintaining a strong baseline individual and general
permitting program.
EPA is exploring models for a watershed permitting program that would allow for local leadership in
conducting watershed planning and selecting appropriate management options to meet watershed
goals and CWA requirements. For example, a local water quality authority, with jurisdiction over thirty
individual discharges across three watersheds and some non-point source control authority, could
receive three watershed permits rather than 30 individual source permits. The watershed permits
would set ambient water quality requirements that the water quality authority must meet using a
combination of point and non-point source controls selected through a local watershed planning
process. Additionally, the permits may contain individual point source effluent limits that meet
technology-based requirements and certain water quality-based requirements not addressed in the
watershed plans.
Watershed permitting may present EPA, states, and communities with a unique framework to achieve
the goals of the CWA and objectives of local watershed management initiatives. By focusing on
ambient or watershed goals in a watershed permit, regulatory agencies, regulated dischargers, and
non-regulated sources may meet otherwise unattainable watershed objectives with potential cost
savings relative to source-by-source permitting (epa.gov/lawsregs/lawsguidance/cwa/tmdl/intro.cfm).
1.6 Roles and Responsibilities of State and Federal Authorities
EPA is authorized under the CWA to directly implement the NPDES Program. EPA, however,
may authorize States, Territories, or Tribes to implement all or parts of the national program.
States, Territories, or Tribes applying for authorization may seek the authority to implement the
base program (i.e., issue individual NPDES permits for industrial and municipal sources) and
additional parts of the national program including:
-Permitting of federal facilities;
-Administering the National Pretreatment Program; and/or
-Administering the Municipal Sewage Sludge Program.
If the State, Territory, or Tribe only has partial authority (e.g., only the base NPDES permits
program), EPA will implement the other program activities. For example, a State may have an
13
approved NPDES Program, but has not received EPA approval of the State's Municipal Sewage
Sludge Program. The EPA Region would be responsible for ensuring conditions to implement the
Standards for the Use or Disposal of Sewage Sludge (40 CFR §503) were included in NPDES
permits issued to POTWs in that State. EPA may issue a separate NPDES permit with the applicable
sewage sludge standards and requirements, or may negotiate with the State on joint issuance of
NPDES permits. The same process also applies where a State, Territory, or Tribe has not received
approval for administering the National Pretreatment Program or permitting of federal facilities.
In general, once a State, Territory, or Tribe is authorized to issue permits or administer a part of the
program, EPA no longer conducts these activities. However, EPA must have an opportunity to review
each permit issued by the State, Territory, or Tribe and may formally object to elements that conflict
with federal requirements. If the permitting agency does not address the objection points, EPA will
issue the permit directly. Once a permit is issued through a government agency, it is enforceable by
the approved State, Territorial, Tribal and Federal agencies (including EPA) with legal authority to
implement and enforce the permit, and also enforceable by private citizens (in federal court).
If the State, Territory, or Tribe does not have approval for administering the NPDES program, EPA
will operate the NPDES program. When EPA issues the permit, Section 401(a) of the CWA requires
that EPA obtain certification from the State where the discharge will occur to ensure that the
discharge will be in compliance with effluent limits, the State's water quality standards, and "any other
appropriate requirement of State law." Section 401(d) requires the State to list in the certification the
conditions that must be included in the permit to implement the certification
(epa.gov/lawsregs/lawsguidance/cwa/tmdl/intro.cfm).
Summary
From the 1948 Water Pollution Control Act to the 1977 CWA to the WQA of 1987, the NPDES
permitting program evolved from environmental legislation to control water quality degradation.
Improvements to the quality of water in this country can be directly linked to the implementation
of the NPDES program and the control of pollutants discharged from both municipal and
industrial point sources into waters of the United States. Individual and general permits set
technology-based and water quality-based effluent limits to maintain environmental standards
that ensure safe water.
14
1.7 Section 303(d) of the Clean Water Act
The goal of the Clean Water Act (CWA) is "to restore and maintain the chemical, physical, and
biological integrity of the Nation's waters" (33 U.S.C §1251(a)). Under section 303(d) of the CWA,
states, territories, and authorized tribes, collectively referred to in the act as "states," are required to
develop lists of impaired waters. These are waters for which technology-based regulations and other
required controls are not stringent enough to meet the water quality standards set by states. The law
requires that states establish priority rankings for waters on the lists and develop Total Maximum
Daily Loads (TMDLs), for these waters. A TMDL is a calculation of the maximum amount of a
pollutant that a water body can receive and still safely meet water quality standards
(epa.gov/lawsregs/lawsguidance/cwa/tmdl/intro.cfm).
How does the 303(d) Impaired Waters and TMDL Program fit into the Clean Water Act?
The CWA includes two basic approaches for protecting and restoring the nation's waters. One is a
technology-based, end-of-pipe approach, whereby EPA promulgates effluent guidelines that rely on
technologies available to remove pollutants from waste streams. These guidelines are used to derive
individual, technology-based National Pollutant Discharge Elimination System (NPDES) permit limits.
The other approach is water-quality based and is designed to achieve the desired uses of a water.
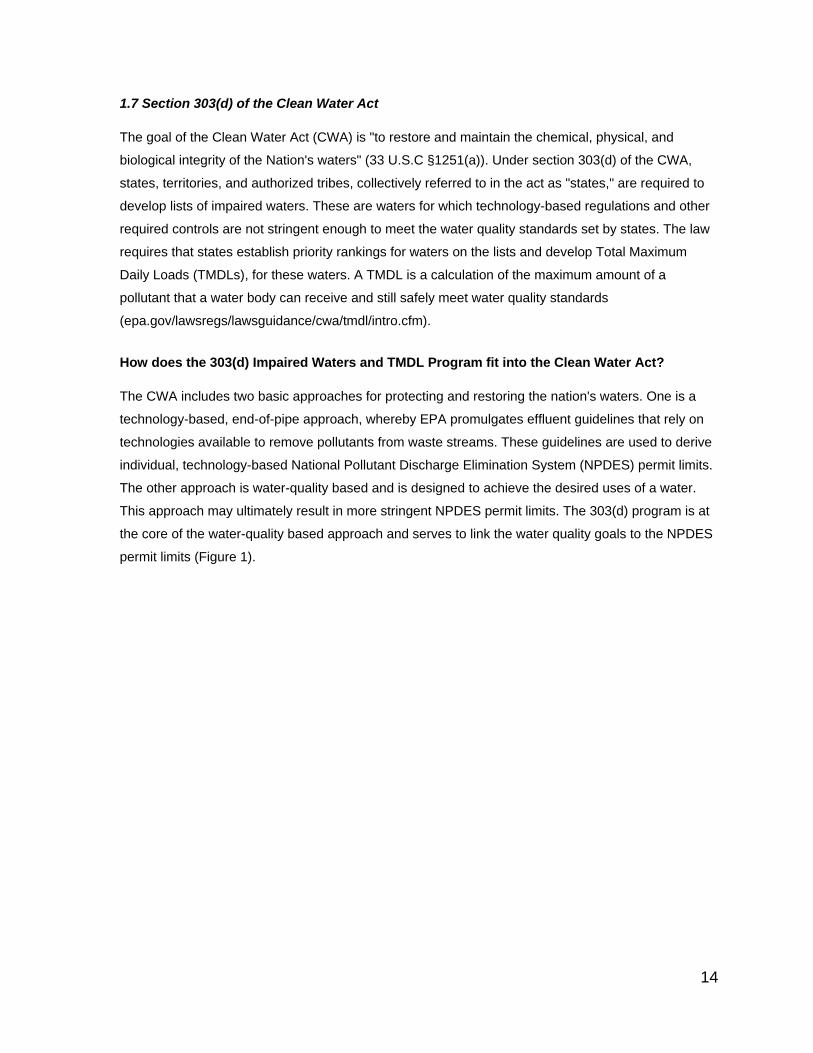
This approach may ultimately result in more stringent NPDES permit limits. The 303(d) program is at
the core of the water-quality based approach and serves to link the water quality goals to the NPDES
permit limits (Figure 1).
15
Figure1 Water Quality Based Approach of the Clean Water Act (EPA Web Site, 2012, http://epa.gov)
Water quality standards are the foundation of the water-quality based control program mandated by
the Clean Water Act. Water quality standards define the goals for a waterbody by designating its
uses, setting criteria to protect those uses, and establishing provisions to protect water quality from
pollutants. A water quality standard consists of four basic elements:
1. designated uses of the waterbody (e.g. recreation, water supply, aquatic life, agriculture), 2. water quality criteria to protect designated uses (numeric pollutant concentrations and
narrative requirements), 3. an anti-degradation policy to maintain and protect existing uses and high quality waters, and 4. general policies addressing implementation issues (e.g., low flows, variances, mixing zones).
By adopting water quality standards, states are able to determine which healthy waters need
protection, which waters must be restored and how much pollutant reductions are needed.
Consequently, these water quality standards set a goal for restoring and protecting a watershed over
the long term.
Water quality monitoring provides the data to characterize waters and identify changes or trends in
water quality over time. The collection of monitoring data enables states to identify existing or
emerging water quality problems and determine whether current pollution control mechanisms are
effective in complying with the regulations. The CWA requires that each state monitor and assess the
16
health of all their waters and report their findings every two years to EPA. This list of data and findings
is called the 305(b) report or "biennial water quality report."
Under section 303(d), monitoring data as well as other information, must be used by the states to
develop a list of "water-quality limited segments," i.e., waters that will not meet water quality
standards for a particular pollutant even after a technology-based permit is in place. States must
develop TMDLs, or Total Maximum Daily Loads, for every water body/pollutant combination on the
303(d) list.
The TMDL calculates the maximum amount of a pollutant allowed to enter a waterbody, also known
as the loading capacity, so that the waterbody will meet and continue to meet water quality standards
for that particular pollutant. The TMDL allocates that load to point sources, (Wasteload Allocation or
WLA), and nonpoint sources (Load Allocation or LA) which include both anthropogenic and natural
background sources of the pollutant.
In many cases, the TMDL analysis is the trigger for determining the source(s) of pollutants. A TMDL
may contain WLAs only, LAs only, or a combination of both. Under the CWA TMDLs are not self-
implementing, meaning EPA cannot enforce implementation of a TMDL once the analysis is
complete. Although, if the TMDL WLA requires more stringent permit limits for point sources these
must be implemented in the appropriate NPDES permits at the time of their renewal. If the TMDL
identifies nonpoint sources of pollutants as a major cause of impairment, states can apply for EPA
funded grants, called section 319 grants. These grants can be used to fund state programs for
nonpoint source assessment and control as well as individual projects.
(epa.gov/lawsregs/lawsguidance/cwa/tmdl/intro.cfm)
1.8 Sediment and Erosion Control (CWA) (Soil Conservation Act) (North Carolina
Sedimentation Pollution Control Act of 1973)
Erosion control programs developed in the 1930s with passage of the Soil Conservation Act by the
U.S. Congress. The Act created the Soil Conservation Service as part of a national program to
address soil and water conservation. Since 1973, over 30 states have adopted legislation to
implement erosion control programs. Federal requirements for the control of stormwater from
construction activities are contained at 40 CFR 122. The 1987 amendments to the federal Clean
Water Act established two phases of NPDES stormwater permitting for certain municipalities and
industrial activities. These phases require sediment and erosion control for land disturbance activities.
17
―In 1973 the State of North Carolina passed the Sedimentation Pollution Control Act of 1973. The
preamble to the law reads as follows: The sedimentation of streams, lakes and other waters of this
State constitute a major pollution problem. Sedimentation occurs from the erosion or depositing of soil
and other materials into the waters, principally from construction sites and road maintenance. The
continued development of this State will result in an intensification of pollution through sedimentation
unless timely and appropriate action is taken. Control of erosion and sedimentation is deemed vital to
the public interest and necessary to the public health and welfare, and expenditures of funds for
erosion and sedimentation control programs shall be deemed for a public purpose. It is the purpose of
this Article to provide for the creation, administration, and enforcement of a program and for the
adoption of minimal mandatory standards which will permit development of this State to continue with
the least detrimental effects from pollution by sedimentation. In recognition of the desirability of early
coordination of sedimentation control planning, it is the intention of the General Assembly that
preconstruction conferences be held among the affected parties, subject to the availability of staff ―
(North Carolina General Statutes Article 4, Chapter 133A).
The North Carolina legislation established a statewide program to control soil erosion and
sedimentation. The law covers all land-disturbing activities, regardless of the size of the disturbance,
except those involving agriculture, forestry, and mining, which are addressed in other legislation. The
law and the rules do not specify a rigid set of practices; rather, they require the land developer to
prepare an erosion and sedimentation control plan and employ appropriate measures to meet the
performance standards.
The law requires installation and maintenance of sufficient erosion control devices and practices to
retain sediment within the boundaries of the site. Under the law, compliance is determined by
assessing performance. It prohibits visible off-site sedimentation from construction sites but permits
the owner and developer to determine the most economical, effective methods for controlling erosion
and sedimentation. This flexibility in the law allows for innovation and variations to account for the
uniqueness of each construction site.
The law requires that developers plan and implement effective temporary and permanent control
measures to prevent accelerated erosion and off-site sedimentation. An erosion and sedimentation
control plan must be submitted at least 30 days before land disturbance begins for any site larger
than 1 acre. A preapproved plan is not required for sites of less than 1 acre; however, the same
control regulations apply. The law also requires that surfaces be non-erosive and stable within 30
working days or 120 calendar days after completion of the activity, whichever period is shorter. In

18
addition to the state regulations, there may be local ordinances and regulations. It is wise to check
with local governments about their erosion and sedimentation control programs before disturbing the
land (Walker, Jennings, Arnold, 1994).
19
Chapter 2 Hypothesis, Objectives and Methods
2.1 Introduction to Objectives
An interesting paradox is raised in an article by Robert Hardin entitled ―The Tragedy of the
Commons‖. The paradox is a helpful model/metaphor in helping to understand the need to actively
collaborate in environmental policy and implementation due to its grounding in a natural resource. In
Hardin’s classic essay everyone is free to graze their cattle on the commons at will, as much as they
want. Everyone driven by individual interest and short-term gain, overgraze the commons, leading
ultimately to the destruction of the commons. Hardin asks the reader to consider what would happen
if each farmer would keep adding an additional animal, finding it more profitable to graze an additional
animal at no extra cost. Each takes extra profit at only a fraction of the cost for overgrazing. The
result is the destruction of all that is held in common and the ruin of all of the farmer’s collective
resource (Hardin 1968). Although each was behaving in an individually rational way, it led to the
collective ruin of all. It highlights the divergence between being rational at the individual level and
being rational for the collective good. There can also be something of an institutional tragedy of the
commons where individual interests are now represented by units of government, homeowner
associations, conservation groups, and the development community, all needing to use a limited
water resource for varying purposes and goals. The individual interest of the agency or lack of an
overarching goal alignment can produce counter-productive and damaging consequences at the
watershed scale.
Stormwater planning, watershed planning, stream restoration and the like all necessitate coordination
without regard to geo-political boundaries in order to be effective. Institutions by not working
collaboratively to sustain the commons (natural resources) can become the individual farmer pursuing
the individual gain to the detriment of all. In starkest terms, the model suggests that rational creatures
left unchecked, will not cooperate even to their own long-term sustainable benefit (Ostrom 1990).
Hardin’s work raises the question particularly apt in environmental policy as to whether or not pursuit
of individual interests, or in this case narrow agency interests will ultimately only lead to a destructive
outcome, setting aside the interest of the collective good. Within the sphere of managing watersheds
it means that a regional understanding of resources and multi-agency goals is necessary to do the
work.
20
Water quality and water quantity continues to be one of the most pressing issues confronting
government and society as populations increase and urbanization of once rural lands continues to
accelerate (Griffith 1994). These ―modern day commons‖, publicly owned ecosystems, continue to be
poorly understood and undervalued (Baskin 1997). For the past century, water quality and water
supply have typically been managed by single function local, state and federal entities. Decision
making has been technocratic, usually involving the public at the end to fine tune proposals. This
approach has come under criticism in an age when water resources are now being competed for by
agricultural, industrial, residential, recreation and a host of other interests (Sabatier 2005). In fact,
most modern decision making with regard to water resources has evolved into an intricate, elaborate,
and diverse stakeholder process.
It takes great effort to get environmental work accomplished in the modern arena. From the inception
of a policy at the highest level, down to the contractor installing a best management practice (BMP),
the intricacy of this path from politics, to policy to implementation is mind boggling. As Deborah Stone
puts it in her book entitled Policy Paradox, ―Policy is potentially a sphere of rational analysis,
objectivity, allegiance to the truth, and pursuit of the well-being of society as a whole. Politics is the
sphere of emotion and passion, irrationality, self-interest, shortsightedness, and raw power‖ (Stone
2002). In short, she is describing aspects of watershed management networks and the need to use
network theory as perhaps the best reflection on how policy and politics develop, and are ultimately
implemented. The need for a collaborative roadmap to navigate this road should be a paramount
concern for any public manager.
Knowledge of local situations and the coordination of multiple agencies, is difficult, if not impossible to
accomplish without the development and engagement of a collaborative network (Sabatier 2005). In
recognizing the presence of networks in watershed management, and their necessity to get work
accomplished, should those involved in watershed management not spend more time both
understanding them, and attempting to have them function effectively?
After an extensive literature review, Michael McGuire (2006), concludes there are four things we
know about managing collaboratively through networks: (1) That collaborative management is a
component of public management that is here to stay, (2) More work needs to be done through
research on the types of skills needed to be effective in network settings, (3) There is renewed
interest in finding out more about the effect of collaboration on program outcomes, (4) There is still
21
much to learn about managing collaboratively through the network, and the questions left to be
answered are nearly endless (McGuire 2006).
Among all of the public management networks, watershed management networks provide one of the
best sub-system’s for both the researcher and practitioner of public management to examine the
collaborations of networks and how they are governed (Imperial 2005, W.D.Leach 2002). They are
unique in their interdependency (what one entity does impacts the goals of another) and spread
across great political and geographic boundaries (local federal state). Watershed Management
Networks are defined for the purposes of this article as public (local government sediment and
erosion control programs, watershed planning programs, soil and water conservation agencies,
cooperative extension, state agencies), and non-governmental agencies (land trusts, water quality
advocacy organizations) directed at improving water quality within a delineated geographic or political
boundary.
Plans and implementation are the natural fruit of the labors of strong networks. They signal policy
intention and agreement and articulate goals reached through collaboration. Most agencies believe
the plans produced for their watersheds are good plans, yet most practioners in the arena of
watershed management believe they are having little or no impact on improving water quality. This
raises the question “If the plans developed through the network are good, why is the perception of
improved water quality, apparently impacted so little”.
By simply understanding that no single organization of government can achieve its policy intentions
alone, and that it requires the work of multiple actors, all with significant capabilities to manage the
flow of problems and solutions into policy action (Bressler 1995), a great deal can be achieved. These
programs that facilitate a policy intention are often spread out across federal, state and local
government, which reflect varying degrees of capacity and innovation (Elazar 1987, Ostrom 1990,
Wright 1988). The network managed well possesses the capacity to move multiple agencies and
programs with divergent goals and capacities towards a collective benefit and improved efficiency
with scarce public resources, that otherwise could not be realized. The goal then for public managers,
is to find ways to improve governance within these complex networks with multiple actors, incapable
of accomplishing their mission acting alone (Provan and Milward 2001).
Watersheds provide an excellent subsystem for the researcher to examine the collaborations of
networks and how they are governed (Imperial 2005, Leach, Pelkey, Sabatier, 2002). There is also
little data available to indicate if these programs and their corresponding plans are effective in
22
protecting and improving water quality as they operate through watershed management networks in
North Carolina. It should be a concern and of interest for those who work in government, as opposed
to NGOs for example, in that they are held more accountable for public funds and meeting public
purposes efficiently (Provan and Milward 2001). This reality, the growing list of 303d listed streams,
and the size of budgets expended through watershed management networks all point to the value
and saliency of understanding networks and both understanding and measuring their outcomes. As
such understanding the management of water resources is best understood through gaining an
understanding of the complex network, how it operates, and where improvements can be realized.
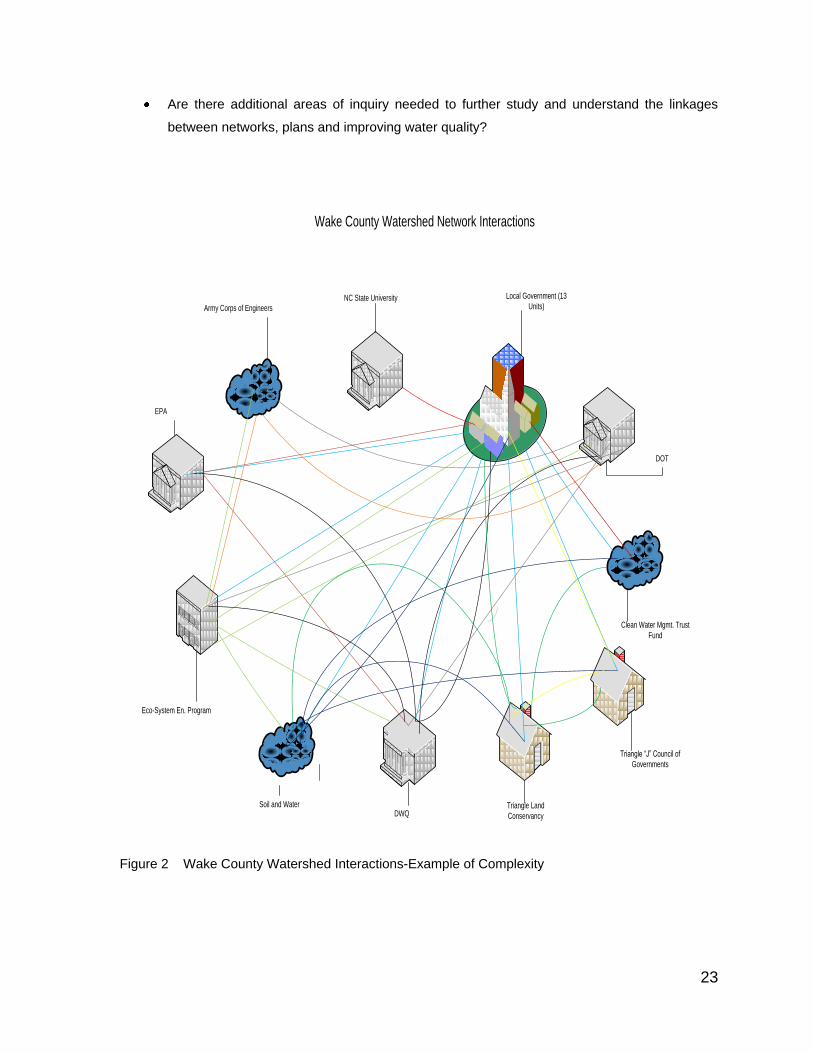
The diagram (Figure 2) illustrates the complexity of a network involved in watershed planning and
implementation in Wake County as an example common to North Carolina county efforts. It depicts
the many possible relationships possible in watershed management within a given county. Those
relationships grow even more complex as they cross multiple counties within a watershed.
Most network organizations produce a web site for public use. Typically great care is used to produce
a positive and expansive view of the organization. These web sites provided me with contact names,
organizations with whom they network, advisory boards, mission, goals, budget, budgetary
considerations and various reports. I used these web sites to provide a rough sketch network map
and narrative of the watershed network in each of the four counties case studies.
2.2 General Objectives The general objective of this study is to determine answers or add to the body of knowledge, for the
following questions about water quality protection efforts:
What types of collaborative activities are most effective to improve governance of the
watershed networks in North Carolina counties?
Is there a positive relationship between the quality of watershed plans derived from the
network and the strength of these networks?
Do strong plans and strong networks improve water quality as opposed to weak networks
and weak plans?
23
Are there additional areas of inquiry needed to further study and understand the linkages
between networks, plans and improving water quality?
Local Government (13
Units)
EPA
DWQSoil and Water
Army Corps of Engineers
Clean Water Mgmt. Trust
Fund
Eco-System En. Program
Triangle Land
Conservancy
Triangle ―J‖ Council of
Governments
DOT
NC State University
Wake County Watershed Network Interactions
Figure 2 Wake County Watershed Interactions-Example of Complexity
24
Gain an understanding of how well each county is at developing watershed-based
plans which meet criteria - as reflected in the nine elements with revisions unique to
watershed management in North Carolina.
Identify common areas of weakness in existing plans which can eventually be communicated
back to the respective networks.
Uncover new approaches to share with researchers, and practitioners within networks to
improve their function.
Drawing from the preceding objectives of this research, this study can help add to the body of knowledge for the following the following:
Ways to measure the strengths of effective plans.
Ways to measure the strength of networks.
Ways of improving and organizing watershed management efforts in North Carolina.
Is a network approach always preferable in managing our watersheds? If so, how can they be
more effective?
Do some county watershed networks work better than others, why?
What types of collaborative activities are used most in the networks? Which ones should be
used more often?
Is there a positive relationship between the quality of watershed plans derived from the
network and the strength of the networks?
Do strong plans and strong networks add improvement to water quality?
2.3 Hypothesis My research is focused on three main hypotheses as they relate to watershed management networks
in urbanizing North Carolina counties. Data produced were from Wake, Mecklenburg, Forsyth and
Guilford counties respectively.
25
H1 Strong networks produce good plans. H2 Good plans lead to improved water quality. H3 Watershed management networks are not effective in improving actual water quality in
urbanizing North Carolina counties.
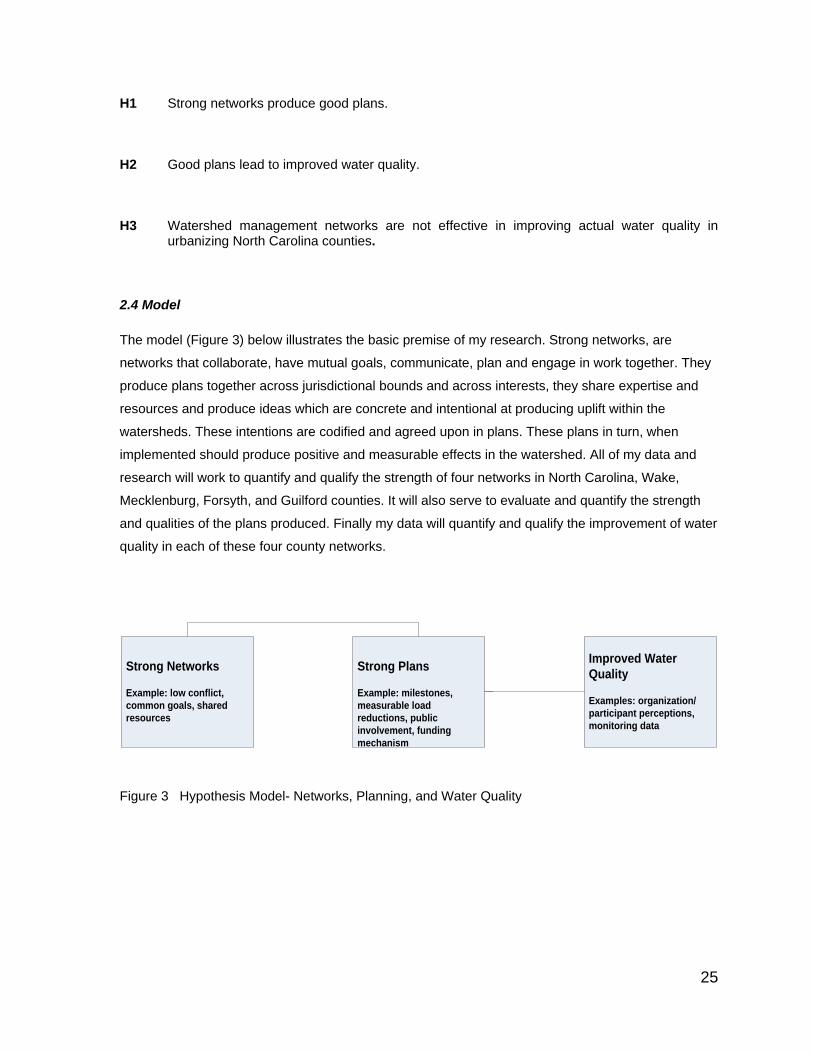
2.4 Model
The model (Figure 3) below illustrates the basic premise of my research. Strong networks, are
networks that collaborate, have mutual goals, communicate, plan and engage in work together. They
produce plans together across jurisdictional bounds and across interests, they share expertise and
resources and produce ideas which are concrete and intentional at producing uplift within the
watersheds. These intentions are codified and agreed upon in plans. These plans in turn, when
implemented should produce positive and measurable effects in the watershed. All of my data and
research will work to quantify and qualify the strength of four networks in North Carolina, Wake,
Mecklenburg, Forsyth, and Guilford counties. It will also serve to evaluate and quantify the strength
and qualities of the plans produced. Finally my data will quantify and qualify the improvement of water
quality in each of these four county networks.
Strong Networks
Example: low conflict,
common goals, shared
resources
Strong Plans
Example: milestones,
measurable load
reductions, public
involvement, funding
mechanism
Improved Water
Quality
Examples: organization/
participant perceptions,
monitoring data
Figure 3 Hypothesis Model- Networks, Planning, and Water Quality
26
2.5 Overview of Methods
In order to assess the relationships among networks, plans and water quality, this research used (1)
literature reviews, (2) political/organizational science on networks and watershed management, (3)
existing and available state data on water quality (4) surveys of watershed planning experts in North
Carolina; and (5) expert evaluation of water quality plans. The literature covered the authoritations for
water quality lawlaw and regulation, as described above. It also examined the theory and related
studies on watershed planning. This review of laws and prior research helped form the empirical
research for this study, consisting of a survy and paln evaluations. I used these methods as an
application of a case study in four large urban counites in North Carolina; Wake (Raleigh),
Mecklenburg (Charlotte), Forsyth (Winston-Salem), and Guilford (Greensboro). The model I used
presumes that strong networks enable counties and stakeholders to develop strong plans, which in
turn led to the ultimate goal of improved water quality (figure 3). It is becoming increasingly important
for government to deliver good service for scarce dollars through networks in a time when
government programs and management are carefully scrutinized (Nohria 1992).
A survey instrument was designed and administered to extract information in three areas: network
strength, perceptions of plan quality, and perceptions of water quality, within the networks of four
North Carolina Counties. The questions are attempting to provide evaluation of the network at two
levels; (1) from the organization/participant level (2) and through the overall network (Provan and
Milward 2001). By measuring network strength, plan quality, and water quality improvement, we can
learn which attributes of planning and networks work well and which ones do not. Through these
measurements and comparisons between the networks of four counties, I will be able to identify
which interactions can be added and subtracted in order to improve function (Salancik 1995) of the
watershed management networks.
A second instrument, a plan evaluation tool was developed resting largely on the work of Phillip
Berke, which measures plan quality. Plan quality was evaluated by three individual raters for each of
four counties (Wake, Mecklenburg, Forsyth and Guilford counties. Plans were examined of three
types: stormwater plans, comprehensive land use plans and watershed plans. The tool allows us to
measure the quality of plans produced by each of the three networks and then be able to compare
county against county.
A final compilation was accomplished with the help of Wake County’s GIS department which did a
county by county analysis, for each of the studied counties, to determine the rate of increase in 303d
listed waters from 2006-2010. This helped to serve as a proxy for water quality improvement for each
county compared against watershed professional’s perceptions of water quality improvement.
27
Lastly, basic information on the characteristics of each county, and the quality and size of the
watershed network at work in each county was compiled and mapped to better understand those
differences between each county.
With these tools developed and employed an examination was made of four North Carolina
watershed management networks: (1) Wake County (2) Mecklenburg County (3) Forsyth County (4)
Guilford County. Within these four networks are the results of comparative case studies which
quantify and qualify the size and strength of the networks, measure the quality of the plans they
produce, and finally measure the perceptions of staff to determine if they perceive water quality as
improving as a result of their efforts.
Case studies, when integrated with a survey in a larger, more complex research design, can be
useful: (1) As a source of rich detail to aid in the interpretation of quantitative findings from the survey
(e.g. construct validation/internal validity and interpretation of observed associations), (2) As a further
means of triangulation, by testing the propositions or patterns with the case sample as well as with
the quantitative survey data (i.e. as a "repeated experiment"), (3) To develop a close relationship with
a few firms who may serve as the sample for pilot testing the survey instruments and as a cross-
check against questionnaire responses to aid in validating the survey instruments, (4) As a test of the
contextual relevance of variables of interest where an idiographic research strategy is pursued, and
(5) As an aid in identifying alternative ex poste models (e.g. justification for dropping the path
between Involvement and Success) (Gable 1994). Recent research suggests that quantitative 'micro-
level' analyses should be integrated with qualitative 'macro-level' analyses, in order that the ways in
which individual behavior impacts organizational phenomenon, and the ways in which macro
phenomenon have effects through individuals, be explicated (Wynekoop 1992).
2.6 Case Study Counties Case studies are best defined as an intensive study of a single unit with an aim to generalize across a
larger set of units (Gerring 2004). Researchers have continued to produce a large number of case
studies, many of which have become classics (Pressman and Wildasky 1973, Kaufman 1960), and
have contributed largely in research and proposing areas of further inquiry. All empirical research has
at its core causal relationships and variation. More specifically things must appear and disappear, or
transform at some more or less predictable interval. Conversely the absence of variation is taken as
disconfirming evidence (Gerring 2004). Variation may be observed in a single unit, or among a
relatively small number of units. These variations can be observed in a qualitative or quantitative
28
fashion, and these patterns create empirical clues on reaching conclusions about causation (Gerring
2004).
To better understand these network service delivery systems aimed at improvement of water quality, I
prepared a set of sample counties, looking at Wake, Mecklenburg, Forsyth, and Guilford counties,
which provided comparisons on the operation and effectiveness of each network, and the types of
plans and goals that are articulated and directed towards water quality improvement. In examining
these four networks, data was gathered, and variations observed, and empirically based conclusions
have been reached. This study framework helps identify characteristics, and knowledge of the
networks that deliver these services directed at protecting and improving water resources. These
case studies and comparisons provide both qualitative and quantitative research on watershed
management programs in North Carolina, which help in theory development and provide
considerations for practitioners.
The case selection was guided by both recognition of key differences and similarities. Similarities
exist between the four in that they are among the most urban, with pressing water quality concerns.
Each county possesses a similar array of agencies working the problem (Figure 2). They were also
selected to ensure that each county had vigorous regulatory and non-regulatory programs at work, to
ensure that I have a wide range of activities to study. Differences exist in their ecological settings
within differing watersheds, environmental and situational histories. My expectations are that enough
difference exists in the historical, ecological, and institutional development of each of these counties,
which can be delineated, defined and described. I also expect to find enough similarities between
these networks to be able to make my findings applicable and relevant to members and practitioners
within the network.
2.7 Survey
The survey approach refers to a group of methods which emphasize quantitative analysis, where data
for a large number of organizations are collected through methods such as mail questionnaires,
telephone interviews, or from published statistics, and these data are analyzed using statistical
techniques. By studying a representative sample of organizations, the survey approach seeks to
discover relationships that are common across organizations and hence to provide generalizable
statements about the object of study (Gable 1994).
My research into networks, plans and water quality improvement will combine both case studies and
survey research to provide some measure of both qualitative and quantitative research in order to
29
better explain the relationships and qualities of the networks, the plans they produce and what if any
measurable impact these networks have on water quality.
2.8 Survey Instrument
I used my initial network sketch (Figure 2) developed through my research of the four counties to;
provide a basis for creating survey questions to assess the strength of networks. For example two
questions: Do you routinely have to work with (internally and externally) to meet goals and get things
done in your organization? Would you describe this collaboration as important, unimportant, or
irrelevant? How many different organizations do you have to work with to achieve your goals
internally and how many externally? I reduced these types of questions to something that can be
answered easily and numerically on a five point Likert scale. For each county, I developed a network
map which shows the dyads (relationships) that exist within each part of the network. The purpose of
this mapping was to demonstrate which counties have the most developed networks, and which have
the strongest networks. This map will demonstrate differences in the four case studies, which can be
searched for correlation with stronger programs, better plans and results.
The survey developed was delivered through web based service, to participants identified through the
web based research of watershed professionals within each network. I further called the leadership of
each organization in the network in advance to: (1) ensure I have the correct people identified (2) to
receive the endorsement of management to have staff respond to the survey when it arrives. The
survey of less than 10 questions was answered and coded numerically. The questions are centered
on three primary areas: (1) the size and strength of the network, (2) the perceptions of water quality
improvement, and the perception of good planning (See Draft Sample Survey Appendix I). This
survey provides insights into the networks size and strength, and the staff perceptions of the
network’s ability to improve water quality, and produce good plans.
There are three main areas of inquiry to examine as part of this survey (1) The size, strength and
characteristics of these networks (2) Assessing and measuring the quality of the plans produced by
the networks (3) Does the presence of networks and strong plans make a measurable difference in
water quality? The survey was developed to tease out the strength of watershed networks, the
perceptions of plan quality developed by these networks and finally respondent’s perceptions about
water quality as it relates to the efforts of the networks. The survey was sent to watershed
professionals in each of four North Carolina counties. Surveys were also sent to agencies that work
across county boundaries, such as NGOs and state agencies which are active in each of the
watershed networks examined. The survey was administered electronically though Survey Monkey

30
web-based service and compiled anonymously. The Dillman (2007) total design survey method was
observed, with samples of the correspondence included in the Appendix (Appendix 1-5). A complete
survey can be found in the Appendix 6.
The purpose of survey questions follows. Understanding network characteristics of sharing resources,
sharing information, and having common goals are critical to evaluating the strength and operation of
networks (Borzell 1998) (Borgatti and Foster 2003). When these characteristics are present or
lacking, it will be determinative of a strong network. The first question was designed illicit
information on the importance of the goal of water quality in three levels, the organization, the
department, and the work unit (Imperial 2005). This is in recognition that there is a nesting that occurs
within organizations with regard to function and mission (Nohria 1992). This question will help to
discover what differences, if any, exist within layers of the organization.
Measures of network effectiveness have been identified in the literature as; (1) dollars spent in
support of collaborating in the creation of a plan, (2) the extent to which an agencies stature
enhanced or degraded by participation in the network (3) the amount of conflict an agency
experiences or perceives in the collaborative process of network activity. (Provan and Millward 2001).
Questions two, three, four and five six were aimed at measuring resources invested in the
network, network stature through participation, and amount of conflict. To the extent that these
interactions can be correlated to stronger networks, better plans, and improved water quality, the
more we may be able to see ways in which adding or subtracting these interactions (Salancik 1995)
can lead to useful applications for the practitioner.
Question number seven was intended to reveal the value of collaboration to the agency. Agencies
are essentially asked if collaborating improves the work of an organization achieving its goals.
Question eight was developed and designed to try to gain insight into the type of collaborations
occurring to see what activities are easily collaborated on and which ones may present more of a
challenge (Imperial 2005). To the extent that these interactions can be correlated to stronger
networks, better plans, and improved water quality, the more we may be able to see ways in which
adding or subtracting these interactions (Salancik 1995) can lead to useful applications for the
practitioner.
My research also measured plan quality through a rating instrument which will assess the absence or
presence of particular attributes largely supported through the literature as being representative of
quality plans (Berke and Godchalk 2009). The rating instrument will be applied to a number of
31
selected plans from each county and assessed by multiple raters. In addition question number nine
will measure the networks perceptions of its own management plans. This subjective measurement of
perception will be compared for differences with the objective rating instrument applied to county
plans. This will provide some comparisons of perceptions with objective measuring of plans to see if
there are differences and what might account for them.
Question number ten is in the survey to simply measure network participant’s perceptions of the
state of water quality in their county. In a similar way to the measurement of objective criteria with
subjective perceptions posed in question seven, I gathered available water quality data to compare
with network perceptions. I plan to examine available data from sources like local monitoring
programs, DWQ data, 303d listings, etc. to see if the perceptions of the network are consistent with
available data. This might for example lead the network to recognize the need for increased
monitoring and measuring of water quality, if perceptions are inconsistent with data, or it could be
affirming of strong networks improving water quality.
Question number eleven is in the survey to be able to identify from which county, organization and
work group the respondent is from. This will assist the research to be cross tabbed and compared
from one group to the next.
Examination of the Size/Strength/Characteristics of Networks To examine the size and strength of the networks I followed a qualitative research process. I
expanded upon my research to compare and contrast demographics and network actors involved in
the watershed networks in Wake, Mecklenburg, Forsyth and Guilford Counties. These provide a
descriptive examination of each network. I measured the size and capacity of the watershed
management networks, and be able to offer a comparison between them. I plan to measure the
strength of these agencies as they operate in the network (questions 1-8 of the survey), and focused
on their ability to collaborate.
This draws on the work of Imperial who examined and measured the abilities of networks to
collaborate at the operational (project specific level), policy (decision makers), and institutional
(agency) levels, through a qualitative matrix used to compare and contrast the strength of the
networks to collaborate at each of these levels by providing a comparative study of six national
watershed management programs (Imperial 2005). A similar matrix was considered for my effort,
examining the networks at these same three levels. In his inquiry the presence of activities of
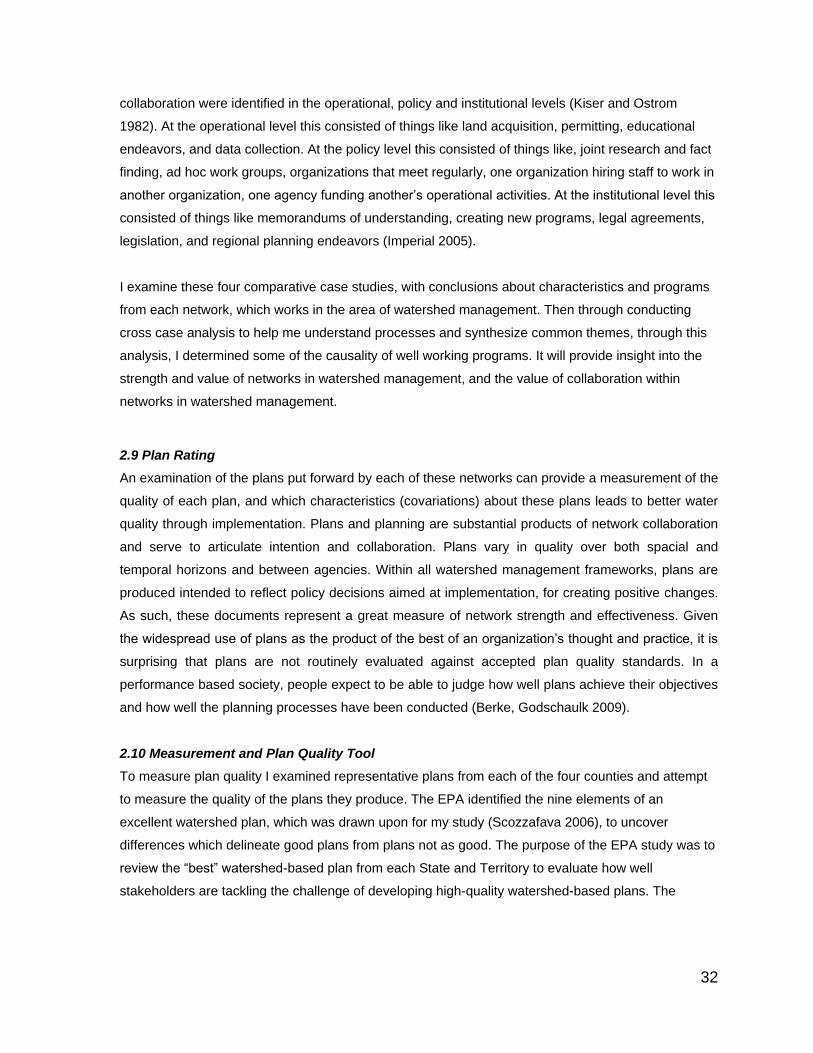
32
collaboration were identified in the operational, policy and institutional levels (Kiser and Ostrom
1982). At the operational level this consisted of things like land acquisition, permitting, educational
endeavors, and data collection. At the policy level this consisted of things like, joint research and fact
finding, ad hoc work groups, organizations that meet regularly, one organization hiring staff to work in
another organization, one agency funding another’s operational activities. At the institutional level this
consisted of things like memorandums of understanding, creating new programs, legal agreements,
legislation, and regional planning endeavors (Imperial 2005).
I examine these four comparative case studies, with conclusions about characteristics and programs
from each network, which works in the area of watershed management. Then through conducting
cross case analysis to help me understand processes and synthesize common themes, through this
analysis, I determined some of the causality of well working programs. It will provide insight into the
strength and value of networks in watershed management, and the value of collaboration within
networks in watershed management.
2.9 Plan Rating
An examination of the plans put forward by each of these networks can provide a measurement of the
quality of each plan, and which characteristics (covariations) about these plans leads to better water
quality through implementation. Plans and planning are substantial products of network collaboration
and serve to articulate intention and collaboration. Plans vary in quality over both spacial and
temporal horizons and between agencies. Within all watershed management frameworks, plans are
produced intended to reflect policy decisions aimed at implementation, for creating positive changes.
As such, these documents represent a great measure of network strength and effectiveness. Given
the widespread use of plans as the product of the best of an organization’s thought and practice, it is
surprising that plans are not routinely evaluated against accepted plan quality standards. In a
performance based society, people expect to be able to judge how well plans achieve their objectives
and how well the planning processes have been conducted (Berke, Godschaulk 2009).
2.10 Measurement and Plan Quality Tool
To measure plan quality I examined representative plans from each of the four counties and attempt
to measure the quality of the plans they produce. The EPA identified the nine elements of an
excellent watershed plan, which was drawn upon for my study (Scozzafava 2006), to uncover
differences which delineate good plans from plans not as good. The purpose of the EPA study was to
review the ―best‖ watershed-based plan from each State and Territory to evaluate how well
stakeholders are tackling the challenge of developing high-quality watershed-based plans. The
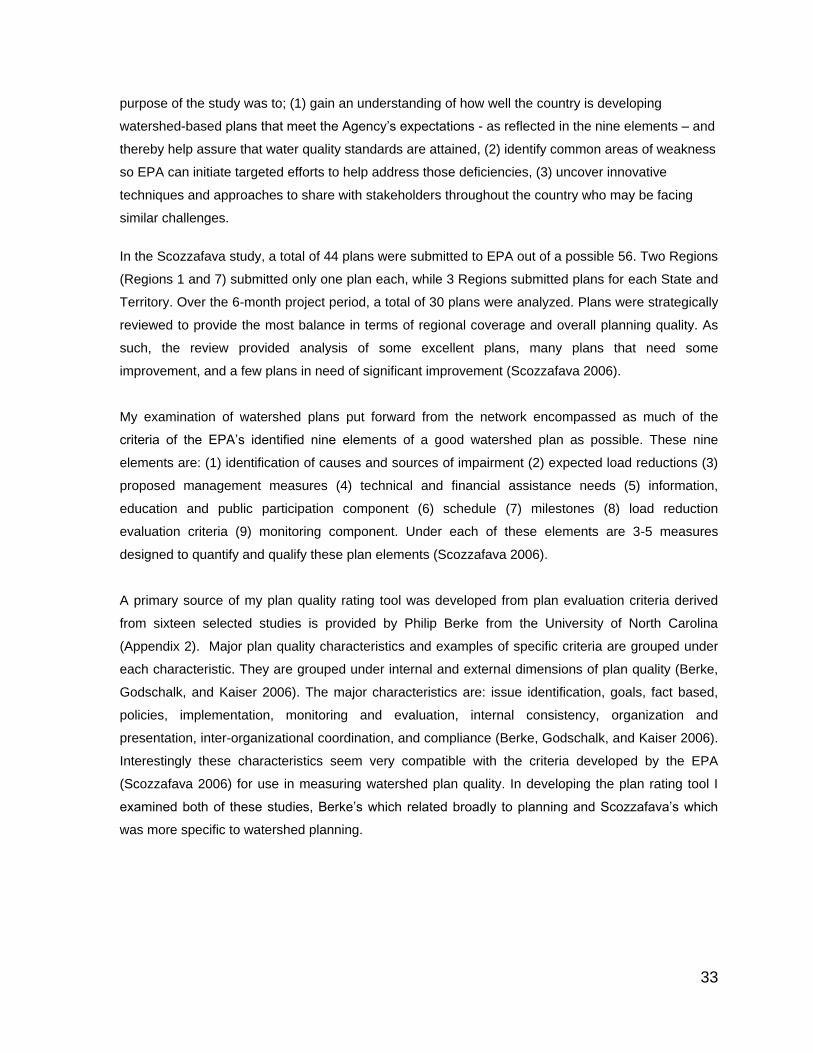
33
purpose of the study was to; (1) gain an understanding of how well the country is developing
watershed-based plans that meet the Agency’s expectations - as reflected in the nine elements – and
thereby help assure that water quality standards are attained, (2) identify common areas of weakness
so EPA can initiate targeted efforts to help address those deficiencies, (3) uncover innovative
techniques and approaches to share with stakeholders throughout the country who may be facing
similar challenges.
In the Scozzafava study, a total of 44 plans were submitted to EPA out of a possible 56. Two Regions
(Regions 1 and 7) submitted only one plan each, while 3 Regions submitted plans for each State and
Territory. Over the 6-month project period, a total of 30 plans were analyzed. Plans were strategically
reviewed to provide the most balance in terms of regional coverage and overall planning quality. As
such, the review provided analysis of some excellent plans, many plans that need some
improvement, and a few plans in need of significant improvement (Scozzafava 2006).
My examination of watershed plans put forward from the network encompassed as much of the
criteria of the EPA’s identified nine elements of a good watershed plan as possible. These nine
elements are: (1) identification of causes and sources of impairment (2) expected load reductions (3)
proposed management measures (4) technical and financial assistance needs (5) information,
education and public participation component (6) schedule (7) milestones (8) load reduction
evaluation criteria (9) monitoring component. Under each of these elements are 3-5 measures
designed to quantify and qualify these plan elements (Scozzafava 2006).
A primary source of my plan quality rating tool was developed from plan evaluation criteria derived
from sixteen selected studies is provided by Philip Berke from the University of North Carolina
(Appendix 2). Major plan quality characteristics and examples of specific criteria are grouped under
each characteristic. They are grouped under internal and external dimensions of plan quality (Berke,
Godschalk, and Kaiser 2006). The major characteristics are: issue identification, goals, fact based,
policies, implementation, monitoring and evaluation, internal consistency, organization and
presentation, inter-organizational coordination, and compliance (Berke, Godschalk, and Kaiser 2006).
Interestingly these characteristics seem very compatible with the criteria developed by the EPA
(Scozzafava 2006) for use in measuring watershed plan quality. In developing the plan rating tool I
examined both of these studies, Berke’s which related broadly to planning and Scozzafava’s which
was more specific to watershed planning.

34
Listed below are the characteristics suggested by Berke and adapted in my study as characteristics
of strong plans (Table 1).
Table 1 Plan Rating Characteristics and Measures
Characteristic/Type Tests/Examples
Issue identification and vision Description of community needs, assets, trends, and future vision Assessment of major issues, trends, and impacts of forecasted change Description of major opportunities for and threats to desirable land use and development A vision that identifies what the community wants to be
Goals Reflections of public values that express desired future land use and development pattern Statements of future desired conditions that reflect breadth of community values
Fact base Analysis of current and future conditions and explanation of reasoning Present and future population and economy Existing land use and land supply, and future land demands for various uses (e.g., housing, commercial, industrial, public facilities) Existing capacity and future demand for public infrastructure State of natural environment resources and constraints Clear maps and tables that support reasoning, and enhance relevance and comprehensibility
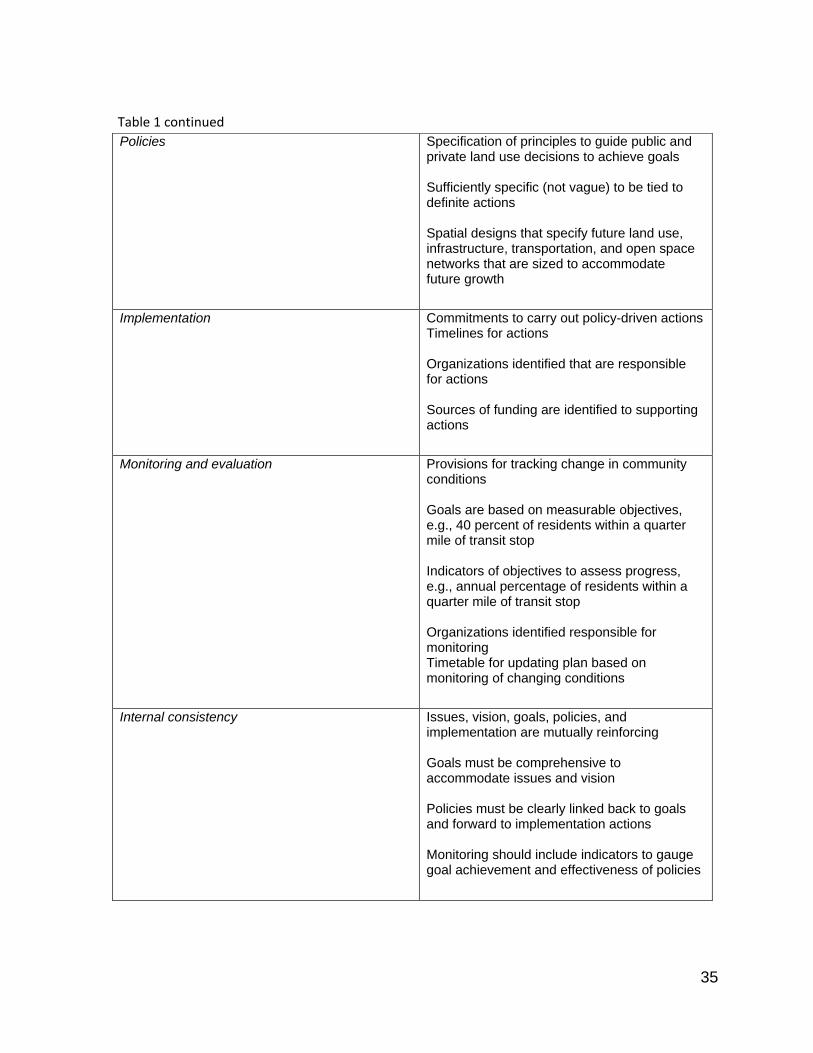
35
Policies Specification of principles to guide public and private land use decisions to achieve goals Sufficiently specific (not vague) to be tied to definite actions Spatial designs that specify future land use, infrastructure, transportation, and open space networks that are sized to accommodate future growth
Implementation Commitments to carry out policy-driven actions Timelines for actions Organizations identified that are responsible for actions Sources of funding are identified to supporting actions
Monitoring and evaluation Provisions for tracking change in community conditions Goals are based on measurable objectives, e.g., 40 percent of residents within a quarter mile of transit stop Indicators of objectives to assess progress, e.g., annual percentage of residents within a quarter mile of transit stop Organizations identified responsible for monitoring Timetable for updating plan based on monitoring of changing conditions
Internal consistency Issues, vision, goals, policies, and implementation are mutually reinforcing Goals must be comprehensive to accommodate issues and vision Policies must be clearly linked back to goals and forward to implementation actions Monitoring should include indicators to gauge goal achievement and effectiveness of policies
Table 1 continued
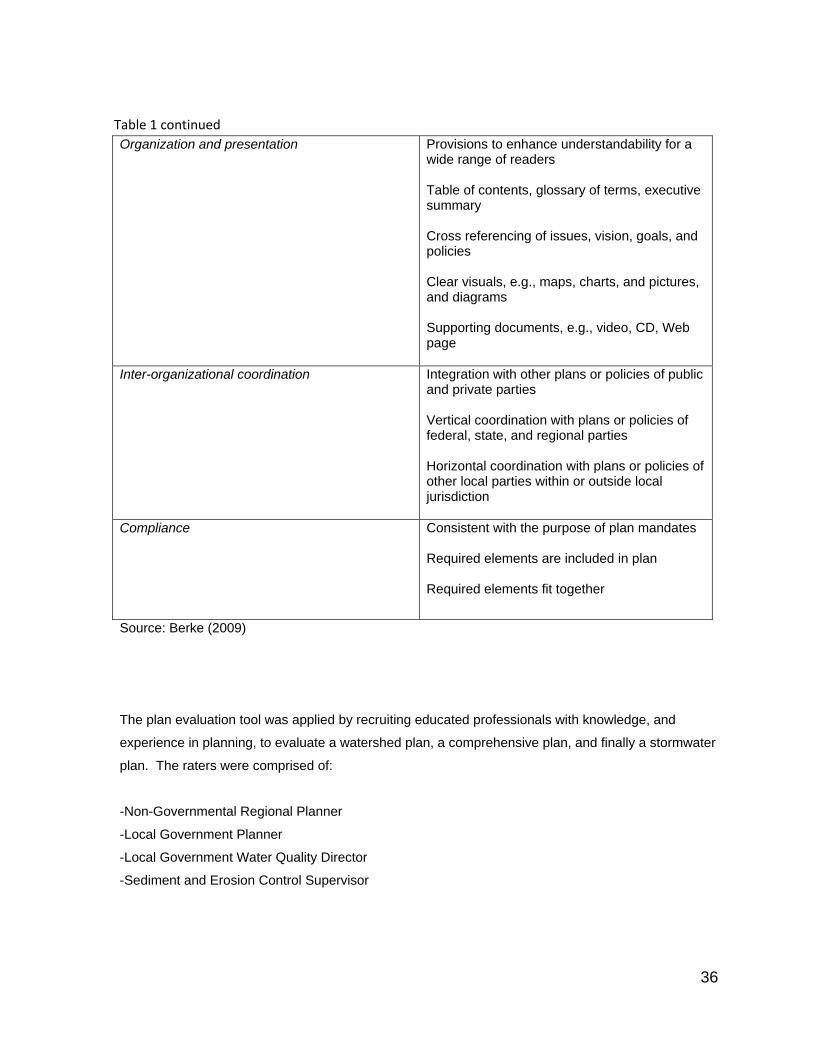
36
Source: Berke (2009)
The plan evaluation tool was applied by recruiting educated professionals with knowledge, and
experience in planning, to evaluate a watershed plan, a comprehensive plan, and finally a stormwater
plan. The raters were comprised of:
-Non-Governmental Regional Planner
-Local Government Planner
-Local Government Water Quality Director
-Sediment and Erosion Control Supervisor
Organization and presentation Provisions to enhance understandability for a wide range of readers Table of contents, glossary of terms, executive summary Cross referencing of issues, vision, goals, and policies Clear visuals, e.g., maps, charts, and pictures, and diagrams Supporting documents, e.g., video, CD, Web page
Inter-organizational coordination Integration with other plans or policies of public and private parties Vertical coordination with plans or policies of federal, state, and regional parties Horizontal coordination with plans or policies of other local parties within or outside local jurisdiction
Compliance Consistent with the purpose of plan mandates Required elements are included in plan Required elements fit together
Table 1 continued
37
-State Office, Soil and Water Conservation Service, Program Manager
-Two State Regional Watershed Planners
-Two County Cooperative Service Extension Directors
-Two Cooperative Service Extension Agents, Water Quality Specialists
-City Park Manager
The raters selected did not work, or live in the county whose plans they evaluated to remove some
rater bias. In most cases raters spent several hours reading through each plan and then answering
and scoring a battery of evaluation questions (appendix I). Using this method I was able to look for
variation within each county for plan quality type, and then look at all of the plans collectively to see if
there were strong commonalities in either strength or weakness that could be found in all of the plans.
2.11 303d Listing
All states are required by section 303 (d) of the 1972 Clean Water Act (CWA) to develop TMDL’s
(total maximum daily loads) for water bodies that are impaired and too polluted to maintain their
beneficial uses. (DWQ Web Site, http://portal.ncdenr.org/web/wq). This list is published on a regular
basis for all of North Carolina. Waters placed on the list are those waters that have been tested
through recognized monitoring techniques and measured against recognized standards as having not
met their intended purpose. The purpose could be recreational, drinking water, habitat etc. This list
provides some measure and a formal and verifiable tool to assess water quality for each county in
North Carolina. By assessing the total 303d stream miles in 2006 and comparing them with 2010 303
(d) listing of stream miles and calculating the rate of increase of miles of impaired stream in each
county, some estimation of water quality trends can be determined.
Data used for water quality assessment and determining inclusion on the 303d list is primarily
collected by DWQ's Ambient Monitoring System, NPDES Discharge Monitoring Coalitions and
Biological Assessment Unit, the NC DENR Division of Environmental Health, and the United States
Geological Survey. Local governments and environmental groups as well as industry, municipal and
university coalitions also provide data. The data is collected in an equal percentage by county in
North Carolina every two years. The percentage of streams will likely continue to grow simply by the
continuing process of checking more streams.
The inclusion of a stream on the 303d list is also based on the waters intended purpose. Waters can
be used for drinking water or recreational use, both which carry different standards. Depending on the
38
differing inventory of classified waters in each county the standards could be more stringent or less
stringent compared to other counties. Collectively these increases evidenced in the data should be
viewed more directionally as a view to water quality supported by science then as a precise
accounting of water quality in each county.
2.12 Data Analysis
As a final part of my study, I examined the networks and the plans from each of my four case studies
to see if in fact a relationship exists between strong networks and plan quality, and if these networks
and plans really do have the ability to improve water quality in any measurable way (survey question
on water quality perception) which can be detected in the streams (303d listing). Findings that
indicate improvement through stronger networks, or that do not indicate improvement, will provide
helpful information for watershed managers and governance of the networks. Findings of
improvement or not, as a result of strong planning will also provide valuable insight which can be
used to improve efforts in watershed management.
I generated data based on a sound platform of network theory and literature review to support data
collected through web-based research, and surveys. I examined causation for effective networks,
quality plans, and watershed improvement, performed cross-case analysis to look for synthesizing
themes, and for determination of causation in individual case studies.
39
Chapter 3 Literature Review 3.1 Networks and Policy Formation Network theory is a helpful framework and theory, which aids in the understanding of organizations in
which entities organize not according to hierarchy, but according to needs which are linked together
to share resources and achieve common goals. A great deal of the environmental community at the
state and local level operate in this way, working in concert with private interests and non-
governmental organizations (NGOs), which made network theory a helpful model for thinking about
managing watersheds. As cooperation occurs, it creates a linked form of organizational entities
moving in a singular way, sharing resources, bargaining, and achieving common goals.
3.1.1 Network Definitions
The term ―network‖ has become synonymous with the term organizational complexity. In the article
―Organizing Babylon-on the different conceptions of policy networks‖ several key points are brought
forward. First, that the common definition of policy networks is a set of stable relationships that is
non-hierarchal, interdependent of each other, and links a variety of actors. These actors and groups
at their core have interest in sharing resources and information in order to advance towards common
goals. With this definition in place the case is made that the use of the term networks remains vague,
and not useful, as a model or theory that has predictive properties helpful for the practitioner. Borzel
goes on to discuss differences between the Anglo/American understanding of policy networks and the
German understanding of the same. The Anglo American understanding helps understand how
society and government interact in given issue areas. Examples might be the Sierra Club and a
timber association as they interact and influence policy with the EPA and Forest Service regarding
buffer policy in the West. In the German conception of networks they would see an arrangement with
stronger links between the state and societal interests, in which networks actually present an
alternative to the hierarchal method of government or market driven influences. In this way they
become more of a true collaborative partner as opposed to being merely an influencer of a policy.
This model in local government is often seen in the social services arena, in which money in the form
of grants is put forward to programs from the NGO sector, and are aimed at satisfying needs of both
local government, and societal, and NGO interests. In some cases the NGO interests can become so
embedded in the government interest that they actually become the primary driver of policy. This is
more the model put forward in the German framework and understanding of networks. The article
goes on to suggest that to sift thought the plethora of material on network policy that has been
recently published a couple of distinctions need to be made at the outset. (Borzel 1998)
40
First, a distinction needs to be made between qualitative and quantitative analysis. While both are
valid analytical tools, the quantitative approach looks at measurable things like cohesion, special
distance in hierarchy, classifications etc. Conversely, the qualitative approach is more process
oriented. The second distinction that should be made when examining the literature between the
viewing of policy networks, is if policy networks are being viewed as a form of governance, or as a
typology of interest intermediation (German versus Anglo understanding of policy networks) (Borzel
1998). Watershed networks can and do operate in both of these paradigms.
The distinctions between these two models are the primary focus of the article, with a detailed
explanation of the interest intermediation model. A great deal of focus is given to the kinds of
relationships that exist between public and private entities, and on the non-hierarchal coordination
employed to get policy created. A number of typologies have been developed to look at the way
policy networks operate in this model. In one such typology developed by Grant and Jordan there are
three main criteria; (1) level of Institutionalism, stable/unstable, (2) scope of policy-making
arrangement, sectoral/trans-sectoral, (3) number of participants, restricted or open. Another typology
developed by Frans Van Waarden looks at seven typologies: (1) actors, (2) function, (3) structure, (4)
Institutionalism, (5) rules of conduct, (6) power relations, and (7) strategies of actors. Kriesi develops
a simplified typology by breaking networks into two types of structural organization (corporatism and
pluralism) and two models of relations between state and interest groups in the process (Borzel
1998). Notable in all the typologies listed in the literature is the recognition of the role of interpersonal
and inter-organizational relations between entities. Much of this analysis is missing from many of the
widely used policy theories of rational choice, and which give network policy theory more richness,
usefulness and ultimately more predictive power for the practitioner in the area of watershed
management.
In Jerry Pressman and Aaron Wildasky’s (1968) work ―The Oakland Project‖ which studies the
question of implementation within a network, some troubling principles are highlighted which may
point to some of the challenges in the development of policy within networks. As they point out, the
more decision points of influence, that go into reaching the goal (in this case the development of a
policy), the more likely it is the outcome is going to fail (Pressman and Wildasky 1978). This
complexity effect, which they point to, calls us to develop evaluative tools to better understand if
networks do in fact work. It would make the case that watershed collaborative networks have
embedded within them great problems of implementation. In the case of watershed management as it
develops in urban North Carolina Counties a great deal can be understood about how things develop,
41
and the success or failure of a given policy by understanding some of the strength of relations among
groups, their ideologies, and the nature of their institutions, and strategies and drivers employed.
3.1.2 Public Networks
In the article by Provan and Milward (2001), entitled; ―Do Networks Really Work? A Framework for
Evaluating Public Sector Organizational Networks‖, an effort is made at going beyond the use of
network theory as a descriptive tool. The article is helpful, in that it is advancing the conversation
beyond the existence of networks, or its use as simply a descriptive piece. A framework is suggested
for trying to evaluate whether networks really deliver good service for scarce dollars and resources. It
assumes networks exist and form policy, but pursues the question; is it the most effective and
efficient way of doing things? While many NGO’s would not be overly concerned with the point, those
in government should be very interested in the point as they are held more accountable for public
funds and meeting public purposes efficiently (Provan , Milward 2001).
One example of how a network operates in a North Carolina county, were efforts aimed at removing
303d listed streams from the EPA list. In order to accomplish this, it requires a collaborative
watershed planning process, which involves creating a network or federal, state, local, private
landowners and NGO’s to engage in an effort to perform detailed and scientific analysis of a
watershed. The ultimate aim of the collaboration/plan is to create a catalogue of projects that can
provide lift and improvement in the watershed. To accomplish this, stakeholder groups are used, one
a technical advisory committee and the other a general stakeholder group. While reasons,
motivations and some goals for participation vary widely; skills, knowledge and resources are shared
across all levels of government and private sector work toward the common goal of improving the
watershed.
The article by Provan gives us a toolbox that could be used in this process to evaluate the worth of
this multi-agency endeavor. The article begins to take us down the road of unpacking network
complexity and giving evaluative criteria for assessing its value and effectiveness of each level of the
network. Three levels of analysis are put forward with differing stakeholder groups and evaluation
criteria are attached to each. The first is the community level of analysis. Community in the article is
identified as that broad group that is served by the network. In this case we’ll call it the citizens of a
North Carolina county. The second level of analysis is the network level of analysis. This would
constitute all of the principals and agents in the network cooperating together, while still remaining
autonomous. It would cover things like transaction costs for collaborating, and all of the effort that
goes into maintaining the network. In the case of local watershed planning in a county, It could be a
42
collection of agencies like EEP, CWMTF, EPA, DWQ, various local governments, the Trust for Public
Land, the Triangle Land Conservancy, the Watershed Protection Society, and a private firm used to
manage a stakeholder process, etc. etc. The third level of analysis would be the
organization/participant level. This would include all agents and clients. It would represent as a
category, all of the providers of service (agencies) and the clients or constituency they are serving
through the network. In the case of North Carolina county watershed planning, we’ll call them the
agencies working on the plan and implementation, and the environmental and development
community which are the clients being served through the process through environmentally
responsible mitigation for impacts.
When looking at evaluating community level of analysis one would look to criteria like cost to the
community, building of social capital, public perceptions that a problem is being addressed etc. In the
county example of watershed planning to develop mitagatable projects, this would mean measures
like, are roads and schools and other public infrastructure being held up due to issues of mitigation?
What is the cost per acre to the developer to mitigate for a project? What is the number of projects
being implemented through the plan? Does the public have an awareness of the plan and its ability to
do good for the community? In the case of evaluating at the network level of analysis, effectiveness
criteria would be things like range of services provided, absence of service duplication, and cost of
coordinating the network. In the county example this might be things such as: the use of one lab for
water sampling for the project, one agreed upon agency to interpret results, number of dollars put
forward to manage a stakeholder group and technical advisory group across agencies etc.
Effectiveness criteria for evaluating at the organization/participant level of analysis would be things
such as the amount of conflict between agencies/programs across networks, cost of services,
perceptions of organizational legitimacy, etc. In my example this would be an assessment of things
like: (1) dollars spent by organizations in support of the development of a watershed plan, (2) number
of conflicts between agencies and across networks and, (3) is the agency’s stature/legitimacy
enhanced or degraded by participation in the local watershed planning process.
In total, the article does a good job of moving beyond the identification and mechanics of networks,
looking into organizations and suggesting evaluative measures. The evaluation measures pointed
too, however, are too imprecise to operationalize, but certainly lays the groundwork for the
practitioner to develop the appropriate measures for evaluating networks. This discussion, in the
evolution of the theory, is more helpful and advancing than dwelling on definitions for the practitioner.
Additionally, I think the author is trying to encourage the building of a metrics for the
researcher/practitioner to use. The challenge seems to be that every group will define success
43
differently, and criteria will vary accordingly, which I think makes meaningful evaluation difficult,
potentially just a self-affirming exercise. Intuitively, to me, it would seem that a universal metrics for
the overall network goals is needed, and a common criteria, in order to be a more effective tool.
3.1.3 Organizational Networks
Building on the work of Provan, a recent work by Scott Davis entitled ―Networks in and around
Organizations: Rational, Natural, and Open System Perspectives, Davis argues that Network thinking
have its routes in sociology. Modern analysis has elevated networks beyond a metaphor to formal
methods of analysis. Davis views three primary analytical levels for network analysis: (1) the ego
network-how many, and what kind of acquaintances, (2) overall network-actors and relationships
within domain, (3) network position/nature of relationships being mapped or looked at.
This type of analysis suggests several measures for analysis, things like an examination of distance,
centrality, closeness, clustering, equivalence, density, and centralization. These types of measures
are well known, tested and can be easily applied to network evaluation. Networks also provide a great
way to visualize and analyze patterns of relationships among organizational parts, including
information flows, resources, and authority. The use of network theory can help provide a typology for
describing organization: functional, divisional, matrix etc. However, there remains, a great deal of
additional research that can be done to expand the usefulness of network theory, and useful
measures for analysis (Davis 2007).
In another article on networks by Nohria, ―Is a network perspective a useful way of studying
organizations?‖ the argument is made that network theory is supremely important to understanding
organizations. Three main reasons are highlighted which give rise to the use and interest in network
theory are; (1) two decades of experience with small entrepreneurial firms with easily identifiable
linkages and networks as a part of their make-up, (2.) Disaggregated flexible production
arrangements have become very normative, (3.) the maturing and increased interest by academia in
using network analysis to view organizations. Several underlying assumptions are in play, which are
presumed to make network analysis valid. First social networks are at work within organizations.
Secondly, an organizations environment is rightly seen as a network of other environments. Thirdly,
the actions of individuals are best explained by their positions within networks. Fourthly, networks
both constrain actions and are shaped and influenced by them. Lastly, any meaningful analysis of
organizations need take into account the characteristics of their network. The article goes on to make
the point that network analysis should be the most dominant theory in use to understand
organizations, because it is adaptable to many differing units of analysis. It is also Nohria argues
44
perhaps the most able of organization theories to provide a true predicative theory, and accordingly it
has become most helpful for use by practitioners (Nohria 1992).
3.1.4 Watershed Planning Networks
In the case of watershed management at the county level, network theory provides a great deal of
explanatory power. Agencies are unable to exercise their will in any singular way, essentially
requiring the creation of a network to achieve goals. In that case, the EPA has a regulatory
requirement passed on to the state in order to mitigate for impacts at the local level. Local
government assesses and collects fees from developers for this impact. The state needs to find and
implement mitigation projects, but typically possess limited local contacts, which are needed to
implement projects in the field. In order to have an approved list of projects, there is a requirement to
have engaged in a local watershed plan, or some approximation of that process. Local land
developers and local government need projects in order to be able to keep developing. State and
federal organizations have the expertise and regulatory authority to produce the projects. The net
result of all of this delineation of interests, roles, knowledge and skills is to highlight a web or network
of interdependence to achieve environmental goals. Only network theory is in a position to cobble all
of these parts together into a meaningful whole, and help us understand the complexity of process
and interactions as it unfolds.
3.1.5 Network Theory Utility for Local Government
Network theory as applied to North Carolina counties would lead me to identify every agency involved
in environmental crafting environmental policy in the county, and all entities with a real interest in the
policy issue. Beyond identification, I would want to look at the mission, goals and objective of each
collective entity. A further examination would focus on interactions in between these agencies/groups,
how they happen, when and why. I would also want to examine the strength of those relationships in
between each agency, and consider the power that each holds in the overall process. Analysis of the
development of a county environmental policy should also take place over some reasonably long time
horizon to ensure the process is understood and somewhat stable in the way it operates.
Development of some form of measuring or metrics to determine the effectiveness of the network
should be determined and applied. This metrics would look at effectiveness from multiple
perspectives within the network, such as: the overall network effectiveness, the effectiveness of the
network to the overall community, and the effectiveness of the network in serving individual clients or
the smallest unit of analysis available. The researcher and practitioner would have the aim to be able
to determine through this analysis to identify and understand the network, assess the effectiveness of
the network, and recommend improvements to the network, to make it more effective.
45
Network theory regardless of the model being used is largely recognition that policy is now being
formed without a strict division between society and state. The question then seems to be not so
much is Network Theory an adequate reflection of how policy develops, but how does one manage
the coordination activity within networks to ensure the best possible outcomes? One of the
weaknesses of the theory/model is that much of the research looked at, largely leaves the effort at
evaluating public agency networks as a framework for understanding, and adds little to the discussion
of how to measure and use this model.
There are a number of merits to using network theory in understanding policy approaches in local
government, which are unique to local government, and make it more applicable then its application
to understanding national/global issues. To further explain this applicability, consider there is a
tremendous delineation of responsibility among all levels of government, NGOs and society when
broken down to the local level. Consider also local governments responsibility is very plural, covering
environment, development, health, safety, transportation and schools. As one goes further up in the
federal form of government, agencies become much larger, more singular in focus, and further
removed from direct contact with constituents. Another distinction is that all of the stakeholders in a
local government network typically live, work and play, in the area where environmental policy is
deliberated, decided upon and implemented. All of the entities and actors also possess legitimate
legal and professional interests at the local level. The local government network possesses the
smallest units of influence with the most players. This creates unique, dynamic, and intricate networks
at the local level.
3.1.6 Wake County Watershed Network Examples
Borgatti and Foster (2003) argue network theory has the ability to be used as a new research
typology, which could encompass all of the classic dimensions of explanatory goals, styles, and
mechanisms. A great deal of research has been conducted on things like, social capital,
embededness, organizational networks, knowledge management, group processes and the like, but
have not been fully integrated into network theory. Network theory presents an opportunity to pull all
of these together and give them meaning and use. Network theory then would suggest that an analyst
should be focused on multiple actors, and multiple forces with both formal and informal authority,
seeking at least some interests in common, and sharing resources and information. These
interactions should be looked at as part of a system or total network. In this way network theory
becomes more helpful then a stand-alone understanding of policy formation, but rather, becomes an
46
integration of many theories, providing practical understanding and predictive properties to the
practitioner.
When examining the formation of environmental policy in Wake County, North Carolina, there are a
number of drivers that form and fashion environmental policy, and which highlight this complexity of
interactions. One of the first of these drivers is the Neuse River Rules. Simplified, they provide for
mandatory buffer requirements along streams to serve as a filter for nitrogen, nutrients and other
pollutants entering the water. Excessive nitrogen into the water supply helps fuel powerful algae
blooms, which consume oxygen, which in turn kill fish and other aquatic life. The rules additionally
require developers of land to pay into a nutrient offset fund, which helps pay for projects to provide
remedy to the problem that has been created. Projects are then created which off-set impacts, like
buffer restoration and enhancement, stream restoration, and creation of stormwater control devices.
Local government collects these fees, and the North Carolina Department of Natural Resources and
the Environment spends the funds through one of its programs known as the Ecosystem
Enhancement Program. Most of the projects they perform must meet the approval of both state and
federal agencies.
Another major driver of environmental policy at the local level is the Clean Water Act, which basically
says to anyone disturbing land, there can be no net loss of wetlands. In short this means if you build a
highway, a mall, a school, a residential development, and you disturb wetlands, you must replace
those wetlands, as close to the impact as possible. Again funds are paid to the state and work is
performed through EEP, or in some cases the Army Corps of Engineers. More recently, private
mitigation bankers have entered the network, providing yet more complexity. Another driver of
environmental policy within Wake County is the EPA designation of a 303d listed stream. The listing
communicates to local government and the state that you have waters that are not living up to their
intended purposes, and they are impaired. Placement on the list ultimately leads local and state
government to begin to seek a remedy and to develop a plan to address the problem, most often
through the development of a TMDL or Total Maximum Dailey Load for the primary pollutants. A
TMDL ultimately leads to more regulation and more money being spent to address the problems at
the local level. At some point should the TMDL fail, the federal government through the Clean Water
Act must step in and require local government to fix the problem. Other related drivers worth
mentioning are local land use planning, sediment and erosion control programs to handle run-off
during construction, and permanent stormwater control devices to handle water conveyance during
storms and peak flow.
47
3.1.7 Analytical Implications
All of these drivers taken in whole are the result of two primary forces; development and its impacts,
and regulation aimed at lessening those impacts and protecting natural resources. The tensions
between these two are then managed by dozens of political entities in local, state and federal
government. Unpacking, and understanding relationships are best done through selecting appropriate
models which can reduce a complicated network to becoming understandable. Understanding these
interrelationships, goals and programs, should lead to better effectives, efficiencies, and organization
of the network. It should also lead us to some predictive properties that would assist the policy analyst
in managing a network in the best way. Policy that is developed through this understanding can then
be used by politicians, and practitioners to improve services, meet goals, and better protect our
natural resources.
In the article by Salancik (1995), titled ―Wanted: A good network theory of organization‖, the case is
made that a good theory of network analysis is needed. Network theory can give the researcher and
practitioner the ability to see the forest for the trees in interactions in and among organizations. Most
network analysis focuses on how networks affect the flow of information and resources to individual
actors. These interactions are the building blocks of networks. If we are not careful, we can over focus
on the interactions rather than trying to understand them as a whole. Some networks exist and cease
to exist over mandates, interpersonal friendships, and proximity, individual or collective action. The
potential exists to interpret chance interactions from designed interactions and point to irrelevant
phenomenon. The use of Network Theory can do two things to assist in better understanding; (1)
propose how adding or subtracting a particular interaction in an organizational network will change
coordination among actors in the network, (2) propose a network structure that enables or disables
interactions between two parties. In short, Salancik argues, a network theory that understands the
how and when interactions come into being may be more useful then understanding the mechanics of
networks in seeing how collective action happens (Salancik 1995).
One interesting paradox from literature is the interesting paradox raised by an article by Robert
Hardin entitled ―The Tragedy of the Commons‖. In addition to giving us some pause, it also
demonstrates some of the nuance that exists within any system, giving yet more weight to a systems
model for understanding the development of environmental policy. The paradox is a helpful
model/metaphor in helping to understand environmental policy because of its grounding in a life
sustaining natural resource. Most rational choice economic models presume or hold as an underlying
48
assumption that self-interest creates efficiency and the greatest good for the most people. In other
words left to their own devise, and trying to maximize self-gain, two entities sharing a common
resource will likely result in the third best result, with both losing out. In starkest terms, the model
suggests that rational creatures left unchecked, will not cooperate even to their own long-term benefit
(Ostrom 1990).
Hardin’s work raises the question particularly apt in environmental policy as to whether or not pursuit
of individual interests will ultimately only lead to a destructive outcome, without intervention for the
collective good. In Hardin’s commons everyone is free to graze their cattle on the commons at will, as
much as they want. Everyone driven by individual interest and short-term gain, overgraze the
commons, leading ultimately to the destruction of the commons. Hardin asks the reader to consider
what would happen if each farmer would keep adding an additional animal, finding it more profitable
to graze an additional animal at no extra cost. Each takes extra profit at only a fraction of the cost for
overgrazing. The result is the destruction of all that is held in common and the ruin of all of the
farmer’s collective resource (Hardin 1968). Although each was behaving in an individually rational
way, it led to the collective ruin of all. It highlights the divergence between being rational at the
individual level and being rational for the collective good.
In an article entitled ―The Tragedy of the Commons‖: 22 Years later‖ by Feeny, Berkes, McCay and
Acheson (1990) they attempt to place the example in the context of natural resource protection with
modern mechanisms and institutional arrangements aimed at control within the commons. They talk
about resources, of common property like: wildlife, surface waters, forests, and fisheries, all of which
have two properties in common. The first property is excludability, which basically assumes that
preventing access and use in many cases will be difficult if not impossible.
The second property is that of subtractability, which indicates that the resource when used by one will
subtract form the welfare of other users. This first property, excludability is the source of divergence
between individual and collective rationality in its use. The authors argue, convincingly, that both the
state and private property interests have the ability to adequately exclude open access, which is a
source of consternation in Hardin’s model. It was interesting to note that Hardin’s work is most often
used to point towards the need for government intervention and action, but as this article makes the
point, private property rights also have the ability to protect the commons in a similar way. Private

49
property rights are fueled by self-interest and restrict open access, both of which are important
features in Hardin’s model (Feeny, Berkes, McCay, Acheson 1990).
As Deborah Stone (2002) puts it in her book entitled Policy Paradox, ―Policy is potentially a sphere of
rational analysis, objectivity, allegiance to the truth, and pursuit of the well-being of society as a
whole. Politics is the sphere of emotion and passion, irrationality, self-interest, shortsightedness, and
raw power‖ (Stone 2002, page 376). In short, she is describing network and network theory as
perhaps the best reflection on how policy is developed. The policy scientist operating with network
theory needs to unpack the weight and connectivity of each of those forces. All of these attributes are
magnified when dealing in a policy arena like natural resources, which are held collectively, have
open access, and in which decisions impact things like current and future populations, economies,
and sustainability.
One final interesting piece of research shows how differing value systems within networks can
influence decision-making. The research demonstrates how employees within the Forest Service
viewed natural resources from either a commodity-based perspective or from a larger more diverse
eco-system perspective. The conclusion was that values and perspective made a very big difference
in the way decisions were made and in the way agencies related to one another (Martin, Ingrid M.,
and Toddi Steelman. 2004).
3.2 Planning Literature
Nearly all of the planning literature evaluates plan quality with measures such as; goals, participation,
implementation, factually based, funding mechanisms, presentation, monitoring, evaluation etc.
(Brody 2003, Berke and Godschalk 2009, Hopkins 2001,Norton 2005, and Berke 2006). Less
quantifiable factors include the composition of stakeholder groups, the role of the individual in the
process, when and where to employ a planning process, is it ecologically sustainable.
Knowing what plans are and are not may be the first step to better application in the watershed
planning process. One book titled the ―Urban Development: the logic of making plans‖ (Hopkins
2001), makes the case that plan-making is more difficult than many imagine. Second, the general
belief that plans are a substitute for decision-making processes is incorrect. Plans are only tools to
help people make decisions, and, depending on the situation, may have only limited application.
Plans alone can’t overcome the difficulties of 'social cognition' (individuals as a source of the interests
50
of the group) or the 'aggregation of preference' (the collected preferences of individuals) that societies
face. We need to know when planning works and when another approach is more appropriate.
Hopkins (2001), points out plan-making is not an activity exclusive to the public-sector, and that plans
are not regulations in themselves, but they are important to the creation of regulations. Finally,
knowing when to use plans and knowing how to make plans is fundamental to the profession of
planning to be effective. In short it is important for the practitioner to recognize that planning and
plans are a process of conversation, an aggregation of thoughts and preferences. How well this takes
place is much more art than science and may well dictate the ability of a plan to articulate policy and
intentions and implementation.
While collaborative watershed partnerships are a commonly used strategy for solving complex natural
resource problems, little theory regarding collaborative partnership design is available to guide policy
makers and their implementation efforts. Bidwell and Ryan (2006), examined 29 watershed
partnerships it concluded, confirming previous research that the composition of network groups is
related around outcomes, and that organizational affiliation is related to both composition and
activities. As such independent partnerships were more likely to conduct scientific assessments and
conduct planning while, agency affiliated partnerships would focus on specific projects. The study
went on to point out that the independent partnerships developed their priorities internally, agency led
partnerships adopted the strategies of their organization.
All of this highlights the need for diverse participation, proper incentives, and consideration of what
stakeholders can and can’t do when forming collaborative groups within the watershed networks. For
a watershed manager to be effective they must contend with conflicts that will run deeper then
economic development versus sustainability. In order to be successful they will need to build a
community based infrastructure that will support and take account of diverse social and bioregional
interests, networks, and partnerships (McGinnis, Woolley, Gamman 1999).
3.2.1 Sustainable Development
Another consideration of watershed planning should be the growing base of knowledge which is
looking at the premise upon which many plans are built. They are in most cases still aimed at
planning for the built environment in a limited planning horizon. Particularly in the sphere of
watershed protection, many of these plans may ultimately despite their best intentions be
51
unsustainable for the heath and benefit for future generations, and deal with a limited planning
horizon. The World Commission of Environment and Development defines the word sustainable as
this: ―Sustainable development is development that meets the needs of the present generation
without compromising the needs of the present generation without compromising the ability of future
generations to meet their own needs‖ (World Commission on Environment and Development-Report
June 1987).
In a study which looked at 30 comprehensive plans to understand the use of the concept of
sustainable development in plan development, plans were found to be lacking. The study found two
interesting things: (1) the inclusion of sustainable development as an organizing concept had no
effect on how well the plans actually promoted its principles, (2) plans do not take a balanced holistic
approach to guiding development and moving toward sustainability. Instead they focus narrowly on
creating more livable built environments, which is the historic mainstream focus of plans (Berke,
Conroy 2000). Most watershed plans created within their network driven by the TMDL process also
share this weakness, in that the 303d listing of streams is essentially an expression of waters not
living up to their intended purposes. In most cases this means supporting livable, built environments,
such as drinking water and recreation.
In contrast to planning around built environments, some planners have begun considering a strategic
approach to conservation and development that channels growth and preserves lands into suitable
locations. This type of planning considers green infrastructure which is defined as the interconnected
network of waterways, wetlands, woodlands, wildlife habitats, and other natural areas that sustain air
and water resources which in turn maintain health and quality of life. (McDonald, Allen, O’Conner
2005)
One of the challenges when talking about the influence of quality of life issues in planning, like
buffers, open spaces, clean air, and ecosystems are they are hard to define, and quantify in a way
that development efforts have a much easier quantifiable way of happening. Science was developed
to deal with ―tame problems‖, whereas some of the more social or quality of life issues can be defined
as ―wicked problems‖ with no optimal solutions, unless severe qualifications are first imposed (Horst,
Webber 1973). It is difficult for us to recognize or even value many ecosystem services like
greenways, clean air, recreation, let alone the value of biodiversity and its importance in the delivery

52
of life giving systems. In many cases added to that is that many impacts do not occur immediately but
will register often generations of later.
53
3.2.2 Watershed Planning
Watersheds span sections of entire states, and sometimes drain entire regions depending on the
hydrologic unit being looked at. These ecological boundaries are increasingly being used as practical
boundaries for land use planning (Barham 2001). This means watershed planning will cross the poor
and rural, and the rich and urban, and everything in between. With limited capacities for funding,
expertise, and more felt needs by the community, the ability for many jurisdictions to plan and
implement effectively in the watershed are limited. A recent study (Brody, Highfield, Carrasco 2004)
examined watershed planning capabilities of local jurisdictions and found that strong planning efforts
came from jurisdictions with high levels of disturbance, large, wealthy and educated populations that
possess a high degree of planning capability to address complex environmental issues. In working
with watershed planning this can be problematic when planning for watersheds from an ecosystem
perspective with huge geographic boundaries which span both rural and economically challenged
areas as well as urban areas with robust economies. From the viewpoint of the watershed one
jurisdiction is likely as important in protecting and preserving water quality. The watersheds
importance by jurisdiction will likely be influenced more by things like geography, slope, and size.
Despite this reality the literature seems to indicate that plan quality follows affluence and education.
One study examined 20 coastal counties and 72 municipalities in coastal North Carolina and found
them to be weak analytically and substantively, providing limited guidance for growth management
(Norton 2005). The difficulty may be in part the rural nature of North Carolina and the lack of planning
expertise. This lack of expertise and resources in rural counties may have lead many of the
jurisdictions in the study to rely on consultants. In fact in the study an overreliance on consultants was
recognized to be common practice because of the belief that a consultant would produce the plan and
deliver a result that was expected. This created formulaic, boiler plate plans that were not particularly
helpful in innovation and implementation (Norton 2005).
When looking at the vital component of stakeholder participation in the planning process a number of
interesting observations come from the literature. Intentionally or unintentionally planning stakeholder
groups get comprised of the interested, available and compatible. Hotch (2007) points out that
seemingly incompatible viewpoints can provide complimentary insights into the planning process
without distorting or diminishing the differences, creating better plans. This shows the need for
thought and care in the composition of stakeholder groups. Stakeholder participation in the watershed
planning process is usually assumed to be critical to the success of the plan and ultimately its

54
adoption and implementation. Few studies have been done however which test this out empirically.
Brody (2003) looked at this question and tested the relationship between community participation and
the quality of local watershed plans associated with the long term management of ecological systems.
The results came back which do in fact show the presence of stakeholders do make a positive
difference. What was interesting in the study was that the presence of certain stakeholders makes a
huge difference. The participation of industry in the planning process and their knowledge of the
critical habitats helped produce innovative ideas on how to manage areas in a sustainable way
(Brody 2003). This speaks in part to the need to produce stakeholder groups that are representative
of the community and not simply created among friendly stakeholder groups which have a similar
orientation toward planning and the environment.
With all of the effort going into planning at the local level, it is right to ask the question: are we getting
better at making plans? One study examined the quality of plan making over time. It found that indeed
that planners, communities, and other contributors are in fact learning to make better plans over time.
Several qualities were found to be influencing the quality of plans. Plans that were driven by specific
problems or were tied to specific properties, or driven by policy making momentum were found to be
of higher quality. Stakeholder group participation were also found to be important in boosting the
collective planning capacity by bringing knowledge, expertise, and resources to the planning process
(Brody 2003).
Finally the role of the individual to lift or confound the process can’t be overlooked. In the classic
piece entitled ―Street Level Bureacracy‖ by Lipsky (1980), he explores the role and power of line level
employees to interpret and implement policy decisions, and the huge amount of discretion they have
to make things work according to plan or policy and also the reverse. This is almost certainly the case
within watershed management networks where a complex network of actors make decisions as part
of an aggregate effort, but never completely lose sight of their own agencies direction and goals, or
perhaps don’t agree with an agencies direction and slow or change the direction of a policy or plan.
3.3 Water Quality Literature
Investigations conducted under the Clean Water Act and Soil and Conservation Resources Act found
non-point sources of pollution to be a significant contributor to polluting the nation’s waters. Eroded
sediment, nutrients, pesticides, oxygen demanding wastes, continue to cause huge problems in the
watershed. A great deal is known about how to manage these problems and reduce loading. The
55
challenge is to know how to implement these practices in a cost effective way. Interagency
cooperation must be fostered and targeted to hot spots within the watershed. This is preferable to
spending billions each year to treat symptoms of the problem (Duda and Johnson 1985).
For the past century water quality issues have largely been addressed by single function state and
federal agencies. Decision making has been largely technocratic in nature. This approach has come
under a great deal of criticism in recent years, which in part reflects the complexity of watershed
issues. Competition for this limited resource from agriculture, industrial users, development,
recreationists, fisheries as well as requirements form the Clean Water Act and its corresponding
TMDL process have created a general era of dissatisfaction with the management of these resources
(Sabatier, Focht, Lubell, Trachtenburg, Vedlitz, Matlock 2005). From this background a new approach
to watershed management has arisen. Its focus has become all pollutant throughout the watershed
as a whole, and is not confined to any arbitrary boundaries imposed by states or municipalities. This
new process requires efforts of a number of years with a comprehensive use of stakeholders. The old
paradigm would have a standardized set of rule making decisions, receive comments, amend the rule
then await litigation from angry stakeholders (Sabatier et al. 2005). The new collaborative watershed
approaches have some common features: (1) They use a hydrographic boundary as opposed to
political boundaries, (2) They involve a wide array of stakeholders form multiple agencies and multiple
levels of government and the community, (3) negotiations occur in face to face interactions among
participants, (4) the goal of the process is to find win-win solutions among economic, scientific and
social interests (5) the process uses an extensive fact finding effort which typically blends scientific
knowledge with local expertise (Sabatier et al. 2005).
Looking at the literature on water quality issues and policy in urbanizing North Carolina counties a
number of interesting facts come to light, which are common to many if not all watersheds and the
corresponding efforts to protect and repair them. In Piedmont North Carolina in the Neuse River basin
a number of things have transpired giving rise to active watershed network efforts. The Neuse rules
have called for a 30% reduction in nitrogen. This has created an urgent need to look both at
agricultural practices as well as development practices in the basin. Nitrogen levels have increased
substantially over the last century, and sharply in the last decade. Research suggests that some of
the water quality impairment in the lower Neuse may not be the result of changes in the watershed,
but rather from chronic nutrient overload in particular areas. Qualifying reductions post best
management practices is also something of an art in that any reductions in stream will likely not be
detected for at least four to five years after improvements are made in loading (Stow et al. 2001).
56
One area of improvement is almost always found in protecting the buffers to streams. This has also
been the case for the Neuse which instituted the Neuse River buffer rules requiring fifty foot buffers.
Riparian areas and its vegetation help control the transport of sediments and chemicals into stream
channels. Studies of the coastal plain show these ecosystems are excellent nutrient sinks and buffer
the surrounding nutrient discharge. They can serve as both a short and long-term filter and are
invaluable (Lawrance et al. 1984)
The loss of riparian forest since pre-settlement days is estimated at 70%, and perhaps as much as
23% of that loss has occurred since 1950. This rapid loss of wetlands is a great concern because
these riparian areas perform a number of valuable services, including: flood control, maintenance of
good water quality, diverse habitats for wildlife. These are largely public benefits. Aside from the
economic return for resource harvesters of timber, benefits generally do not accrue to the landowner,
but rather to individuals or groups downstream. Wetlands have therefore been recognized as public
resources and are federally protected under the Clean Water Act of 1972 (Gosselink and Shaffer
1990). Levels of nitrogen and phosphorus were from five to forty times greater in agricultural
watersheds then in mostly forested watersheds (Duda 1983).
Conventional farming consists of plowing, disking and harrowing. Often fields are left in the winter
season with no crop cover. With large storms and erodible soil this creates a significant problem
coming from agriculture, impacting water quality. New conservation cropping techniques and no till
planting have created great opportunities to improve water quality when applied across the watershed
(Endale et al. 2000). Agricultural runoff continues to be a major source of water quality degradation.
Institutional arrangements to effectively link voluntary agriculture programs with enforcement
mechanisms are not readily apparent. Local conservation districts seem to be best situated to
implement non-point source pollution programs in this current climate (Frarey et al. 1995). In a recent
5 year study on USDA demonstration projects it has been demonstrated that implementation of
improved management practices in agriculture does produce positive, measurable in stream impacts
and improvements (Stone et al. 1990). This demonstrates the networks with the institutional and
political will can improve their waters.
In urban and suburban areas, stormwater runoff is a primary stressor on surface waters.
Conventional urban stormwater drainage systems often route directly to streams and rivers, thus
exacerbating pollutant input and hydrologic disturbance. Low impact development (LID) and water
57
sensitive urban design is often a more sustainable tool for stormwater management if implemented at
the watershed scale. (Roy et al. 2008). There are seven major impediments to implementing
sustainable stormwater management practices: (1) uncertainties in performance and cost, (2)
insufficient engineering standards and guidelines, (3) fragmented responsibilities, (4) lack of
institutional capacity, (5) lack of legislative mandate, (6) lack of funding or effective market incentives,
and (7) resistance to change (Roy et al 2008).
In 1998 the North Carolina Legislature mandated a 30% reduction in the nitrogen loading in the
Neuse River in an attempt to reduce the undesirable environmental conditions in the lower-river and
estuary. One of the difficulties in working with stakeholder groups is that scientific models used have
biophysical outcomes such as dissolved oxygen. These types of outcomes are not directly meaningful
to the public. Stakeholder and decision makers have other concerns relating to fairness, economics,
and implantation which go beyond the science. Greater efforts need to be made to link the two
together in the stakeholder process (Borusk et al. 2001). Many watershed improvement efforts fail
because they fail to take into account the needs, constraints and practices of local people.
Participatory watershed management in which the users help define the problem, set priorities, select
policy, and evaluate impacts. This type of management preference raises a number of new questions
on how best to manage and organize such groups in order to be effective. Managing such a complex
process may ultimately lead to users participating in the research process itself to be effective
(Johnson et al. 2002). Additionally the formation of these new collaborative management groups must
also grapple with maintaining these organizations over an extended period of time (Bonnell and
Koontz 2007).
The 1990s have been characterized as the decade of market incentives. With this have come a host
of effluent trading programs to help improve the watershed. One study examined four such programs
and found that they do in fact produce cost-effective reductions in water pollution (Jarvie and
Solomon 1998). The value of the services provided to human societies by natural ecosystems and
biogeochemical cycles has recently been the topic of discussion and research. One study considered
basic economic principles necessary for understanding some of the questions that arise in this area.
The study found the sense in which economists can value nature's services is limited, and that
valuing these services is much less important than providing incentives for their conservation.
Valuation is neither necessary nor sufficient for conservation, whereas providing the right incentives is
(Heal 1999).
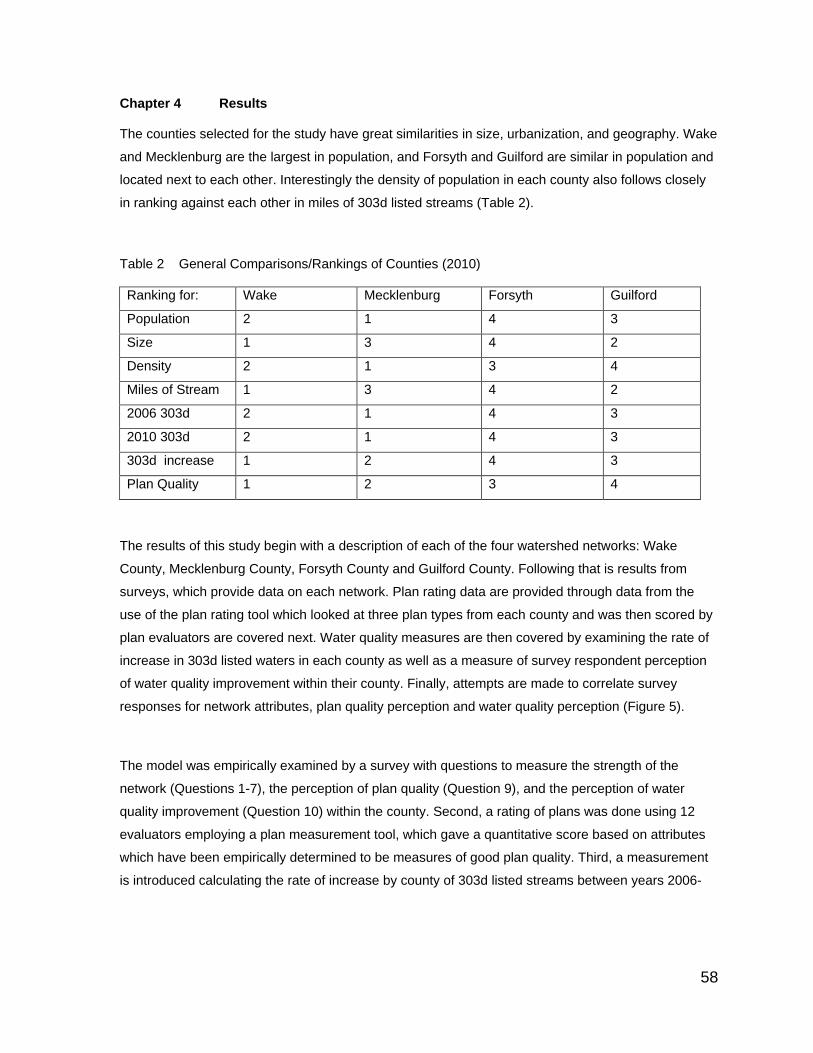
58
Chapter 4 Results The counties selected for the study have great similarities in size, urbanization, and geography. Wake
and Mecklenburg are the largest in population, and Forsyth and Guilford are similar in population and
located next to each other. Interestingly the density of population in each county also follows closely
in ranking against each other in miles of 303d listed streams (Table 2).
Table 2 General Comparisons/Rankings of Counties (2010)
Ranking for: Wake Mecklenburg Forsyth Guilford
Population 2 1 4 3
Size 1 3 4 2
Density 2 1 3 4
Miles of Stream 1 3 4 2
2006 303d 2 1 4 3
2010 303d 2 1 4 3
303d increase 1 2 4 3
Plan Quality 1 2 3 4
The results of this study begin with a description of each of the four watershed networks: Wake
County, Mecklenburg County, Forsyth County and Guilford County. Following that is results from
surveys, which provide data on each network. Plan rating data are provided through data from the
use of the plan rating tool which looked at three plan types from each county and was then scored by
plan evaluators are covered next. Water quality measures are then covered by examining the rate of
increase in 303d listed waters in each county as well as a measure of survey respondent perception
of water quality improvement within their county. Finally, attempts are made to correlate survey
responses for network attributes, plan quality perception and water quality perception (Figure 5).
The model was empirically examined by a survey with questions to measure the strength of the
network (Questions 1-7), the perception of plan quality (Question 9), and the perception of water
quality improvement (Question 10) within the county. Second, a rating of plans was done using 12
evaluators employing a plan measurement tool, which gave a quantitative score based on attributes
which have been empirically determined to be measures of good plan quality. Third, a measurement
is introduced calculating the rate of increase by county of 303d listed streams between years 2006-
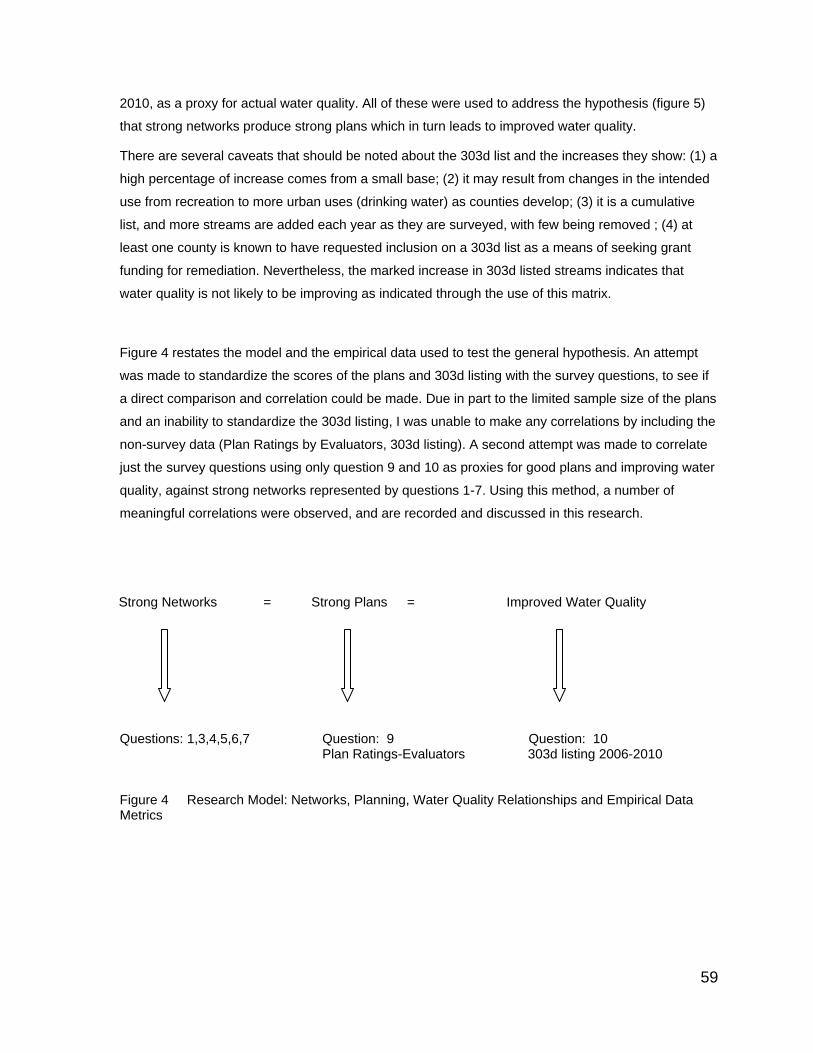
59
2010, as a proxy for actual water quality. All of these were used to address the hypothesis (figure 5)
that strong networks produce strong plans which in turn leads to improved water quality.
There are several caveats that should be noted about the 303d list and the increases they show: (1) a
high percentage of increase comes from a small base; (2) it may result from changes in the intended
use from recreation to more urban uses (drinking water) as counties develop; (3) it is a cumulative
list, and more streams are added each year as they are surveyed, with few being removed ; (4) at
least one county is known to have requested inclusion on a 303d list as a means of seeking grant
funding for remediation. Nevertheless, the marked increase in 303d listed streams indicates that
water quality is not likely to be improving as indicated through the use of this matrix.
Figure 4 restates the model and the empirical data used to test the general hypothesis. An attempt
was made to standardize the scores of the plans and 303d listing with the survey questions, to see if
a direct comparison and correlation could be made. Due in part to the limited sample size of the plans
and an inability to standardize the 303d listing, I was unable to make any correlations by including the
non-survey data (Plan Ratings by Evaluators, 303d listing). A second attempt was made to correlate
just the survey questions using only question 9 and 10 as proxies for good plans and improving water
quality, against strong networks represented by questions 1-7. Using this method, a number of
meaningful correlations were observed, and are recorded and discussed in this research.
Strong Networks = Strong Plans = Improved Water Quality
Questions: 1,3,4,5,6,7 Question: 9 Question: 10 Plan Ratings-Evaluators 303d listing 2006-2010 Figure 4 Research Model: Networks, Planning, Water Quality Relationships and Empirical Data Metrics
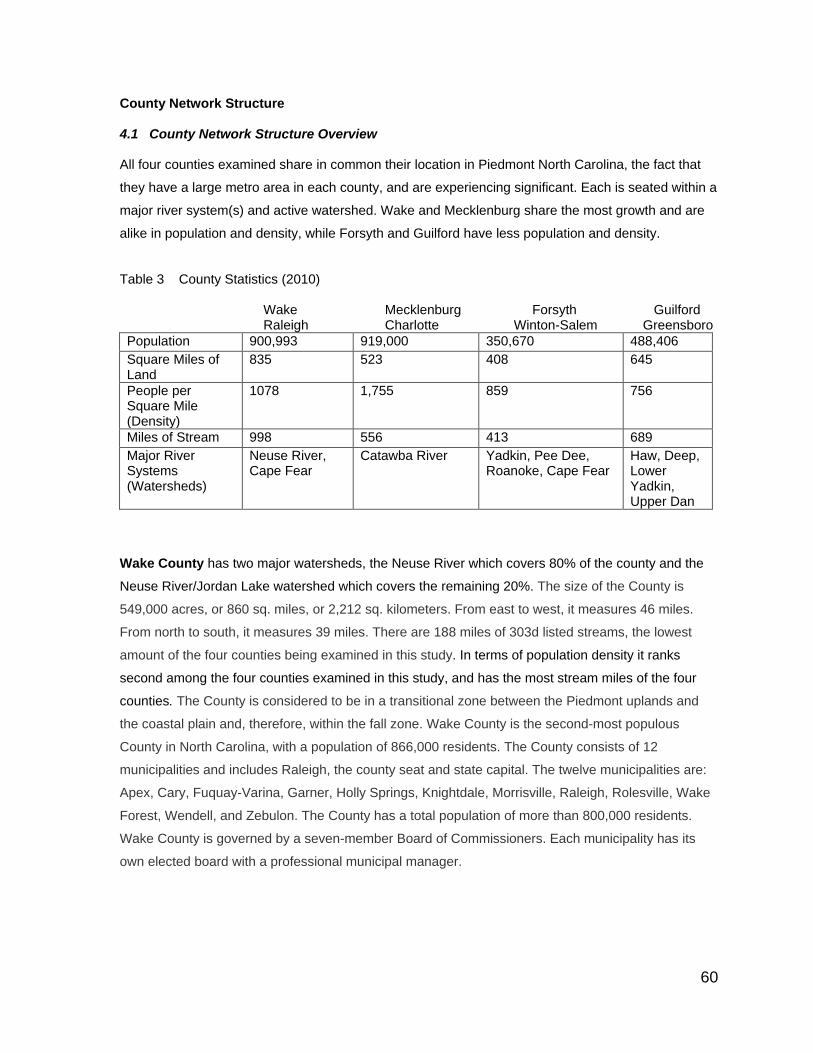
60
County Network Structure 4.1 County Network Structure Overview All four counties examined share in common their location in Piedmont North Carolina, the fact that
they have a large metro area in each county, and are experiencing significant. Each is seated within a
major river system(s) and active watershed. Wake and Mecklenburg share the most growth and are
alike in population and density, while Forsyth and Guilford have less population and density.
Table 3 County Statistics (2010) Wake Mecklenburg Forsyth Guilford Raleigh Charlotte Winton-Salem Greensboro
Population 900,993 919,000 350,670 488,406
Square Miles of Land
835 523 408 645
People per Square Mile (Density)
1078 1,755 859 756
Miles of Stream 998 556 413 689
Major River Systems (Watersheds)
Neuse River, Cape Fear
Catawba River Yadkin, Pee Dee, Roanoke, Cape Fear
Haw, Deep, Lower Yadkin, Upper Dan
Wake County has two major watersheds, the Neuse River which covers 80% of the county and the
Neuse River/Jordan Lake watershed which covers the remaining 20%. The size of the County is
549,000 acres, or 860 sq. miles, or 2,212 sq. kilometers. From east to west, it measures 46 miles.
From north to south, it measures 39 miles. There are 188 miles of 303d listed streams, the lowest
amount of the four counties being examined in this study. In terms of population density it ranks
second among the four counties examined in this study, and has the most stream miles of the four
counties. The County is considered to be in a transitional zone between the Piedmont uplands and
the coastal plain and, therefore, within the fall zone. Wake County is the second-most populous
County in North Carolina, with a population of 866,000 residents. The County consists of 12
municipalities and includes Raleigh, the county seat and state capital. The twelve municipalities are:
Apex, Cary, Fuquay-Varina, Garner, Holly Springs, Knightdale, Morrisville, Raleigh, Rolesville, Wake
Forest, Wendell, and Zebulon. The County has a total population of more than 800,000 residents.
Wake County is governed by a seven-member Board of Commissioners. Each municipality has its
own elected board with a professional municipal manager.
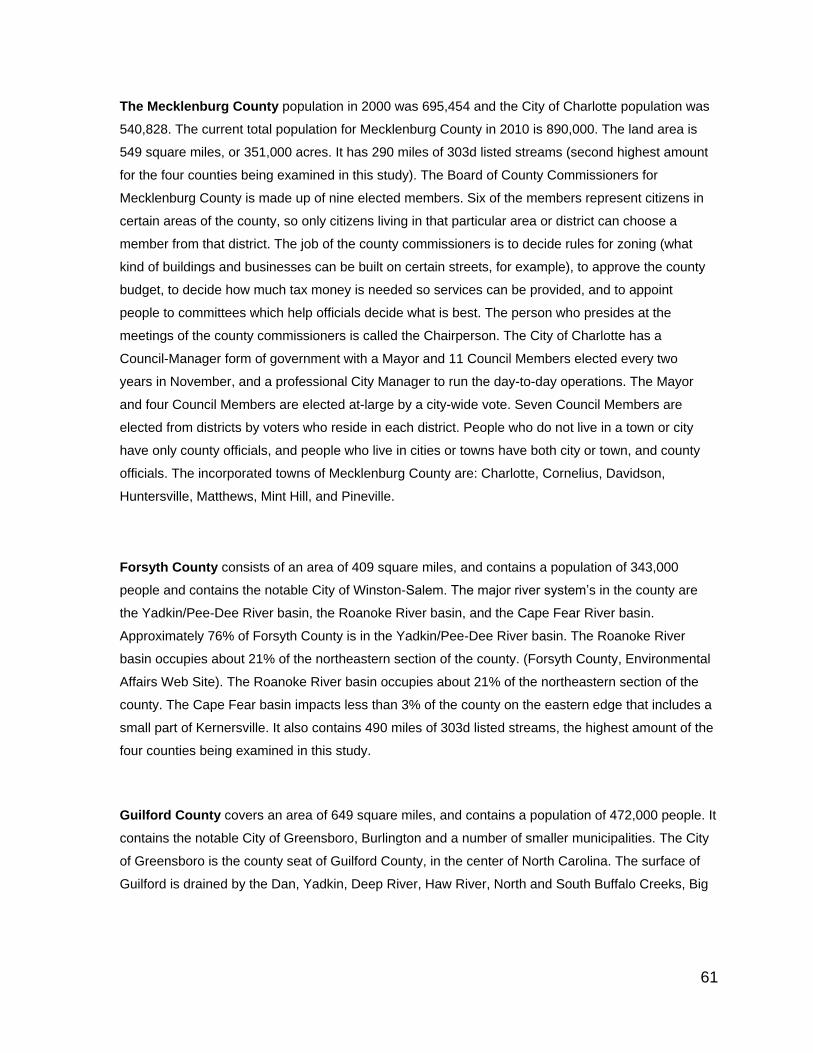
61
The Mecklenburg County population in 2000 was 695,454 and the City of Charlotte population was
540,828. The current total population for Mecklenburg County in 2010 is 890,000. The land area is
549 square miles, or 351,000 acres. It has 290 miles of 303d listed streams (second highest amount
for the four counties being examined in this study). The Board of County Commissioners for
Mecklenburg County is made up of nine elected members. Six of the members represent citizens in
certain areas of the county, so only citizens living in that particular area or district can choose a
member from that district. The job of the county commissioners is to decide rules for zoning (what
kind of buildings and businesses can be built on certain streets, for example), to approve the county
budget, to decide how much tax money is needed so services can be provided, and to appoint
people to committees which help officials decide what is best. The person who presides at the
meetings of the county commissioners is called the Chairperson. The City of Charlotte has a
Council-Manager form of government with a Mayor and 11 Council Members elected every two
years in November, and a professional City Manager to run the day-to-day operations. The Mayor
and four Council Members are elected at-large by a city-wide vote. Seven Council Members are
elected from districts by voters who reside in each district. People who do not live in a town or city
have only county officials, and people who live in cities or towns have both city or town, and county
officials. The incorporated towns of Mecklenburg County are: Charlotte, Cornelius, Davidson,
Huntersville, Matthews, Mint Hill, and Pineville.
Forsyth County consists of an area of 409 square miles, and contains a population of 343,000
people and contains the notable City of Winston-Salem. The major river system’s in the county are
the Yadkin/Pee-Dee River basin, the Roanoke River basin, and the Cape Fear River basin.
Approximately 76% of Forsyth County is in the Yadkin/Pee-Dee River basin. The Roanoke River
basin occupies about 21% of the northeastern section of the county. (Forsyth County, Environmental
Affairs Web Site). The Roanoke River basin occupies about 21% of the northeastern section of the
county. The Cape Fear basin impacts less than 3% of the county on the eastern edge that includes a
small part of Kernersville. It also contains 490 miles of 303d listed streams, the highest amount of the
four counties being examined in this study.
Guilford County covers an area of 649 square miles, and contains a population of 472,000 people. It
contains the notable City of Greensboro, Burlington and a number of smaller municipalities. The City
of Greensboro is the county seat of Guilford County, in the center of North Carolina. The surface of
Guilford is drained by the Dan, Yadkin, Deep River, Haw River, North and South Buffalo Creeks, Big
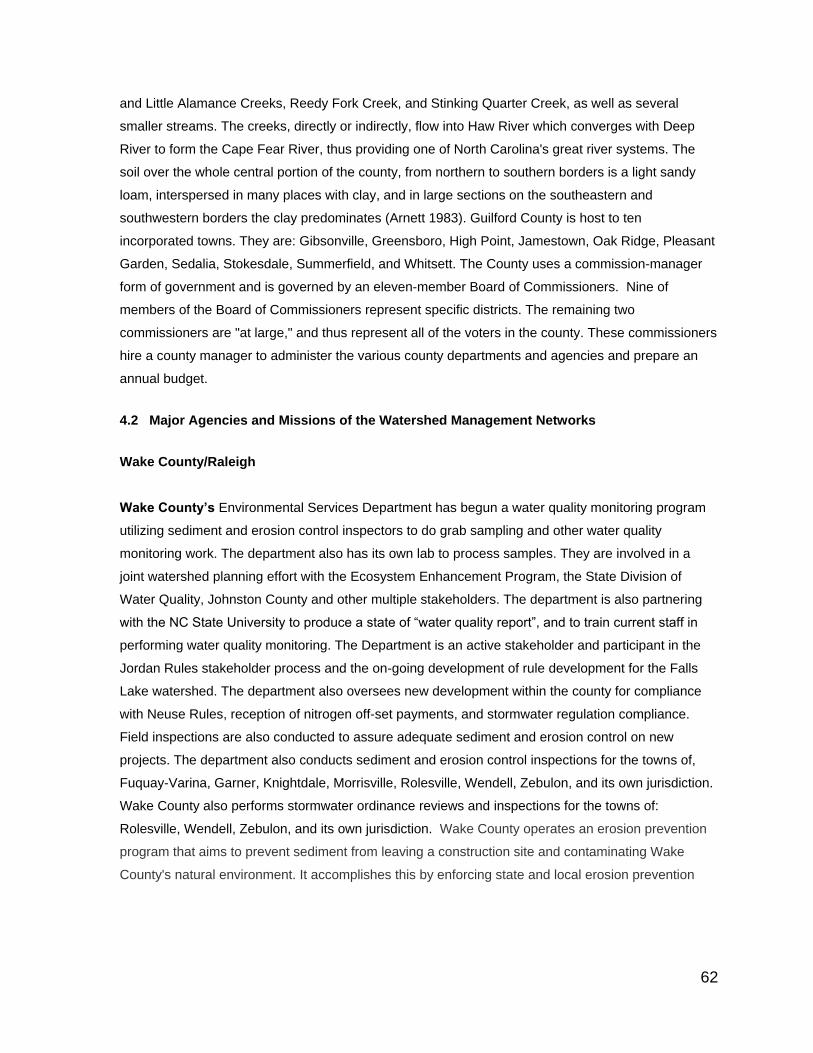
62
and Little Alamance Creeks, Reedy Fork Creek, and Stinking Quarter Creek, as well as several
smaller streams. The creeks, directly or indirectly, flow into Haw River which converges with Deep
River to form the Cape Fear River, thus providing one of North Carolina's great river systems. The
soil over the whole central portion of the county, from northern to southern borders is a light sandy
loam, interspersed in many places with clay, and in large sections on the southeastern and
southwestern borders the clay predominates (Arnett 1983). Guilford County is host to ten
incorporated towns. They are: Gibsonville, Greensboro, High Point, Jamestown, Oak Ridge, Pleasant
Garden, Sedalia, Stokesdale, Summerfield, and Whitsett. The County uses a commission-manager
form of government and is governed by an eleven-member Board of Commissioners. Nine of
members of the Board of Commissioners represent specific districts. The remaining two
commissioners are "at large," and thus represent all of the voters in the county. These commissioners
hire a county manager to administer the various county departments and agencies and prepare an
annual budget.
4.2 Major Agencies and Missions of the Watershed Management Networks
Wake County/Raleigh
Wake County’s Environmental Services Department has begun a water quality monitoring program
utilizing sediment and erosion control inspectors to do grab sampling and other water quality
monitoring work. The department also has its own lab to process samples. They are involved in a
joint watershed planning effort with the Ecosystem Enhancement Program, the State Division of
Water Quality, Johnston County and other multiple stakeholders. The department is also partnering
with the NC State University to produce a state of ―water quality report‖, and to train current staff in
performing water quality monitoring. The Department is an active stakeholder and participant in the
Jordan Rules stakeholder process and the on-going development of rule development for the Falls
Lake watershed. The department also oversees new development within the county for compliance
with Neuse Rules, reception of nitrogen off-set payments, and stormwater regulation compliance.
Field inspections are also conducted to assure adequate sediment and erosion control on new
projects. The department also conducts sediment and erosion control inspections for the towns of,
Fuquay-Varina, Garner, Knightdale, Morrisville, Rolesville, Wendell, Zebulon, and its own jurisdiction.
Wake County also performs stormwater ordinance reviews and inspections for the towns of:
Rolesville, Wendell, Zebulon, and its own jurisdiction. Wake County operates an erosion prevention
program that aims to prevent sediment from leaving a construction site and contaminating Wake
County's natural environment. It accomplishes this by enforcing state and local erosion prevention
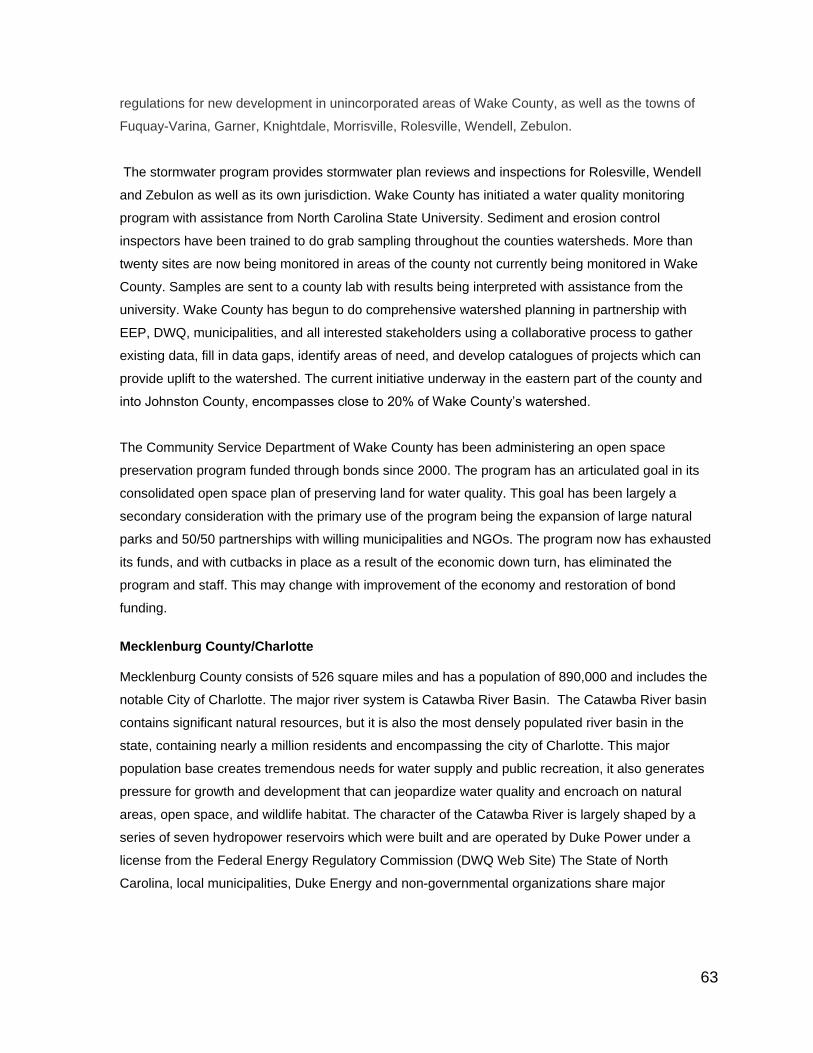
63
regulations for new development in unincorporated areas of Wake County, as well as the towns of
Fuquay-Varina, Garner, Knightdale, Morrisville, Rolesville, Wendell, Zebulon.
The stormwater program provides stormwater plan reviews and inspections for Rolesville, Wendell
and Zebulon as well as its own jurisdiction. Wake County has initiated a water quality monitoring
program with assistance from North Carolina State University. Sediment and erosion control
inspectors have been trained to do grab sampling throughout the counties watersheds. More than
twenty sites are now being monitored in areas of the county not currently being monitored in Wake
County. Samples are sent to a county lab with results being interpreted with assistance from the
university. Wake County has begun to do comprehensive watershed planning in partnership with
EEP, DWQ, municipalities, and all interested stakeholders using a collaborative process to gather
existing data, fill in data gaps, identify areas of need, and develop catalogues of projects which can
provide uplift to the watershed. The current initiative underway in the eastern part of the county and
into Johnston County, encompasses close to 20% of Wake County’s watershed.
The Community Service Department of Wake County has been administering an open space
preservation program funded through bonds since 2000. The program has an articulated goal in its
consolidated open space plan of preserving land for water quality. This goal has been largely a
secondary consideration with the primary use of the program being the expansion of large natural
parks and 50/50 partnerships with willing municipalities and NGOs. The program now has exhausted
its funds, and with cutbacks in place as a result of the economic down turn, has eliminated the
program and staff. This may change with improvement of the economy and restoration of bond
funding.
Mecklenburg County/Charlotte Mecklenburg County consists of 526 square miles and has a population of 890,000 and includes the
notable City of Charlotte. The major river system is Catawba River Basin. The Catawba River basin
contains significant natural resources, but it is also the most densely populated river basin in the
state, containing nearly a million residents and encompassing the city of Charlotte. This major
population base creates tremendous needs for water supply and public recreation, it also generates
pressure for growth and development that can jeopardize water quality and encroach on natural
areas, open space, and wildlife habitat. The character of the Catawba River is largely shaped by a
series of seven hydropower reservoirs which were built and are operated by Duke Power under a
license from the Federal Energy Regulatory Commission (DWQ Web Site) The State of North
Carolina, local municipalities, Duke Energy and non-governmental organizations share major
64
responsibilities, challenges, and opportunities in planning for the future protection and management
of the significant public resources in the Catawba River Basin.
Mecklenburg County contains the incorporated towns of Charlotte, Cornelius, Davidson, Huntersville,
Matthews, Mint Hill, and Pineview. Watershed management services are provided by the combined
efforts of the City of Charlotte and Mecklenburg County and include sediment and erosion control
programs as well as stormwater management control programs. Examples of these services include
the design review and inspection of storm drainage systems, water quality features, erosion control,
roadways and driveway entrances.
The Land Use and Environmental Services Department (LUESA) Provides services for the City of Charlotte and Towns of Cornelius, Davidson*, Huntersville,
Matthews, Mint Hill and Pineville and their extra-territorial jurisdictions (ETJs) that surround the City of
Charlotte. These services include the design review and inspection of storm drainage systems, water
quality features, erosion control, roadways and driveway entrances.
Forsyth County contains the incorporated towns of: Bethania, Clemmons, Kernersville, Lewisville,
Rural hall, Tobaccoville, Walkertown, and Winston-Salem. The municipalities of Bethania, Clemmons,
Kernersville, Lewisville, Rural Hall, Tobaccoville, and Walkertown, all have sediment and erosion
control programs administered jointly between the City of Winston-Salem and Forsyth County. There
is also a stormwater management program which is administered by the county for unincorporated
areas and the mall of the municipalities except for the City of Winston-Salem. The City of Winston
Salem manages its own stormwater program and has a stormwater utility fee. The county manages
any remaining unincorporated areas.
The Forsyth County Environmental Affairs Department administers a non-regulatory Water Quality
Program to protect the quality of surface water in Forsyth County. They investigate non-emergency
water contamination events that are discovered or that are reported by citizens. Many violations are
able to be resolve quickly and reduce the pollution impact during an initial on-site investigation. Cases
where enforcement action is necessary to correct a problem are referred to the N.C. Department of
Environment and Natural Resources (DENR) under a Memorandum of Understanding. Forsyth
County and the City of Winston Salem combined manage the sediment and erosion control program
for all of the municipalities and the county. The Planning Department administers the sediment and
erosion control programs. The Utilities Department: Water and Sewer Division manages the
stormwater program. Guilford County currently has a task force standing a merger of city and county
government between Greensboro and Guilford County. The County handles sediment and erosion

65
control plan review, inspections and the required stormwater management.for the towns of
Gibsonville, High Point, Jamestown, Oak Ridge, Pleasant Garden, Sedalia, Stokesdale, Summerfield,
and Whitsett The City of Greensboro handles sediment and erosion control within its own jurisdiction
through the Building and Inspections Department. The stormwater management function is
administered through the Water Resources Department.
Water and Land Resource Division (Division of LUESA): Contains three sections (1) ground and wastewater (2) land development (3) stormwater services
(1) Ground/Waste Water Services-
(2) Land Development (sediment and erosion control, stormwater ordinance)
(3) Stormwater Services (sediment and erosion control, stormwater, monitoring program, watershed planning)
State Agencies
Cooperative Extension The Cooperative Extension Service provides each county with expertise from North Carolina
University, and access to the University for training, problem solving and other forms of support. In
addition to educating both the public and private sector, they install cooperatively with interested
entities BMPs in various watersheds throughout the county. They are maintained in county offices are
funded partly through each county. They also provide education based on the need and request of
each county.
Soil and Water Conservation District (Agricultural Programs)
The Soil and Water Conservation District is a separate legal body from each county, and enjoys
county funding, while being directly accountable to an elected board of District Supervisors. These
elected supervisors are chartered with setting priorities, administering programs, and making strategic
decisions on future programs. The County Soil & Water Conservation District's (SWCD) mission is to
conserve the soil, water and related natural resources of each County. They provide technical
assistance to interested landowners and land users for managing natural resources -- soil, water,
forestry, and wildlife. Financial assistance is provided for management practices through state
agricultural cost share programs (ACP), and community conservation assistance program (CCAP).
Federal assistance for natural resource programs is available through the Environmental Quality
66
Incentives Program (EQUIP) and Wildlife Habitat Incentives Program (WHIP). The district helps
facilitate interested landowners with these financial resources to install sound land management
practices. One major program of note, funded by Forsyth County and administered by the Soil and
Water Conservation Service, is the Farmland Preservation Program which is often cited as a model
program for land conservation in North Carolina.
The Clean Water Management Trust Fund (CWMTF)
North Carolina's Clean Water Management Trust Fund (CWMTF) was established by the General
Assembly in 1996 (Article 18; Chapter 113A of the North Carolina General Statutes). CWMTF
receives a direct appropriation from the General Assembly in order to issue grants to local
governments, state agencies and conservation non-profits to help finance projects that specifically
address water pollution problems. The 21-member, independent, CWMTF Board of Trustees has full
responsibility over the allocation of moneys from the Fund (CWMTF Web Site 2010). The CWMTF
will fund projects that (1) enhance or restore degraded waters, (2) protect unpolluted waters, and/or
(3) contribute toward a network of riparian buffers and greenways for environmental, educational, and
recreational benefits. (CWMTF Web Site 2010).The CWMTF has been an active network partner
throughout Wake County, providing a powerful funding mechanism to leverage local funds to
accomplish on-the-ground projects.
North Carolina Division of Water Quality The North Carolina Division of Water Quality is responsible for statewide regulatory programs and
both surface and groundwater protection. DWQ accomplishes this through water quality monitoring
programs, permitting, and enforcement. They administer the laws, policies, and rules established by
the Environmental Management Commission, the NC General Assembly, the state legislature and the
Environmental Protection Agency. They have been an active watershed management network
partner, helping with grants, technical expertise, monitoring data, and even some joint collaboration
with municipal government to do stream monitoring.
The Ecosystem Enhancement Program (EEP) The Ecosystem Enhancement Program, formerly known as the Wetlands Restoration Program is
largely a creation of a three way memorandum of understanding between the U.S. Army Corps of
Engineers, the North Carolina Department of Transportation, and the N.C. Department of Natural
67
Resources. This agreement has EEP working collaboratively to mitigate impacts caused through
construction throughout the state. As such EEP provides:
· Projects for watershed improvement and protection;
· Compensation for unavoidable environmental impacts associated with transportation-infrastructure
and economic development; and
· Detailed watershed-planning and project-implementation efforts within North Carolina's threatened
or degraded watersheds.
They have been an active network partner in both planning and implementation of water quality
projects throughout Wake County. They have funded open space acquisitions, done stream
restorations, provided buffer enhancements to streams, and led major planning initiatives in Swift
Creek and Eastern Wake County watersheds in recent years. In Guilford County the Eco-System
Enhancement Program (EEP) has restored more than 16,000 linear feet of streams in four
Greensboro City parks. Projects in Benbow Park, Brown Bark Park, the Gillespie Golf Course, Price
Park, and Hillsdale Park have used natural stream restoration methods to stabilize stream channels,
improve water quality, and increase habitat for fish and other aquatic life. Not only did these projects
improve the streams in the parks, they also improved the aesthetic qualities of the parks, making
them more attractive and functional.
Federal Agencies
EPA In relation to watershed management the EPA delegates authority for Phase I and Phase II permits
which essentially require that attention is paid to both sediment and erosion and stormwater run-off.
The EPA also produces in collaboration with the State Division of Water Quality a listing of 303d listed
waters, which ultimately will require local and state governments to develop a Total Maximum Daily
Load (TMDL) for the pollutant indentified in an effort to clean up the impaired stream. The EPA
derives its authority from the Clean Water Act. The EPA also identifies the acceptable levels of
contaminants and pollutants allowed within the waters of the United States. The EPA also provides
319 grants, administered through the Division of Water Quality to allow for the cleaning up of these
waters.
68
Army Corps of Engineers The Army Corps of Engineers maintains the system of Dams and reservoirs for multiple purposes. In
the case of Wake County they are responsible for the Falls Lake Dam which impounds the Neuse
River, which provides the majority of drinking water available for Wake County within Falls Lake. The
Army Corps of Engineers also provides permitting for most large road and public works projects
which have environmental impacts. As roads are permitted and built the Army Corps requires the
impacter to mitigate the damage done to wetlands. Money is often paid into a fund and projects that
off-set the damage done by the project are identified, paid for and built. Much of the work of mitigation
is often done through the Eco-System Enhancement Program, or private mitigation banks, under the
approval of the Army Corps of Engineers.
Non-Governmental Organizations
Triangle Land Conservancy
The mission of the Triangle Land Conservancy is to protect important open space—stream corridors,
forests, wildlife habitat, farmland and natural areas—in Chatham, Durham, Johnston, Lee, Orange
and Wake counties. TLC is funded by over 2,000+ members. They have been successful in applying
for grants from the North Carolina Clean Water Management Fund which have been the catalyst for a
great deal of Wake County open space acquisitions when paired with Wake County open space bond
money.
Piedmont Land Conservancy
Piedmont Land Conservancy is a non-profit, grassroots land trust in nine North Carolina Counties:
Alamance, Caswell, Forsyth, Guilford, Randolph, Rockingham, Stokes, Surry, and Yadkin. Their
sated mission is to protect natural and scenic lands, farms, and open space in piedmont North
Carolina to enrich the quality of life for our communities and for future generations. (Piedmont Land
Conservancy Web Site)
Foothills Land Conservancy Early in 1997, Foothills Conservancy of North Carolina was incorporated as a nonprofit land trust
dedicated to serving the Blue Ridge Foothills region - an eight-county area in the Blue Ridge
Mountains of western North Carolina - and includes the headwaters of three major rivers in the area:
Catawba, Broad and Yadkin (Foothills Conservancy Web Site)

69
Triangle J COG The Triangle J Council of Governments is a voluntary organization of municipal and county
governments in North Carolina's Region J (Chatham, Durham, Johnston, Lee, Moore, Orange and
Wake counties). It is one of 17 regional councils established in 1972 by the General Assembly to aid,
assist, and improve the capabilities of local governments in administration, planning, fiscal
management, and development.
Much of Triangle J's work involves developing and managing partnerships that bring local
communities together with other stakeholders to develop strategies. Working with community partners
on a regional-scale the Triangle J takes on five principal roles:
1. convener and common ground for research, project development, relationship-building and
information-sharing
2. coordinator of regional services
3. manager of regional planning projects
4. administrator for regional institutions addressing development, conservation and infrastructure
5. providing technical assistance and data to member communities
As such they have played a major role in every watershed management initiative that is multi-
jurisdictional in nature. They are currently working to develop the new Falls Lake rules working
collaboratively with local, state and federal entities.
Trust for Public Land The Trust for Public Land is a national non-profit land conservation organization. It maintains a state
office in Wake County. They had been an active partner in developing conservation plans in Wake
County and assisting state and local government in developing land acquisition strategies. With the
recent economic downturn there has been little activity with this organization in Wake County. In
Charlotte, they have been particularly active in protecting Mountain Island Lake. More than half a
million people obtain their drinking water from Mountain Island Lake. The Trust for Public Land and its
partners have led a regional effort to improve water quality by protecting 80 percent of the lake's
undeveloped shoreline and critical tributaries.

70
Audubon Society
The mission statement of the Audubon Society is : "To conserve and restore natural ecosystems,
focusing on birds, wildlife and their natural habitats for the benefit of humanity and North Carolina's
biological diversity. "In line with this mission statement, members also contribute time on local
Conservation projects. They are very active in Forsyth County currently, they are working with the
Town of Bethania to improve habitat at their Walnut Bottoms property and with Historic Bethabara
Park to control exotic, invasive Sacret Lotus at the wetland.
The following four figures (Figures 5, 6, 7, 8) provide a sketch of the basic networks in each of the
four counties: Wake, Mecklenburg, Forsyth and Guilford counties. Typical features of each network
are a local/county government which addresses comprehensive land-use planning, sediment and
erosion control, stormwater, and some kind of watershed management. Each county divides these
responsibilities differently, with some small local governments doing their part and in some cases the
county or the largest municipality will represent the interests of the smaller towns. Each has at least
one non-governmental agency at work doing land conservation, state and federal agencies. All work
in concert to create a network of watershed management for the county and watershed. The smaller
counties of Forsyth and Guilford have similar less sophisticated networks, with Wake and
Mecklenburg having fairly developed complex networks.
Each of the four counties have very similar features of their respective networks. Wake and
Mecklenburg have the most in common with the largest of the cities of the four studied counties.
Wake and Mecklenburg also share similar populations in size and as such have greater resources
and greater pressures upon their natural resources. Forsyth and Guilford share great commonalities
in population size and in the amount of funding for the network. Most noticeable and not surprising
the more urbanized counties of Wake and Mecklenburg have larger and more sophisticated
stormwater management programs designed to address the pressures of development, and to keep
in compliance with provisions of the Clean Water Act.
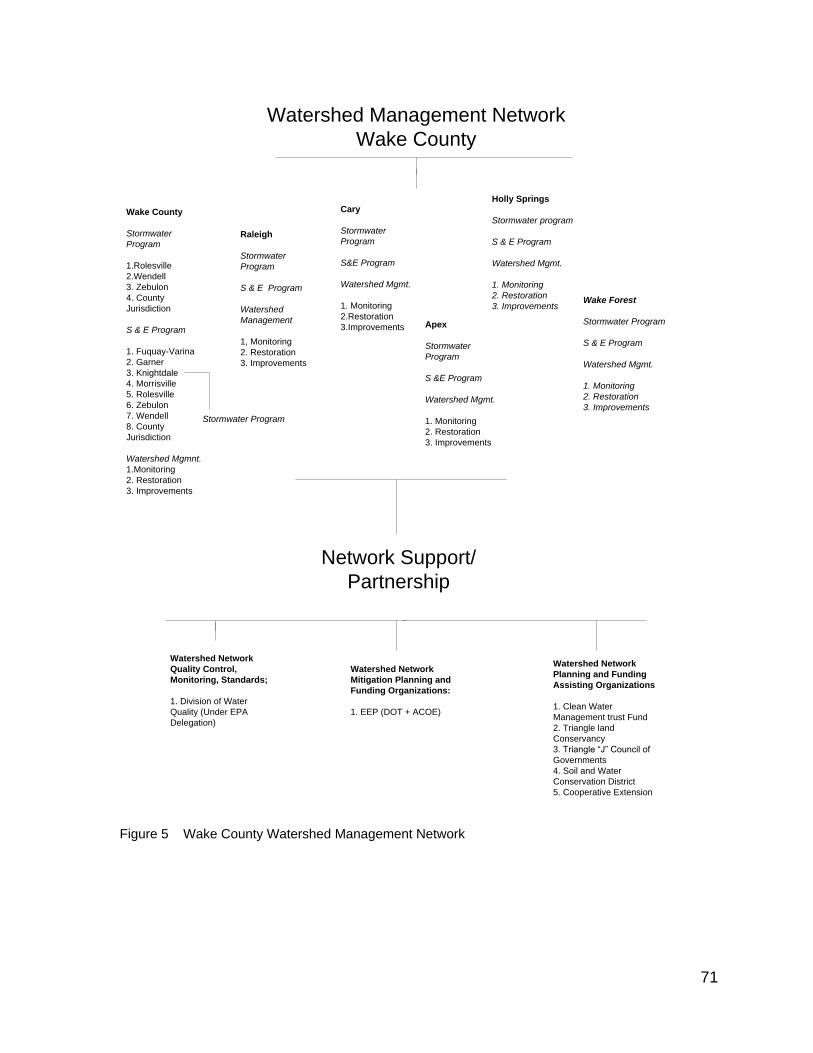
71
Wake County
Stormwater
Program
1.Rolesville
2.Wendell
3. Zebulon
4. County
Jurisdiction
S & E Program
1. Fuquay-Varina
2. Garner
3. Knightdale
4. Morrisville
5. Rolesville
6. Zebulon
7. Wendell
8. County
Jurisdiction
Watershed Mgmnt.
1.Monitoring
2. Restoration
3. Improvements
Raleigh
Stormwater
Program
S & E Program
Watershed
Management
1, Monitoring
2. Restoration
3. Improvements
Cary
Stormwater
Program
S&E Program
Watershed Mgmt.
1. Monitoring
2.Restoration
3.Improvements Apex
Stormwater
Program
S &E Program
Watershed Mgmt.
1. Monitoring
2. Restoration
3. Improvements
Holly Springs
Stormwater program
S & E Program
Watershed Mgmt.
1. Monitoring
2. Restoration
3. ImprovementsWake Forest
Stormwater Program
S & E Program
Watershed Mgmt.
1. Monitoring
2. Restoration
3. Improvements
Stormwater Program
Watershed Network
Planning and Funding
Assisting Organizations
1. Clean Water
Management trust Fund
2. Triangle land
Conservancy
3. Triangle ―J‖ Council of
Governments
4. Soil and Water
Conservation District
5. Cooperative Extension
Watershed Network
Mitigation Planning and
Funding Organizations:
1. EEP (DOT + ACOE)
Watershed Network
Quality Control,
Monitoring, Standards;
1. Division of Water
Quality (Under EPA
Delegation)
Network Support/
Partnership
Watershed Management Network
Wake County
Figure 5 Wake County Watershed Management Network
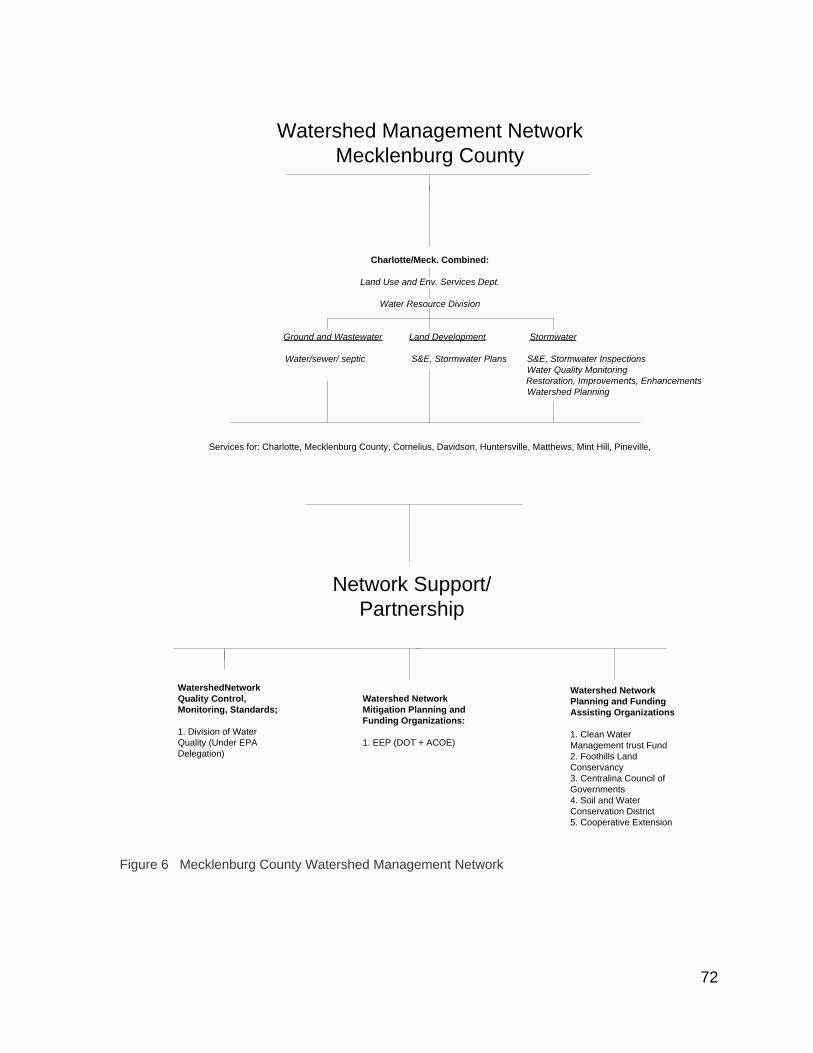
72
Charlotte/Meck. Combined:
Land Use and Env. Services Dept.
Water Resource Division
Ground and Wastewater Land Development Stormwater
Water/sewer/ septic S&E, Stormwater Plans S&E, Stormwater Inspections
Water Quality Monitoring
Restoration, Improvements, Enhancements
Watershed Planning
Services for: Charlotte, Mecklenburg County, Cornelius, Davidson, Huntersville, Matthews, Mint Hill, Pineville,
Watershed Network
Planning and Funding
Assisting Organizations
1. Clean Water
Management trust Fund
2. Foothills Land
Conservancy
3. Centralina Council of
Governments
4. Soil and Water
Conservation District
5. Cooperative Extension
Watershed Network
Mitigation Planning and
Funding Organizations:
1. EEP (DOT + ACOE)
WatershedNetwork
Quality Control,
Monitoring, Standards;
1. Division of Water
Quality (Under EPA
Delegation)
Network Support/
Partnership
Watershed Management Network
Mecklenburg County
Figure 6 Mecklenburg County Watershed Management Network
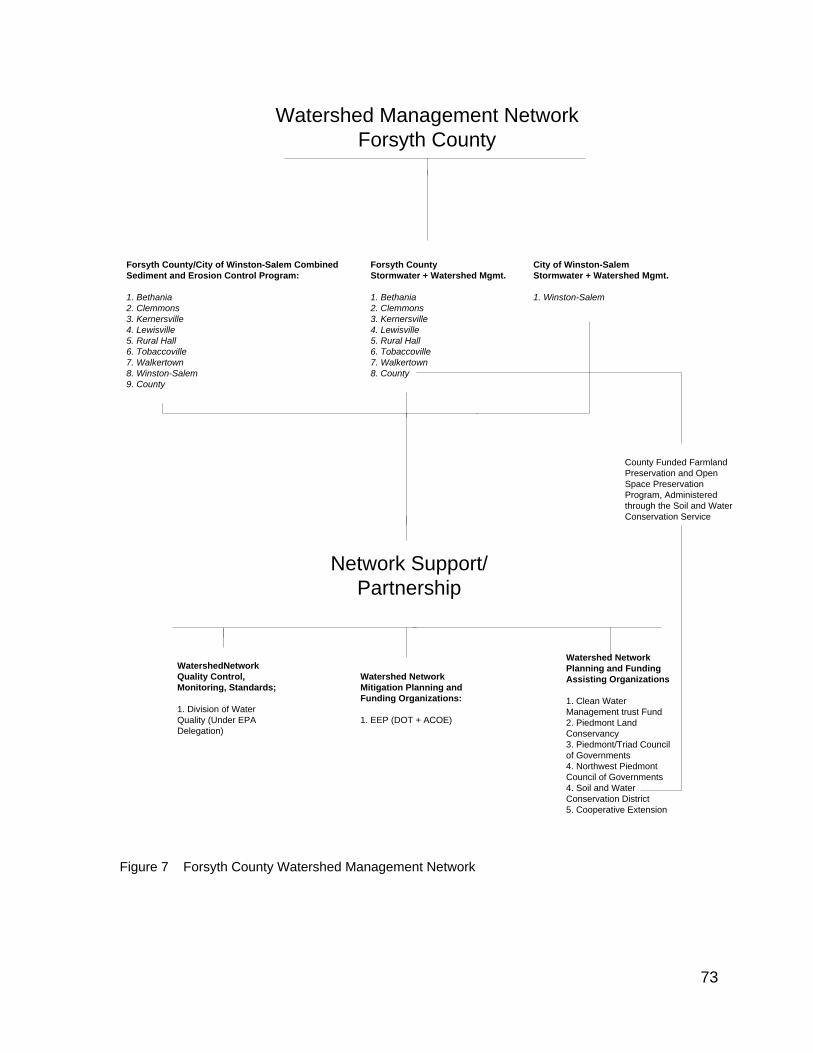
73
Forsyth County/City of Winston-Salem Combined Forsyth County City of Winston-Salem
Sediment and Erosion Control Program: Stormwater + Watershed Mgmt. Stormwater + Watershed Mgmt.
1. Bethania 1. Bethania 1. Winston-Salem
2. Clemmons 2. Clemmons
3. Kernersville 3. Kernersville
4. Lewisville 4. Lewisville
5. Rural Hall 5. Rural Hall
6. Tobaccoville 6. Tobaccoville
7. Walkertown 7. Walkertown
8. Winston-Salem 8. County
9. County
Watershed Network
Planning and Funding
Assisting Organizations
1. Clean Water
Management trust Fund
2. Piedmont Land
Conservancy
3. Piedmont/Triad Council
of Governments
4. Northwest Piedmont
Council of Governments
4. Soil and Water
Conservation District
5. Cooperative Extension
Watershed Network
Mitigation Planning and
Funding Organizations:
1. EEP (DOT + ACOE)
WatershedNetwork
Quality Control,
Monitoring, Standards;
1. Division of Water
Quality (Under EPA
Delegation)
Network Support/
Partnership
Watershed Management Network
Forsyth County
County Funded Farmland
Preservation and Open
Space Preservation
Program, Administered
through the Soil and Water
Conservation Service
Figure 7 Forsyth County Watershed Management Network
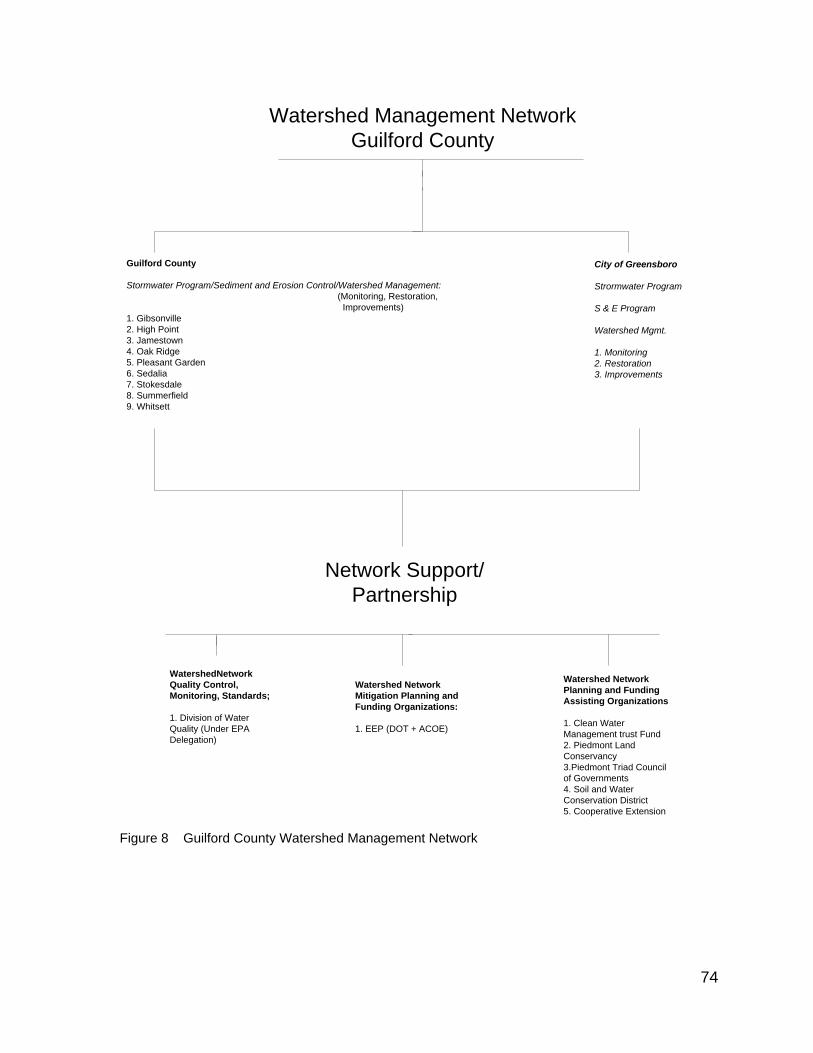
74
Guilford County
Stormwater Program/Sediment and Erosion Control/Watershed Management:
(Monitoring, Restoration,
Improvements)
1. Gibsonville
2. High Point
3. Jamestown
4. Oak Ridge
5. Pleasant Garden
6. Sedalia
7. Stokesdale
8. Summerfield
9. Whitsett
City of Greensboro
Strormwater Program
S & E Program
Watershed Mgmt.
1. Monitoring
2. Restoration
3. Improvements
Watershed Network
Planning and Funding
Assisting Organizations
1. Clean Water
Management trust Fund
2. Piedmont Land
Conservancy
3.Piedmont Triad Council
of Governments
4. Soil and Water
Conservation District
5. Cooperative Extension
Watershed Network
Mitigation Planning and
Funding Organizations:
1. EEP (DOT + ACOE)
WatershedNetwork
Quality Control,
Monitoring, Standards;
1. Division of Water
Quality (Under EPA
Delegation)
Network Support/
Partnership
Watershed Management Network
Guilford County
Figure 8 Guilford County Watershed Management Network
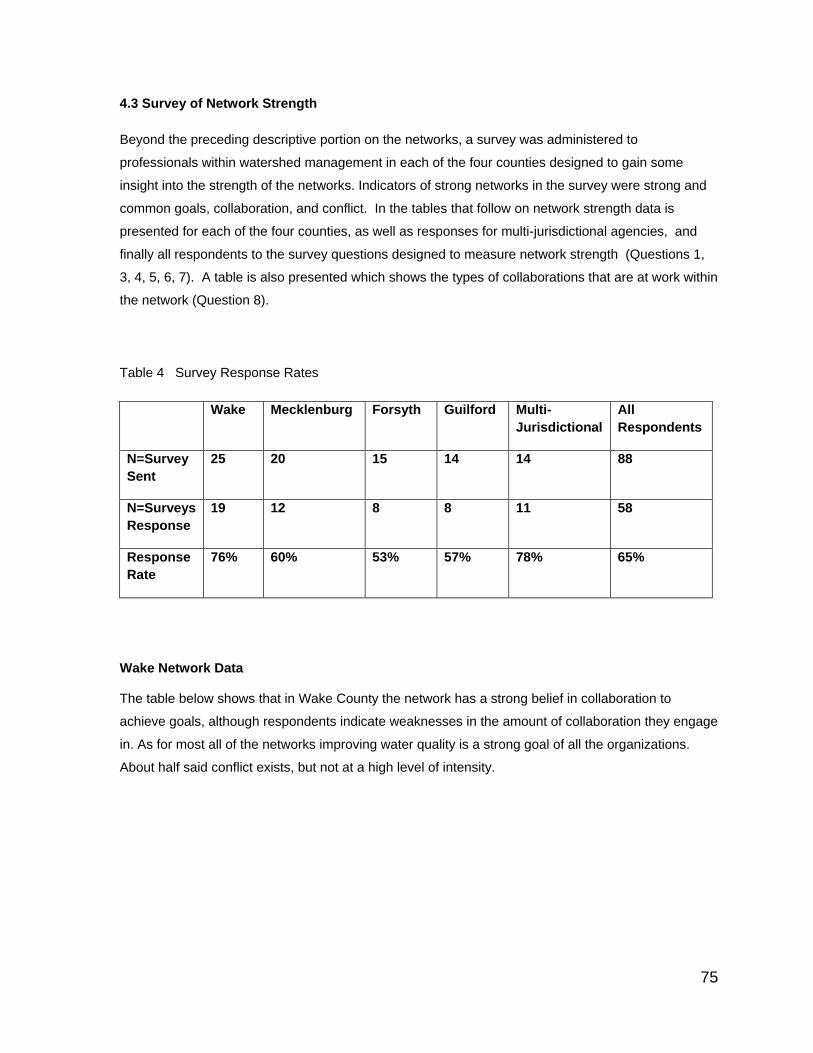
75
4.3 Survey of Network Strength
Beyond the preceding descriptive portion on the networks, a survey was administered to
professionals within watershed management in each of the four counties designed to gain some
insight into the strength of the networks. Indicators of strong networks in the survey were strong and
common goals, collaboration, and conflict. In the tables that follow on network strength data is
presented for each of the four counties, as well as responses for multi-jurisdictional agencies, and
finally all respondents to the survey questions designed to measure network strength (Questions 1,
3, 4, 5, 6, 7). A table is also presented which shows the types of collaborations that are at work within
the network (Question 8).
Table 4 Survey Response Rates
Wake Mecklenburg Forsyth Guilford Multi-
Jurisdictional
All
Respondents
N=Survey
Sent
25 20 15 14 14 88
N=Surveys
Response
19 12 8 8 11 58
Response
Rate
76% 60% 53% 57% 78% 65%
Wake Network Data The table below shows that in Wake County the network has a strong belief in collaboration to
achieve goals, although respondents indicate weaknesses in the amount of collaboration they engage
in. As for most all of the networks improving water quality is a strong goal of all the organizations.
About half said conflict exists, but not at a high level of intensity.
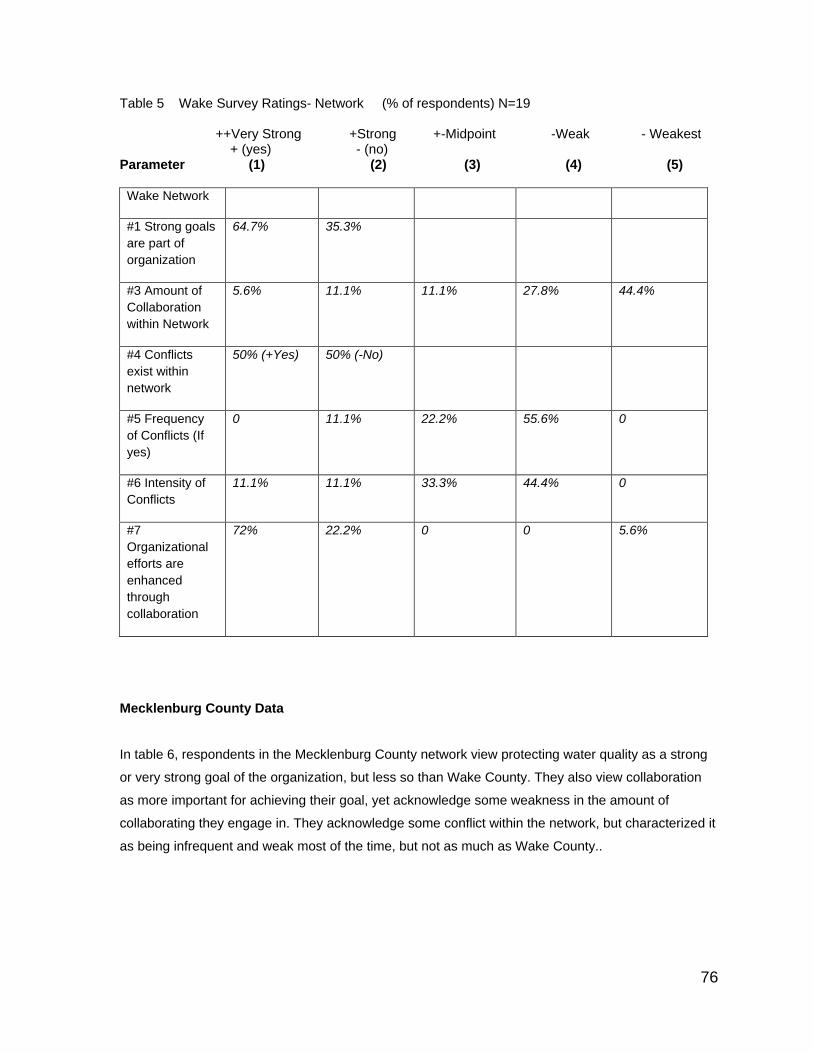
76
Table 5 Wake Survey Ratings- Network (% of respondents) N=19 ++Very Strong +Strong +-Midpoint -Weak - Weakest + (yes) - (no) Parameter (1) (2) (3) (4) (5)
Wake Network
#1 Strong goals
are part of
organization
64.7% 35.3%
#3 Amount of
Collaboration
within Network
5.6% 11.1% 11.1% 27.8% 44.4%
#4 Conflicts
exist within
network
50% (+Yes) 50% (-No)
#5 Frequency
of Conflicts (If
yes)
0 11.1% 22.2% 55.6% 0
#6 Intensity of
Conflicts
11.1% 11.1% 33.3% 44.4% 0
#7
Organizational
efforts are
enhanced
through
collaboration
72% 22.2% 0 0 5.6%
Mecklenburg County Data
In table 6, respondents in the Mecklenburg County network view protecting water quality as a strong
or very strong goal of the organization, but less so than Wake County. They also view collaboration
as more important for achieving their goal, yet acknowledge some weakness in the amount of
collaborating they engage in. They acknowledge some conflict within the network, but characterized it
as being infrequent and weak most of the time, but not as much as Wake County..
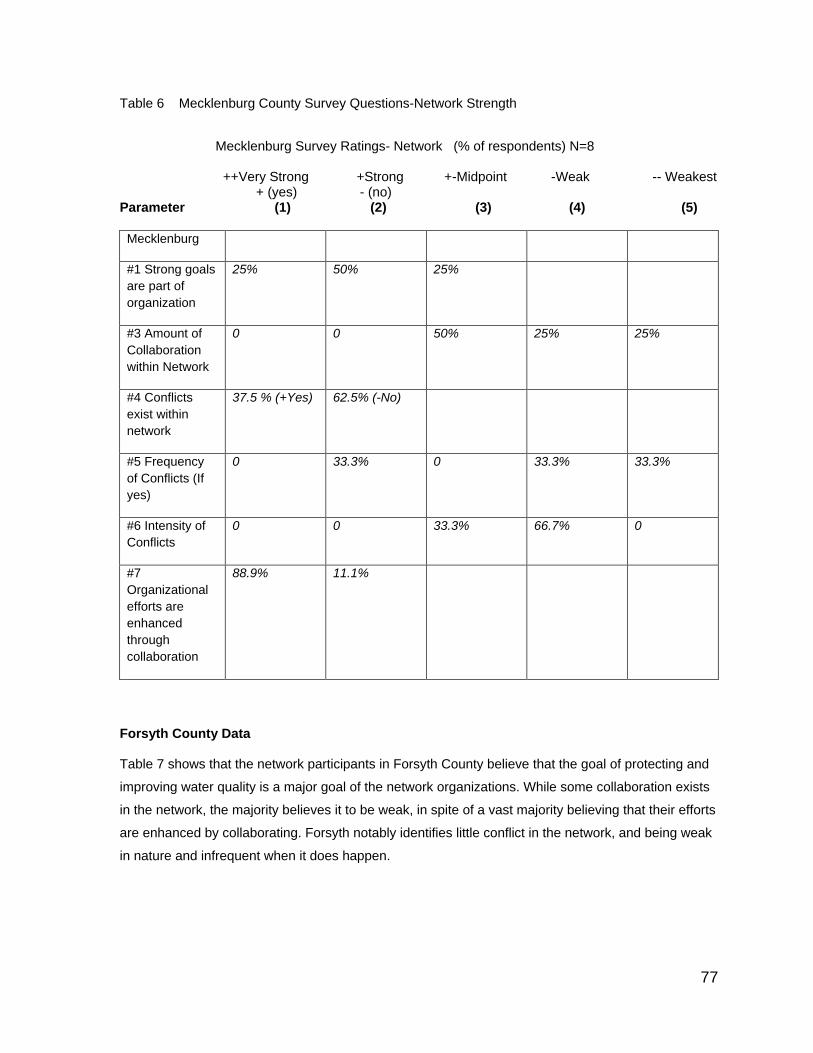
77
Table 6 Mecklenburg County Survey Questions-Network Strength
Mecklenburg Survey Ratings- Network (% of respondents) N=8 ++Very Strong +Strong +-Midpoint -Weak -- Weakest + (yes) - (no) Parameter (1) (2) (3) (4) (5)
Mecklenburg
#1 Strong goals
are part of
organization
25% 50% 25%
#3 Amount of
Collaboration
within Network
0 0 50% 25% 25%
#4 Conflicts
exist within
network
37.5 % (+Yes) 62.5% (-No)
#5 Frequency
of Conflicts (If
yes)
0 33.3% 0 33.3% 33.3%
#6 Intensity of
Conflicts
0 0 33.3% 66.7% 0
#7
Organizational
efforts are
enhanced
through
collaboration
88.9% 11.1%
Forsyth County Data Table 7 shows that the network participants in Forsyth County believe that the goal of protecting and
improving water quality is a major goal of the network organizations. While some collaboration exists
in the network, the majority believes it to be weak, in spite of a vast majority believing that their efforts
are enhanced by collaborating. Forsyth notably identifies little conflict in the network, and being weak
in nature and infrequent when it does happen.
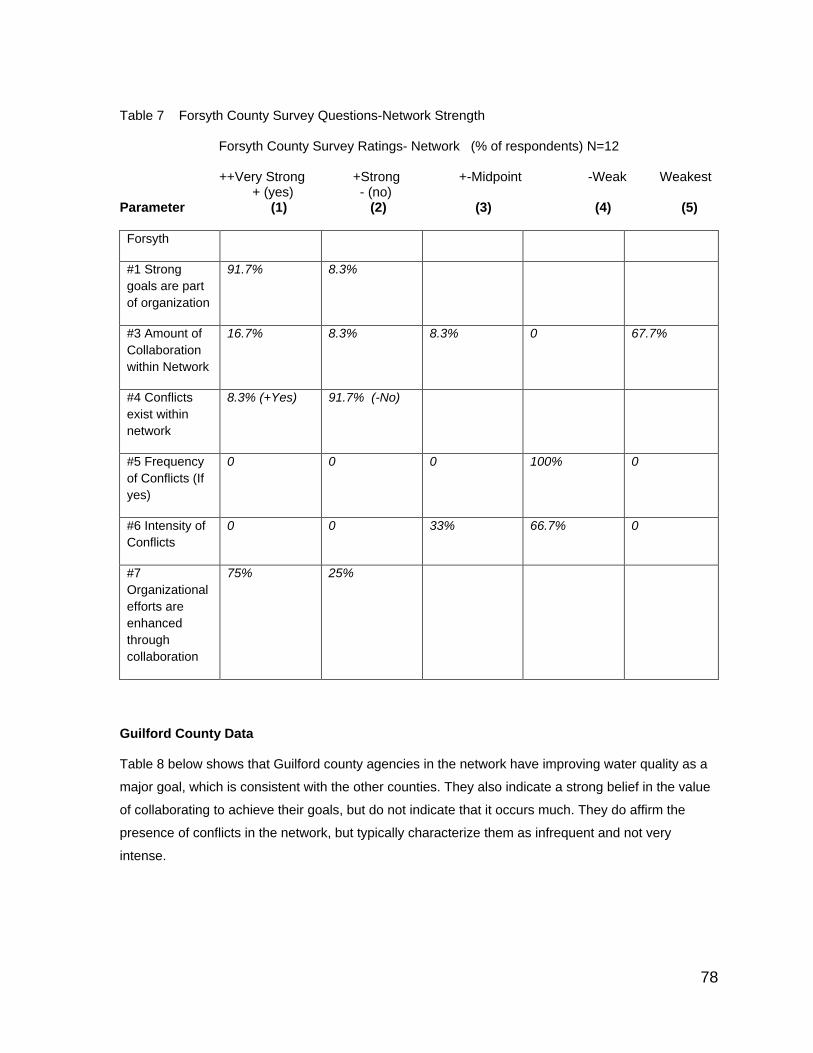
78
Table 7 Forsyth County Survey Questions-Network Strength
Forsyth County Survey Ratings- Network (% of respondents) N=12 ++Very Strong +Strong +-Midpoint -Weak Weakest + (yes) - (no) Parameter (1) (2) (3) (4) (5)
Forsyth
#1 Strong
goals are part
of organization
91.7% 8.3%
#3 Amount of
Collaboration
within Network
16.7% 8.3% 8.3% 0 67.7%
#4 Conflicts
exist within
network
8.3% (+Yes) 91.7% (-No)
#5 Frequency
of Conflicts (If
yes)
0 0 0 100% 0
#6 Intensity of
Conflicts
0 0 33% 66.7% 0
#7
Organizational
efforts are
enhanced
through
collaboration
75% 25%
Guilford County Data Table 8 below shows that Guilford county agencies in the network have improving water quality as a
major goal, which is consistent with the other counties. They also indicate a strong belief in the value
of collaborating to achieve their goals, but do not indicate that it occurs much. They do affirm the
presence of conflicts in the network, but typically characterize them as infrequent and not very
intense.

79
Table 8 Guilford County Survey Questions-Network Strength
Guilford County Survey Ratings- Network (% of respondents) N=8 ++Very Strong +Strong +-Midpoint -Weak Weakest + (yes) - (no) Parameter (1) (2) (3) (4) (5)
Guilford
#1 Strong
goals are part
of organization
71.4% 14.3% 14.3%
#3 Amount of
Collaboration
within Network
25% 0 0 25% 50%
#4 Conflicts
exist within
network
62.5% (+Yes) 37.5% (-No)
#5 Frequency
of Conflicts (If
yes)
16.7% 0 0 66.7% 16.7%
#6 Intensity of
Conflicts
0 0 0 83.3% 16.7%
#7
Organizational
efforts are
enhanced
through
collaboration
62.5% 12.5% 25% 0 0
Multi-Jurisdictional Data
In table 9 below we see strong and common goals as being important for improving water quality
among these respondents which work across jurisdictions. We also see the strongest response to the
recognition that collaboration is a key component of the organizations mission and success. As was
the case in the four counties there seems to be room for increasing the amount of collaborating going
on. Conflicts again are not seen as excessive.
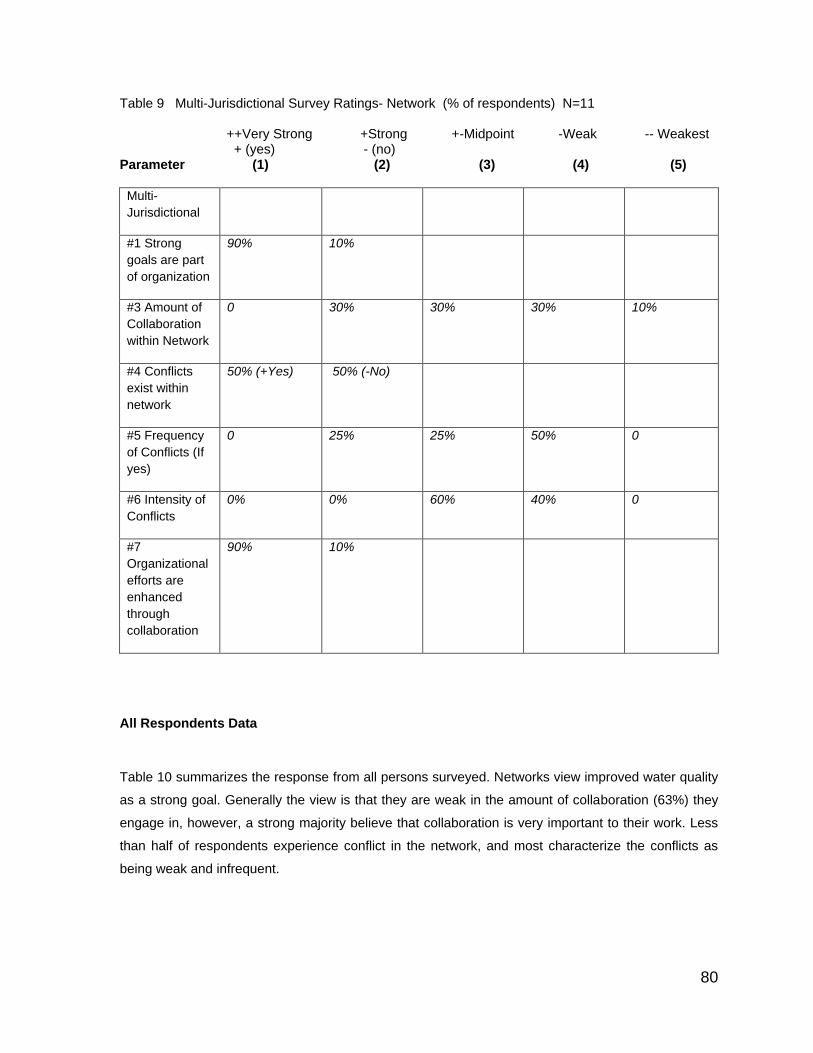
80
Table 9 Multi-Jurisdictional Survey Ratings- Network (% of respondents) N=11 ++Very Strong +Strong +-Midpoint -Weak -- Weakest + (yes) - (no) Parameter (1) (2) (3) (4) (5)
Multi-
Jurisdictional
#1 Strong
goals are part
of organization
90% 10%
#3 Amount of
Collaboration
within Network
0 30% 30% 30% 10%
#4 Conflicts
exist within
network
50% (+Yes) 50% (-No)
#5 Frequency
of Conflicts (If
yes)
0 25% 25% 50% 0
#6 Intensity of
Conflicts
0% 0% 60% 40% 0
#7
Organizational
efforts are
enhanced
through
collaboration
90% 10%
All Respondents Data
Table 10 summarizes the response from all persons surveyed. Networks view improved water quality
as a strong goal. Generally the view is that they are weak in the amount of collaboration (63%) they
engage in, however, a strong majority believe that collaboration is very important to their work. Less
than half of respondents experience conflict in the network, and most characterize the conflicts as
being weak and infrequent.
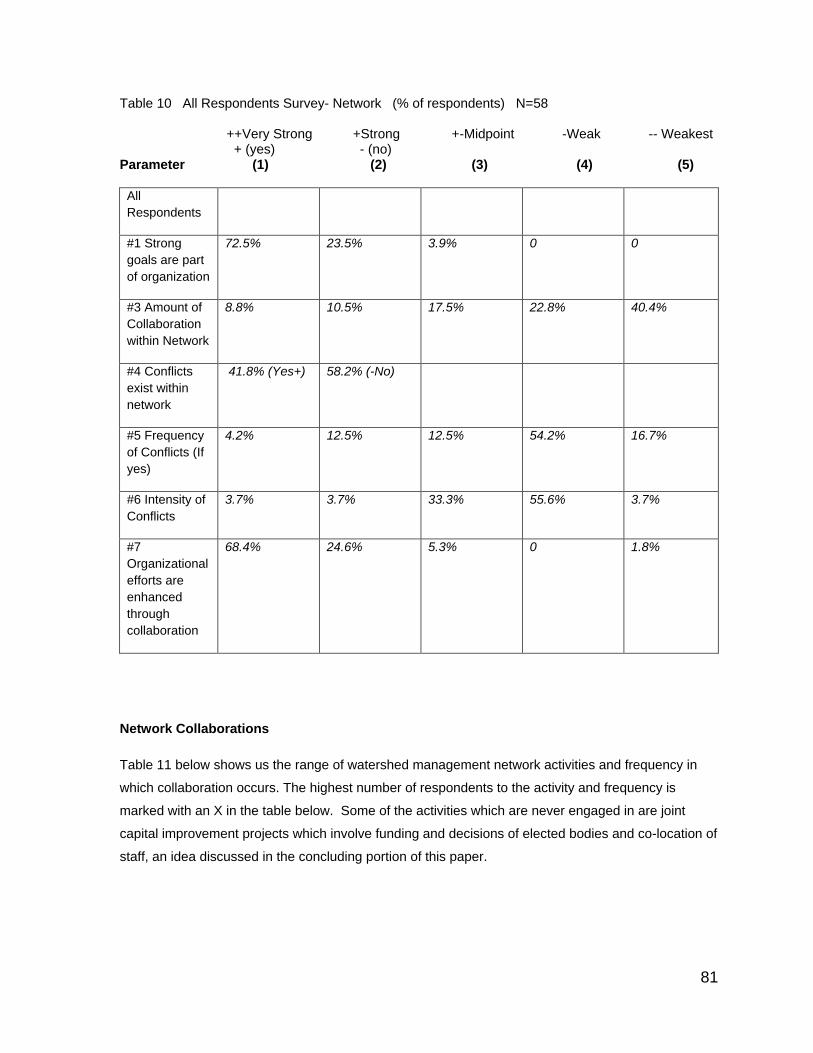
81
Table 10 All Respondents Survey- Network (% of respondents) N=58 ++Very Strong +Strong +-Midpoint -Weak -- Weakest + (yes) - (no) Parameter (1) (2) (3) (4) (5)
All
Respondents
#1 Strong
goals are part
of organization
72.5% 23.5% 3.9% 0 0
#3 Amount of
Collaboration
within Network
8.8% 10.5% 17.5% 22.8% 40.4%
#4 Conflicts
exist within
network
41.8% (Yes+) 58.2% (-No)
#5 Frequency
of Conflicts (If
yes)
4.2% 12.5% 12.5% 54.2% 16.7%
#6 Intensity of
Conflicts
3.7% 3.7% 33.3% 55.6% 3.7%
#7
Organizational
efforts are
enhanced
through
collaboration
68.4% 24.6% 5.3% 0 1.8%
Network Collaborations
Table 11 below shows us the range of watershed management network activities and frequency in
which collaboration occurs. The highest number of respondents to the activity and frequency is
marked with an X in the table below. Some of the activities which are never engaged in are joint
capital improvement projects which involve funding and decisions of elected bodies and co-location of
staff, an idea discussed in the concluding portion of this paper.
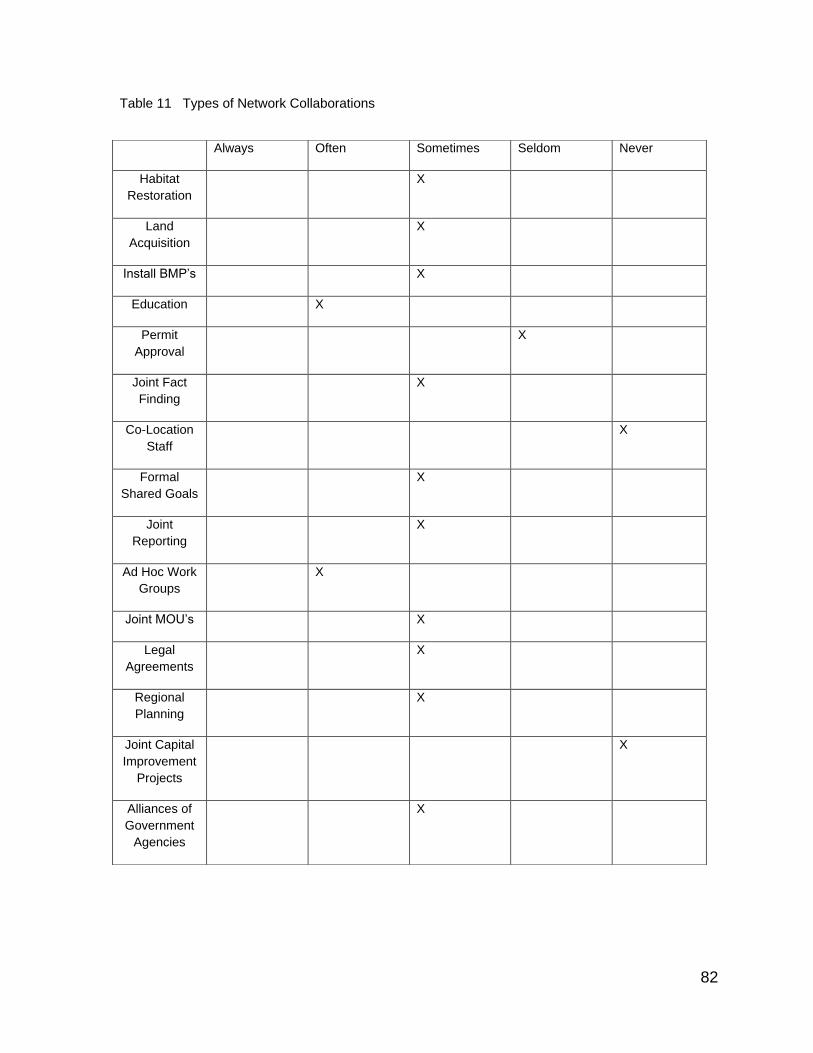
82
Table 11 Types of Network Collaborations
Always Often Sometimes Seldom Never
Habitat
Restoration
X
Land
Acquisition
X
Install BMP’s X
Education X
Permit
Approval
X
Joint Fact
Finding
X
Co-Location
Staff
X
Formal
Shared Goals
X
Joint
Reporting
X
Ad Hoc Work
Groups
X
Joint MOU’s X
Legal
Agreements
X
Regional
Planning
X
Joint Capital
Improvement
Projects
X
Alliances of
Government
Agencies
X
83
Summary of Network Strength Survey Data
In generalizing the preceding data on network strength, there seems to be some generalities at work
in each county, and among all respondents. All of the networks report strong water quality goals. All
of the networks characterize collaboration as being a key feature to the effectiveness of their
organizations. At the same time they seem to indicate that there is room for more collaboration
among organizations. All seem to report relatively low amounts of conflict in both frequency and
intensity. Mecklenburg County has perhaps the most singular watershed management operation, with
a city/county consolidation, strong funding, and control over stormwater, watershed planning, and
overall planning initiatives in the county. In participating in the survey Mecklenburg County frequently
designated a management person to fill out the survey for a number of subordinates, suggesting a
strong command and control structure which was a unique response among the four counties.
When examining the types of collaborative activities we see a predictable pattern. Those activities
which require low commitment are done most often. This would be things like education, and the
creation of ad hoc groups for a special purpose. The activities that are engaged in sometimes are
ones which make sense from the viewpoint of cost sharing or geography. For example habitat
improvement, land acquisitions are common endeavors in which both expense and expertise are
shared to advance the goals of both. The rarest of activities were developing joint, capital
improvement projects and co-location of staff. An activity such as a joint CIP is certainly not a surprise
as such activities involve political autonomy and decision making at the elected body level, something
that is often challenging to do. Co-locating staff is an idea which merits more consideration as a tool
in watershed management. Given the fragmented geography the diverse resources and skills needed
to manage watersheds, this could provide an interesting opportunity for improving funding and
implementation of plans within watersheds.
One consideration of network strength is the ability of a network to produce strong plans. Plans are
the articulation of the aggregate of best thought and intentions towards a problem or issue. The
following data attempts to quantify plan quality in each of the four networks through plan evaluation
administered by network professionals in all four counties, looking at multiple types of plans which
impact water quality.
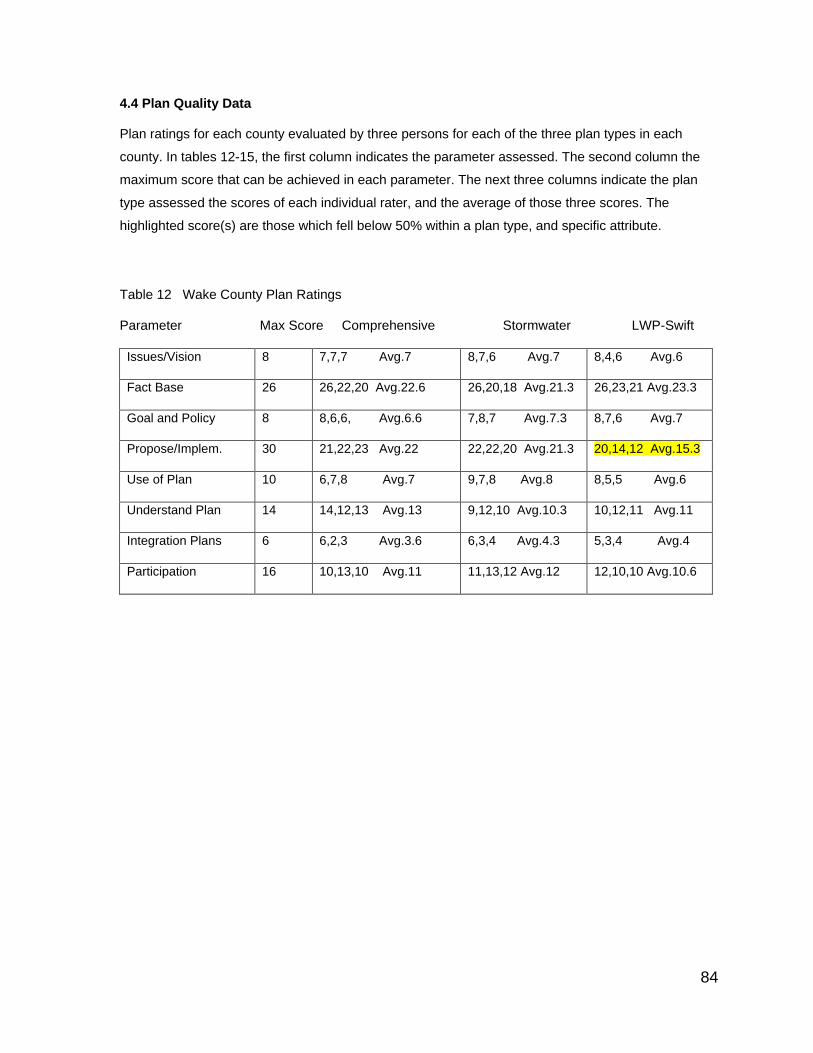
84
4.4 Plan Quality Data Plan ratings for each county evaluated by three persons for each of the three plan types in each
county. In tables 12-15, the first column indicates the parameter assessed. The second column the
maximum score that can be achieved in each parameter. The next three columns indicate the plan
type assessed the scores of each individual rater, and the average of those three scores. The
highlighted score(s) are those which fell below 50% within a plan type, and specific attribute.
Table 12 Wake County Plan Ratings
Parameter Max Score Comprehensive Stormwater LWP-Swift
Issues/Vision 8 7,7,7 Avg.7 8,7,6 Avg.7 8,4,6 Avg.6
Fact Base 26 26,22,20 Avg.22.6 26,20,18 Avg.21.3 26,23,21 Avg.23.3
Goal and Policy 8 8,6,6, Avg.6.6 7,8,7 Avg.7.3 8,7,6 Avg.7
Propose/Implem. 30 21,22,23 Avg.22 22,22,20 Avg.21.3 20,14,12 Avg.15.3
Use of Plan 10 6,7,8 Avg.7 9,7,8 Avg.8 8,5,5 Avg.6
Understand Plan 14 14,12,13 Avg.13 9,12,10 Avg.10.3 10,12,11 Avg.11
Integration Plans 6 6,2,3 Avg.3.6 6,3,4 Avg.4.3 5,3,4 Avg.4
Participation 16 10,13,10 Avg.11 11,13,12 Avg.12 12,10,10 Avg.10.6
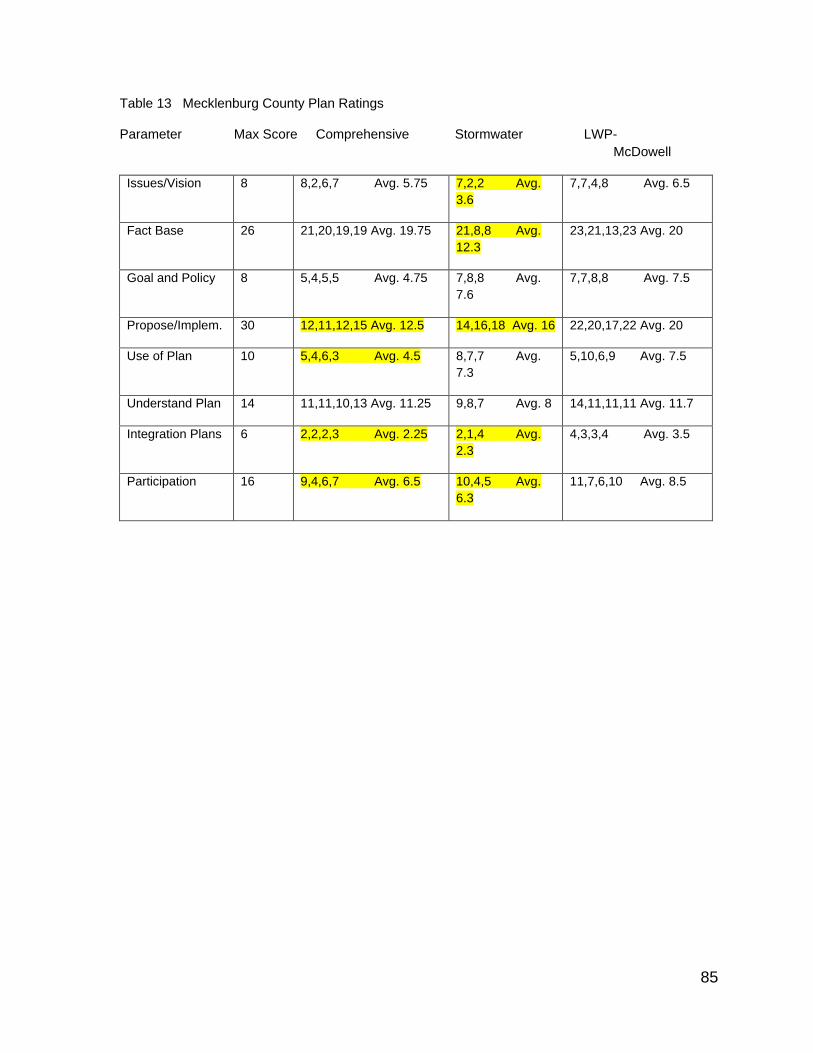
85
Table 13 Mecklenburg County Plan Ratings
Parameter Max Score Comprehensive Stormwater LWP-
McDowell
Issues/Vision 8 8,2,6,7 Avg. 5.75 7,2,2 Avg.
3.6
7,7,4,8 Avg. 6.5
Fact Base 26 21,20,19,19 Avg. 19.75 21,8,8 Avg.
12.3
23,21,13,23 Avg. 20
Goal and Policy 8 5,4,5,5 Avg. 4.75 7,8,8 Avg.
7.6
7,7,8,8 Avg. 7.5
Propose/Implem. 30 12,11,12,15 Avg. 12.5 14,16,18 Avg. 16 22,20,17,22 Avg. 20
Use of Plan 10 5,4,6,3 Avg. 4.5 8,7,7 Avg.
7.3
5,10,6,9 Avg. 7.5
Understand Plan 14 11,11,10,13 Avg. 11.25 9,8,7 Avg. 8 14,11,11,11 Avg. 11.7
Integration Plans 6 2,2,2,3 Avg. 2.25 2,1,4 Avg.
2.3
4,3,3,4 Avg. 3.5
Participation 16 9,4,6,7 Avg. 6.5 10,4,5 Avg.
6.3
11,7,6,10 Avg. 8.5
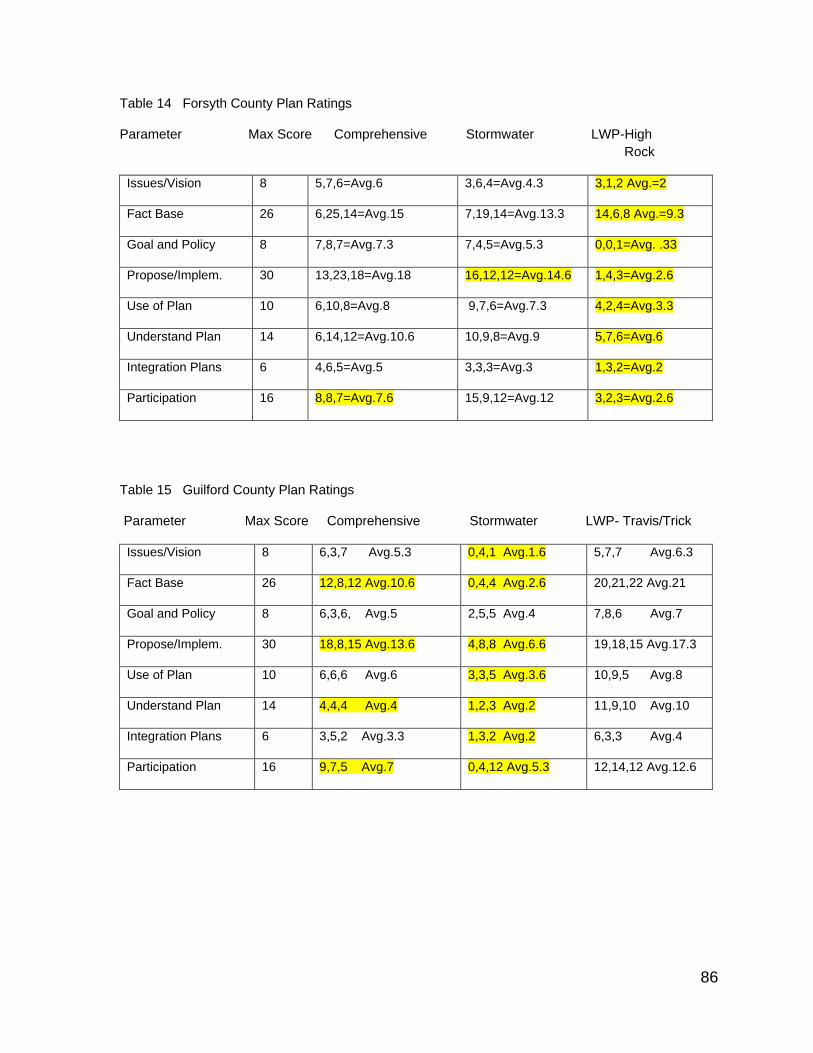
86
Table 14 Forsyth County Plan Ratings
Parameter Max Score Comprehensive Stormwater LWP-High
Rock
Issues/Vision 8 5,7,6=Avg.6 3,6,4=Avg.4.3 3,1,2 Avg.=2
Fact Base 26 6,25,14=Avg.15 7,19,14=Avg.13.3 14,6,8 Avg.=9.3
Goal and Policy 8 7,8,7=Avg.7.3 7,4,5=Avg.5.3 0,0,1=Avg. .33
Propose/Implem. 30 13,23,18=Avg.18 16,12,12=Avg.14.6 1,4,3=Avg.2.6
Use of Plan 10 6,10,8=Avg.8 9,7,6=Avg.7.3 4,2,4=Avg.3.3
Understand Plan 14 6,14,12=Avg.10.6 10,9,8=Avg.9 5,7,6=Avg.6
Integration Plans 6 4,6,5=Avg.5 3,3,3=Avg.3 1,3,2=Avg.2
Participation 16 8,8,7=Avg.7.6 15,9,12=Avg.12 3,2,3=Avg.2.6
Table 15 Guilford County Plan Ratings
Parameter Max Score Comprehensive Stormwater LWP- Travis/Trick
Issues/Vision 8 6,3,7 Avg.5.3 0,4,1 Avg.1.6 5,7,7 Avg.6.3
Fact Base 26 12,8,12 Avg.10.6 0,4,4 Avg.2.6 20,21,22 Avg.21
Goal and Policy 8 6,3,6, Avg.5 2,5,5 Avg.4 7,8,6 Avg.7
Propose/Implem. 30 18,8,15 Avg.13.6 4,8,8 Avg.6.6 19,18,15 Avg.17.3
Use of Plan 10 6,6,6 Avg.6 3,3,5 Avg.3.6 10,9,5 Avg.8
Understand Plan 14 4,4,4 Avg.4 1,2,3 Avg.2 11,9,10 Avg.10
Integration Plans 6 3,5,2 Avg.3.3 1,3,2 Avg.2 6,3,3 Avg.4
Participation 16 9,7,5 Avg.7 0,4,12 Avg.5.3 12,14,12 Avg.12.6
87
Summary of Plan Evaluation Data The three types of plans were evaluated by individuals who have knowledge and skills in government
planning. None of the evaluators assessed plans from the jurisdiction in which they lived or worked.
Sample plans of a Comprehensive, a Stormwater and a Watershed plan were given to each
evaluator. Each county had three evaluators, which provided a total of 9 plan observations for each
county by three differing evaluators.
Wake County presented the best plans in all three categories. Much of their planning efforts were
done at expense by hired contractors, and presented strongly to the evaluators, Mecklenburg County
does much of their planning in-house and presented some weaknesses in the comprehensive and
stormwwater plan type. There watershed planning was quite strong. Forsyth County had strong
comprehensive and stormwater plans, and a weak watershed plan. Guilford County had a weak
comprehensive and Stormwater plan.
In looking across attributes for all four counties, the two which were most commonly lacking for all of
the plan types and most counties were implementation and participation. The fact that three of the
four counties had perceived deficiencies in one or more types of plans indicates that county planning
is not as robust in relation to watershed protection as it could be.
The three plan types (Comprehensive, Stormwater, and Watershed), are all important and intertwined
in the protection of water resources. Comprehensive plans speak to the needs of responsible
development. Stormwater plans protect and mitigate against the impacts of development, and
watershed plans typically are remediating the effects which remain after the implementation of the
other two plan types.
These evaluations suggest improvements need to be made in planning efforts, and may reflect
weaknesses in the network, or a lack of political interest which may lead to a lack of funding for plan
implementation, rendering the networks less the effective.
Table 16 attempts to further refine the assessment and scores of plan evaluators by placing scores
by attribute on a 100 point scale and ascribing a grade of excellent, very good, good, fair and poor for
each county.

88
In table 16 each parameter is averaged by all three plan types, and then rated on a 100 point scale.
This indicates of all the plan parameters, the poorest results were in implementation, integration of
plans, and participation. This was followed by use of plan which achieved barely a good rating.
Highest ratings were found in issues and vision. In Wake County the ratings of plan evaluators seem
to align themselves well with the respondent perceptions of their planning efforts. The scores were:
1=excellent, 2=very good, 3=good, 4=fair, 5=poor
Table 16 County Plan Ratings- All Plan Types Combined
1-excellent 2-very good 3-good 4-fair 5-poor
90-100% 80-90% 70-80% 60-70% <60%
County/Attribute Wake Mecklenburg Forsyth Guilford
Issues/Vision 83% 66% 51% 55%
Fact Based 86% 66% 48% 43%
Goal/Policy 87% 82% 53% 66%
Implementation 65% 53% 39% 41%
Use of Plan 70% 64% 62% 58%
Understandable 81% 73% 60% 38%
Integration 66% 44% 55% 51%
Participation 70% 44% 46% 51%
This table shows a pattern of the best plans coming from Wake, followed by Mecklenburg, then
Forsyth, and finally Guilford County. The lowest attributes across counties were for implementation
and participation. The larger counties of Wake and Mecklenburg typically have larger resources for
planning efforts.
Table 17 combines the attribute scores by county and plan type and assigns an overall grade of
excellent, very good, good, fair, and poor.
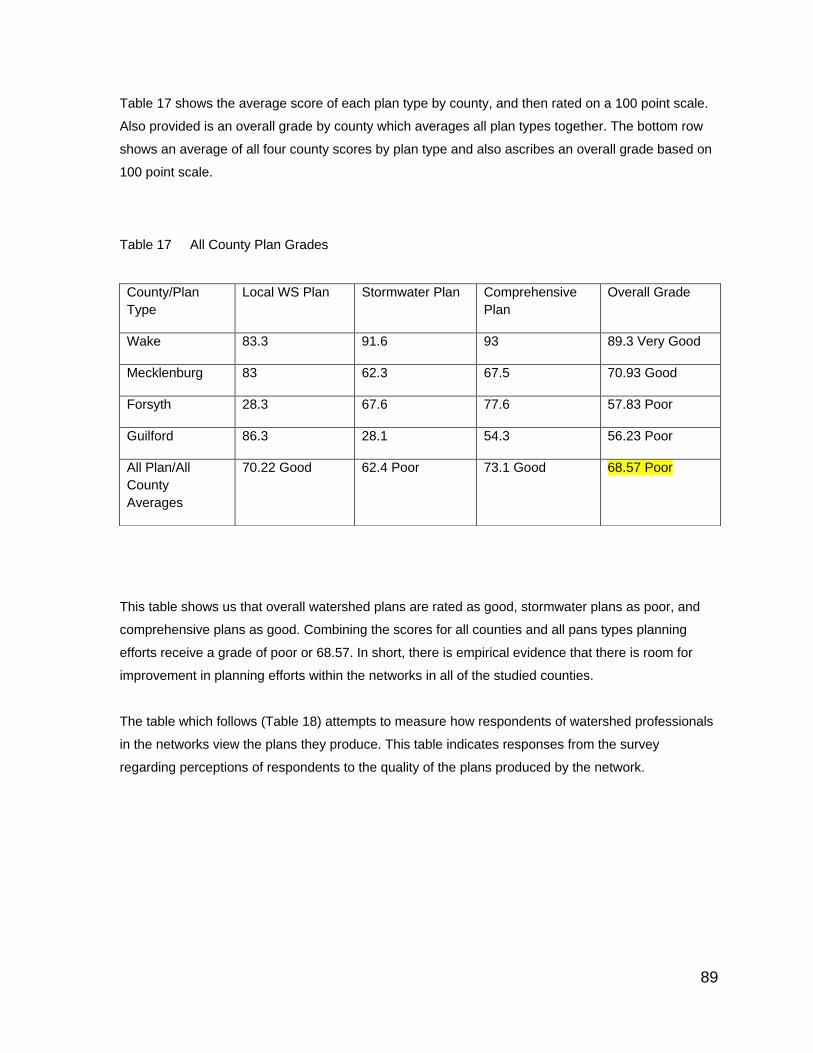
89
Table 17 shows the average score of each plan type by county, and then rated on a 100 point scale.
Also provided is an overall grade by county which averages all plan types together. The bottom row
shows an average of all four county scores by plan type and also ascribes an overall grade based on
100 point scale.
Table 17 All County Plan Grades
This table shows us that overall watershed plans are rated as good, stormwater plans as poor, and
comprehensive plans as good. Combining the scores for all counties and all pans types planning
efforts receive a grade of poor or 68.57. In short, there is empirical evidence that there is room for
improvement in planning efforts within the networks in all of the studied counties.
The table which follows (Table 18) attempts to measure how respondents of watershed professionals
in the networks view the plans they produce. This table indicates responses from the survey
regarding perceptions of respondents to the quality of the plans produced by the network.
County/Plan
Type
Local WS Plan Stormwater Plan Comprehensive
Plan
Overall Grade
Wake 83.3 91.6 93 89.3 Very Good
Mecklenburg 83 62.3 67.5 70.93 Good
Forsyth 28.3 67.6 77.6 57.83 Poor
Guilford 86.3 28.1 54.3 56.23 Poor
All Plan/All
County
Averages
70.22 Good 62.4 Poor 73.1 Good 68.57 Poor
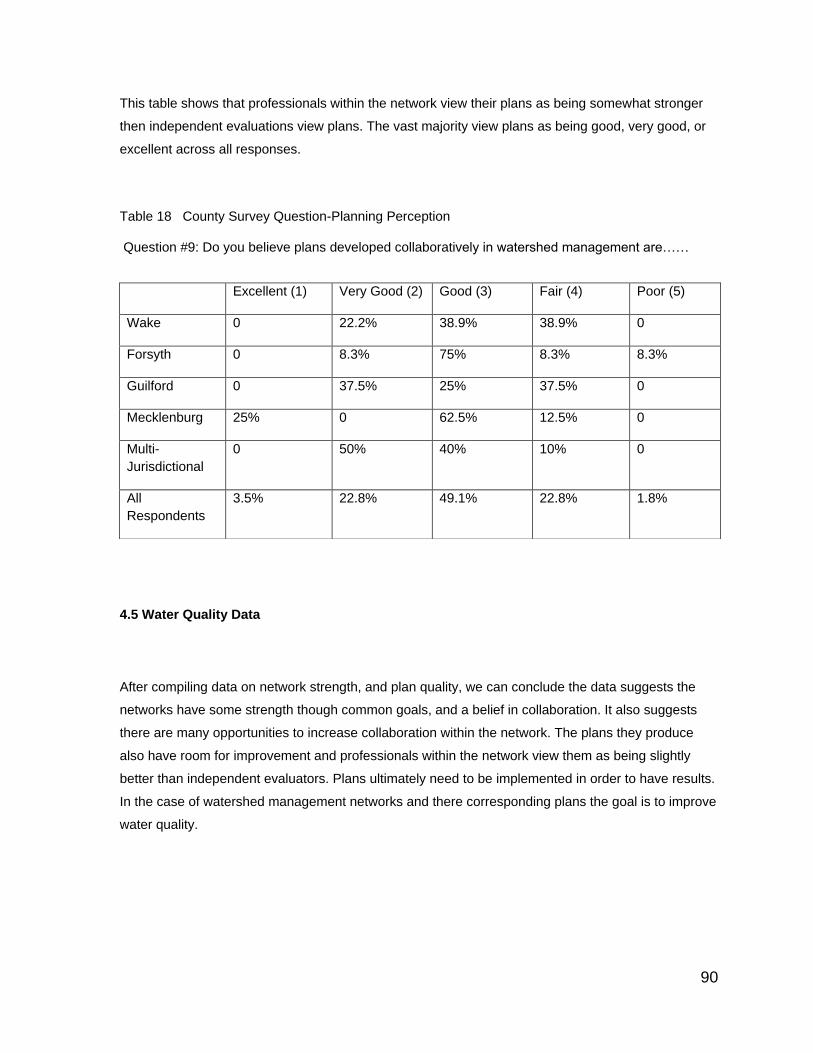
90
This table shows that professionals within the network view their plans as being somewhat stronger
then independent evaluations view plans. The vast majority view plans as being good, very good, or
excellent across all responses.
Table 18 County Survey Question-Planning Perception
Question #9: Do you believe plans developed collaboratively in watershed management are……
4.5 Water Quality Data
After compiling data on network strength, and plan quality, we can conclude the data suggests the
networks have some strength though common goals, and a belief in collaboration. It also suggests
there are many opportunities to increase collaboration within the network. The plans they produce
also have room for improvement and professionals within the network view them as being slightly
better than independent evaluators. Plans ultimately need to be implemented in order to have results.
In the case of watershed management networks and there corresponding plans the goal is to improve
water quality.
Excellent (1) Very Good (2) Good (3) Fair (4) Poor (5)
Wake 0 22.2% 38.9% 38.9% 0
Forsyth 0 8.3% 75% 8.3% 8.3%
Guilford 0 37.5% 25% 37.5% 0
Mecklenburg 25% 0 62.5% 12.5% 0
Multi-
Jurisdictional
0 50% 40% 10% 0
All
Respondents
3.5% 22.8% 49.1% 22.8% 1.8%
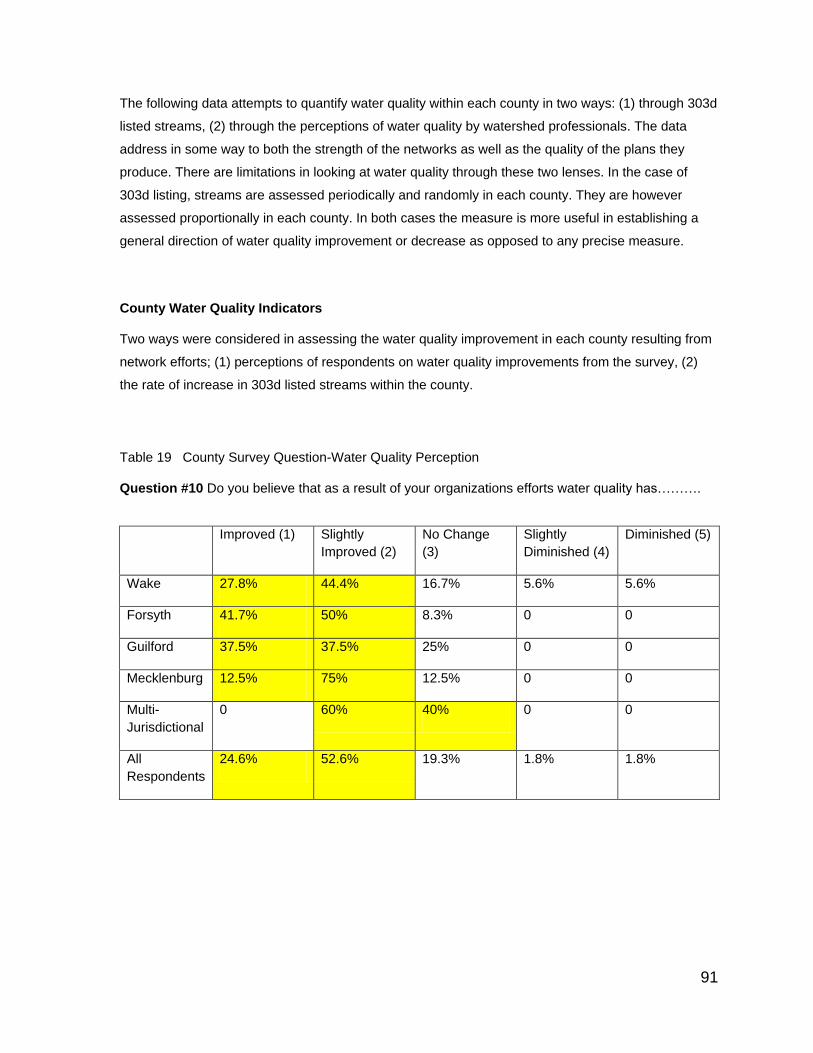
91
The following data attempts to quantify water quality within each county in two ways: (1) through 303d
listed streams, (2) through the perceptions of water quality by watershed professionals. The data
address in some way to both the strength of the networks as well as the quality of the plans they
produce. There are limitations in looking at water quality through these two lenses. In the case of
303d listing, streams are assessed periodically and randomly in each county. They are however
assessed proportionally in each county. In both cases the measure is more useful in establishing a
general direction of water quality improvement or decrease as opposed to any precise measure.
County Water Quality Indicators
Two ways were considered in assessing the water quality improvement in each county resulting from
network efforts; (1) perceptions of respondents on water quality improvements from the survey, (2)
the rate of increase in 303d listed streams within the county.
Table 19 County Survey Question-Water Quality Perception
Question #10 Do you believe that as a result of your organizations efforts water quality has……….
Improved (1) Slightly
Improved (2)
No Change
(3)
Slightly
Diminished (4)
Diminished (5)
Wake 27.8% 44.4% 16.7% 5.6% 5.6%
Forsyth 41.7% 50% 8.3% 0 0
Guilford 37.5% 37.5% 25% 0 0
Mecklenburg 12.5% 75% 12.5% 0 0
Multi-
Jurisdictional
0 60% 40% 0 0
All
Respondents
24.6% 52.6% 19.3% 1.8% 1.8%
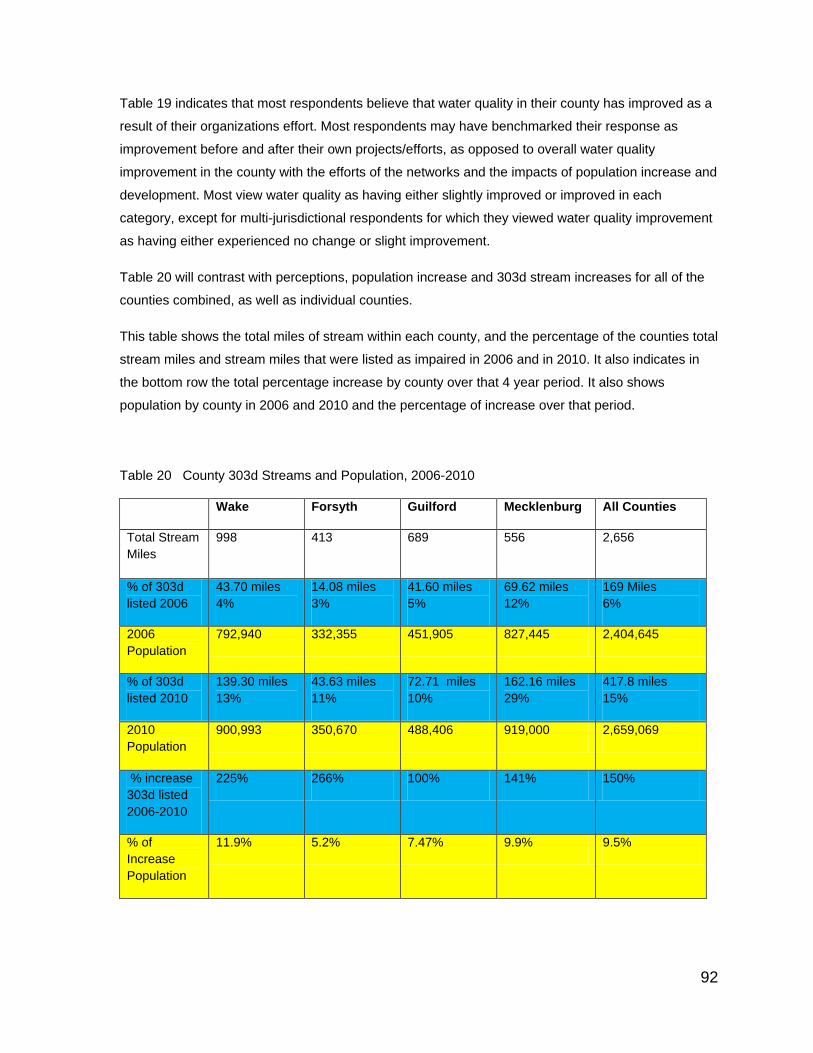
92
Table 19 indicates that most respondents believe that water quality in their county has improved as a
result of their organizations effort. Most respondents may have benchmarked their response as
improvement before and after their own projects/efforts, as opposed to overall water quality
improvement in the county with the efforts of the networks and the impacts of population increase and
development. Most view water quality as having either slightly improved or improved in each
category, except for multi-jurisdictional respondents for which they viewed water quality improvement
as having either experienced no change or slight improvement.
Table 20 will contrast with perceptions, population increase and 303d stream increases for all of the
counties combined, as well as individual counties.
This table shows the total miles of stream within each county, and the percentage of the counties total
stream miles and stream miles that were listed as impaired in 2006 and in 2010. It also indicates in
the bottom row the total percentage increase by county over that 4 year period. It also shows
population by county in 2006 and 2010 and the percentage of increase over that period.
Table 20 County 303d Streams and Population, 2006-2010
Wake Forsyth Guilford Mecklenburg All Counties
Total Stream
Miles
998 413 689 556 2,656
% of 303d
listed 2006
43.70 miles
4%
14.08 miles
3%
41.60 miles
5%
69.62 miles
12%
169 Miles
6%
2006
Population
792,940 332,355 451,905 827,445 2,404,645
% of 303d
listed 2010
139.30 miles
13%
43.63 miles
11%
72.71 miles
10%
162.16 miles
29%
417.8 miles
15%
2010
Population
900,993 350,670 488,406 919,000 2,659,069
% increase
303d listed
2006-2010
225% 266% 100% 141% 150%
% of
Increase
Population
11.9% 5.2% 7.47% 9.9% 9.5%
93
Contrasting with positive perceptions about water quality improvement in each county is the rate of
increase of 303d listed streams. It should be noted that in a four-year span all counties combined
have gone from listing 6% of its total stream miles as impaired to 15% of its total stream miles in 2010
an increase in 4 years of 151%, while populations have increased in the same time span by only
9.5%. Wake County leads the way having the most population growth as well as the greatest
increase in 303d listing. Forsyth County shows one of the greatest increases in 303d listed streams
and some of the smallest population increases of the four studied counties. Undoubtedly things would
be much worse without the efforts of the networks, but it is apparent that the stress on watersheds is
far outpacing what the networks can do though planning an implementation.
It should be noted that for the purposes of this study streams were cut at the geographic boundaries
of the county, from which water quality problems are often complex and created from outside geo-
political boundaries and are in some instances outside of the control of individual counties.
The data would also suggest that stormwater measures, current ordinances and combined efforts
from local, state and federal sources aimed at protecting the environment are insufficient. It suggests
that the impacts may reach beyond anything the current network structure can do to address the
problem. While more research would need to be done, it would seem that the rate of increase in each
of the four cases for 303d listed streams jumps dramatically along with the population increase.
Cumulatively for all four counties, when population jumps by 9.5% the rate of increase in 303d listed
streams jumps to 150%%. Similar ratios seem to appear for each of the four counties.
An attempt was made through statistical analysis to determine if any correlative relationships exist
between the survey questions which were used to measure network strength, plan quality, and water
quality. The tables are presented by county, then by multi-jurisdictional responses (N=11) and finally
from all responses grouped together (N=58). In some case the data sets were quite small (Guilford
N=8, and Mecklenburg N=8). In other instances a bit more robust (Wake N=19 and Forsyth N=12).
The strongest data set is all respondents in which N=58. These correlations should be considered the
best and the strongest. The correlations for each county were generally small and not particularly
useful. No real significant correlations were observed and so only the correlation table for all
respondents is included in table 21 where more meaningful correlation occurs.
4.6 Correlation Data In the table that follows (Table 21), shows correlative relationships within the survey from all
respondents
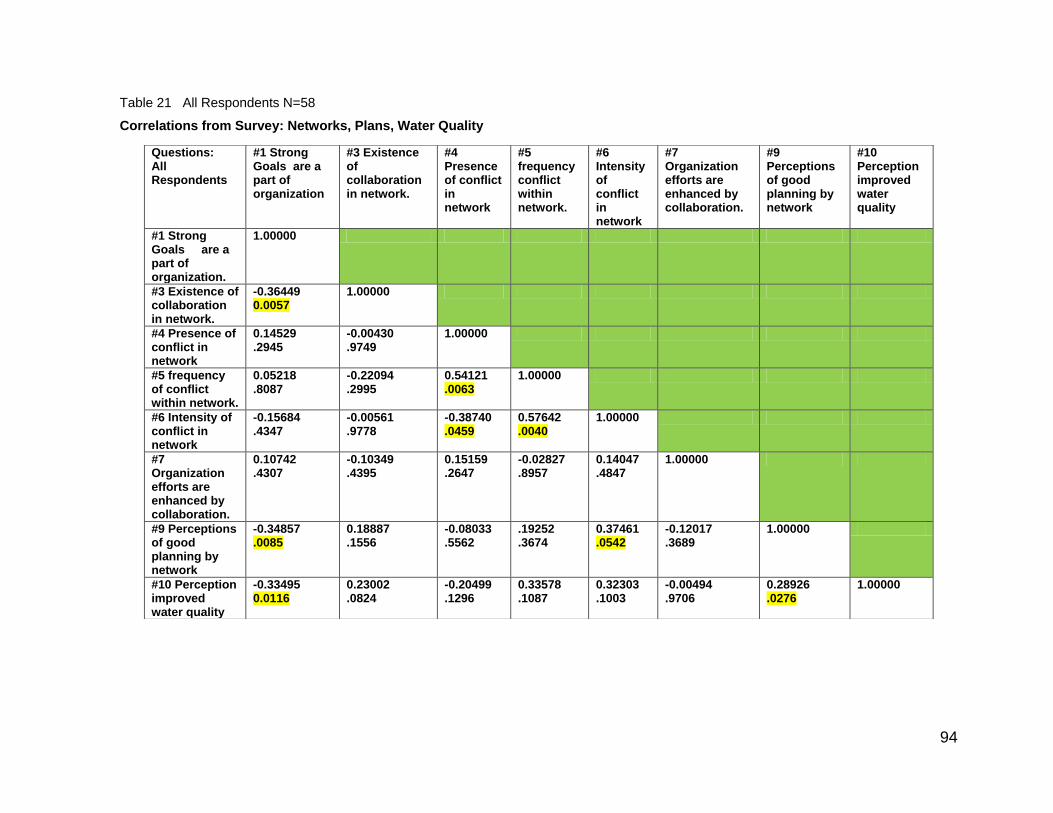
94
Table 21 All Respondents N=58
Correlations from Survey: Networks, Plans, Water Quality
Questions: All Respondents
#1 Strong Goals are a part of organization
#3 Existence of collaboration in network.
#4 Presence of conflict in network
#5 frequency conflict within network.
#6 Intensity of conflict in network
#7 Organization efforts are enhanced by collaboration.
#9 Perceptions of good planning by network
#10 Perception improved water quality
#1 Strong Goals are a part of organization.
1.00000
#3 Existence of collaboration in network.
-0.36449 0.0057
1.00000
#4 Presence of conflict in network
0.14529 .2945
-0.00430 .9749
1.00000
#5 frequency of conflict within network.
0.05218 .8087
-0.22094 .2995
0.54121 .0063
1.00000
#6 Intensity of conflict in network
-0.15684 .4347
-0.00561 .9778
-0.38740 .0459
0.57642 .0040
1.00000
#7 Organization efforts are enhanced by collaboration.
0.10742 .4307
-0.10349 .4395
0.15159 .2647
-0.02827 .8957
0.14047 .4847
1.00000
#9 Perceptions of good planning by network
-0.34857 .0085
0.18887 .1556
-0.08033 .5562
.19252
.3674 0.37461 .0542
-0.12017 .3689
1.00000
#10 Perception improved water quality
-0.33495 0.0116
0.23002 .0824
-0.20499 .1296
0.33578 .1087
0.32303 .1003
-0.00494 .9706
0.28926 .0276
1.00000
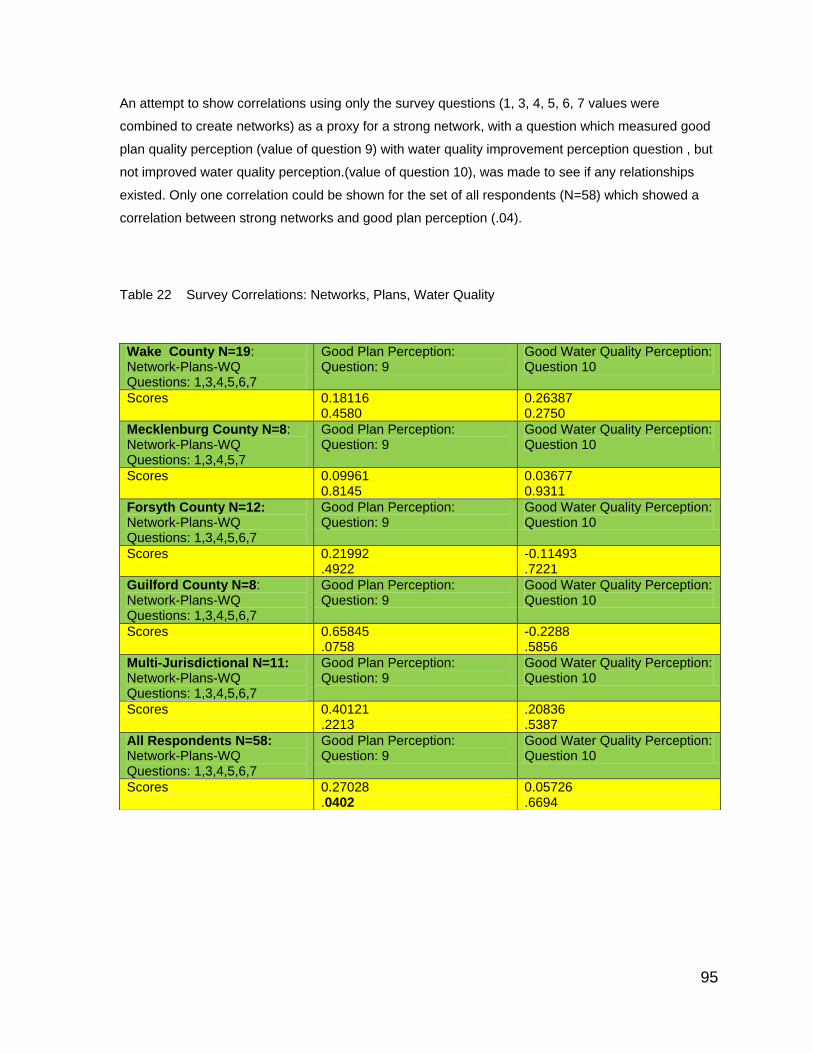
95
An attempt to show correlations using only the survey questions (1, 3, 4, 5, 6, 7 values were
combined to create networks) as a proxy for a strong network, with a question which measured good
plan quality perception (value of question 9) with water quality improvement perception question , but
not improved water quality perception.(value of question 10), was made to see if any relationships
existed. Only one correlation could be shown for the set of all respondents (N=58) which showed a
correlation between strong networks and good plan perception (.04).
Table 22 Survey Correlations: Networks, Plans, Water Quality
Wake County N=19: Network-Plans-WQ Questions: 1,3,4,5,6,7
Good Plan Perception: Question: 9
Good Water Quality Perception: Question 10
Scores 0.18116 0.4580
0.26387 0.2750
Mecklenburg County N=8: Network-Plans-WQ Questions: 1,3,4,5,7
Good Plan Perception: Question: 9
Good Water Quality Perception: Question 10
Scores 0.09961 0.8145
0.03677 0.9311
Forsyth County N=12: Network-Plans-WQ Questions: 1,3,4,5,6,7
Good Plan Perception: Question: 9
Good Water Quality Perception: Question 10
Scores 0.21992 .4922
-0.11493 .7221
Guilford County N=8: Network-Plans-WQ Questions: 1,3,4,5,6,7
Good Plan Perception: Question: 9
Good Water Quality Perception: Question 10
Scores 0.65845 .0758
-0.2288 .5856
Multi-Jurisdictional N=11: Network-Plans-WQ Questions: 1,3,4,5,6,7
Good Plan Perception: Question: 9
Good Water Quality Perception: Question 10
Scores 0.40121 .2213
.20836
.5387
All Respondents N=58: Network-Plans-WQ Questions: 1,3,4,5,6,7
Good Plan Perception: Question: 9
Good Water Quality Perception: Question 10
Scores 0.27028 .0402
0.05726 .6694
96
Summary of Correlations Data
These tables show correlations among planning goals, collaboration, conflict, and perceptions of
planning and water quality within the survey instrument. Strong goals correlate with high collaboration
(.005). Not a surprising fact are those organizations with well-defined goals are equipped and desire
to collaborate to achieve their goals, and as the survey tells us they see collaboration as an
enhancement to doing so.
Strong goals also correlate with strong plan perception (.008), or in other words those organizations
within the network with strong water quality goals are more likely to view, or have an opinion that
planning efforts as strong or deficient.
Strong goals correlate with improved water quality perceptions (.01), in a similar way organizations
with a strong singular goal of improved water quality are likely to have a measurable perception of
how they are doing as opposed to an organization with multiple or more diffuse goals.
The presence of conflict correlates frequency of conflicts (.006), demonstrating the obvious fact that
as observations of conflict are observed the frequency also rises, this observation of observable
conflict also shows that with increased observations comes increased intensity of the conflict (.04).
A correlation was also observed between perceptions of good planning, that also correlates with
perceptions of good water quality (.027). While this assumption is logical and widely held among
professionals in the survey, other data would suggest plans are not of the quality believed and water
quality continues to deteriorate in North Carolina’s urbanizing counties.
Table 22 looks at the broad model of a strong network, creates strong plans, which lead to improved
water quality, viewed through the survey instrument. The only correlation that could be observed here
was that strong networks lead to strong plan quality perception
4.7 Summary of Results
Wake County
Of the four counties Wake County ranked second in population with 900,993 people. It had the
largest land mass of 835 square miles and ranked first of the four counties. In terms of population
97
density it ranked second with 1078 people per square mile. It is first in miles of stream with over 998
miles of stream. Wake County ranked second in both 2006 (43.7 miles) and 2010 (139 miles) in 303d
listed streams. The increase was 9% which also ranks second among the studied counties. The plans
produced by Wake County were the best of the four counties ranking number one with a combined
average score of the three plan types (local watershed plan, stormwater plan, and comprehensive
plan) of 89.3. The weakest aspect of the plan was found in the local watershed plan in
implementation. Wake County had the highest percentage of population increase of 11.9% over a
four year period, which also had an increase of 303d listed streams of 69% for the same period. This
is the highest for all of the four studied counties.
Wake County had the highest response rate of 19 out of 25 respondents for a response rate of 76%
among the four studied counties. Results from Wake County respondents show that a correlation
exists between:
Presence of conflict and the intensity of conflict (.04) within the network.
It failed to show any correlation between the network, good plan perception and good water quality
perception.
Mecklenburg County Of the four counties Mecklenburg County ranked first in population with 919,000 people. It had the
third largest land mass of 523 square miles and ranked third of the four counties. In terms of
population density it ranked first with 1755 people per square mile. It is three in miles of stream with
over 556 miles of stream. It ranked first in both 2006 (69.62 miles) and 2010 (162.16 miles) in 303d
listed streams. The increase was 17% which also ranks first among the studied counties. The plans
produced by Mecklenburg County were the second best of the four counties with a combined average
score of the three plan types (local watershed plan, stormwater plan, comprehensive plan) of 70.9.
The weakest types of plans were found in the comprehensive plan which lacked in terms of
implementation, use of plan, integration with other plans, and participation. The stormwater plans
were found to be lacking in vision, fact based, implementation, integration with other plans, and
participation. Mecklenburg County saw a population increase of 5.2% during the period of 2006 to
2010 and an increase of 67% in 303d listed streams for the same period. This was the lowest growth
in population yet the second highest increase in 303d listed streams.
98
Mecklenburg County had a response rate of 60% or 12 respondents out of 20. There seemed to be
some reticence expressed on how the information would be used, and a reliance on supervisors to
express the information on behalf of a larger group. The data from respondents in Mecklenburg
County indicate a correlation between:
Perception of good water quality and the intensity of conflict within the network (.001).
Conflict and collaboration (05).
Forsyth County
Of the four counties Forsyth County ranked fourth in population with 350,670 people. It had the fourth
largest land mass of 408 square. In terms of population density it ranked third with 859.2 people per
square mile. It is fourth in miles of stream with over 413 miles of stream. Forsyth ranked fourth in both
2006 (14.08 miles) and 2010 (43.63 miles) in 303d listed streams .The population increase between
years 2006-2010 was 7.4% while 303d listed streams grew by 43% during the same period. This was
the lowest increase in 303d listed streams of the four studied counties. The plans produced by
Forsyth County were the third best of the four counties with a combined average score of the three
plan types (local watershed plan, stormwater plan, comprehensive plan) of 57.8. The weakest types
of plans were found in the comprehensive plan which lacked in terms of participation. The local
watershed plan was found to be lacking in every measure and received the lowest score of 28.3.
Forsyth County had a good response rate of 57% or 8 out of 14 respondents from the professionals in
the network that were contacted. A negative correlation was found between:
Strong goals and good plan perception (.0007)
Strong goals and good water quality perception (.006).
No correlations could be found between strong networks, good plan perception and good water
quality perception.
Guilford County
Of the four counties Guilford County ranked fourth in population with 488,406 people. It had the
second largest land mass of 645 square miles of the four counties. In terms of population density it
99
ranked fourth with 756.4 people per square mile. It is second in miles of stream with over 689 miles of
stream. It ranked third in both 2006 (41.60 miles), and 2010 (72.71 miles), in 303d listed streams. The
population increased between the years 2006-2010 by 9.9% and 303d listed streams grew by 59%
during the same period. The plans produced by Guilford County were the fourth best of the counties
with a combined average score of the three plan types (local watershed plan, stormwater plan,
comprehensive plan) of 56.23, although it is very comparable to Forsyth County in that regard. The
weakest types of plans were found in the comprehensive plan which lacked in terms of being fact
based, implementation, understanding of plan, and participation. The stormwater plan failed in nearly
every measure except for being goal based.
The small number of respondents, 8 out of 14 or a 57% response rate, make conclusions about
Guilford County limited, however in Guilford County negative correlations were found between:
Strong goals and collaboration (.02)
Collaboration and presence of conflict (.01).
Frequency of conflict and collaboration (.004).
Intensity of conflict and presence of conflict (.0001).
One positive correlation was found between:
Presence of conflict and frequency of conflict (.002)
Multi-jurisdictional respondents were composed of federal, state, non-profit land trusts, and
conservation organizations that operate outside of any geo-political boundaries in North Carolina. The
correlations found in this set of respondents were between collaboration and planning. Since planning
and collaboration are the natural activities of these multi-jurisdictional entities this result is not
surprising. Collectively these organizations saw an increase of 9% of 303d listed streams. The viewed
the plans produced by the networks as either good or very good, and had a view of their efforts at
improving water quality as having produced, no change (40%), or slight improvement (60%). When
comparing these perceptions from the survey to the overall plan ratings of plans rated using the plan
assessment tool, we find that for all plan types, across all four counties, plans were received an
overall rating of 68.7, very close to an average score. Every county had a plan type they were
deficient in, and most plans trended towards needing improvement in implementation and
participation. In short these respondents were just slightly more optimistic in terms of planning and
100
water quality, but trended in a very similar way with the measures of 303d listing, and independent
plan ratings. They had a very high response rate to the survey of 11 out of 14 or a 78%response rate.
All Respondents (N=58)
There were eighty-eight requests for the survey sent out to specific agencies and professionals
involved in watershed network activities in the four urbanizing counties, and state, federal and non-
profit agencies at work in these counties. The data set is the most reliable and large of all of the sets
looked at. The highest numbers of correlations were observed when looking at all respondents, as
well as a correlation between networks and good planning perception. There were 58 out of 88
surveys returned a response rate of 65%. For all four counties combined, the population growth rate
between the years of 2006-2010 was 9.5% and 303d listed streams grew by 59% during the same
period.
Strong goals correlate with high collaboration (.005)
Strong goals correlate with strong plan perception (.008)
Strong goals correlate with improved water quality perceptions (.01)
Presence of conflict correlates frequency of conflicts (.006)
Presence of conflict correlates with intensity of conflict (.04)
Frequency of conflict correlates with intensity of conflict (.004)
Frequency of conflict correlates with high value on collaboration (.01)
Perceptions of good planning correlates with perceptions of good water quality (.027)
*Strong networks (Questions 1-7) correlates to good planning perception (.04)
When perceptions of water quality are compiled by all respondents to the survey, and compared with
the gains in 303d listing we find respondents to be more optimistic about efforts at improving water
quality. Among all respondents 24.6 % believed water quality has improved, while 52% believed
things had slightly improved, and 19.3% believed there was no change. 303d listing showed an
overall increase of 59% in 303d listed stream miles, between years 2006-2010. When contrasting
perceptions of good planning from the survey with the data produced using the plan assessment tool,
71.9% of all respondents believed that plans were either good or very good. The average plan
assessment score for all plan types across all counties however scored a 68.57, on a scale of 100.

101
While most counties showed some outstanding plan types nearly all had one type of plan that was
deficient. Nearly all plans showed deficiencies in implementation and in participation.
102
Chapter 5 Conclusions I will discuss the findings based on empirical data and results. These will be presented for each
hypothesis, and for other salient findings of the research. Following this will be a brief discussion
related to the empirical findings with applications from these case study counties. Data on network
strength was gathered primarily through the survey, plan quality was determined both from plan
quality perception as well by independent evaluation of multiple plans from all counties. Water quality
was determined both through respondent perceptions from the survey as well as the 303d list of
impaired streams published bi-annually from the EPA. Stream quality was measured by length of
EPA 303d listed streams.
5.1 Hypothesis
H1 Strong networks produce good plans in urbanizing North Carolina counties.
After analyzing the data on the networks ability to produce strong plans, I have concluded that the
studied networks are strong networks, and do produce good/fair plans. The networks in urbanizing
counties in North Carolina were found to be strong based on the survey assessment. Collaboration
was highly valued, strong water quality goals were evident, and there was some conflict, which was
characterized as being infrequent and of low intensity. Networks produced some strong plans among
the three types examined, but the average scores for all plan types and all counties were rated as
fair. Plan types for all four counties scores averaged 68.57.
H2 Good plans lead to increased implementation in urbanizing North Carolina counties. After carefully analyzing the data on good plans and their link to implementation, I have concluded
that strong plans are likely an important component for increased implementation but could not be
empirically linked in this study, by themselves, as a cause of increased implementation. Even good
plans within the network had weakness identified by independent evaluators, in implementation and
participation in each of the four counties where the plans were independently evaluated. The EPA list
of 303d listed streams would indicate that the perceptions of respondents are optimistic and that
deterioration of water quality is increasing. In fact for all four counties the rate of 303d listed streams
average percent of increase was 151% between 2006 and 2010. Some of their optimism expressed
103
as improvement may stem from the reality that without the collective efforts of the network in
urbanizing counties the rate would be much higher.
Some consideration was given to see if plans prepared by contractors were of lower quality then
those prepared in-house. The findings indicate that contractor prepared plans scored slightly better,
although the sample size was small. As such, it is unknown if differences exist between plans done
in-house or those prepared by contractors. And which ultimately led to more or less implementation
(Appendix 9)
H3 Watershed management networks are not effective in improving actual water quality in
urbanizing North Carolina counties.
The research indicates that the watershed networks are not effective in improving actual in-stream
water quality in urbanizing North Carolina counties. This is evidenced by indications form the survey
of network strength, coupled with an increase of 150% of 303d listed streams between 2006 and
2010. It should be noted that the measures of water quality perception and 303d listing have
limitations in reaching concrete conclusions in this regard, but do indicate a need for further study,
better measures of water quality improvement, and other network improvements. This raises serious
questions about the amount of time and resources committed to the problem. It is likely the networks
do good things (improvement) in the watershed but not enough to outpace the degradation occurring
in rapidly developing counties. In looking at both respondent perceptions as well as the increasing
percentages of 303d listed streams, Research indicates professionals are not be able to keep pace
with diminished water quality. They likely play a role in stemming and lessening the rate of increase in
water quality degradation. We may have reached a critical point in resource degradation that prevents
us from actually improving the overall water quality. The best we may be able to do is reduce the
amount of avoidable damage.
5.2 Additional Lessons and Areas of Inquiry
What types of characteristics are present in strong watershed networks?
My research indicated that among all respondents that several characteristics are present and
linked among the strongest networks. Both data and literature suggest strong goals, involvement
in collaborative activities, a belief that collaboration is essential, and the presence of conflict are
important values in strong networks. Research on goal alignment, and collaboration among
104
watershed networks in North Carolina could produce specific ways to strengthen these
relationships and improve the programmatic efforts. More research could be done to better
understand the nature of conflict that produces positive results, and how to manage conflict in a
productive way. The potential for benefit to the network could also be realized in finding ways to
foster and nurture collaborative arrangements between network participants. Knowing when to
add or subtract or manage these conflicts and collaborative efforts could produce positive
programmatic outcomes in North Carolina’s urbanizing counties.
What are some of the empirically valid plan characteristics of high quality plans?
Based on my research and literature review, characteristics of strong plans are: issues/vision are
framed and articulated, fact based information is used as a platform, goals and policies are clear,
it has a articulated path to implementation, it makes use of other plans, it can be easily
understood and used, it is integrated with other plans, and has had a strong participatory
component. Among the three plan types assessed watershed plans are the best plan type across
the network of the three types looked at, which was, stormwater, comprehensive land-use, and
watershed plans. The reason may be that watershed plans because of the geographic and
jurisdictional diversity, require more collaboration then the other plan types and as such produce
a stronger plan. However, this can’t be empirically asserted from this research. Among all of the
plans assessed there were weakness and potential improvements across all plan types, and
across all plan measures.
Are some of these good planning characteristics lacking or present in plans produced in the four study counties?
Wake County produced strong plans in all types, and received high marks for having clear vision,
being fact-based, having clear goals, a clear map for use of the plan, being easily understood,
well integrated with other plans and had a good participation component. Wake County relied a
great deal on contractors to produce these plans. An interesting area of research would be to
compare plans prepared in house, with those done by consultants. As noted in some of the
literature (Norton 2005), that an often overreliance on consultants produces a polished plan on
schedule, but also one of less real use in implementing the created plan.
105
One area of weakness noted by evaluators of plans was in implementing, Mecklenburg County
produced good plans on balance and demonstrated an excellent watershed plan in particular.
Common to both the comprehensive and stormwater plan were weaknesses in the measures of
implementation, participation and integration with other plans. Plans that were more
interdisciplinary in scope (like watershed plans), may have fared better in part because of the
wide scope of expertise among stakeholders, however this can’t be empirically asserted from this
study and its data.. The narrower scope of some stormwater plans and comprehensive plans
relied on more specific engineering and planning skills and more limited participation. This may
help explain why their plans showed weaknesses in integration with other plans and low scores
for participation. The plan ratings for Forsyth County were skewed in that the local watershed
plan received very low marks. If you remove that plan type from the mix Forsyth plans scored on
par with Wake and Mecklenburg counties. There otherwise strong plans which scored well in all
categories. Guilford County by contrast did as well as all counties in planning if you subtract the
poor plan type of stormwater which impacted the overall scores significantly. By contrast, they
produced one of the best watershed plans, but the comprehensive plan was found lacking.
There were solid planning examples from all of the four studied counties. The planning discipline
seems to produce examples of plans that do well in most of the characteristics rated in this study.
All of these planning characteristics provide an opportunity for further research to improve
watershed efforts in North Carolina. Without buy in from a wide spectrum of stakeholders
implementation is hampered thereby producing plans that do not have a clear path to
implementing and which receive committed resources. Without these committed resources the
articulated goals contained in the plan are more likely to fail. More could be done to research the
reasons why plans fail in being implemented within watersheds. The failure for many of these
plans in the area of implementation should be an area suggested from this research for further
study.
The larger counties of Wake and Mecklenburg produced visually more appealing and more
thorough documents then then the smaller counties of Forsyth and Guilford. However the smaller
counties did have some solid examples of certain planning efforts which were innovative and
referred to as a model for the state. Particularly of note were Forsyth County and the Farmland
Preservation Plan, which was funded and implemented and has preserved a great deal of
agricultural land from development. Forsyth County was also moving close to consolidating
Forsyth County with the City of Winston-Salem, which might serve to improve the resources,
staff, and better align goals of agencies working in water quality.
106
What improvements are possible/desirable in the management of each of the counties watershed management networks?
More can be done to improve the networks by providing dedicated resources to implement plans.
Many of the plans looked at were lacking in articulating an implementation schedule. This is may
be the case because few elected bodies or agencies are willing to make absolute commitments to
funding, particularly in partnerships, and the absence of absolute mandates. This lack of funding
implementation may also be contributing to the data which suggests that despite good plans, the
impact on water quality improvement is limited. The ability to back plans with committed funding
may also speak to the need to research regionalized efforts for funding, and greater education on
ecosystem services.
At work here may be something of a free rider principle where individual members of a network
are often unwilling to fund and implement for those things which do not directly benefit, or for
which they are already receiving benefits, like clean water from upstream. More should also be
done to research the value of educating citizens, elected officials and the development
community about the ecosystem benefits of clean water and protected streams, as they relate to
their interests. There may be benefit, if more were done to explain the short and long-term costs
associated with degraded waters, and the lengthy corresponding TMDL process. Through better
education the public demand and the elected official response would likely be made more
favorable for watersheds in North Carolina through either preventative measures using low-
impact development (LID‖s) or through retrofits in the watershed.
What were the easiest areas of collaboration for the networks? The hardest? Why, and
what can be learned from this?
Based on survey responses (Question 8 from the survey, Appendix 6), the easiest area of
collaboration is around public education. This is an activity engaged in throughout the network, it
is seen as necessary, requires a low level of commitment to each other. Ad Hoc work groups,
habitat restoration, and joint fact finding and reporting are also activities the networks seem to do
with some regularity. Many of these activities require collaboration and shared resources to
achieve and are natural activities for the networks to engage in. Some of the harder areas to
collaborate in are centered on legal agreements, joint funding, capital improvement projects
(CIP's), between entities. These activities require the highest level of commitment; involve a
107
political dimension, competition with other governmental activities for resources to name a few of
the impediments.
The other activity which was almost never engaged in, was the collocation of staff. This may be
an area worth looking at for the networks. Watershed activities involve a wide array of actors and
a mix of resources and expertise. Co-locating staff may lead to some great innovation and an
increase in implementation and funding strategies. This could happen naturally through an easy
and open exchange of ideas, better understanding if the goals and resources each have. An
example of this might be locating Soil and Water Staff, Cooperative Extension Staff, DWQ staff,
EEP Staff, an NGO (land trust), local government stormwater management staff, etc. in one or
several office suites within a county, and looking at the amount of innovation, and projects this
generated in the county over a period of five years and comparing it to another county without this
arrangement.
5.3 Integrated Conclusions 5.3.1 Networks and Plans The survey about networks, water quality, and planning was sent out to professionals in watershed
management in four urbanizing counties in North Carolina (Wake, Mecklenburg, Forsyth, and
Guilford). The survey confirmed that 77% of respondents believe that through the efforts of their
agency and collaborative activities of the network, water quality has improved. However, the steady
rise of 303d listed streams within these counties, suggests water quality continues to erode , despite
perceptions of respondents. Given the current state of the economy and increased pressure to spend
limited public resources wisely or risk elimination of programs, the reasons for this perception, and
the rise of impaired streams should be better understood.
Data were gathered n plan quality on the four counties of Wake, Mecklenburg, Forsyth and Guilford in
North Carolina. Three plan types were identified within each county. Theses plan types were a
watershed plan, a stormwater plan, and a comprehensive plan. Twelve plan raters were enlisted to
use a plan quality measurement tool largely adapted form from accepted and vetted methods for
measuring plan quality (Berke 2009). The tool evaluated the strength of plans in eight areas: issues
and vision, fact based, goal and policy, Implementation, use of plan, understanding of plan,
integration of plans, and participation in planning.
108
Plans are the natural fruit of the labors of networks. They signal policy intention, agreement and
articulate goals reached through collaboration, ultimately leading to implementation. Interestingly the
same group of respondents that believe they have had a positive impact on improving water quality
also believe the plans produced by these networks were viewed as good or very good (78% of
respondents). This raises the question: “If the plans developed through the network are good, why is
water quality, impacted so little”. The assessments from independent evaluators rate the plans of
these county’s collectively as only fair, and lacking in some key areas of implementation and
participation.
Data were gathered on plan quality on the four counties of Wake, Mecklenburg, Forsyth, and Guilford
in North Carolina. Three plan types were identified within each county. These plan types were a
watershed plan, a stormwater plan and a comprehensive plan. Twelve plan raters were enlisted to
use a plan quality measurement tool largely adapted from accepted and vetted methods for
measuring plan quality (Philip Berke 2009). The tool evaluated the strength of plans in eight different
areas. These areas were: issues and vision, fact based, goal and policy, implementation, use of plan,
understanding of plan, integration of plans, and participation in planning.
While there was some variance of overall plan quality, plans were found to be lacking in two areas
consistently: implementation and participation. In scoring in these two areas, most plans fell below
50%, or lower. This would suggest that these are two areas of concern for the manager of water
resources. While more research and thought is needed, it may also provide a causal link for why
good plans produce limited results. While this assertion can’t be empirically linked, it may give rise to
further research and a meaningful improvement in managing water resources in North Carolina.
Improving watershed networks could occur through increased effort and focus on meaningful
participation of stakeholders, and in pressing harder to plan for how to implement and fund the
recommendations of plans.
One finding of the study are that all respondents reported using time in collaborative activities, and
having significant additional capacity to collaborate, and ninety-seven percent viewed the attainment
of agency goals as being enhanced through collaboration with other agencies. An area of further
study should be to understand why more collaborating do not occur, and how they might increase, be
encouraged and channeled in a way to improve the network.
Another finding of the survey indicated significant number of respondents reported having conflicts
with other organizations in the network. The strength of these conflicts was characterized as medium
109
to weak in most of the reported conflicts. Overall, collaboration is viewed as an important part of the
network’s business to accomplish water quality goals. The survey showed a correlation between
conflict and improved perception of good plans, which could indicate that conflict is a positive feature
of good planning. Better understanding of this feature could benefit network performance in planning.
The data would suggest there is a perceived opportunity to grow and expand in the area of
collaboration, which is viewed as a positive feature in improving water quality efforts. This would
seem to also link well to the perceived deficiencies in planning relating to implantation and
participation.
Results like these should be of concern and interest for those who work in government, in that they
are held more accountable for public funds and meeting public purposes efficiently (Provan 2001).
This reality, the growing list of 303d listed streams, and the shrinking size of budgets due to the
recent economic downturn, all point to the value and saliency of additional research, thought and
consideration of the way in which watershed management networks both collaborate and implement
water quality protection measures. My research suggests some directions this research might take.
5.3.2 Planning Improvements The model towards which all of my data were oriented at addressing is that a strong network
produces strong plans, which in turn improve water quality. The data indicates that within North
Carolina, in its urbanizing watersheds, that strong networks are producing fair plans, which are not
leading to improved water quality. While it is certain that many positive benefits and outcomes are
being achieved through the efforts of a watershed management network, more needs to be done to
keep up with environmental degradation of North Carolina’s waters.. This is evidenced by the reality
of a cumulative population increase, in a four year period, within the four studied counties of 9.5%,
and an increase in 303d listed streams of 151% for the same period.
While plans are a helpful articulation of problem identification, goals and remediation, many simply
become the end in itself and go unfunded, unimplemented and remain on the shelf until the time of
the next revision. The data indicates that we know water quality continues to deteriorate, but we are
unable though current methods and organization to do much about it, on a large scale watershed
basis. Networks should continue to be examined to see if improvements can be made in composition,
purpose, authority, and funding to produce meaningful plans and better outcomes. Planning efforts
need to become more linked to funding, outcomes, and articulated responsibility as well as post plan
implementation and measurement.
110
More should be done to develop the networks that deliver watershed management services. It may
well be that simply recognizing the collective benefit, and being aware of the framework from which
these watershed management services are delivered help in keeping transaction costs low and
efficient, and drive practitioners to both collaborate and plan for implementation more aggressively
within these often complex networks (Toole 1997). By simply understanding that no single
organization of government can achieve its policy intentions alone, and that it requires the work of
multiple actors, all with significant will capabilities to manage the flow of problems and solutions into
policy action (Bressler 1995), a great deal can be achieved.
Watershed management programs that facilitate implementation of policy intention, are spread out
across federal, state and local government, and will continue to reflect varying degrees of capacity
and innovation (Elazar 1987) (Ostrom 1990, Wright 1988). This network when managed well
possesses the capacity to move multiple agencies and programs with divergent goals and capacities
towards a collective benefit and improved efficiency with scarce public resources, that otherwise
could not be realized. The goal then for public managers, is to improve governance within these
complex networks with multiple actors, since they are incapable of accomplishing their mission acting
alone (Provan 2001). Moving beyond governance of the network however, a link to producing plans
that become funded and implemented should become a central goal of networks and public sector
managers.
5.3.3 Management Implications
Results from this study should be of interest for those who work in government, in that they are held
accountable for public funds and meeting public purposes efficiently (Provan 2001) in a way business
and non-governmental agencies are not.. This reality, the growing list of 303d listed streams, and the
shrinking size of budgets due to the recent economic downturn, all point to the value and saliency of
additional research, thought and consideration of the way in which watershed management networks
operate, collaborate and implement. We know for example, that differing values and perspectives
held collectively by an organization can make a large difference in the way decisions are made and in
the way agencies relate to one another (Martin 2004). Understanding the particular way this diffusion
takes place in our networks in North Carolina could be a very useful area of research for both the
practitioner and participants in these networks.
One principle that should be considered within watershed management networks in North Carolina is
that of the ―precautionary principle‖. The precautionary principle, proposed as a new guideline in
111
environmental decision making, has four central components: taking preventive action in the face of
uncertainty; shifting the burden of proof to the proponents of an activity; exploring a wide range of
alternatives to possibly harmful actions; and increasing public participation in decision making
(Kriebel 2001). Working in fast growing communities often involves studying highly complex, poorly
understood systems, while at the same time facing conflicting pressures from those who seek to
balance economic growth and environmental protection. Public managers typically do not spend a lot
of time trying to reckon with and understand these perspectives before entering into, or initiating a
stakeholder process. All of this bolsters further the necessity to view the complexity of environmental
policy from a network perspective, looking carefully at interactions within the network, and leveraging
ways to collaborate.
Researchers are aware of the important role that relationships play within networks and there
importance in getting policy implemented (Hall 2000). As such it is also important to build human
capacity and relationships to govern effectively within the network. My research confirms that greater
effort should be spent developing participation within the network in planning. When we understand a
link may exist between the implementation of plans, and ultimately to improved water quality, this
becomes an important area to understand.. For these efforts to be effective in participation and
implementation, effort must be intentional, and a recognizing that it will be time consuming at the front
end.
This effort could mean extending a stakeholder process, or spending additional time to ensure
decision making is inclusive to the greatest extent possible. It will require the manager/practitioner to
place greater effort on developing the planning design and process correctly in hopes of greater gains
post planning through implementation, funding and collective efforts. To achieve this also means
public manager’s will need to expand their skill sets beyond the technical and have an acumen for
developing the requisite interpersonal skills for managing the many dimensions of human interaction
and associated processes. The calculus of a well-managed human process should also lead to
improved capacity to fund those things planned for. Support, funding, and enthusiasm are typically
based in human dimensions through relationships as opposed to data, science and technical
reasoning.
The premise and corresponding model for this study was that strong networks, produce good plans,
which in turn, produce improved water quality. The research indicates that the networks have some
strength in well aligned goals, but there remains a realization that collaboration is important and the
112
networks have capacity to do more of it. Many of the agencies which are replicated in each county
have singular well defined missions, often complimentary, but also with significant differences.
Collaboration occurs primarily around necessity or where skills are complimentary. The networks
could be made stronger through collaborating and working together on a more routine basis. The
plans which are produced are generally adequate but have room for improvement in areas of
participation and implementation. One would find these two attributes to be among the most important
to multiple agency participation, implementation and funding. Finally, in each of these rapidly growing
counties water quality in some measure continues to deteriorate. If the measure of 303d listing and
perception is insufficient to support such a finding, then a serious collaborative effort should be made
to standardize and implement a state wide monitoring program that can properly assess the health of
watersheds. Absent this solid data gives rise to advocating for adaption of the precautionary principle,
to the extent possible, to be conservative in the care of an ecosystem that is so important to the
health, and well-being of its citizens.
5.4 Additional Areas of Research
Some additional areas of research that are suggested from this study are finding ways that the
informal network can be formalized or induced to create a stronger funding mechanism’s aimed at
implementation. There is a disconnection between plans and implementation, and ultimately a
perception of improving water quality in the counties. A research effort should be made to better
understand the link between education and support for the networks. Co-location of staff is an area
worth more study, which is rarely employed (Question 8 from the survey, Appendix 6), in which
members of the network would actually co-locate and work to solve watershed problems, share ideas
and resources.
There is a possibility that such work groups clustered around watershed management would begin to
experience greater goal alignment and provide a more holisitic approach to working in the watershed
for the taxpayer. A research effort should be undertaken to create a paired study which would look at
a strong centralized authority, and a more typical affiliation of the network clustered around a goal,
usually stemming from a mandate such as TMDL, found in North Carolina counties. The nature of
watersheds and the wide geographic distribution might suggest a stronger centralized approach might
be helpful to accomplish both preventative efforts through ordinances and LID’s, as well as retrofits
and BMP’s in the watershed.
113
We know that the costs involved in repairing watersheds is huge in comparison to allowing
detrimental effects to take hold in the temporal positive impacts of accelerated development. We
know for example, that differing values and perspectives held collectively by an organization can
make a very big difference in the way decisions are made and in the way agencies relate to one
another (Martin 2004). The reality of the growing list of 303d listed streams, and the shrinking size of
budgets due to the recent economic downturn, all point to the value and saliency of additional
research, thought and consideration of the way in which watershed management networks should
both collaborate and implement.
We know for example, in North Carolina the interests of the agriculture community differ greatly from
the development community. We know the interests of agencies of local government are motivated
differently than NGO’s and certain state agencies. They differ in the both the goals of the institution,
and the type of training that the staff’s they hire typically bring to the organizations. There are a host
of other institutional differences, which all impact the effectiveness of the networks to operate. Yet
public managers typically do little work to try to reckon with and understand these perspectives before
entering into, or initiating a stakeholder process. All of this bolsters the necessity to continue to
understand, better study, and teach practitioner’s about the complexity of environmental policy from a
network perspective, looking carefully at interactions within the network, and leveraging ways to
collaborate.
North Carolina has an extensive university system. More could be done in partnership with the
university to bring resources and current research of both science and social science to bear in
improving watershed efforts in North Carolina. Research done in partnership with the university,
would assist governments from replicating efforts known not to work, and make use of the best of
new ideas, technology and the ways to organize them. Such partnerships require careful thought in
putting it together in a way that is flexible enough to meet the unique goals of individual partners, and
formal enough to have meaningful participation and funding.
114
Works Cited
Arnett, Esther, S. (1983) Greensboro, North Carolina: The County Seat of Guilford. UNC Press.
Chapel Hill, NC.
Barham E. (2001) Ecological Boundaries as Community Boundaries: The Politics of Watersheds,
Society and Natural Resources, Vol. 14, No. 3 pp. 181-191
Baskin, Yvonne (1997) Ecosystem Services: Benefits Supplied to Human Societies by Natural
Ecosystems. Issues in Ecology, No 2, Spring.
Berke,Philip and Godschalk, David (2009). Searching for the Good Plan: A Meta-Analysis of Plan Quality Studies, Journal of Planning Literature 23; 227 Berke, P. R., D. R. Godschalk, and Kaiser, E.J. with Rodriguez, D.A. (2006). Urban land use planning. 5th ed. Urbana: University of Illinois Press. Berke, Phillip R. Are we Planning for Sustainable Development? An Evaluation of 30 Comprehensive Plans (2000). Journal of the American Planning Association, Winter 2000 66:1 Bidwell, Ryan D., Ryan Clare M (2006) Collaborative Partnership Design: The Implications of Organizational Affiliation for Watershed Partnerships, Society and Natural Resources, 19:827-843. Birkland, Thomas A. (2005) Policy Proccess: Theory, Concepts, and Models of Public Policy Making. M.E. Sharpe Inc. 228-229 Bonnel, Joseph, Koontz, Thomas (2007) Stumbling Forward: The Organizational Challenges of Building and Sustaining Collaborative Watershed Management, Society and Natural Resources, Vol 20, No. 2, pp. 153-167 (15)
Bressers, H., O’Toole, L. J., Jr., & Richardson, J. (1995). Networks as models of analysis: Water policy in comparative perspective. In H. Bressers, L. J. O’Toole, Jr., & J. Richardson (Eds.), Networks for water policy: A comparative perspective (pp. 1-23). London: Frank Cass.
Brody, Samuel D. (2003) Are we Learning to Make Better Plans? Journal of Planning and Research 23:191-201 Brody, Samuel D. (2003) Measuring the Effects of Stakeholder Participation on the Quality of Local Plans Based on the Principles of Collaborative Ecosystem Management, Journal of Planning Education and Research 22:407-419. Brody, Samuel D., Highfield , Wess, Carrasco, Virginia (2004) Measuring the Collective Planning Capabilities of Local Jurisdictions to Manage Ecological Systems in Southern Florida, Journal of Landscape and Urban Planning 69:33-50 Borgatti and Foster (2003). The Network Paradigm in Organizational Research: A Review and
Typology.Journal of Management, 29: 991-1013
115
Borusk, Mark, Clemen, Robert, Maguire Lynn, Reckhow, Kenneth (2001) Stakeholder Values and
Scientific Modeling in the Neuse River Watershed. Group Decision and Negotiation Vol. 10, No. 4,
pp.355-373
Borzel, Tanja, A. (1998) Organizing Babylon-On The Different Conceptions of Policy Networks. Public Administration, Vol 76, Summer, 253-273. Cropper, Maureen and Griffiths, Charles (1994) The Interaction of Population Growth and
Environmental Quality, American Economic Review, Vol. 84, No.2, pp.250-254.
Dillman, Don A. (2007) Mail and Internet Surveys: The tailored design method, Wiley & Sons.
Duda, Alfred M. (1982) Municipal Point Source and Agricultural Nonpoint Source Contributions to
Coastal Eutrophication, Journal of the American Water Resources Association, Vol. 18, Issue 3 pp.
397-407
Duda, Alfred M. Johnson, R.J. (1985) Cost-effective targeting of agricultural nonpoint-source pollution
controls, Journal of Soil and Water Conservation 40 (1) 108-111
Elazar, D. (1987). Exploring Federalism. Tuscaloosa: University of Alabama Press.
Endale, D.M., Schomberg, H.H., Steiner J. (2000) Long-term sediment yield and mitigation in a small southern piedmont watershed, International Journal of Sediment Research, Vol. 14, No. 1, pp. 60-68.
EPA Web Site (epa.gov/lawsregs/lawsguidance/cwa/tmdl/intro.cfm)
Feeny, David, Berkes Fikret, McCay, Bonnie, Acheson, James M. (1990) The Tragedy of the Commons: Twenty-Two Years Later. Human Ecology, Vol 18, No.1 Frarey, Larry C., Jones, Ron, Pratt, Staci (1995) Conservation Districts as the Foundation for Watershed Based Programs to Prevent and Abate Polluted Agricultural Runoff. Hamline Law Review, 151-159. Gable, Guy G (1994) Integrating case study and survey research methods: an example in information systems. European Journal of Information Systems 3(2):pp. 112-126.
Gerring, John (2004). What is a Case Study and What is it Good for? American Political Science Review, Vol. 98. No. 2.
Gosselink, James G., Shaffer, Gary P. (1990) Landscape Conservation in a Forested Wetland Watershed, Bio-Science, Vol. 40, No.8 pp. 588-600.
Griffith, Maurren Cropper and Charles (1994). "The Interaction of Population Growth and
Environmental Quality." American Economic Review : Vol.84 250-254.
Hall, T. E., & O’Toole, L. J.,Jr. (2000). Structures for policy implementation: An analysis of national legislation, 1965-1966 and 1993-1994. Administration and Society, 31, 667-686.
Hardin, Garrett (1968) The Tragedy of the Commons, Science, 162:1243-1248
116
Heal, Geoffrey (1999) Valuing Ecosystem Services, Ecosystems, Vol. 3 No. 1, pp. 24-30 Hopkins, Lewis D. (2001) Urban Development: The Logic of Making Plans, Island Press. Horst W. J. Rittel, Webber, Melvin M. (1973) Dilemmas in a General Theory of Planning, Policy Sciences, Vol4, No.2 155-169 Hoch, Charles (2007) Making Plans: Representation and Intention, Journal of Planning and Theory, March, Vol.6, No.1, 16-35. Houck, O. A. "The Regulation of Toxic Pollutants Under the Clean Water Act", Environmental Law Reporter September 1991, 21, 10528-10560. Imperial, Mark (2005) Using Collaboration as a Governance Strategy: Lessons from Six Watershed Programs, Administration & Society, Vol.37, No 3, 281-320 Jarvie, Michelle, Solomon, Barry (1998) Point-nonpoint effluent trading in watersheds: a review and critique. Environmental Impact Assessment Review Vol. 18, Issue 2, pp.135-137 Johnson, NancyRavnborg, H., Westerman, Olaf, Probst, Kirsten (2002) User Participation in Watershed Management and Research, Water Policy, Vol. 3, Issue 6, pp. 507-520 Kingdon, John W. (1995) Agendas, Alternatives and Public Policies. 2
nd addition, New York: Harper
Collins Kovalic, J. M. The Clean Water Act of 1987, 2nd edition; The Water Pollution Control Federation (W.P.C.F); Alexandria, VA, 1987. Kiser, L., & Ostorm, E. (1982). The Three Worlds of Action: A Theoretical Synthesis of Institutional
Approaches. In E. Ostrom, Strategies for Political Inquiry )pp 179-222. Beverly Hills, CA :Sage.
Kriebel D., Tickner J., Epstein P., Lemons J., Levins R., Loechler E. L., Quinn M., Rudel R., Schettler T., and Stoto M. (2001). The Precautionary Principle in Environmental Science, Environmental Health Perspective. September; 109(9): 871–876.
Leach, W. D., Pelkey, N. W., & Sabatier, P. A. (2002). Stakeholder partnerships as collaborative
policymaking: Evaluation criteria applied to watershed management in California and Washington.
Journal of Public Policy Analysis and Management, 21, 645-670.
Lindblom, Charles (1959) The Science of Muddling Through, Public Administration Review (19) 79-88 Lowrance, Richard, Todd, Robert, Fail, Joseph, Hendrickson, Ole, Leonard, Ralph, Asmussen Loris (1984) Riparian Forests as Nutrient Filters in Agricultural Watersheds, BioScience, No.6 pp. 374-377 Lipsky, M. (1980) Street Level Bureaucracy: Dilemmas of the Individual in Public Services. Russell Sage Foundation
Martin, Ingrid M., and Toddi Steelman. 2004. Using Multiple Methods to Understand Agency Values
and Objectives: Lessons for Public Land Management. Policy Sciences 37: 37-69.
117
McDonald, L., Allen, W., Benedict M., O’Conner K. (2004) Green Infrastructure Plan Evaluation
Frameworks, Journal of Conservation Planning, 1 (1) 12-43.
McGinnis, Michael V., Wooley, John, Gamman, John (1999) Bioregional Conflict Resolution:
Rebuilding Community in Watershed Planning and Organizing, Environmental Management Vol. 24,
No1, pp.1-12
McGuire, Michael. (2006) Collaborative Public Management: Assessing What We Know and How We
Know It. Public Administration Review, December, Special Issue.
Milward, H. B., & Provan, K. G. (2000). Governing the Hollow State. Journal of Public Administration
Research and Theory, 10, 359-379.
North Carolina DENR Web Site (ncdenr.org/web/ps/mtu/tmdl)
North Carolina General Statutes Article 4, Chapter 133A
Nohria, N. (1992) Is a network perspective a useful way of studying organizations? In N. Nohria and
R. G.Eccles, (eds) Networks and Organizations: Structure, Form, and Fit. Boston: Harvard Business
School Press.
Norton, Richard K. (2005) More and Better Local Planning: State Mandated Local Planning n North
Carolina, Journal of American Planning Association, Article 29
Ostrom, Elinor. Governing the Commons: The Evolution of Institutions for Collective Action, (New
York: Cambridge University Press, 1990).
Ostrom, V. (1989). The intellectual crisis in American public administration (2nd ed.). Tuscaloosa: University of Alabama Press.
Ostrom, V. (1994). The meaning of American federalism: Constituting a self-governing society. San Francisco: ICS Press.
O’Toole, Laurence J. (1997). Implementing Public Innovations in Network Settings, Administration
and Society 29(2):115-34.
Pressman, Jeffery and Wildavsky, Aaron. Implementation, The Oakland Project (University of California Press, 1984)
Provan, Keith, G. & Milward, H. Brinton (2001) Do Networks Really Work? A framework for Evaluating Public-Sector Organizational Networks. Public Administration Review, July/August Vol.61, No 4. 414-423
Rowley, T. (1997) Moving beyond dyadic ties: A network theory of stakeholder influences. The Academy of Management Review, 22(4), 887-910.
Roy, Allison H., Wenger, Seth J., Fletcher Tim D., Walsh Christopher J., Ladson, Anthony R., Shuster, William D., Thurston Hale D., Brown, Rebekah R., (2008) Environmental Management, Vol. 42, No.2., 344-359.
Sabatier, Paul A. (1999) Theories of the Policy Process, West View Press, pgs. 117-160
118
Sabatier, Paul A., Focht Will, Lubell Mark, Trachtenberg Zev, Vedlitz Arnold, Matlock Mary (2005)
Swimming Upstream: Collaborative Approaches to Watershed Management, MIT Press, Cambridge,
Massachusetts.
Salancik, G. (1995). Wanted: A good network theory of organization. Administrative Science Quarterly, 40(2),. 345-349.
Scott, W. R. & Davis, G. F. (2007). Networks in and around organizations. (Ch 11). In Organizations
and Organizing: Rational, Natural, and Open System Perspectives. Upper Saddle River, NJ: Prentice
Hall.
Scozzafava, Michael (2006) The Best Watershed Plans In The Nation, U.S. Environmental Protection Agency, Office of Wetlands, Oceans and Watersheds, Final Report.
Stone, Deborah. (2002) Policy Paradox. New York: W.W. Norton, page 376
Stone, K.C. Hunt, P.G. Coffey S. W. Matheny T.A. (1995) Water Quality Status of a USDA Water
Quality Demonstration Project in the Eastern Coastal Plain, Soil and Water Conservation Society.
Stowe, Craig A., Borusk, Mark E., Stanley, Donald (2001) Long-term changes in watershed nutrient
inputs and riverine exports in the Neuse River, North Carolina, Water Research Vol.35 Issue 6, 1489-
1499.
U.S. EPA NPDES Permit Writers' Manual; U.S. Environmental Protection Agency, Office of Water, December, 1996; EPA-833-B-96-003, pp 1-28. Walker, J.C., Jennings, G.D., and Arnold, J.A. (1994) Erosion and Sedimentation Control in North Carolina AG 473-20/WQWM-130.N.C.CES, Raleigh, NC. Walker, Joseph C., Jennings, Gregory, D., Arnold, Jon A. (1996) Erosion and Sedimentation Control
in North Carolina. Journal of Watershed Management, March 473-20.
World Commission on the Environment and Development (1987), Report: Our Common Future, June
1987, Geneva Switzerland, A/42/427.
Wright, D. S. (1988). Understanding intergovernmental relations (3rd ed.). Pacific Grove, CA: Brooks/Cole.
Wynekoop J L (1992) Strategies For Implementation Research: Combining Research Methods. In Proceedings of the Thirteenth International Conference on Information Systems, Janice I DeGross, Jack D Becker and Joyce J Elam,(eds.), Dallas, Texas, December 1992, pp.185-193.

119
Appendix

120
Appendix 1 *Sample of first notification of survey
Watershed Management Questionnaire
In one week you will receive an email request to fill out a questionnaire about your organizations role
in watershed management within your county as part of a research project by NC State University.
We are writing in advance because most people like to know ahead of time that they will be
contacted. The study will hopefully provide new insight into the way inter-organization efforts are
carried out within the county, and how they ultimately play a role in the improvement of water quality.
Organizations playing a role in watershed management will be contacted in Wake, Mecklenburg,
Forsyth and Guilford counties. Your opinions are important and can help can help identify potential
improvements in the way in which counties manage for water quality improvement.
Thanks for your time and consideration.
Kurt Smith
Graduate Student, Department of Forestry and Environmental Resources, North Carolina State
University
(919) 856-7447
Fred Cubbage, Professor, Department of Forestry and Environmental Resources, North Carolina
State University
(919) 515-7789

121
Appendix 2 *Sample first letter sent along with survey: Date: To:
Watershed Management Questionnaire We are writing to ask your help in studying watershed management in a selected number of counties in North Carolina. We are contacting organizations involved in watershed management in Wake, Mecklenburg, Forsyth and Guilford counties. The study will assess how effective collaborative activities between organizations are occurring, the effectiveness of planning efforts, and the overall contribution of both to improved water quality. Results will be used to suggest the best ways for inter-organizational efforts aimed at the improvement of water quality to be maximized, and ultimately lead to improved water quality. The results of the final study will be shared with each organization participating. Your answers are completely confidential and will be released only as summaries in which no individual’s name can be identified. The survey is voluntary. Please link to the site provided ( _______ ) and fill out the provided survey. If you have questions, you can contact us at the email addresses or phone numbers listed below. Thank you very much for helping with this important study. Kurt Smith Graduate Student, Department of Forestry and Environmental Resources, North Carolina State University (919) 856-7447 [email protected] Fred Cubbage, Professor, Department of Forestry and Environmental Resources, North Carolina State University (919) 515-7789 [email protected]

122
Appendix 3 *Sample second letter with survey-10 Days
Watershed Management Questionnaire
Ten days ago we sent you a questionnaire seeking your opinions about watershed management in
your county as part of a major study by NC State University. We have received many responses
already, but not for your firm.
If possible, please complete and return the questionnaire this week. You are one of several selected
organizations in your county working in watershed management, and your response is important.
Your replies will be completely confidential, and released only as part of statistical summaries.
Please link to the provided address ( ________) and fill out this brief survey.
Thanks again helping with this important study.
Kurt Smith
Graduate Student, Department of Forestry and Environmental Resources, North Carolina State
University
(919) 856-7447
Fred Cubbage, Professor, Department of Forestry and Environmental Resources, North Carolina
State University
(919) 515-7789
123
Appendix 4 *Sample letter three weeks after initial survey:
Watershed Management in North Carolina Questionnaire
About three weeks ago we sent you a questionnaire seeking your opinions about watershed
management in your county. We have not received your reply yet.
Your reply to this survey can help improve the ability of collaborating organizations within North
Carolina to improve water quality.
These surveys will be completely confidential, and you will not be identified by name in the survey.
We hope that you will fill out and return the questionnaire soon, but if you prefer not to for any reason,
please do reply by email to let us know.
Thanks again for your consideration.
Kurt Smith
Graduate Student, Department of Forestry and Environmental Resources, North Carolina State
University
(919) 856-7447
Fred Cubbage, Professor, Department of Forestry and Environmental Resources, North Carolina
State University
(919) 515-7789

124
Appendix 5
*Sample final letter -2 months
Watershed Management Questionnaire
During the last two months, we have sent several requests to complete a survey on watershed
management in your county for a study we are doing at NC State University.
The study is drawing to a close, and this is the last time we will ask you to complete a survey by
email.
We are sending this request from different account in case our other messages were inadvertently
blocked as spam or deleted in the flood of other email you receive.
The opinions of managers like you are one of the best gauges of program success. If you can,
please complete the survey by clicking on the provided link ( _________ ) it would be very
appreciated.
We know the questionnaire is one more task in your busy day, but your response is very important.
Finally, we appreciate your willingness to consider our request as we conclude our efforts to
understand more about watershed management in North Carolina. Thanks for your consideration.
Kurt Smith
Graduate Student, Department of Forestry and Environmental Resources, North Carolina State
University
(919) 856-7447
Fred Cubbage, Professor, Department of Forestry and Environmental Resources, North Carolina
State University
(919) 515-7789
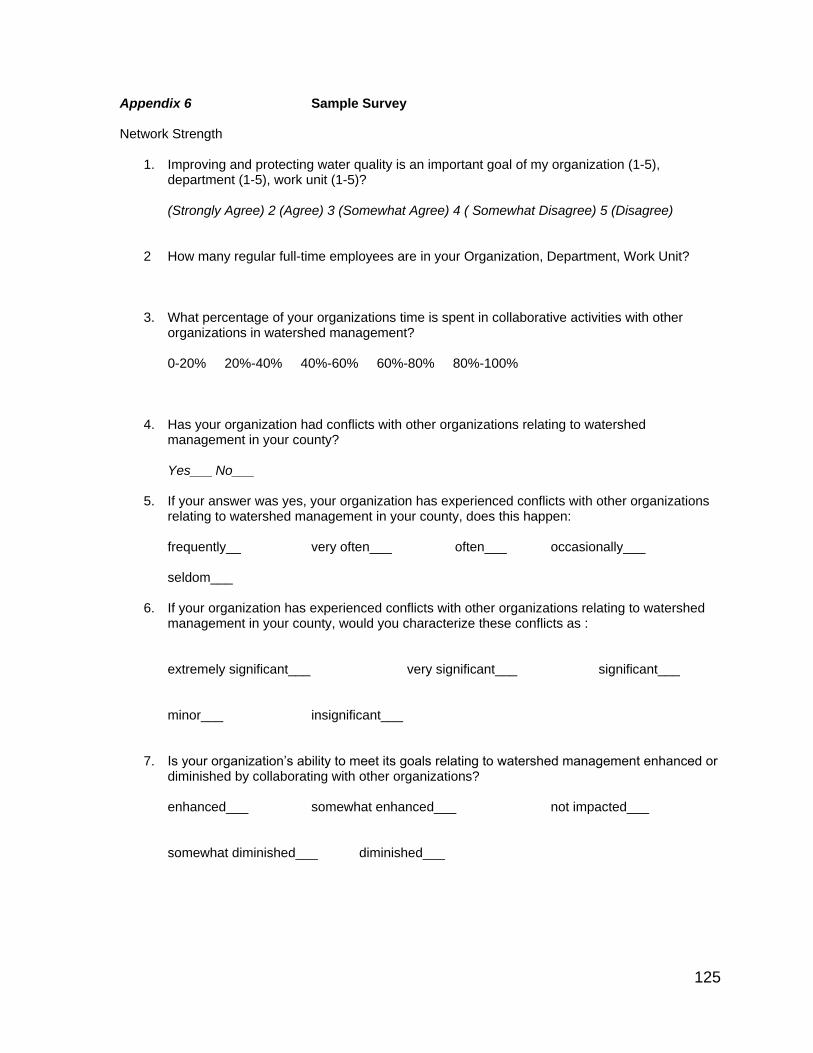
125
Appendix 6 Sample Survey Network Strength
1. Improving and protecting water quality is an important goal of my organization (1-5), department (1-5), work unit (1-5)?
(Strongly Agree) 2 (Agree) 3 (Somewhat Agree) 4 ( Somewhat Disagree) 5 (Disagree)
2 How many regular full-time employees are in your Organization, Department, Work Unit?
3. What percentage of your organizations time is spent in collaborative activities with other organizations in watershed management? 0-20% 20%-40% 40%-60% 60%-80% 80%-100%
4. Has your organization had conflicts with other organizations relating to watershed
management in your county?
Yes___ No___ 5. If your answer was yes, your organization has experienced conflicts with other organizations
relating to watershed management in your county, does this happen:
frequently__ very often___ often___ occasionally___ seldom___ 6. If your organization has experienced conflicts with other organizations relating to watershed
management in your county, would you characterize these conflicts as :
extremely significant___ very significant___ significant___
minor___ insignificant___ 7. Is your organization’s ability to meet its goals relating to watershed management enhanced or
diminished by collaborating with other organizations? enhanced___ somewhat enhanced___ not impacted___ somewhat diminished___ diminished___
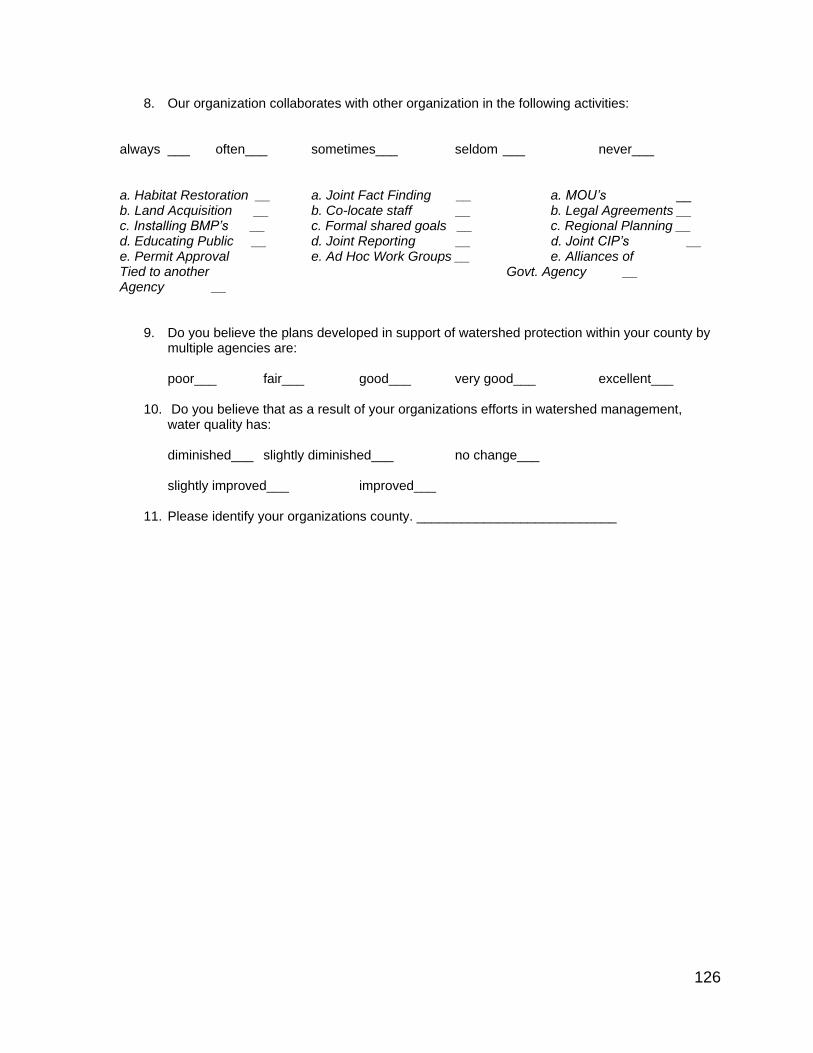
126
8. Our organization collaborates with other organization in the following activities:
always ___ often___ sometimes___ seldom ___ never___
a. Habitat Restoration __ a. Joint Fact Finding __ a. MOU’s __ b. Land Acquisition __ b. Co-locate staff __ b. Legal Agreements __ c. Installing BMP’s __ c. Formal shared goals __ c. Regional Planning __ d. Educating Public __ d. Joint Reporting __ d. Joint CIP’s __ e. Permit Approval e. Ad Hoc Work Groups __ e. Alliances of Tied to another Govt. Agency __ Agency __
9. Do you believe the plans developed in support of watershed protection within your county by multiple agencies are: poor___ fair___ good___ very good___ excellent___
10. Do you believe that as a result of your organizations efforts in watershed management,
water quality has: diminished___ slightly diminished___ no change___ slightly improved___ improved___
11. Please identify your organizations county. ___________________________
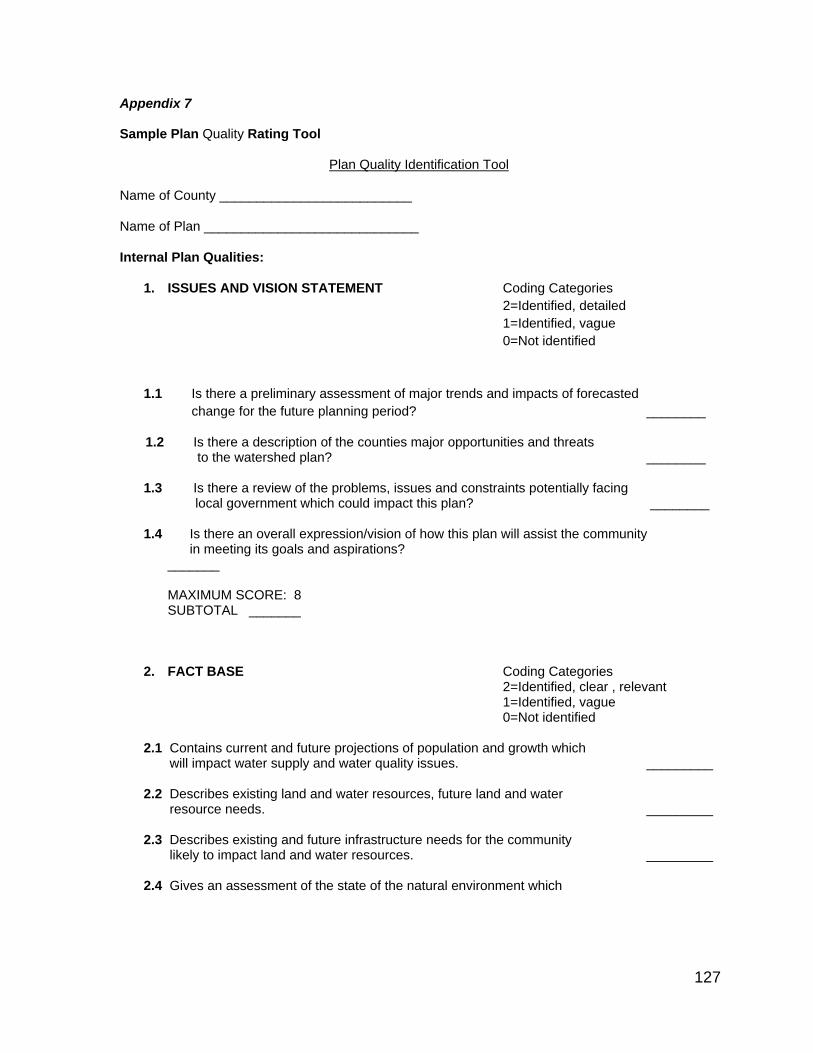
127
Appendix 7 Sample Plan Quality Rating Tool
Plan Quality Identification Tool
Name of County __________________________
Name of Plan _____________________________
Internal Plan Qualities:
1. ISSUES AND VISION STATEMENT Coding Categories
2=Identified, detailed
1=Identified, vague
0=Not identified
1.1 Is there a preliminary assessment of major trends and impacts of forecasted
change for the future planning period? ________
1.2 Is there a description of the counties major opportunities and threats to the watershed plan? ________
1.3 Is there a review of the problems, issues and constraints potentially facing local government which could impact this plan? ________ 1.4 Is there an overall expression/vision of how this plan will assist the community
in meeting its goals and aspirations? _______ MAXIMUM SCORE: 8 SUBTOTAL _______
2. FACT BASE Coding Categories 2=Identified, clear , relevant 1=Identified, vague 0=Not identified
2.1 Contains current and future projections of population and growth which
will impact water supply and water quality issues. _________
2.2 Describes existing land and water resources, future land and water resource needs. _________
2.3 Describes existing and future infrastructure needs for the community
likely to impact land and water resources. _________
2.4 Gives an assessment of the state of the natural environment which
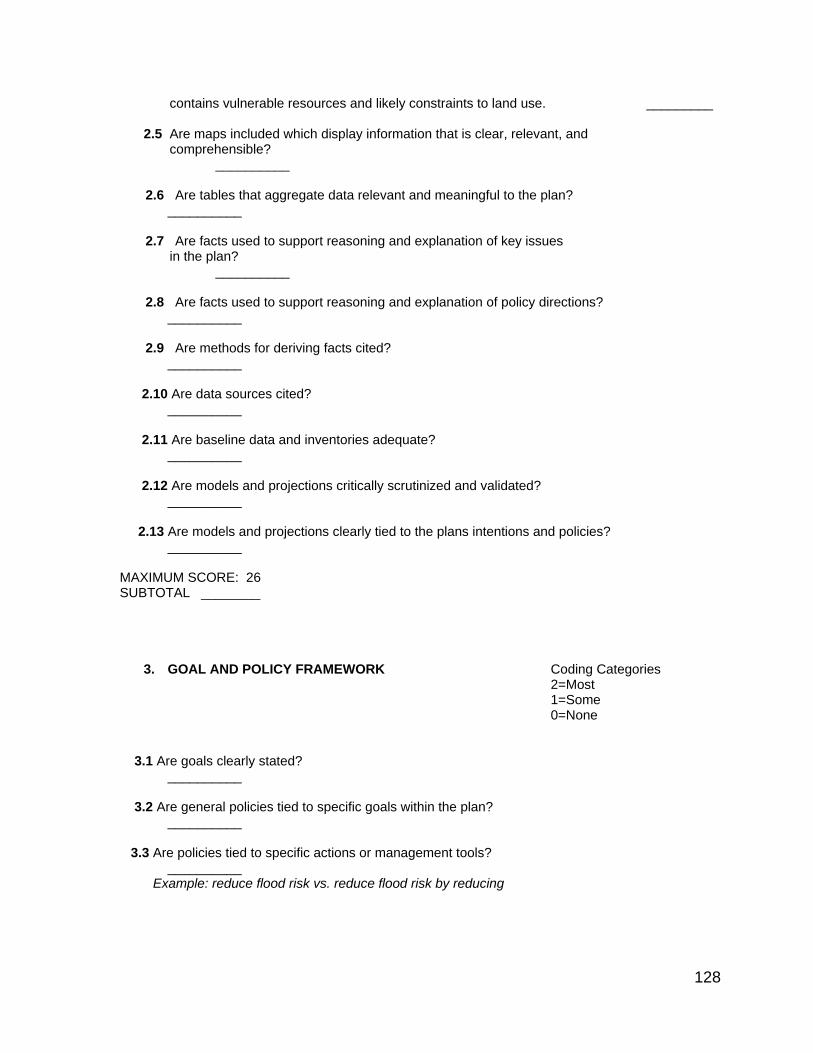
128
contains vulnerable resources and likely constraints to land use. _________
2.5 Are maps included which display information that is clear, relevant, and comprehensible? __________
2.6 Are tables that aggregate data relevant and meaningful to the plan? __________ 2.7 Are facts used to support reasoning and explanation of key issues
in the plan? __________
2.8 Are facts used to support reasoning and explanation of policy directions? __________ 2.9 Are methods for deriving facts cited? __________ 2.10 Are data sources cited? __________ 2.11 Are baseline data and inventories adequate? __________
2.12 Are models and projections critically scrutinized and validated? __________ 2.13 Are models and projections clearly tied to the plans intentions and policies? __________ MAXIMUM SCORE: 26 SUBTOTAL ________
3. GOAL AND POLICY FRAMEWORK Coding Categories 2=Most 1=Some 0=None
3.1 Are goals clearly stated? __________ 3.2 Are general policies tied to specific goals within the plan? __________ 3.3 Are policies tied to specific actions or management tools? __________ Example: reduce flood risk vs. reduce flood risk by reducing
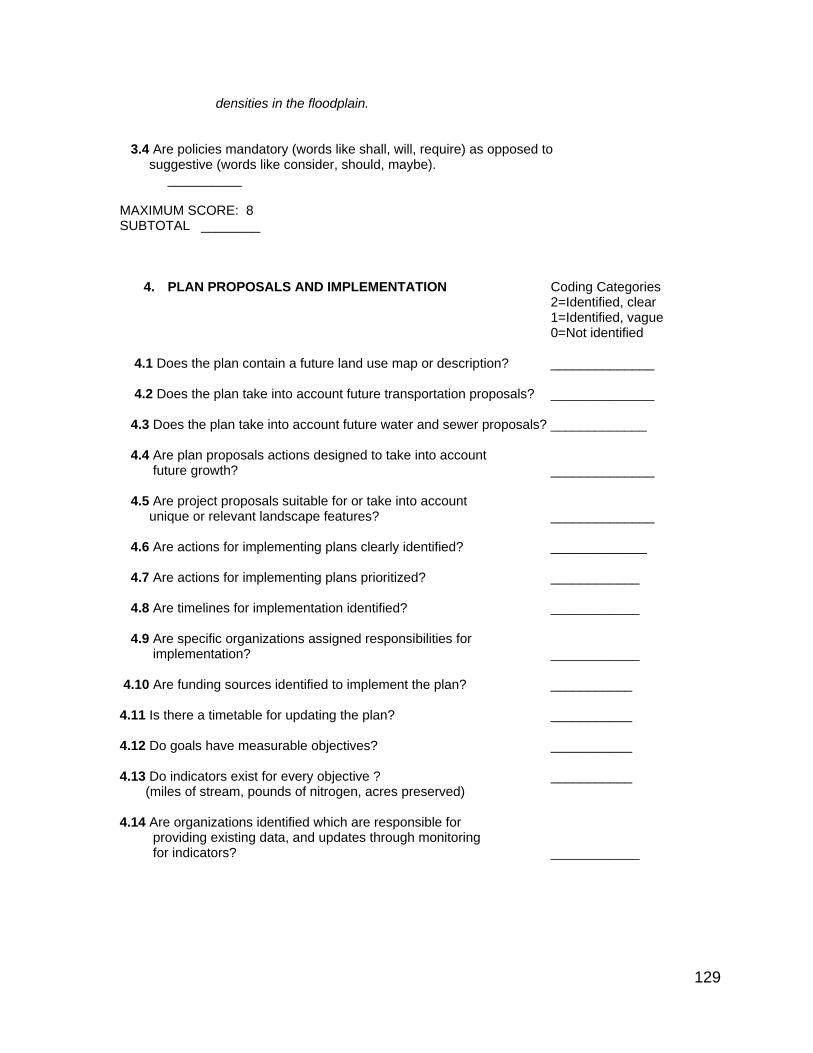
129
densities in the floodplain. 3.4 Are policies mandatory (words like shall, will, require) as opposed to suggestive (words like consider, should, maybe). __________ MAXIMUM SCORE: 8 SUBTOTAL ________
4. PLAN PROPOSALS AND IMPLEMENTATION Coding Categories 2=Identified, clear 1=Identified, vague 0=Not identified
4.1 Does the plan contain a future land use map or description? ______________ 4.2 Does the plan take into account future transportation proposals? ______________ 4.3 Does the plan take into account future water and sewer proposals? _____________ 4.4 Are plan proposals actions designed to take into account future growth? ______________ 4.5 Are project proposals suitable for or take into account unique or relevant landscape features? ______________ 4.6 Are actions for implementing plans clearly identified? _____________ 4.7 Are actions for implementing plans prioritized? ____________ 4.8 Are timelines for implementation identified? ____________ 4.9 Are specific organizations assigned responsibilities for implementation? ____________ 4.10 Are funding sources identified to implement the plan? ___________ 4.11 Is there a timetable for updating the plan? ___________ 4.12 Do goals have measurable objectives? ___________ 4.13 Do indicators exist for every objective ? ___________ (miles of stream, pounds of nitrogen, acres preserved) 4.14 Are organizations identified which are responsible for providing existing data, and updates through monitoring for indicators? ____________
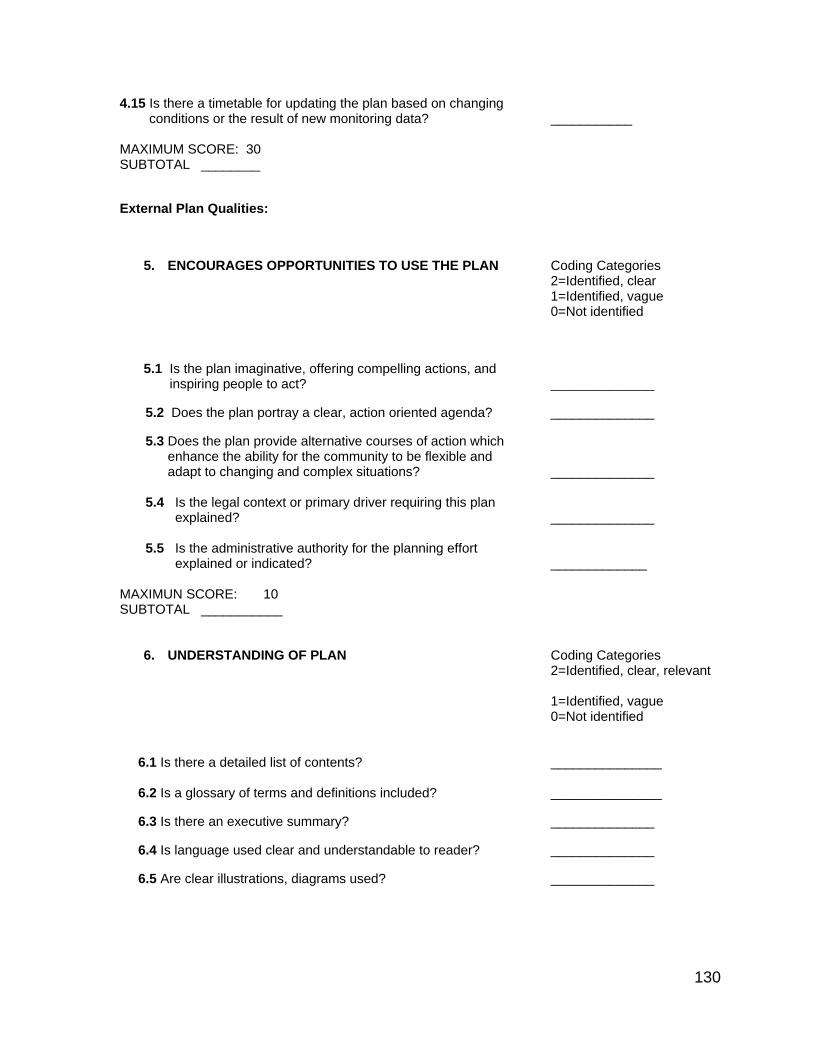
130
4.15 Is there a timetable for updating the plan based on changing conditions or the result of new monitoring data? ___________ MAXIMUM SCORE: 30 SUBTOTAL ________
External Plan Qualities:
5. ENCOURAGES OPPORTUNITIES TO USE THE PLAN Coding Categories 2=Identified, clear 1=Identified, vague 0=Not identified
5.1 Is the plan imaginative, offering compelling actions, and inspiring people to act? ______________
5.2 Does the plan portray a clear, action oriented agenda? ______________
5.3 Does the plan provide alternative courses of action which enhance the ability for the community to be flexible and adapt to changing and complex situations? ______________ 5.4 Is the legal context or primary driver requiring this plan explained? ______________ 5.5 Is the administrative authority for the planning effort explained or indicated? _____________ MAXIMUN SCORE: 10 SUBTOTAL ___________
6. UNDERSTANDING OF PLAN Coding Categories 2=Identified, clear, relevant 1=Identified, vague 0=Not identified
6.1 Is there a detailed list of contents? _______________ 6.2 Is a glossary of terms and definitions included? _______________
6.3 Is there an executive summary? ______________
6.4 Is language used clear and understandable to reader? ______________
6.5 Are clear illustrations, diagrams used? ______________
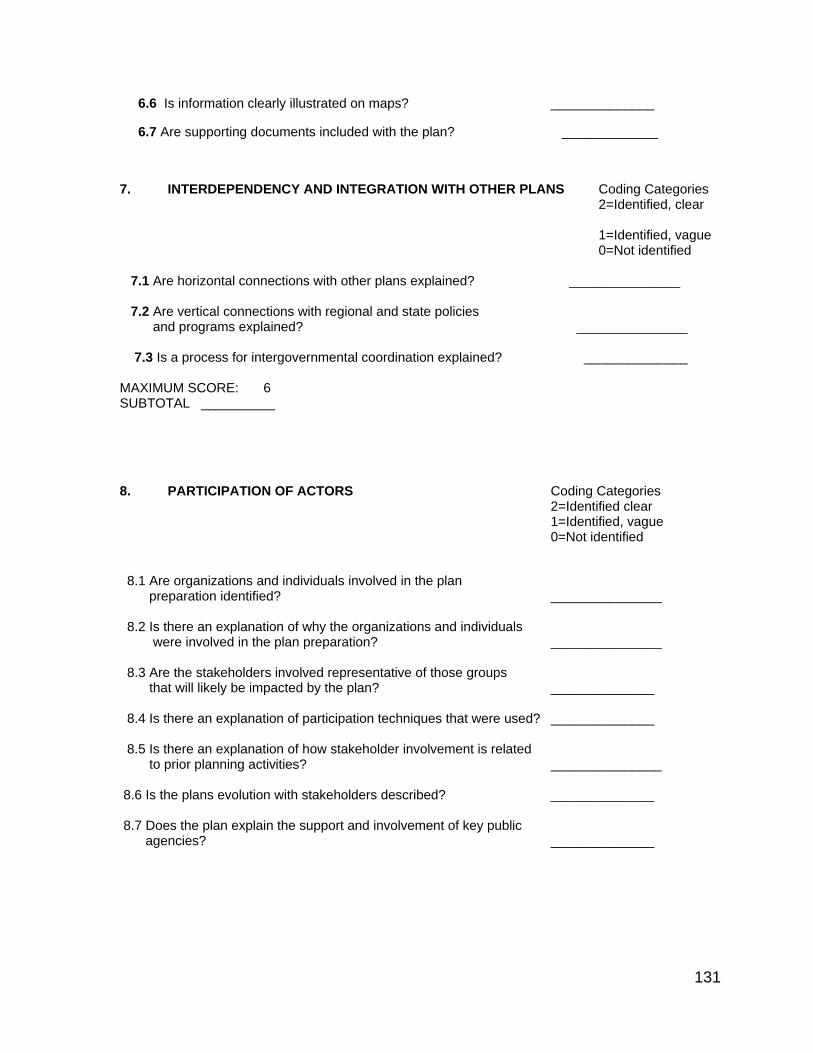
131
6.6 Is information clearly illustrated on maps? ______________
6.7 Are supporting documents included with the plan? _____________
7. INTERDEPENDENCY AND INTEGRATION WITH OTHER PLANS Coding Categories 2=Identified, clear 1=Identified, vague 0=Not identified
7.1 Are horizontal connections with other plans explained? _______________ 7.2 Are vertical connections with regional and state policies and programs explained? _______________ 7.3 Is a process for intergovernmental coordination explained? ______________ MAXIMUM SCORE: 6 SUBTOTAL __________
8. PARTICIPATION OF ACTORS Coding Categories 2=Identified clear
1=Identified, vague 0=Not identified
8.1 Are organizations and individuals involved in the plan preparation identified? _______________ 8.2 Is there an explanation of why the organizations and individuals were involved in the plan preparation? _______________ 8.3 Are the stakeholders involved representative of those groups that will likely be impacted by the plan? ______________ 8.4 Is there an explanation of participation techniques that were used? ______________ 8.5 Is there an explanation of how stakeholder involvement is related to prior planning activities? _______________ 8.6 Is the plans evolution with stakeholders described? ______________ 8.7 Does the plan explain the support and involvement of key public agencies? ______________

132
8.8 Does the plan incorporate input form a broad spectrum of stakeholders? _____________
MAXIMUM SCORE: 16 SUBTOTAL ___________ OVERALL MAXIMUM TOTAL: 120 F (0-30 ) D (30-50) C (50-70) B (70=90) A (100-110)

133
Appendix 8 Survey Responses by County
Question 1: Improving and protecting water quality is an important goal of my work unit.
Wake Forsyth Guilford Mecklenburg
strongly agree(1) 64.7% 91.7% 71.4% 25%
Agree(2) 35.3% 8.3% 14.3% 50%
somewhat
agree(3)
14.3% 25%
somewhat
disagree(4)
Disagree(5)
Question 2: What percentage of your time is spent in collaborative activities with other organizations?
Wake Forsyth Guilford Mecklenburg
80-100%(1) 5.6% 16.7% 25% 0
60-80%(2) 11.1% 8.3% 0 0
40-60%(3) 11.1% 8.3% 0 50%
20-40%(4) 27.8% 0 25% 25%
0-20%(5) 44.4% 66.7% 50% 25%
Question 4: Has your organization had conflicts with other organizations in watershed mgmt.? Y/N
Wake Forsyth Guilford Mecklenburg
No (1)+ 50% 91.7 37.5% 62.5%
Yes (2)- 50% 8.3 62.5% 37.5%
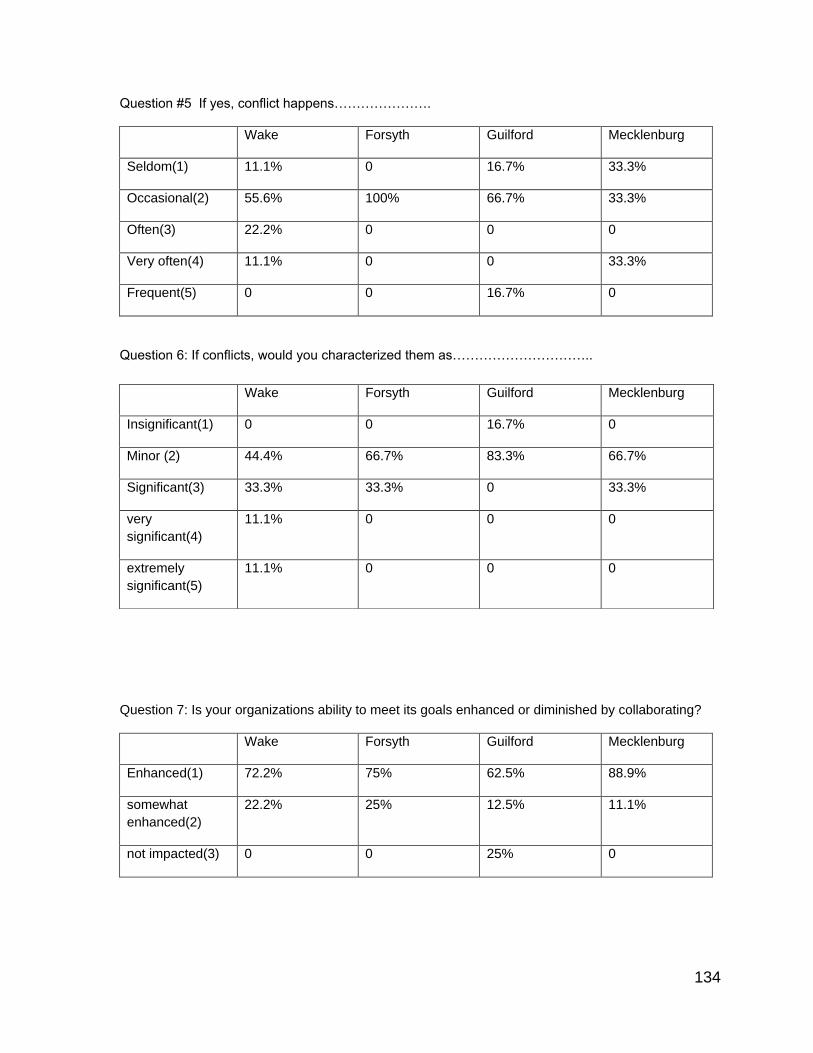
134
Question #5 If yes, conflict happens………………….
Wake Forsyth Guilford Mecklenburg
Seldom(1) 11.1% 0 16.7% 33.3%
Occasional(2) 55.6% 100% 66.7% 33.3%
Often(3) 22.2% 0 0 0
Very often(4) 11.1% 0 0 33.3%
Frequent(5) 0 0 16.7% 0
Question 6: If conflicts, would you characterized them as…………………………..
Question 7: Is your organizations ability to meet its goals enhanced or diminished by collaborating?
Wake Forsyth Guilford Mecklenburg
Enhanced(1) 72.2% 75% 62.5% 88.9%
somewhat
enhanced(2)
22.2% 25% 12.5% 11.1%
not impacted(3) 0 0 25% 0
Wake Forsyth Guilford Mecklenburg
Insignificant(1) 0 0 16.7% 0
Minor (2) 44.4% 66.7% 83.3% 66.7%
Significant(3) 33.3% 33.3% 0 33.3%
very
significant(4)
11.1% 0 0 0
extremely
significant(5)
11.1% 0 0 0
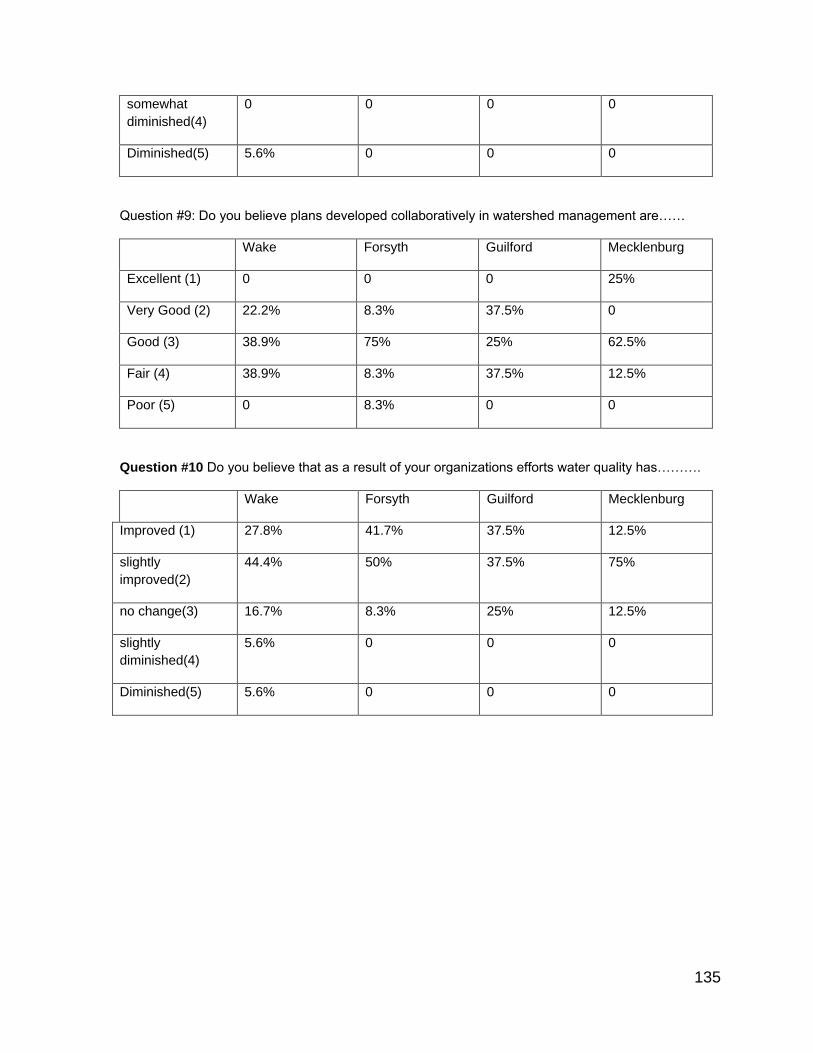
135
somewhat
diminished(4)
0 0 0 0
Diminished(5) 5.6% 0 0 0
Question #9: Do you believe plans developed collaboratively in watershed management are……
Wake Forsyth Guilford Mecklenburg
Excellent (1) 0 0 0 25%
Very Good (2) 22.2% 8.3% 37.5% 0
Good (3) 38.9% 75% 25% 62.5%
Fair (4) 38.9% 8.3% 37.5% 12.5%
Poor (5) 0 8.3% 0 0
Question #10 Do you believe that as a result of your organizations efforts water quality has……….
Wake Forsyth Guilford Mecklenburg
Improved (1) 27.8% 41.7% 37.5% 12.5%
slightly
improved(2)
44.4% 50% 37.5% 75%
no change(3) 16.7% 8.3% 25% 12.5%
slightly
diminished(4)
5.6% 0 0 0
Diminished(5) 5.6% 0 0 0
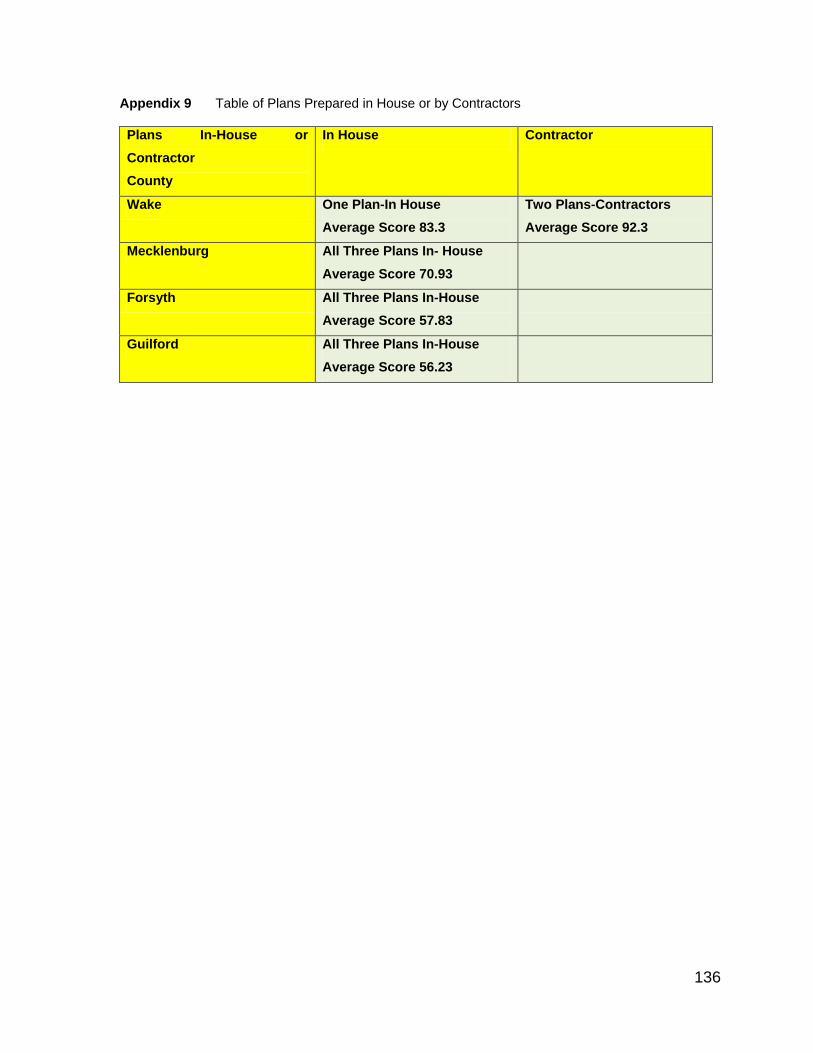
136
Appendix 9 Table of Plans Prepared in House or by Contractors
Plans In-House or
Contractor
County
In House Contractor
Wake One Plan-In House
Average Score 83.3
Two Plans-Contractors
Average Score 92.3
Mecklenburg All Three Plans In- House
Average Score 70.93
Forsyth All Three Plans In-House
Average Score 57.83
Guilford All Three Plans In-House
Average Score 56.23