Embed Size (px)
DESCRIPTION
In this issue of Waterscapes, the focus is on nutrient removal – from treatment technology research to sustainability analysis.
Citation preview
A technicAl publicAtion by hDR’s WAteR AnD nAtuRAl ResouRces GRoup spRinG 2013
WasteWater and nutrient ManageMent
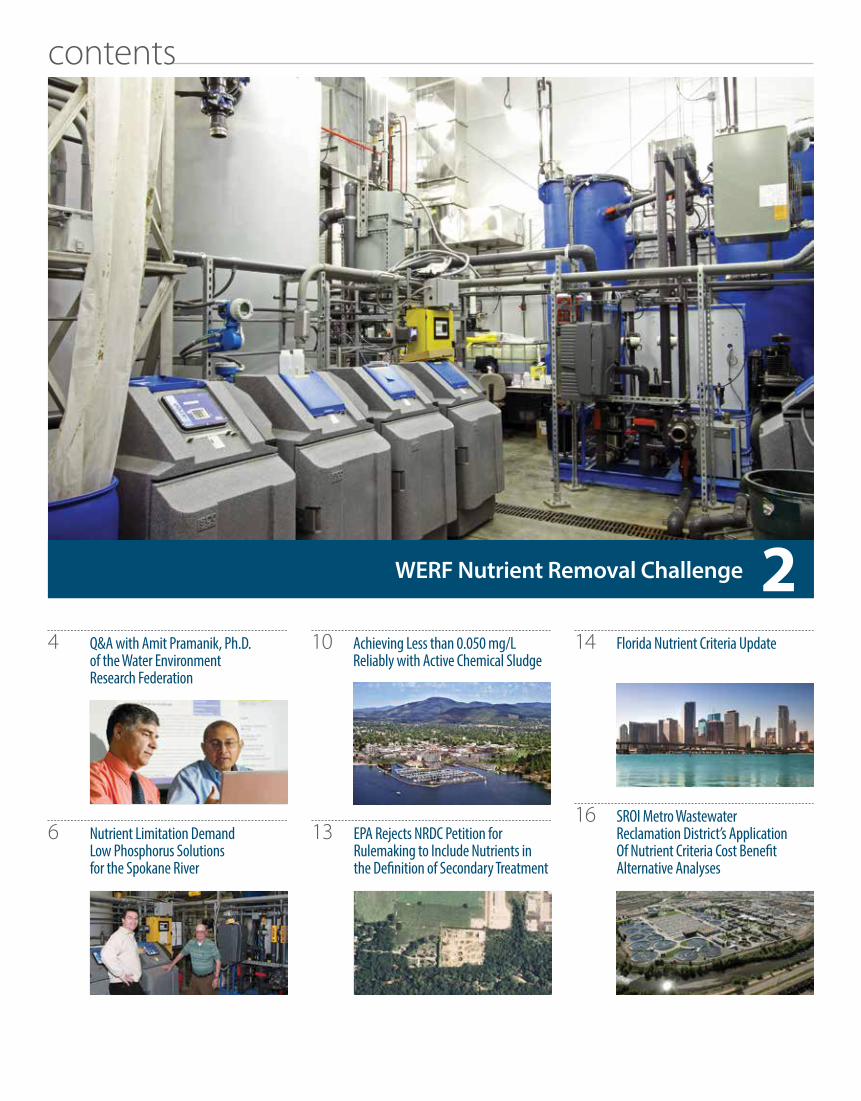
210 Achieving Less than 0.050 mg/L
Reliably with Active Chemical Sludge
6 13Nutrient Limitation Demand Low Phosphorus Solutions for the Spokane River
EPA Rejects NRDC Petition for Rulemaking to Include Nutrients in the Definition of Secondary Treatment
16 SROI Metro Wastewater Reclamation District’s Application Of Nutrient Criteria Cost Benefit Alternative Analyses
4 Q&A with Amit Pramanik, Ph.D. of the Water Environment Research Federation
WerF nutrient removal Challenge
14 Florida Nutrient Criteria Update
contents
s p r i n g 2 0 1 3
Waterscapes is a technical publication produced and distributed by HDr. Address
changes and correspondence should be sent to the attention of:
Waterscapes Editor Engineering Marketing Services
8404 Indian Hills DriveOmaha, NE 68114-4049
T e c H n i c A l e D i To rDave Clark
WAT e r s c A p e s e D i To rSteve Beideck
e D i T i n g & D e s i g nEngineering Marketing Services
www.hdrinc.com
© 2013 HDr, inc., all rights reserved.
For information on career opportunities at HDR, please visit: www.hdrinc.com/careers
We practice increased use of sustainable materials and reduction of material use.
Waterscapes is offset printed on Utopia Two Xtra green 100# Dull text, which is Fsc-
certified paper manufactured with electricity in the form of renewable energy (wind,
hydro, and biogas) and includes a minimum of 30% post-consumer recovered fiber.
[ front cover photo ]commissioned artwork at the city of
coeur d’Alene feature the “clean Up crew” of cor-Ten steel sculptures by local
artists Allen and Mary Dodge of rotifers, filamentous bacteria, crawling ciliates,
flagellates, round worms, stalked ciliates and free swimming ciliates that “work” at the wastewater facility. The sculptures are
along Academic Way at the entrance to the University of idaho, lewis clark state,
north idaho college and the city’s Wastewater Administration Building.
in this issue of Waterscapes we focus on nutrient removal, from treatment technology research to sustainability analysis. This is timely in light of the United states environmental protection Agency’s recent announcement that more than half of the nation’s rivers and streams are in poor condition.
epA’s recently published draft “national rivers and streams Assessment, 2008-2009” identifies nutrient pollution as the most widespread water quality problem with nitrogen and phosphorus at excessive levels in 27 percent of the nation’s streams. Forty percent were found to have high levels of phosphorus.
An update on the Water environment research Foundation (WerF) nutrient removal challenge is spot-on that topic of controlling excessive nutrients in United states waters. This research program has documented the practices associated with a wide range of issues, such as nutrient characterization and bioavailability in aquatic environments; the selection of sustainable, cost-effective processes to meet nutrient limits in wastewater treatment facilities; and the demonstration of new nutrient removal technologies and practices, as well as improvements to existing ones.
Then there’s a question-and-answer interview with Amit pramanik of the Water environment research Foundation, who serves as the research manager for the nutrient removal challenge. Dr. pramanik talks about the latest updates from the challenge and what’s next for this important research work.
pushing the boundaries of treatment technology for nutrient removal is the focus of two articles about pilot testing work for the city of coeur d’Alene, idaho. The first is on the overall two-year pilot demonstration testing program that investigated three different tertiary phosphorus removal technologies to meet very restrictive effluent limits for the spokane river. The second takes a closer look at results of the study and optimizing the use of chemical coagulants.
The last two articles of this edition summarize recent developments on key issues related to nutrient limitations. epA recently announced the rejection of a natural resource Defense council (nrDc) petition for rulemaking to include nitrogen and phosphorus effluent limits in the definition of secondary treatment. in Florida, news of an agreement between the state and epA over nutrient criteria may signal the beginning of a new phase of implementation after an interesting but contentious period following the imposition of federal standards.
We hope that you find this edition of Waterscapes of interest and contact us to further discuss any of the topics summarized here.
Dave ClarkHDR Wastewater Market Sector Director
1
message from technical editor
waterscapes | spring 2013
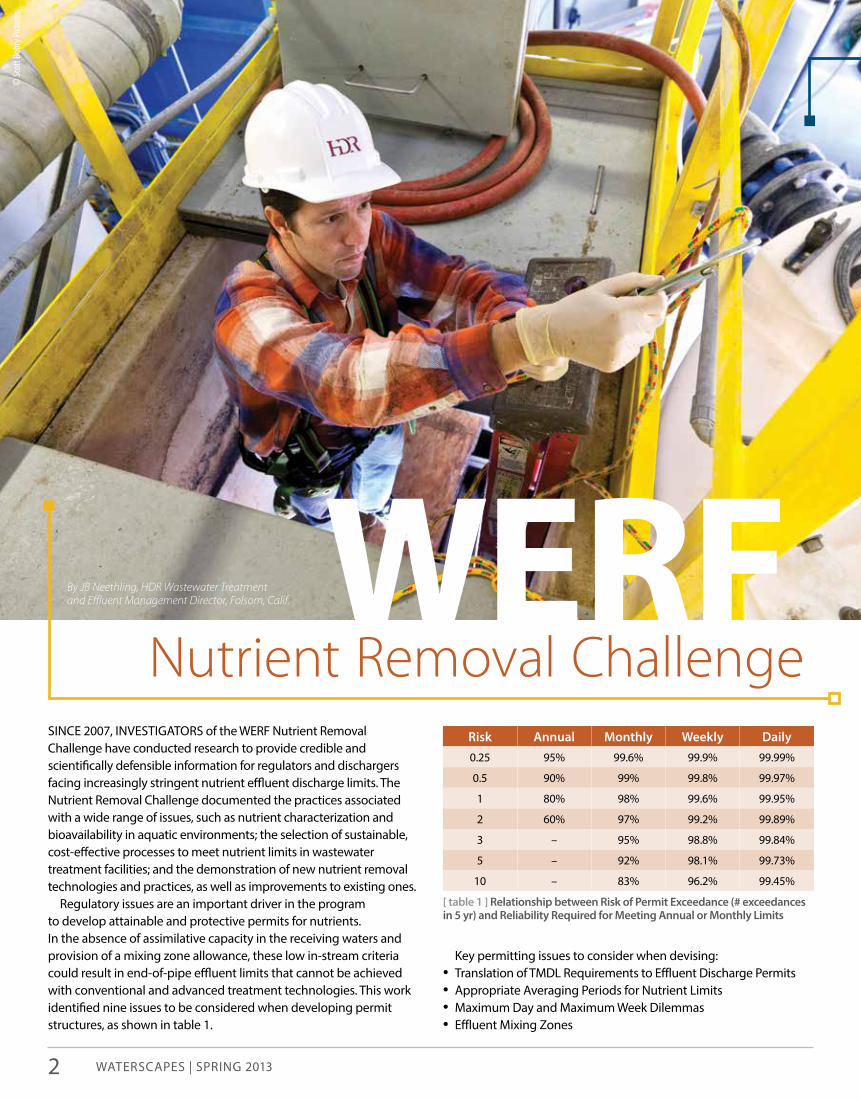
nutrient Removal challengeWERF By JB Neethling, HDR Wastewater Treatment
and Effluent Management Director, Folsom, Calif.
© Sc
ott D
obry
Pictu
res
since 2007, invesTigATors of the WerF nutrient removal challenge have conducted research to provide credible and scientifically defensible information for regulators and dischargers facing increasingly stringent nutrient effluent discharge limits. The nutrient removal challenge documented the practices associated with a wide range of issues, such as nutrient characterization and bioavailability in aquatic environments; the selection of sustainable, cost-effective processes to meet nutrient limits in wastewater treatment facilities; and the demonstration of new nutrient removal technologies and practices, as well as improvements to existing ones.
regulatory issues are an important driver in the program to develop attainable and protective permits for nutrients. in the absence of assimilative capacity in the receiving waters and provision of a mixing zone allowance, these low in-stream criteria could result in end-of-pipe effluent limits that cannot be achieved with conventional and advanced treatment technologies. This work identified nine issues to be considered when developing permit structures, as shown in table 1.
Key permitting issues to consider when devising:• Translation of TMDl requirements to effluent Discharge permits• Appropriate Averaging periods for nutrient limits• Maximum Day and Maximum Week Dilemmas• effluent Mixing Zones
risk annual Monthly Weekly daily0.25 95% 99.6% 99.9% 99.99%
0.5 90% 99% 99.8% 99.97%
1 80% 98% 99.6% 99.95%
2 60% 97% 99.2% 99.89%
3 – 95% 98.8% 99.84%
5 – 92% 98.1% 99.73%
10 – 83% 96.2% 99.45%
[ table 1 ] relationship between risk of Permit exceedance (# exceedances in 5 yr) and reliability required for Meeting annual or Monthly Limits
2
• permit requirements Below the capabilities of Wastewater Treatment Technology
• novel npDes permit Approaches• Treatment performance statistics• Watershed Based permitting• Water Quality off-sets and Trading (npDes discharge
permit conditions)Fostering a constructive dialog between regulatory agencies,
wastewater utilities, and other stakeholders has been found effective in bridging some of the gaps in the understanding of potential nutrient requirements and treatment technology capabilities. since national guidance from epA that links the development of numeric nutrient endpoints with implementation guidance for effluent discharge permitting for nutrients has been lagging, individual states have undertaken efforts to develop unique state approaches. Diverse groups of stakeholders participated in collaborative workgroups to craft nutrient standards and an approach to nutrient pollution control in several states, including Wisconsin, colorado, and Montana. An important driver in the dialog in these states has been the recognition of the potential for water quality standard rulemaking to result in infeasible effluent limits. The result is an approach to nutrient control that is achievable technologically and financially by utilities in phases moving toward lower limits as the benefits of nutrient control are demonstrated.
investigations into the capabilities and limitations of existing technologies for nitrogen and phosphorus removal provided data for a statistical analysis to determine the reliability and limitations of treatment technologies. These investigations relied primarily on full-scale, well-operated treatment plants that had detailed performance records. By considering the statistical performance of the treatment facilities, one could determine the reliability at which permit compliance is possible for different permit limits and averaging periods. Table 1 shows the relationship between performance reliability required to meet the risk of permit exceedence under different averaging conditions. The table illustrates that the risk associated with short-term permit averaging periods requires a significantly higher performance reliability to meet permit consistently. According to this, the owner can establish an appropriate reliability to balance the need for permit compliance with financial investments required to meet permit.
several projects conducted under the nutrient challenge addressed technology performance. Using data from more than 22 full-scale facilities, Bott and parker (2010) summarized the technology performance statistics of various nitrogen and phosphorus removal facilities. The statistics identified the ideal performance (14-day best performance), average (50th percentile), and also the reliable performance of these plants at 90- and 95- percent level. Based on these performance statistics, one can determine the reliability of different technologies to meet challenging permit conditions.
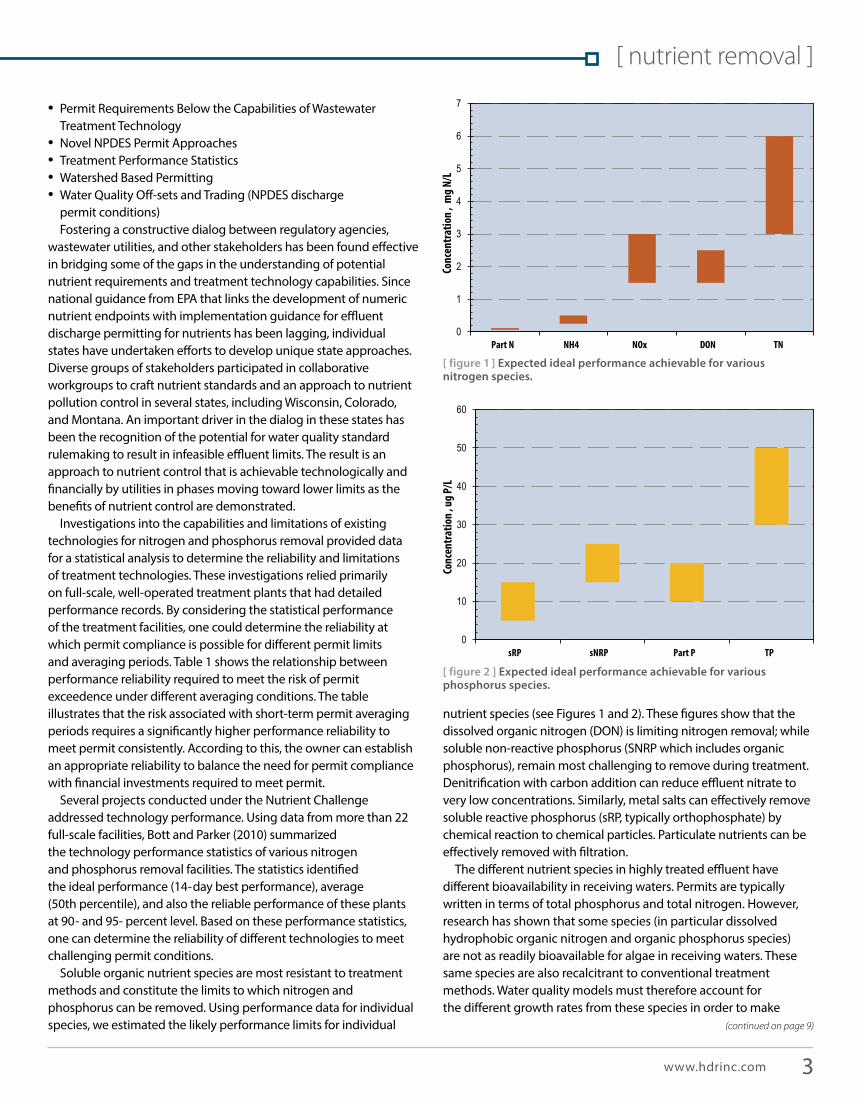
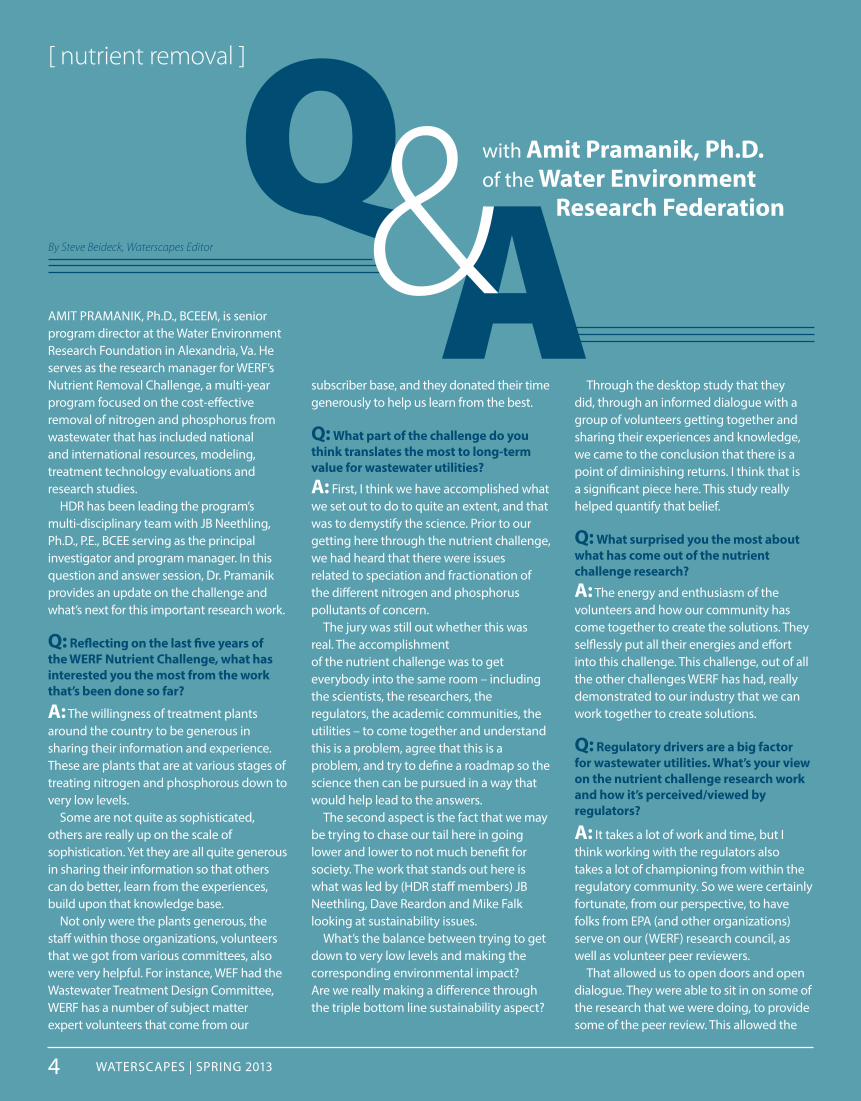
soluble organic nutrient species are most resistant to treatment methods and constitute the limits to which nitrogen and phosphorus can be removed. Using performance data for individual species, we estimated the likely performance limits for individual
nutrient species (see Figures 1 and 2). These figures show that the dissolved organic nitrogen (Don) is limiting nitrogen removal; while soluble non-reactive phosphorus (snrp which includes organic phosphorus), remain most challenging to remove during treatment. Denitrification with carbon addition can reduce effluent nitrate to very low concentrations. similarly, metal salts can effectively remove soluble reactive phosphorus (srp, typically orthophosphate) by chemical reaction to chemical particles. particulate nutrients can be effectively removed with filtration.
The different nutrient species in highly treated effluent have different bioavailability in receiving waters. permits are typically written in terms of total phosphorus and total nitrogen. However, research has shown that some species (in particular dissolved hydrophobic organic nitrogen and organic phosphorus species) are not as readily bioavailable for algae in receiving waters. These same species are also recalcitrant to conventional treatment methods. Water quality models must therefore account for the different growth rates from these species in order to make
0
1
2
3
4
5
6
7
Part N NH4 NOx DON TN
Conc
entra
tion ,
mg
N/L
0
10
20
30
40
50
60
sRP sNRP Part P TP
Conc
entra
tion ,
ug
P/L
[ figure 2 ] expected ideal performance achievable for various phosphorus species.
[ figure 1 ] expected ideal performance achievable for various nitrogen species.
(continued on page 9)
[ nutrient removal ]
3www.hdrinc.com
WATerscApes | spring 2013
AMiT prAMAniK, ph.D., BceeM, is senior program director at the Water environment research Foundation in Alexandria, va. He serves as the research manager for WerF’s nutrient removal challenge, a multi-year program focused on the cost-effective removal of nitrogen and phosphorus from wastewater that has included national and international resources, modeling, treatment technology evaluations and research studies.
HDr has been leading the program’s multi-disciplinary team with JB neethling, ph.D., p.e., Bcee serving as the principal investigator and program manager. in this question and answer session, Dr. pramanik provides an update on the challenge and what’s next for this important research work.
Q: Reflecting on the last five years of the WERF Nutrient Challenge, what has interested you the most from the work that’s been done so far?
A: The willingness of treatment plants around the country to be generous in sharing their information and experience. These are plants that are at various stages of treating nitrogen and phosphorous down to very low levels.
some are not quite as sophisticated, others are really up on the scale of sophistication. Yet they are all quite generous in sharing their information so that others can do better, learn from the experiences, build upon that knowledge base.
not only were the plants generous, the staff within those organizations, volunteers that we got from various committees, also were very helpful. For instance, WeF had the Wastewater Treatment Design committee, WerF has a number of subject matter expert volunteers that come from our
with Amit Pramanik, Ph.D. of the Water Environment Research Federation
By Steve Beideck, Waterscapes Editor
QA&
[ nutrient removal ]
subscriber base, and they donated their time generously to help us learn from the best.
Q: What part of the challenge do you think translates the most to long-term value for wastewater utilities?
A: First, i think we have accomplished what we set out to do to quite an extent, and that was to demystify the science. prior to our getting here through the nutrient challenge, we had heard that there were issues related to speciation and fractionation of the different nitrogen and phosphorus pollutants of concern.
The jury was still out whether this was real. The accomplishment of the nutrient challenge was to get everybody into the same room – including the scientists, the researchers, the regulators, the academic communities, the utilities – to come together and understand this is a problem, agree that this is a problem, and try to define a roadmap so the science then can be pursued in a way that would help lead to the answers.
The second aspect is the fact that we may be trying to chase our tail here in going lower and lower to not much benefit for society. The work that stands out here is what was led by (HDr staff members) JB neethling, Dave reardon and Mike Falk looking at sustainability issues.
What’s the balance between trying to get down to very low levels and making the corresponding environmental impact? Are we really making a difference through the triple bottom line sustainability aspect?
Through the desktop study that they did, through an informed dialogue with a group of volunteers getting together and sharing their experiences and knowledge, we came to the conclusion that there is a point of diminishing returns. i think that is a significant piece here. This study really helped quantify that belief.
Q: What surprised you the most about what has come out of the nutrient challenge research?
A: The energy and enthusiasm of the volunteers and how our community has come together to create the solutions. They selflessly put all their energies and effort into this challenge. This challenge, out of all the other challenges WerF has had, really demonstrated to our industry that we can work together to create solutions.
Q: Regulatory drivers are a big factor for wastewater utilities. What’s your view on the nutrient challenge research work and how it’s perceived/viewed by regulators?
A: it takes a lot of work and time, but i think working with the regulators also takes a lot of championing from within the regulatory community. so we were certainly fortunate, from our perspective, to have folks from epA (and other organizations) serve on our (WerF) research council, as well as volunteer peer reviewers.
That allowed us to open doors and open dialogue. They were able to sit in on some of the research that we were doing, to provide some of the peer review. This allowed the
4

JB neethling (left) with amit Pramanik (right)
© Sc
ott D
obry
Pictu
res
complete results and ongoing research to be shared with regulatory staff members.
We also were fortunate to help review some of the nutrient management and treatment documents epA was creating. That synergy was incredible. This helped with the uptake and knowledge transfer gained from the nutrient challenge.
Q: Why is the WERF nutrient challenge research program valuable not just to WERF subscribers, but to all wastewater utilities in the country facing nutrient limits?
A: That is because the wastewater treatment utilities are a small community. The work we were doing through the nutrient challenge actually involved many beyond our regular subscriber base, yet they were generous enough to provide their data, and vice versa. We created fact sheets and compendiums that we made available to everybody without any charge on what we know, what we don’t know and what we need to know on this subject.
That goes just beyond the U.s. i know folks in Australia and other countries are interested in the work we were doing; they were staying up late into the night or early in the morning to listen to web seminars that were put together to disseminate research findings from our nutrient challenge.
Q: How will this work improve public perception/views on nutrient issues?A: We haven’t gotten to that stage yet. i believe as the work continues to grow, the body of knowledge continues to grow, and this gets transferred into practice, i think we will make significant headway when it gets communicated to the public.
Q: The nutrient sustainability study has received a lot of attention. How do you see the sustainability study helping utilities balance nutrient removal considerations?
A: i think they can take this study and go to their regulators when they have to renew their npDes permits, for example, and say ‘look, this has been the experience not
just with us, but with other utilities. We really cannot get down to that level that you might be requesting on those limits with that corresponding benefit at the cost we’re seeing’.
They can tell them they’re better off spending the public dollar somewhere else. i think this is where that study really would help.
Q: How will sustainability factor in wastewater treatment processes/solutions?
A: Until we began to look at it from a triple bottom line aspect, not much. on the encouraging side, our industry is beginning to look at this more holistically, they’re beginning to look at the economic, social and environmental impact of any decisions or public investment that they make.
i know for a fact more and more utilities are becoming more holistically-minded, they’re breaking down the silos – drinking water, wastewater, stormwater – that have traditionally divided our community and profession.
But it is water, after all, and i think we need to start thinking of it as an integrated piece here. it’s all water; it’s how we manage the water, both the quantities and the qualities, that’s more important than just divvying it up in different silos and trying to work on it with blinders on. More and more utilities are beginning to look at this big picture.
For example, with nutrient removal, we see that if we can remove nitrogen or phosphorus down to such low levels, we might as well recover these as resources. These are scarce resources. We all realize the readily-available phosphorus, which is essential for all life on this planet, is very limited.
phosphorus is available in wastewater, and wastewater treatment plants had once looked at phosphorus as a problem that needed to be removed. At the same time it was gumming up the works in these treatment plants. Almost a decade ago the tide turned and the struvite problem became a phosphorus recovery opportunity.
Q: What is the focus of reNEWable water?
A: i view wastewater as a renewable resource and a three-legged stool. Within the neW, the n is the nutrient, the e is the energy and the w is the water. That’s what i’m enthused about.
i think our industry has embraced this notion and we’re moving forward. A recent example is the Alexandria (va.) sanitation Authority; they recently changed their name to Alex renew. We’re beginning to see a paradigm shift already taking place.
Q: What will WERF want to do next with the nutrient research? How will it fit in with nutrient recovery and broader concepts from wastewater?
A: We see nutrient removal coming to a stage where the recovery piece becomes more important. As we go lower and lower, as our regulations shift toward reducing the amount of nitrogen and phosphorus in the effluent, we’re going to see if we can recover more of it.
so nutrient recovery will start to escalate in terms of intensity, because in nutrient removal we’ve done what we’ve set out to have done. That was to create answers and solutions for utilities that were not quite up that curve here in terms of removing nutrients.
let’s focus now on the recovery pieces. They compliment each other very nicely. S
5www.hdrinc.com
[ nutrient treatment ]
WATerscApes | spring 2013
WATer QUAliTY sTAnDArDs across the country are driving nutrient limits lower and lower, which is creating opportunities for creative nutrient treatment and management solutions. This is the case along the spokane river in the northern idaho city of coeur d’Alene.
The city is facing ultra-low effluent phosphorus limits that are requiring the need for significant treatment upgrades. After a decades-long regulatory process developing the spokane river Dissolved oxygen Total Maximum Daily load (TMDl), city officials anticipate a national pollutant Discharge elimination system (npDes) permit with a seasonal, load total phosphorus (Tp) limit that is equivalent to an effluent concentration of 0.050 mg/l from February through october. The draft compliance schedule to achieve this effluent limit is approximately eight years, with an additional two years provided for process optimization to meet the final effluent limits.
conditions. The technologies produced effluent Tp concentrations less than 0.050 mg/l, and the pilot results highlighted the need for additional testing and larger scale performance analysis.
The city invested in a two-year pilot demonstration facility to investigate three different tertiary phosphorus removal technologies. The purpose of the pilot facility was to test the ability of three technologies to achieve low effluent phosphorus concentrations, and to develop operating strategies, plant maintenance requirements, site-specific design parameters, and troubleshooting guidelines.
The pilot provided a platform for operator training and allowed testing and operations of each technology to determine the operational liability and effluent consistency. Throughout the pilot, the process impacts from diurnal and seasonal flow and loading variability were analyzed, and various flow and load stress testing was performed.
This two-year pilot program focused on providing the city with information to make a strategic, economically-sound and informed decision about the future of its wastewater treatment facility.
1.1 tertiary treatment technologiesThe three technologies tested in coeur d’Alene’s pilot were a
dual-stage continuous upflow sand filter (dual-stage filter), a tertiary membrane filter, and a membrane bioreactor. each technology was designed for 50,000 gallons per day (gpd) average flow that was paced to match the diurnal pattern of the plant flow.
The pilot included online analytical equipment, grab sample points, and composite samplers. Daily influent and effluent composite samples were gathered and analyzed for a variety of constituents. There were 17 grab sample points strategically located throughout the pilot plant facility. grab samples could be taken between any stage of treatment to analyze process conditions in real time using an online analytical instrument that measured ammonia, nitrate and total reactive phosphorus.
By Mario Benisch, P.E., Portland, Ore.Karen Bill, P.E., Water/Wastewater, Portland, Ore.Haley Falconer, Water/Wastewater EIT, Boise, Idaho
prior to the completion of the TMDl, city officials recognized that meeting the low phosphorus challenges would require a substantial investment in additional treatment capacity and technology. in 2006, the city conducted a four-week pilot treatment study with the goal of demonstrating the ability of tertiary technologies to achieve an effluent of 0.010 mg/l Tp under steady-state, vendor-operated
DUAL-STAGE FILTER MBR
BAP (filtered) (ug/L) % (ug/L) %
sample 1 5 20 8 27
sample 2 5 16 9 43
[ table 1 ] Bio-available Phosphorus remaining Following tertiary treatment, Dr. Michael T. Brett and Bo Li, University of Washington, Civil & Environmental Engineering. 2011.
for the Spokane RiveRLow Phosphorus Solutions
Nutrient Limitations Demand
6

[ category ]
1.1.1 DUAL-STAGE FILTERThe dual-stage filter consisted of two filters with a
continuously moving sand bed. Ferric chloride or aluminum sulfate was fed upstream of each filter. The dual-stage filter was typically operated in series to achieve maximum phosphorus removal but could be operated in parallel under high flow conditions.
The dual-stage filter achieved low effluent phosphorus concentrations while operating with either ferric or alum addition. one critical observation throughout the pilot was that the influent phosphorus concentration can impact the effluent performance, especially at high concentrations.
To reduce the impact of influent concentration, online phosphorus monitoring (soluble or total reactive phosphorus) of the influent is recommended. Also, providing load-paced chemical additions based on influent phosphorus concentrations automatically will increase the chemical dose during periods of increased influent phosphorus.
High influent solids concentrations or increased chemical dosing led to decreased bed turnover and, in some cases, substantial bed blinding. To reduce the impacts of these events and provide a simple operations solution, air jets located on the bottom of the filter should be provided to fluidize the bed when this blinding occurs. if an event requires the filter bed to be fluidized, the filtration during that period should be sent to drain rather than discharged as effluent.
1.1.2 TERTIARy MEMBRANE FILTERThe tertiary membrane filter system included an influent
strainer, a chemical mixing tank and a membrane tank. Ferric chloride or aluminum sulfate were added upstream of the mixing tank. The TMF system operated in two modes; conventional filtration mode, or recirculation mode.
When operating in conventional filtration mode, the membrane tank drained during backwash events, wasting the accumulated solids. in recirculation mode, the TMF operated similar to an MBr system where the chemical sludge generated in the process is retained to maintain a solids inventory. This allowed for a longer contact time with the chemical sludge for surface complexation, potentially resulting in greater phosphorus removal.
The tertiary membrane filter achieved low effluent phosphorus concentrations throughout pilot operation. During the first few months, the pilot was operated in conventional mode, but starting in August 2010, the tertiary membrane filter was operated in recirculation mode so that a solids inventory was maintained in the chemical mixing tank.
it was hypothesized that the longer contact time with the chemical sludge for surface complexation could enhance and improve phosphorus removal reliability while reducing effluent variability. The sludge inventory provided a buffer for maintaining some additional phosphorus removal with no chemical coagulant addition (reference next article in this edition of Waterscapes for more details).
While operating in recirculation mode, the TMF also provided ammonia removal as an additional benefit in enhancing effluent quality and meeting one of the effluent discharge objectives. nitrification was primarily seen in the TMF during the summer months (August to october 2010 and June to november 2011) during warmer temperatures.
[ figure 1 ] dual-stage Moving sand Bed Filters
[ figure 2 ] tertiary Membrane Filter
7www.hdrinc.com
[ category ]
waterscapes | spring 2013
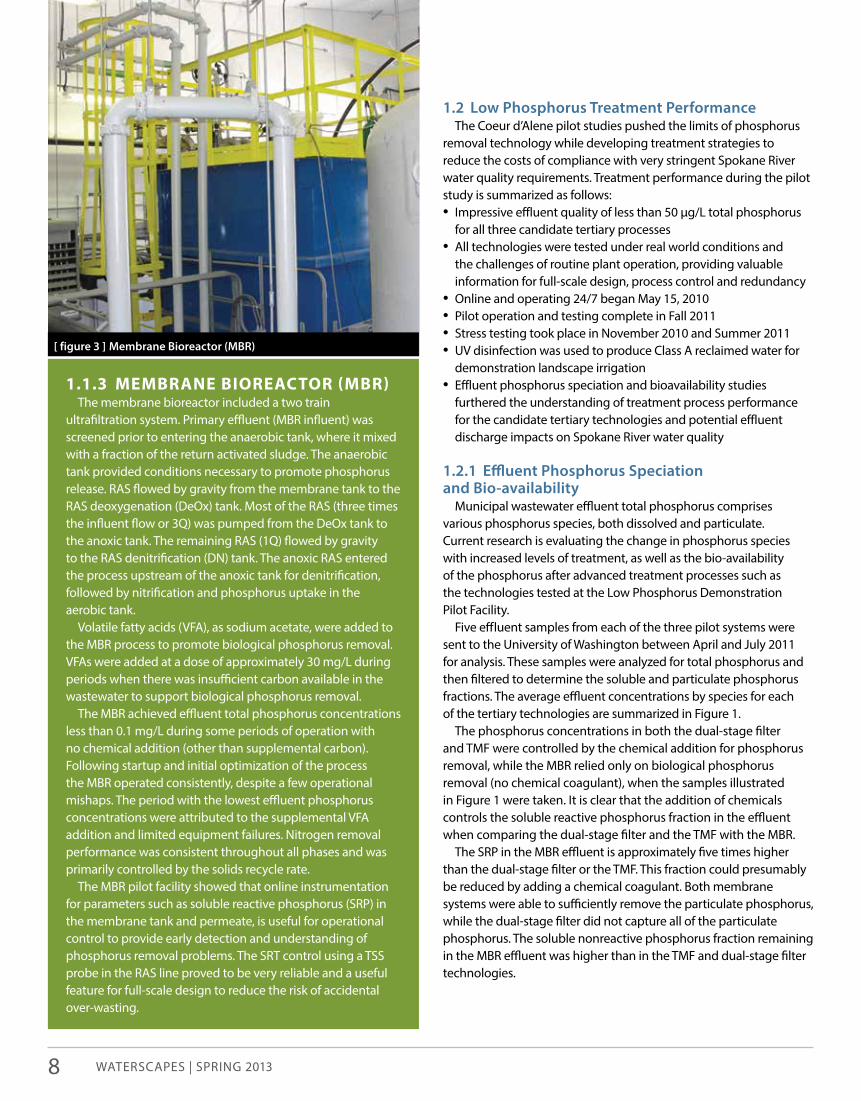
1.1.3 MEMBRANE BIoREACToR (MBR)The membrane bioreactor included a two train
ultrafiltration system. primary effluent (MBr influent) was screened prior to entering the anaerobic tank, where it mixed with a fraction of the return activated sludge. The anaerobic tank provided conditions necessary to promote phosphorus release. rAs flowed by gravity from the membrane tank to the rAs deoxygenation (Deox) tank. Most of the rAs (three times the influent flow or 3Q) was pumped from the Deox tank to the anoxic tank. The remaining rAs (1Q) flowed by gravity to the rAs denitrification (Dn) tank. The anoxic rAs entered the process upstream of the anoxic tank for denitrification, followed by nitrification and phosphorus uptake in the aerobic tank.
volatile fatty acids (vFA), as sodium acetate, were added to the MBr process to promote biological phosphorus removal. vFAs were added at a dose of approximately 30 mg/l during periods when there was insufficient carbon available in the wastewater to support biological phosphorus removal.
The MBr achieved effluent total phosphorus concentrations less than 0.1 mg/l during some periods of operation with no chemical addition (other than supplemental carbon). Following startup and initial optimization of the process the MBr operated consistently, despite a few operational mishaps. The period with the lowest effluent phosphorus concentrations were attributed to the supplemental vFA addition and limited equipment failures. nitrogen removal performance was consistent throughout all phases and was primarily controlled by the solids recycle rate.
The MBr pilot facility showed that online instrumentation for parameters such as soluble reactive phosphorus (srp) in the membrane tank and permeate, is useful for operational control to provide early detection and understanding of phosphorus removal problems. The srT control using a Tss probe in the rAs line proved to be very reliable and a useful feature for full-scale design to reduce the risk of accidental over-wasting.
1.2 Low Phosphorus treatment Performance The coeur d’Alene pilot studies pushed the limits of phosphorus
removal technology while developing treatment strategies to reduce the costs of compliance with very stringent spokane river water quality requirements. Treatment performance during the pilot study is summarized as follows:• impressive effluent quality of less than 50 μg/l total phosphorus
for all three candidate tertiary processes• All technologies were tested under real world conditions and
the challenges of routine plant operation, providing valuable information for full-scale design, process control and redundancy
• online and operating 24/7 began May 15, 2010• pilot operation and testing complete in Fall 2011• stress testing took place in november 2010 and summer 2011• Uv disinfection was used to produce class A reclaimed water for
demonstration landscape irrigation• effluent phosphorus speciation and bioavailability studies
furthered the understanding of treatment process performance for the candidate tertiary technologies and potential effluent discharge impacts on spokane river water quality
1.2.1 effluent Phosphorus speciation and Bio-availability
Municipal wastewater effluent total phosphorus comprises various phosphorus species, both dissolved and particulate. current research is evaluating the change in phosphorus species with increased levels of treatment, as well as the bio-availability of the phosphorus after advanced treatment processes such as the technologies tested at the low phosphorus Demonstration pilot Facility.
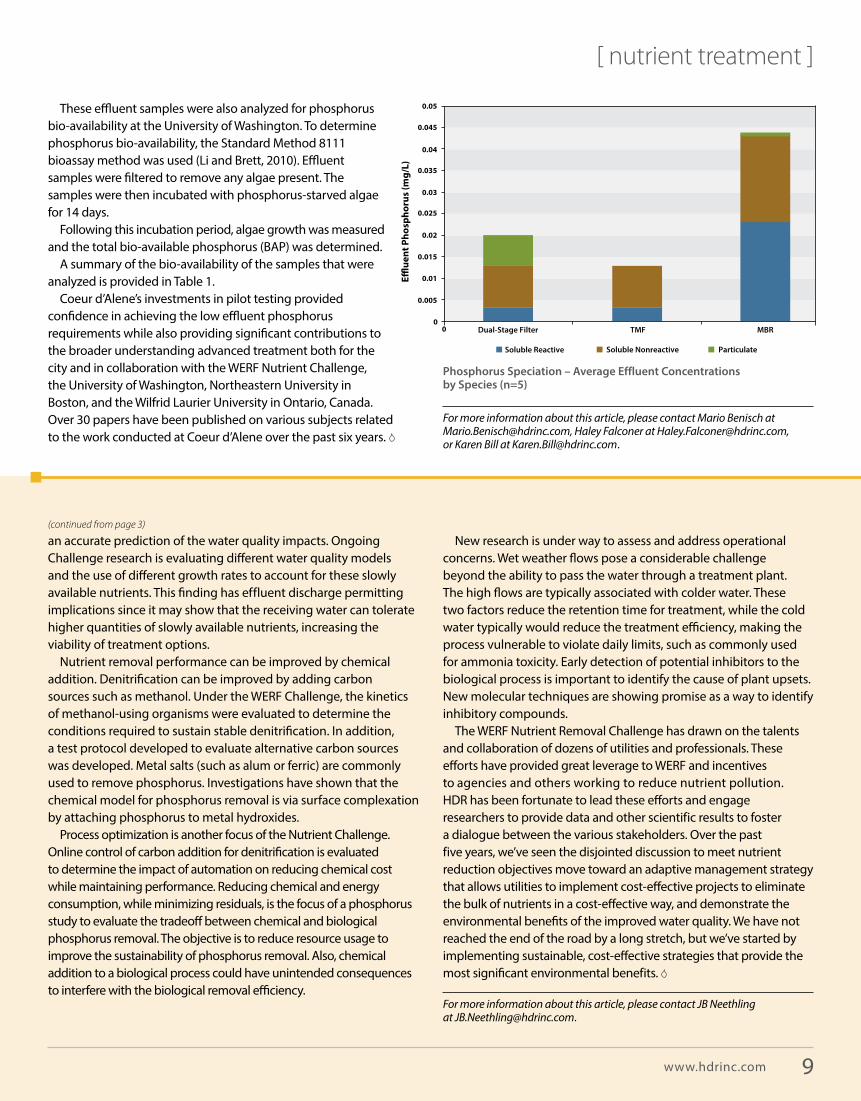
Five effluent samples from each of the three pilot systems were sent to the University of Washington between April and July 2011 for analysis. These samples were analyzed for total phosphorus and then filtered to determine the soluble and particulate phosphorus fractions. The average effluent concentrations by species for each of the tertiary technologies are summarized in Figure 1.
The phosphorus concentrations in both the dual-stage filter and TMF were controlled by the chemical addition for phosphorus removal, while the MBr relied only on biological phosphorus removal (no chemical coagulant), when the samples illustrated in Figure 1 were taken. it is clear that the addition of chemicals controls the soluble reactive phosphorus fraction in the effluent when comparing the dual-stage filter and the TMF with the MBr.
The srp in the MBr effluent is approximately five times higher than the dual-stage filter or the TMF. This fraction could presumably be reduced by adding a chemical coagulant. Both membrane systems were able to sufficiently remove the particulate phosphorus, while the dual-stage filter did not capture all of the particulate phosphorus. The soluble nonreactive phosphorus fraction remaining in the MBr effluent was higher than in the TMF and dual-stage filter technologies.
[ figure 3 ] Membrane Bioreactor (MBr)
8
[ nutrient treatment ]
These effluent samples were also analyzed for phosphorus bio-availability at the University of Washington. To determine phosphorus bio-availability, the standard Method 8111 bioassay method was used (li and Brett, 2010). effluent samples were filtered to remove any algae present. The samples were then incubated with phosphorus-starved algae for 14 days.
Following this incubation period, algae growth was measured and the total bio-available phosphorus (BAp) was determined.
A summary of the bio-availability of the samples that were analyzed is provided in Table 1.
coeur d’Alene’s investments in pilot testing provided confidence in achieving the low effluent phosphorus requirements while also providing significant contributions to the broader understanding advanced treatment both for the city and in collaboration with the WerF nutrient challenge, the University of Washington, northeastern University in Boston, and the Wilfrid laurier University in ontario, canada. over 30 papers have been published on various subjects related to the work conducted at coeur d’Alene over the past six years.
0
0.005
0.01
0.015
0.02
0.025
0.03
0.035
0.04
0.045
0.05
0
E�ue
nt P
hosp
horu
s (m
g/L)
Soluble Reactive
Dual-Stage Filter TMF MBR
Soluble Nonreactive Particulate
For more information about this article, please contact Mario Benisch at [email protected], Haley Falconer at [email protected], or Karen Bill at [email protected] .
an accurate prediction of the water quality impacts. ongoing challenge research is evaluating different water quality models and the use of different growth rates to account for these slowly available nutrients. This finding has effluent discharge permitting implications since it may show that the receiving water can tolerate higher quantities of slowly available nutrients, increasing the viability of treatment options.
nutrient removal performance can be improved by chemical addition. Denitrification can be improved by adding carbon sources such as methanol. Under the WerF challenge, the kinetics of methanol-using organisms were evaluated to determine the conditions required to sustain stable denitrification. in addition, a test protocol developed to evaluate alternative carbon sources was developed. Metal salts (such as alum or ferric) are commonly used to remove phosphorus. investigations have shown that the chemical model for phosphorus removal is via surface complexation by attaching phosphorus to metal hydroxides.
process optimization is another focus of the nutrient challenge. online control of carbon addition for denitrification is evaluated to determine the impact of automation on reducing chemical cost while maintaining performance. reducing chemical and energy consumption, while minimizing residuals, is the focus of a phosphorus study to evaluate the tradeoff between chemical and biological phosphorus removal. The objective is to reduce resource usage to improve the sustainability of phosphorus removal. Also, chemical addition to a biological process could have unintended consequences to interfere with the biological removal efficiency.
new research is under way to assess and address operational concerns. Wet weather flows pose a considerable challenge beyond the ability to pass the water through a treatment plant. The high flows are typically associated with colder water. These two factors reduce the retention time for treatment, while the cold water typically would reduce the treatment efficiency, making the process vulnerable to violate daily limits, such as commonly used for ammonia toxicity. early detection of potential inhibitors to the biological process is important to identify the cause of plant upsets. new molecular techniques are showing promise as a way to identify inhibitory compounds.
The WerF nutrient removal challenge has drawn on the talents and collaboration of dozens of utilities and professionals. These efforts have provided great leverage to WerF and incentives to agencies and others working to reduce nutrient pollution. HDr has been fortunate to lead these efforts and engage researchers to provide data and other scientific results to foster a dialogue between the various stakeholders. over the past five years, we’ve seen the disjointed discussion to meet nutrient reduction objectives move toward an adaptive management strategy that allows utilities to implement cost-effective projects to eliminate the bulk of nutrients in a cost-effective way, and demonstrate the environmental benefits of the improved water quality. We have not reached the end of the road by a long stretch, but we’ve started by implementing sustainable, cost-effective strategies that provide the most significant environmental benefits.
For more information about this article, please contact JB Neethling at [email protected] .
(continued from page 3)
Phosphorus speciation – average effluent Concentrations by species (n=5)
9www.hdrinc.com
WATerscApes | spring 2013
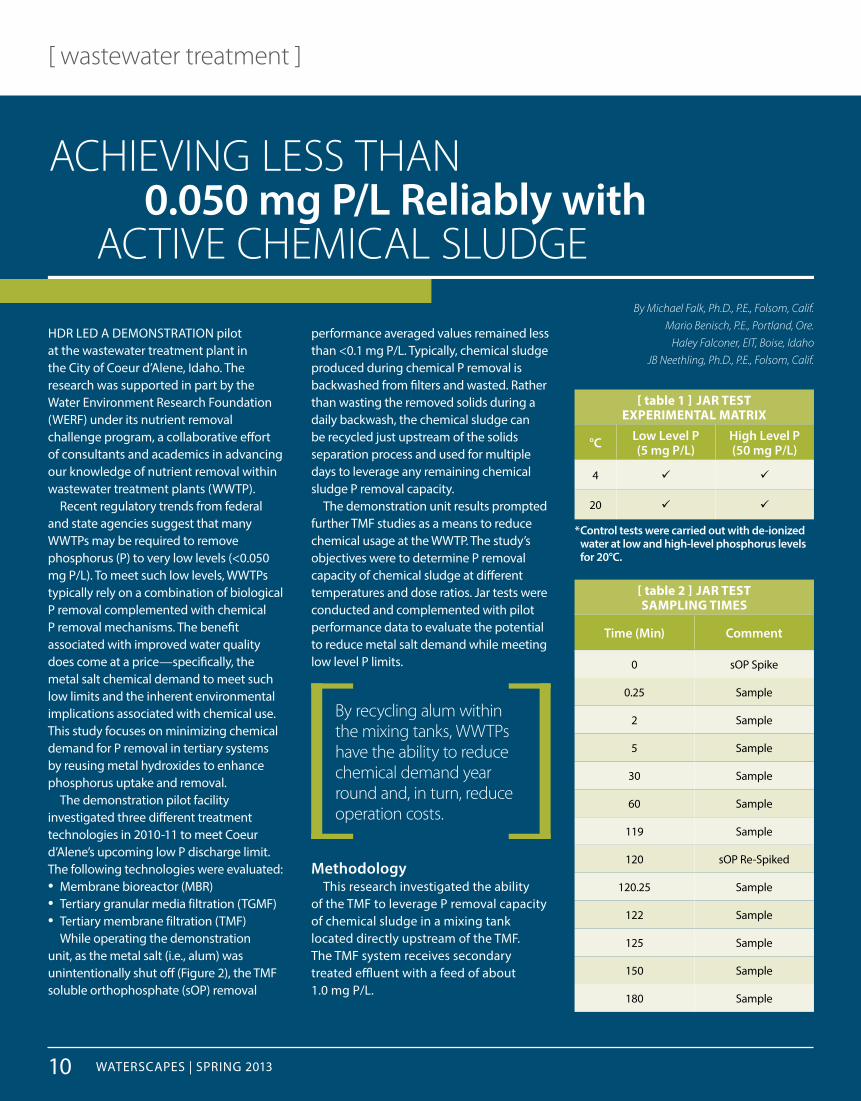
[ table 2 ] JAR TEST SAMPLING TIMES
time (Min) Comment
0 sop spike
0.25 sample
2 sample
5 sample
30 sample
60 sample
119 sample
120 sop re-spiked
120.25 sample
122 sample
125 sample
150 sample
180 sample
* Control tests were carried out with de-ionized water at low and high-level phosphorus levels for 20°C.
By Michael Falk, Ph.D., P.E., Folsom, Calif.Mario Benisch, P.E., Portland, Ore.
Haley Falconer, EIT, Boise, IdahoJB Neethling, Ph.D., P.E., Folsom, Calif.
AchievinG less thAn 0.050 mg P/L reliably with Active chemicAl sluDGe
[ wastewater treatment ]
HDr leD A DeMonsTrATion pilot at the wastewater treatment plant in the city of coeur d’Alene, idaho. The research was supported in part by the Water environment research Foundation (WerF) under its nutrient removal challenge program, a collaborative effort of consultants and academics in advancing our knowledge of nutrient removal within wastewater treatment plants (WWTp).
recent regulatory trends from federal and state agencies suggest that many WWTps may be required to remove phosphorus (p) to very low levels (<0.050 mg p/l). To meet such low levels, WWTps typically rely on a combination of biological p removal complemented with chemical p removal mechanisms. The benefit associated with improved water quality does come at a price —specifically, the metal salt chemical demand to meet such low limits and the inherent environmental implications associated with chemical use. This study focuses on minimizing chemical demand for p removal in tertiary systems by reusing metal hydroxides to enhance phosphorus uptake and removal.
The demonstration pilot facility investigated three different treatment technologies in 2010-11 to meet coeur d’Alene’s upcoming low p discharge limit. The following technologies were evaluated:• Membrane bioreactor (MBr)• Tertiary granular media filtration (TgMF)• Tertiary membrane filtration (TMF)
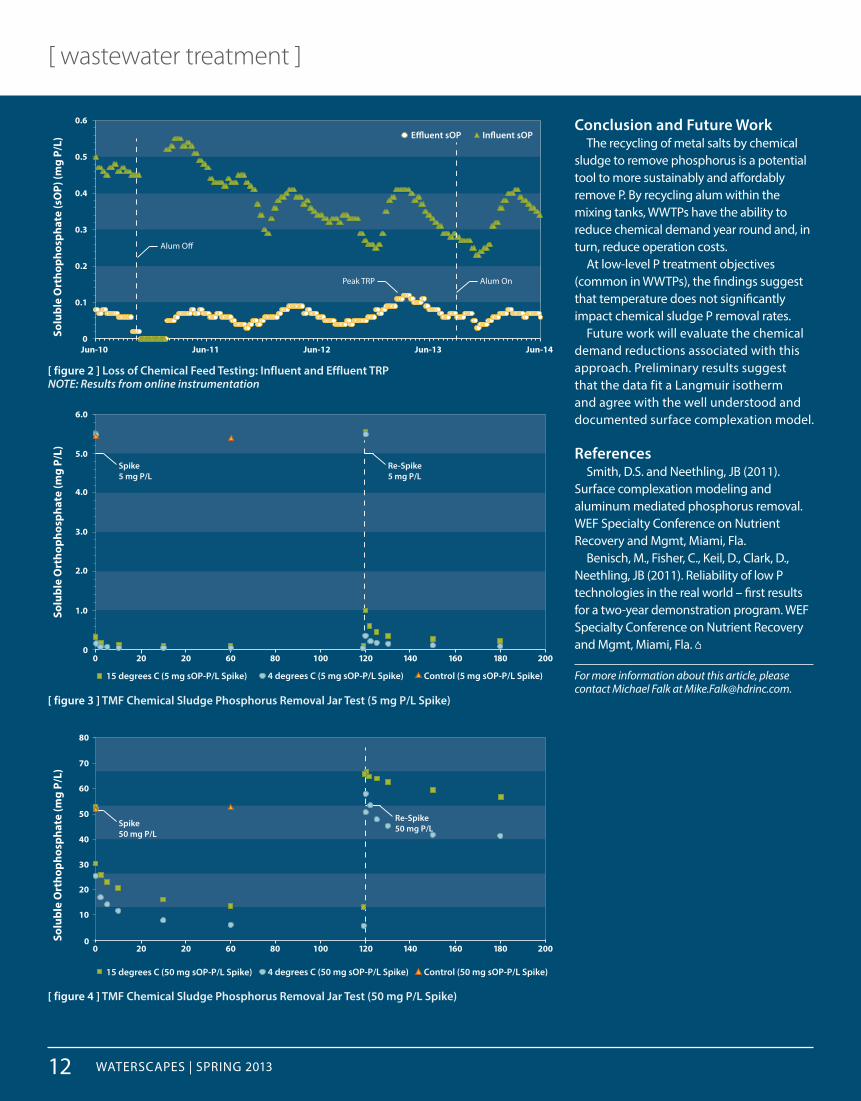
While operating the demonstration unit, as the metal salt (i.e., alum) was unintentionally shut off (Figure 2), the TMF soluble orthophosphate (sop) removal
performance averaged values remained less than <0.1 mg p/l. Typically, chemical sludge produced during chemical p removal is backwashed from filters and wasted. rather than wasting the removed solids during a daily backwash, the chemical sludge can be recycled just upstream of the solids separation process and used for multiple days to leverage any remaining chemical sludge p removal capacity.
The demonstration unit results prompted further TMF studies as a means to reduce chemical usage at the WWTp. The study’s objectives were to determine p removal capacity of chemical sludge at different temperatures and dose ratios. Jar tests were conducted and complemented with pilot performance data to evaluate the potential to reduce metal salt demand while meeting low level p limits.
by recycling alum within the mixing tanks, WWtps have the ability to reduce chemical demand year round and, in turn, reduce operation costs.
MethodologyThis research investigated the ability
of the TMF to leverage p removal capacity of chemical sludge in a mixing tank located directly upstream of the TMF. The TMF system receives secondary treated effluent with a feed of about 1.0 mg p/l.
[ table 1 ] JAR TEST ExPERIMENTAL MATRIx
°C Low Level P (5 mg P/L)
High Level P (50 mg P/L)
4
20
10
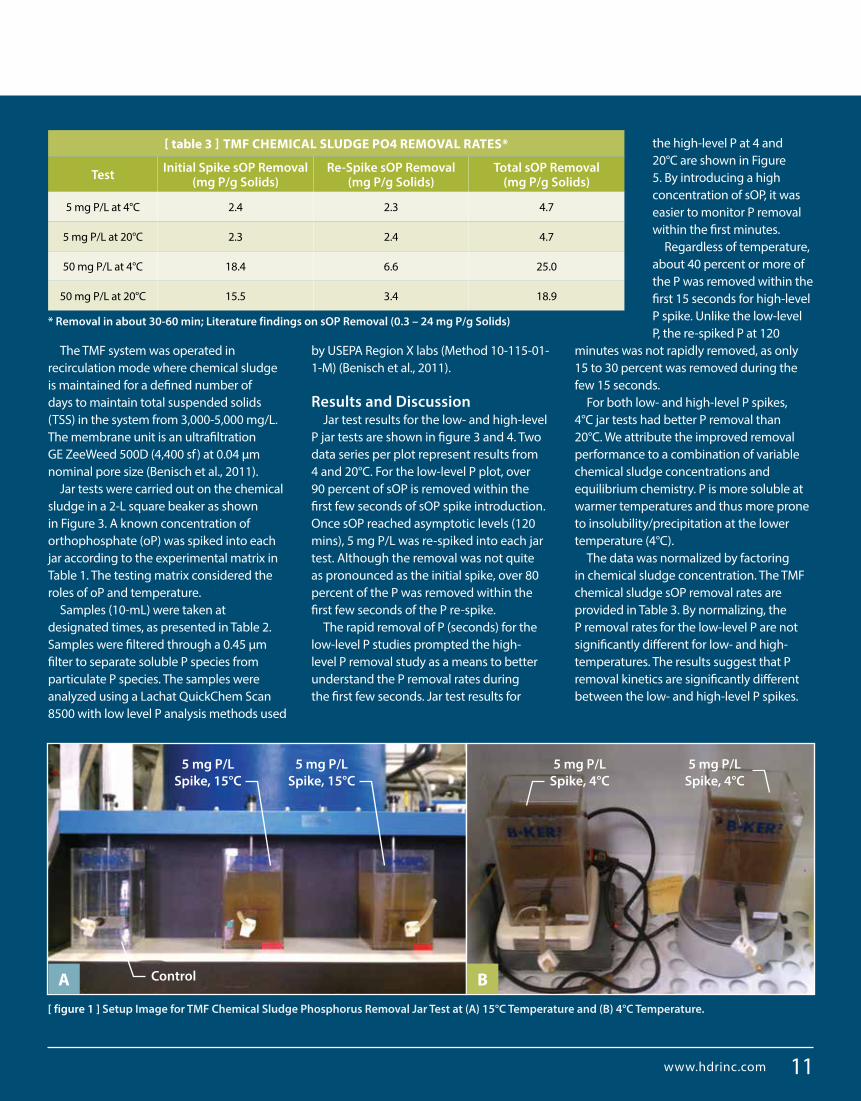
The TMF system was operated in recirculation mode where chemical sludge is maintained for a defined number of days to maintain total suspended solids (Tss) in the system from 3,000-5,000 mg/l. The membrane unit is an ultrafiltration ge ZeeWeed 500D (4,400 sf ) at 0.04 µm nominal pore size (Benisch et al., 2011).
Jar tests were carried out on the chemical sludge in a 2-l square beaker as shown in Figure 3. A known concentration of orthophosphate (op) was spiked into each jar according to the experimental matrix in Table 1. The testing matrix considered the roles of op and temperature.
samples (10-ml) were taken at designated times, as presented in Table 2. samples were filtered through a 0.45 µm filter to separate soluble p species from particulate p species. The samples were analyzed using a lachat Quickchem scan 8500 with low level p analysis methods used
by UsepA region X labs (Method 10-115-01-1-M) (Benisch et al., 2011).
results and discussionJar test results for the low- and high-level
p jar tests are shown in figure 3 and 4. Two data series per plot represent results from 4 and 20°c. For the low-level p plot, over 90 percent of sop is removed within the first few seconds of sop spike introduction. once sop reached asymptotic levels (120 mins), 5 mg p/l was re-spiked into each jar test. Although the removal was not quite as pronounced as the initial spike, over 80 percent of the p was removed within the first few seconds of the p re-spike.
The rapid removal of p (seconds) for the low-level p studies prompted the high-level p removal study as a means to better understand the p removal rates during the first few seconds. Jar test results for
the high-level p at 4 and 20°c are shown in Figure 5. By introducing a high concentration of sop, it was easier to monitor p removal within the first minutes.
regardless of temperature, about 40 percent or more of the p was removed within the first 15 seconds for high-level p spike. Unlike the low-level p, the re-spiked p at 120
minutes was not rapidly removed, as only 15 to 30 percent was removed during the few 15 seconds.
For both low- and high-level p spikes, 4°c jar tests had better p removal than 20°c. We attribute the improved removal performance to a combination of variable chemical sludge concentrations and equilibrium chemistry. p is more soluble at warmer temperatures and thus more prone to insolubility/precipitation at the lower temperature (4°c).
The data was normalized by factoring in chemical sludge concentration. The TMF chemical sludge sop removal rates are provided in Table 3. By normalizing, the p removal rates for the low-level p are not significantly different for low- and high-temperatures. The results suggest that p removal kinetics are significantly different between the low- and high-level p spikes.
[ table 3 ] TMF CHEMICAL SLUDGE Po4 REMovAL RATES *
test initial spike sOP removal (mg P/g solids)
re-spike sOP removal (mg P/g solids)
total sOP removal (mg P/g solids)
5 mg p/l at 4°c 2.4 2.3 4.7
5 mg p/l at 20°c 2.3 2.4 4.7
50 mg p/l at 4°c 18.4 6.6 25.0
50 mg p/l at 20°c 15.5 3.4 18.9
* removal in about 30-60 min; Literature findings on sOP removal (0.3 – 24 mg P/g solids)
[ figure 1 ] setup image for tMF Chemical sludge Phosphorus removal Jar test at (a) 15°C temperature and (B) 4°C temperature.
Control
5 mg P/L spike, 15°C
5 mg P/L spike, 15°C
5 mg P/L spike, 4°C
5 mg P/L spike, 4°C
BA
www.hdrinc.com 11
WATerscApes | spring 2013
[ wastewater treatment ]
0
0.1
0.2
0.3
0.4
0.5
0.6
Jun-10 Jun-11 Jun-12 Jun-13 Jun-14
Solu
ble
Ort
hoph
osph
ate
(sO
P) (m
g P/
L)
E�uent sOP In�uent sOP
Alum O�
Alum OnPeak TRP
Re-Spike5 mg P/L
Spike5 mg P/L
0
1.0
2.0
3.0
4.0
5.0
6.0
0 20 20
Solu
ble
Ort
hoph
osph
ate
(mg
P/L)
15 degrees C (5 mg sOP-P/L Spike) 4 degrees C (5 mg sOP-P/L Spike) Control (5 mg sOP-P/L Spike)
60 80 100 120 140 160 180 200
Re-Spike50 mg P/LSpike
50 mg P/L
0
10
0 20 20
Solu
ble
Ort
hoph
osph
ate
(mg
P/L)
15 degrees C (50 mg sOP-P/L Spike) 4 degrees C (50 mg sOP-P/L Spike) Control (50 mg sOP-P/L Spike)
60 80 100 120 140 160 180 200
20
30
40
50
60
70
80
[ figure 4 ] tMF Chemical sludge Phosphorus removal Jar test (50 mg P/L spike)
[ figure 2 ] Loss of Chemical Feed testing: influent and effluent trPNOTE: Results from online instrumentation
[ figure 3 ] tMF Chemical sludge Phosphorus removal Jar test (5 mg P/L spike)
Conclusion and Future WorkThe recycling of metal salts by chemical
sludge to remove phosphorus is a potential tool to more sustainably and affordably remove p. By recycling alum within the mixing tanks, WWTps have the ability to reduce chemical demand year round and, in turn, reduce operation costs.
At low-level p treatment objectives (common in WWTps), the findings suggest that temperature does not significantly impact chemical sludge p removal rates.
Future work will evaluate the chemical demand reductions associated with this approach. preliminary results suggest that the data fit a langmuir isotherm and agree with the well understood and documented surface complexation model.
referencessmith, D.s. and neethling, JB (2011).
surface complexation modeling and aluminum mediated phosphorus removal. WeF specialty conference on nutrient recovery and Mgmt, Miami, Fla.
Benisch, M., Fisher, c., Keil, D., clark, D., neethling, JB (2011). reliability of low p technologies in the real world – first results for a two-year demonstration program. WeF specialty conference on nutrient recovery and Mgmt, Miami, Fla.
For more information about this article, please contact Michael Falk at [email protected] .
12
[ secondary treatment standards ]
EPA Rejects NRDC Petition for Rulemaking to Include Nutrients in the Definition of Secondary Treatment
on Dec. 14, 2012, the United states environmental protection Agency (epA) rejected the natural resources Defense council (nrDc) petition for rulemaking on secondary treatment standards. nrDc had challenged epA to update secondary treatment regulations and include effluent limits for nitrogen and phosphorus citing widespread nutrient pollution.
epA’s action in rejecting the petition is significant in that the approach advocated by nrDc would have had far reaching effects on many wastewater utilities by applying a uniform standard for nutrient removal despite widely varying water quality conditions across the country.
This would be costly and not necessarily result in commensurate water quality benefits. instead, the epA continues to emphasize that states should adopt numeric nutrient criteria, and interpret existing narrative standards, to control nutrients. nevertheless, the nrDc petition was a provocative suggestion to address control of nutrient discharges from wastewater facilities through application of treatment technology based effluent limits.
Background on nrdC Petition on nov. 27, 2007, the natural resources Defense council (nrDc)
filed a petition for rulemaking with the epA to limit nutrient pollution from wastewater treatment facilities.
Joining nrDc in the petition were 10 other regional and national environmental groups, including the sierra club and American rivers. nrDc contended that the epA must protect both the public and the nation’s water quality by establishing nitrogen and phosphorus limits as part of the base technology definition of secondary treatment.
nrDc argued that nutrient pollution is widespread and justifies a generally-applicable standards approach to treatment for nutrients. The nrDc contended that nutrient control is properly included within “secondary treatment” and cited the following as facts:• effluent Tp 0.3 mg/l and Tn 3 mg/l is consistently attainable using
current technology• effluent Tp 1 mg/l and Tn 8.0 mg/l is attainable with existing
technology using only improved biological treatment processesnrDc argued that epA’s reliance on site specific standards is
unreasonable in light of pervasive nutrient pollution and the lack of numeric nutrient standards, which hinders the ability to require water quality-based effluent limitations. nrDc called for epA to specify the degree of nitrogen and phosphorus reduction attainable through secondary treatment.
Basis for ePa’s rejectionA Dec. 14, 2012 letter from Michael H. shapiro, epA deputy
assistant administrator, explained epA’s reasoning in rejecting the nrDc petition. in answering the petition, the epA noted that secondary treatment technology is not designed for nutrient removal and found that there was insufficient data to draw any general conclusions about the ability of secondary treatment to remove nutrients.
epA officials determined that setting uniform technology-based effluent limits for nutrients is not warranted at this time, and that epA is effectively pursuing control of wastewater discharges of nutrients with site specific, water quality-based effluent limits.
epA officials also noted that setting uniform national limits for nutrients would have a high cost for publically owned treatment works (poTWs), even when incurring those costs was not necessary to protect water quality. epA presented a detailed analysis to support rejection of the petition, including the key considerations discussed in the following paragraphs.
ePa report on the Performance of secondary treatment technology
The nrDc petition called on epA to publish information on nutrient reduction attainable by secondary treatment. epA found that there was little data upon which to assess incidental nutrient removal in secondary treatment facilities and determined that no general conclusions could be drawn about nutrient removal in facilities using secondary treatment alone.
in March 2013, epA published a report on secondary treatment technology as a support document in response to the nrDc petition. epA selected the most common secondary treatment process, activated sludge, and used the facilities included in a 2008 clean Watersheds needs survey with flows greater than 10 million gallons per day (mgd).
included in the needs survey were 653 facilities with design flows greater than 10 mgd, and of those, 116 were activated sludge plants with no nutrient removal. There also were 107 plants with ammonia removal, 59 with nitrogen and phosphorus removal, 122 with phosphorus removal, and 66 with nitrogen removal.
For the 116 activated sludge secondary treatment plants meeting or bettering effluent limits of 30 mg/l Tss and 30 mg/l BoD5 (or 25 mg/l cBoD5), epA used the data reported in the permit compliance system (pcs) and integrated compliance information system for the national pollutant Discharge elimination system (icis-npDes) to evaluate Tss and BoD performance (not nutrient removal performance).
By Dave Clark, P.E., Water and Natural Resources Wastewater Market Sector Director, Boise, Idaho
13www.hdrinc.com
waterscapes | spring 2013
[ secondary treatment standards ]
epA decided to screen out facilities with more than six combined sewer overflow (cso) outfalls due to noticeable impacts on the reported effluent concentrations. The following summarizes the findings of the secondary treatment Tss and BoD performance review for plants with fewer than six cso outfalls: • For facilities with 30 mg/l effluent BoD5 limits (33 plants),
epA found the following effluent performance: – Median BoD5 9.2 mg/l – 95th percentile BoD5 24.0 mg/l
• For facilities with 25 mg/l effluent cBoD limits (42 plants), epA found the following effluent performance:
– Median cBoD5 5.2 mg/l – 95th percentile cBoD5 15.0 mg/l
• For facilities with 30 mg/l effluent Tss limits (68 plants), epA found the following effluent performance:
– Median Tss 8.0 mg/l – 95th percentile Tss 20.0 mg/l
nutrient Limits not Warranted at this timeAlthough epA stated that eliminating nutrient pollution is one of
its top priorities, epA officials determined that revising secondary treatment standards to include limitations for nutrients is not warranted at this time.
in making this determination, it was noted that the need to control nutrients is highly site-specific and not suited to a national rule with minimum technology-based nutrient limits. epA’s preferred approach is to continue to use water quality-based permitting and allow states the flexibility to determine where point source nutrient controls are warranted.
Potential implications of nrdC Petition for secondary treatment
secondary treatment technology standards originally were to be met by 1977 and best practicable waste treatment technology (BpWTT), which was envisioned to include nutrients, by 1983. However, congress repealed the 1983 deadline for BpWTT in recognition of the lack of federal funding in the Municipal Wastewater Treatment construction grants amendments of 1981.
The epA’s decision to deny the nrDc petition included consideration of the intent of congress in balancing policy with use of public funds. substantial costs would be incurred by wastewater utilities to comply with a national secondary treatment standard that included new nutrient limitations.
epA officials estimated that to retrofit or replace secondary treatment at all plants with flows greater than 0.5 mgd would cost between $5 and $12 billion annually. The capital cost of retrofitting secondary plants was estimated to be $45 billion, and the costs to replace other existing facilities were estimated to be $130 billion.
Also, epA officials firmly refuted the nrDc assertion that minor retrofits to existing treatment facilities would allow cost-effective reduction of nutrient discharges. epA found that nrDc underestimated the actual cost of retrofits and overlooked many smaller facilities throughout the country that employ trickling filters, lagoons and oxidation ponds that would not be easily retrofit.
These officials also found that the examples cited by nrDc were already using some form of advanced treatment and that it would be much easier to retrofit under-loading facilities that had available capacity, which was a site-specific condition.
Dischargers have the option of pursuing relief from nutrient criteria through establishment of site-specific alternative criteria (ssAc), a variance or a designated use modification.
The evolution of Florida nutrient criteria continues to be an interesting story that has generated many headlines while also highlighting the difficulty involved in setting numeric nutrient endpoints in rivers, streams, estuaries and coastal waters.
legal challenges led the epA to step into Florida to establish nutrient criteria. This led to a push back and on-going debate extending for more than five years through the ebb and flow of federal and state efforts, challenges from environmental groups, and court decisions.
At the core are nutrient criteria for nitrogen and phosphorus that are low concentrations, whether developed by the state or by epA, and likely to present challenges for wastewater dischargers that will face water quality-based effluent limits for surface water discharges. A recent announcement of an agreement between epA and the state of Florida signals the beginning of a new chapter of numeric nutrient criteria implementation.
Florida Nutrient Criteria UpdateFlorida nutrient Criteria Background
in a letter dated April 29, 2008, earthjustice stated its intention to sue epA for not setting numeric nutrient criteria for Florida as outlined in section 303(c)(4)(B) of the clean Water Act (cWA). The case was filed in the U.s. District court, northern District of Florida, and included the Florida Wildlife Federation, sierra club, conservancy of southwest Florida, environmental confederation of southwest Florida, and st. John’s riverkeeper.
in a letter to the Florida Department of environmental protection dated Jan. 14, 2009, Ben grumbles, then the assistant administrator for the epA, issued an official determination that pursuant to the cWA section 303(c)(4)(B), new or revised nutrient water quality standards were necessary for Florida to meet the requirements of the cWA.
Although Florida had taken steps to control nutrient enrichment, epA officials concluded that Florida’s narrative nutrient criterion was
By Dave Clark, P.E., Water and Natural Resources Wastewater Market Sector Director, Boise, Idaho
14
[ nutrient criteria ]
(continued on inside back cover)
not sufficient to protect designated uses, and numeric criteria were necessary to comply with the cWA. The epA’s letter of determination stated that despite Florida’s actions to control nutrient pollution, an analysis of United states geological survey monitoring data showed that no significant improvements had occurred since 1980.
The epA entered into a consent Decree with Florida Wildlife Federation, sierra club, conservancy of southwest Florida, environmental confederation of southwest Florida, and st. John’s riverkeeper, effective on Dec. 30, 2009, which established a schedule for epA to promulgate numeric nutrient criteria for Florida. Under the provisions of the consent decree, epA wouldn’t be obligated to propose criteria if Florida submitted numeric nutrient criteria that would meet epA approval.
ePa Proposed Water Quality standards for Floridaon Jan. 26, 2010, epA officials proposed water quality standards
for lakes and flowing waters in the state of Florida. Four water body types were proposed for the state on which to base nutrient standards – lakes, streams, springs and clear streams, and canals in south Florida. epA’s proposed rule included nutrient criteria for both in-stream protection values and controversial downstream protection values. epA’s proposed stream criteria for total nitrogen ranged from 0.824 to 1.798 mg/l, and total phosphorus from 0.043 to 0.739 mg/l, across the state of Florida’s nutrient watershed regions.
ePa’s alternative regulatory approachesAn interesting aspect of epA’s proposed Florida nutrient criteria
was a section called “Alternative regulatory Approaches and implementation Mechanisms” that presented a discussion of several tools for implementing nutrient control requirements, including water quality variances, site-specific alternative criteria (ssAc), compliance schedules, and restoration water quality standards.
epA’s proposed restoration standard approach was not fully developed but appeared similar in some respects to a water quality variance in that full compliance could be extended by phasing for eventual attainment of water quality standards. epA framed restoration standards to consider a broad range of watershed management issues, including nonpoint source controls and innovative and flexible approaches.
The epA’s approach also appeared to carry a substantial burden in building the justification to demonstrate that standards are not
attainable and to define interim milestones and beneficial uses, perhaps through use attainability analysis (UAA).
Lawsuits and 2012 Consolidated Case rulingBy January 2011, 13 lawsuits related to Florida nutrient criteria had
been filed. There were 25 parties involved, including the Fertilizer institute, Florida cattlemen’s Association, Florida electric power coordinating group, inc., Florida Fruit and vegetable Association, Florida league of cities, Florida pulp and paper Association, Florida stormwater Association, Florida Water environmental Association Utility council, Florida Wildlife Federation, gulf restoration network, southeast Milk, inc., and the state of Florida.
The 2012 consolidated case in U.s. District court for the northern District of Florida resulted in an interesting ruling where the summary-judgment motions were both granted in part and denied in part. Where the epA provided substantive reasoning of some sort to support nutrient criteria, the court held that the epA could do so.
on the other hand, when epA either had no supporting basis for the proposed criteria, or simply failed to present the supporting information, the court found that epA’s actions were arbitrary or capricious.
The court found that the epA Administrator was justified in setting numeric criteria in Florida and upheld the lakes and springs criteria. However, the court found that epA did not provide a sound basis in science to support the stream criteria and found them arbitrary or capricious.
The court found that adopting “downstream protection values” to protect water quality was not arbitrary or capricious. However, the use of default “downstream protection values” for a lake that is unimpaired is inappropriate because there needs to be a basis in sound science for limiting nutrient increases that cause a harmful increase in flora or fauna, not just any nutrient increase.
some highlights of the court decision are summarized in the following:• ePa setting numeric Criteria for Florida. “in 2009 the (epA)
Administrator made an explicit “determination” under clean Water Act § 303(c)(4), 33 U.s.c. § 1313(c)(4), that new criteria—numeric criteria—are necessary to meet the Act’s requirements. The determination imposed on the Administrator an explicit statutory duty to promptly propose and adopt new criteria unless Florida did so first. Florida did not. The Administrator’s determination was not “arbitrary, capricious, an abuse of discretion, or otherwise not in accordance with law.””
• Lake and spring Criteria. “The (epA) Administrator adopted lake and spring criteria based on modeling and field studies designed to determine the level at which an increase in nutrients ordinarily causes harmful effects. The criteria are based on sound science and are not arbitrary or capricious.”
• stream Criteria. “The Administrator was unable to develop acceptable stream criteria based on modeling and field studies and so adopted stream criteria using a different approach. she identified a representative sample of minimally-disturbed streams for which nutrient data were available, calculated annual
15www.hdrinc.com
waterscapes | spring 2013
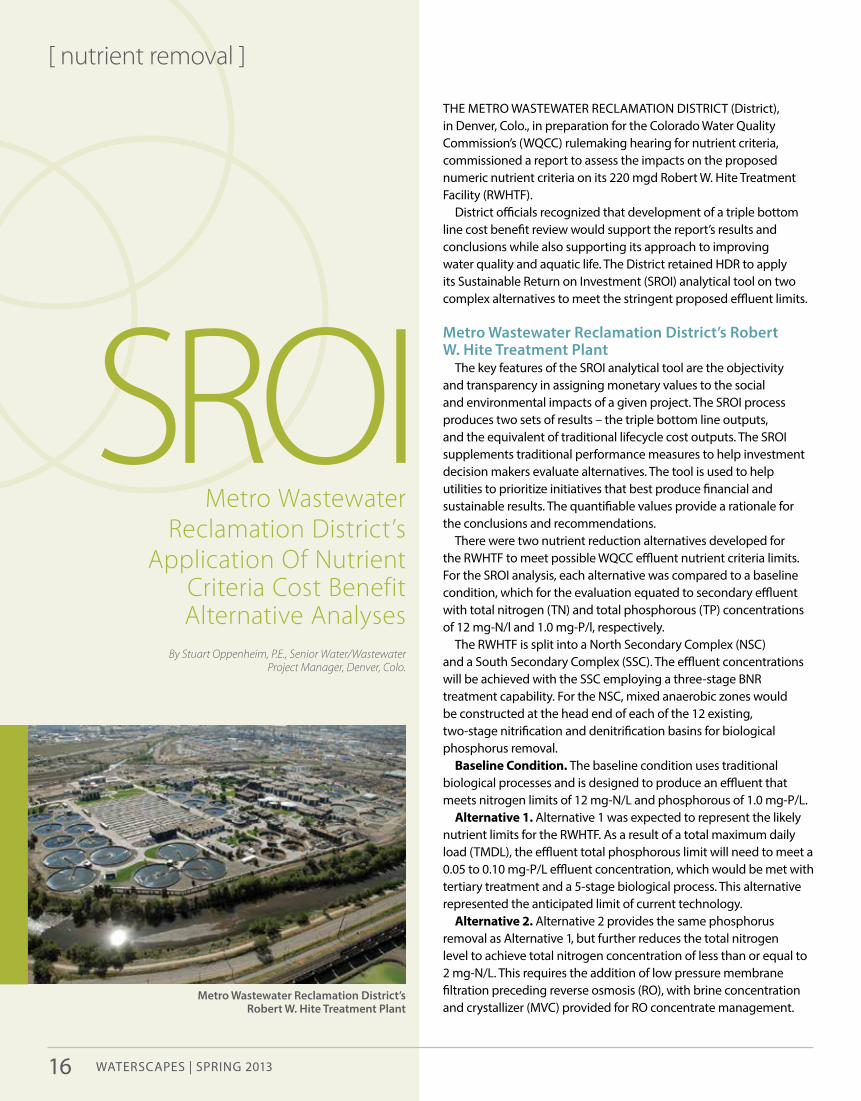
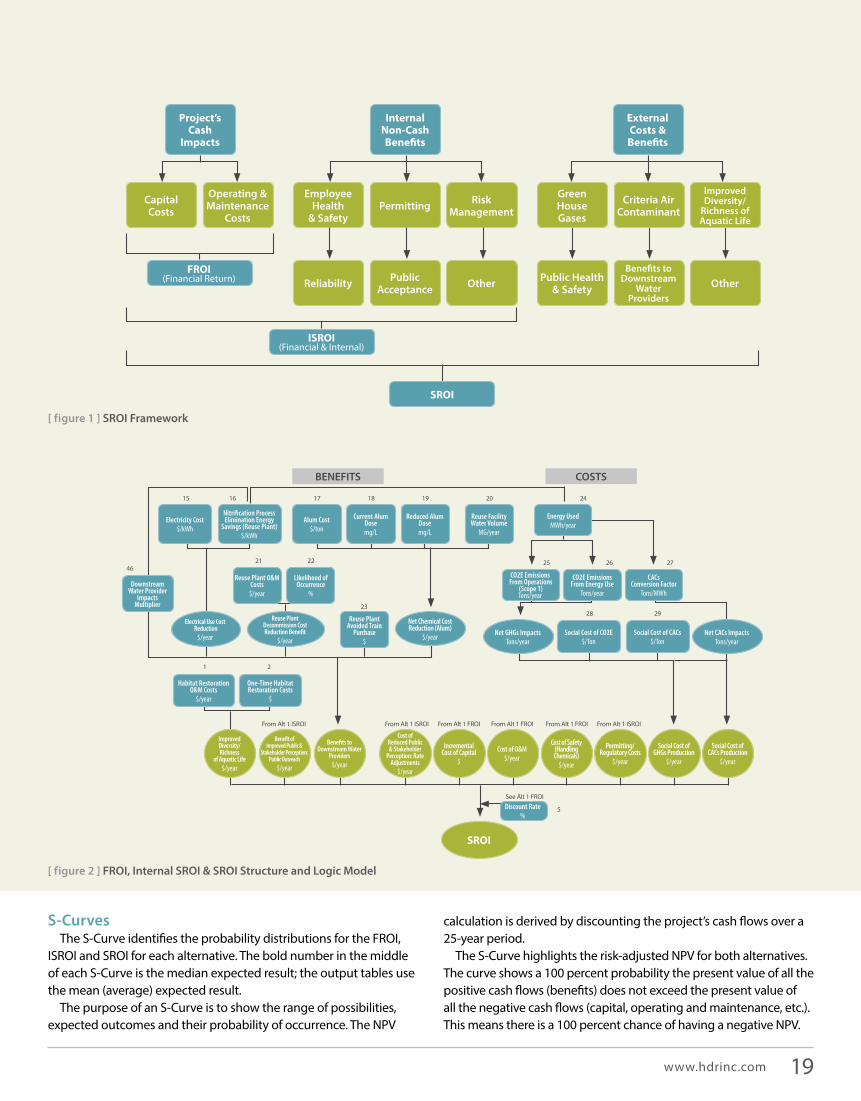
THe MeTro WAsTeWATer reclAMATion DisTricT (District), in Denver, colo., in preparation for the colorado Water Quality commission’s (WQcc) rulemaking hearing for nutrient criteria, commissioned a report to assess the impacts on the proposed numeric nutrient criteria on its 220 mgd robert W. Hite Treatment Facility (rWHTF).
District officials recognized that development of a triple bottom line cost benefit review would support the report’s results and conclusions while also supporting its approach to improving water quality and aquatic life. The District retained HDr to apply its sustainable return on investment (sroi) analytical tool on two complex alternatives to meet the stringent proposed effluent limits.
Metro Wastewater reclamation district’s robert W. Hite treatment Plant
The key features of the sroi analytical tool are the objectivity and transparency in assigning monetary values to the social and environmental impacts of a given project. The sroi process produces two sets of results – the triple bottom line outputs, and the equivalent of traditional lifecycle cost outputs. The sroi supplements traditional performance measures to help investment decision makers evaluate alternatives. The tool is used to help utilities to prioritize initiatives that best produce financial and sustainable results. The quantifiable values provide a rationale for the conclusions and recommendations.
There were two nutrient reduction alternatives developed for the rWHTF to meet possible WQcc effluent nutrient criteria limits. For the sroi analysis, each alternative was compared to a baseline condition, which for the evaluation equated to secondary effluent with total nitrogen (Tn) and total phosphorous (Tp) concentrations of 12 mg-n/l and 1.0 mg-p/l, respectively.
The rWHTF is split into a north secondary complex (nsc) and a south secondary complex (ssc). The effluent concentrations will be achieved with the ssc employing a three-stage Bnr treatment capability. For the nsc, mixed anaerobic zones would be constructed at the head end of each of the 12 existing, two-stage nitrification and denitrification basins for biological phosphorus removal.
Baseline Condition. The baseline condition uses traditional biological processes and is designed to produce an effluent that meets nitrogen limits of 12 mg-n/l and phosphorous of 1.0 mg-p/l.
Alternative 1. Alternative 1 was expected to represent the likely nutrient limits for the rWHTF. As a result of a total maximum daily load (TMDl), the effluent total phosphorous limit will need to meet a 0.05 to 0.10 mg-p/l effluent concentration, which would be met with tertiary treatment and a 5-stage biological process. This alternative represented the anticipated limit of current technology.
Alternative 2. Alternative 2 provides the same phosphorus removal as Alternative 1, but further reduces the total nitrogen level to achieve total nitrogen concentration of less than or equal to 2 mg-n/l. This requires the addition of low pressure membrane filtration preceding reverse osmosis (ro), with brine concentration and crystallizer (Mvc) provided for ro concentrate management.
By Stuart Oppenheim, P.E., Senior Water/Wastewater Project Manager, Denver, Colo.
Metro Wastewater reclamation district’s robert W. Hite treatment Plant
sRoimetro Wastewater
Reclamation District’sApplication of nutrient
criteria cost benefit Alternative Analyses
[ nutrient removal ]
16
Step 1 Develop the structure and logic Diagrams
Step 2
Step 3
Step 4
Assign monetary values and Risk Ranges
Develop consensus Among stakeholders
simulate and Quantify the outcome
map out all relevant economic, social and environmental variables of an initiative, starting from the basic division of costs and benefits.
measure the impacts of the project by assigning monetary values and probability distributions, where possible, to each variable.
bring stakeholders together to evaluate and validate the structure of the model and the assigned values and probabilities of each variable.
once consensus regarding the inputs is achieved, compute the net present value, discounted payback period, rate of return and the distribution of benefits for the initiative.
Hdr’s srOi PrOCess invOLves FOur distinCt stePs
District officials developed capital and annual operation and maintenance (o&M) costs, as well as greenhouse gas (gHg) production for each alternative. With the addition of membrane filtration, reverse osmosis and brine disposal, the District was able to identify the incremental costs for nitrogen removal. Although the cost for Alternative 1 over the baseline was considerable, the increased costs for Alternative 2 were more substantial.
in order to assess the overall societal cost for the alternatives, the District decided to enlist the sroi analytical tool to capture the social, environmental and economic costs for each alternative.
How does the srOi Process Work?Decisions considering sustainability
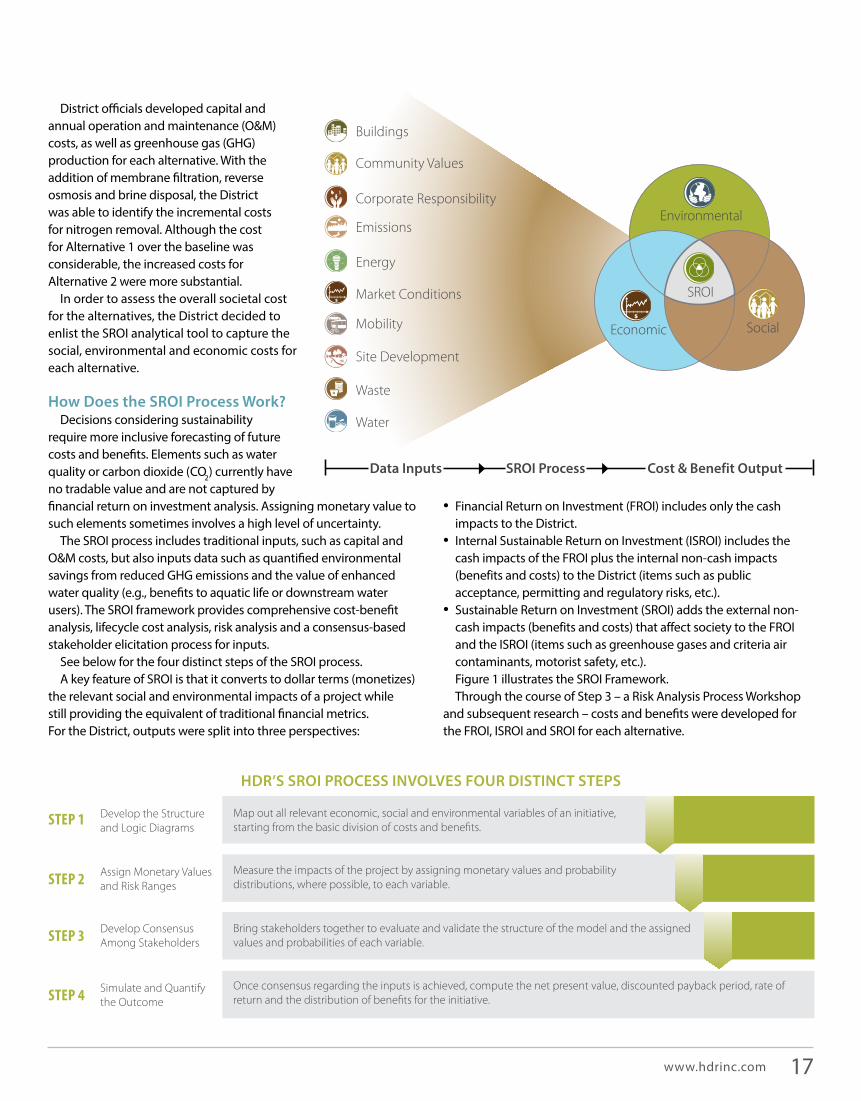
require more inclusive forecasting of future costs and benefits. elements such as water quality or carbon dioxide (co2) currently have no tradable value and are not captured by financial return on investment analysis. Assigning monetary value to such elements sometimes involves a high level of uncertainty.
The sroi process includes traditional inputs, such as capital and o&M costs, but also inputs data such as quantified environmental savings from reduced gHg emissions and the value of enhanced water quality (e.g., benefits to aquatic life or downstream water users). The sroi framework provides comprehensive cost-benefit analysis, lifecycle cost analysis, risk analysis and a consensus-based stakeholder elicitation process for inputs.
see below for the four distinct steps of the sroi process.A key feature of sroi is that it converts to dollar terms (monetizes)
the relevant social and environmental impacts of a project while still providing the equivalent of traditional financial metrics. For the District, outputs were split into three perspectives:
• Financial return on investment (Froi) includes only the cash impacts to the District.
• internal sustainable return on investment (isroi) includes the cash impacts of the Froi plus the internal non-cash impacts (benefits and costs) to the District (items such as public acceptance, permitting and regulatory risks, etc.).
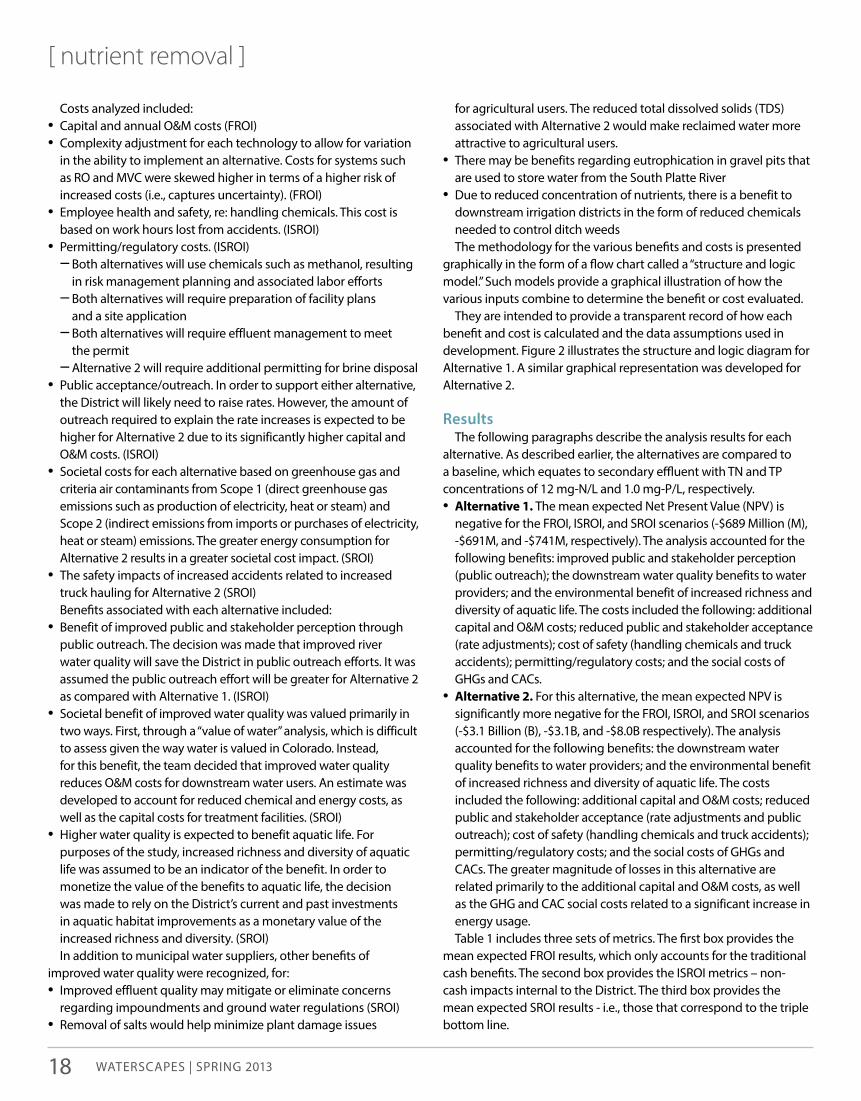
• sustainable return on investment (sroi) adds the external non-cash impacts (benefits and costs) that affect society to the Froi and the isroi (items such as greenhouse gases and criteria air contaminants, motorist safety, etc.).Figure 1 illustrates the sroi Framework.Through the course of step 3 – a risk Analysis process Workshop
and subsequent research – costs and benefits were developed for the Froi, isroi and sroi for each alternative.
$market conditions
corporate Responsibility
buildings
energy
site Development
mobility
Water
Waste
community values
data inputs srOi Process Cost & Benefit Output
$
environmental
economic social
emissions
sRoi
17www.hdrinc.com
costs analyzed included: • capital and annual o&M costs (Froi)• complexity adjustment for each technology to allow for variation
in the ability to implement an alternative. costs for systems such as ro and Mvc were skewed higher in terms of a higher risk of increased costs (i.e., captures uncertainty). (Froi)
• employee health and safety, re: handling chemicals. This cost is based on work hours lost from accidents. (isroi)
• permitting/regulatory costs. (isroi) – Both alternatives will use chemicals such as methanol, resulting in risk management planning and associated labor efforts – Both alternatives will require preparation of facility plans and a site application – Both alternatives will require effluent management to meet the permit – Alternative 2 will require additional permitting for brine disposal
• public acceptance/outreach. in order to support either alternative, the District will likely need to raise rates. However, the amount of outreach required to explain the rate increases is expected to be higher for Alternative 2 due to its significantly higher capital and o&M costs. (isroi)
• societal costs for each alternative based on greenhouse gas and criteria air contaminants from scope 1 (direct greenhouse gas emissions such as production of electricity, heat or steam) and scope 2 (indirect emissions from imports or purchases of electricity, heat or steam) emissions. The greater energy consumption for Alternative 2 results in a greater societal cost impact. (sroi)
• The safety impacts of increased accidents related to increased truck hauling for Alternative 2 (sroi)Benefits associated with each alternative included:
• Benefit of improved public and stakeholder perception through public outreach. The decision was made that improved river water quality will save the District in public outreach efforts. it was assumed the public outreach effort will be greater for Alternative 2 as compared with Alternative 1. (isroi)
• societal benefit of improved water quality was valued primarily in two ways. First, through a “value of water” analysis, which is difficult to assess given the way water is valued in colorado. instead, for this benefit, the team decided that improved water quality reduces o&M costs for downstream water users. An estimate was developed to account for reduced chemical and energy costs, as well as the capital costs for treatment facilities. (sroi)
• Higher water quality is expected to benefit aquatic life. For purposes of the study, increased richness and diversity of aquatic life was assumed to be an indicator of the benefit. in order to monetize the value of the benefits to aquatic life, the decision was made to rely on the District’s current and past investments in aquatic habitat improvements as a monetary value of the increased richness and diversity. (sroi)in addition to municipal water suppliers, other benefits of
improved water quality were recognized, for: • improved effluent quality may mitigate or eliminate concerns
regarding impoundments and ground water regulations (sroi)• removal of salts would help minimize plant damage issues
for agricultural users. The reduced total dissolved solids (TDs) associated with Alternative 2 would make reclaimed water more attractive to agricultural users.
• There may be benefits regarding eutrophication in gravel pits that are used to store water from the south platte river
• Due to reduced concentration of nutrients, there is a benefit to downstream irrigation districts in the form of reduced chemicals needed to control ditch weedsThe methodology for the various benefits and costs is presented
graphically in the form of a flow chart called a “structure and logic model.” such models provide a graphical illustration of how the various inputs combine to determine the benefit or cost evaluated.
They are intended to provide a transparent record of how each benefit and cost is calculated and the data assumptions used in development. Figure 2 illustrates the structure and logic diagram for Alternative 1. A similar graphical representation was developed for Alternative 2.
resultsThe following paragraphs describe the analysis results for each
alternative. As described earlier, the alternatives are compared to a baseline, which equates to secondary effluent with Tn and Tp concentrations of 12 mg-n/l and 1.0 mg-p/l, respectively.• Alternative 1. The mean expected net present value (npv) is
negative for the Froi, isroi, and sroi scenarios (-$689 Million (M), -$691M, and -$741M, respectively). The analysis accounted for the following benefits: improved public and stakeholder perception (public outreach); the downstream water quality benefits to water providers; and the environmental benefit of increased richness and diversity of aquatic life. The costs included the following: additional capital and o&M costs; reduced public and stakeholder acceptance (rate adjustments); cost of safety (handling chemicals and truck accidents); permitting/regulatory costs; and the social costs of gHgs and cAcs.
• Alternative 2. For this alternative, the mean expected npv is significantly more negative for the Froi, isroi, and sroi scenarios (-$3.1 Billion (B), -$3.1B, and -$8.0B respectively). The analysis accounted for the following benefits: the downstream water quality benefits to water providers; and the environmental benefit of increased richness and diversity of aquatic life. The costs included the following: additional capital and o&M costs; reduced public and stakeholder acceptance (rate adjustments and public outreach); cost of safety (handling chemicals and truck accidents); permitting/regulatory costs; and the social costs of gHgs and cAcs. The greater magnitude of losses in this alternative are related primarily to the additional capital and o&M costs, as well as the gHg and cAc social costs related to a significant increase in energy usage.Table 1 includes three sets of metrics. The first box provides the
mean expected Froi results, which only accounts for the traditional cash benefits. The second box provides the isroi metrics – non-cash impacts internal to the District. The third box provides the mean expected sroi results - i.e., those that correspond to the triple bottom line.
18 WATerscApes | spring 2013
[ nutrient removal ]
[ figure 1 ] srOi Framework
[ figure 2 ] FrOi, internal srOi & srOi structure and Logic Model
COstsBeneFits
Electricity Cost$/kWh
Alum Cost$/ton
Current Alum Dosemg/L
Reduced Alum Dosemg/L
Reuse Facility Water Volume
MG/year
Energy UsedMWh/year
CO2E Emissions From Operations
(Scope 1)Tons/year
CO2E Emissions From Energy Use
Tons/year
CACs Conversion Factor
Tons/MWh
Social Cost of CACs$/Ton
Social Cost of CO2E$/Ton
Discount Rate%
Reuse Plant Avoided Train
Purchase$
Likelihood of Occurrence
%
Reuse Plant O&M Costs$/year
Habitat Restoration O&M Costs
$/year
One-Time Habitat Restoration Costs
$
Downstream Water Provider
Impacts Multiplier
Net GHGs ImpactsTons/year
Net CACs ImpactsTons/year
SRoI
Net Chemical Cost Reduction (Alum)
$/year
Reuse PlantDecommission CostReduction Benefit
$/year
Electrical Use Cost Reduction
$/year
Improved Diversity/Richness
of Aquatic Life$/year
Benefits to Downstream Water
Providers$/year
Cost of Reduced Public & Stakeholder
Perception: Rate Adjustments
$/year
Incremental Cost of Capital
$
Cost of O&M$/year
Cost of Safety (Handling Chemicals)
$/year
Permitting/ Regulatory Costs
$/year
Social Cost of GHGs Production
$/year
Social Cost of CACs Production
$/year
Benefit of Improved Public &
Stakeholder Perception: Public Outreach
$/year
Nitrification Process Elimination Energy
Savings (Reuse Plant)$/kWh
15
4621 22
23
2
5
From Alt 1 isroi From Alt 1 isroi From Alt 1 Froi From Alt 1 Froi
see Alt 1 Froi
From Alt 1 Froi From Alt 1 isroi
1
16 17 18 19 20 24
25 26 27
2928
s-CurvesThe s-curve identifies the probability distributions for the Froi,
isroi and sroi for each alternative. The bold number in the middle of each s-curve is the median expected result; the output tables use the mean (average) expected result.
The purpose of an s-curve is to show the range of possibilities, expected outcomes and their probability of occurrence. The npv
calculation is derived by discounting the project’s cash flows over a 25-year period.
The s-curve highlights the risk-adjusted npv for both alternatives. The curve shows a 100 percent probability the present value of all the positive cash flows (benefits) does not exceed the present value of all the negative cash flows (capital, operating and maintenance, etc.). This means there is a 100 percent chance of having a negative npv.
FRoI(Financial return)
ISRoI(Financial & internal)
Capital Costs
employee Health
& safety
Public Health& safety Other
Operating & Maintenance
CostsPermitting risk
Management
Benefits to downstream
WaterProviders
Project’sCash
Impacts
Internal Non-Cash Benefits
External Costs & Benefits
greenHousegases
Criteria airContaminant
improveddiversity/
richness ofaquatic Life
reliability Publicacceptance Other
SRoI
19www.hdrinc.com
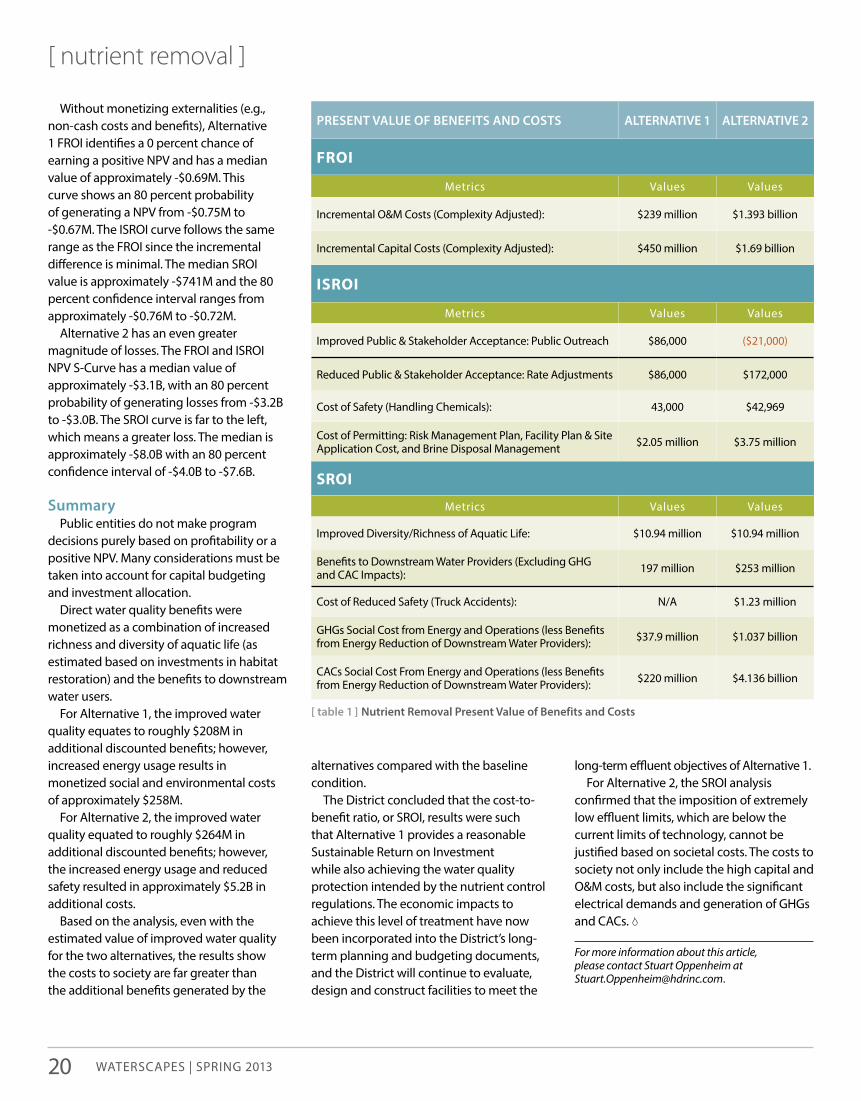
waterscapes | spring 2013
[ nutrient removal ]
Without monetizing externalities (e.g., non-cash costs and benefits), Alternative 1 Froi identifies a 0 percent chance of earning a positive npv and has a median value of approximately -$0.69M. This curve shows an 80 percent probability of generating a npv from -$0.75M to -$0.67M. The isroi curve follows the same range as the Froi since the incremental difference is minimal. The median sroi value is approximately -$741M and the 80 percent confidence interval ranges from approximately -$0.76M to -$0.72M.
Alternative 2 has an even greater magnitude of losses. The Froi and isroi npv s-curve has a median value of approximately -$3.1B, with an 80 percent probability of generating losses from -$3.2B to -$3.0B. The sroi curve is far to the left, which means a greater loss. The median is approximately -$8.0B with an 80 percent confidence interval of -$4.0B to -$7.6B.
summarypublic entities do not make program
decisions purely based on profitability or a positive npv. Many considerations must be taken into account for capital budgeting and investment allocation.
Direct water quality benefits were monetized as a combination of increased richness and diversity of aquatic life (as estimated based on investments in habitat restoration) and the benefits to downstream water users.
For Alternative 1, the improved water quality equates to roughly $208M in additional discounted benefits; however, increased energy usage results in monetized social and environmental costs of approximately $258M.
For Alternative 2, the improved water quality equated to roughly $264M in additional discounted benefits; however, the increased energy usage and reduced safety resulted in approximately $5.2B in additional costs.
Based on the analysis, even with the estimated value of improved water quality for the two alternatives, the results show the costs to society are far greater than the additional benefits generated by the
alternatives compared with the baseline condition.
The District concluded that the cost-to-benefit ratio, or sroi, results were such that Alternative 1 provides a reasonable sustainable return on investment while also achieving the water quality protection intended by the nutrient control regulations. The economic impacts to achieve this level of treatment have now been incorporated into the District’s long-term planning and budgeting documents, and the District will continue to evaluate, design and construct facilities to meet the
long-term effluent objectives of Alternative 1.For Alternative 2, the sroi analysis
confirmed that the imposition of extremely low effluent limits, which are below the current limits of technology, cannot be justified based on societal costs. The costs to society not only include the high capital and o&M costs, but also include the significant electrical demands and generation of gHgs and cAcs.
For more information about this article, please contact Stuart Oppenheim at [email protected] .
Present vaLue OF BeneFits and COsts aLternative 1 aLternative 2
FRoI
Metrics values values
incremental o&M costs (complexity Adjusted): $239 million $1.393 billion
incremental capital costs (complexity Adjusted): $450 million $1.69 billion
ISRoI
Metrics values values
improved public & stakeholder Acceptance: public outreach $86,000 ($21,000)
reduced public & stakeholder Acceptance: rate Adjustments $86,000 $172,000
cost of safety (Handling chemicals): 43,000 $42,969
cost of permitting: risk Management plan, Facility plan & site Application cost, and Brine Disposal Management $2.05 million $3.75 million
SRoI
Metrics values values
improved Diversity/richness of Aquatic life: $10.94 million $10.94 million
Benefits to Downstream Water providers (excluding gHg and cAc impacts): 197 million $253 million
cost of reduced safety (Truck Accidents): n/A $1.23 million
gHgs social cost from energy and operations (less Benefits from energy reduction of Downstream Water providers): $37.9 million $1.037 billion
cAcs social cost From energy and operations (less Benefits from energy reduction of Downstream Water providers): $220 million $4.136 billion
[ table 1 ] nutrient removal Present value of Benefits and Costs
20
[ nutrient criteria ]
(continued from page 15)
(continued on back cover)
geometric means for each stream and in turn for the sample set of streams, and set the criteria at the 90th percentile. The Administrator apparently concluded only that an increase above this level ordinarily causes a change in flora and fauna — not that it causes a harmful change. if there is a basis in sound science for disapproving a nutrient increase that causes any increase in flora and fauna, not just a harmful increase, the Administrator did not cite it. And even if the Administrator’s conclusion was that an increase in nutrients to a level above the 90th percentile ordinarily causes a harmful change in flora and fauna, the Administrator again did not cite a sound science basis for the conclusion. Without a further explanation, the stream criteria are arbitrary or capricious.”
ePa’s 2012 approval of Florida nutrient Criteriaon nov. 30, 2012, the epA approved Florida’s numeric nutrient
criteria for rivers, streams, lakes and estuaries from Tampa Bay to Biscayne Bay, including the Florida Keys. At the same time, epA proposed draft federal criteria as required for compliance with the federal consent decree for the waters not yet covered by state rules, including remaining estuaries, ocean waters, and where south Florida canals enter estuaries.
ePa’s 2012 Proposed rules for estuaries and Marine Waters
on Dec. 18, 2012, the epA published in the federal register proposed rules for “Water Quality standards for the state of Florida’s estuaries, coastal Waters, and south Florida inland Flowing Waters; Water Quality standards for the state of Florida’s streams and Downstream protection values for lakes.” epA must complete final rulemaking before sept. 30, 2013, to satisfy previous consent decrees.
epA conducted a detailed scientific analysis of water quality data to develop proposed numeric nutrient criteria for Florida’s estuaries, coastal waters, and south Florida inland flowing waters. epA’s approach used biological endpoints and multiple lines of evidence, including stressor-response analyses and mechanistic modeling, to derive numeric nutrient criteria for nitrogen, phosphorus, and chlorophyll a for estuaries.
epA’s numeric criteria for Florida’s estuaries are summarized in the ranges below over all geographic areas:• range of Total nitrogen (Tn) criteria: 0.14 to 1.63 mg/l• ranged of Total phosphorus (Tp) criteria: 0.008 to 0.440 mg/l• range of chlorophyll-a criteria: 0.7 to 11.9 μg/l• For a given water body, the annual geometric mean of Tn, Tp,
or chlorophyll a, concentrations shall not exceed the applicable criterion concentration more than once in a three-year periodFor the Florida gulf coast, epA is proposing to use a reference
condition-based approach with chlorophyll a criteria based on satellite remote sensing imagery that has been calibrated to field monitoring data. epA’s numeric criteria for Florida’s coastal waters, including the panhandle, West Florida shelf, and Atlantic coast are
summarized as follows:• range of chlorophyllrs-a criteria: 0.02 to 5.70 mg/m3
– chlorophyllrs-a is remotely sensed calculation of chlorophyll a concentrations
• For a given water body, the annual geometric mean of the chlorophyll-a concentration shall not exceed the applicable criterion concentration more than once in a three-year periodTo protect downstream estuaries, epA examined a variety of
modeling techniques and data to propose an approach to derive nitrogen and phosphorus criteria expressed as downstream protection values (Dpvs) at the points where inland flowing waters flow into estuaries, or marine waters in south Florida (referred to as ‘pour points’).
ePa addresses remanded Provisionsin the Dec. 18, 2012, Federal register, epA provided a further
explanation of proposed stream criteria and downstream protection values to address the two portions of proposed numeric nutrient criteria that were remanded from U.s. District court for the northern District of Florida in the consolidated case ruling.
epA re-proposed the same numeric nutrient criteria for nitrogen and phosphorus for streams with further explanation of how the proposed numeric criteria will ensure protection of beneficial uses. epA also proposed default approaches available for use when modeling cannot be performed to derive downstream protection values to ensure protection of both impaired and unimpaired lakes.
There are a number of conditions under which epA could withdraw federal standards if Florida proceeds with final rulemaking for state standards in accordance with Florida’s “implementation document” to support nutrient standards. epA is also subject to the agreement by the U.s. District court to modify previous consent decrees.
an agreement announced in the new YearThe beginning of 2013 brought a continuation of the debate
over Florida nutrient criteria. on Jan. 4, 2013, epA filed a motion requesting an administrative stay until nov. 15, 2013, for portions of epA’s “Water Quality standards for the state of Florida’s lakes and Flowing Waters,” in the rule originally signed by epA Administrator lisa Jackson on nov. 14, 2010.
conservationists (Florida Wildlife Federation, inc., sierra club, inc., st. Johns riverkeeper, inc., conservancy of southwest Florida, inc., and environmental confederation of southwest Florida, inc.) took exception and filed a motion on Jan. 14, 2013, in opposition to epA’s motion for a stay of the effective date of epA’s nutrient criteria for Florida.
However, perhaps the most significant new development in Florida is the March 15, 2013, announcement of an agreement in principle between epA and the state on an implementation plan reached four days earlier for numeric nutrient criteria to be adopted by reference by the Florida legislature by Dec. 1, 2014, and accompanied by epA rescinding federal criteria for Florida.
www.hdrinc.com
[ nutrient criteria ]
3428
041
3
(continued from inside back cover)
implementation Plan for Florida’s nutrient standards Florida has published a March 2013 document to support
implementation of the state’s nutrient standards that uses a hierarchical approach to interpret the narrative nutrient criterion (nnc) on a site-specific basis. The hierarchical approach provides a way to numerically interpret the state’s narrative nutrient criterion by first using a site-specific numeric endpoint developed through one of the following methods when they are available:• nutrient Total Maximum Daily load (TMDl)• site specific Alternative criteria (ssAc)• Water Quality Based effluent limitation (WQBel)
if a site-specific numeric endpoint is not available from one of these methods, then stressor-response relationships are next in the hierarchy. stressor-response relationships have been found for Florida lakes and springs, but have not been well established for Florida streams.
For streams, the narrative nutrient criteria continue to apply and must be interpreted by a weight-of-evidence approach that uses reference stream-based thresholds combined with biological data (flora and fauna). Florida published a 2011 guideline titled “sampling and Use of the stream condition index (sci) for Assessing Flowing Waters: A primer” that includes consideration of how to address scenarios where the nitrogen and phosphorus concentration thresholds are exceeded, but because the floral and faunal measures are met, the streams are found to be healthy and well balanced.
Weight-of-evidence approach for stream CriteriaThe Florida weight-of-evidence approach requires a substantial
amount of water quality data and development of assessment indices to determine whether or not a stream complies with nutrient criteria. Water quality data includes nitrogen, phosphorus, chlorophyll a, and ancillary parameters such as color, turbidity, Do, pH, conductivity, and temperature, nitrate, etc. This must be combined with a minimum of two samples of each of the following floral and faunal assessments:• rapid periphyton survey (rps)
– Tool to quantify abundance of nuisance algal growth• linear vegetation survey (lvs)
– Tool for evaluating stream condition based on vascular plants• Habitat Assessment (HA)
– Key physical data to determine whether biological community health is impaired due to habitat disturbance or water quality degradation
• stream condition index (sci) – Biological assessment based on benthic macroinvertebrates
The water chemistry data and biological indices are used together as the multiple lines of evidence to decide whether a stream is healthy and within acceptable levels of nutrients. Florida has produced a decision matrix for assessment of streams that links nitrogen and phosphorus concentrations with a combination of the floral measures and stream condition index (fauna) to determine attainment with standards.
surface Water discharge PermitsFlorida’s permitting process places the burden for providing
reasonable assurance that a discharge will not cause or contribute to a violation of the narrative nutrient criteria on the applicant. Water quality based effluent limits (WQBels) are to be based on worst case conditions with permitted flows from a discharger and the potential impact on downstream waters must be assessed, regardless of the distance downstream. new or expanded discharges are subject to an anti-degradation review.
The hierarchical approach in Florida requires that a site-specific interpretation (TMDl, ssAc) be used as the basis for water quality based effluent limits, if available. if there is not a site-specific interpretation available, a quantifiable stressor-response relationship may be used; however, these relationships have only been developed for lakes and spring vents, not streams.
streams with balanced flora and fauna are deemed to be in compliance and WQBels may be established based on permitted loadings, providing they are not expanding beyond current levels. if there is a lack of information about stream health, an applicant may collect additional biological data to support an assessment.
if there is an imbalance of flora or fauna, then a water body does not meet the narrative nutrient criteria. When a stream is verified as impaired for nutrients, a TMDl is required to develop a site-specific interpretation of the narrative nutrient standards and provide a wasteload allocation as the basis for WQBels.
For more information about this article, please contact Dave Clark at [email protected] .
PRSRT STDUS POSTAGE
PAIDOMAHA, NE
PERMIT NO. 9638404 Indian Hills Drive | Omaha, NE 68114-4049www.hdrinc.com