Embed Size (px)
Citation preview

Who areYou going to Call?
NorwoodDepartment of
Public Service
2009 SafeDrinking
Water Report
WNorwood purchases the water you drink fromCincinnati Water Works (CWW), which isfamous for its excellent drinking water. TheirGranular Activated Carbon process is consideredthe best way to remove natural and man-madeorganic materials that can affect human health.
In order to make sure all of their treatmentprocesses work, CWW tests the water an averageof 300 times each day. They also have monitorsthroughout the system that test the water contin-uously. Alarms on these monitors make it easy forthem to respond quickly to potential problems.
As additional water quality safeguards, NorwoodHealth Department tests the water CWW provides to us 365 days a year for chlorine resid-ual. We also monitor the water each month forbacteria, and yearly for lead and copper. TheOhio Environmental Protection Agency (EPA)reviews CWW’s and Norwood’s compliance testing results annually.
NorwoodDepartment of
Public Service
2009 SafeDrinking
Water Report
I-71
I-75
I-275
I-74
Richard Miller Treatment PlantSource Water: Ohio River Surface Water
Ohio
Rive
r
City of Cincinnati City of Cincinnati
Norwood Norwood
Thenewsis Good
Thenewsis GoodWhereyourWater
comes fromWhereyourWater
comes fromNorwood drinking water comes from the Miller Treatment Plant located in thesoutheastern Cincinnati neighborhood ofCalifornia, Ohio. Miller treats “surface”water pumped from the Ohio River.
The Treatment Process at the Miller Plant on the Ohio River
settling aids added
pumps
presettling removes most solids further settling
occurs inreservoir
final settling occurs, water preparedfor final treatment
sand and gravelfilter water
intake
pH adjusted
granular activated carbon removesorganics
reservoir
todistributionsystem
furnace cleanscarbonfor reuse
pH adjusted again, chlorine and fluoride added
While CWW provides us with treatedwater, the City of Norwood is responsible
for distributing it, metering it, and billing for thewater service.
As such, we make our own repairs to theNorwood distribution system. Norwood HealthDepartment works closely with the Public Works Department during water main breaks to maintain high water quality while repairs are being made.
City of Norwood personnel are on the job at all times to bring you the cleanest, safest wateravailable. You are welcome to attend public watermeetings held the first Monday of February, May,August, and November from 5-6 pm in the officeof Safety-Service Director.
Who areYou going to Call?• If you have a water break, call the Department
of Public Works at 458-4615.
• If you have a water quality question, call theDepartment of Health at 458-4600.
• If you want to establish water service, or have a billing question, call the Water Departmentat 458-4518.
Thank you for reading this report, which wasprepared to meet the EPA’s National PrimaryDrinking Water Regulation for ConsumerConfidence Reports and sent to all Norwoodwater service customers.
Department of Public ServiceNorwood City Hall
4645 Montgomery RoadNorwood, OH 45212
(513) 458-4503
Whether Norwood drinking water tastes gooddepends on who you ask. Because CWW usescarbon filtration, they don’t need to add as much chlorine as many utilities do, so Norwoodwater has less of a “chemical” taste than water inmany cities.
If you feel your water has a chemical or chlorinetaste, try leaving an open pitcher of it in yourrefrigerator overnight. The chlorine will bereduced by morning and the taste will improve.
While some people like the taste of bottled or home-treated water, these are not necessarilysafer than tap water. The safety of any waterdepends on its source and treatment. For moreinformation about bottled water and home treatment devices, contact the Food and DrugAdministration (FDA) at 1-800-332-4010.
AbouttheTaste AbouttheTaste
City of N
orwood
Office of S
afety-Service D
irector4645 M
ontgomery R
oadN
orwood, O
hio 45212
PR
E-S
OR
TE
DS
TAN
DA
RD
U.S
. PO
STA
GE
PAID
CIN
CIN
NA
TI, O
HP
ER
MIT
NO
. 8259
Important facts about the safety of your water:
• How it compares to national standards
• What’s in it
• Where it comes from
• How it’s treated and tested
CON1783 Norwood CR 10 5/6/10 10:04 AM Page 1
Regulated Contaminants subject to an MCL, Action Level (AL) or Treatment Technique (TT)**Miller Water
Contaminant (units) MCLG MCL Highest level used Range of Typical source of contaminant< 5% of to determine detections
Total Coliform Bacteria 0 monthly samples compliance Naturally present in the environment d
Fluoride (ppm) 4 4 0.96 0.84-1.08 Erosion of natural deposits, additive to protect teeth
Nitrate (ppm) 10 10 1.03 0.50-1.03 Runoff from fertilizer use, leaching from septic tanks, sewage, erosion of natural deposits
Turbidity (NTU) na TT<1 NTU Max & 0.10 a Soil runoff
TT2=<0.3 NTU 95% of the time(MCL) 100% < 0.3 NTU 0.05-0.11
Lead (ug/L) 0 AL = 15.5 ug/L 90th percentile < 5-22.7 ug/L (0 Corrosion of household plumbing, erosion of < 5 ug/L out of 30 samples natural depositsb
tested were>AL)
Copper (ug/L) 1350 ug/L AL = 1350 ug/L 90th percentile < 50-< 50 ug/L (0 Corrosion of household plumbing, erosion of 18.5 ug/L out of 30 samples natural deposits
tested were>AL)
Haloacetic Acids (ppb) na 60 8.42 < 6.00-8.42 By product of drinking water chlorination
Total Organic Carbon na TTe 2.34 1.75-3.04 Naturally present in the environment
Total Chlorine (ppm) 4 4 1.45 0.40-1.45 Disinfectant
Barium (ppm) 2 2 0.0359 na Erosion of natural deposits. Discharge of drilling waste.Discharge from metal refineries.
Organic ContaminantsTotal Trihalomethanes (ppb) na 80 60.7 31.2-60.7 Byproduct of drinking water chlorination
Radioactive ContaminantsGross Beta (pCi/L) 0 50c 24 nd-24 Decay of natural and man-made deposits
Unregulated Contaminants for which EPA requires monitoringContaminant (units) MCLG MCL Average Level Range of Typical Source of Contaminant
Detected Detectionse
Chloroform (ppb) na na 3.95 na Byproduct of drinking water chlorination
Bromodichloromethane (ppb) nd na 4.66 na Byproduct of drinking water chlorination
Dibromochloromethane (ppb) 60 na 4.4 na Byproduct of drinking water chlorination
Bromoform (ppb) 0 na 0.57 na Byproduct of drinking water chlorination
Free Chlorine (ppm) nr nr 0.84 0.36-1.16 Disinfectant
Sulfate (ppm) na na 79 57-119 Byproduct of drinking water chlorination
a The EPA has two requirements: 1) That the maximum level found must be less than 5 NTU; and 2) That the level must be under 0.5 NTU 95% of the time.We met both requirements.b Although there is no detectable lead in our drinking water as it leaves the treatment plants, by the time it reaches your tap, lead levels may vary.c EPA considers 50 pCi/L to be the level of concern for beta particles.d Coliforms are used as indicator that other potentially - harmful bactreria may be present. In 2009, no samples were positive for coliform bacteria.e The value in “Highest level used to determine complience” for Total Organic Carbon (TOC) is the lowest ratio between percentage of TOC actually removed to the percentage of TOC required
to be removed.A value of greater than 1 indicates the water system is in compliance with TOC removal requirements; a value less than 1 indicates a violation of TOC removal requirements.
Water Quality Data **DefinitionsMaximum Contaminant Level Goal orMCLG: The level of a contaminant in drinking water below which there is noknown or expected risk to health. MCLGsallow for a margin of safety.
Maximum Contaminant Level or MCL: Thehighest level of a contaminant that is allowedin drinking water. MCLs are set as close to theMCLGs as feasible using the best available treatment technology.
Action Level or AL: The concentration of a contaminant, which, if exceeded, triggerstreatment or other requirements which awater system must follow.
Treatment Technique or TT: A requiredprocess intended to reduce the level of a contaminant in drinking water.
The < symbol: A symbol which means lessthan. A result of <5 means that the lowestlevel that could be detected was 5 and thecontaminant in that sample was not detected.
Abbreviationsppb: parts per billion or micrograms per liter ppm: parts per million or milligrams per liter na: not applicable NTU: Nephelometric Turbidity Unit, used to measure cloudiness in drinking water nd: not detectable at testing limits nr: not regulated pCi/L: picoCuries per liter, a measure ofradioactivity in waterug/L: micrograms per liter
Total Coliform BacteriaThe Norwood Water System did not incur
any violations in 2009 for bacteria indrinking water. We continue to monitor forthe presence of bacteria on a weekly basis.
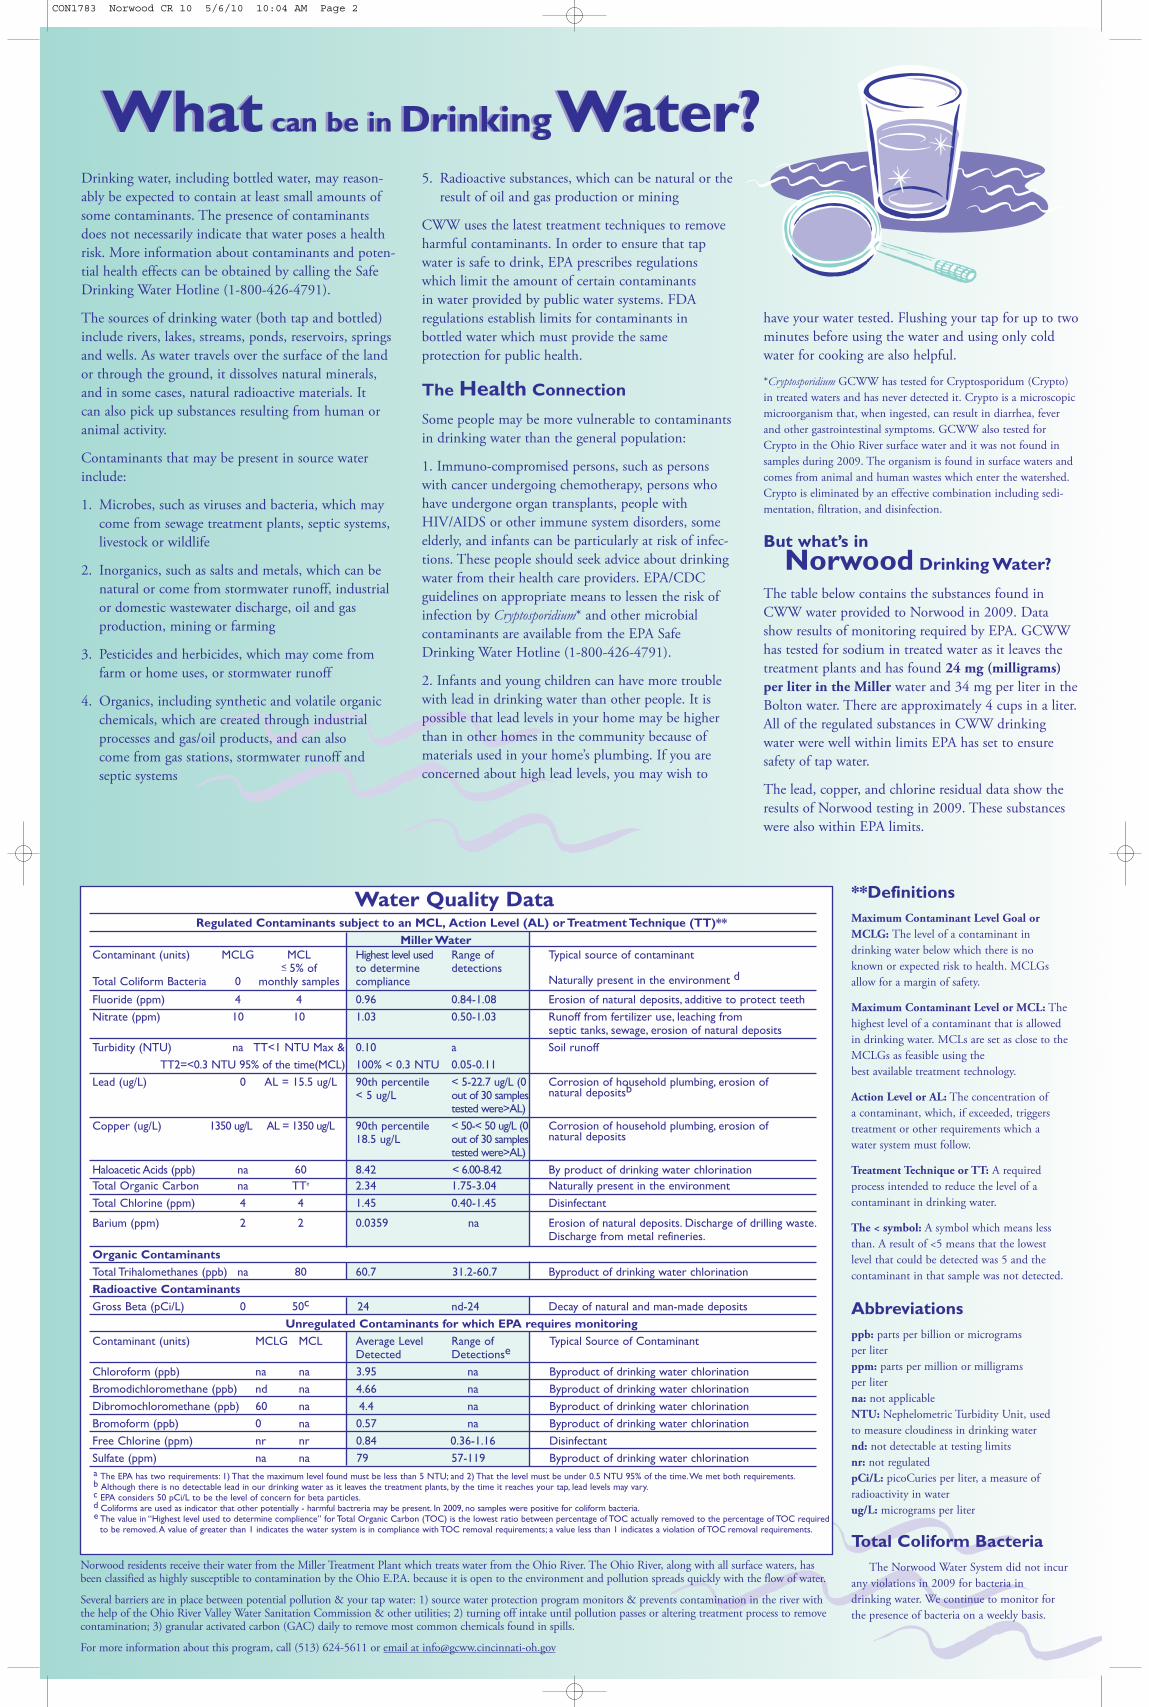
What can be in DrinkingWater? What can be in DrinkingWater?Drinking water, including bottled water, may reason-ably be expected to contain at least small amounts ofsome contaminants. The presence of contaminantsdoes not necessarily indicate that water poses a healthrisk. More information about contaminants and poten-tial health effects can be obtained by calling the SafeDrinking Water Hotline (1-800-426-4791).
The sources of drinking water (both tap and bottled)include rivers, lakes, streams, ponds, reservoirs, springsand wells. As water travels over the surface of the landor through the ground, it dissolves natural minerals,and in some cases, natural radioactive materials. It can also pick up substances resulting from human or animal activity.
Contaminants that may be present in source waterinclude:
1. Microbes, such as viruses and bacteria, which maycome from sewage treatment plants, septic systems,livestock or wildlife
2. Inorganics, such as salts and metals, which can benatural or come from stormwater runoff, industrialor domestic wastewater discharge, oil and gas production, mining or farming
3. Pesticides and herbicides, which may come fromfarm or home uses, or stormwater runoff
4. Organics, including synthetic and volatile organicchemicals, which are created through industrialprocesses and gas/oil products, and can also come from gas stations, stormwater runoff and septic systems
5. Radioactive substances, which can be natural or theresult of oil and gas production or mining
CWW uses the latest treatment techniques to removeharmful contaminants. In order to ensure that tapwater is safe to drink, EPA prescribes regulations which limit the amount of certain contaminants in water provided by public water systems. FDA regulations establish limits for contaminants in bottled water which must provide the same protection for public health.
The Health Connection
Some people may be more vulnerable to contaminantsin drinking water than the general population:
1. Immuno-compromised persons, such as personswith cancer undergoing chemotherapy, persons whohave undergone organ transplants, people withHIV/AIDS or other immune system disorders, someelderly, and infants can be particularly at risk of infec-tions. These people should seek advice about drinkingwater from their health care providers. EPA/CDCguidelines on appropriate means to lessen the risk ofinfection by Cryptosporidium* and other microbial contaminants are available from the EPA SafeDrinking Water Hotline (1-800-426-4791).
2. Infants and young children can have more troublewith lead in drinking water than other people. It ispossible that lead levels in your home may be higherthan in other homes in the community because ofmaterials used in your home’s plumbing. If you areconcerned about high lead levels, you may wish to
have your water tested. Flushing your tap for up to twominutes before using the water and using only coldwater for cooking are also helpful.
*Cryptosporidium GCWW has tested for Cryptosporidum (Crypto)in treated waters and has never detected it. Crypto is a microscopicmicroorganism that, when ingested, can result in diarrhea, feverand other gastrointestinal symptoms. GCWW also tested forCrypto in the Ohio River surface water and it was not found insamples during 2009. The organism is found in surface waters andcomes from animal and human wastes which enter the watershed.Crypto is eliminated by an effective combination including sedi-mentation, filtration, and disinfection.
But what’s in Norwood Drinking Water?
The table below contains the substances found inCWW water provided to Norwood in 2009. Datashow results of monitoring required by EPA. GCWWhas tested for sodium in treated water as it leaves thetreatment plants and has found 24 mg (milligrams)per liter in the Miller water and 34 mg per liter in theBolton water. There are approximately 4 cups in a liter.All of the regulated substances in CWW drinkingwater were well within limits EPA has set to ensuresafety of tap water.
The lead, copper, and chlorine residual data show theresults of Norwood testing in 2009. These substanceswere also within EPA limits.
Norwood residents receive their water from the Miller Treatment Plant which treats water from the Ohio River. The Ohio River, along with all surface waters, hasbeen classified as highly susceptible to contamination by the Ohio E.P.A. because it is open to the environment and pollution spreads quickly with the flow of water.
Several barriers are in place between potential pollution & your tap water: 1) source water protection program monitors & prevents contamination in the river withthe help of the Ohio River Valley Water Sanitation Commission & other utilities; 2) turning off intake until pollution passes or altering treatment process to removecontamination; 3) granular activated carbon (GAC) daily to remove most common chemicals found in spills.
For more information about this program, call (513) 624-5611 or email at [email protected]
CON1783 Norwood CR 10 5/6/10 10:04 AM Page 2