Embed Size (px)
Citation preview
WaterWater
What is it good for…What is it good for…
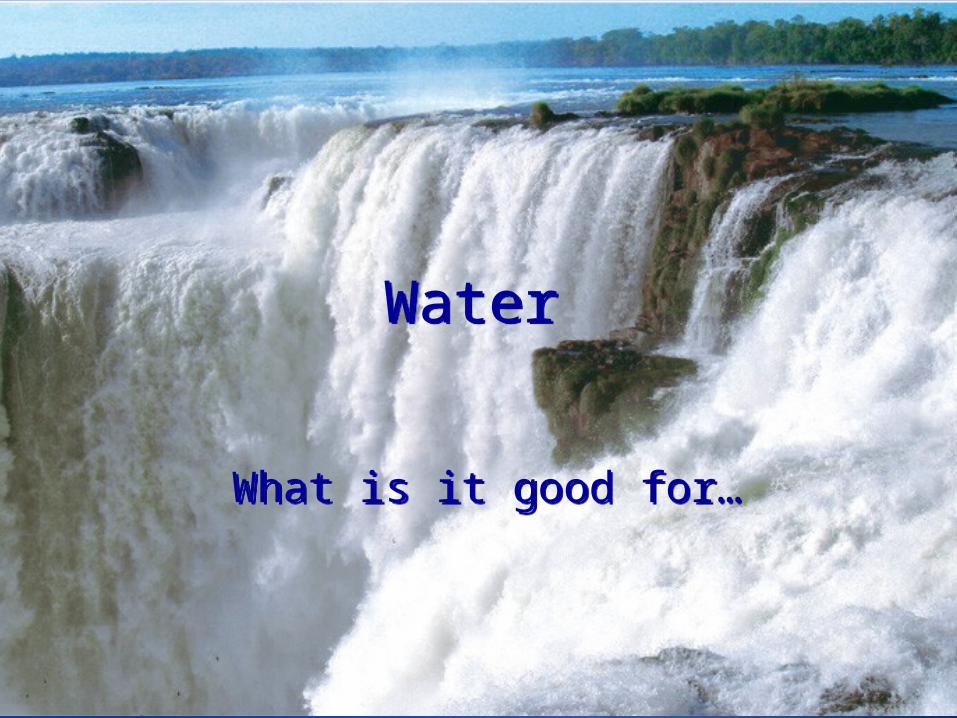
1.2 Billion liters clean drinking waterclean drinking water a day (320 Million gallons)
1.8 Trillion liters agricultural / agricultural / industrial waterindustrial water a day
That's 6000 liters/day (1600 gallons) per person in N.A.For comparison:
World average 1800 liters/dayChina about 1100 liters/day
We use about 400 liters/day for personal use
vs. World average 90 liters/day
Use doubled in US from 1955-1985 (with population growth)
North America Uses...North America Uses...North America Uses...North America Uses...
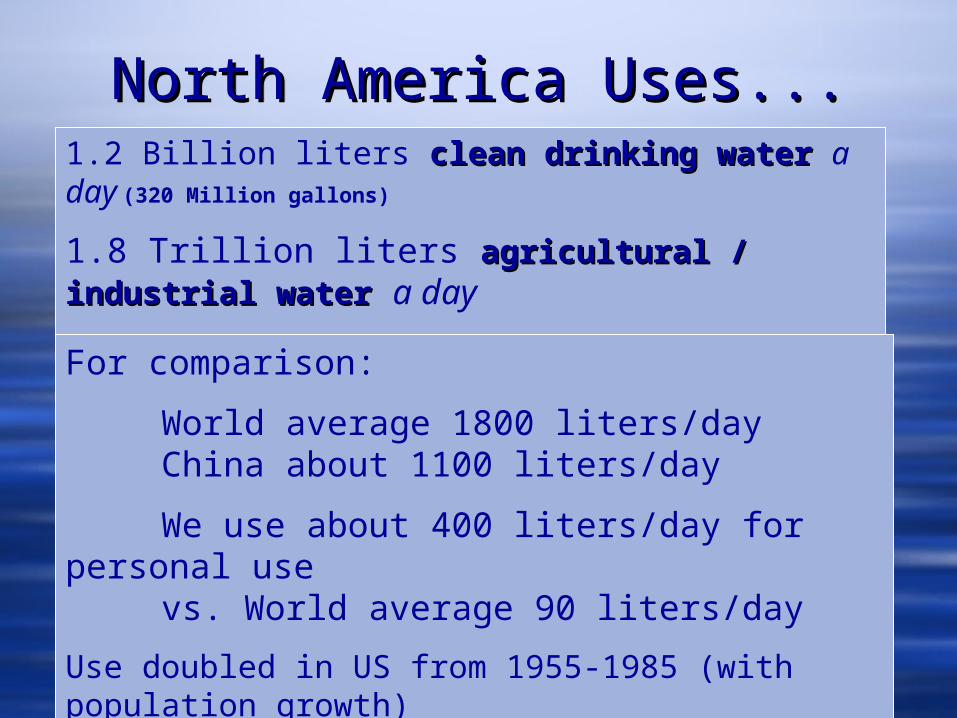
This water needs to be present and clean
Therefore we need to measurewater quantity and water quality
in order to understand where problems lie
Water can be “renewable” if Use < Recharge
Water can be “renewable” if Pollution < Cleanup
Water for Human UseWater for Human Use
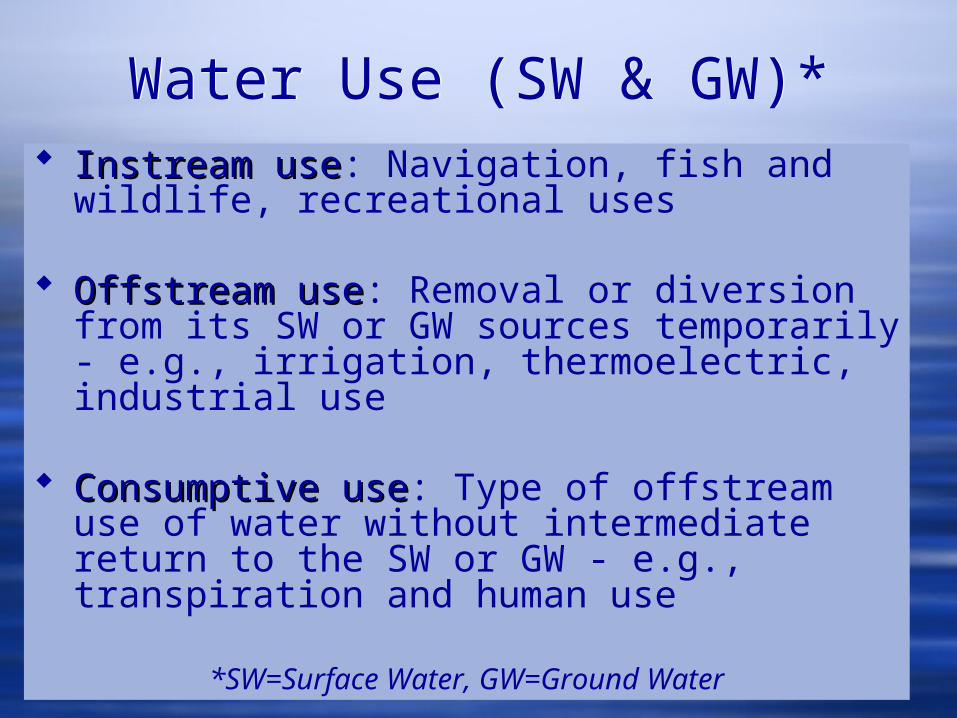
Instream useInstream use: Navigation, fish and wildlife, recreational uses
Offstream useOffstream use: Removal or diversion from its SW or GW sources temporarily - e.g., irrigation, thermoelectric, industrial use
Consumptive useConsumptive use: Type of offstream use of water without intermediate return to the SW or GW - e.g., transpiration and human use
*SW=Surface Water, GW=Ground Water
Water Use (SW & GW)*Water Use (SW & GW)*
Problems Arise From…Problems Arise From…
Not Enough Water Too Much Water Degraded (Polluted) Water
Not Enough Water Too Much Water Degraded (Polluted) Water
Water UseWater Use
QuickTime™ and aTIFF (Uncompressed) decompressor
are needed to see this picture.
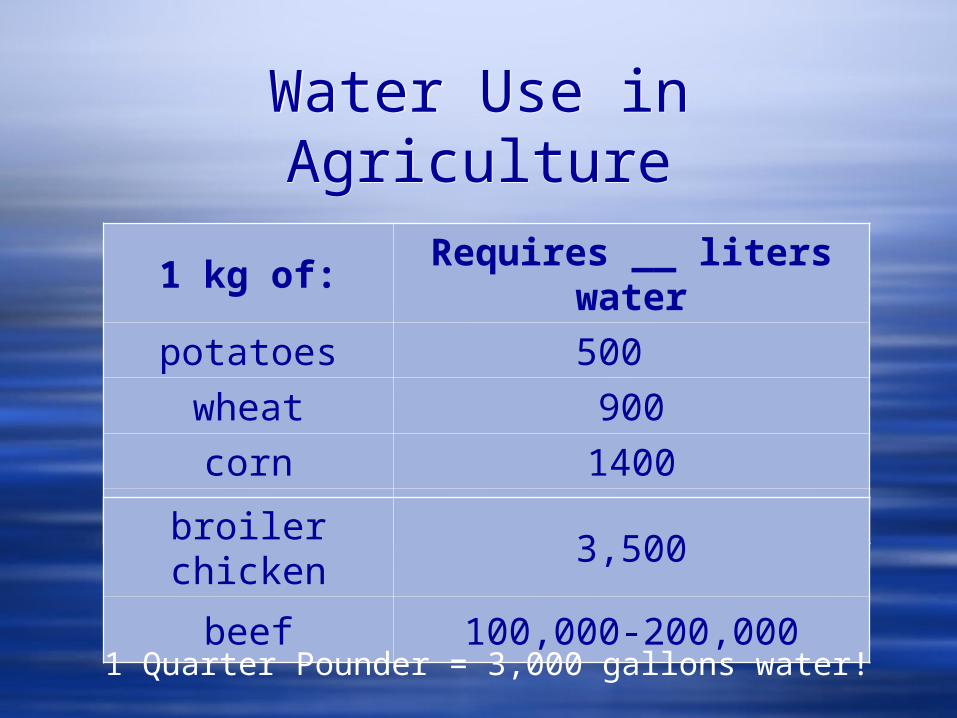
Water Use in AgricultureWater Use in Agriculture
1 kg of:Requires __ liters
water
potatoes 500
wheat 900
corn 1400
rice 1900broiler chicken
3,500
beef 100,000-200,0001 Quarter Pounder = 3,000 gallons water!
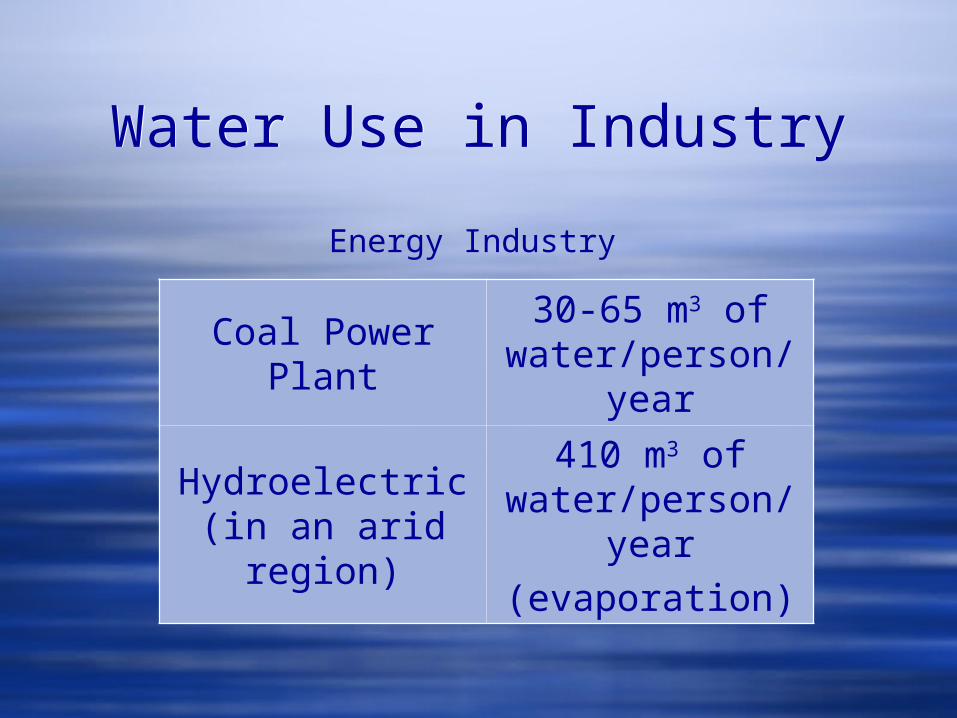
Water Use in IndustryWater Use in Industry
Energy Industry
Coal Power Plant
30-65 m3 of water/person/
year
Hydroelectric (in an arid region)
410 m3 of water/person/
year(evaporation)
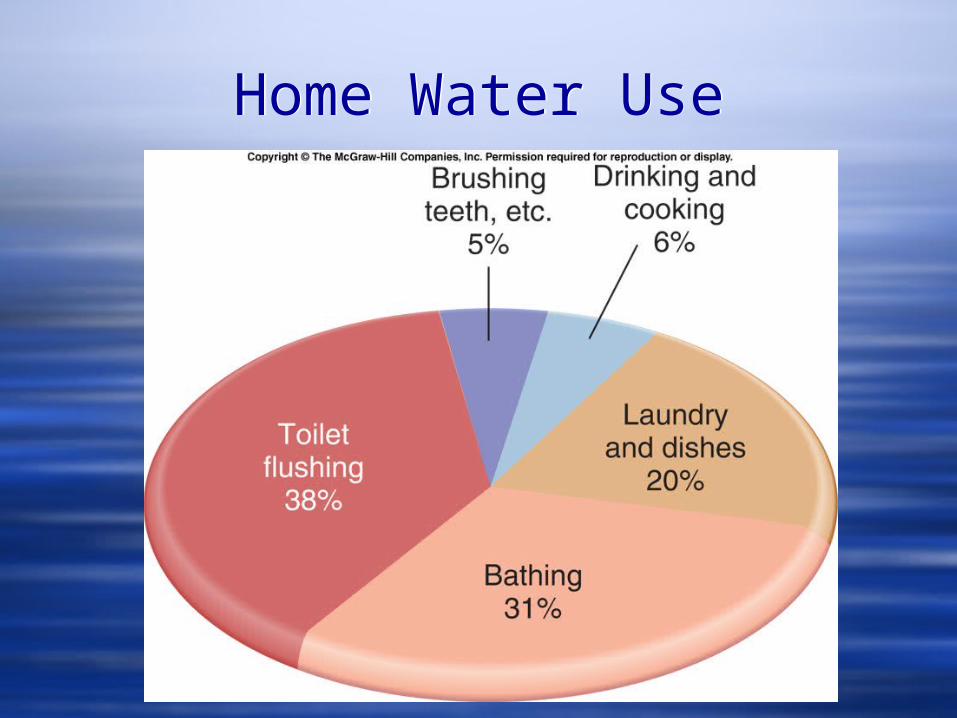
Home Water UseHome Water Use
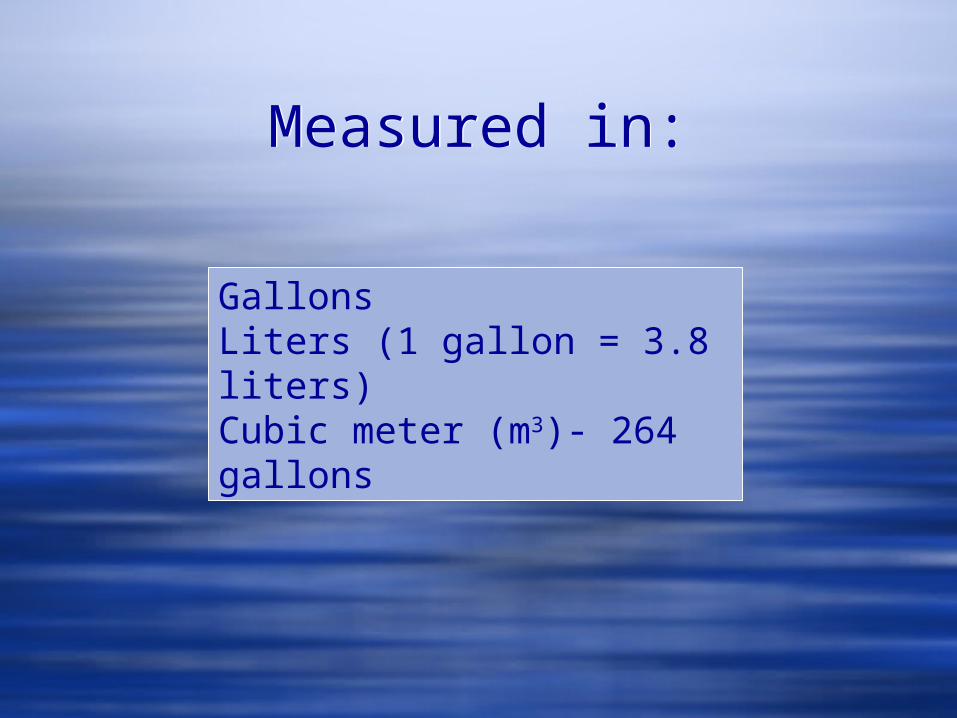
Measured in:Measured in:
GallonsLiters (1 gallon = 3.8 liters)Cubic meter (m3)- 264 gallons
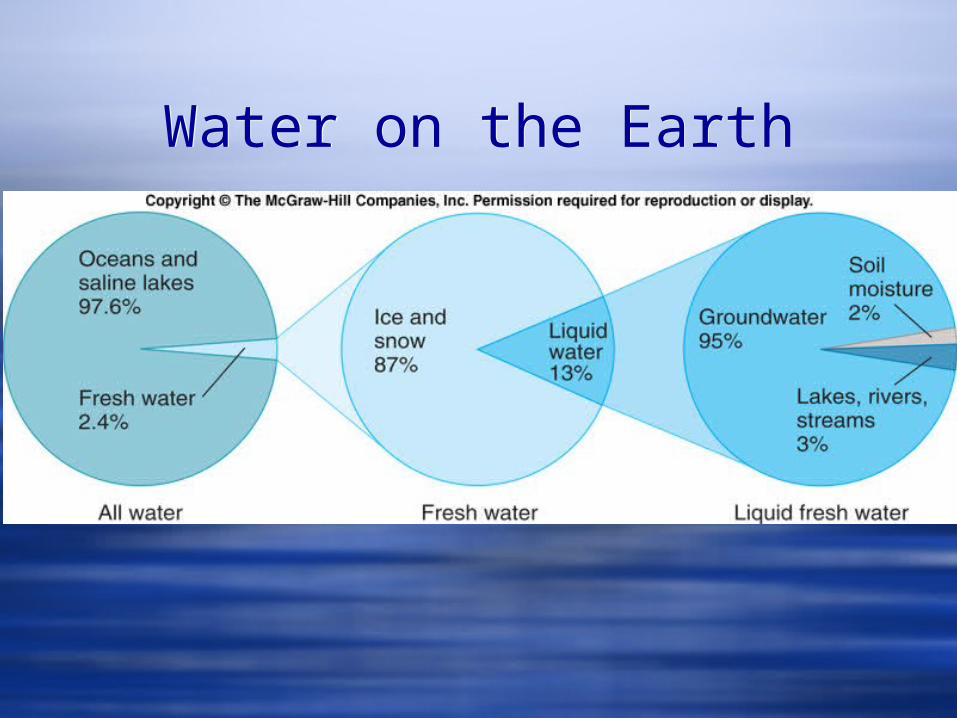
Water on the EarthWater on the Earth
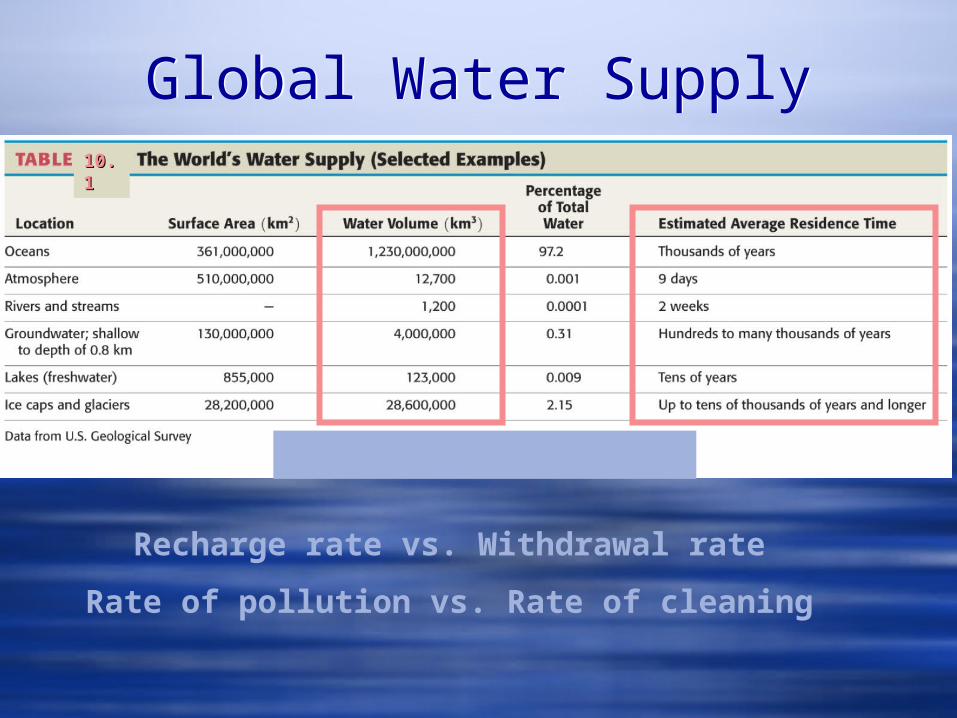
10.10.11
Recharge rate vs. Withdrawal rate
Rate of pollution vs. Rate of cleaning
Global Water SupplyGlobal Water Supply
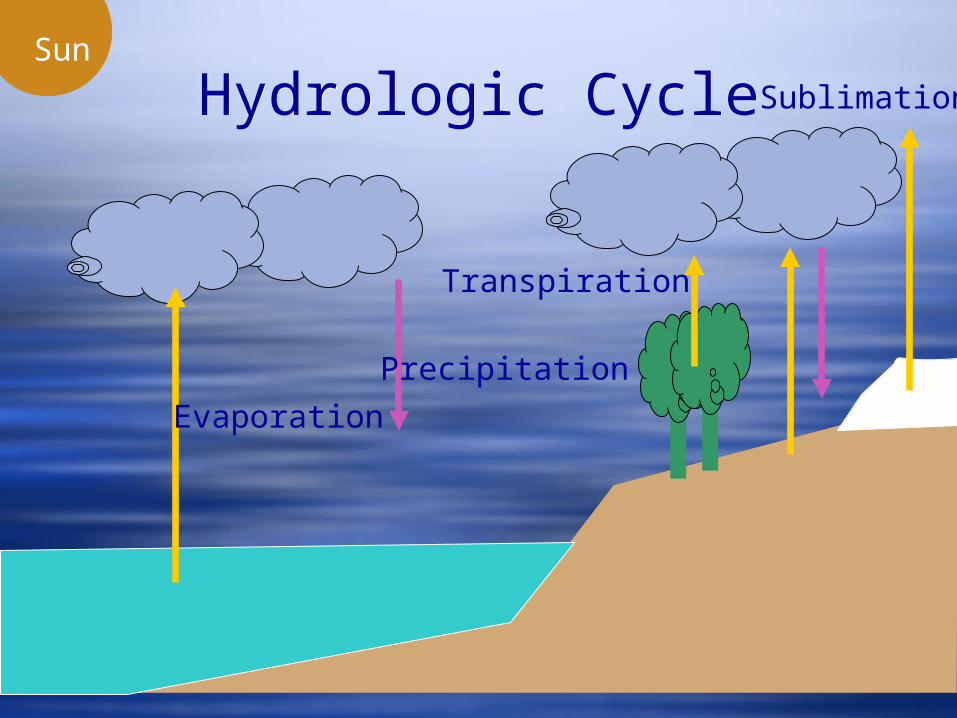
Hydrologic CycleHydrologic CycleSun
Evaporation
Sublimation
Transpiration
Precipitation
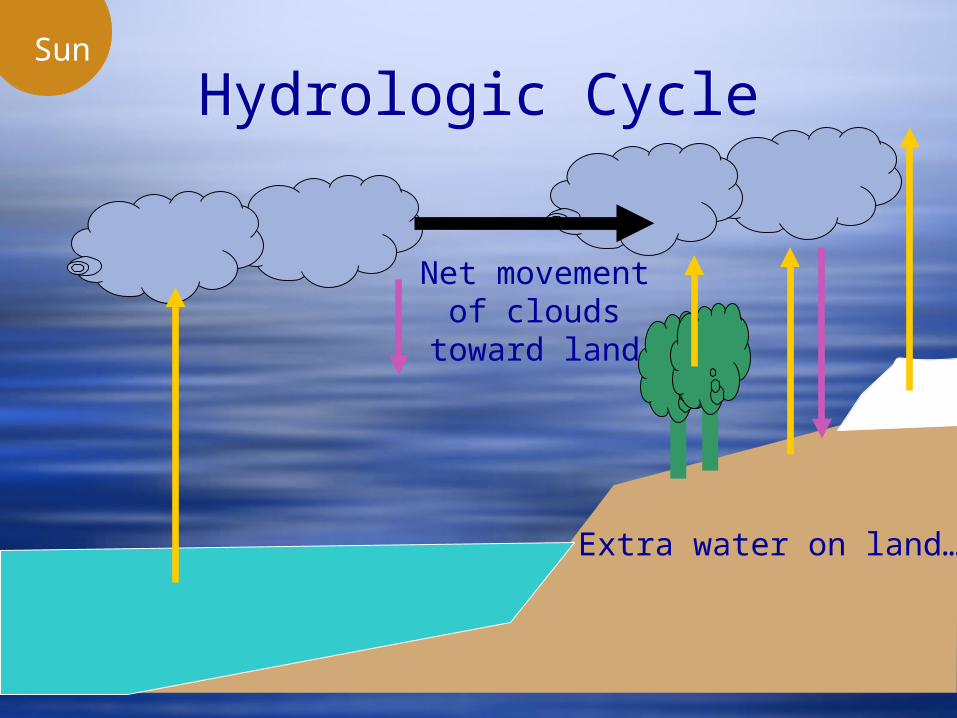
Hydrologic CycleHydrologic CycleSun
Net movement of clouds toward
land
Extra water on land…
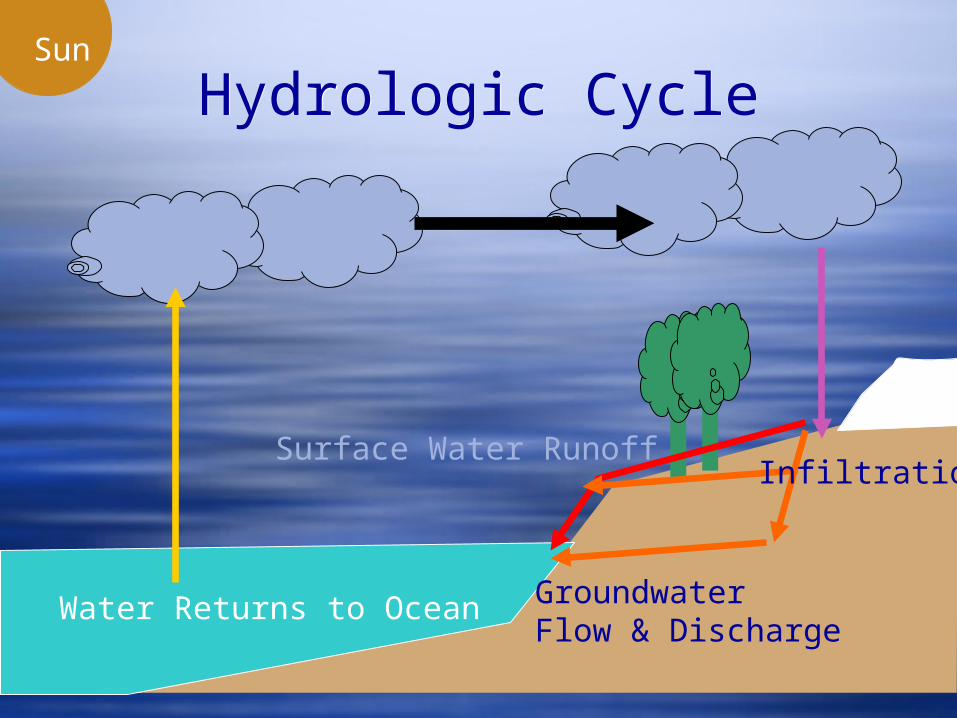
Hydrologic CycleHydrologic CycleSun
Surface Water Runoff
GroundwaterFlow & Discharge
Infiltration
Water Returns to Ocean
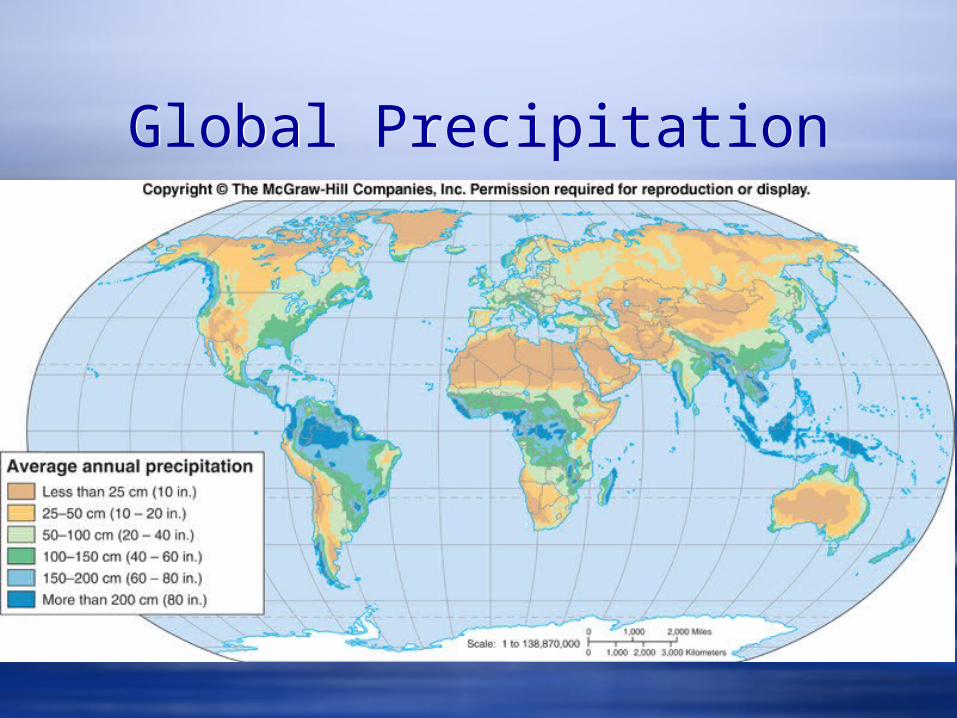
Global PrecipitationGlobal Precipitation
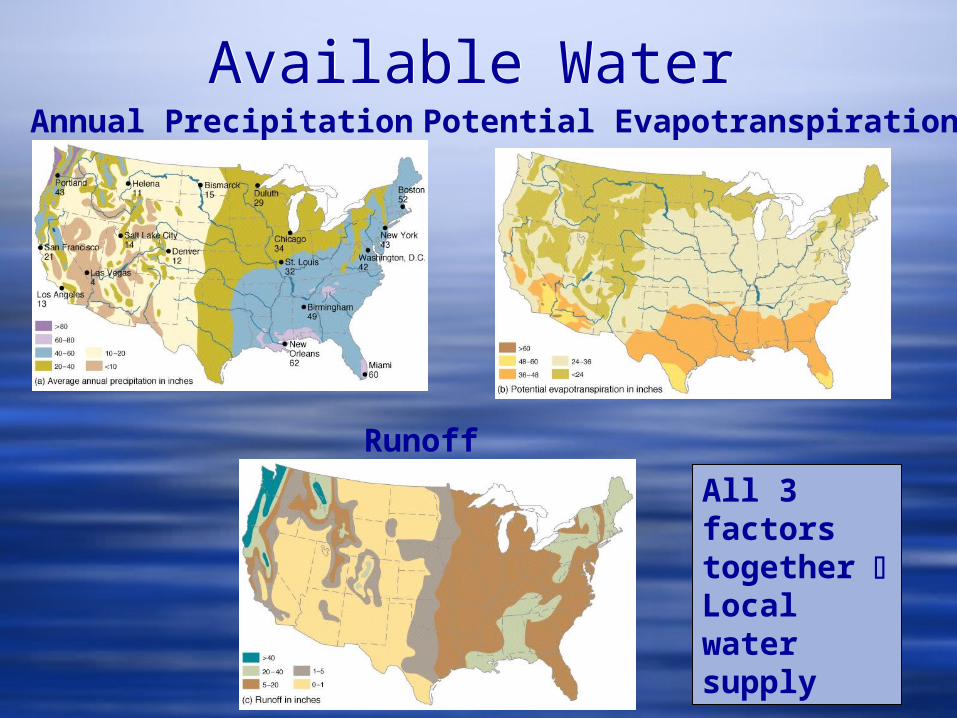
Available WaterAvailable WaterAnnual Precipitation
Runoff
Potential Evapotranspiration
All 3 factors together Local water supply
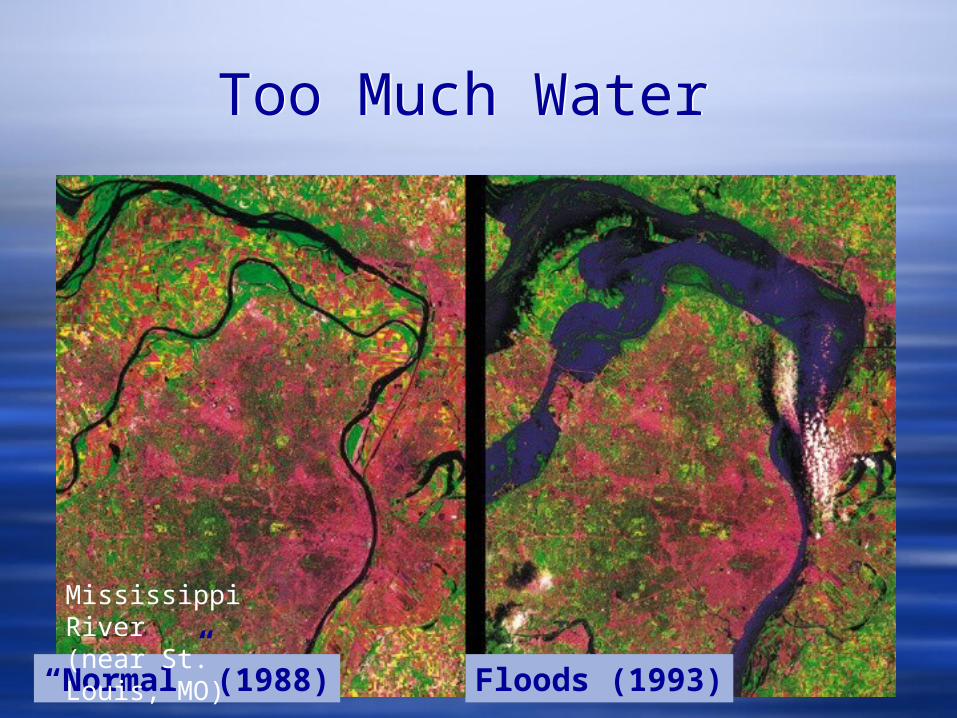
Too Much WaterToo Much Water
“Normal” (1988) Floods (1993)
Mississippi River(near St. Louis, MO)
QuickTime™ and aTIFF (Uncompressed) decompressor
are needed to see this picture.New Orleans
Lake Pontchartrain
Mississippi River
”A land between earth and sea, belonging to neither and alternately claimed by both." - Kolb and Van Topik

QuickTime™ and aTIFF (Uncompressed) decompressor
are needed to see this picture.
QuickTime™ and aTIFF (Uncompressed) decompressor
are needed to see this picture.
Sea Level

Erosion & Subsidence:Loss of Coastal Marshes
Erosion & Subsidence:Loss of Coastal Marshes
QuickTime™ and aTIFF (Uncompressed) decompressor
are needed to see this picture.
All told, more than 600,000 acres of wetlands have been lost in recent decades. Erosion rates as high as 40 acres in a day have been recorded.
Water ShortagesWater
Shortages
QuickTime™ and aTIFF (Uncompressed) decompressor
are needed to see this picture.
QuickTime™ and aTIFF (Uncompressed) decompressor
are needed to see this picture.
Water Scarce(<1000 m3/yr/person)
Water Stressed(1700-1000 m3/yr/person)
Water ConflictWater ConflictEarliest Recorded (2500 B.C.):Border dispute between Lagash and Umma. Water diverted via canals.1672:French invade Netherlands. Dutch open the dikes and create an impenetrable flood barrier.1907-1913:Pipeline diverting water to L.A. repeatedly bombed to protect local water supply.1940-45:Hydroelectric dams repeatedly bombed during WWII.
1967:Israel takes over the Golan Heights to secure water supply from the Jordan River.
QuickTime™ and aTIFF (Uncompressed) decompressor
are needed to see this picture.

Water PoliticsWater Politics
Trade in Food
International Agreements
QuickTime™ and aTIFF (Uncompressed) decompressor
are needed to see this picture.
QuickTime™ and aTIFF (Uncompressed) decompressor
are needed to see this picture.
Where does our water come from?
Where does our water come from?
Surface Water(0.4% of all freshwater)
Groundwater(12% of all freshwater)

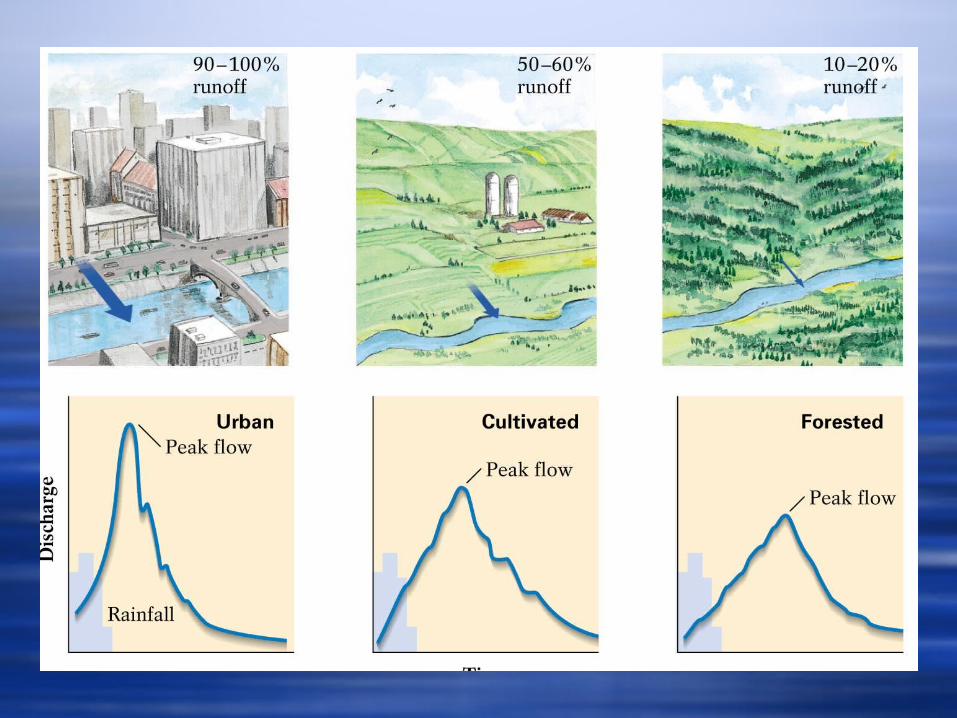
Amount of infiltrationinfiltration depends on:1.Surface materials
• Promoted by pore space of soils, sand, gravel (Clay or crystalline bedrock = More runoff)
2.Vegetation• Heavy vegetation = Rain doesn’t reach ground
before evaporating• Roots promote infiltration for water reaching
ground3.Topography
• Steeper = More runoff (can only infiltrate so fast)
4.Rate of precipitation• Drought = No/little recharge (may be seasonal)• Lots of rain = Saturates soil, promotes runoff
(can only move through ground so fast)
Infiltration vs. Infiltration vs. RunoffRunoff
Infiltration vs. Infiltration vs. RunoffRunoff

“Ratio of 4” means “Flooding is 4 times more
common after this amount of urbanization”
(about 50%)
Luna Leopold, 1968, USGS Circular 559

Effects of Land-Use ChangesEffects of Land-Use Changes
QuickTime™ and aTIFF (Uncompressed) decompressor
are needed to see this picture.