Embed Size (px)
Citation preview

U.S. Department of the InteriorU.S. Geological Survey
Scientific Investigations Report 2013–5082
Prepared in cooperation with theCity of Frederick, Maryland and Frederick County, Maryland
Water Volume and Sediment Volume and Density in Lake Linganore between Boyers Mill Road Bridge and Bens Branch, Frederick County, Maryland, 2012

Cover. 1995 aerial photograph of the Lake Linganore study area between Boyers Mill Road Bridge and Bens Branch, Frederick County, Maryland, from the U.S. Department of Agriculture (USDA) National Agriculture Imagery Program (NAIP).
Water Volume and Sediment Volume and Density in Lake Linganore between Boyers Mill Road Bridge and Bens Branch, Frederick County, Maryland, 2012
By Andrew J. Sekellick, William S.L. Banks, and Michael K. Myers, Jr.
Scientific Investigations Report 2013–5082
U.S. Department of the InteriorU.S. Geological Survey
Prepared in cooperation with the City of Frederick, Maryland and Frederick County, Maryland
U.S. Department of the InteriorSALLY JEWELL, Secretary
U.S. Geological SurveySuzette M. Kimball, Acting Director
U.S. Geological Survey, Reston, Virginia: 2013
For more information on the USGS—the Federal source for science about the Earth, its natural and living resources, natural hazards, and the environment, visit http://www.usgs.gov or call 1-888-ASK-USGS
For an overview of USGS information products, including maps, imagery, and publications, visit http://www.usgs.gov/pubprod
To order this and other USGS information products, visit http://store.usgs.gov
Any use of trade, product, or firm names is for descriptive purposes only and does not imply endorsement by the U.S. Government.
Although this report is in the public domain, permission must be secured from the individual copyright owners to reproduce any copyrighted materials contained within this report.
Suggested citation:Sekellick, A.J., Banks, W.S.L., and Myers, M.K., Jr., 2013, Water volume and sediment volume and density in Lake Linganore between Boyers Mill Road Bridge and Bens Branch, Frederick County, Maryland, 2012: U.S. Geological Survey Scientific Investigations Report 2013–5082, 15 p.
ISBN 978-1-4113-3585-1
iii
Contents
Abstract ...........................................................................................................................................................1Introduction.....................................................................................................................................................1
Purpose and Scope ..............................................................................................................................4Description of Study Area ...................................................................................................................4
Methods...........................................................................................................................................................4Bathymetric-Data Collection ..............................................................................................................4Bathymetric-Data Processing ............................................................................................................5Sediment-Core Collection ...................................................................................................................6Sediment-Data Processing ...............................................................................................................10Quality Assurance...............................................................................................................................10
Water Volume ...............................................................................................................................................10Sediment Volume and Density ...................................................................................................................11Comparison to Previous Study Results ....................................................................................................13Summary........................................................................................................................................................14Acknowledgments .......................................................................................................................................14References Cited..........................................................................................................................................14
iv
Figures 1a. Map showing location of Linganore Creek watershed, Frederick County,
Maryland ........................................................................................................................................2 1b. Map showing location of Linganore Creek study area, Frederick County,
Maryland ........................................................................................................................................3 2. Map showing planned bathymetric survey lines with 100-foot spacing
and quality-assurance lines, Lake Linganore, Frederick County, Maryland, 2012 ..............................................................................................................................5
3. Photograph showing U.S. Geological Survey bathymetric-survey and support boat, Lake Linganore, Frederick County, Maryland, 2012........................................6
4. Map showing collected bathymetric survey lines from measurement points, and quality-assurance lines from bathymetric quality-assurance data points, Lake Linganore, Frederick County, Maryland, 2012 ..........................................7
5. Map showing location of sediment cores and survey sections A–F of Lake Linganore, Frederick County, Maryland, 2012 ................................................................8
6. Photograph showing U.S. Geological Survey Hoverprobe, Lake Linganore, Frederick County, Maryland, 2012 ..............................................................................................8
7. Map showing bathymetric contours of Lake Linganore, Frederick County, Maryland, 2012 ............................................................................................................................11
8. Map showing sediment accumulation and scour in Lake Linganore, Frederick County, Maryland, 2012 ............................................................................................12
9. Map showing areas with sediment deposited above full-pool elevation and the 308-foot contour line from 1972, Lake Linganore, Frederick County, Maryland, 2012 ............................................................................................................................12
Tables 1. Location and physical properties of sediment cores collected in Lake
Linganore, Frederick County, Maryland, 2012 ..........................................................................9 2. Sediment volume, average dry bulk density, and sediment mass by
survey section, Lake Linganore, Frederick County, Maryland, 2012 ..................................13 3. Total sediment mass between topographic contours of Lake Linganore,
Frederick County, Maryland, 2012 ............................................................................................13
v
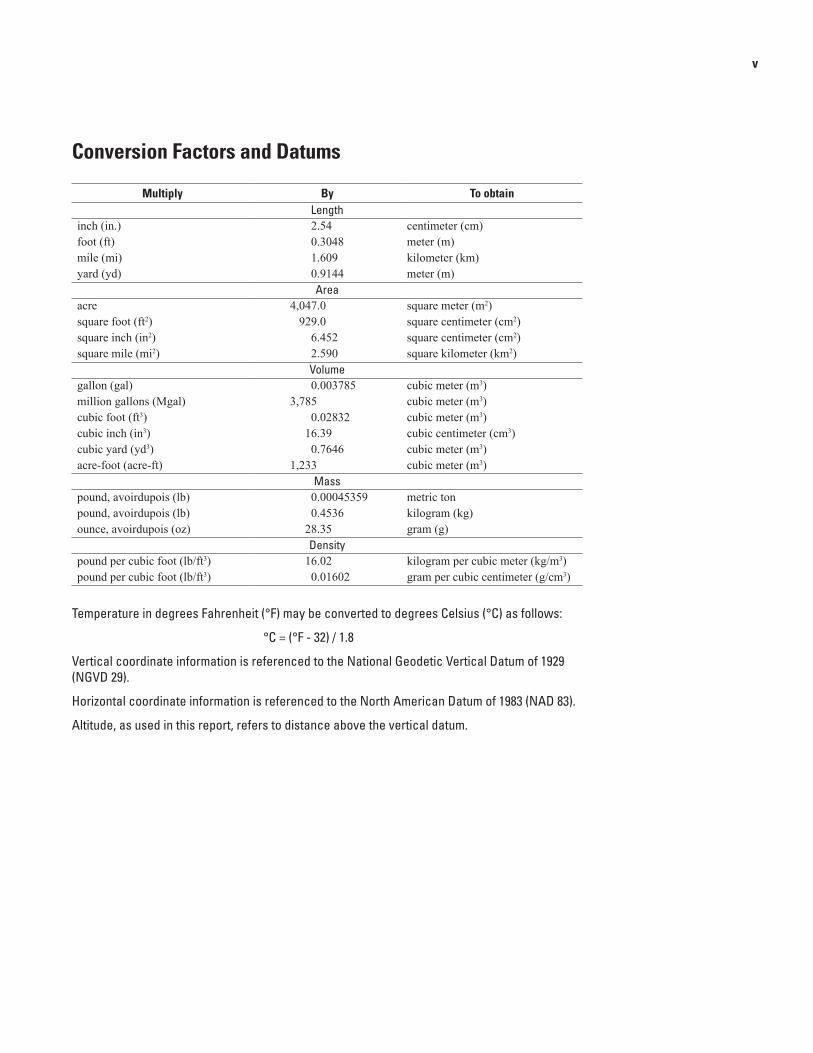
Conversion Factors and Datums
Multiply By To obtainLength
inch (in.) 2.54 centimeter (cm)foot (ft) 0.3048 meter (m)mile (mi) 1.609 kilometer (km)yard (yd) 0.9144 meter (m)
Areaacre 4,047.0 square meter (m2)square foot (ft2) 929.0 square centimeter (cm2)square inch (in2) 6.452 square centimeter (cm2)square mile (mi2) 2.590 square kilometer (km2)
Volumegallon (gal) 0.003785 cubic meter (m3) million gallons (Mgal) 3,785 cubic meter (m3)cubic foot (ft3) 0.02832 cubic meter (m3) cubic inch (in3) 16.39 cubic centimeter (cm3) cubic yard (yd3) 0.7646 cubic meter (m3) acre-foot (acre-ft) 1,233 cubic meter (m3)
Masspound, avoirdupois (lb) 0.00045359 metric tonpound, avoirdupois (lb) 0.4536 kilogram (kg) ounce, avoirdupois (oz) 28.35 gram (g)
Densitypound per cubic foot (lb/ft3) 16.02 kilogram per cubic meter (kg/m3)pound per cubic foot (lb/ft3) 0.01602 gram per cubic centimeter (g/cm3)
Temperature in degrees Fahrenheit (°F) may be converted to degrees Celsius (°C) as follows:
°C = (°F - 32) / 1.8
Vertical coordinate information is referenced to the National Geodetic Vertical Datum of 1929 (NGVD 29).
Horizontal coordinate information is referenced to the North American Datum of 1983 (NAD 83).
Altitude, as used in this report, refers to distance above the vertical datum.

Water Volume and Sediment Volume and Density in Lake Linganore between Boyers Mill Road Bridge and Bens Branch, Frederick County, Maryland, 2012
By Andrew J. Sekellick, William S.L. Banks, and Michael K. Myers, Jr.
AbstractTo assist in understanding sediment loadings and the
management of water resources, a bathymetric survey was conducted in the part of Lake Linganore between Boyers Mill Road Bridge and Bens Branch in Frederick County, Maryland. The bathymetric survey was performed in January 2012 by the U.S. Geological Survey, in cooperation with the City of Frederick and Frederick County. A separate, but related, field effort to collect 18 sediment cores was conducted in March and April 2012. Depth and location data from the bathymetric survey and location data for the sediment cores were compiled and edited by using geographic information system (GIS) software. A three-dimensional triangulated irregular network (TIN) model of the lake bottom was created to calculate the volume of stored water in the reservoir. Large-scale topo-graphic maps of the valley prior to inundation in 1972 were provided by the Frederick County Division of Utilities and Solid Waste Management and digitized for comparison with current (2012) conditions in order to calculate sediment volume. Cartographic representations of both water depth and sediment accumulation were produced, along with an accu-racy assessment for the resulting bathymetric model. Vertical accuracies at the 95-percent confidence level for the collected data, the bathymetric surface model, and the bathymetric contour map were calculated to be 0.64 feet (ft), 1.77 ft, and 2.30 ft, respectively. A dry bulk sediment density was calcu-lated for each of the 18 sediment cores collected during March and April 2012, and used to determine accumulated sediment mass.
Water-storage capacity in the study area is 110 acre-feet (acre-ft) at a full-pool elevation 308 ft above the National Geodetic Vertical Datum of 1929, whereas total sediment volume in the study area is 202 acre-ft. These totals indicate a loss of about 65 percent of the original water-storage capacity in the 40 years since dam construction. This corresponds to an average rate of sediment accumulation of 5.1 acre-ft per year since Linganore Creek was impounded.
Sediment thicknesses ranged from 0 to 16.7 ft. Sediment densities ranged from 0.38 to 1.08 grams per cubic centimeter,
and generally decreased in the downstream direction. The total accumulated-sediment mass was 156,000 metric tons between 1972 and 2012.
IntroductionThe U.S. Environmental Protection Agency has identified
the Lower Monocacy River, a tributary to the Chesapeake Bay, as impaired by sediment and nutrients, and imposed a sedi-ment and phosphorus Total Maximum Daily Load (TMDL) (Maryland Department of the Environment, 2002). Linganore Creek is a tributary of the Lower Monocacy River (fig. 1). Lake Linganore, an impoundment on Linganore Creek, provides water to the City of Frederick and Frederick County, Maryland. Frederick County is within commuting distance of the Washington, D.C. and Baltimore, Maryland metropolitan areas, and from 2000 to 2010, the population of Frederick County increased by 19.5 percent (38,108 people) (U.S. Census Bureau, 2011). Land-use conversion that accompanies population growth and the expansion of impervious surfaces can cause increases in stormwater runoff, streamflow, erosion, and sediment and phosphorus loadings, which in turn have a significant impact on the water quality of the Chesapeake Bay and its tributaries (Gellis and others, 2009). Frederick County does not use Lake Linganore as a primary water supply and by agreement withdraws water from the lake under emergency conditions and when the pool elevation is greater or equal to a full-pool elevation of 308 feet (ft) National Geodetic Vertical Datum of 1929 (NGVD 29). In order to meet the TMDL regulatory requirement, mitigate sediment and phosphorus loadings, and manage their water resources, it is necessary for the City of Frederick and Frederick County, Maryland to know how much water is impounded in Lake Linganore and to accurately quantify the volume and mass of sediment behind the dam. To address these issues, the City of Frederick and Frederick County, Maryland partnered with the U.S. Geological Survey (USGS) to investigate water volume and sediment volume and density in the lake.
2 Water Volume and Sediment Volume and Density in Lake Linganore between Boyers Mill Road Bridge and Bens Branch, 2012
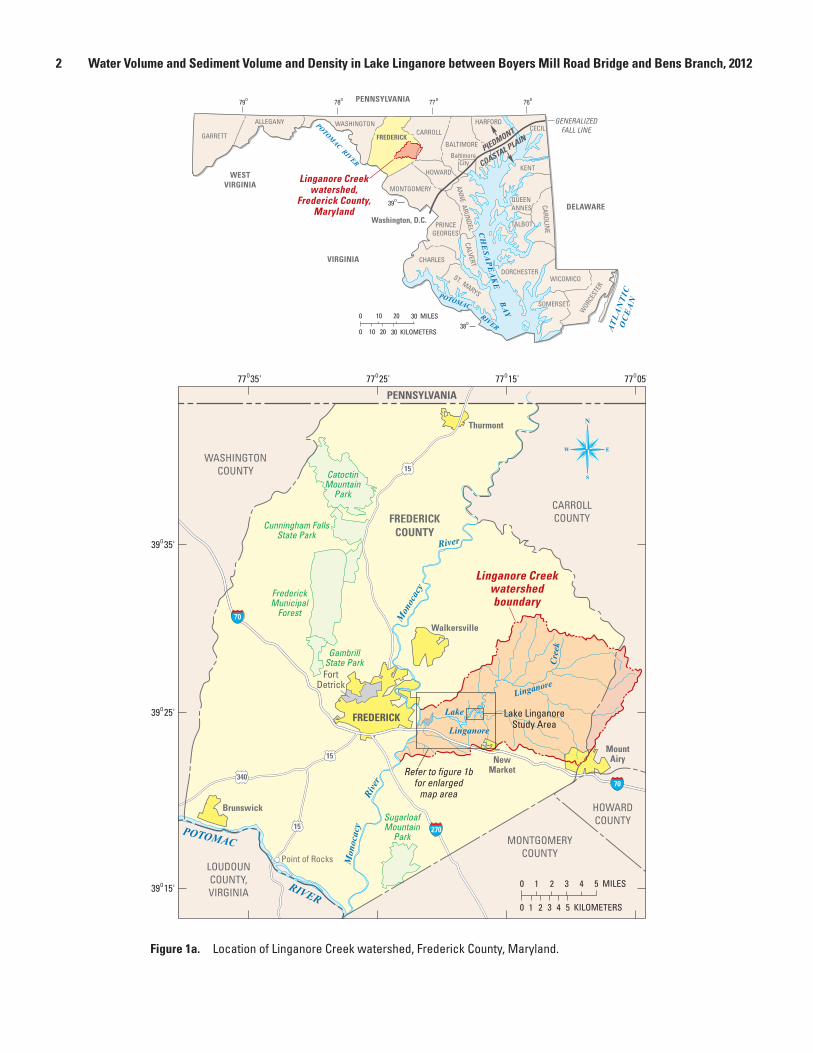
Figure 1a. Location of Linganore Creek watershed, Frederick County, Maryland.
Introduction 3
Figu
re 1
b.
Loca
tion
of L
inga
nore
Cre
ek s
tudy
are
a, F
rede
rick
Coun
ty, M
aryl
and.
4 Water Volume and Sediment Volume and Density in Lake Linganore between Boyers Mill Road Bridge and Bens Branch, 2012
Purpose and Scope
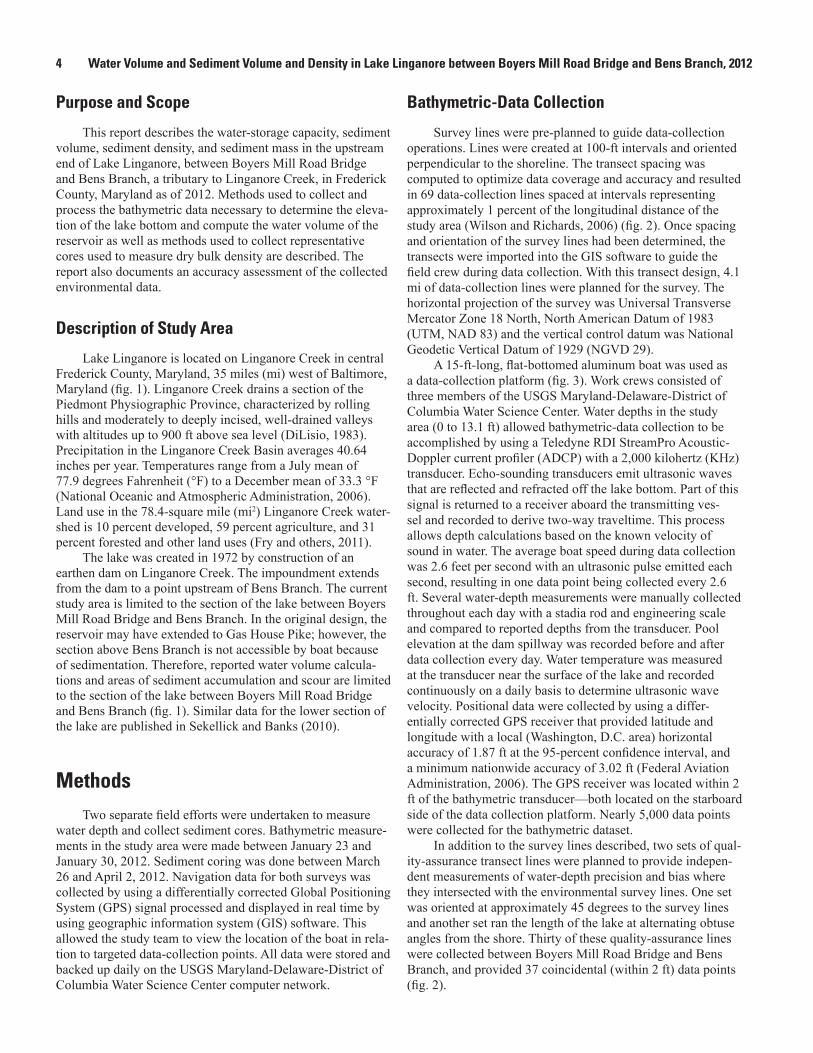
This report describes the water-storage capacity, sediment volume, sediment density, and sediment mass in the upstream end of Lake Linganore, between Boyers Mill Road Bridge and Bens Branch, a tributary to Linganore Creek, in Frederick County, Maryland as of 2012. Methods used to collect and process the bathymetric data necessary to determine the eleva-tion of the lake bottom and compute the water volume of the reservoir as well as methods used to collect representative cores used to measure dry bulk density are described. The report also documents an accuracy assessment of the collected environmental data.
Description of Study Area
Lake Linganore is located on Linganore Creek in central Frederick County, Maryland, 35 miles (mi) west of Baltimore, Maryland (fig. 1). Linganore Creek drains a section of the Piedmont Physiographic Province, characterized by rolling hills and moderately to deeply incised, well-drained valleys with altitudes up to 900 ft above sea level (DiLisio, 1983). Precipitation in the Linganore Creek Basin averages 40.64 inches per year. Temperatures range from a July mean of 77.9 degrees Fahrenheit (°F) to a December mean of 33.3 °F (National Oceanic and Atmospheric Administration, 2006). Land use in the 78.4-square mile (mi2) Linganore Creek water-shed is 10 percent developed, 59 percent agriculture, and 31 percent forested and other land uses (Fry and others, 2011).
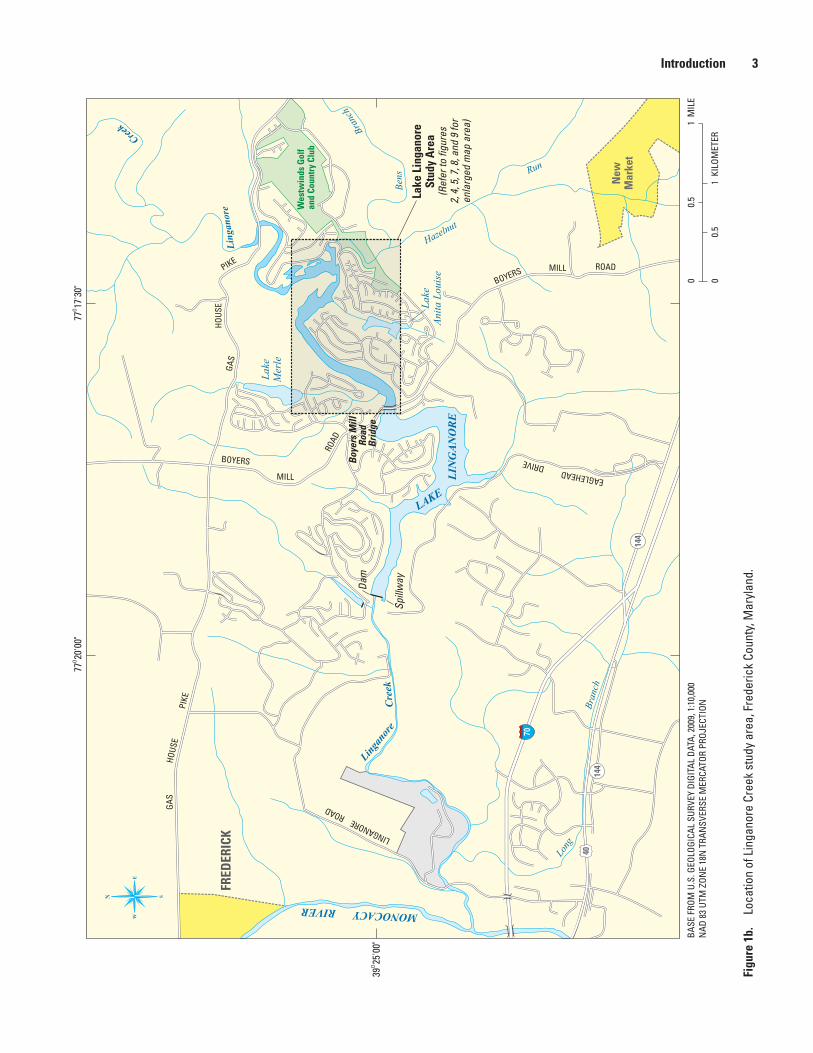
The lake was created in 1972 by construction of an earthen dam on Linganore Creek. The impoundment extends from the dam to a point upstream of Bens Branch. The current study area is limited to the section of the lake between Boyers Mill Road Bridge and Bens Branch. In the original design, the reservoir may have extended to Gas House Pike; however, the section above Bens Branch is not accessible by boat because of sedimentation. Therefore, reported water volume calcula-tions and areas of sediment accumulation and scour are limited to the section of the lake between Boyers Mill Road Bridge and Bens Branch (fig. 1). Similar data for the lower section of the lake are published in Sekellick and Banks (2010).
MethodsTwo separate field efforts were undertaken to measure
water depth and collect sediment cores. Bathymetric measure-ments in the study area were made between January 23 and January 30, 2012. Sediment coring was done between March 26 and April 2, 2012. Navigation data for both surveys was collected by using a differentially corrected Global Positioning System (GPS) signal processed and displayed in real time by using geographic information system (GIS) software. This allowed the study team to view the location of the boat in rela-tion to targeted data-collection points. All data were stored and backed up daily on the USGS Maryland-Delaware-District of Columbia Water Science Center computer network.
Bathymetric-Data Collection
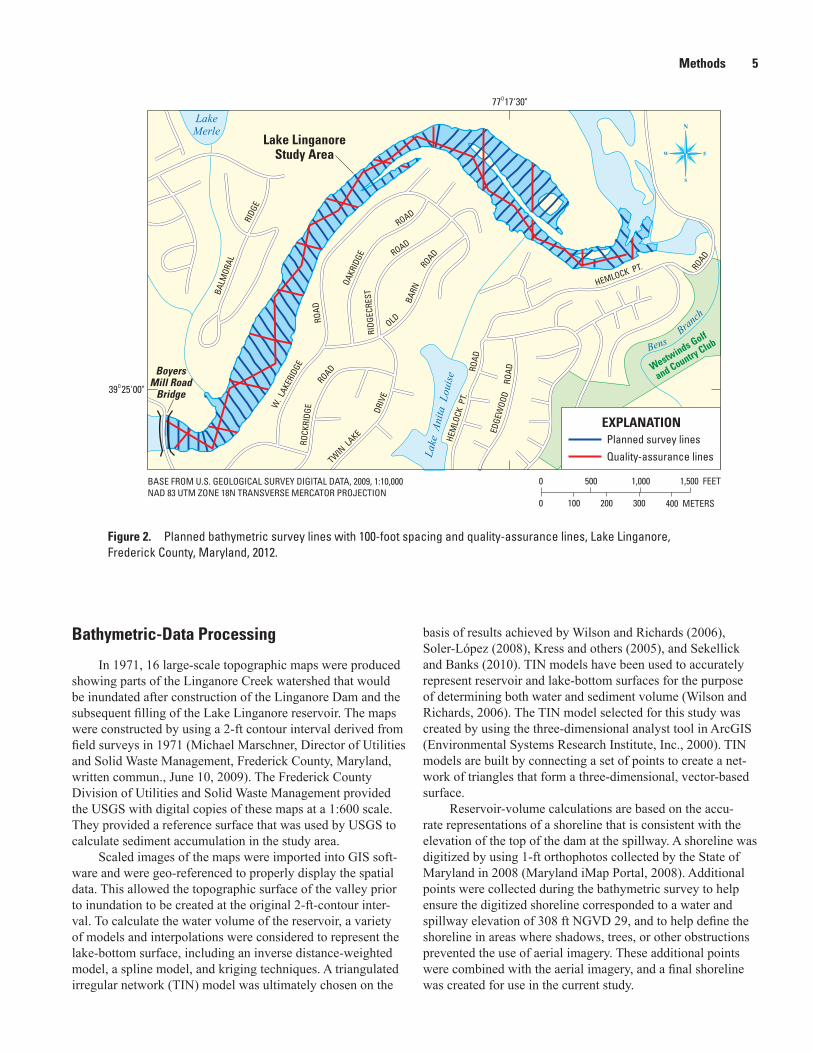
Survey lines were pre-planned to guide data-collection operations. Lines were created at 100-ft intervals and oriented perpendicular to the shoreline. The transect spacing was computed to optimize data coverage and accuracy and resulted in 69 data-collection lines spaced at intervals representing approximately 1 percent of the longitudinal distance of the study area (Wilson and Richards, 2006) (fig. 2). Once spacing and orientation of the survey lines had been determined, the transects were imported into the GIS software to guide the field crew during data collection. With this transect design, 4.1 mi of data-collection lines were planned for the survey. The horizontal projection of the survey was Universal Transverse Mercator Zone 18 North, North American Datum of 1983 (UTM, NAD 83) and the vertical control datum was National Geodetic Vertical Datum of 1929 (NGVD 29).
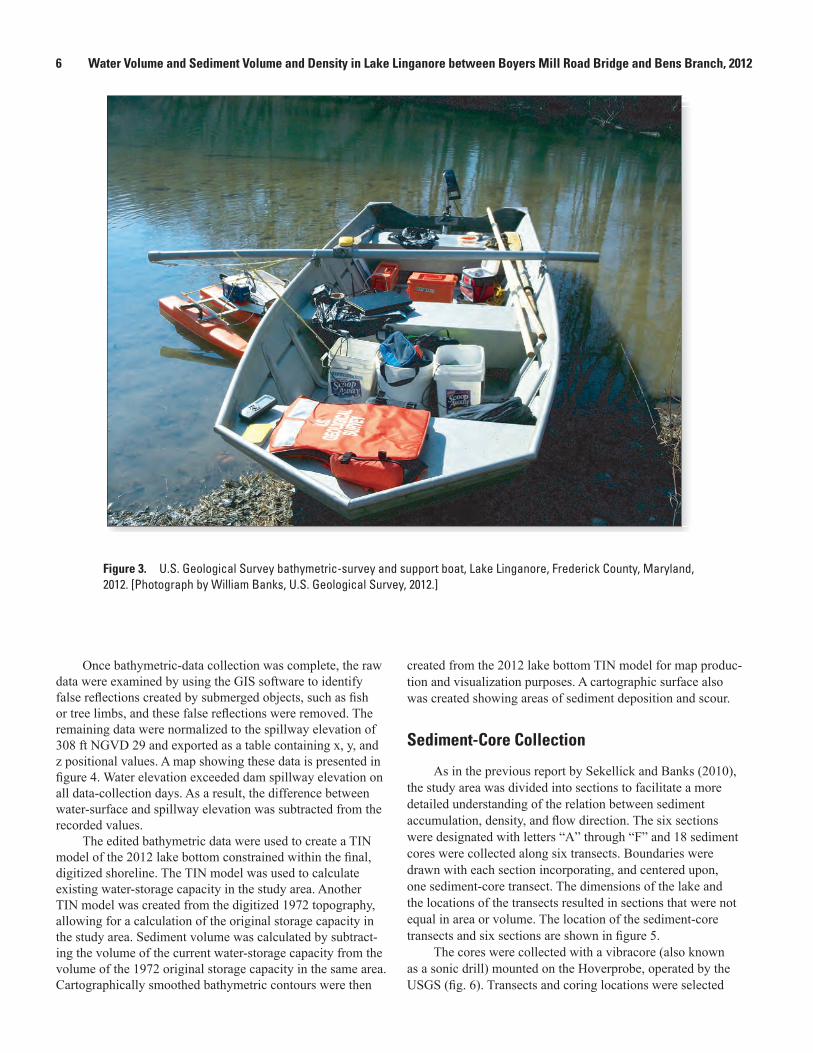
A 15-ft-long, flat-bottomed aluminum boat was used as a data-collection platform (fig. 3). Work crews consisted of three members of the USGS Maryland-Delaware-District of Columbia Water Science Center. Water depths in the study area (0 to 13.1 ft) allowed bathymetric-data collection to be accomplished by using a Teledyne RDI StreamPro Acoustic-Doppler current profiler (ADCP) with a 2,000 kilohertz (KHz) transducer. Echo-sounding transducers emit ultrasonic waves that are reflected and refracted off the lake bottom. Part of this signal is returned to a receiver aboard the transmitting ves-sel and recorded to derive two-way traveltime. This process allows depth calculations based on the known velocity of sound in water. The average boat speed during data collection was 2.6 feet per second with an ultrasonic pulse emitted each second, resulting in one data point being collected every 2.6 ft. Several water-depth measurements were manually collected throughout each day with a stadia rod and engineering scale and compared to reported depths from the transducer. Pool elevation at the dam spillway was recorded before and after data collection every day. Water temperature was measured at the transducer near the surface of the lake and recorded continuously on a daily basis to determine ultrasonic wave velocity. Positional data were collected by using a differ-entially corrected GPS receiver that provided latitude and longitude with a local (Washington, D.C. area) horizontal accuracy of 1.87 ft at the 95-percent confidence interval, and a minimum nationwide accuracy of 3.02 ft (Federal Aviation Administration, 2006). The GPS receiver was located within 2 ft of the bathymetric transducer—both located on the starboard side of the data collection platform. Nearly 5,000 data points were collected for the bathymetric dataset.
In addition to the survey lines described, two sets of qual-ity-assurance transect lines were planned to provide indepen-dent measurements of water-depth precision and bias where they intersected with the environmental survey lines. One set was oriented at approximately 45 degrees to the survey lines and another set ran the length of the lake at alternating obtuse angles from the shore. Thirty of these quality-assurance lines were collected between Boyers Mill Road Bridge and Bens Branch, and provided 37 coincidental (within 2 ft) data points (fig. 2).
Methods 5
Figure 2. Planned bathymetric survey lines with 100-foot spacing and quality-assurance lines, Lake Linganore, Frederick County, Maryland, 2012.
Bathymetric-Data Processing
In 1971, 16 large-scale topographic maps were produced showing parts of the Linganore Creek watershed that would be inundated after construction of the Linganore Dam and the subsequent filling of the Lake Linganore reservoir. The maps were constructed by using a 2-ft contour interval derived from field surveys in 1971 (Michael Marschner, Director of Utilities and Solid Waste Management, Frederick County, Maryland, written commun., June 10, 2009). The Frederick County Division of Utilities and Solid Waste Management provided the USGS with digital copies of these maps at a 1:600 scale. They provided a reference surface that was used by USGS to calculate sediment accumulation in the study area.
Scaled images of the maps were imported into GIS soft-ware and were geo-referenced to properly display the spatial data. This allowed the topographic surface of the valley prior to inundation to be created at the original 2-ft-contour inter-val. To calculate the water volume of the reservoir, a variety of models and interpolations were considered to represent the lake-bottom surface, including an inverse distance-weighted model, a spline model, and kriging techniques. A triangulated irregular network (TIN) model was ultimately chosen on the
basis of results achieved by Wilson and Richards (2006), Soler-López (2008), Kress and others (2005), and Sekellick and Banks (2010). TIN models have been used to accurately represent reservoir and lake-bottom surfaces for the purpose of determining both water and sediment volume (Wilson and Richards, 2006). The TIN model selected for this study was created by using the three-dimensional analyst tool in ArcGIS (Environmental Systems Research Institute, Inc., 2000). TIN models are built by connecting a set of points to create a net-work of triangles that form a three-dimensional, vector-based surface.
Reservoir-volume calculations are based on the accu-rate representations of a shoreline that is consistent with the elevation of the top of the dam at the spillway. A shoreline was digitized by using 1-ft orthophotos collected by the State of Maryland in 2008 (Maryland iMap Portal, 2008). Additional points were collected during the bathymetric survey to help ensure the digitized shoreline corresponded to a water and spillway elevation of 308 ft NGVD 29, and to help define the shoreline in areas where shadows, trees, or other obstructions prevented the use of aerial imagery. These additional points were combined with the aerial imagery, and a final shoreline was created for use in the current study.
6 Water Volume and Sediment Volume and Density in Lake Linganore between Boyers Mill Road Bridge and Bens Branch, 2012
Figure 3. U.S. Geological Survey bathymetric-survey and support boat, Lake Linganore, Frederick County, Maryland, 2012. [Photograph by William Banks, U.S. Geological Survey, 2012.]
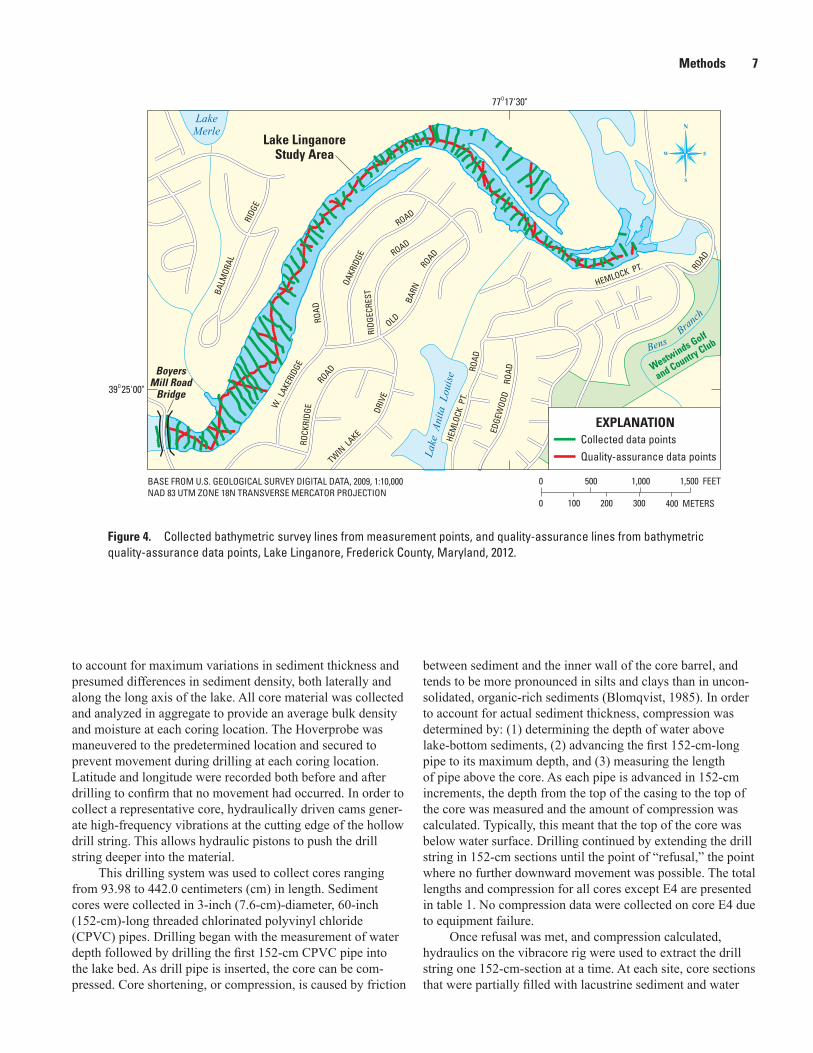
Once bathymetric-data collection was complete, the raw data were examined by using the GIS software to identify false reflections created by submerged objects, such as fish or tree limbs, and these false reflections were removed. The remaining data were normalized to the spillway elevation of 308 ft NGVD 29 and exported as a table containing x, y, and z positional values. A map showing these data is presented in figure 4. Water elevation exceeded dam spillway elevation on all data-collection days. As a result, the difference between water-surface and spillway elevation was subtracted from the recorded values.
The edited bathymetric data were used to create a TIN model of the 2012 lake bottom constrained within the final, digitized shoreline. The TIN model was used to calculate existing water-storage capacity in the study area. Another TIN model was created from the digitized 1972 topography, allowing for a calculation of the original storage capacity in the study area. Sediment volume was calculated by subtract-ing the volume of the current water-storage capacity from the volume of the 1972 original storage capacity in the same area. Cartographically smoothed bathymetric contours were then
created from the 2012 lake bottom TIN model for map produc-tion and visualization purposes. A cartographic surface also was created showing areas of sediment deposition and scour.
Sediment-Core Collection
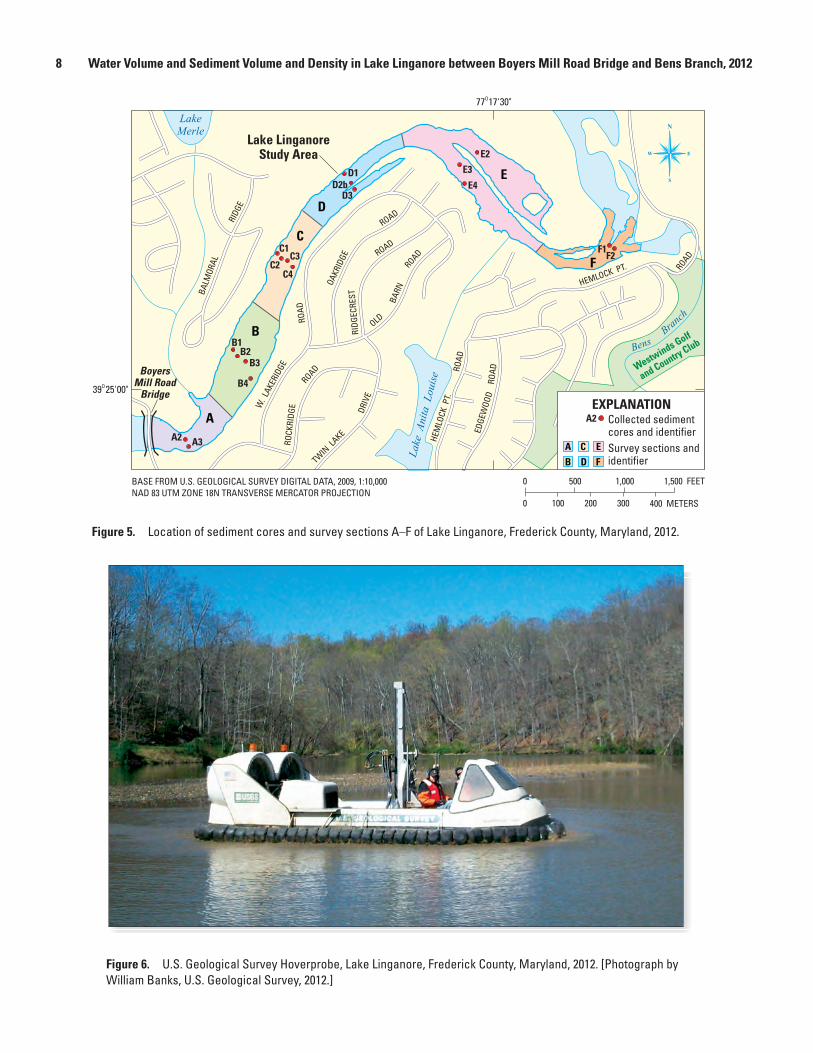
As in the previous report by Sekellick and Banks (2010), the study area was divided into sections to facilitate a more detailed understanding of the relation between sediment accumulation, density, and flow direction. The six sections were designated with letters “A” through “F” and 18 sediment cores were collected along six transects. Boundaries were drawn with each section incorporating, and centered upon, one sediment-core transect. The dimensions of the lake and the locations of the transects resulted in sections that were not equal in area or volume. The location of the sediment-core transects and six sections are shown in figure 5.
The cores were collected with a vibracore (also known as a sonic drill) mounted on the Hoverprobe, operated by the USGS (fig. 6). Transects and coring locations were selected
Methods 7
Figure 4. Collected bathymetric survey lines from measurement points, and quality-assurance lines from bathymetric quality-assurance data points, Lake Linganore, Frederick County, Maryland, 2012.
to account for maximum variations in sediment thickness and presumed differences in sediment density, both laterally and along the long axis of the lake. All core material was collected and analyzed in aggregate to provide an average bulk density and moisture at each coring location. The Hoverprobe was maneuvered to the predetermined location and secured to prevent movement during drilling at each coring location. Latitude and longitude were recorded both before and after drilling to confirm that no movement had occurred. In order to collect a representative core, hydraulically driven cams gener-ate high-frequency vibrations at the cutting edge of the hollow drill string. This allows hydraulic pistons to push the drill string deeper into the material.
This drilling system was used to collect cores ranging from 93.98 to 442.0 centimeters (cm) in length. Sediment cores were collected in 3-inch (7.6-cm)-diameter, 60-inch (152-cm)-long threaded chlorinated polyvinyl chloride (CPVC) pipes. Drilling began with the measurement of water depth followed by drilling the first 152-cm CPVC pipe into the lake bed. As drill pipe is inserted, the core can be com-pressed. Core shortening, or compression, is caused by friction
between sediment and the inner wall of the core barrel, and tends to be more pronounced in silts and clays than in uncon-solidated, organic-rich sediments (Blomqvist, 1985). In order to account for actual sediment thickness, compression was determined by: (1) determining the depth of water above lake-bottom sediments, (2) advancing the first 152-cm-long pipe to its maximum depth, and (3) measuring the length of pipe above the core. As each pipe is advanced in 152-cm increments, the depth from the top of the casing to the top of the core was measured and the amount of compression was calculated. Typically, this meant that the top of the core was below water surface. Drilling continued by extending the drill string in 152-cm sections until the point of “refusal,” the point where no further downward movement was possible. The total lengths and compression for all cores except E4 are presented in table 1. No compression data were collected on core E4 due to equipment failure.
Once refusal was met, and compression calculated, hydraulics on the vibracore rig were used to extract the drill string one 152-cm-section at a time. At each site, core sections that were partially filled with lacustrine sediment and water
8 Water Volume and Sediment Volume and Density in Lake Linganore between Boyers Mill Road Bridge and Bens Branch, 2012
Figure 5. Location of sediment cores and survey sections A–F of Lake Linganore, Frederick County, Maryland, 2012.
Figure 6. U.S. Geological Survey Hoverprobe, Lake Linganore, Frederick County, Maryland, 2012. [Photograph by William Banks, U.S. Geological Survey, 2012.]
Methods 9
were extruded from the core barrel and placed directly into clean, pre-weighed plastic containers and covered to prevent evaporation. At 15 of the 18 sites, the bottom section could not be extruded in the field. These sections were capped to prevent evaporation and material loss, temporarily stored aboard the Hoverprobe, and transported daily to the USGS sediment labo-ratory in Reston, Virginia.
Upon completion of field efforts, the 15 bottom core-barrel sections (the sections that contained the pre- and post-lacustrine boundary) were cut length-wise and examined to determine the boundary. The boundary between lake-bottom sediment and the underlying pre-inundation land-surface material was determined on the basis of sediment texture. Material deposited before the construction of the dam tended to be more coarse sand, whereas material deposited after dam construction tended to be finer silts and clays. In addition, the
pre-inundation surface was often characterized by the presence of root hairs, sticks, seed pods, and leaves (Juracek, 1998; Van Metre and others, 2004). A quantitative analysis of sediment grain size was not performed.
For each core, material retained in the core barrel that was deposited after inundation was placed in the same con-tainer used for the collection of other material from that core. The material was allowed to air dry in a low humidity environ-ment for 14 days at a temperature between 68 and 75 °F. Once all standing water was evaporated, the material was spread across plastic sheeting, and drying continued for an additional 14 days. The dried material was then returned to its original container and weighed. The material was then allowed to dry an additional 10 days before being re-weighed to confirm the dry weight of the material (table 1).
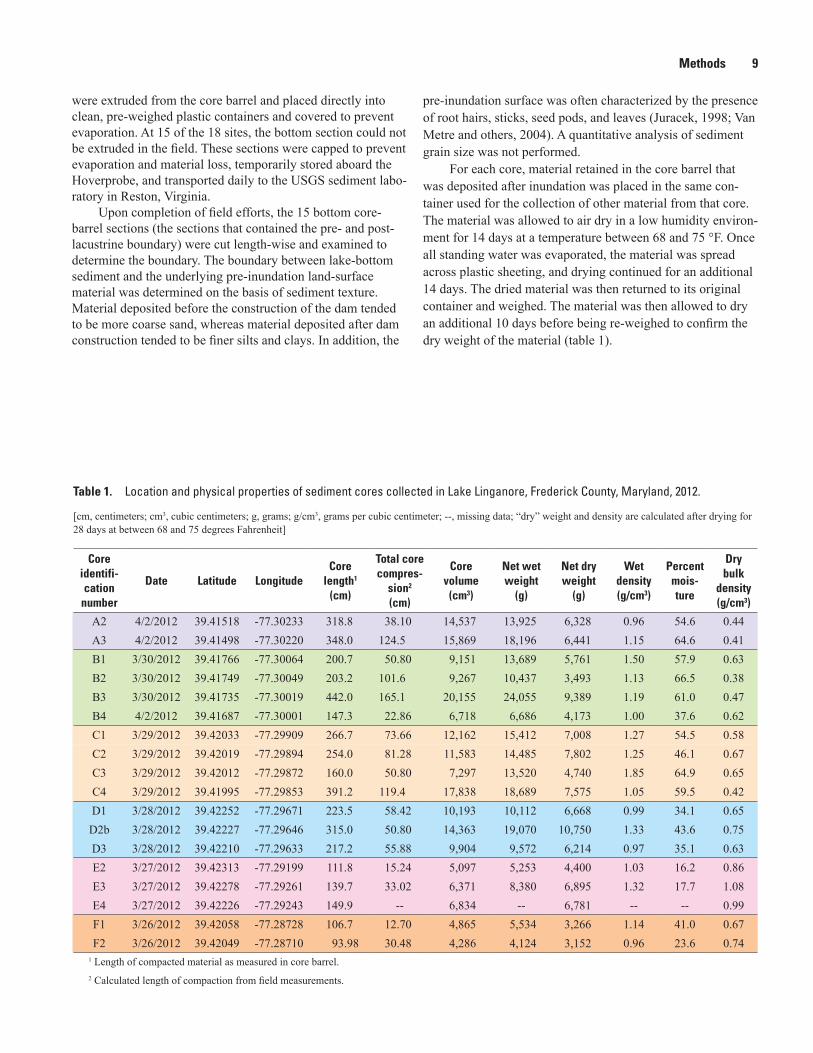
Table 1. Location and physical properties of sediment cores collected in Lake Linganore, Frederick County, Maryland, 2012.
[cm, centimeters; cm3, cubic centimeters; g, grams; g/cm3, grams per cubic centimeter; --, missing data; “dry” weight and density are calculated after drying for 28 days at between 68 and 75 degrees Fahrenheit]
Core identifi-cation
number
Date Latitude LongitudeCore
length1 (cm)
Total core compres-
sion2 (cm)
Core volume
(cm3)
Net wet weight
(g)
Net dry weight
(g)
Wet density (g/cm3)
Percent mois-ture
Dry bulk
density (g/cm3)
A2 4/2/2012 39.41518 -77.30233 318.8 38.10 14,537 13,925 6,328 0.96 54.6 0.44A3 4/2/2012 39.41498 -77.30220 348.0 124.5 15,869 18,196 6,441 1.15 64.6 0.41B1 3/30/2012 39.41766 -77.30064 200.7 50.80 9,151 13,689 5,761 1.50 57.9 0.63B2 3/30/2012 39.41749 -77.30049 203.2 101.6 9,267 10,437 3,493 1.13 66.5 0.38B3 3/30/2012 39.41735 -77.30019 442.0 165.1 20,155 24,055 9,389 1.19 61.0 0.47B4 4/2/2012 39.41687 -77.30001 147.3 22.86 6,718 6,686 4,173 1.00 37.6 0.62C1 3/29/2012 39.42033 -77.29909 266.7 73.66 12,162 15,412 7,008 1.27 54.5 0.58C2 3/29/2012 39.42019 -77.29894 254.0 81.28 11,583 14,485 7,802 1.25 46.1 0.67C3 3/29/2012 39.42012 -77.29872 160.0 50.80 7,297 13,520 4,740 1.85 64.9 0.65C4 3/29/2012 39.41995 -77.29853 391.2 119.4 17,838 18,689 7,575 1.05 59.5 0.42D1 3/28/2012 39.42252 -77.29671 223.5 58.42 10,193 10,112 6,668 0.99 34.1 0.65D2b 3/28/2012 39.42227 -77.29646 315.0 50.80 14,363 19,070 10,750 1.33 43.6 0.75D3 3/28/2012 39.42210 -77.29633 217.2 55.88 9,904 9,572 6,214 0.97 35.1 0.63E2 3/27/2012 39.42313 -77.29199 111.8 15.24 5,097 5,253 4,400 1.03 16.2 0.86E3 3/27/2012 39.42278 -77.29261 139.7 33.02 6,371 8,380 6,895 1.32 17.7 1.08E4 3/27/2012 39.42226 -77.29243 149.9 -- 6,834 -- 6,781 -- -- 0.99F1 3/26/2012 39.42058 -77.28728 106.7 12.70 4,865 5,534 3,266 1.14 41.0 0.67F2 3/26/2012 39.42049 -77.28710 93.98 30.48 4,286 4,124 3,152 0.96 23.6 0.74
1 Length of compacted material as measured in core barrel.2 Calculated length of compaction from field measurements.
10 Water Volume and Sediment Volume and Density in Lake Linganore between Boyers Mill Road Bridge and Bens Branch, 2012
Sediment-Data Processing
Dry bulk density was calculated for 18 cores, and wet density and percent moisture were calculated for 17 cores, by use of equations (1) through (3).
Sediment density as dry bulk density:
/BD m v= (1)
where BD = the bulk density, in grams per cubic
centimeter (g/cm3), m = the mass (net dry weight) of the sample, in
grams (g), and v = the volume of the sample, in cubic
centimeters (cm3).
Percent moisture:
100*w mMw− =
(2)
where M = the percent moisture content, w = the net wet weight of the sample (g), and m = the net dry weight of the sample (g).
Volume for a cylindrical core sample:
2
4dv h
=
(3)
where v = the volume of the sample (cm3), h = the height of the cylinder, in centimeters
(cm), d = the inside diameter of the cylinder (cm), and π = the ratio of the circumference of a circle to
its diameter.
In order to calculate wet density and moisture content, it was necessary to account for pore water removed from the core as a result of compression. To do this, a volume of water equal to the compression void was converted into an equiva-lent mass and subtracted from the final wet mass. For the purpose of this calculation, it was assumed that 1 g of water occupies a volume of 1 cm3 (table 1).
Quality Assurance
Vertical accuracy was determined by use of guidelines from the National Standard for Spatial Data Accuracy (NSSDA), which requires an independent quality-assurance
dataset (Federal Geographic Data Committee, 1998). Quality-assurance data points were compared to coincident data points from the environmental survey. To allow for a sufficient number of comparable points, measurements were considered to be coincidental if they were less than 2 ft apart in horizontal distance. To determine the precision in this measurement, the square root of the mean of the squared residuals (RMSE) was calculated by using equation (4) below.
2( ) /i iz data checkRMSE Z Z n = − ∑ (4)
where RMSEz = the root mean squared error of the z, or
vertical component, Zdatai
= the coordinate of the ith check point in the dataset,
Zchecki = the coordinate of the ith check point in the
quality-assurance dataset, and n = the number of coincidental points.
When compared to the environmental dataset, there were 37 quality-assurance data points measuring depth at coincidental locations. Absolute vertical differences between the two datasets ranged from 0.2 ft to 1.6 ft. From equation (4), a RMSEz of 0.64 ft was calculated for the entire dataset. According to the NSSDA guidelines, a factor of 1.96 is multiplied by the RMSEz to determine vertical accuracy at the 95-percent confidence interval. Thus, vertical data collected for this study have an accuracy of plus or minus 1.26 ft at the 95-percent confidence interval. The vertical accuracies of the bathymetric-surface model and the bathymetric-contour map were 1.77 ft and 2.30 ft, respectively, at the 95-percent confi-dence interval, according to NSSDA guidelines.
Water VolumeThe water-storage volume of Lake Linganore from
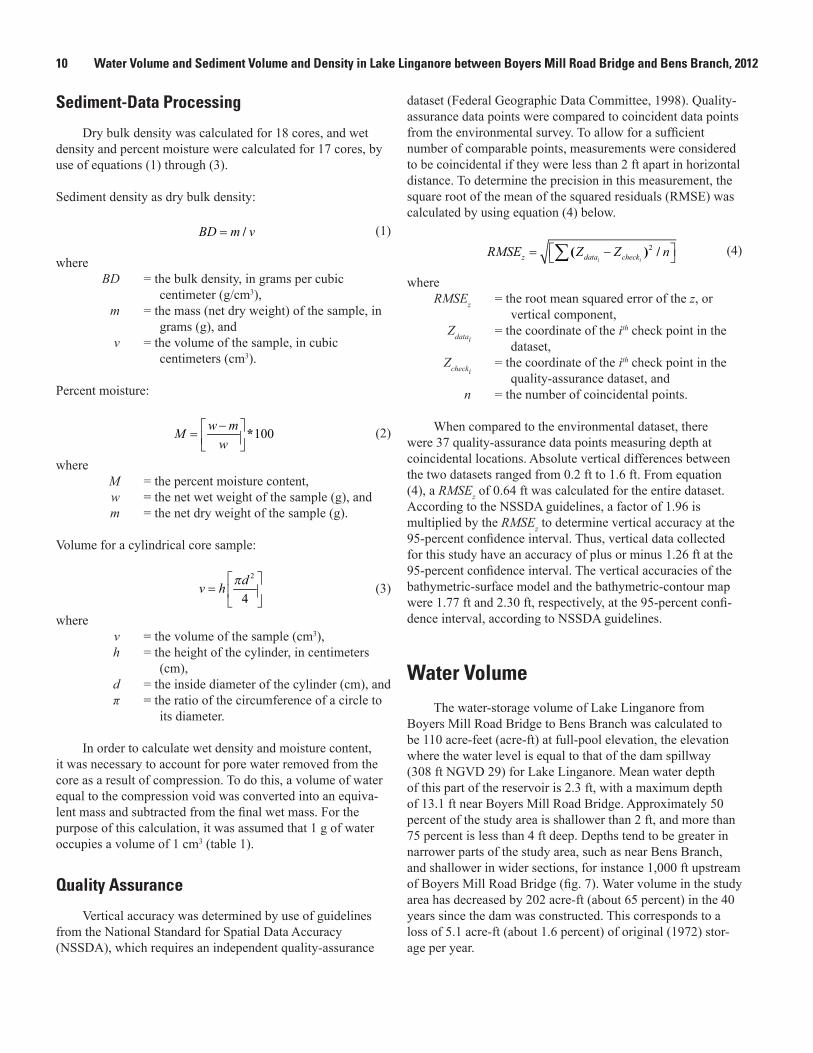
Boyers Mill Road Bridge to Bens Branch was calculated to be 110 acre-feet (acre-ft) at full-pool elevation, the elevation where the water level is equal to that of the dam spillway (308 ft NGVD 29) for Lake Linganore. Mean water depth of this part of the reservoir is 2.3 ft, with a maximum depth of 13.1 ft near Boyers Mill Road Bridge. Approximately 50 percent of the study area is shallower than 2 ft, and more than 75 percent is less than 4 ft deep. Depths tend to be greater in narrower parts of the study area, such as near Bens Branch, and shallower in wider sections, for instance 1,000 ft upstream of Boyers Mill Road Bridge (fig. 7). Water volume in the study area has decreased by 202 acre-ft (about 65 percent) in the 40 years since the dam was constructed. This corresponds to a loss of 5.1 acre-ft (about 1.6 percent) of original (1972) stor-age per year.
Sediment Volume and Density 11
Figure 7. Bathymetric contours of Lake Linganore, Frederick County, Maryland, 2012.
Sediment Volume and DensityBetween 1972 and 2012, a total of 202 acre-ft of sedi-
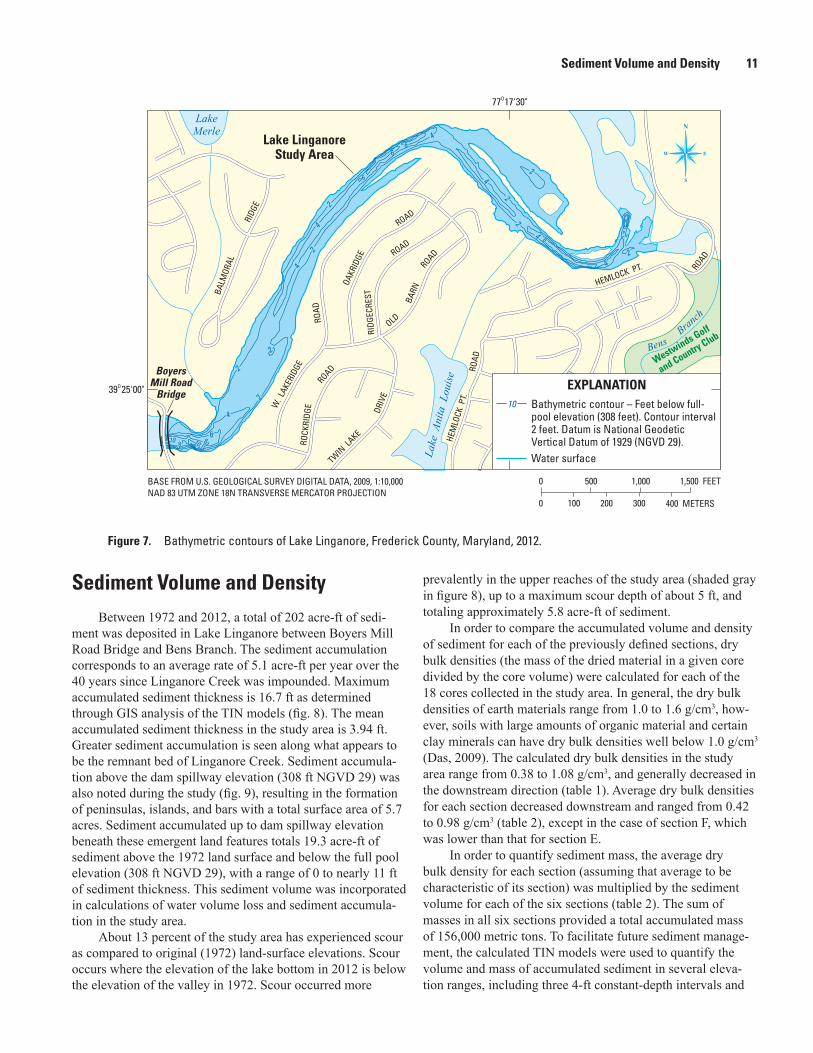
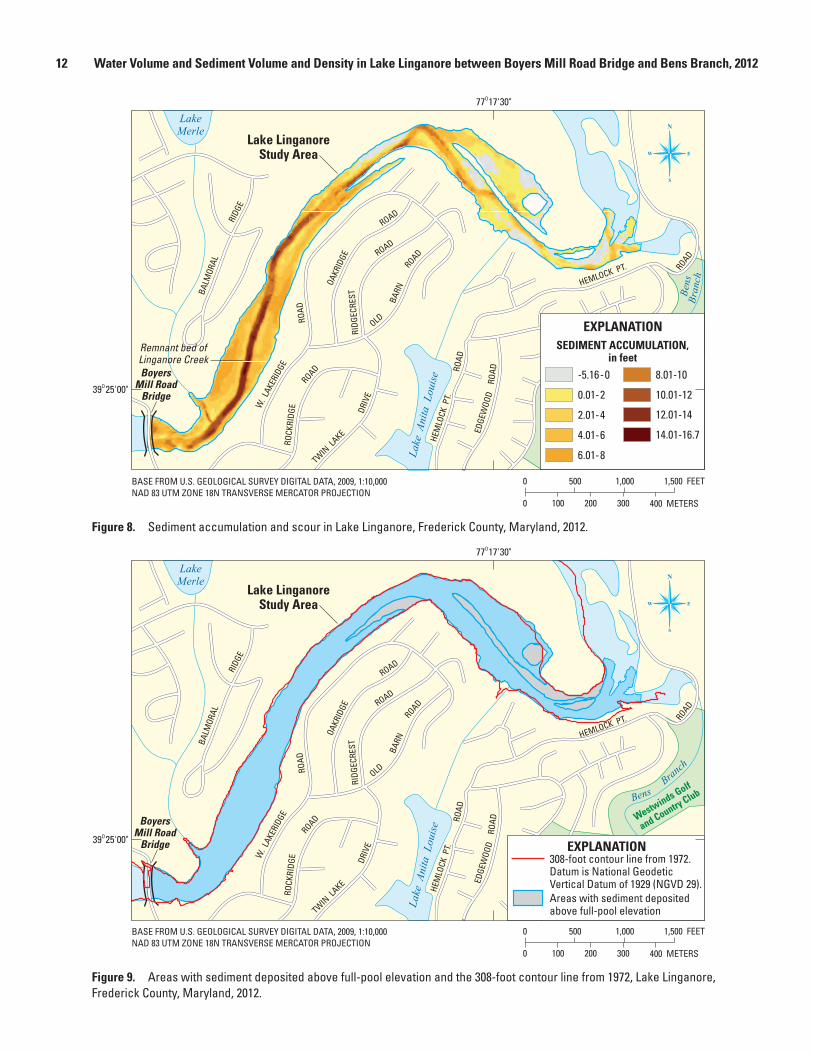
ment was deposited in Lake Linganore between Boyers Mill Road Bridge and Bens Branch. The sediment accumulation corresponds to an average rate of 5.1 acre-ft per year over the 40 years since Linganore Creek was impounded. Maximum accumulated sediment thickness is 16.7 ft as determined through GIS analysis of the TIN models (fig. 8). The mean accumulated sediment thickness in the study area is 3.94 ft. Greater sediment accumulation is seen along what appears to be the remnant bed of Linganore Creek. Sediment accumula-tion above the dam spillway elevation (308 ft NGVD 29) was also noted during the study (fig. 9), resulting in the formation of peninsulas, islands, and bars with a total surface area of 5.7 acres. Sediment accumulated up to dam spillway elevation beneath these emergent land features totals 19.3 acre-ft of sediment above the 1972 land surface and below the full pool elevation (308 ft NGVD 29), with a range of 0 to nearly 11 ft of sediment thickness. This sediment volume was incorporated in calculations of water volume loss and sediment accumula-tion in the study area.
About 13 percent of the study area has experienced scour as compared to original (1972) land-surface elevations. Scour occurs where the elevation of the lake bottom in 2012 is below the elevation of the valley in 1972. Scour occurred more
prevalently in the upper reaches of the study area (shaded gray in figure 8), up to a maximum scour depth of about 5 ft, and totaling approximately 5.8 acre-ft of sediment.
In order to compare the accumulated volume and density of sediment for each of the previously defined sections, dry bulk densities (the mass of the dried material in a given core divided by the core volume) were calculated for each of the 18 cores collected in the study area. In general, the dry bulk densities of earth materials range from 1.0 to 1.6 g/cm3, how-ever, soils with large amounts of organic material and certain clay minerals can have dry bulk densities well below 1.0 g/cm3 (Das, 2009). The calculated dry bulk densities in the study area range from 0.38 to 1.08 g/cm3, and generally decreased in the downstream direction (table 1). Average dry bulk densities for each section decreased downstream and ranged from 0.42 to 0.98 g/cm3 (table 2), except in the case of section F, which was lower than that for section E.
In order to quantify sediment mass, the average dry bulk density for each section (assuming that average to be characteristic of its section) was multiplied by the sediment volume for each of the six sections (table 2). The sum of masses in all six sections provided a total accumulated mass of 156,000 metric tons. To facilitate future sediment manage-ment, the calculated TIN models were used to quantify the volume and mass of accumulated sediment in several eleva-tion ranges, including three 4-ft constant-depth intervals and
12 Water Volume and Sediment Volume and Density in Lake Linganore between Boyers Mill Road Bridge and Bens Branch, 2012
Figure 8. Sediment accumulation and scour in Lake Linganore, Frederick County, Maryland, 2012.
Figure 9. Areas with sediment deposited above full-pool elevation and the 308-foot contour line from 1972, Lake Linganore, Frederick County, Maryland, 2012.

Comparison to Previous Study Results 13
a variable-depth interval from 296 ft NGVD 29 to the 1972 pre-inundation land surface (table 3). The uppermost depth layer, from the full-pool elevation of 308 ft to 304 ft NGVD 29, contained 67.5 acre-ft and 57,800 metric tons of sediment. The next layer, from 304 ft to 300 ft NGVD 29, contained the largest volume and mass of sediment—89.4 acre-ft and 67,800 metric tons, respectively. The third layer, from 300 ft to 296 ft NGVD 29, contained 34.7 acre-ft and 24,600 metric tons of sediment. The deepest layer extended from 296 ft NGVD 29 to the 1972 pre-inundation land surface and contained 10.4 acre-ft and 6,260 metric tons of sediment.
Comparison to Previous Study ResultsTo relate the results from Sekellick and Banks (2010)
to the current study, average sediment accumulation rates from both studies were used to calculate a combined water-storage capacity of the reservoir from the dam to Bens Branch. Sekellick and Banks (2010) showed that there was 1,860 acre-ft of water-storage capacity left in the reservoir between the dam and Boyers Mill Road Bridge in 2009, a 15.8-percent loss of storage capacity over 37 years—0.43 percent per year. Using this rate to account for sediment accumulation between 2009 and 2012 for the part of the lake between the dam and
Boyers Mill Road Bridge, and using the calculated sediment accumulation of 202 acre-ft between Boyers Mill Road Bridge and Bens Branch, the combined 2012 water volume of Lake Linganore from the dam to Bens Branch is 1,950 acre-ft. This is a 22.9-percent decrease from the lake’s original storage capacity, or a decrease of 576 acre-ft.
The study area discussed in this report, from Boyers Mill Road Bridge to Bens Branch, holds 5.6 percent of the water in Lake Linganore and contains nearly 60 percent of the sedi-ment accumulated since 1972. Sekellick and Banks (2010) noted that after dividing the lake between the dam and Boyers Mill Road Bridge into three equal-area sections, the most upstream section near Boyers Mill Road Bridge contained 22 percent of the water-storage volume and 45 percent of the sed-iment accumulated since 1972, whereas the most downstream section contained 46 percent of the water-storage volume and 27 percent of the sediment.
With the 576 acre-ft decrease in storage capacity between 1972 and 2012 from the dam to Bens Branch, the combined sedimentation rate for the 81.1-mi2 watershed (above the dam) is 0.18 acre-feet per year per square mile (acre-ft/yr/mi2). This is an increase of 0.08 acre-ft/yr/mi2 from the rate of 0.10 acre-ft/yr/mi2 that was calculated by using data collected between the dam and Boyers Mill Road Bridge (Sekellick and Banks, 2010).
Table 2. Sediment volume, average dry bulk density, and sediment mass by survey section, Lake Linganore, Frederick County, Maryland, 2012.
[acre-ft, acre-feet; g/cm3, grams per cubic centimeter]
Section (locations shown in
figure 5)Number of cores
Volume (acre-ft)
Average density (g/cm3)
Mass (metric tons)
A 2 30.3 0.42 15,900B 4 59.9 0.52 38,400C 4 38.5 0.58 27,500D 3 32.5 0.68 27,200E 3 35.0 0.98 42,300F 2 5.8 0.70 5,010
TOTAL 18 202 156,000
Table 3. Total sediment mass between topographic contours of Lake Linganore, Frederick County, Maryland, 2012.
[ft, feet; kg, kilogram; acre-ft, acre-feet]
Topographic contour (ft)
Mass (kg)
Mass (metric tons)
Volume (acre-ft)
308 to 304 57,800,000 57,800 67.5304 to 300 67,800,000 67,800 89.4300 to 296 24,600,000 24,600 34.7
296 to 1972 pre-inundation land surface 6,260,000 6,260 10.4
TOTAL 156,000,000 156,000 202
14 Water Volume and Sediment Volume and Density in Lake Linganore between Boyers Mill Road Bridge and Bens Branch, 2012
SummaryA water volume and sediment volume and density study
was performed in Lake Linganore, Maryland by the U.S. Geological Survey, in cooperation with the City of Frederick and Fredrick County, Maryland. The survey was conducted in order to calculate water volume and sediment accumula-tion in the lake so that the City of Frederick and Frederick County, Maryland can better manage their water resources. Bathymetric data points from Boyers Mill Road Bridge to Bens Branch, bounded by a shoreline digitized from ortho-photography (the study area), were collected to determine the elevation of the lake bottom. To determine the volume of sedi-ment accumulated since the construction of the dam in 1972, contour lines representing land-surface elevations prior to dam construction were digitized and a surface was created by using geographic information system (GIS) software. Current water and sediment volumes (as of 2012) were calculated by using triangulated irregular network (TIN) models and by compar-ing the current lake bottom to the pre-inundation topography. Sediment density was computed from 18 sediment cores col-lected along six transects. These data were used to calculate a total mass of sediment in the study area.
Water volume from Boyers Mill Road Bridge to Bens Branch is 110 acre-feet (acre-ft), which is 202 acre-ft (65 percent) less than the potential water-storage capacity as calculated from the 1972 contour lines. This decrease in water-storage capacity (202 acre-ft) represents the volume of sediment accumulated since 1972. Accumulated-sediment mass was calculated to be 156,000 metric tons.
AcknowledgmentsThe authors wish to thank Eric Boyd (USGS) who oper-
ated the support boat during data collection, as well as William Davies (USGS) who also provided support with electrical equipment and set-up. Lastly, special thanks are extended to Paul Pierce and Stephen Hembree of the Lake Linganore Association for their assistance on the lake.
References Cited
Blomqvist, Sven, 1985, Reliability of core sampling of soft bottom sediment—an in situ study: Sedimentology, v. 32, no. 4, p. 605–612, DOI: 10.1111/j.1365-3091.1985.tb00474.x.
Das, B.M., 2009, Principles of geotechnical engineering (25th ed.): Stanford, Connecticut, Cengage Learning, 671 p.
DiLisio, J.E., 1983, Maryland: A geography: Boulder, Colorado, Westview Press, Inc., 233 p.
Environmental Systems Research Institute, Inc., 2000, Using ArcGIS 3D Analyst: Redlands, California, ESRI Press, 261 p.
Federal Aviation Administration, 2006, Wide-area augmen-tation system performance analysis report: Report 17, accessed June 14, 2012 at http://www.nstb.tc.faa.gov/REPORTS/waaspan17.pdf.
Federal Geographic Data Committee, 1998, Geospatial positioning accuracy standards, Part 3: National standard for spatial data accuracy: Subcommittee for base carto-graphic data, Federal Geographic Data Committee, accessed March 10, 2010 at http://www.fgdc.gov/standards/projects/FGDC-standards-projects/accuracy/part3/chapter3.
Fry, J., Xian, G., Jin, S., Dewitz, J., Homer, C., Yang, L., Barnes, C., Herold, N., and Wickham, J., 2011, Completion of the 2006 National Land Cover Database for the Conterminous United States: Photogrammetric Engineering & Remote Sensing, v. 77, no. 9, p.858–864, accessed January 17, 2013 at http://www.mrlc.gov/nlcd2006.php.
Gellis, A.C., Hupp, C.R., Pavich, M.J., Landwehr, J.M., Banks, W.S.L., Hubbard, B.E., Langland, M.J., Ritchie, J.C., and Reuter, J.M., 2009, Sources, transport, and stor-age of sediment in the Chesapeake Bay Watershed: U.S. Geological Survey Scientific Investigations Report 2008–5186, 95 p. (also available online at http://pubs.usgs.gov/sir/2008/5186/).
Juracek, K.E., 1998, Analysis of lake-bottom sediment to esti-mate historical nonpoint-source phosphorus loads: Journal of the American Water Resources Association, v. 23, no. 6, p. 1,449–1,463.
Kress, W.H., Sebree, S.K., Littin, G.R., Drain, M.A., and Kling, M.E., 2005, Comparison of preconstruction and 2003 bathymetric and topographic survey of Lake McConaughy, Nebraska: U.S. Geological Survey Scientific Investigations Report 2005–5040, 19 p., 1 pl. (also available online at http://pubs.usgs.gov/sir/2005/5040/).
Maryland Department of the Environment, 2002, Total Maximum Daily Loads of phosphorus and sediments for Lake Linganore, Frederick County, MD: Maryland Department of the Environment, Final Report Submitted to U.S. Environmental Protection Agency, Region III, accessed March 10, 2010 at http://www.mde.state.md.us/assets/document/Linganore_eutro_final.pdf.
References Cited 15
Maryland iMap Portal, 2008, Maryland 6 Inch Imagery, accessed June 14, 2012 at http://mdimap.towson.edu/ArcGIS/rest/services/ImageryBaseMapsEarthCover/MD.State.6InchImagery/MapServer/0.
National Oceanic and Atmospheric Administration, 2006, National Weather Service Maryland Mid-Atlantic River Forecast Center (MARFC) average precipitation (inches), accessed June 16, 2012 at http://www.erh.noaa.gov/marfc/Climatology/mdppn.shtml.
Sekellick, A.J., and Banks, W.S.L., 2010, Water volume and sediment accumulation in Lake Linganore, Frederick County, Maryland, 2009: U.S. Geological Survey Scientific Investigations Report 2010–5174, 14 p. (also available online at http://pubs.usgs.gov/sir/2010/5174/).
Soler-López, L.R., 2008, Sedimentation survey of Lago La Plata, Puerto Rico, July 2006: U.S. Geological Survey Scientific Investigations Map 2008–3021, available online only at http://pubs.usgs.gov/sim/3021/.
U.S. Census Bureau, American Fact Finder, Frederick County, Maryland, 2011, accessed June 13, 2012 at http://quickfacts.census.gov/qfd/states/24/24021.html.
Van Metre, P.C., Wilson , J.T., Fuller, C.C., Callender, Edward, and Mahler, B.J., 2004, Collection, analysis, and age-dating of sediment cores from 56 U.S. lakes and reservoirs sampled by the U.S. Geological Survey, 1992–2001: U.S. Geological Survey Scientific Investigations Report 2004-5184, 180 p. (also available online at http://pubs.usgs.gov/sir/2004/5184/).
Wilson, G.L., and Richards, J.M., 2006, Procedural documen-tation and accuracy assessment of bathymetric maps and area/capacity tables for small reservoirs: U.S. Geological Survey Scientific Investigations Report 2006–5208, 24 p. (also available online at http://pubs.usgs.gov/sir/2006/5208/).


Prepared by USGS West Trenton Publishing Service Center.Edited by Valerie M. Gaine.Graphics and layout by Timothy W. Auer.
For additional information, contact:Director, MD-DE-DC Water Science CenterU.S. Geological Survey5522 Research Park DriveBaltimore, MD 21228
or visit our Web site at:http://md.water.usgs.gov

Sekellick, A.J., and others— W
ater Volume and Sedim
ent Volume and D
ensity in Lake Linganore between B
oyers Mill Road B
ridge and Bens B
ranch, Frederick County, Maryland, 2012—
Scientific Investigations Report 2013–5082
Printed on recycled paper