Embed Size (px)
Citation preview
7/31/2019 Water Utility and City Profiles
http://slidepdf.com/reader/full/water-utility-and-city-profiles 1/37
Water Utility andCity Profiles
3
7/31/2019 Water Utility and City Profiles
http://slidepdf.com/reader/full/water-utility-and-city-profiles 2/37
32 Water in Asian Cities
CHENGDU Utility Profile
Wat e r U t i l i t y CHENGDU MUN I CI PAL W ATER SUPPLY GENERAL COMPANY
Address : No.16 Twelve Bridge Street, Shu Du Road, Chengdu, Sichuan 610072, People’s Republicof China
Telephone : (86-28) 8778 7536Fax : (86-28) 8771 9403Head : Ding Baoquan, General Manager
The Chengdu Municipal Water Supply General Company (CMWSC) is a state-owned enterprise involved in
water production and distribution to the city’s urban population. The Generale des Eaux-Marubeni JointVenture Water Supply Company (CGE-M) produces 400,000 m3 of treated water per day and sells it toCMWSC under an agreement.
Genera l DataAbou t
Wat e r U t i l i t y
Connections : 50,077Staff : 1,691Annual O&M Costs : US$19,549,830Annual Revenue : US$38,940,170Annual Capital Expenditure : US$ 8,825,390Source of Investment Funds : no data
Wat e rResources
M anagem en t
Chengdu is one of 300 cities in the People’s Republic of China that have water shortage problems. The mainsource of Chengdu’s water supply is the Minjiang River. Water pollution and reduction in forest cover in the
upper reaches of the river have decreased the amount of water available, resulting in either reduced outputs(No. 2 and No. 5 waterworks) or closure (No. 3 and No. 4 waterworks) of water treatment plants. TheChengdu Government has issued laws and regulations for the protection and conservation of water suppliesincluding groundwater sources. It began a watershed rehabilitation project in 1998 that cost CNY566 million(US$68.4 million). It is also investing CNY2.7 billion (US$326 million) in the Shahe watershed rehabilitation,which started in November 2001. The city has plans to use treated wastewater effluent for car washing, toiletflushing, irrigation, and small fountains/waterfalls in new development areas.
Tar i f fS t r uc t u re
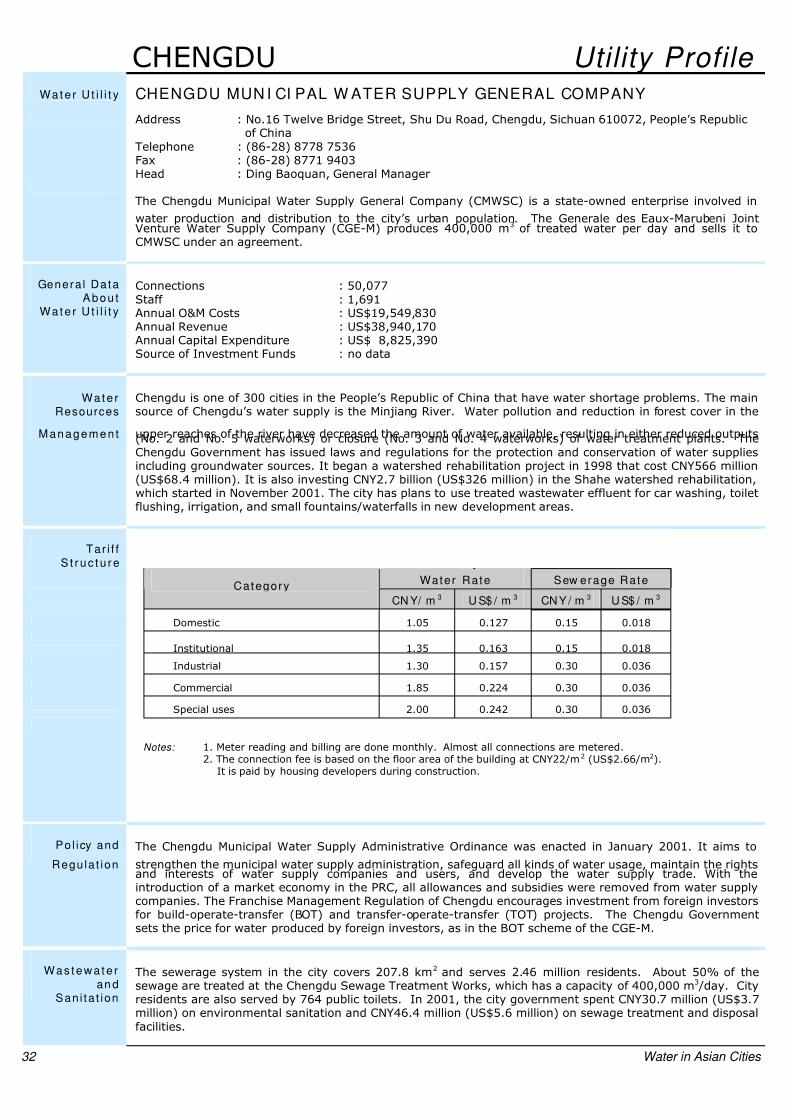
Water Rate Sew erage RateCategory
CN Y/ m 3 U S$ / m 3 CNY/ m 3 U S$ / m 3
Domestic 1.05 0.127 0.15 0.018
Institutional 1.35 0.163 0.15 0.018
Industrial 1.30 0.157 0.30 0.036
Commercial 1.85 0.224 0.30 0.036
Special uses 2.00 0.242 0.30 0.036
Notes: 1. Meter reading and billing are done monthly. Almost all connections are metered.2. The connection fee is based on the floor area of the building at CNY22/m2 (US$2.66/m2).
It is paid by housing developers during construction.
Pol icy and
Regula t ion
The Chengdu Municipal Water Supply Administrative Ordinance was enacted in January 2001. It aims to
strengthen the municipal water supply administration, safeguard all kinds of water usage, maintain the rightsand interests of water supply companies and users, and develop the water supply trade. With theintroduction of a market economy in the PRC, all allowances and subsidies were removed from water supplycompanies. The Franchise Management Regulation of Chengdu encourages investment from foreign investorsfor build-operate-transfer (BOT) and transfer-operate-transfer (TOT) projects. The Chengdu Governmentsets the price for water produced by foreign investors, as in the BOT scheme of the CGE-M.
Was t ewa t e ran d
Sani ta t ion
The sewerage system in the city covers 207.8 km2 and serves 2.46 million residents. About 50% of thesewage are treated at the Chengdu Sewage Treatment Works, which has a capacity of 400,000 m3 /day. Cityresidents are also served by 764 public toilets. In 2001, the city government spent CNY30.7 million (US$3.7million) on environmental sanitation and CNY46.4 million (US$5.6 million) on sewage treatment and disposalfacilities.
7/31/2019 Water Utility and City Profiles
http://slidepdf.com/reader/full/water-utility-and-city-profiles 3/37
CHENGDU 33
City Profile CHENGDU W ATER SUPPLY
P r oduct i on &D is t r i bu t i on
Population: 2,891,100 (2001)
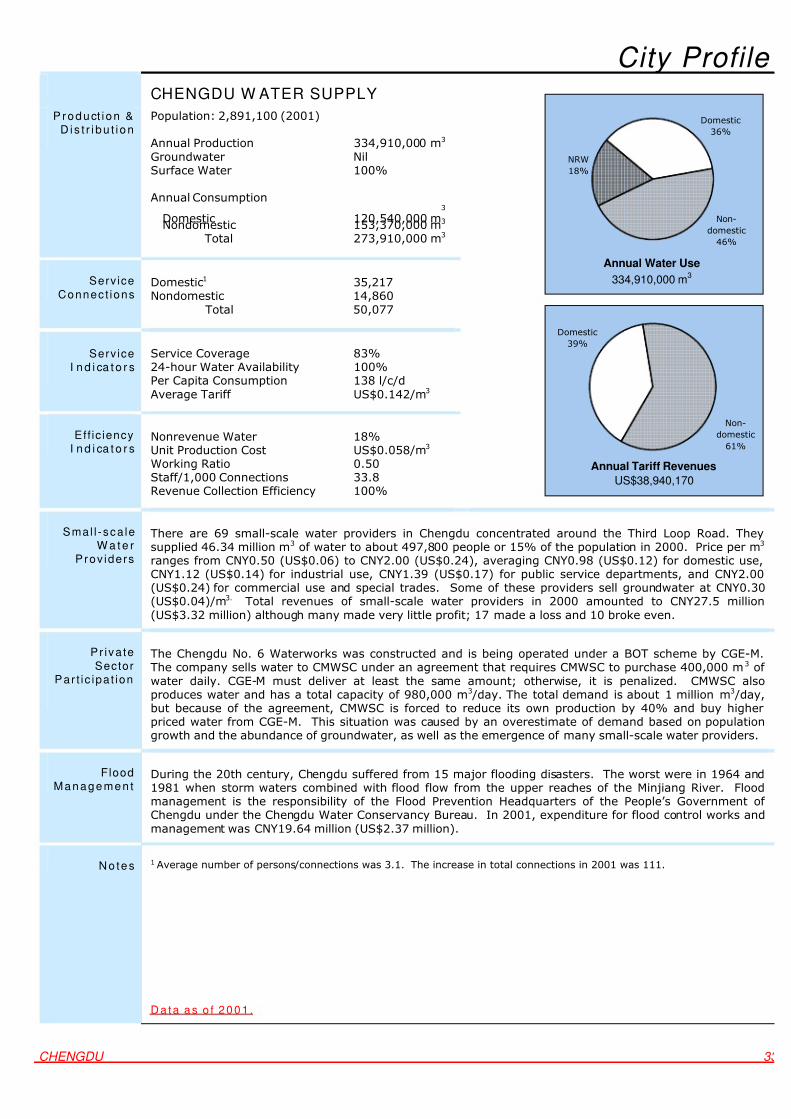
Annual Production 334,910,000 m3 Groundwater NilSurface Water 100%
Annual Consumption
Domestic 120,540,000 m3
Nondomestic 153,370,000 m3
Total 273,910,000 m3
Serv ice
Connec t ionsDomestic1 35,217Nondomestic 14,860
Total 50,077
Serv iceI n d i ca t o r s
Service Coverage 83%24-hour Water Availability 100%Per Capita Consumption 138 l/c/dAverage Tariff US$0.142/m3
Eff ic iencyI n d i ca t o r s
Nonrevenue Water 18%Unit Production Cost US$0.058/m3 Working Ratio 0.50Staff/1,000 Connections 33.8Revenue Collection Efficiency 100%
Non-
domestic
46%
NRW
18%
Domestic
36%
Annual Water Use
334,910,000 m3
Non-
domestic
61%
Domestic
39%
Annual Tariff Revenues
US$38,940,170
Smal l -sca leW a t e r
Prov iders
There are 69 small-scale water providers in Chengdu concentrated around the Third Loop Road. Theysupplied 46.34 million m3 of water to about 497,800 people or 15% of the population in 2000. Price per m3
ranges from CNY0.50 (US$0.06) to CNY2.00 (US$0.24), averaging CNY0.98 (US$0.12) for domestic use,CNY1.12 (US$0.14) for industrial use, CNY1.39 (US$0.17) for public service departments, and CNY2.00(US$0.24) for commercial use and special trades. Some of these providers sell groundwater at CNY0.30(US$0.04)/m3. Total revenues of small-scale water providers in 2000 amounted to CNY27.5 million(US$3.32 million) although many made very little profit; 17 made a loss and 10 broke even.
Pr iva te
SectorPar t ic ipa t ion
The Chengdu No. 6 Waterworks was constructed and is being operated under a BOT scheme by CGE-M.The company sells water to CMWSC under an agreement that requires CMWSC to purchase 400,000 m3 of water daily. CGE-M must deliver at least the same amount; otherwise, it is penalized. CMWSC alsoproduces water and has a total capacity of 980,000 m3 /day. The total demand is about 1 million m3 /day,but because of the agreement, CMWSC is forced to reduce its own production by 40% and buy higherpriced water from CGE-M. This situation was caused by an overestimate of demand based on populationgrowth and the abundance of groundwater, as well as the emergence of many small-scale water providers.
FloodManagemen t
During the 20th century, Chengdu suffered from 15 major flooding disasters. The worst were in 1964 and1981 when storm waters combined with flood flow from the upper reaches of the Minjiang River. Floodmanagement is the responsibility of the Flood Prevention Headquarters of the People’s Government of Chengdu under the Chengdu Water Conservancy Bureau. In 2001, expenditure for flood control works andmanagement was CNY19.64 million (US$2.37 million).
N otes 1 Average number of persons/connections was 3.1. The increase in total connections in 2001 was 111.
D ata as o f 2001 .
7/31/2019 Water Utility and City Profiles
http://slidepdf.com/reader/full/water-utility-and-city-profiles 4/37
34 Water in Asian Cities
COLOMBO Utility Profile
Wat e r U t i l i t y NATI ONAL W ATER SUPPLY AND DRAI NAGE BOARD
Address : P O Box 14, Mount Lavinia, Sri LankaTelephone : (94-11) 263 6449Fax : (94-11) 263 6449E-mail : [email protected] : M. Wickramage, General Manager
The National Water Supply and Drainage Board (NWSDB), a government corporation formed in 1975,manages Sri Lanka’s water supply, drainage, and sewerage where local authorities are unable to do so. TheCity of Colombo, which is governed by the Colombo Municipal Council (CMC), is part of the Greater ColomboWater Supply Area.
Genera l Dat aAbou t
Wat e r U t i l i t y
Connections : 86,586Staff : 656Annual O&M Costs : US$ 5,224,000Annual Revenue : US$10,102,000Annual Capital Expenditure : US$ 729,940Source of Investment Funds : no data
Wat e rResources
M anagem en t
The Greater Colombo Area is primarily supplied from the Labugama and Kalatuwawa impounding reservoirsand the Ambatale head works on the Kelani River. The use of groundwater is very limited. Although theriver flow at Ambatale is sufficient for the present requirement of 500,000 m3 /day, low tide during low flowperiods may cause the river water level to fall below the intake level and high tide may bring in saline water.The high proportion of nonrevenue water in the Greater Colombo Area (47%), especially in Colombo City,raises the prospect of severe water shortages after 2003.
Tar i f f
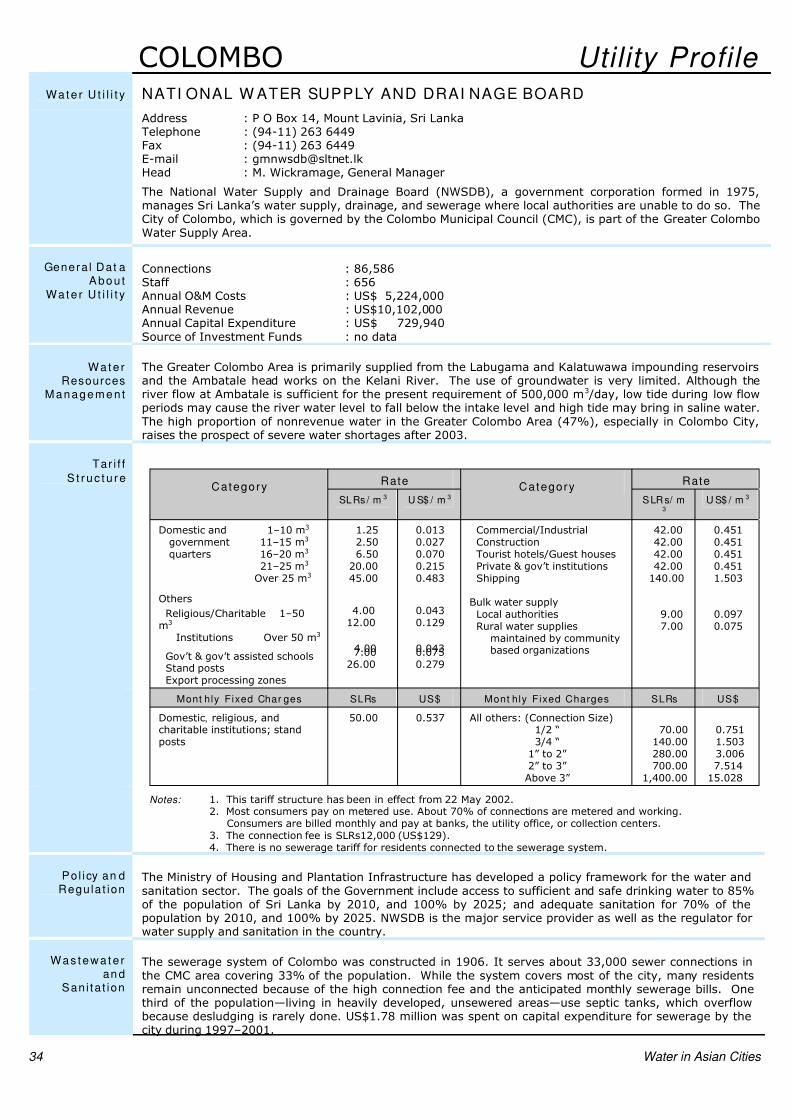
S t r uc t u re Rate Rate Category
SLRs/ m 3 U S$ / m 3
CategorySLRs/ m
3U S$ / m 3
Domestic and 1–10 m3
government 11–15 m3
quarters 16–20 m3
21–25 m3
Over 25 m3
Others
Religious/Charitable 1–50m3
Institutions Over 50 m3
Gov’t & gov’t assisted schoolsStand postsExport processing zones
1.252.506.50
20.0045.00
4.0012.00
4.007.0026.00
0.0130.0270.0700.2150.483
0.0430.129
0.0430.0750.279
Commercial/IndustrialConstructionTourist hotels/Guest housesPrivate & gov’t institutionsShipping
Bulk water supplyLocal authoritiesRural water supplies
maintained by communitybased organizations
42.0042.0042.0042.00
140.00
9.007.00
0.4510.4510.4510.4511.503
0.0970.075
Mont hly Fixed Char ges SLRs US$ Mont hly Fixed Charges SLRs US$
Domestic, religious, andcharitable institutions; standposts
50.00 0.537 All others: (Connection Size)1/2 “3/4 “
1” to 2” 2” to 3” Above 3”
70.00140.00280.00700.00
1,400.00
0.7511.5033.0067.514
15.028
Notes: 1. This tariff structure has been in effect from 22 May 2002.2. Most consumers pay on metered use. About 70% of connections are metered and working.
Consumers are billed monthly and pay at banks, the utility office, or collection centers.3. The connection fee is SLRs12,000 (US$129).4. There is no sewerage tariff for residents connected to the sewerage system.
Pol icy an dRegula t ion
The Ministry of Housing and Plantation Infrastructure has developed a policy framework for the water andsanitation sector. The goals of the Government include access to sufficient and safe drinking water to 85%of the population of Sri Lanka by 2010, and 100% by 2025; and adequate sanitation for 70% of thepopulation by 2010, and 100% by 2025. NWSDB is the major service provider as well as the regulator forwater supply and sanitation in the country.
Was t ewa t e ran d
Sani ta t ion
The sewerage system of Colombo was constructed in 1906. It serves about 33,000 sewer connections inthe CMC area covering 33% of the population. While the system covers most of the city, many residentsremain unconnected because of the high connection fee and the anticipated monthly sewerage bills. Onethird of the population—living in heavily developed, unsewered areas—use septic tanks, which overflowbecause desludging is rarely done. US$1.78 million was spent on capital expenditure for sewerage by thecity during 1997–2001.

7/31/2019 Water Utility and City Profiles
http://slidepdf.com/reader/full/water-utility-and-city-profiles 5/37
7/31/2019 Water Utility and City Profiles
http://slidepdf.com/reader/full/water-utility-and-city-profiles 6/37
36 Water in Asian Cities
DELHI Utility Profile
Wat e r U t i l i t y DELHI JAL BOARD
Address : Varunalaya Phase II, Jhandewalan, Karol Bagh, New Delhi 110005, IndiaTelephone : (91-11) 354 4795Fax : (91-11) 355 8940, 351 6182E-mail : [email protected] : P. K. Tripathi, Chief Executive Officer
The Delhi Jal Board (DJB) is a statutory body created under the Delhi Jal Board Act of 1998. It is responsible
for production and distribution of potable water and for treatment and disposal of wastewater for the city’spopulation of nearly 14 million people. The utility buys raw water from the Uttar Pradesh Irrigation Board andthe Bhakra Beas Management Board. DJB provides bulk water to the New Delhi Municipal Corporation (NDMC)and the Cantonment Board for distribution in their respective areas.
Genera l DataAbou t
Wat e r U t i l i t y
Connections : 1,374,622Staff : 27,321Annual O&M Costs : US$ 88,314,650Annual Revenue : US$ 36,042,240Annual Capital Expenditure : US$107,206,930Source of Investment Funds : 48% government loan; 24% revenues; 7% grant; 21% others
Wat e rResources
M anagem en t
Delhi draws water from the Yamuna River at Munak in Haryana State about 100 km from the city, and fromthe Ganges River at Muradnagar in Uttar Pradesh 32 km from the city. Water is also drawn from tubewellsnear the Yamuna flood plain and the Ranney wells in the south. Raw water from the rivers is of adequatequality and is treated and distributed by DJB from its 6 water treatment plants. Because Delhi is largelydependent on other states and outside sources of raw water, and groundwater extraction is limited, DJB hastaken the following measures: tapping groundwater along the Yamuna River floodplain, nonrevenue waterreduction by metering, mandating rainwater harvesting structures in large buildings, recycling of wastewater,and promoting water conservation through public awareness campaigns.
Tar i f fS t r uc t u re
Category Rate
Met e red Consumpt i on Rs/ m 3 U S$ / m 3
Domestic 0–10 m3
11–20 m3
21–30 m3
Over 30 m3
0.351.001.503.00
0.0070.0210.0310.062
Commercial 0–50 m3
Over 50 m35.00
10.000.1040.208
Industrial 0–50 m3
51–100 m3
Over 100 m3
8.0012.0016.00
0.1660.2490.332
Unmet e red (F l a t ) Rat e
Domestic Rs30 (US$0.62)/month
Commercial Rs150 (US$3.11 /month
Industrial Rs450 (US$9.34)/month
Notes: 1. This tariff structure has been in effect from January 2001.2. Most of the connections are unmetered except those in the NDMC area; hence, consumption is
at best an estimate or is assessed on flat rates. The connection fee is Rs100 (US$2.08).
3. There are no specific sewerage charges in tariffs, but a 50% surcharge is collected ostensibly for sewerage.
Pol icy andRegula t ion
The Government of Delhi is considering the establishment of a regulator for the sector. This follows thesuccessful establishment of an electricity regulator associated with the recent privatization of electricitydistribution in the city. An initial proposal for the electricity regulator to regulate water supply was notaccepted. Legislation for the establishment of a water supply regulator is being drafted.
Was t ewa t e ran d
Sani ta t ion
DJB estimates that around 60% of the city population have access to sewerage facilities. Residents of areasnot served by sewers use septic tanks. Slums are primarily served by mobile trailer-mounted latrines that aremaintained by the Slum Wing of the municipal corporation. The capacity of the wastewater treatment plantwas increased from 284 million gallons per day (mgd) in 1995 to 482 mgd in 2001. This is expected toincrease to 512 mgd when construction of the 16 sewage treatment plants is completed. Investment insewerage during 1997–2001 was Rs6.56 billion (US$136 million).
7/31/2019 Water Utility and City Profiles
http://slidepdf.com/reader/full/water-utility-and-city-profiles 7/37
City Profile
DELHI W ATER SUPPLY
Produc t ion &D is t r i bu t i on
Population: 13,783,000 (2001)
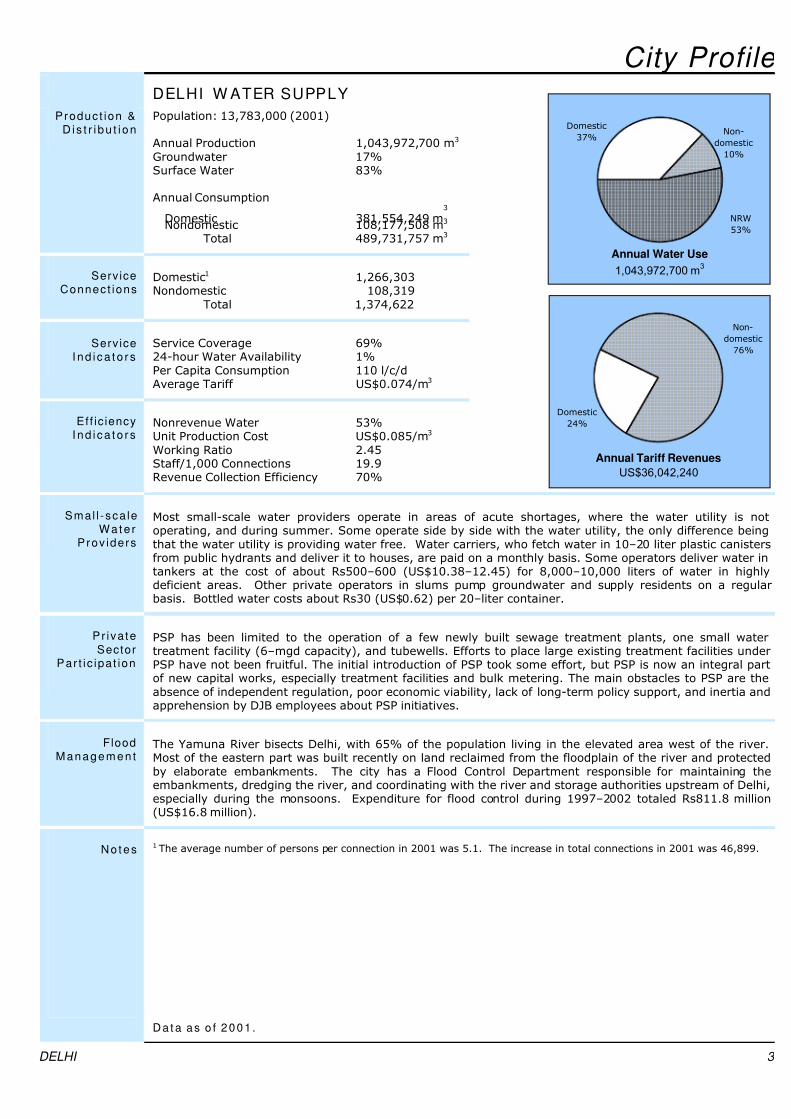
Annual Production 1,043,972,700 m3
Groundwater 17%Surface Water 83%
Annual Consumption
Domestic 381,554,249 m3
Nondomestic 108,177,508 m3
Total 489,731,757 m3
ServiceConnect ions
Domestic1 1,266,303Nondomestic 108,319
Total 1,374,622
ServiceI nd i ca t o r s
Service Coverage 69%24-hour Water Availability 1%Per Capita Consumption 110 l/c/dAverage Tariff US$0.074/m3
Eff ic iencyI nd i ca t o r s
Nonrevenue Water 53%Unit Production Cost US$0.085/m3
Working Ratio 2.45Staff/1,000 Connections 19.9Revenue Collection Efficiency 70%
Non-
domestic
10%
NRW
53%
Domestic
37%
Annual Water Use
1,043,972,700 m3
Domestic
24%
Non-
domestic
76%
Annual Tariff Revenues
US$36,042,240
Smal l -sca leWat e r
Prov iders
Most small-scale water providers operate in areas of acute shortages, where the water utility is notoperating, and during summer. Some operate side by side with the water utility, the only difference beingthat the water utility is providing water free. Water carriers, who fetch water in 10–20 liter plastic canistersfrom public hydrants and deliver it to houses, are paid on a monthly basis. Some operators deliver water intankers at the cost of about Rs500–600 (US$10.38–12.45) for 8,000–10,000 liters of water in highlydeficient areas. Other private operators in slums pump groundwater and supply residents on a regularbasis. Bottled water costs about Rs30 (US$0.62) per 20–liter container.
Pr ivateSector
Par t ic ipat ion
PSP has been limited to the operation of a few newly built sewage treatment plants, one small watertreatment facility (6–mgd capacity), and tubewells. Efforts to place large existing treatment facilities underPSP have not been fruitful. The initial introduction of PSP took some effort, but PSP is now an integral partof new capital works, especially treatment facilities and bulk metering. The main obstacles to PSP are theabsence of independent regulation, poor economic viability, lack of long-term policy support, and inertia andapprehension by DJB employees about PSP initiatives.
FloodM anagem en t
The Yamuna River bisects Delhi, with 65% of the population living in the elevated area west of the river.Most of the eastern part was built recently on land reclaimed from the floodplain of the river and protectedby elaborate embankments. The city has a Flood Control Department responsible for maintaining theembankments, dredging the river, and coordinating with the river and storage authorities upstream of Delhi,especially during the monsoons. Expenditure for flood control during 1997–2002 totaled Rs811.8 million(US$16.8 million).
Not es 1 The average number of persons per connection in 2001 was 5.1. The increase in total connections in 2001 was 46,899.
Dat a as o f 2001 .
DELHI 3
7/31/2019 Water Utility and City Profiles
http://slidepdf.com/reader/full/water-utility-and-city-profiles 8/37
38 Water in Asian Cities
DHAKA Utility Profile Wat e r U t i l i t y DHA KA W ATER SUPPLY AND SEW ERAGE AUTHORI TY
Address : 98 Kazi Nazrul Islam Avenue, Kawran Bazar, Dhaka-1215, BangladeshTelephone : (880-2) 811 6792Fax : (880-2) 811 2109E-mail : [email protected] : A. N. H. Akhtar Hussain, Managing Director
The Dhaka Water Supply and Sewerage Authority (DWASA) is a government corporation established in 1963
to take over the responsibility for water supply and sewerage services in Dhaka and the nearby city of Narayanganj from the Department of Public Health Engineering. It was reconstituted in 1996 to run on acommercial basis and was made the sole authority to plan, develop, and maintain the water supply andsewerage and drainage facilities in the city.
Genera l DataAbou t
Wat e r U t i l i t y
Connections : 185,866Staff : 2,151Annual O&M Costs : US$13,000,000Annual Revenue : US$14,660,000Annual Capital Expenditure : US$26,005,790Source of Investment Funds : 46% government grant; 22% foreign loan; 31% foreign grant;
1% tariff
Wat e r
ResourcesM anagem en t
DWASA supplies 1,300 million liters per day (mld) of the estimated water demand of 1,600 mld; most of the
supply is from deep tubewells. This huge abstraction of groundwater has resulted in lowering of thegroundwater table at an alarming rate. The Government recently harnessed surface water with thecommissioning of a 225 mld capacity water treatment plant. Rainwater harvesting is also being promoted tomeet a part of the water demand. Steps are being taken to protect the raw water quality of the nearestsurface water sources, the Buriganga and Shitalakhya rivers. The Department of Environment hasestablished 6 monitoring stations on the rivers around Dhaka to monitor surface water quality and at anumber of points to monitor wastewater.
Tar i f fS t r uc t u re
Category Rate
M e t er e d Tk / m 3 U S$ / m 3
Domestic 4.50 0.079
Commercial and industrial 15.00 0.263
Unmet e red
Domestic and community 29.0% of valuation of holding per annum
Commercial and industrial 29.5% of valuation of holding per annum
Notes: 1. About 51% of connections have meters that are working.2. Billing is done monthly and consumers pay through banks.3. Connection fees are Tk1,650 (US$28.95) for 18 mm and Tk3,442 (US$60.39) for
25 mm pipes, respectively.4. Sewerage charge is 100% of the water bill for connected users.
Pol icy andRegula t ion
The Government framed a National Policy for Safe Water Supply and Sanitation in 1998 to improve thestandard of public health and the environment. The policy made water supply and sewerage authoritiesresponsible for providing safe drinking water in urban areas including slums and squatter settlements, settingtariffs, reducing nonrevenue water, and promoting PSP and NGO participation in water supply activities.Tariffs can be reviewed yearly but adjustments can only be made every 5 years, subject to governmentapproval. At a workshop in 2001, there was consensus for the establishment of a national regulatory bodythat would comprise representatives from government, local bodies, national professional agency, waterproviders, consumers’ association, engineering university, and lawyers’ council. However, no appreciableprogress has been made toward forming this regulatory body.
Was t ewa t e ran d
Sani ta t ion
The existing sanitation facilities of Dhaka are insufficient. Only about 30% of the city’s population areconnected to the sewerage system. Some households not connected to the system use septic tanks that aredesludged manually. Others dispose of wastewater through surface drains, or in low-lying areas, naturaldrains, or water bodies that find their way to storm sewers. Indiscriminate disposal of untreated industrialeffluent to rivers is common. Laws to prevent environmental pollution are not enforced. Investment in thissector during 1997–2001 was Tk456 million (US$8 million).
7/31/2019 Water Utility and City Profiles
http://slidepdf.com/reader/full/water-utility-and-city-profiles 9/37
City Profile
DHAKA WATER SUPPLY
Population1: 10,358,000 (2001)Produc t ion &D is t r i bu t i on
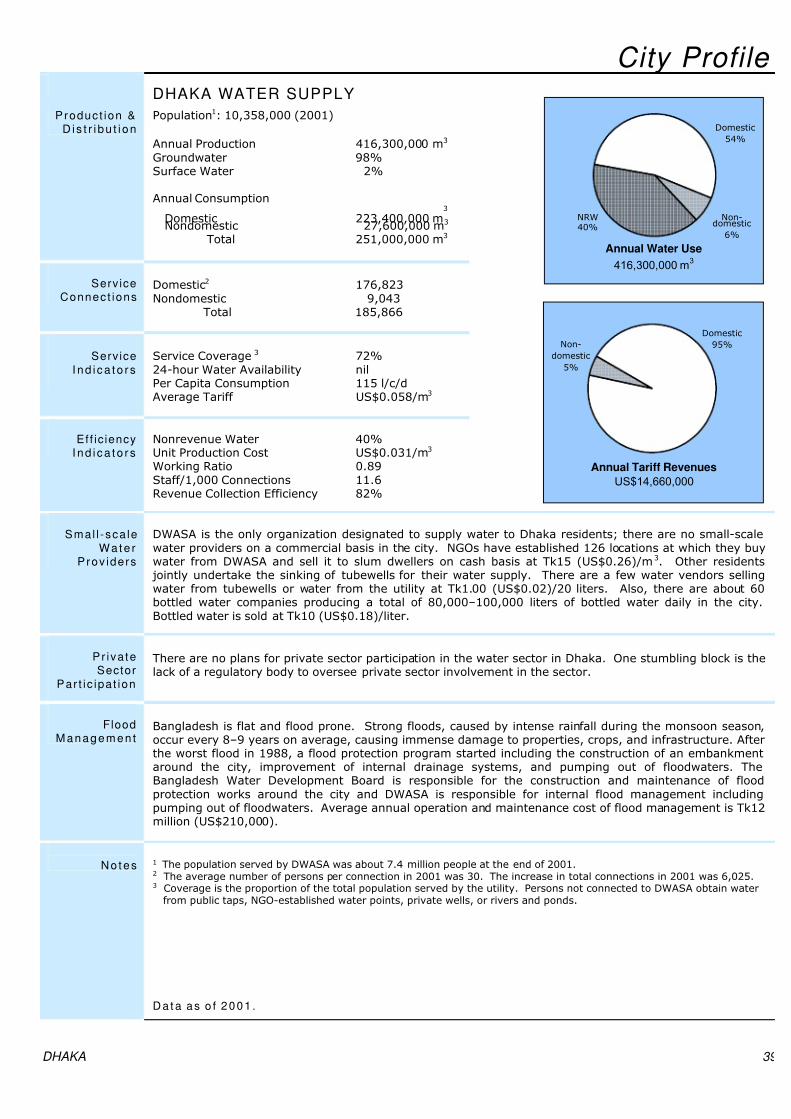
Annual Production 416,300,000 m3
Groundwater 98%Surface Water 2%
Annual Consumption
Domestic 223,400,000 m3
Nondomestic 27,600,000 m3
Total 251,000,000 m3
ServiceConnect ions
Domestic2 176,823Nondomestic 9,043
Total 185,866
ServiceI nd i ca t o r s
Service Coverage 3 72%24-hour Water Availability nilPer Capita Consumption 115 l/c/dAverage Tariff US$0.058/m3
Eff ic iencyI nd i ca t o r s
Nonrevenue Water 40%Unit Production Cost US$0.031/m3
Working Ratio 0.89Staff/1,000 Connections 11.6Revenue Collection Efficiency 82%
Non-domestic
6%
NRW40%
Domestic
54%
Annual Water Use
416,300,000 m3
Non-
domestic
5%
Domestic
95%
Annual Tariff Revenues
US$14,660,000
Smal l -sca leWat e r
Prov iders
DWASA is the only organization designated to supply water to Dhaka residents; there are no small-scalewater providers on a commercial basis in the city. NGOs have established 126 locations at which they buywater from DWASA and sell it to slum dwellers on cash basis at Tk15 (US$0.26)/m 3. Other residents
jointly undertake the sinking of tubewells for their water supply. There are a few water vendors sellingwater from tubewells or water from the utility at Tk1.00 (US$0.02)/20 liters. Also, there are about 60bottled water companies producing a total of 80,000–100,000 liters of bottled water daily in the city.Bottled water is sold at Tk10 (US$0.18)/liter.
Pr ivateSector
Par t ic ipat ion
There are no plans for private sector participation in the water sector in Dhaka. One stumbling block is thelack of a regulatory body to oversee private sector involvement in the sector.
FloodM anagem en t
Bangladesh is flat and flood prone. Strong floods, caused by intense rainfall during the monsoon season,occur every 8–9 years on average, causing immense damage to properties, crops, and infrastructure. Afterthe worst flood in 1988, a flood protection program started including the construction of an embankmentaround the city, improvement of internal drainage systems, and pumping out of floodwaters. TheBangladesh Water Development Board is responsible for the construction and maintenance of floodprotection works around the city and DWASA is responsible for internal flood management includingpumping out of floodwaters. Average annual operation and maintenance cost of flood management is Tk12million (US$210,000).
Not es 1 The population served by DWASA was about 7.4 million people at the end of 2001.2 The average number of persons per connection in 2001 was 30. The increase in total connections in 2001 was 6,025.3 Coverage is the proportion of the total population served by the utility. Persons not connected to DWASA obtain water
from public taps, NGO-established water points, private wells, or rivers and ponds.
Dat a as o f 2001 .
DHAKA 39
7/31/2019 Water Utility and City Profiles
http://slidepdf.com/reader/full/water-utility-and-city-profiles 10/37
40 Water in Asian Cities
HO CHI MINH CITY Utility Profile Wat e r U t i l i t y HO CHI MI NH CI TY WATER SUPPLY COMPANY
Address : 1 Cong Truong Quoc Te, District 3, Ho Chi Minh City, VietnamTelephone : (84-8) 829 1777, 829 1974Fax : (84-8) 824 1644E-mail : [email protected] : Vo Dung, Director
The Ho Chi Minh City (HCMC) Water Supply Company (WSC) is a government enterprise formed in 1966. It
is under the city’s Department of Transportation and Public Works. WSC manages the water supply systemof HCMC’s 17 urban and 5 rural districts, which have a population of about 5.3 million.
Genera l DataAbou t
Wat e r U t i l i t y
Connections : 332,336Staff : 1,147Annual O&M Costs : US$39,622,500Annual Revenue : US$35,683,770Annual Capital Expenditure : US$23,876,360Source of Investment Funds : no data
Wat e rResources
M anagem en t
HCMC is in the northeastern part of the Mekong Delta in the downstream regions of the Sai Gon and theDong Nai river basins. The Dong Nai River is the main water supply source for HCMC. This supply isaugmented by the Sai Gon River, especially for the old urban districts. Groundwater is the primary sourcefor drinking water outside the old districts, particularly in the northern half of the city and new developmentareas. There are plans to double the amount of water to be drawn from the two rivers by 2010 and up tothree times the present amount by 2020.
Tar i f fS t r uc t u re
Rate
CategoryD/ m 3 U S$ / m 3
Domes t i c
0–4 m3 /capita/month4–6 m3 /capita/month6–10 m3 /capita/monthAbove 10 m3 /capita/month
1,7002,5003,2004,000
0.1130.1660.2120.265
Admi n i s t ra t i on and Pub l i c Organ i za t i on
0–1 m3 /capita/month
Above 1 m3
/capita/month
2,200
3,000
0.146
0.199
I n d u s t r i e s 4,000 0.265
Business and Serv ice 6,500 0.431
W at er Supp l y by W at e r T ruck 10,000 0.663
Notes: 1. All consumers pay on metered use. They are billed monthly and pay at designated banks, at utility offices, orto bill collectors.
2. Tariff setting aims at full cost recovery with profit including sufficient counterpart funds for project loans andcontingencies for cost escalation and reserves for long-term development.
3. The connection fee is D800,000 (US$53.00)–1,200,000 (US$80.00) payable in advance.
Pol icy andRegula t ion
The Ministry of Construction’s national water supply strategy study, begun in December 1994, recommendedservice level targets based on a national water supply policy that conformed to the general policy guidelines
on economic development set by the Government. Ministerial decisions in late 1998 and early 1999 set outgeneral planning parameters for HCMC in terms of total and per capita water demands for 2010 and 2020.The decisions gave guidelines on urban water supply management and development including water losstargets and human resources development. Surface water allocation is administered by the Ministry of Irrigation. Groundwater regulation is the responsibility of the Ministry of Heavy Industry. The Ministry of Health is responsible for regulating drinking water quality, and wastewater quality and pollution control areenforced by the Ministry of Science, Technology, and Environment.
Was t ewa t e ran d
Sani ta t ion
The sewerage system in HCMC is combined with the storm drainage system and covers about 12% of thecity. Coverage is particularly low in the new urban (1.0%) and rural districts (0.3%), which comprise about73% of the city’s total area. The old urban districts have coverage of 42%. About 79% of households inHCMC discharge their waste in septic tanks.
7/31/2019 Water Utility and City Profiles
http://slidepdf.com/reader/full/water-utility-and-city-profiles 11/37
City Profile
HO CHI MI NH CI TY WATER SUPPLY
Produc t ion &D is t r i bu t i on
Population1: 5,285,454 (2001)
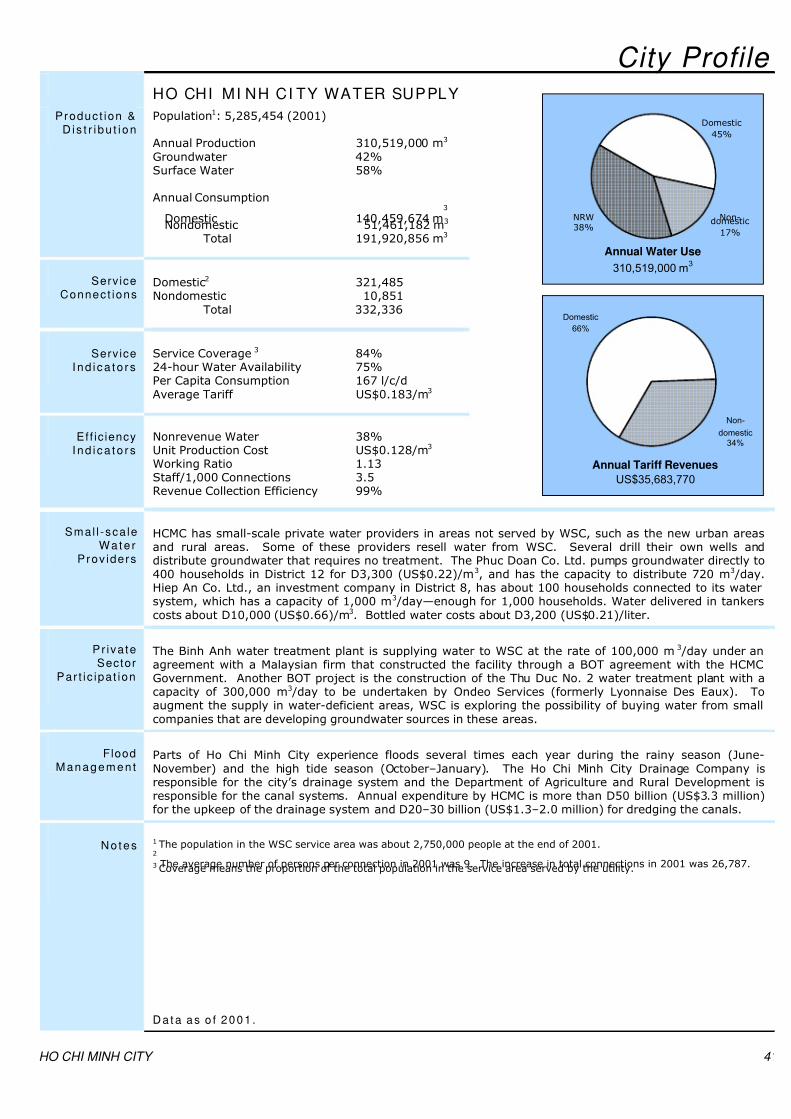
Annual Production 310,519,000 m3
Groundwater 42%Surface Water 58%
Annual Consumption
Domestic 140,459,674 m3
Nondomestic 51,461,182 m3
Total 191,920,856 m3
ServiceConnect ions
Domestic2 321,485Nondomestic 10,851
Total 332,336
ServiceI nd i ca t o r s
Service Coverage 3 84%24-hour Water Availability 75%Per Capita Consumption 167 l/c/dAverage Tariff US$0.183/m3
Eff ic iencyI nd i ca t o r s
Nonrevenue Water 38%Unit Production Cost US$0.128/m3
Working Ratio 1.13Staff/1,000 Connections 3.5Revenue Collection Efficiency 99%
Non-domestic
17%
NRW38%
Domestic
45%
Annual Water Use
310,519,000 m3
Annual Tariff Revenues
US$35,683,770
Domestic
66%
Non-
domestic
34%
Smal l -sca leWat e r
Prov iders
HCMC has small-scale private water providers in areas not served by WSC, such as the new urban areasand rural areas. Some of these providers resell water from WSC. Several drill their own wells anddistribute groundwater that requires no treatment. The Phuc Doan Co. Ltd. pumps groundwater directly to400 households in District 12 for D3,300 (US$0.22)/m3, and has the capacity to distribute 720 m3 /day.Hiep An Co. Ltd., an investment company in District 8, has about 100 households connected to its watersystem, which has a capacity of 1,000 m3 /day—enough for 1,000 households. Water delivered in tankerscosts about D10,000 (US$0.66)/m3. Bottled water costs about D3,200 (US$0.21)/liter.
Pr ivateSector
Par t ic ipat ion
The Binh Anh water treatment plant is supplying water to WSC at the rate of 100,000 m 3 /day under anagreement with a Malaysian firm that constructed the facility through a BOT agreement with the HCMCGovernment. Another BOT project is the construction of the Thu Duc No. 2 water treatment plant with acapacity of 300,000 m3 /day to be undertaken by Ondeo Services (formerly Lyonnaise Des Eaux). Toaugment the supply in water-deficient areas, WSC is exploring the possibility of buying water from smallcompanies that are developing groundwater sources in these areas.
FloodM anagem en t
Parts of Ho Chi Minh City experience floods several times each year during the rainy season (June-November) and the high tide season (October–January). The Ho Chi Minh City Drainage Company isresponsible for the city’s drainage system and the Department of Agriculture and Rural Development isresponsible for the canal systems. Annual expenditure by HCMC is more than D50 billion (US$3.3 million)for the upkeep of the drainage system and D20–30 billion (US$1.3–2.0 million) for dredging the canals.
Not es 1 The population in the WSC service area was about 2,750,000 people at the end of 2001.2
The average number of persons per connection in 2001 was 9. The increase in total connections in 2001 was 26,787.3 Coverage means the proportion of the total population in the service area served by the utility.
Dat a as o f 2001 .
HO CHI MINH CITY 41
7/31/2019 Water Utility and City Profiles
http://slidepdf.com/reader/full/water-utility-and-city-profiles 12/37
42 Water in Asian Cities
HONG KONG Utility Profile
Wat e r U t i l i t y W ATER SUPPLI ES DEPARTMENT
Address : 48/F Immigration Tower, 7 Gloucester Road, Wanchai, Hong Kong, ChinaTelephone : (85-2) 2829 4500Fax : (85-2) 2824 0578E-mail : [email protected] : William G. C. Ko, Director
The Water Supplies Department (WSD) of the Government of Hong Kong Special Administrative Region of the People’s Republic of China (Government of the HKSAR) is tasked with developing and managing waterservices for the city. The utility, which dates back to 1863, buys about 78% of its water supply frommainland People’s Republic of China, treats the water, and distributes it to the urban population of 6,865,600people. It also distributes seawater for flushing purposes.
Genera l DataAbou t
Wat e r U t i l i t y
Connections : 2,430,000Staff : 5,673Annual O&M Costs : US$794,151,600Annual Revenue : US$329,870,460Annual Capital Expenditure : US$279,466,460Source of Investment Funds : 100% government grant
Wat e rResources
M anagem en t
Since 1960, the Government of the HKSAR has made agreements with Guangdong authorities for the supplyof raw water from the East River. In 2001, this river contributed about 78% of the water supply; rainwater,impounded in 120 km of channels and 17 reservoirs, supplied the remaining 22%. The freshwater supply is
supplemented by a unique seawater supply system, which saves about 20% of freshwater needs.
Tar i f fS t r uc t u re
Rat e ( 4 -m on t h pe r iod )Category
H K$ / m 3 US$ / m 3
Domes t i c
First 12 m3
Next 31 m3
Next 19 m3
Remainder
Free4.166.459.05
Free0.5340.8271.161
Nondomes t i c
TradeConstructionShipping
Ocean goingNonocean going
4.587.11
10.934.58
0.5870.912
1.4020.587
Flushing WaterFirst 30 m3
RemainderFree4.58
Free0.587
Notes: 1. This tariff structure has been in effect since 16 February 1995.2. Charges are for 4-month periods. Flushing water is billed separately to registered customers.3. All consumers pay on metered use and most are billed every 4 months; large consumers are billed monthly.4. Consumers pay at banks, post offices, automated teller machines, the utility office or at government
collection offices.5. The connection fee for pipes up to 20 mm in diameter and for any length up to 100 meters is
HK$1,140 (US$146.21).6. There is a sewerage surcharge of approximately 20% in the water bill.
Pol icy andRegula t ion
The water policy objective of the Government of the HKSAR is to ensure the provision of reliable, adequate,and quality water and an efficient water supply service, as stated in the vision, mission, and values statementsof WSD. In setting water charges, the major factors considered are the financial impact on customers, costrecovery and return on assets, prevention of waste, and avoidance of cross subsidy. WSD is a governmentutility and is self-regulated, but is accountable to the Waterworks Account Committee. Other governmentdepartments monitor health (Health Department), radiological (Hong Kong Observatory), and environmental(Environmental Protection Department) aspects of the water supply.
Was t ewa t e ran d
Sani ta t ion
The entire city population of Hong Kong has access to sewerage. Septic tanks are used only in remote villageswhere desludging is done by tankers. The Environmental Protection Department regulates industrial effluentdisposal and water pollution control including issuance of standards for effluents discharged into the drainageand sewerage systems and coastal waters. The Drainage Services Department invested about US$1,140million in sanitation during 1997–2002.
7/31/2019 Water Utility and City Profiles
http://slidepdf.com/reader/full/water-utility-and-city-profiles 13/37
HONG KONG 43
City ProfileHONG KONG WATER SUPPLY
P r oduct i on &D is t r i bu t i on
Population: 6,865,600 (2001)
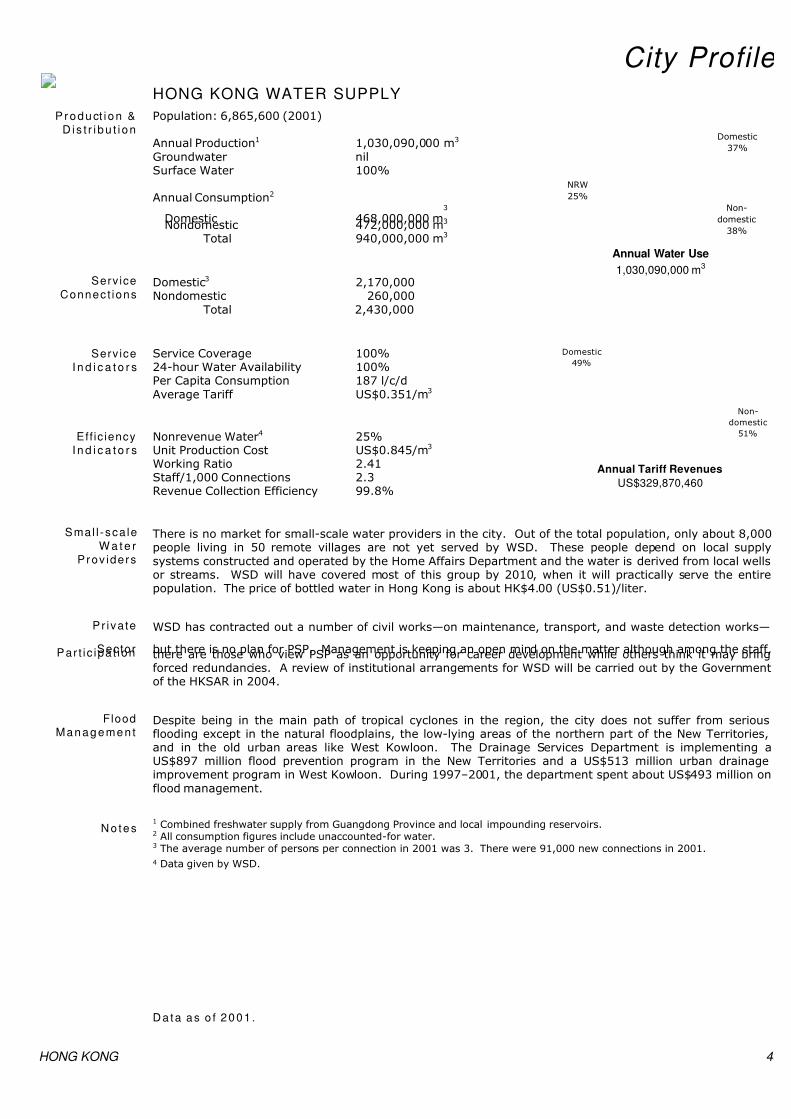
Annual Production1 1,030,090,000 m3 Groundwater nilSurface Water 100%
Annual Consumption2
Domestic 468,000,000 m3
Nondomestic 472,000,000 m3
Total 940,000,000 m3
Serv ice
Connec t ionsDomestic3 2,170,000Nondomestic 260,000
Total 2,430,000
Serv iceI n d i c a t o r s
Service Coverage 100%24-hour Water Availability 100%Per Capita Consumption 187 l/c/dAverage Tariff US$0.351/m3
Eff ic iencyI n d i c a t o r s
Nonrevenue Water4 25%Unit Production Cost US$0.845/m3 Working Ratio 2.41Staff/1,000 Connections 2.3Revenue Collection Efficiency 99.8%
Non-
domestic
38%
NRW
25%
Domestic
37%
Annual Water Use
1,030,090,000 m3
Non-
domestic
51%
Domestic
49%
Annual Tariff Revenues
US$329,870,460
Smal l -sca le
W a t e rProv iders
There is no market for small-scale water providers in the city. Out of the total population, only about 8,000people living in 50 remote villages are not yet served by WSD. These people depend on local supplysystems constructed and operated by the Home Affairs Department and the water is derived from local wellsor streams. WSD will have covered most of this group by 2010, when it will practically serve the entirepopulation. The price of bottled water in Hong Kong is about HK$4.00 (US$0.51)/liter.
Pr iva te
SectorPar t ic ipa t ion
WSD has contracted out a number of civil works—on maintenance, transport, and waste detection works—
but there is no plan for PSP. Management is keeping an open mind on the matter although among the staff,there are those who view PSP as an opportunity for career development while others think it may bringforced redundancies. A review of institutional arrangements for WSD will be carried out by the Governmentof the HKSAR in 2004.
FloodManagemen t
Despite being in the main path of tropical cyclones in the region, the city does not suffer from seriousflooding except in the natural floodplains, the low-lying areas of the northern part of the New Territories,and in the old urban areas like West Kowloon. The Drainage Services Department is implementing aUS$897 million flood prevention program in the New Territories and a US$513 million urban drainageimprovement program in West Kowloon. During 1997–2001, the department spent about US$493 million onflood management.
Notes1 Combined freshwater supply from Guangdong Province and local impounding reservoirs.2 All consumption figures include unaccounted-for water.3 The average number of persons per connection in 2001 was 3. There were 91,000 new connections in 2001.
4 Data given by WSD.
Data as o f 2001 .
7/31/2019 Water Utility and City Profiles
http://slidepdf.com/reader/full/water-utility-and-city-profiles 14/37
44 Water in Asian Cities
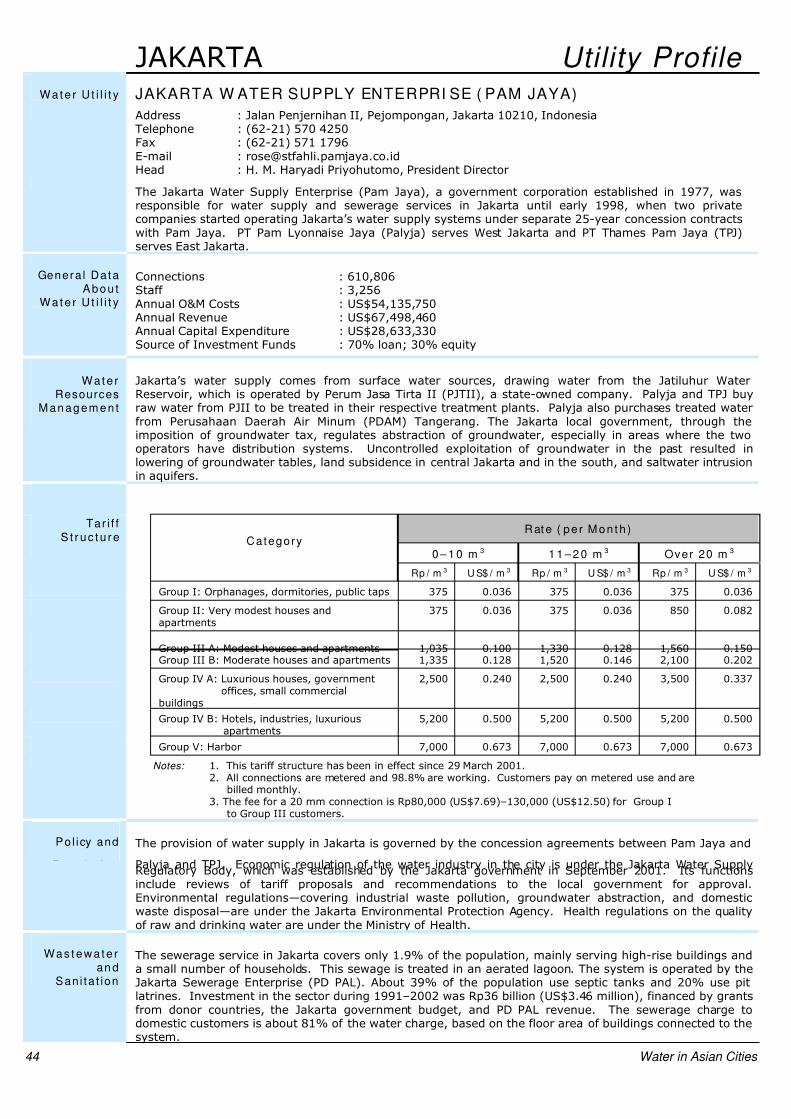
JAKARTA Utility Profile Wat e r U t i l i t y JAKARTA W ATER SUPPLY ENTERPRI SE ( PAM JAYA)
Address : Jalan Penjernihan II, Pejompongan, Jakarta 10210, IndonesiaTelephone : (62-21) 570 4250Fax : (62-21) 571 1796E-mail : [email protected] : H. M. Haryadi Priyohutomo, President Director
The Jakarta Water Supply Enterprise (Pam Jaya), a government corporation established in 1977, wasresponsible for water supply and sewerage services in Jakarta until early 1998, when two privatecompanies started operating Jakarta’s water supply systems under separate 25-year concession contractswith Pam Jaya. PT Pam Lyonnaise Jaya (Palyja) serves West Jakarta and PT Thames Pam Jaya (TPJ)serves East Jakarta.
Genera l DataAbou t
Wat e r U t i l i t y
Connections : 610,806Staff : 3,256Annual O&M Costs : US$54,135,750Annual Revenue : US$67,498,460Annual Capital Expenditure : US$28,633,330Source of Investment Funds : 70% loan; 30% equity
Wat e rResources
M anagem en t
Jakarta’s water supply comes from surface water sources, drawing water from the Jatiluhur WaterReservoir, which is operated by Perum Jasa Tirta II (PJTII), a state-owned company. Palyja and TPJ buyraw water from PJII to be treated in their respective treatment plants. Palyja also purchases treated waterfrom Perusahaan Daerah Air Minum (PDAM) Tangerang. The Jakarta local government, through theimposition of groundwater tax, regulates abstraction of groundwater, especially in areas where the twooperators have distribution systems. Uncontrolled exploitation of groundwater in the past resulted inlowering of groundwater tables, land subsidence in central Jakarta and in the south, and saltwater intrusionin aquifers.
Tar i f fS t r uc t u re
Rat e ( pe r M on t h )
0 – 1 0 m 3 1 1 – 2 0 m 3 Over 20 m 3 Category
Rp / m 3 U S$ / m 3 Rp / m 3 U S$ / m 3 Rp / m 3 U S$ / m 3
Group I: Orphanages, dormitories, public taps 375 0.036 375 0.036 375 0.036
Group II: Very modest houses andapartments
375 0.036 375 0.036 850 0.082
Group III A: Modest houses and apartments 1,035 0.100 1,330 0.128 1,560 0.150Group III B: Moderate houses and apartments 1,335 0.128 1,520 0.146 2,100 0.202
Group IV A: Luxurious houses, governmentoffices, small commercial
buildings
2,500 0.240 2,500 0.240 3,500 0.337
Group IV B: Hotels, industries, luxuriousapartments
5,200 0.500 5,200 0.500 5,200 0.500
Group V: Harbor 7,000 0.673 7,000 0.673 7,000 0.673
Notes: 1. This tariff structure has been in effect since 29 March 2001.2. All connections are metered and 98.8% are working. Customers pay on metered use and are
billed monthly.3. The fee for a 20 mm connection is Rp80,000 (US$7.69)–130,000 (US$12.50) for Group I
to Group III customers. Pol icy and
Regula t ion
The provision of water supply in Jakarta is governed by the concession agreements between Pam Jaya and
Palyja and TPJ. Economic regulation of the water industry in the city is under the Jakarta Water SupplyRegulatory Body, which was established by the Jakarta government in September 2001. Its functionsinclude reviews of tariff proposals and recommendations to the local government for approval.Environmental regulations—covering industrial waste pollution, groundwater abstraction, and domesticwaste disposal—are under the Jakarta Environmental Protection Agency. Health regulations on the qualityof raw and drinking water are under the Ministry of Health.
Was t ewa t e ran d
Sani ta t ion
The sewerage service in Jakarta covers only 1.9% of the population, mainly serving high-rise buildings anda small number of households. This sewage is treated in an aerated lagoon. The system is operated by theJakarta Sewerage Enterprise (PD PAL). About 39% of the population use septic tanks and 20% use pitlatrines. Investment in the sector during 1991–2002 was Rp36 billion (US$3.46 million), financed by grantsfrom donor countries, the Jakarta government budget, and PD PAL revenue. The sewerage charge todomestic customers is about 81% of the water charge, based on the floor area of buildings connected to thesystem.
7/31/2019 Water Utility and City Profiles
http://slidepdf.com/reader/full/water-utility-and-city-profiles 15/37
JAKARTA 45
City Profile
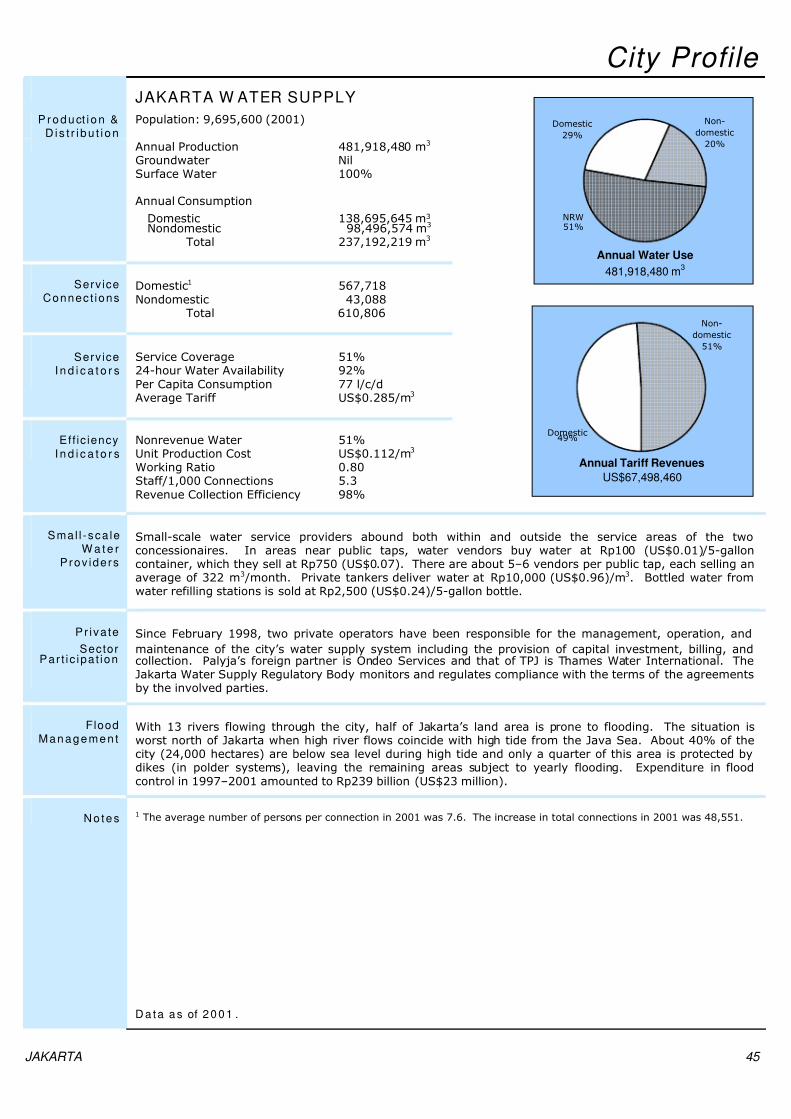
JAKARTA W ATER SUPPLY
P r oduct i on &D is t r i bu t i on
Population: 9,695,600 (2001)
Annual Production 481,918,480 m3 Groundwater NilSurface Water 100%
Annual Consumption
Domestic 138,695,645 m3 Nondomestic 98,496,574 m3
Total 237,192,219 m3
Serv iceConnec t ions
Domestic1 567,718Nondomestic 43,088
Total 610,806
Serv iceI n d i c a t o r s
Service Coverage 51%24-hour Water Availability 92%Per Capita Consumption 77 l/c/dAverage Tariff US$0.285/m3
Eff ic iency
I n d i c a t o r sNonrevenue Water 51%Unit Production Cost US$0.112/m3 Working Ratio 0.80Staff/1,000 Connections 5.3Revenue Collection Efficiency 98%
Domestic
29%
NRW51%
Non-
domestic
20%
Annual Water Use
481,918,480 m3
Non-
domestic
51%
Domestic49%
Annual Tariff Revenues
US$67,498,460
Smal l -sca leW a t e r
Prov iders
Small-scale water service providers abound both within and outside the service areas of the twoconcessionaires. In areas near public taps, water vendors buy water at Rp100 (US$0.01)/5-galloncontainer, which they sell at Rp750 (US$0.07). There are about 5–6 vendors per public tap, each selling anaverage of 322 m3 /month. Private tankers deliver water at Rp10,000 (US$0.96)/m3. Bottled water fromwater refilling stations is sold at Rp2,500 (US$0.24)/5-gallon bottle.
Pr iva te
SectorPar t ic ipa t ion
Since February 1998, two private operators have been responsible for the management, operation, and
maintenance of the city’s water supply system including the provision of capital investment, billing, andcollection. Palyja’s foreign partner is Ondeo Services and that of TPJ is Thames Water International. TheJakarta Water Supply Regulatory Body monitors and regulates compliance with the terms of the agreementsby the involved parties.
FloodManagemen t
With 13 rivers flowing through the city, half of Jakarta’s land area is prone to flooding. The situation isworst north of Jakarta when high river flows coincide with high tide from the Java Sea. About 40% of thecity (24,000 hectares) are below sea level during high tide and only a quarter of this area is protected bydikes (in polder systems), leaving the remaining areas subject to yearly flooding. Expenditure in floodcontrol in 1997–2001 amounted to Rp239 billion (US$23 million).
N otes1 The average number of persons per connection in 2001 was 7.6. The increase in total connections in 2001 was 48,551.
D ata as of 2001 .

7/31/2019 Water Utility and City Profiles
http://slidepdf.com/reader/full/water-utility-and-city-profiles 16/37
7/31/2019 Water Utility and City Profiles
http://slidepdf.com/reader/full/water-utility-and-city-profiles 17/37
City Profile
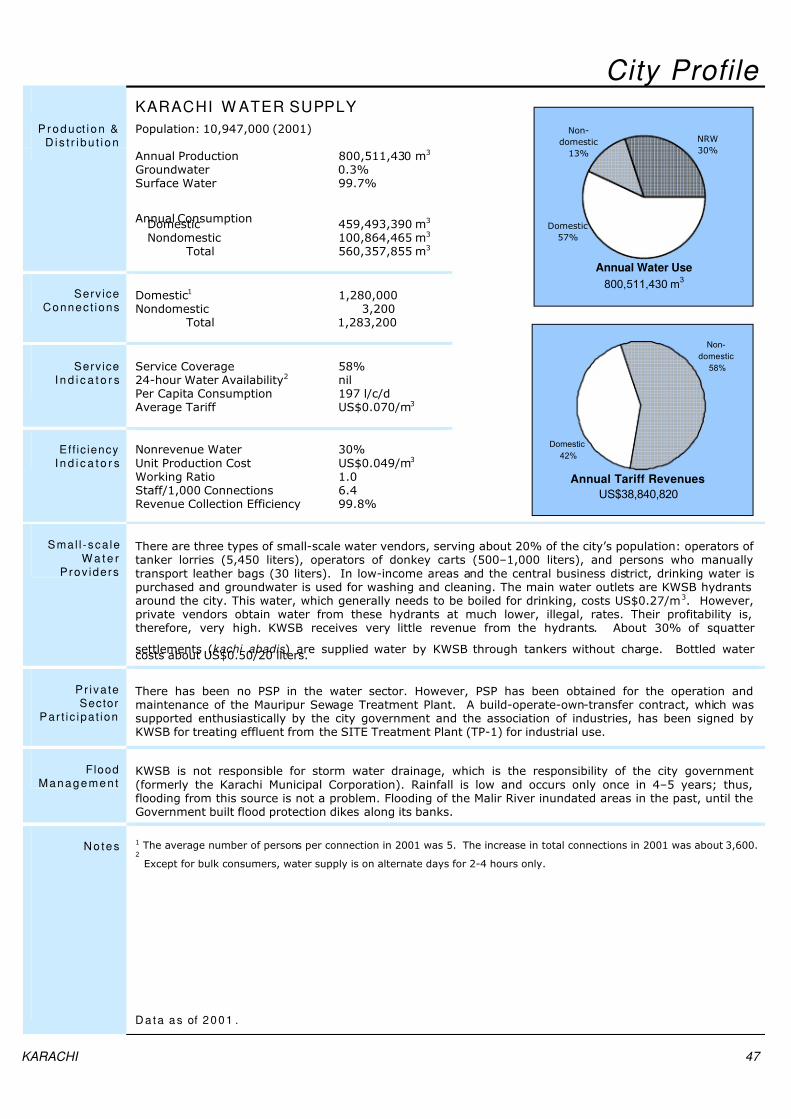
KARACHI W ATER SUPPLY
P r oduct i on &D is t r i bu t i on
Population: 10,947,000 (2001)
Annual Production 800,511,430 m3
Groundwater 0.3%Surface Water 99.7%
Annual ConsumptionDomestic 459,493,390 m3
Nondomestic 100,864,465 m3
Total 560,357,855 m3
Serv iceConnec t ions
Domestic1 1,280,000Nondomestic 3,200
Total 1,283,200
Serv iceI n d i c a t o r s
Service Coverage 58%24-hour Water Availability2 nilPer Capita Consumption 197 l/c/dAverage Tariff US$0.070/m3
Eff ic iencyI n d i c a t o r s
Nonrevenue Water 30%Unit Production Cost US$0.049/m3
Working Ratio 1.0Staff/1,000 Connections 6.4Revenue Collection Efficiency 99.8%
Non-
domestic
13%
NRW
30%
Domestic
57%
Annual Water Use
800,511,430 m3
Non-
domestic
58%
Domestic
42%
Annual Tariff Revenues
US$38,840,820
Smal l -sca le
W a t e rProv iders
There are three types of small-scale water vendors, serving about 20% of the city’s population: operators of tanker lorries (5,450 liters), operators of donkey carts (500–1,000 liters), and persons who manuallytransport leather bags (30 liters). In low-income areas and the central business district, drinking water ispurchased and groundwater is used for washing and cleaning. The main water outlets are KWSB hydrantsaround the city. This water, which generally needs to be boiled for drinking, costs US$0.27/m3. However,private vendors obtain water from these hydrants at much lower, illegal, rates. Their profitability is,therefore, very high. KWSB receives very little revenue from the hydrants. About 30% of squatter
settlements (kachi abadis ) are supplied water by KWSB through tankers without charge. Bottled watercosts about US$0.50/20 liters.
Pr iva teSector
Par t ic ipa t ion
There has been no PSP in the water sector. However, PSP has been obtained for the operation andmaintenance of the Mauripur Sewage Treatment Plant. A build-operate-own-transfer contract, which wassupported enthusiastically by the city government and the association of industries, has been signed byKWSB for treating effluent from the SITE Treatment Plant (TP-1) for industrial use.
FloodManagemen t
KWSB is not responsible for storm water drainage, which is the responsibility of the city government(formerly the Karachi Municipal Corporation). Rainfall is low and occurs only once in 4–5 years; thus,flooding from this source is not a problem. Flooding of the Malir River inundated areas in the past, until theGovernment built flood protection dikes along its banks.
N otes1 The average number of persons per connection in 2001 was 5. The increase in total connections in 2001 was about 3,600.2
Except for bulk consumers, water supply is on alternate days for 2-4 hours only.
D ata as of 2001 .
KARACHI 47
7/31/2019 Water Utility and City Profiles
http://slidepdf.com/reader/full/water-utility-and-city-profiles 18/37
48 Water in Asian Cities
KATHMANDU Utility Profile
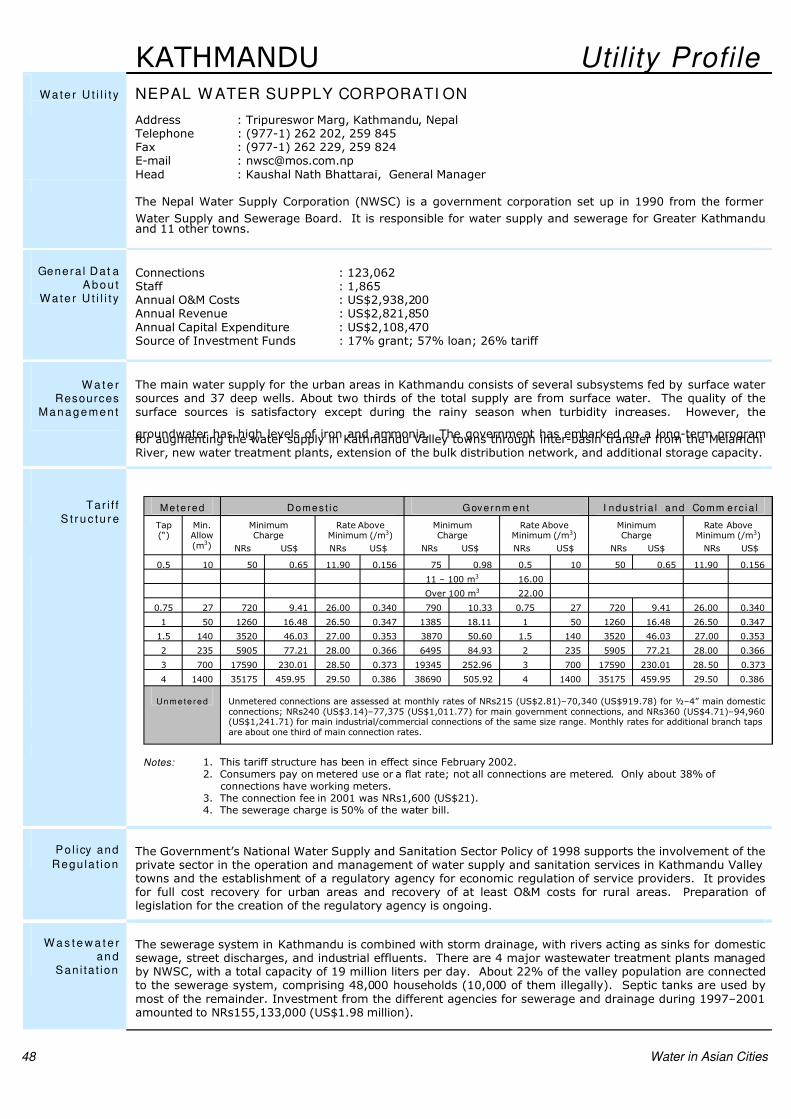
Wate r U t i l i t y NEPAL W ATER SUPPLY CORPORATI ON
Address : Tripureswor Marg, Kathmandu, NepalTelephone : (977-1) 262 202, 259 845Fax : (977-1) 262 229, 259 824E-mail : [email protected] : Kaushal Nath Bhattarai, General Manager
The Nepal Water Supply Corporation (NWSC) is a government corporation set up in 1990 from the former
Water Supply and Sewerage Board. It is responsible for water supply and sewerage for Greater Kathmanduand 11 other towns.
Genera l Dat aA bou t
Wa te r U t i l i t y
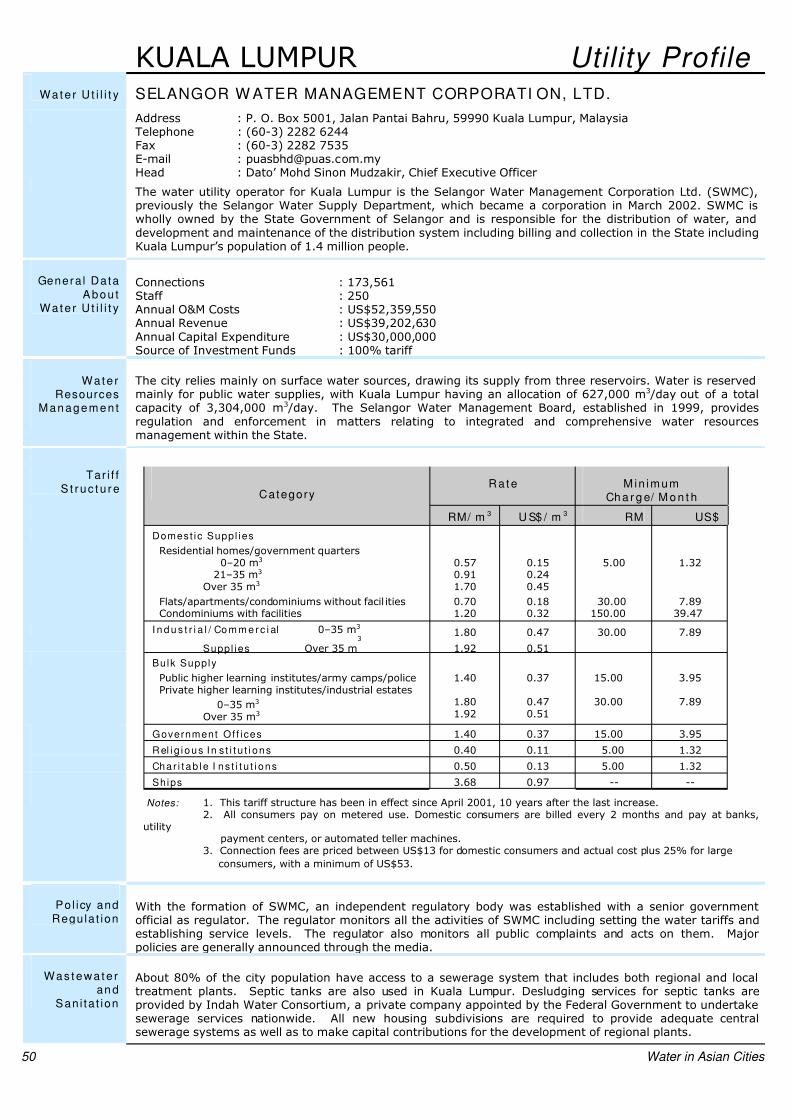
Connections : 123,062Staff : 1,865Annual O&M Costs : US$2,938,200Annual Revenue : US$2,821,850Annual Capital Expenditure : US$2,108,470Source of Investment Funds : 17% grant; 57% loan; 26% tariff
W a t e rResources
Managemen t
The main water supply for the urban areas in Kathmandu consists of several subsystems fed by surface watersources and 37 deep wells. About two thirds of the total supply are from surface water. The quality of thesurface sources is satisfactory except during the rainy season when turbidity increases. However, the
groundwater has high levels of iron and ammonia. The government has embarked on a long-term programfor augmenting the water supply in Kathmandu Valley towns through inter-basin transfer from the MelamchiRiver, new water treatment plants, extension of the bulk distribution network, and additional storage capacity.
Mete red D omes t i c Gove rnm en t I ndus t r i a l and Comm erc i a lTar i f f
S t r uc tu r eTap(“)
Min.Allow(m3)
MinimumCharge
NRs US$
Rate AboveMinimum (/m3)
NRs US$
MinimumCharge
NRs US$
Rate AboveMinimum (/m3)
NRs US$
MinimumCharge
NRs US$
Rate AboveMinimum (/m3)
NRs US$
0.5 10 50 0.65 11.90 0.156 75 0.98 0.5 10 50 0.65 11.90 0.156
11 – 100 m3 16.00
Over 100 m3 22.00
0.75 27 720 9.41 26.00 0.340 790 10.33 0.75 27 720 9.41 26.00 0.340
1 50 1260 16.48 26.50 0.347 1385 18.11 1 50 1260 16.48 26.50 0.347
1.5 140 3520 46.03 27.00 0.353 3870 50.60 1.5 140 3520 46.03 27.00 0.353
2 235 5905 77.21 28.00 0.366 6495 84.93 2 235 5905 77.21 28.00 0.366
3 700 17590 230.01 28.50 0.373 19345 252.96 3 700 17590 230.01 28.50 0.373
4 1400 35175 459.95 29.50 0.386 38690 505.92 4 1400 35175 459.95 29.50 0.386
Unmete red Unmetered connections are assessed at monthly rates of NRs215 (US$2.81)–70,340 (US$919.78) for ½–4” main domesticconnections; NRs240 (US$3.14)–77,375 (US$1,011.77) for main government connections, and NRs360 (US$4.71)–94,960(US$1,241.71) for main industrial/commercial connections of the same size range. Monthly rates for additional branch tapsare about one third of main connection rates.
Notes: 1. This tariff structure has been in effect since February 2002.2. Consumers pay on metered use or a flat rate; not all connections are metered. Only about 38% of
connections have working meters.3. The connection fee in 2001 was NRs1,600 (US$21).4. The sewerage charge is 50% of the water bill.
Pol icy and
Regu la t ionThe Government’s National Water Supply and Sanitation Sector Policy of 1998 supports the involvement of theprivate sector in the operation and management of water supply and sanitation services in Kathmandu Valleytowns and the establishment of a regulatory agency for economic regulation of service providers. It providesfor full cost recovery for urban areas and recovery of at least O&M costs for rural areas. Preparation of legislation for the creation of the regulatory agency is ongoing.
W a s t e w a t e ran d
San i ta t ion
The sewerage system in Kathmandu is combined with storm drainage, with rivers acting as sinks for domesticsewage, street discharges, and industrial effluents. There are 4 major wastewater treatment plants managedby NWSC, with a total capacity of 19 million liters per day. About 22% of the valley population are connectedto the sewerage system, comprising 48,000 households (10,000 of them illegally). Septic tanks are used bymost of the remainder. Investment from the different agencies for sewerage and drainage during 1997–2001amounted to NRs155,133,000 (US$1.98 million).
7/31/2019 Water Utility and City Profiles
http://slidepdf.com/reader/full/water-utility-and-city-profiles 19/37
City Profile
KATHMA NDU W ATER SUPPLY
P r oduct i on &D is t r i bu t i on
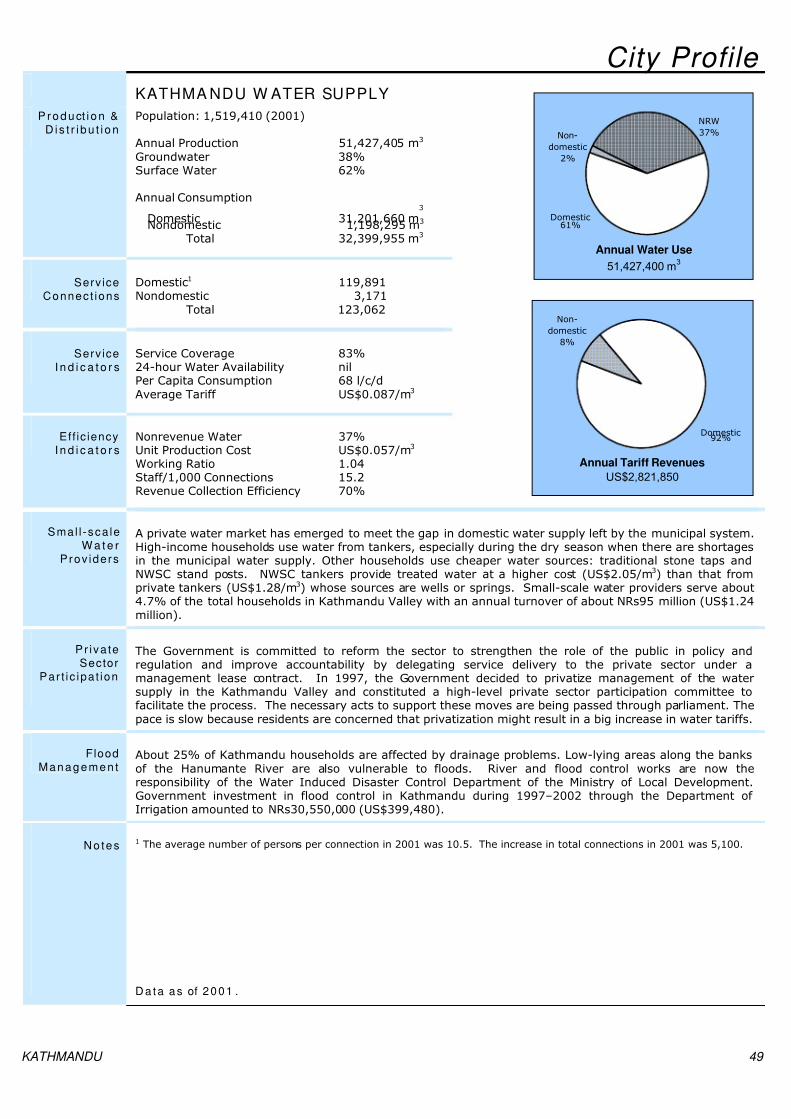
Population: 1,519,410 (2001)
Annual Production 51,427,405 m3
Groundwater 38%Surface Water 62%
Annual Consumption
Domestic 31,201,660 m3
Nondomestic 1,198,295 m3
Total 32,399,955 m3
Serv iceConnec t ions
Domestic1 119,891Nondomestic 3,171
Total 123,062
Serv iceI n d i c a t o r s
Service Coverage 83%24-hour Water Availability nilPer Capita Consumption 68 l/c/dAverage Tariff US$0.087/m3
Eff ic iencyI n d i c a t o r s
Nonrevenue Water 37%Unit Production Cost US$0.057/m3
Working Ratio 1.04Staff/1,000 Connections 15.2Revenue Collection Efficiency 70%
Non-
domestic
2%
NRW
37%
Domestic61%
Annual Water Use
51,427,400 m3
Non-
domestic
8%
Domestic92%
Annual Tariff Revenues
US$2,821,850
Smal l -sca leW a t e r
Prov iders
A private water market has emerged to meet the gap in domestic water supply left by the municipal system.High-income households use water from tankers, especially during the dry season when there are shortagesin the municipal water supply. Other households use cheaper water sources: traditional stone taps andNWSC stand posts. NWSC tankers provide treated water at a higher cost (US$2.05/m3) than that fromprivate tankers (US$1.28/m3) whose sources are wells or springs. Small-scale water providers serve about4.7% of the total households in Kathmandu Valley with an annual turnover of about NRs95 million (US$1.24million).
Pr iva teSector
Par t ic ipa t ion
The Government is committed to reform the sector to strengthen the role of the public in policy andregulation and improve accountability by delegating service delivery to the private sector under amanagement lease contract. In 1997, the Government decided to privatize management of the watersupply in the Kathmandu Valley and constituted a high-level private sector participation committee tofacilitate the process. The necessary acts to support these moves are being passed through parliament. Thepace is slow because residents are concerned that privatization might result in a big increase in water tariffs.
FloodManagemen t
About 25% of Kathmandu households are affected by drainage problems. Low-lying areas along the banksof the Hanumante River are also vulnerable to floods. River and flood control works are now theresponsibility of the Water Induced Disaster Control Department of the Ministry of Local Development.Government investment in flood control in Kathmandu during 1997–2002 through the Department of Irrigation amounted to NRs30,550,000 (US$399,480).
N otes1 The average number of persons per connection in 2001 was 10.5. The increase in total connections in 2001 was 5,100.
D ata as of 2001 .
KATHMANDU 49
7/31/2019 Water Utility and City Profiles
http://slidepdf.com/reader/full/water-utility-and-city-profiles 20/37
50 Water in Asian Cities
KUALA LUMPUR Utility Profile Wat e r U t i l i t y SELANGOR W ATER MANAGEMENT CORPORATI ON, LTD.
Address : P. O. Box 5001, Jalan Pantai Bahru, 59990 Kuala Lumpur, MalaysiaTelephone : (60-3) 2282 6244Fax : (60-3) 2282 7535E-mail : [email protected] : Dato’ Mohd Sinon Mudzakir, Chief Executive Officer
The water utility operator for Kuala Lumpur is the Selangor Water Management Corporation Ltd. (SWMC),previously the Selangor Water Supply Department, which became a corporation in March 2002. SWMC iswholly owned by the State Government of Selangor and is responsible for the distribution of water, anddevelopment and maintenance of the distribution system including billing and collection in the State includingKuala Lumpur’s population of 1.4 million people.
Genera l DataAbou t
Wat e r U t i l i t y
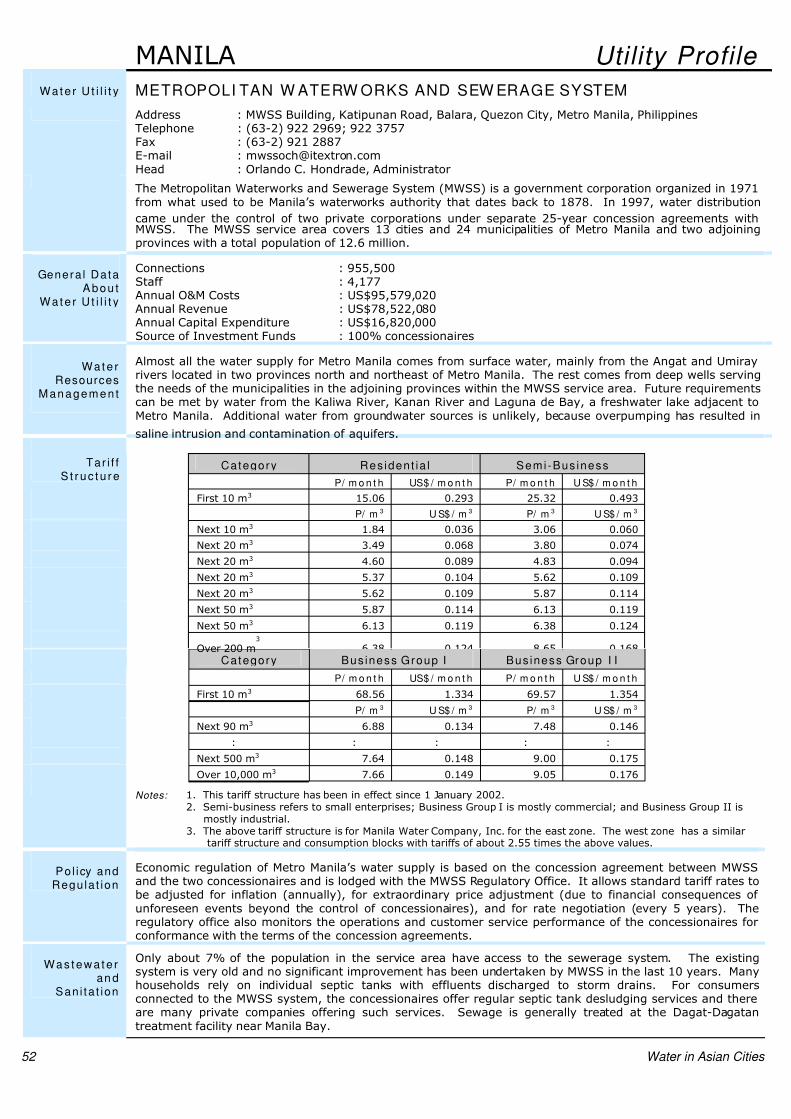
Connections : 173,561Staff : 250Annual O&M Costs : US$52,359,550Annual Revenue : US$39,202,630Annual Capital Expenditure : US$30,000,000Source of Investment Funds : 100% tariff
Wat e rResources
M anagem en t
The city relies mainly on surface water sources, drawing its supply from three reservoirs. Water is reservedmainly for public water supplies, with Kuala Lumpur having an allocation of 627,000 m3 /day out of a totalcapacity of 3,304,000 m3 /day. The Selangor Water Management Board, established in 1999, providesregulation and enforcement in matters relating to integrated and comprehensive water resourcesmanagement within the State.
Tar i f fS t r uc t u re Ra t e M in im um
Ch a r g e/ M o n t hCategory
RM/ m 3 U S$ / m 3 RM US$
Domest ic Suppl ies
Residential homes/government quarters0–20 m3
21–35 m3
Over 35 m3
Flats/apartments/condominiums without facil itiesCondominiums with facilities
0.570.911.70
0.701.20
0.150.240.45
0.180.32
5.00
30.00150.00
1.32
7.8939.47
I n d u s t r i a l / Co m m e r c i al 0–35 m3
Suppl ies Over 35 m3
1.80
1.92
0.47
0.51
30.00 7.89
Bulk Supply
Public higher learning institutes/army camps/policePrivate higher learning institutes/industrial estates
0–35 m3
Over 35 m3
1.40
1.801.92
0.37
0.470.51
15.00
30.00
3.95
7.89
Government Of f i ces 1.40 0.37 15.00 3.95
Rel i g i ous I n s t i t u t i ons 0.40 0.11 5.00 1.32
Char i t ab l e I ns t i t u t i ons 0.50 0.13 5.00 1.32
Ships 3.68 0.97 -- --
Notes: 1. This tariff structure has been in effect since April 2001, 10 years after the last increase.2. All consumers pay on metered use. Domestic consumers are billed every 2 months and pay at banks,
utilitypayment centers, or automated teller machines.
3. Connection fees are priced between US$13 for domestic consumers and actual cost plus 25% for large
consumers, with a minimum of US$53.
Pol icy andRegula t ion
With the formation of SWMC, an independent regulatory body was established with a senior governmentofficial as regulator. The regulator monitors all the activities of SWMC including setting the water tariffs andestablishing service levels. The regulator also monitors all public complaints and acts on them. Majorpolicies are generally announced through the media.
Was t ewa t e ran d
Sani ta t ion
About 80% of the city population have access to a sewerage system that includes both regional and localtreatment plants. Septic tanks are also used in Kuala Lumpur. Desludging services for septic tanks areprovided by Indah Water Consortium, a private company appointed by the Federal Government to undertakesewerage services nationwide. All new housing subdivisions are required to provide adequate centralsewerage systems as well as to make capital contributions for the development of regional plants.
7/31/2019 Water Utility and City Profiles
http://slidepdf.com/reader/full/water-utility-and-city-profiles 21/37
City Profile
KUALA LUMPUR W ATER SUPPLY
Produc t ion &D is t r i bu t i on
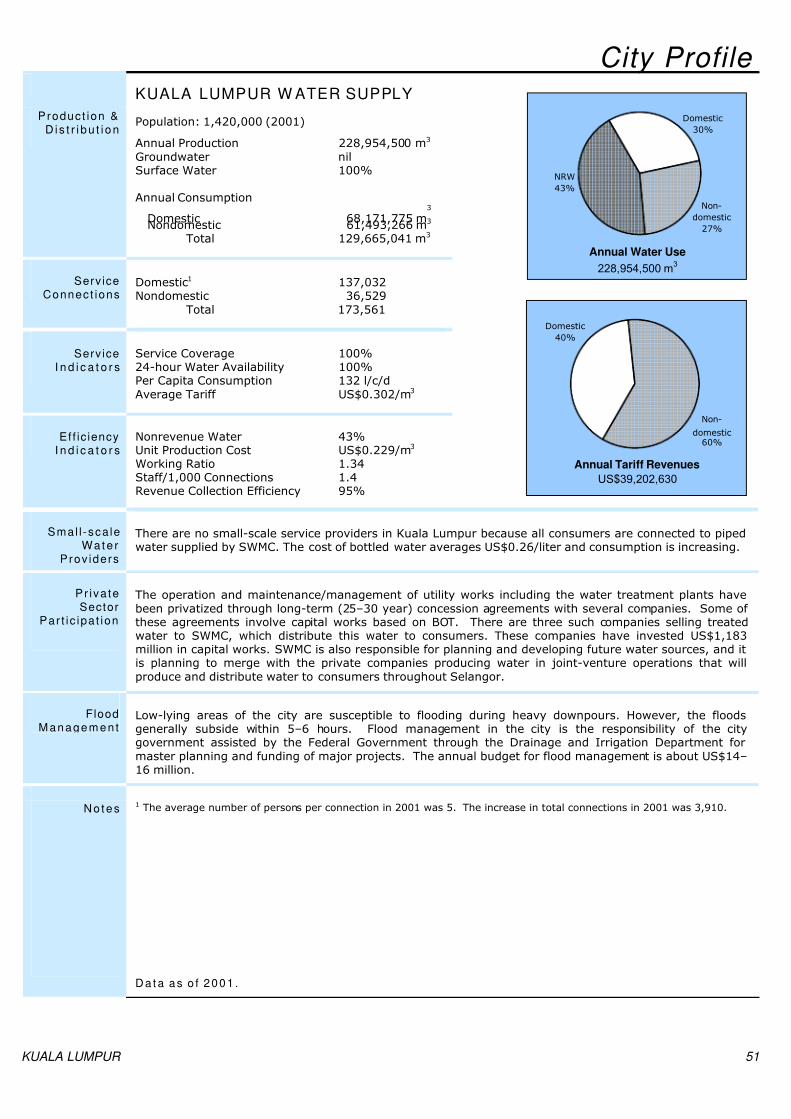
Population: 1,420,000 (2001)
Annual Production 228,954,500 m3
Groundwater nilSurface Water 100%
Annual Consumption
Domestic 68,171,775 m3
Nondomestic 61,493,266 m3
Total 129,665,041 m3
ServiceConnect ions
Domestic1 137,032Nondomestic 36,529
Total 173,561
ServiceI n d i c a t o r s
Service Coverage 100%24-hour Water Availability 100%Per Capita Consumption 132 l/c/dAverage Tariff US$0.302/m3
Eff ic iencyI n d i c a t o r s
Nonrevenue Water 43%Unit Production Cost US$0.229/m3
Working Ratio 1.34Staff/1,000 Connections 1.4Revenue Collection Efficiency 95%
Domestic
30%
NRW
43%
Non-
domestic
27%
Annual Water Use
228,954,500 m3
Non-
domestic60%
Domestic
40%
Annual Tariff Revenues
US$39,202,630
Smal l -sca leWat e r
Prov iders
There are no small-scale service providers in Kuala Lumpur because all consumers are connected to pipedwater supplied by SWMC. The cost of bottled water averages US$0.26/liter and consumption is increasing.
Pr ivateSector
Par t ic ipat ion
The operation and maintenance/management of utility works including the water treatment plants havebeen privatized through long-term (25–30 year) concession agreements with several companies. Some of these agreements involve capital works based on BOT. There are three such companies selling treatedwater to SWMC, which distribute this water to consumers. These companies have invested US$1,183million in capital works. SWMC is also responsible for planning and developing future water sources, and itis planning to merge with the private companies producing water in joint-venture operations that willproduce and distribute water to consumers throughout Selangor.
FloodM anagem en t
Low-lying areas of the city are susceptible to flooding during heavy downpours. However, the floodsgenerally subside within 5–6 hours. Flood management in the city is the responsibility of the citygovernment assisted by the Federal Government through the Drainage and Irrigation Department formaster planning and funding of major projects. The annual budget for flood management is about US$14–16 million.
Not es 1 The average number of persons per connection in 2001 was 5. The increase in total connections in 2001 was 3,910.
Dat a as o f 2001 .
KUALA LUMPUR 51
7/31/2019 Water Utility and City Profiles
http://slidepdf.com/reader/full/water-utility-and-city-profiles 22/37
52 Water in Asian Cities
MANILA Utility Profile
Wat e r U t i l i t y METROPOLI TAN W ATERW ORKS AND SEW ERAGE SYSTEM
Address : MWSS Building, Katipunan Road, Balara, Quezon City, Metro Manila, PhilippinesTelephone : (63-2) 922 2969; 922 3757Fax : (63-2) 921 2887E-mail : [email protected] : Orlando C. Hondrade, Administrator
The Metropolitan Waterworks and Sewerage System (MWSS) is a government corporation organized in 1971from what used to be Manila’s waterworks authority that dates back to 1878. In 1997, water distribution
came under the control of two private corporations under separate 25-year concession agreements withMWSS. The MWSS service area covers 13 cities and 24 municipalities of Metro Manila and two adjoiningprovinces with a total population of 12.6 million.
Genera l DataAbou t
Wat e r U t i l i t y
Connections : 955,500Staff : 4,177Annual O&M Costs : US$95,579,020Annual Revenue : US$78,522,080Annual Capital Expenditure : US$16,820,000Source of Investment Funds : 100% concessionaires
Wat e rResources
M anagem en t
Almost all the water supply for Metro Manila comes from surface water, mainly from the Angat and Umirayrivers located in two provinces north and northeast of Metro Manila. The rest comes from deep wells servingthe needs of the municipalities in the adjoining provinces within the MWSS service area. Future requirementscan be met by water from the Kaliwa River, Kanan River and Laguna de Bay, a freshwater lake adjacent toMetro Manila. Additional water from groundwater sources is unlikely, because overpumping has resulted in
saline intrusion and contamination of aquifers.
Category Res ident ia l Semi-Bus inessTar i f fS t r uc t u re
P/ m o n t h US$ / m o n t h P/ m o n t h U S$ / m o n t h
First 10 m3 15.06 0.293 25.32 0.493
P/ m 3 U S$ / m 3 P/ m 3 U S$ / m 3
Next 10 m3 1.84 0.036 3.06 0.060
Next 20 m3 3.49 0.068 3.80 0.074
Next 20 m3 4.60 0.089 4.83 0.094
Next 20 m3 5.37 0.104 5.62 0.109
Next 20 m3 5.62 0.109 5.87 0.114
Next 50 m3 5.87 0.114 6.13 0.119
Next 50 m3 6.13 0.119 6.38 0.124
Over 200 m3
6.38 0.124 8.65 0.168
Category Bus iness Group I Bus iness Group I I
P/ m o n t h US$ / m o n t h P/ m o n t h U S$ / m o n t h
First 10 m3 68.56 1.334 69.57 1.354
P/ m 3 U S$ / m 3 P/ m 3 U S$ / m 3
Next 90 m3 6.88 0.134 7.48 0.146
: : : : :
Next 500 m3 7.64 0.148 9.00 0.175
Over 10,000 m3 7.66 0.149 9.05 0.176
Notes: 1. This tariff structure has been in effect since 1 January 2002.2. Semi-business refers to small enterprises; Business Group I is mostly commercial; and Business Group II is
mostly industrial.3. The above tariff structure is for Manila Water Company, Inc. for the east zone. The west zone has a similar
tariff structure and consumption blocks with tariffs of about 2.55 times the above values.
Pol icy andRegula t ion
Economic regulation of Metro Manila’s water supply is based on the concession agreement between MWSSand the two concessionaires and is lodged with the MWSS Regulatory Office. It allows standard tariff rates tobe adjusted for inflation (annually), for extraordinary price adjustment (due to financial consequences of unforeseen events beyond the control of concessionaires), and for rate negotiation (every 5 years). Theregulatory office also monitors the operations and customer service performance of the concessionaires forconformance with the terms of the concession agreements.
Was t ewa t e ran d
Sani ta t ion
Only about 7% of the population in the service area have access to the sewerage system. The existingsystem is very old and no significant improvement has been undertaken by MWSS in the last 10 years. Manyhouseholds rely on individual septic tanks with effluents discharged to storm drains. For consumersconnected to the MWSS system, the concessionaires offer regular septic tank desludging services and thereare many private companies offering such services. Sewage is generally treated at the Dagat-Dagatantreatment facility near Manila Bay.
7/31/2019 Water Utility and City Profiles
http://slidepdf.com/reader/full/water-utility-and-city-profiles 23/37
City Profile
MAN I LA WATER SUPPLY
Produc t ion &D is t r i bu t i on
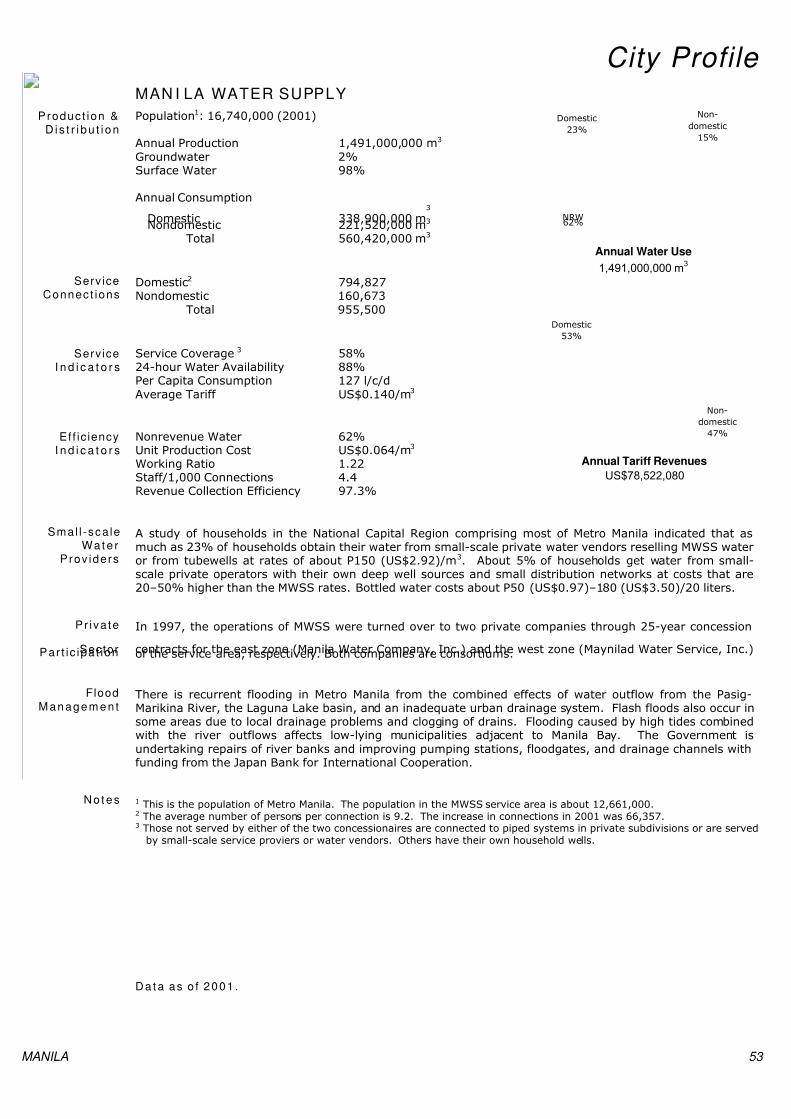
Population1: 16,740,000 (2001)
Annual Production 1,491,000,000 m3
Groundwater 2%Surface Water 98%
Annual Consumption
Domestic 338,900,000 m3
Nondomestic 221,520,000 m3
Total 560,420,000 m3
ServiceConnect ions
Domestic2 794,827Nondomestic 160,673
Total 955,500
ServiceI n d i c a t o r s
Service Coverage 3 58%24-hour Water Availability 88%Per Capita Consumption 127 l/c/dAverage Tariff US$0.140/m3
Eff ic iencyI n d i c a t o r s
Nonrevenue Water 62%Unit Production Cost US$0.064/m3
Working Ratio 1.22Staff/1,000 Connections 4.4Revenue Collection Efficiency 97.3%
Domestic
23%
NRW62%
Non-
domestic
15%
Annual Water Use
1,491,000,000 m3
Non-
domestic
47%
Domestic
53%
Annual Tariff Revenues
US$78,522,080
Smal l -sca leWat e r
Prov iders
A study of households in the National Capital Region comprising most of Metro Manila indicated that asmuch as 23% of households obtain their water from small-scale private water vendors reselling MWSS wateror from tubewells at rates of about P150 (US$2.92)/m3. About 5% of households get water from small-scale private operators with their own deep well sources and small distribution networks at costs that are20–50% higher than the MWSS rates. Bottled water costs about P50 (US$0.97)–180 (US$3.50)/20 liters.
Pr ivate
SectorPar t ic ipat ion
In 1997, the operations of MWSS were turned over to two private companies through 25-year concession
contracts for the east zone (Manila Water Company, Inc.) and the west zone (Maynilad Water Service, Inc.)of the service area, respectively. Both companies are consortiums.
FloodM anagem en t
There is recurrent flooding in Metro Manila from the combined effects of water outflow from the Pasig-Marikina River, the Laguna Lake basin, and an inadequate urban drainage system. Flash floods also occur insome areas due to local drainage problems and clogging of drains. Flooding caused by high tides combinedwith the river outflows affects low-lying municipalities adjacent to Manila Bay. The Government isundertaking repairs of river banks and improving pumping stations, floodgates, and drainage channels withfunding from the Japan Bank for International Cooperation.
Not es 1 This is the population of Metro Manila. The population in the MWSS service area is about 12,661,000.2 The average number of persons per connection is 9.2. The increase in connections in 2001 was 66,357.3 Those not served by either of the two concessionaires are connected to piped systems in private subdivisions or are served
by small-scale service proviers or water vendors. Others have their own household wells.
Dat a as o f 2001 .
MANILA 53

7/31/2019 Water Utility and City Profiles
http://slidepdf.com/reader/full/water-utility-and-city-profiles 24/37
7/31/2019 Water Utility and City Profiles
http://slidepdf.com/reader/full/water-utility-and-city-profiles 25/37
City Profile
OSAKA W ATER SUPPLY
Produc t ion &D is t r i bu t i on
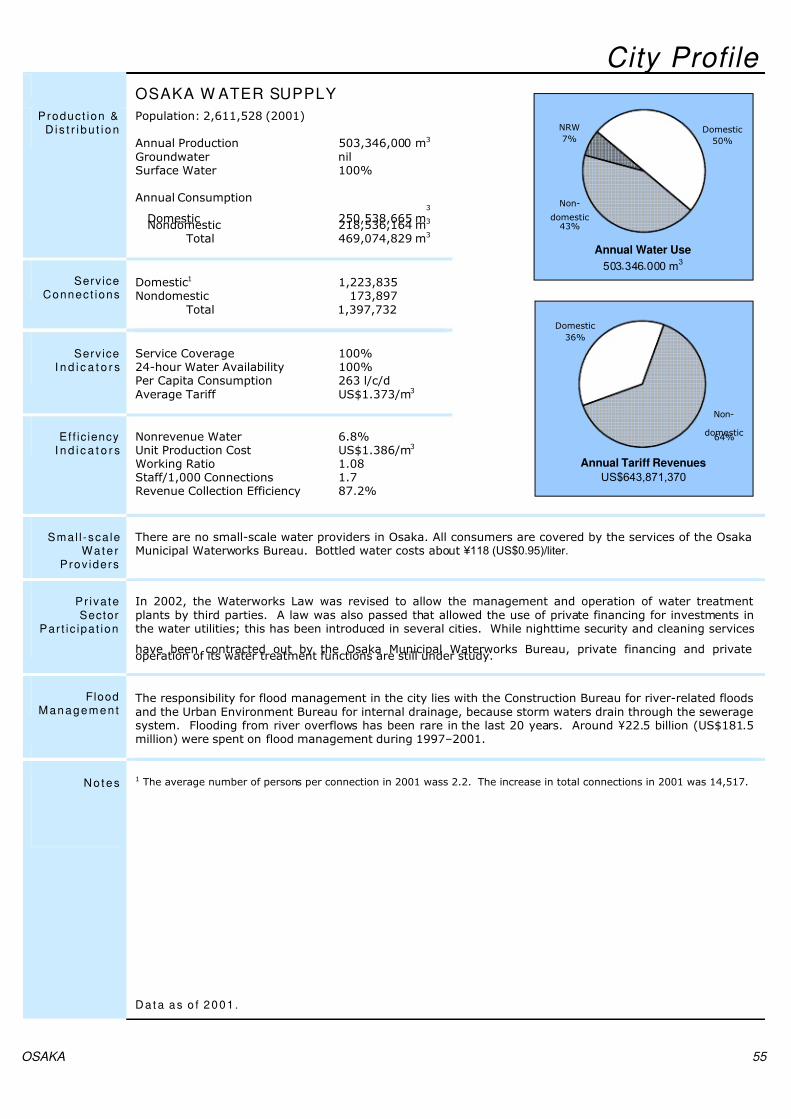
Population: 2,611,528 (2001)
Annual Production 503,346,000 m3
Groundwater nilSurface Water 100%
Annual Consumption
Domestic 250,538,665 m3
Nondomestic 218,536,164 m3
Total 469,074,829 m3
ServiceConnect ions
Domestic1 1,223,835Nondomestic 173,897
Total 1,397,732
ServiceI n d i c a t o r s
Service Coverage 100%24-hour Water Availability 100%Per Capita Consumption 263 l/c/dAverage Tariff US$1.373/m3
Eff ic iencyI n d i c a t o r s
Nonrevenue Water 6.8%Unit Production Cost US$1.386/m3
Working Ratio 1.08Staff/1,000 Connections 1.7Revenue Collection Efficiency 87.2%
Non-
domestic43%
NRW
7%Domestic
50%
Annual Water Use
503 346 000 m3
Non-
domestic64%
Domestic
36%
Annual Tariff Revenues
US$643,871,370
Smal l -sca leWat e r
Prov iders
There are no small-scale water providers in Osaka. All consumers are covered by the services of the OsakaMunicipal Waterworks Bureau. Bottled water costs about ¥118 (US$0.95)/liter.
Pr ivateSector
Par t ic ipat ion
In 2002, the Waterworks Law was revised to allow the management and operation of water treatmentplants by third parties. A law was also passed that allowed the use of private financing for investments inthe water utilities; this has been introduced in several cities. While nighttime security and cleaning services
have been contracted out by the Osaka Municipal Waterworks Bureau, private financing and privateoperation of its water treatment functions are still under study.
FloodM anagem en t
The responsibility for flood management in the city lies with the Construction Bureau for river-related floodsand the Urban Environment Bureau for internal drainage, because storm waters drain through the seweragesystem. Flooding from river overflows has been rare in the last 20 years. Around ¥22.5 billion (US$181.5million) were spent on flood management during 1997–2001.
Not es 1 The average number of persons per connection in 2001 wass 2.2. The increase in total connections in 2001 was 14,517.
Dat a as o f 2001 .
OSAKA 55
7/31/2019 Water Utility and City Profiles
http://slidepdf.com/reader/full/water-utility-and-city-profiles 26/37
56 Water in Asian Cities
PHNOM PENH Utility Profile Wat e r U t i l i t y PHNOM PENH W ATER SUPPLY AUTHORI TY
Address : St. 108, Phnom Penh 122001, CambodiaTelephone : (855-16) 820 777Fax : (855-23) 428 969E-mail : [email protected] : Ek Sonn Chan, Director General
The Phnom Penh Water Supply Authority (PPWSA) is an autonomous public enterprise established under the
Phnom Penh Municipal Government in December 1996. It replaces the original utility, which dates back to1895, and is responsible for water production and distribution to the city’s population of nearly 1 millionpeople.
Genera l DataAbou t
Wat e r U t i l i t y
Connections : 74,945Staff : 402Annual O&M Costs : US$ 3,102,250Annual Revenue : US$ 6,794,450Annual Capital Expenditure : US$15,181,580Source of Investment Funds : 78% loan; 20% tariffs; 2% government grant
Wat e rResources
M anagem en t
PPWSA takes raw water from the Mekong, Tonle Sap, and Bassac rivers. There are 3 water treatment plants,with a total production capacity of 120,000 m3 /day (2001). Cambodia is a member of the Mekong RiverCommission and follows the Agreement on Cooperation for the Sustainable Development of the Mekong River
Basin.
Tar i f fS t r uc t u re Category Consumpt ion
( m 3 / m on t h )
Rate
( K R/ m 3) ( US$ / m 3)
Domestic (Residential)
0–78–15
16–50Over 50
550770
1,0101,270
0.1410.1970.2590.325
Commercial and industrial
0–100101–200201–500
Over 500
9501,1501,350
1,450
0.2430.2940.346
0.371Administration (Government)and community connections
Uniform Rate 1,030 0.264
Notes: 1. This tariff structure has been in effect since January 2001.2. Consumers are billed bimonthly. Almost all connections are metered.3. The fee for a 15 mm connection is KR338,400 (US$86.66)–720,000 (US$184.38) depending on the length
of branch extension. Payment can be made in 12 or 20 monthly installments with 10% annual interest.
Pol icy andRegula t ion
The Government has prepared an urban water supply policy and guidelines, which are yet to be finalized andinstitutionalized. The framework of the water policy centers on financial autonomy of public utilities, costrecovery, private sector participation, protecting the poor, and a regulatory mechanism. There is provision for
the establishment of an independent body to provide a credible, competent, and impartial regulatorymechanism for the operation of public, private, and autonomous utilities.
Was t ewa t e ran d
Sani ta t ion
According to a 1999 survey, most households have access to flush toilets connected either to a seweragesystem (41%) or septic tanks (37%), and 12% have no toilet facility. The combined drainage system is inpoor condition, however, and there is no treatment of sewage after collection; all sewers discharge directlyinto a river or low-lying areas. A municipal law requires households to construct a septic tank to treathousehold wastes, but is hard to monitor and enforce because most septic tanks are covered or buried inconcrete. The Wastewater Cleaning Authority of Phnom Penh was established in March 2000 as anautonomous body that is financially independent and self-sustaining through charges levied on customers. Itis responsible for the transportation and disposal of septic tank and industrial effluents. A draft nationalpolicy on urban sanitation was formulated in 1999 but has not been implemented.
7/31/2019 Water Utility and City Profiles
http://slidepdf.com/reader/full/water-utility-and-city-profiles 27/37
City Profile
PHNOM PENH W ATER SUPPLY
Produc t ion &D is t r i bu t i on
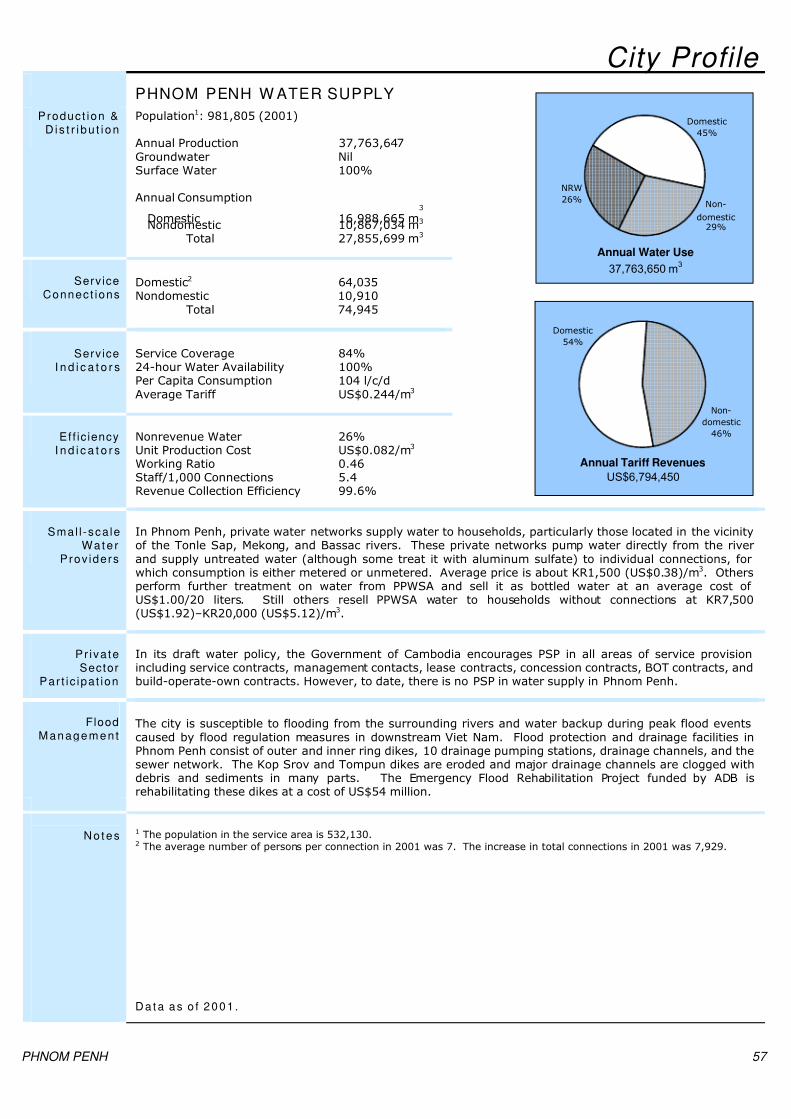
Population1: 981,805 (2001)
Annual Production 37,763,647Groundwater NilSurface Water 100%
Annual Consumption
Domestic 16,988,665 m3
Nondomestic 10,867,034 m3
Total 27,855,699 m3
ServiceConnect ions
Domestic2 64,035Nondomestic 10,910
Total 74,945
ServiceI n d i c a t o r s
Service Coverage 84%24-hour Water Availability 100%Per Capita Consumption 104 l/c/dAverage Tariff US$0.244/m3
Eff ic iencyI n d i c a t o r s
Nonrevenue Water 26%Unit Production Cost US$0.082/m3
Working Ratio 0.46Staff/1,000 Connections 5.4Revenue Collection Efficiency 99.6%
Non-
domestic29%
NRW
26%
Domestic
45%
Annual Water Use
37,763,650 m3
Non-
domestic
46%
Domestic
54%
Annual Tariff Revenues
US$6,794,450
Smal l -sca leWat e r
Prov iders
In Phnom Penh, private water networks supply water to households, particularly those located in the vicinityof the Tonle Sap, Mekong, and Bassac rivers. These private networks pump water directly from the riverand supply untreated water (although some treat it with aluminum sulfate) to individual connections, forwhich consumption is either metered or unmetered. Average price is about KR1,500 (US$0.38)/m3. Othersperform further treatment on water from PPWSA and sell it as bottled water at an average cost of US$1.00/20 liters. Still others resell PPWSA water to households without connections at KR7,500(US$1.92)–KR20,000 (US$5.12)/m3.
Pr ivateSector
Par t ic ipat ion
In its draft water policy, the Government of Cambodia encourages PSP in all areas of service provisionincluding service contracts, management contacts, lease contracts, concession contracts, BOT contracts, andbuild-operate-own contracts. However, to date, there is no PSP in water supply in Phnom Penh.
FloodM anagem en t
The city is susceptible to flooding from the surrounding rivers and water backup during peak flood eventscaused by flood regulation measures in downstream Viet Nam. Flood protection and drainage facilities inPhnom Penh consist of outer and inner ring dikes, 10 drainage pumping stations, drainage channels, and thesewer network. The Kop Srov and Tompun dikes are eroded and major drainage channels are clogged withdebris and sediments in many parts. The Emergency Flood Rehabilitation Project funded by ADB isrehabilitating these dikes at a cost of US$54 million.
Not es1 The population in the service area is 532,130.2 The average number of persons per connection in 2001 was 7. The increase in total connections in 2001 was 7,929.
Dat a as o f 2001 .
PHNOM PENH 57
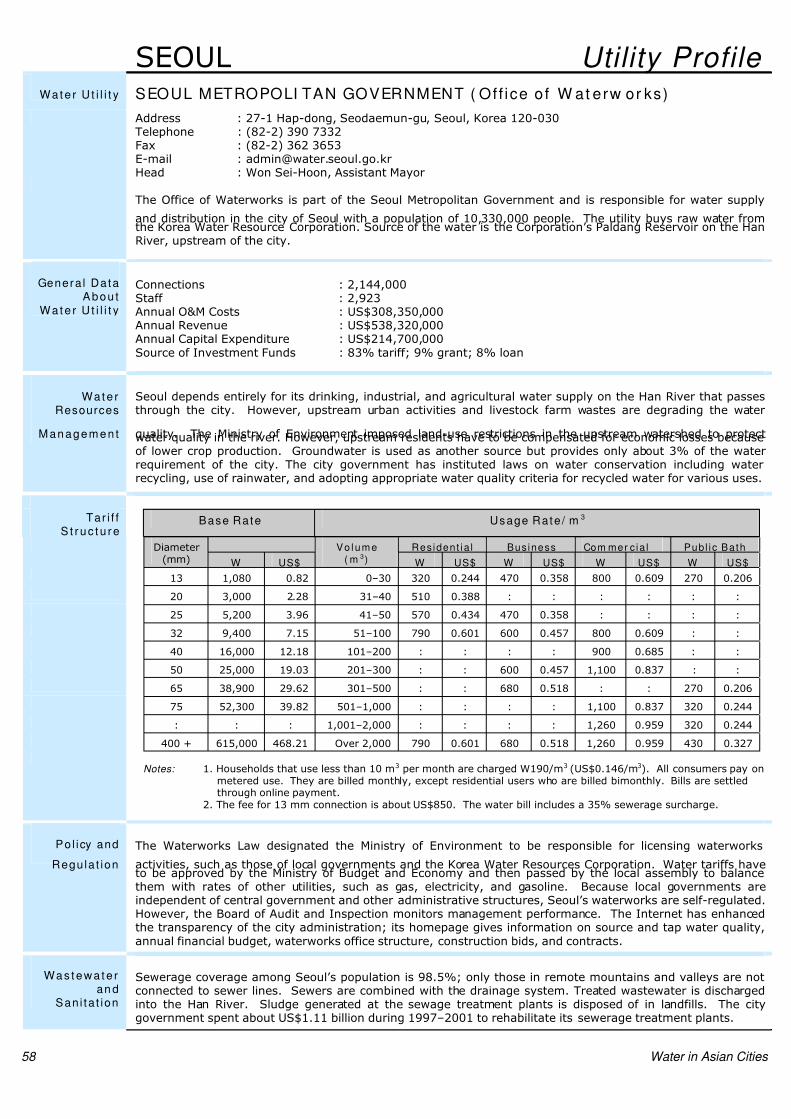
7/31/2019 Water Utility and City Profiles
http://slidepdf.com/reader/full/water-utility-and-city-profiles 28/37
58 Water in Asian Cities
SEOUL Utility Profile
Wat e r U t i l i t y SEOUL METROPOLI TAN GOVERNMENT ( Off ice o f W at erw or ks)
Address : 27-1 Hap-dong, Seodaemun-gu, Seoul, Korea 120-030Telephone : (82-2) 390 7332Fax : (82-2) 362 3653E-mail : [email protected] : Won Sei-Hoon, Assistant Mayor
The Office of Waterworks is part of the Seoul Metropolitan Government and is responsible for water supply
and distribution in the city of Seoul with a population of 10,330,000 people. The utility buys raw water fromthe Korea Water Resource Corporation. Source of the water is the Corporation’s Paldang Reservoir on the HanRiver, upstream of the city.
Genera l DataAbou t
Wat e r U t i l i t y
Connections : 2,144,000Staff : 2,923Annual O&M Costs : US$308,350,000Annual Revenue : US$538,320,000Annual Capital Expenditure : US$214,700,000Source of Investment Funds : 83% tariff; 9% grant; 8% loan
Wat e rResources
M anagem en t
Seoul depends entirely for its drinking, industrial, and agricultural water supply on the Han River that passesthrough the city. However, upstream urban activities and livestock farm wastes are degrading the water
quality. The Ministry of Environment imposed land-use restrictions in the upstream watershed to protectwater quality in the river. However, upstream residents have to be compensated for economic losses becauseof lower crop production. Groundwater is used as another source but provides only about 3% of the waterrequirement of the city. The city government has instituted laws on water conservation including waterrecycling, use of rainwater, and adopting appropriate water quality criteria for recycled water for various uses.
Tar i f fS t r uc t u re
Base Rate Usage Rate / m 3
Resident ia l Business Com mer c ia l Publ i c BathDiameter(mm) W US$
Vo l ume( m 3) W US$ W US$ W US$ W US$
13 1,080 0.82 0–30 320 0.244 470 0.358 800 0.609 270 0.206
20 3,000 2.28 31–40 510 0.388 : : : : : :
25 5,200 3.96 41–50 570 0.434 470 0.358 : : : :
32 9,400 7.15 51–100 790 0.601 600 0.457 800 0.609 : :
40 16,000 12.18 101–200 : : : : 900 0.685 : :
50 25,000 19.03 201–300 : : 600 0.457 1,100 0.837 : :
65 38,900 29.62 301–500 : : 680 0.518 : : 270 0.206
75 52,300 39.82 501–1,000 : : : : 1,100 0.837 320 0.244
: : : 1,001–2,000 : : : : 1,260 0.959 320 0.244
400 + 615,000 468.21 Over 2,000 790 0.601 680 0.518 1,260 0.959 430 0.327
Notes: 1. Households that use less than 10 m3 per month are charged W190/m3 (US$0.146/m3). All consumers pay onmetered use. They are billed monthly, except residential users who are billed bimonthly. Bills are settledthrough online payment.
2. The fee for 13 mm connection is about US$850. The water bill includes a 35% sewerage surcharge.
Pol icy and
Regula t ion
The Waterworks Law designated the Ministry of Environment to be responsible for licensing waterworks
activities, such as those of local governments and the Korea Water Resources Corporation. Water tariffs haveto be approved by the Ministry of Budget and Economy and then passed by the local assembly to balancethem with rates of other utilities, such as gas, electricity, and gasoline. Because local governments areindependent of central government and other administrative structures, Seoul’s waterworks are self-regulated.However, the Board of Audit and Inspection monitors management performance. The Internet has enhancedthe transparency of the city administration; its homepage gives information on source and tap water quality,annual financial budget, waterworks office structure, construction bids, and contracts.
Was t ewa t e ran d
Sani ta t ion
Sewerage coverage among Seoul’s population is 98.5%; only those in remote mountains and valleys are notconnected to sewer lines. Sewers are combined with the drainage system. Treated wastewater is dischargedinto the Han River. Sludge generated at the sewage treatment plants is disposed of in landfills. The citygovernment spent about US$1.11 billion during 1997–2001 to rehabilitate its sewerage treatment plants.

7/31/2019 Water Utility and City Profiles
http://slidepdf.com/reader/full/water-utility-and-city-profiles 29/37
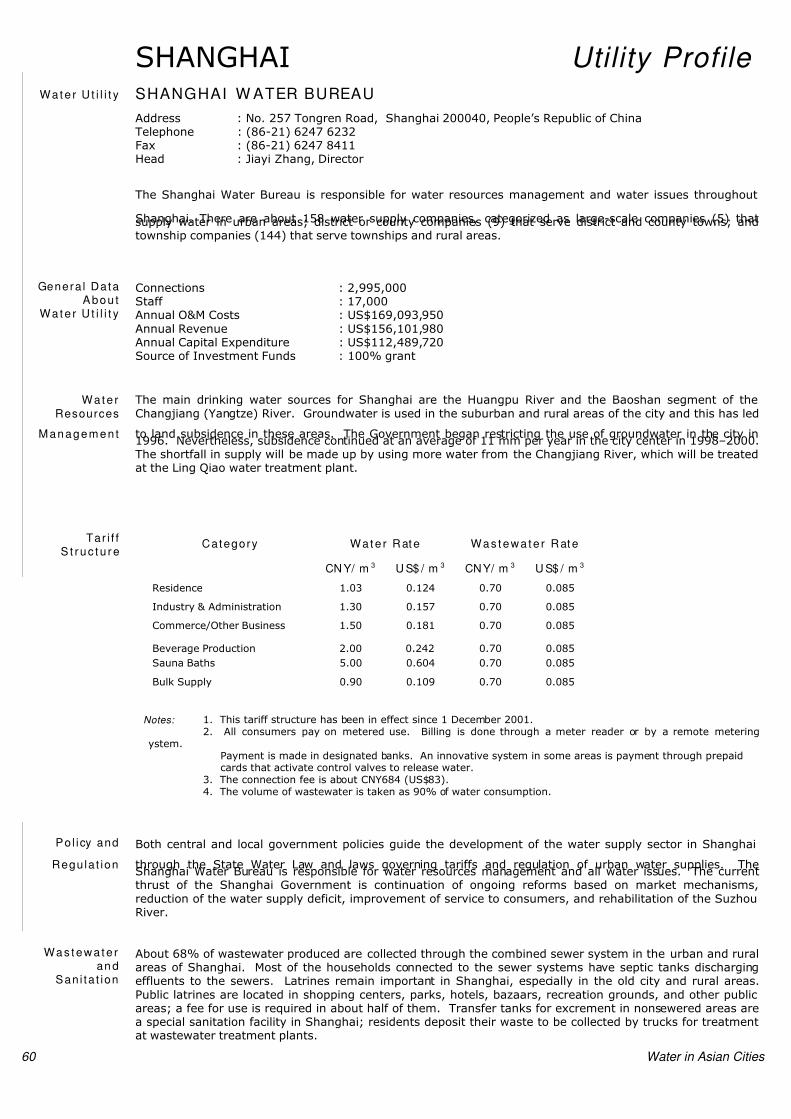
7/31/2019 Water Utility and City Profiles
http://slidepdf.com/reader/full/water-utility-and-city-profiles 30/37
60 Water in Asian Cities
SHANGHAI Utility Profile
Wat e r U t i l i t y SHANGHAI W ATER BUREAU
Address : No. 257 Tongren Road, Shanghai 200040, People’s Republic of ChinaTelephone : (86-21) 6247 6232Fax : (86-21) 6247 8411Head : Jiayi Zhang, Director
The Shanghai Water Bureau is responsible for water resources management and water issues throughout
Shanghai. There are about 158 water supply companies, categorized as large-scale companies (5) thatsupply water in urban areas; district or county companies (9) that serve district and county towns; andtownship companies (144) that serve townships and rural areas.
Genera l DataAbou t
Wat e r U t i l i t y
Connections : 2,995,000Staff : 17,000Annual O&M Costs : US$169,093,950Annual Revenue : US$156,101,980Annual Capital Expenditure : US$112,489,720Source of Investment Funds : 100% grant
Wat e rResources
M anagem en t
The main drinking water sources for Shanghai are the Huangpu River and the Baoshan segment of theChangjiang (Yangtze) River. Groundwater is used in the suburban and rural areas of the city and this has led
to land subsidence in these areas. The Government began restricting the use of groundwater in the city in1996. Nevertheless, subsidence continued at an average of 11 mm per year in the city center in 1998–2000.The shortfall in supply will be made up by using more water from the Changjiang River, which will be treatedat the Ling Qiao water treatment plant.
Tar i f fS t r uc t u re
Wat e r Rat e Was t ewa t e r Rat eCategory
CN Y/ m 3 U S$ / m 3 CNY/ m 3 U S$ / m 3
Residence 1.03 0.124 0.70 0.085
Industry & Administration 1.30 0.157 0.70 0.085
Commerce/Other Business 1.50 0.181 0.70 0.085
Beverage Production 2.00 0.242 0.70 0.085
Sauna Baths 5.00 0.604 0.70 0.085
Bulk Supply 0.90 0.109 0.70 0.085
Notes: 1. This tariff structure has been in effect since 1 December 2001.2. All consumers pay on metered use. Billing is done through a meter reader or by a remote metering
ystem.Payment is made in designated banks. An innovative system in some areas is payment through prepaidcards that activate control valves to release water.
3. The connection fee is about CNY684 (US$83).4. The volume of wastewater is taken as 90% of water consumption.
Pol icy and
Regula t ion
Both central and local government policies guide the development of the water supply sector in Shanghai
through the State Water Law and laws governing tariffs and regulation of urban water supplies. TheShanghai Water Bureau is responsible for water resources management and all water issues. The currentthrust of the Shanghai Government is continuation of ongoing reforms based on market mechanisms,reduction of the water supply deficit, improvement of service to consumers, and rehabilitation of the SuzhouRiver.
Was t ewa t e ran d
Sani ta t ion
About 68% of wastewater produced are collected through the combined sewer system in the urban and ruralareas of Shanghai. Most of the households connected to the sewer systems have septic tanks dischargingeffluents to the sewers. Latrines remain important in Shanghai, especially in the old city and rural areas.Public latrines are located in shopping centers, parks, hotels, bazaars, recreation grounds, and other publicareas; a fee for use is required in about half of them. Transfer tanks for excrement in nonsewered areas area special sanitation facility in Shanghai; residents deposit their waste to be collected by trucks for treatmentat wastewater treatment plants.

7/31/2019 Water Utility and City Profiles
http://slidepdf.com/reader/full/water-utility-and-city-profiles 31/37
City Profile
SHANGHAI W ATER SUPPLY
Produc t ion &D is t r i bu t i on
Population1: 10,500,000 (2001)
Annual Production 1,805,620,000 m3
Groundwater 30%Surface Water 70%
Annual Consumption
Domestic 962,760,000 m3
Nondomestic 545,410,000 m3
Total 1,508,170,000 m3
ServiceConnect ions
Domestic2 2,972,053Nondomestic 22,947
Total 2,995,000
ServiceI n d i c a t o r s
Service Coverage 100%24-hour Water Availability 100%Per Capita Consumption 251 l/c/dAverage Tariff US$0.104/m3
Eff ic iencyI n d i c a t o r s
Nonrevenue Water 16%Unit Production Cost US$0.094/m3
Working Ratio 1.08Staff/1,000 Connections 5.7Revenue Collection Efficiency 93.5%
Non-domestic
30%
NRW
16%Domestic
54%
Annual Water Use
1,805,620,000 m3
Non-
domestic
41%
Domestic
59%
Annual Tariff Revenues
US$156,101,980
Smal l -sca leWat e r
Prov iders
Of the 158 water supply companies in Shanghai, 64 have supply capacities of only 2,000–10,000 m 3 /day.These small suppliers provide only 3.9% of the total water supply and serve about 9% of the populationwith piped water in the rural areas of Shanghai. The Government plans to either close or merge most of these small companies because many are not profitable due to low tariffs and poor management. By doingthis, the Government hopes to increase supply capacity, improve efficient use of water resources, improvewater quality, and reduce costs. Small-scale providers that distribute water by tankers do not exist inShanghai.
Pr ivateSector
Par t ic ipat ion
Pudong-Vivendi Water Supply Co., Ltd. is the only large-scale joint venture by the Government with aprivate company, with Vivendi Water holding 50% of the stocks of the company. It mainly supplies water toPudong region’s urban districts, providing 1.7 million m3 of water daily to a population of 1.71 million. Thisis the first case in the PRC in which a private company participates not only in water treatment operationsbut also in piped water distribution.
FloodM anagem en t
Shanghai is in the lower reaches of the Taihu watershed, bounded in the east and north sides by a longcoastline; the Huangpu and Suzhou rivers cross the center of the city. The city’s flat topography and alluvialnature make it susceptible to flooding, even in the city center. The storm drainage system covers only 60%of the urban areas. Expenditure for flood management and control in 1996–2000 was about CNY6.063billion (US$732 million).
Not es 1 Total population of Shanghai including those in the suburban and rural areas was 16,740,000 in 2001.2 The average number of persons per connection in 2001 was 3.5. The increase in total connections was 33,000.
Dat a as o f 2001 .
SHANGHAI 61
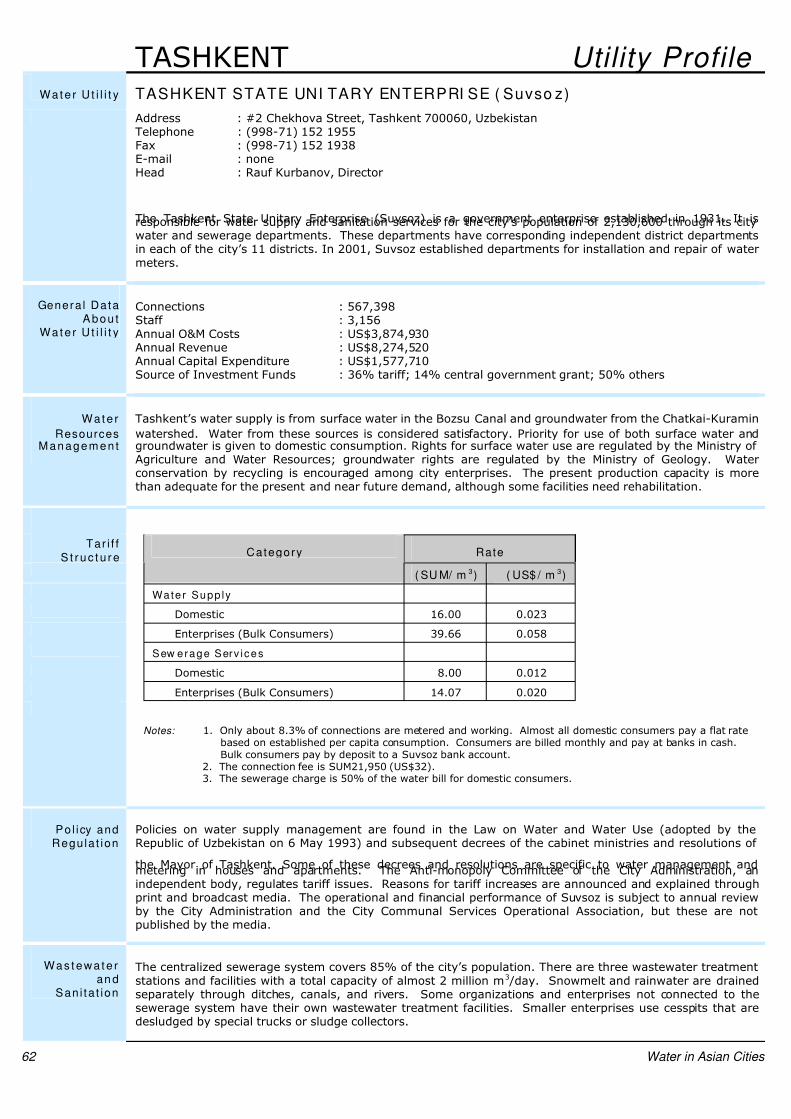
7/31/2019 Water Utility and City Profiles
http://slidepdf.com/reader/full/water-utility-and-city-profiles 32/37
62 Water in Asian Cities
TASHKENT Utility Profile
Wat e r U t i l i t y TASHKENT STATE UNI TARY ENTERPRI SE ( Suvso z)
Address : #2 Chekhova Street, Tashkent 700060, UzbekistanTelephone : (998-71) 152 1955Fax : (998-71) 152 1938E-mail : noneHead : Rauf Kurbanov, Director
The Tashkent State Unitary Enterprise (Suvsoz) is a government enterprise established in 1931. It isresponsible for water supply and sanitation services for the city’s population of 2,130,600 through its citywater and sewerage departments. These departments have corresponding independent district departmentsin each of the city’s 11 districts. In 2001, Suvsoz established departments for installation and repair of watermeters.
Genera l DataAbou t
Wat e r U t i l i t y
Connections : 567,398Staff : 3,156Annual O&M Costs : US$3,874,930Annual Revenue : US$8,274,520Annual Capital Expenditure : US$1,577,710Source of Investment Funds : 36% tariff; 14% central government grant; 50% others
Wat e r
ResourcesM anagem en t
Tashkent’s water supply is from surface water in the Bozsu Canal and groundwater from the Chatkai-Kuramin
watershed. Water from these sources is considered satisfactory. Priority for use of both surface water andgroundwater is given to domestic consumption. Rights for surface water use are regulated by the Ministry of Agriculture and Water Resources; groundwater rights are regulated by the Ministry of Geology. Waterconservation by recycling is encouraged among city enterprises. The present production capacity is morethan adequate for the present and near future demand, although some facilities need rehabilitation.
Tar i f fS t r uc t u re Rate Category
( SU M/ m 3) ( US$ / m 3)
Water Supp ly
Domestic 16.00 0.023
Enterprises (Bulk Consumers) 39.66 0.058
Sew erage Serv ices
Domestic 8.00 0.012
Enterprises (Bulk Consumers) 14.07 0.020
Notes: 1. Only about 8.3% of connections are metered and working. Almost all domestic consumers pay a flat ratebased on established per capita consumption. Consumers are billed monthly and pay at banks in cash.Bulk consumers pay by deposit to a Suvsoz bank account.
2. The connection fee is SUM21,950 (US$32).3. The sewerage charge is 50% of the water bill for domestic consumers.
Pol icy andRegula t ion
Policies on water supply management are found in the Law on Water and Water Use (adopted by theRepublic of Uzbekistan on 6 May 1993) and subsequent decrees of the cabinet ministries and resolutions of
the Mayor of Tashkent. Some of these decrees and resolutions are specific to water management andmetering in houses and apartments. The Anti-monopoly Committee of the City Administration, anindependent body, regulates tariff issues. Reasons for tariff increases are announced and explained throughprint and broadcast media. The operational and financial performance of Suvsoz is subject to annual reviewby the City Administration and the City Communal Services Operational Association, but these are notpublished by the media.
Was t ewa t e ran d
Sani ta t ion
The centralized sewerage system covers 85% of the city’s population. There are three wastewater treatmentstations and facilities with a total capacity of almost 2 million m3 /day. Snowmelt and rainwater are drainedseparately through ditches, canals, and rivers. Some organizations and enterprises not connected to thesewerage system have their own wastewater treatment facilities. Smaller enterprises use cesspits that aredesludged by special trucks or sludge collectors.
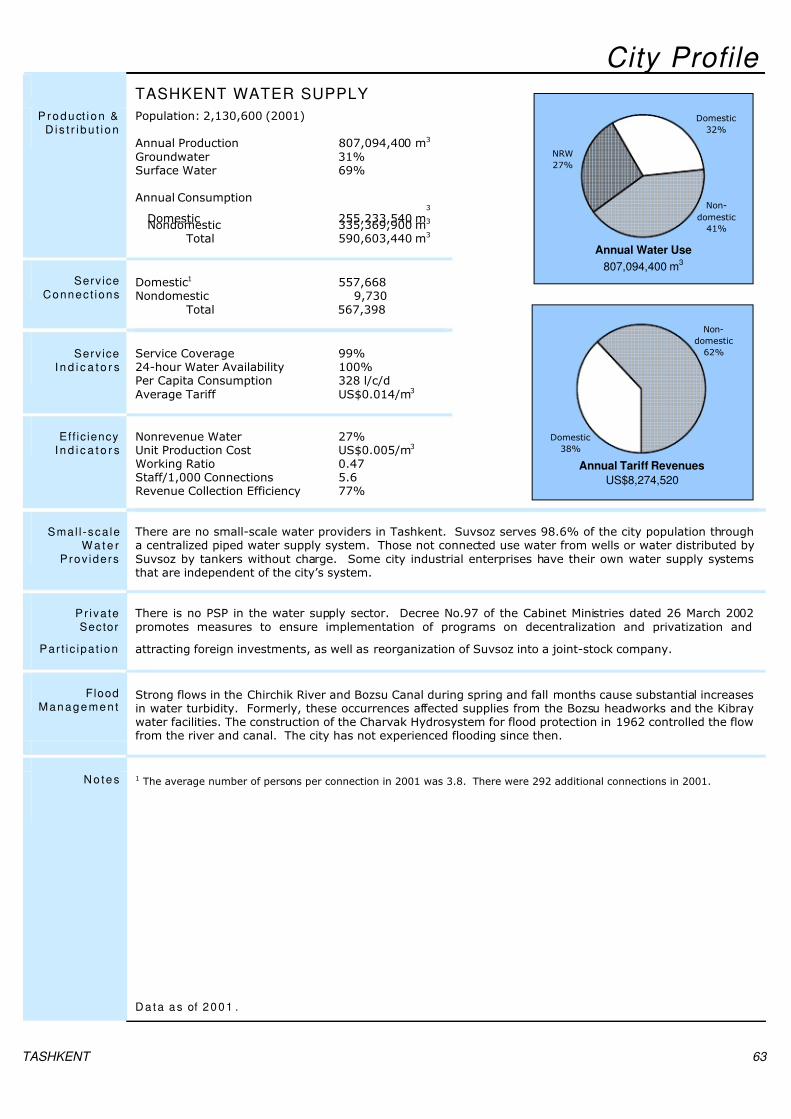
7/31/2019 Water Utility and City Profiles
http://slidepdf.com/reader/full/water-utility-and-city-profiles 33/37
TASHKENT 63
City Profile TASHKENT WATER SUPPLY
P r oduct i on &D is t r i bu t i on
Population: 2,130,600 (2001)
Annual Production 807,094,400 m3 Groundwater 31%Surface Water 69%
Annual Consumption
Domestic 255,233,540 m3
Nondomestic 335,369,900 m3
Total 590,603,440 m3
Serv ice
Connec t ionsDomestic1 557,668Nondomestic 9,730
Total 567,398
Serv iceI n d i c a t o r s
Service Coverage 99%24-hour Water Availability 100%Per Capita Consumption 328 l/c/dAverage Tariff US$0.014/m3
Eff ic iencyI n d i c a t o r s
Nonrevenue Water 27%Unit Production Cost US$0.005/m3 Working Ratio 0.47Staff/1,000 Connections 5.6Revenue Collection Efficiency 77%
Non-
domestic
41%
NRW
27%
Domestic
32%
Annual Water Use
807,094,400 m3
Non-
domestic
62%
Domestic
38%
Annual Tariff Revenues
US$8,274,520
Smal l -sca leW a t e r
Prov iders
There are no small-scale water providers in Tashkent. Suvsoz serves 98.6% of the city population througha centralized piped water supply system. Those not connected use water from wells or water distributed bySuvsoz by tankers without charge. Some city industrial enterprises have their own water supply systemsthat are independent of the city’s system.
Pr iva teSector
Par t ic ipa t ion
There is no PSP in the water supply sector. Decree No.97 of the Cabinet Ministries dated 26 March 2002promotes measures to ensure implementation of programs on decentralization and privatization and
attracting foreign investments, as well as reorganization of Suvsoz into a joint-stock company.
FloodManagemen t
Strong flows in the Chirchik River and Bozsu Canal during spring and fall months cause substantial increasesin water turbidity. Formerly, these occurrences affected supplies from the Bozsu headworks and the Kibraywater facilities. The construction of the Charvak Hydrosystem for flood protection in 1962 controlled the flowfrom the river and canal. The city has not experienced flooding since then.
N otes 1 The average number of persons per connection in 2001 was 3.8. There were 292 additional connections in 2001.
D ata as of 2001 .
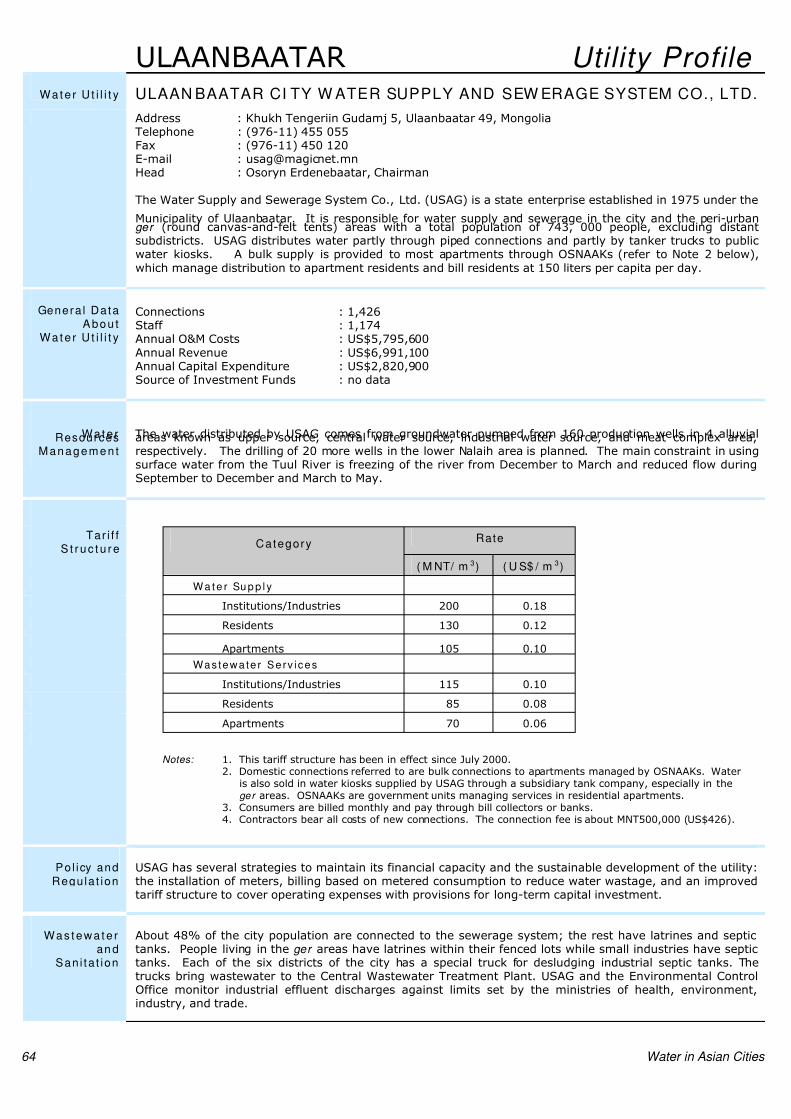
7/31/2019 Water Utility and City Profiles
http://slidepdf.com/reader/full/water-utility-and-city-profiles 34/37
64 Water in Asian Cities
ULAANBAATAR Utility Profile
Wat e r U t i l i t y ULAAN BAATAR CI TY W ATER SUPPLY AND SEW ERAGE SYSTEM CO., LTD.
Address : Khukh Tengeriin Gudamj 5, Ulaanbaatar 49, MongoliaTelephone : (976-11) 455 055Fax : (976-11) 450 120E-mail : [email protected] : Osoryn Erdenebaatar, Chairman
The Water Supply and Sewerage System Co., Ltd. (USAG) is a state enterprise established in 1975 under the
Municipality of Ulaanbaatar. It is responsible for water supply and sewerage in the city and the peri-urbanger (round canvas-and-felt tents) areas with a total population of 743, 000 people, excluding distantsubdistricts. USAG distributes water partly through piped connections and partly by tanker trucks to publicwater kiosks. A bulk supply is provided to most apartments through OSNAAKs (refer to Note 2 below),which manage distribution to apartment residents and bill residents at 150 liters per capita per day.
Genera l DataAbou t
Wat e r U t i l i t y
Connections : 1,426Staff : 1,174Annual O&M Costs : US$5,795,600Annual Revenue : US$6,991,100Annual Capital Expenditure : US$2,820,900Source of Investment Funds : no data
Wat e rResourcesM anagem en t
The water distributed by USAG comes from groundwater pumped from 160 production wells in 4 alluvialareas known as upper source, central water source, industrial water source, and meat complex area,respectively. The drilling of 20 more wells in the lower Nalaih area is planned. The main constraint in usingsurface water from the Tuul River is freezing of the river from December to March and reduced flow duringSeptember to December and March to May.
Tar i f fS t r uc t u re
Rate Category
( M NT/ m 3) ( U S$ / m 3)
Wa te r Su p p l y
Institutions/Industries 200 0.18
Residents 130 0.12
Apartments 105 0.10
Wastewate r Serv ices
Institutions/Industries 115 0.10
Residents 85 0.08
Apartments 70 0.06
Notes: 1. This tariff structure has been in effect since July 2000.2. Domestic connections referred to are bulk connections to apartments managed by OSNAAKs. Water
is also sold in water kiosks supplied by USAG through a subsidiary tank company, especially in theger areas. OSNAAKs are government units managing services in residential apartments.
3. Consumers are billed monthly and pay through bill collectors or banks.4. Contractors bear all costs of new connections. The connection fee is about MNT500,000 (US$426).
Pol icy andRegula t ion
USAG has several strategies to maintain its financial capacity and the sustainable development of the utility:the installation of meters, billing based on metered consumption to reduce water wastage, and an improvedtariff structure to cover operating expenses with provisions for long-term capital investment.
Was t ewa t e ran d
Sani ta t ion
About 48% of the city population are connected to the sewerage system; the rest have latrines and septictanks. People living in the ger areas have latrines within their fenced lots while small industries have septictanks. Each of the six districts of the city has a special truck for desludging industrial septic tanks. Thetrucks bring wastewater to the Central Wastewater Treatment Plant. USAG and the Environmental ControlOffice monitor industrial effluent discharges against limits set by the ministries of health, environment,industry, and trade.
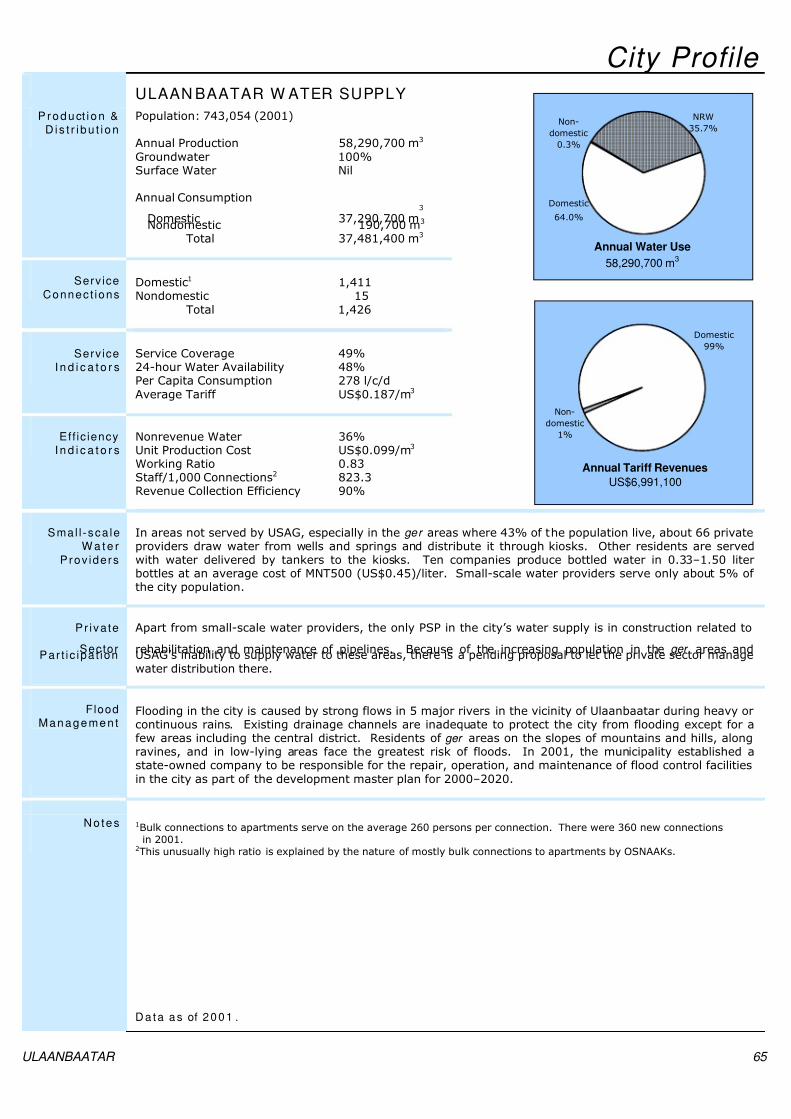
7/31/2019 Water Utility and City Profiles
http://slidepdf.com/reader/full/water-utility-and-city-profiles 35/37
ULAANBAATAR 65
City Profile ULAAN BAATAR W ATER SUPPLY
P r oduct i on &D is t r i bu t i on
Population: 743,054 (2001)
Annual Production 58,290,700 m3 Groundwater 100%Surface Water Nil
Annual Consumption
Domestic 37,290,700 m3
Nondomestic 190,700 m3
Total 37,481,400 m3
Serv ice
Connec t ionsDomestic1 1,411Nondomestic 15
Total 1,426
Serv iceI n d i c a t o r s
Service Coverage 49%24-hour Water Availability 48%Per Capita Consumption 278 l/c/dAverage Tariff US$0.187/m3
Eff ic iencyI n d i c a t o r s
Nonrevenue Water 36%Unit Production Cost US$0.099/m3 Working Ratio 0.83Staff/1,000 Connections2 823.3Revenue Collection Efficiency 90%
Non-
domestic
0.3%
NRW
35.7%
Domestic
64.0%
Annual Water Use
58,290,700 m3
Non-
domestic
1%
Domestic
99%
Annual Tariff Revenues
US$6,991,100
Smal l -sca leW a t e r
Prov iders
In areas not served by USAG, especially in the ger areas where 43% of the population live, about 66 privateproviders draw water from wells and springs and distribute it through kiosks. Other residents are servedwith water delivered by tankers to the kiosks. Ten companies produce bottled water in 0.33–1.50 literbottles at an average cost of MNT500 (US$0.45)/liter. Small-scale water providers serve only about 5% of the city population.
Pr iva te
SectorPar t ic ipa t ion
Apart from small-scale water providers, the only PSP in the city’s water supply is in construction related to
rehabilitation and maintenance of pipelines. Because of the increasing population in the ger areas andUSAG’s inability to supply water to these areas, there is a pending proposal to let the private sector managewater distribution there.
FloodManagemen t
Flooding in the city is caused by strong flows in 5 major rivers in the vicinity of Ulaanbaatar during heavy orcontinuous rains. Existing drainage channels are inadequate to protect the city from flooding except for afew areas including the central district. Residents of ger areas on the slopes of mountains and hills, alongravines, and in low-lying areas face the greatest risk of floods. In 2001, the municipality established astate-owned company to be responsible for the repair, operation, and maintenance of flood control facilitiesin the city as part of the development master plan for 2000–2020.
N otes 1Bulk connections to apartments serve on the average 260 persons per connection. There were 360 new connectionsin 2001.
2This unusually high ratio is explained by the nature of mostly bulk connections to apartments by OSNAAKs.
D ata as of 2001 .

7/31/2019 Water Utility and City Profiles
http://slidepdf.com/reader/full/water-utility-and-city-profiles 36/37
66 Water in Asian Cities
VIENTIANE Utility Profile Wat e r U t i l i t y VI ENTI ANE W ATER SUPPLY COMPANY ( Nam Papa Vient iane)
Address : Box 2571, Phonekheng Road, Vientiane, Lao PDRTelephone : (856-21) 412 880Fax : (856-21) 414 378E-mail : [email protected] : Daophet Bouapha, General Manager
Vientiane Water Supply Company (Nam Papa Vientiane) is the water utility operator for Vientiane Prefectureincluding the city of about 616,000 people. Prior to 1999, the Lao Water Supply Company (Nam Papa Lao), anational government enterprise established in 1962, was responsible for the water supply of the entirecountry including Vientiane. In line with the decentralization policy of the Government, each province is nowresponsible for water supply within its own boundaries. State-owned enterprises (known as Nam Papas) arecurrently managing all urban water systems in provinces that own such facilities.
Genera l DataAbou t
Wat e r U t i l i t y
Connections : 42,052Staff : 440Annual O&M Costs : US$1,281,540Annual Revenue : US$1,170,330Annual Capital Expenditure : US$1,957,010Source of Investment Funds : 60% tariff; 33% connection fees; 7% government grant
Wat e rResources
M anagem en t
Water availability is high because of low population density. The main use is in agriculture for irrigation(82%); industry uses 10% and households the remaining 8%. The water sources for Vientiane Prefectureand four other large urban centers are the Mekong River and groundwater. The water in the river and its
tributaries within the prefecture is not significantly polluted, although there is high turbidity during the rainyseason. Presidential Decree No. 126, promulgated in November 1966, governs the administration, use, anddevelopment of water and water resources in the Lao People’s Democratic Republic so as to preserve andsustain the resources, ensure water quality and quantity, and protect the environment.
Tar i f f
S t r uc t u re M on t h l yConsumpt ion
Rate Month ly Consum pt ion Rate
( m 3) ( KN/ m 3 ) ( U S$ / m 3) ( m 3) ( KN / m 3) ( U S$ / m 3)
I . Domes t i c andGovernment Of f i ces
0–5 m3
6–20 m3
21–50 m3
Over 50 m3
219263329383
0.0230.0280.0350.040
I I I . En t e rp r i ses & Bus i ness(using water as raw material)
0–50 m3
51–100 m3
Over 100 m3
8551,2161,360
0.0900.1280.143
I I . En t e rp r i ses &Business (not usingwater as rawmaterial)
0–5 m3
6–20 m3
21–50 m3
Over 50 m3
549602636670
0.0580.0630.0670.071
I V . D ip lomat ic Personnel / Fore igners
0–10 m3
Over 10 m3
6,1847,668
0.6520.808
Notes: 1. This tariff structure has been in effect since 1 September 2001.2. All consumers pay on metered use. Payment is through bill collectors or at the water utility office.3. Tariff setting objectives are to recover costs including O&M and to generate enough surplus to meet
a portion of debt service.4. The connection fee for a 15 mm domestic connection is KN700,000 (US$74).
Pol icy andRegula t ion
Prime Ministerial Decision No 37 defines the government policy on management and development of thewater supply and sanitation sector. It includes strategies, targets, and operational framework for effectiveand sustainable financing, development, and management of the water supply and wastewater systems inurban and rural areas throughout the country. The Government established the Water Supply Authority tooversee developments in the water supply sector, the planning of projects in urban and rural areas, and toregulate the water supply and wastewater sector. Nam Papas are regulated within the provinces throughBusiness Law 42/PR and each is responsible to a Water Administration Board.
Was t ewa t e ran d
Sani ta t ion
No urban center has a comprehensive piped sewerage system. A small-bore sewer system installed in alimited area in Vientiane municipality is not working due to blockages. In areas with onsite sanitation, septictank effluents discharge into storm drains to watercourses. Pit latrines are desludged irregularly. There is nonational agency responsible for sanitation in the urban centers, although Nam Saat is responsible forsanitation in the rural areas.
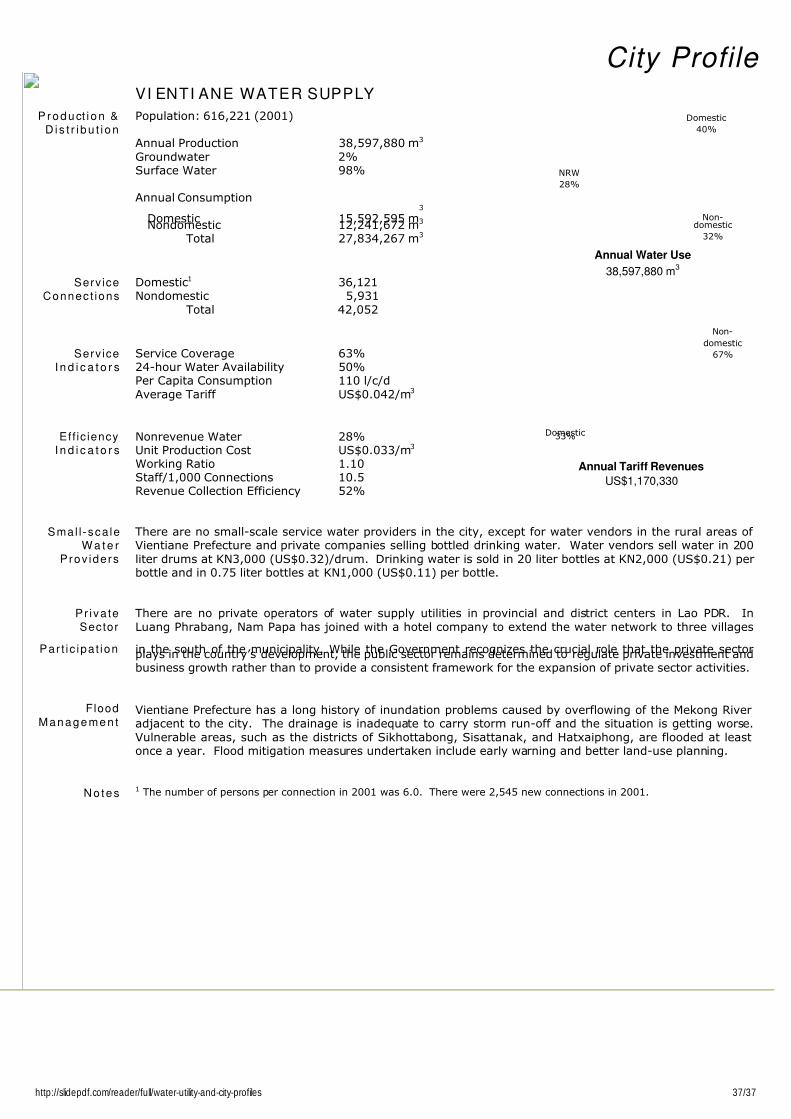
7/31/2019 Water Utility and City Profiles
http://slidepdf.com/reader/full/water-utility-and-city-profiles 37/37
City Profile VI ENTI ANE WATER SUPPLY
P r oduct i on &D is t r i bu t i on
Population: 616,221 (2001)
Annual Production 38,597,880 m3 Groundwater 2%Surface Water 98%
Annual Consumption
Domestic 15,592,595 m3
Nondomestic 12,241,672 m3
Total 27,834,267 m3
Serv iceConnec t ions
Domestic1 36,121Nondomestic 5,931
Total 42,052
Serv iceI n d i c a t o r s
Service Coverage 63%24-hour Water Availability 50%Per Capita Consumption 110 l/c/dAverage Tariff US$0.042/m3
Eff ic iencyI n d i c a t o r s
Nonrevenue Water 28%Unit Production Cost US$0.033/m3 Working Ratio 1.10Staff/1,000 Connections 10.5Revenue Collection Efficiency 52%
Non-domestic
32%
NRW
28%
Domestic
40%
Annual Water Use
38,597,880 m3
Non-
domestic
67%
Domestic33%
Annual Tariff Revenues
US$1,170,330
Smal l -sca leW a t e r
Prov iders
There are no small-scale service water providers in the city, except for water vendors in the rural areas of Vientiane Prefecture and private companies selling bottled drinking water. Water vendors sell water in 200liter drums at KN3,000 (US$0.32)/drum. Drinking water is sold in 20 liter bottles at KN2,000 (US$0.21) perbottle and in 0.75 liter bottles at KN1,000 (US$0.11) per bottle.
Pr iva teSector
Par t ic ipa t ion
There are no private operators of water supply utilities in provincial and district centers in Lao PDR. InLuang Phrabang, Nam Papa has joined with a hotel company to extend the water network to three villages
in the south of the municipality. While the Government recognizes the crucial role that the private sectorplays in the country’s development, the public sector remains determined to regulate private investment andbusiness growth rather than to provide a consistent framework for the expansion of private sector activities.
Flood
Managemen tVientiane Prefecture has a long history of inundation problems caused by overflowing of the Mekong Riveradjacent to the city. The drainage is inadequate to carry storm run-off and the situation is getting worse.Vulnerable areas, such as the districts of Sikhottabong, Sisattanak, and Hatxaiphong, are flooded at leastonce a year. Flood mitigation measures undertaken include early warning and better land-use planning.
N otes1 The number of persons per connection in 2001 was 6.0. There were 2,545 new connections in 2001.