Embed Size (px)
Citation preview
IntroductIon: trends In oIl and gas productIon globally
Water use in oil and gas
02
The oil and gas industry is undergoing a series of dramatic shifts with one common outcome: extracting hydrocarbons is harder than ever before. Production from the world’s largest conventional fields is in decline while national oil companies continue to control the majority of the world’s oil reserves. Simultaneously, global demand for oil and gas continues to grow, fueled in large part by emerging economies.
As a result, producers have resorted to new techniques to bypass declining and inaccessible legacy sources of oil and gas. The last five years have seen a dramatic increase in production from unconventional sources. These sources – shale, oil sands, deep water offshore – represented 47 percent of capital spending in the oil industry in 2012.i Producers are using more to get less – more labor, more energy, more time, more water – which all leads to higher costs for both producers and consumers.
This paper will focus on the challenges in managing the most critical and costliest input to the extraction process: water.
Xylem believes that for an industry focused on improving margins, solving water challenges may be the best opportunity to reduce costs, improve profitability and preserve the natural environment around extraction points. From the water used to flood declining conventional and offshore wells, to the water injected to fracture underground shale, to the steam required for oil sands extraction, water is the most important input to the oil and gas industry.
Water is critically important because its supply is also under stress. By 2030, if current trends continue, global water requirements are expected to exceed supplies by 40 percent.ii This trend is all the more relevant in oil and gas production, as many of the world’s largest reserves reside in the most water-starved regions. Oil and gas producers should be concerned with water not only as a proactive step to be more efficient, but also as a defensive step against declining water supplies.
Xylem is dedicated to helping solve water-related challenges around the world by protecting water quality, enhancing water productivity, and making water-intensive industries more resilient in the face of climate change and an uncertain regulatory environment.
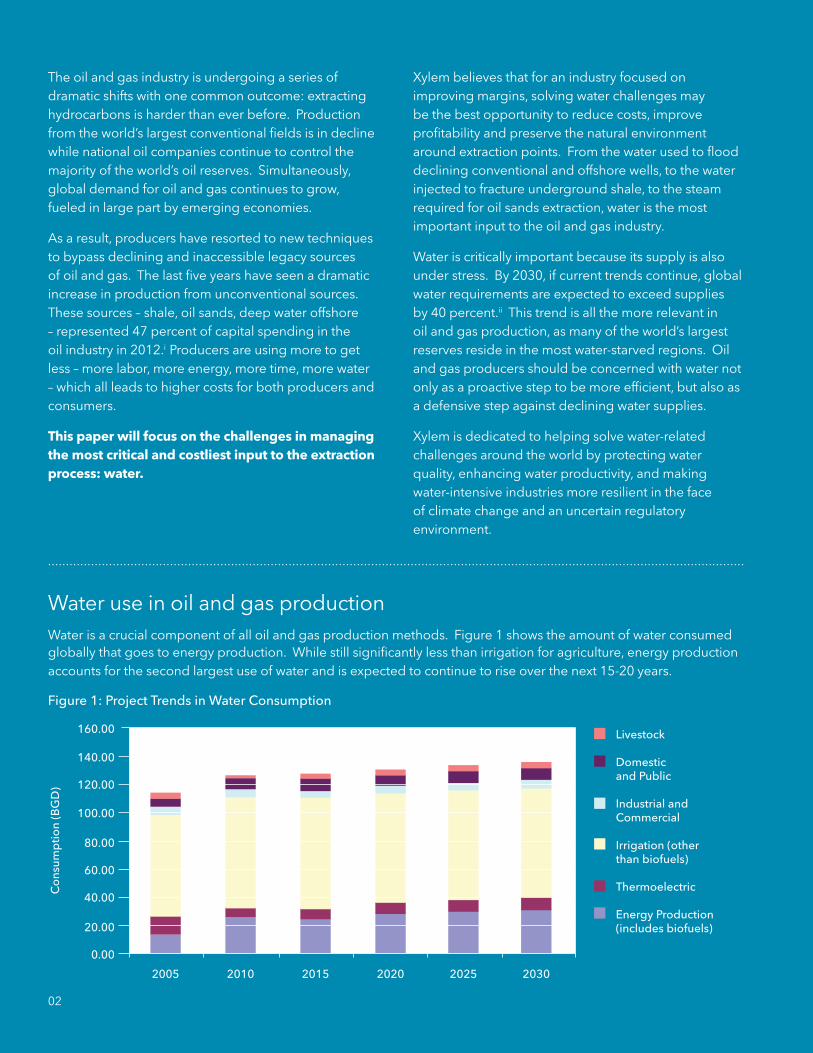
Water use in oil and gas productionWater is a crucial component of all oil and gas production methods. Figure 1 shows the amount of water consumed globally that goes to energy production. While still significantly less than irrigation for agriculture, energy production accounts for the second largest use of water and is expected to continue to rise over the next 15-20 years.
..................................................................................................................................................................................................
160.00
140.00
120.00
100.00
80.00
60.00
40.00
20.00
0.00
2005
Co
nsum
ptio
n (B
GD
)
2010 2015 2020
Livestock
Domestic and Public
Industrial andCommercial
Irrigation (otherthan biofuels)
Thermoelectric
Energy Production(includes biofuels)
2025 2030
Figure 1: project trends in Water consumption
03
table 1: Water coefficients in primary energy production
Energy Source Water coefficient (m3/TJ) Source
Oil (1)
Crude oil (OPEC) 78 Wu et al., 2009
Crude oil (Non-OPEC)
Primary recovery 6 Gleick, 1994
Secondary recovery 600 Gleick, 1994
EOR using steam 140 Gleick, 1994
EOR using CO2 640 Gleick, 1994
Bitumen
Mining 26 Wu et al., 2009
In situ SAGD 8 Wu et al., 2009
In situ CSS 14 Wu et al., 2009
In situ multi-scheme 32 Wu et al., 2009
Heavy oil 14 Wu et al., 2009
Natural gas liquids 6 Gleick, 1994
Coal-to-liquids 53 Gleick, 1994
Natural Gas
Conventional gas negligible Gleick, 1994
Unconventional gas
Coalbed methane negligible Elcock, 2008
Shale gas 0.4 Elcock, 2008
Tight gas 0.4 Elcock, 2008
Coal
Surface mining 2 Gleick, 1994
Underground mining 12 Gleick, 1994
Upgrading (washing) 4 Gleick, 1994
Nuclear
Uranium mining
Open-pit negligible Mudd & Diesendorf, 2007
Underground negligible Mudd & Diesendorf, 2007
In-situ leaching 0.1 Mudd & Diesendorf, 2007
Co-product negligible Mudd & Diesendorf, 2007
Uranium conversion 4 Gleick, 1994
Uranium enrichment
Gaseous diffusion 12 Gleick, 1994
Centrifuge 2 Gleick, 1994
Biomass 25,000 Berndes, 2002
1) The IEA considers different petroleum products under its definition of oil (including natural gas liquids and coal-to-liquids).
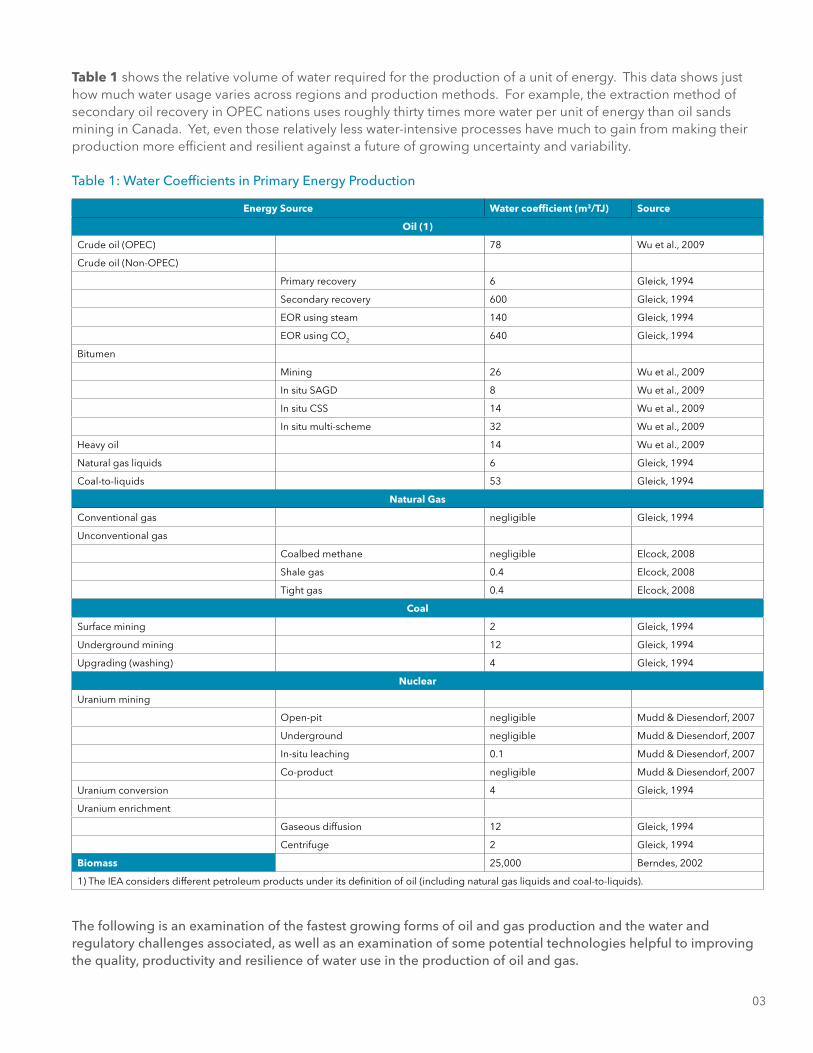
Table 1 shows the relative volume of water required for the production of a unit of energy. This data shows just how much water usage varies across regions and production methods. For example, the extraction method of secondary oil recovery in OPEC nations uses roughly thirty times more water per unit of energy than oil sands mining in Canada. Yet, even those relatively less water-intensive processes have much to gain from making their production more efficient and resilient against a future of growing uncertainty and variability.
the following is an examination of the fastest growing forms of oil and gas production and the water and regulatory challenges associated, as well as an examination of some potential technologies helpful to improving the quality, productivity and resilience of water use in the production of oil and gas.
04
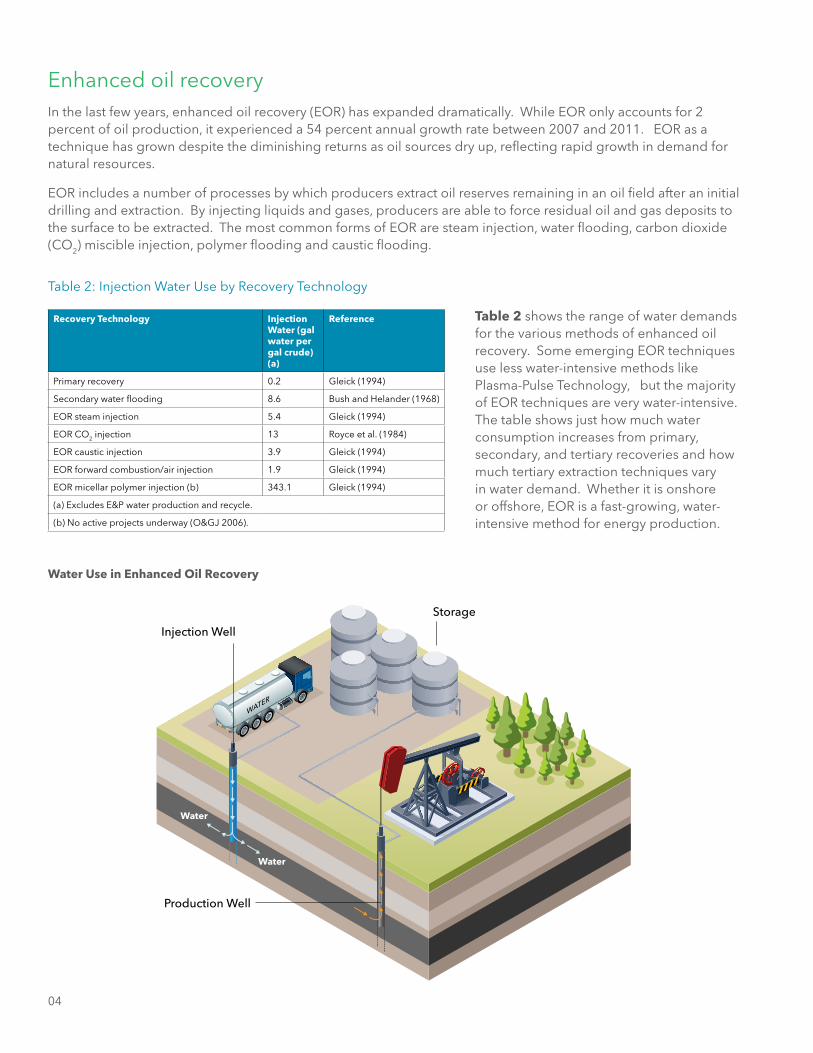
Enhanced oil recoveryIn the last few years, enhanced oil recovery (EOR) has expanded dramatically. While EOR only accounts for 2 percent of oil production, it experienced a 54 percent annual growth rate between 2007 and 2011. EOR as a technique has grown despite the diminishing returns as oil sources dry up, reflecting rapid growth in demand for natural resources.
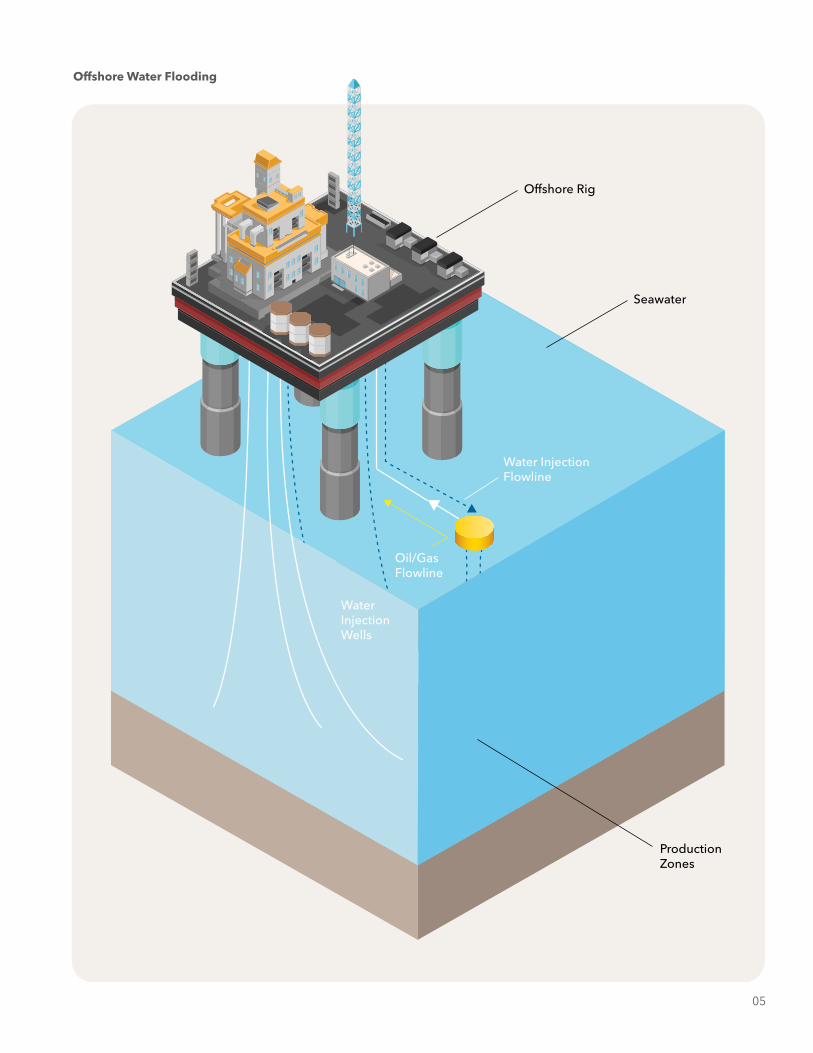
EOR includes a number of processes by which producers extract oil reserves remaining in an oil field after an initial drilling and extraction. By injecting liquids and gases, producers are able to force residual oil and gas deposits to the surface to be extracted. The most common forms of EOR are steam injection, water flooding, carbon dioxide (CO2) miscible injection, polymer flooding and caustic flooding.
Table 2 shows the range of water demands for the various methods of enhanced oil recovery. Some emerging EOR techniques use less water-intensive methods like Plasma-Pulse Technology, but the majority of EOR techniques are very water-intensive. The table shows just how much water consumption increases from primary, secondary, and tertiary recoveries and how much tertiary extraction techniques vary in water demand. Whether it is onshore or offshore, EOR is a fast-growing, water-intensive method for energy production.
Table 2: Injection Water Use by Recovery Technology
Recovery Technology Injection Water (gal water per gal crude) (a)
Reference
Primary recovery 0.2 Gleick (1994)
Secondary water flooding 8.6 Bush and Helander (1968)
EOR steam injection 5.4 Gleick (1994)
EOR CO2 injection 13 Royce et al. (1984)
EOR caustic injection 3.9 Gleick (1994)
EOR forward combustion/air injection 1.9 Gleick (1994)
EOR micellar polymer injection (b) 343.1 Gleick (1994)
(a) Excludes E&P water production and recycle.
(b) No active projects underway (O&GJ 2006).
Injection Well
Water
Water
Storage
Production Well
Water Use in Enhanced Oil Recovery
05
Offshore Rig
Water InjectionFlowline
WaterInjectionWells
Oil/GasFlowline
Seawater
ProductionZones
Offshore Water Flooding
06
Shale fracturing (fracking)
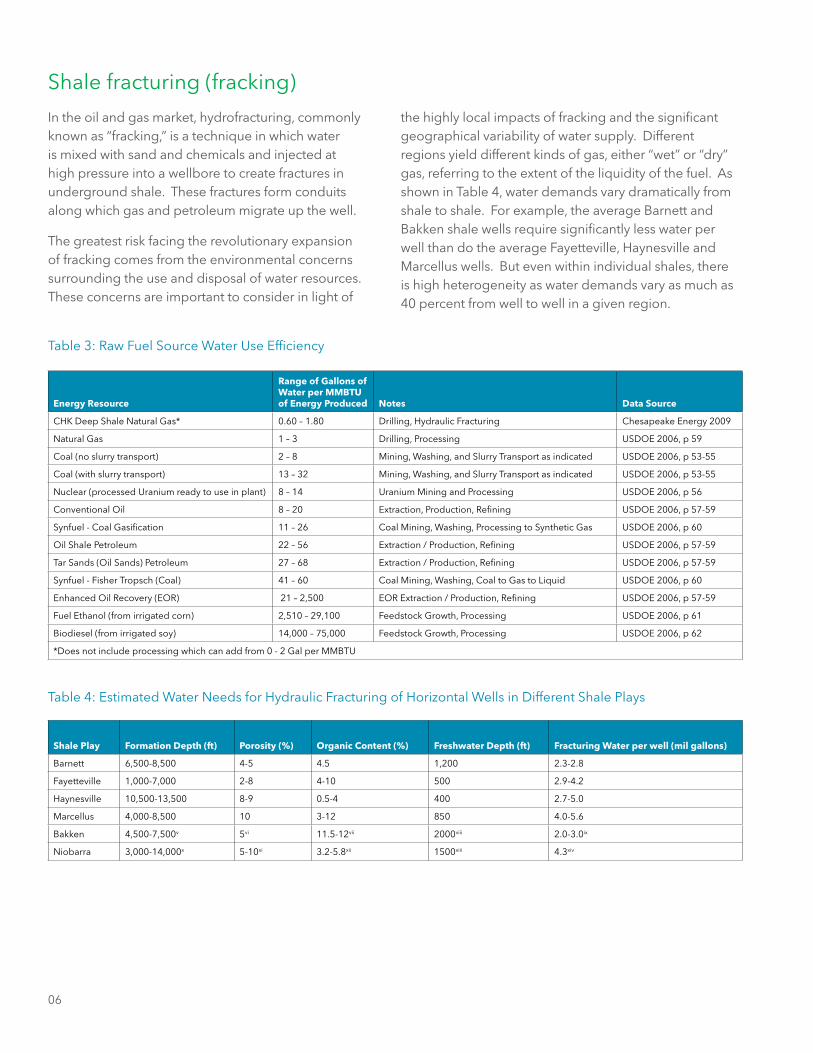
In the oil and gas market, hydrofracturing, commonly known as “fracking,” is a technique in which water is mixed with sand and chemicals and injected at high pressure into a wellbore to create fractures in underground shale. These fractures form conduits along which gas and petroleum migrate up the well.
The greatest risk facing the revolutionary expansion of fracking comes from the environmental concerns surrounding the use and disposal of water resources. These concerns are important to consider in light of
the highly local impacts of fracking and the significant geographical variability of water supply. Different regions yield different kinds of gas, either “wet” or “dry” gas, referring to the extent of the liquidity of the fuel. As shown in Table 4, water demands vary dramatically from shale to shale. For example, the average Barnett and Bakken shale wells require significantly less water per well than do the average Fayetteville, Haynesville and Marcellus wells. But even within individual shales, there is high heterogeneity as water demands vary as much as 40 percent from well to well in a given region.
Table 3: Raw Fuel Source Water Use Efficiency
Energy Resource
Range of Gallons of Water per MMBTU of Energy Produced Notes Data Source
CHK Deep Shale Natural Gas* 0.60 – 1.80 Drilling, Hydraulic Fracturing Chesapeake Energy 2009
Natural Gas 1 – 3 Drilling, Processing USDOE 2006, p 59
Coal (no slurry transport) 2 – 8 Mining, Washing, and Slurry Transport as indicated USDOE 2006, p 53-55
Coal (with slurry transport) 13 – 32 Mining, Washing, and Slurry Transport as indicated USDOE 2006, p 53-55
Nuclear (processed Uranium ready to use in plant) 8 – 14 Uranium Mining and Processing USDOE 2006, p 56
Conventional Oil 8 – 20 Extraction, Production, Refining USDOE 2006, p 57-59
Synfuel - Coal Gasification 11 – 26 Coal Mining, Washing, Processing to Synthetic Gas USDOE 2006, p 60
Oil Shale Petroleum 22 – 56 Extraction / Production, Refining USDOE 2006, p 57-59
Tar Sands (Oil Sands) Petroleum 27 – 68 Extraction / Production, Refining USDOE 2006, p 57-59
Synfuel - Fisher Tropsch (Coal) 41 – 60 Coal Mining, Washing, Coal to Gas to Liquid USDOE 2006, p 60
Enhanced Oil Recovery (EOR) 21 – 2,500 EOR Extraction / Production, Refining USDOE 2006, p 57-59
Fuel Ethanol (from irrigated corn) 2,510 – 29,100 Feedstock Growth, Processing USDOE 2006, p 61
Biodiesel (from irrigated soy) 14,000 – 75,000 Feedstock Growth, Processing USDOE 2006, p 62
*Does not include processing which can add from 0 - 2 Gal per MMBTU
Table 4: Estimated Water Needs for Hydraulic Fracturing of Horizontal Wells in Different Shale Plays
Shale Play Formation Depth (ft) Porosity (%) Organic Content (%) Freshwater Depth (ft) Fracturing Water per well (mil gallons)
Barnett 6,500-8,500 4-5 4.5 1,200 2.3-2.8
Fayetteville 1,000-7,000 2-8 4-10 500 2.9-4.2
Haynesville 10,500-13,500 8-9 0.5-4 400 2.7-5.0
Marcellus 4,000-8,500 10 3-12 850 4.0-5.6
Bakken 4,500-7,500v 5vi 11.5-12vii 2000viii 2.0-3.0ix
Niobarra 3,000-14,000x 5-10xi 3.2-5.8xii 1500xiii 4.3xiv
07
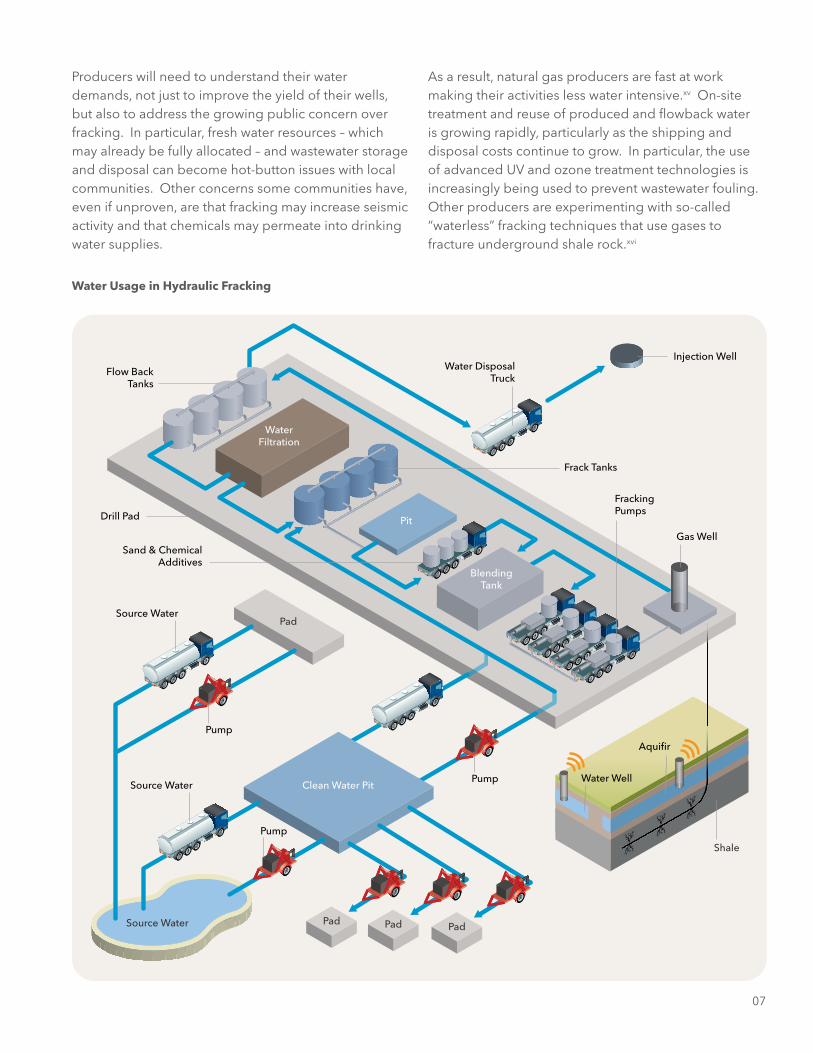
Producers will need to understand their water demands, not just to improve the yield of their wells, but also to address the growing public concern over fracking. In particular, fresh water resources – which may already be fully allocated – and wastewater storage and disposal can become hot-button issues with local communities. Other concerns some communities have, even if unproven, are that fracking may increase seismic activity and that chemicals may permeate into drinking water supplies.
As a result, natural gas producers are fast at work making their activities less water intensive.xv On-site treatment and reuse of produced and flowback water is growing rapidly, particularly as the shipping and disposal costs continue to grow. In particular, the use of advanced UV and ozone treatment technologies is increasingly being used to prevent wastewater fouling. Other producers are experimenting with so-called “waterless” fracking techniques that use gases to fracture underground shale rock.xvi
Source Water
Pad
Clean Water Pit
Pit
WaterFiltration
BlendingTank
Pump
Pump
Source Water
Drill Pad
Source Water
Pump
Pad Pad Pad
Flow BackTanks
Frack Tanks
FrackingPumps
Gas WellSand & Chemical
Additives
Aquifir
Water Well
Shale
Water DisposalTruck
Injection Well
Water Usage in Hydraulic Fracking
08
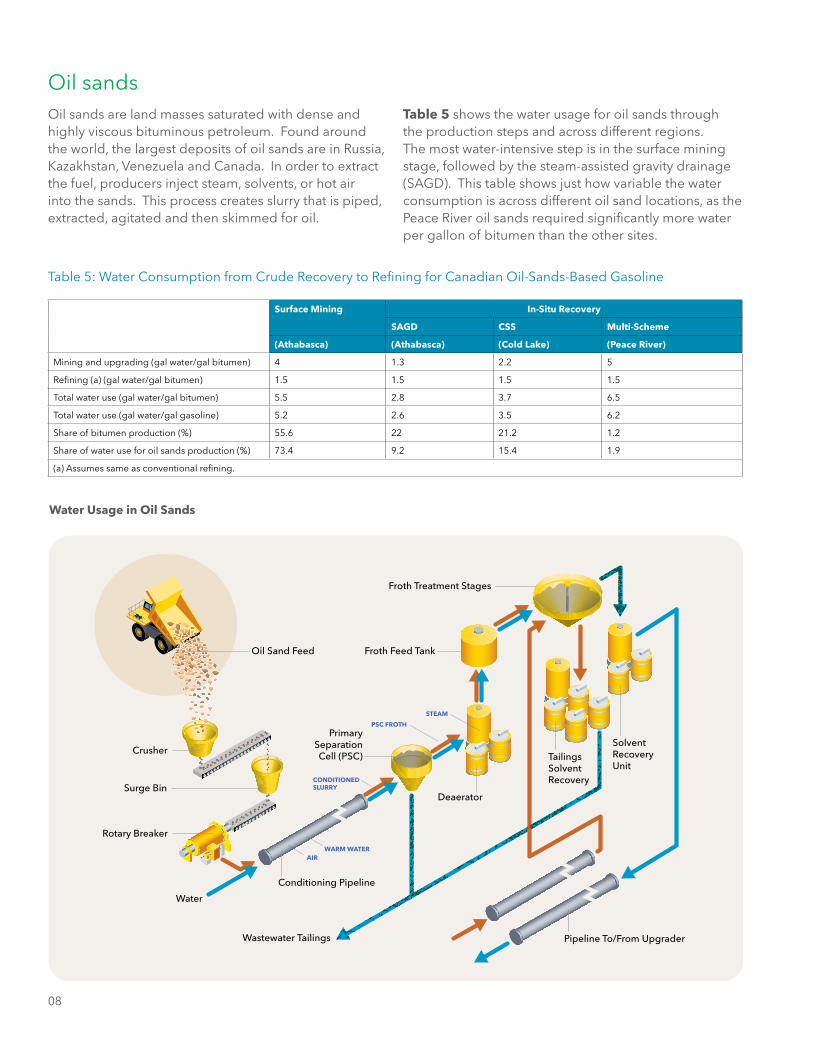
Oil sandsOil sands are land masses saturated with dense and highly viscous bituminous petroleum. Found around the world, the largest deposits of oil sands are in Russia, Kazakhstan, Venezuela and Canada. In order to extract the fuel, producers inject steam, solvents, or hot air into the sands. This process creates slurry that is piped, extracted, agitated and then skimmed for oil.
Table 5 shows the water usage for oil sands through the production steps and across different regions. The most water-intensive step is in the surface mining stage, followed by the steam-assisted gravity drainage (SAGD). This table shows just how variable the water consumption is across different oil sand locations, as the Peace River oil sands required significantly more water per gallon of bitumen than the other sites.
Table 5: Water Consumption from Crude Recovery to Refining for Canadian Oil-Sands-Based Gasoline
Surface Mining In-Situ Recovery
SAGD CSS Multi-Scheme
(Athabasca) (Athabasca) (Cold Lake) (Peace River)
Mining and upgrading (gal water/gal bitumen) 4 1.3 2.2 5
Refining (a) (gal water/gal bitumen) 1.5 1.5 1.5 1.5
Total water use (gal water/gal bitumen) 5.5 2.8 3.7 6.5
Total water use (gal water/gal gasoline) 5.2 2.6 3.5 6.2
Share of bitumen production (%) 55.6 22 21.2 1.2
Share of water use for oil sands production (%) 73.4 9.2 15.4 1.9
(a) Assumes same as conventional refining.
Crusher
Surge Bin
Rotary Breaker
Water
Oil Sand Feed Froth Feed Tank
Froth Treatment Stages
PrimarySeparationCell (PSC)
Conditioning Pipeline
Wastewater Tailings
Deaerator
Pipeline To/From Upgrader
TailingsSolventRecovery
SolventRecoveryUnit
WARM WATER
CONDITIONEDSLURRY
PSC FROTH
AIR
STEAM
Water Usage in Oil Sands
Changing regulatory environmentAs oil and gas extraction methods expand, so too do the regulations governing conduct in the sector. As an industry, oil and gas producers know the danger of having an exploration method that outpaces the regulation designed to govern industry; the result can be public backlash, knee-jerk moratoriums and onerous restrictions. Therefore, it is all the more important for the industry to engage regulators, public opinion and elected officials to help in the creation of policy that protects citizens, the environment and the industry itself.
Recent regulatory steps taken by federal, state and local governments to govern oil and gas exploration are common industry knowledge. New York State has imposed a moratorium on fracking. Building on previous regulatory efforts states including California, North Dakota and throughout the Marcellus Shale are defining stricter rules to govern fracking.
Chemical disclosures, groundwater monitoring, produced and flowback water treatment, and wastewater disposal are just some of the activities that are generating greater public scrutiny by federal agencies in the US like the Environmental Protection
Agency, the Bureau of Land Management and the Department of Energy, in addition to state departments of environmental protection, county regulators, watershed protection groups, and even communities and homeowner associations. These developments are not limited to the US. Even as fracking expands in places like Poland and the Ukraine, the United Kingdom has been swept by a series of protests surrounding potential seismic activity in and around fracking sites.
Fracking is not the only production method under scrutiny. The Canadian oil sands have been the subject of intense debate for some time. The Canadian Oil Sands Innovation Alliance has developed a new set of management, storage and treatment standards for oil sands tailings, the residual from the bitumen extraction, in part as a result of public pressure. The oil sands have become a particular concern for Americans due to the recent debate surrounding the Keystone Pipeline, which would deliver oil sands extract to the refineries and shipping ports in the Gulf of Mexico. Americans are not only concerned with the pathway and structural integrity of the pipeline (which travels over the Ogallala Aquifer, America’s largest), but also with the environmental impacts of the production of the oil.
09
10
Consequences for the industry and the role of technologythe water-related challenges facing the oil and gas industry can be grouped into three issues: quality, productivity and resilience.
Quality Declining water quality threatens not just the energy production process itself, but more importantly the public acceptance of new forms of energy extraction. The industry can better protect water quality in a number of ways: first, by systematically installing monitoring and analytical equipment, such as groundwater gas analyzers and surface water quality analyzers. These devices are crucial to complying with regulations, improving operations and addressing public concerns. Second, by using the most up-to-date water treatment techniques including UV and ozone treatment; and third, producers can employ the best water reuse techniques in order to cut down on the amount of water required for fuel production, thereby minimizing the impact on regional water quality.
Productivity Water productivity is about producing more economic output per unit of water and treating water resources as a source of competitive advantage rather than a cost to be diminished. Curently, most of the methods of water and wastewater management are extremely inefficient. Trucking produced and flowback water from fracking sites to wastewater wells is costly, risky and environmentally impactful. Across the industry the productivity of water could be greatly improved by the use of pipelines, onsite treatment, reusing produced and flowback water for fracking, temporary piping, and infill drilling to decrease the distance between wells. Remote monitoring and control systems that allow the automated, real-time management of water resources is one such way Xylem has helped energy producers become more productive. (See breakout Godwin case).
Resilience The energy industry is changing at an increasing pace. Producers are constantly adapting to changing energy sources, extraction techniques, market prices, customer demands, regulations, and environmental and climatic conditions. In the face of these unprecedented changes, energy producers have to be durable enough to absorb short-term shocks and flexible enough to adapt to long-term shifts; they have to become, in a word, resilient.
The greatest uncertainties surrounding water use in the oil and gas industry are the greater unpredictability in water supplies and precipitation as a result of climate change, and rapid changes in government regulations related to water and wastewater. Producers can address these risks by extracting less water from natural sources and better managing what water they do extract. Once again, better monitoring and control, wastewater reuse, and advanced treatment technologies are crucial to protecting the operational, environment, regulatory and economic fluctuations that are so common in the industry.
The best preparation oil and gas producers can make against an uncertain future is to invest in technologies to improve the quality, productivity and resilience of their water operations, by enhancing their ability to monitor, transport and treat water.

11
ConclusionOil and gas companies that are able to examine their production steps and make some small changes in the way they use water will see positive reputational impacts, improved margins and the ability to execute projects faster due to lower regulatory barriers. Moreover, they will be making a commitment to the sustainability of their operations.
Around the world, water resources are facing systemic threats to their future availability, from population growth, poor management and climate volatility. These shifts will necessarily require oil and gas producers to be more considerate and aware of their water uses. Sources of water (e.g. rivers, streams, lakes, aquifers) are coming under greater strain, citizens are concerned with fast-moving developments and technologies they do not fully understand, and regulators are being pressured to take action. Oil and gas producers need to understand their water consumption, the needs and limitations of the areas in which they operate, and the potential for technology investments to protect and enhance their profitability into the future.
Xylem believes that in order to protect against the uncertainties in the future of the energy sector, energy producers should look to partner with institutions with a history of innovating in the management of precious resources. With our proven record in monitoring and transportation and our emerging treatment technologies, Xylem can help the oil and gas industry use water to unlock business opportunities by becoming better stewards of this vital and finite resource.
Let’s work together to solve water.
12
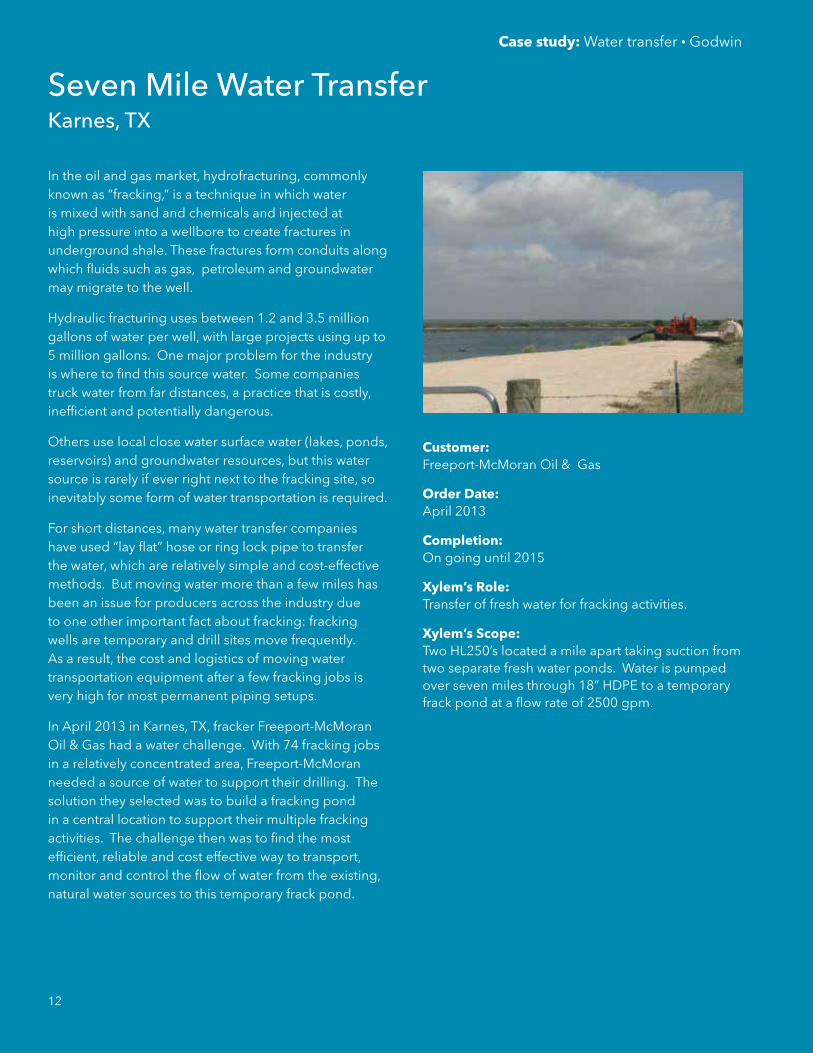
seven Mile Water transfer Karnes, tX
In the oil and gas market, hydrofracturing, commonly known as “fracking,” is a technique in which water is mixed with sand and chemicals and injected at high pressure into a wellbore to create fractures in underground shale. These fractures form conduits along which fluids such as gas, petroleum and groundwater may migrate to the well.
Hydraulic fracturing uses between 1.2 and 3.5 million gallons of water per well, with large projects using up to 5 million gallons. One major problem for the industry is where to find this source water. Some companies truck water from far distances, a practice that is costly, inefficient and potentially dangerous.
Others use local close water surface water (lakes, ponds, reservoirs) and groundwater resources, but this water source is rarely if ever right next to the fracking site, so inevitably some form of water transportation is required.
For short distances, many water transfer companies have used “lay flat” hose or ring lock pipe to transfer the water, which are relatively simple and cost-effective methods. But moving water more than a few miles has been an issue for producers across the industry due to one other important fact about fracking: fracking wells are temporary and drill sites move frequently. As a result, the cost and logistics of moving water transportation equipment after a few fracking jobs is very high for most permanent piping setups.
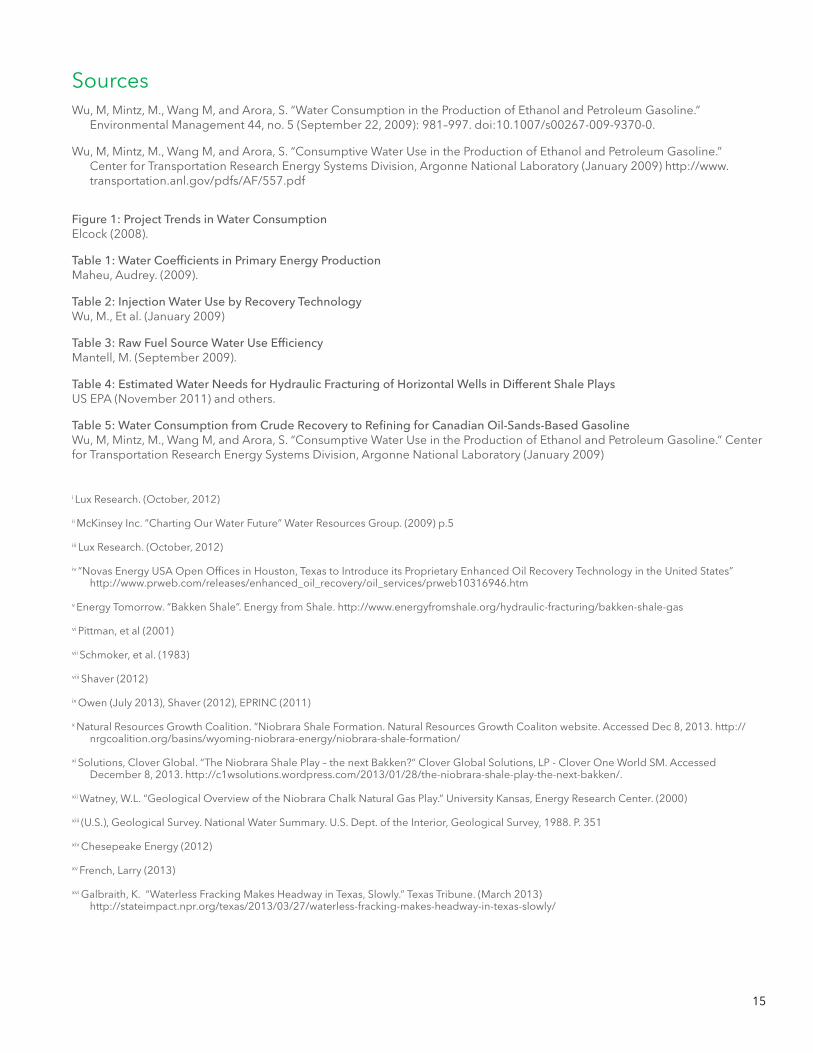
In April 2013 in Karnes, TX, fracker Freeport-McMoran Oil & Gas had a water challenge. With 74 fracking jobs in a relatively concentrated area, Freeport-McMoran needed a source of water to support their drilling. The solution they selected was to build a fracking pond in a central location to support their multiple fracking activities. The challenge then was to find the most efficient, reliable and cost effective way to transport, monitor and control the flow of water from the existing, natural water sources to this temporary frack pond.
Customer: Freeport-McMoran Oil & Gas
Order Date: April 2013
Completion: On going until 2015
Xylem’s Role: Transfer of fresh water for fracking activities.
Xylem’s Scope: Two HL250’s located a mile apart taking suction from two separate fresh water ponds. Water is pumped over seven miles through 18” HDPE to a temporary frack pond at a flow rate of 2500 gpm.
Case study: Water transfer • Godwin
12
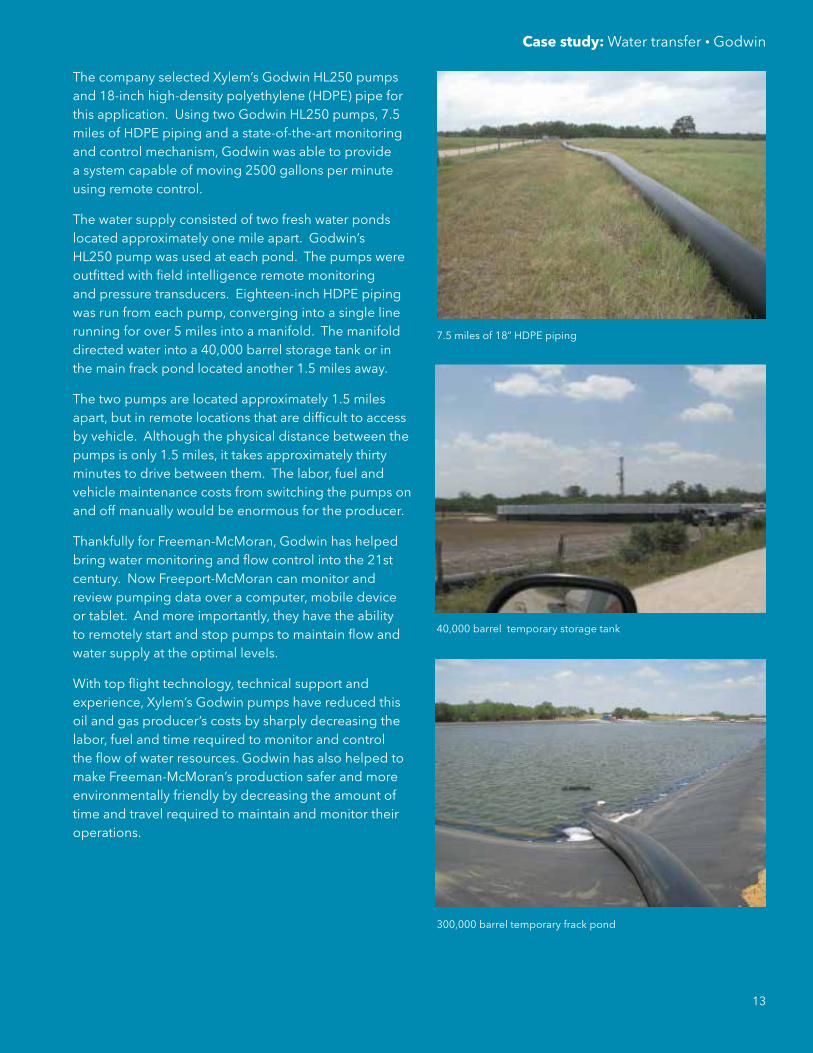
The company selected Xylem’s Godwin HL250 pumps and 18-inch high-density polyethylene (HDPE) pipe for this application. Using two Godwin HL250 pumps, 7.5 miles of HDPE piping and a state-of-the-art monitoring and control mechanism, Godwin was able to provide a system capable of moving 2500 gallons per minute using remote control.
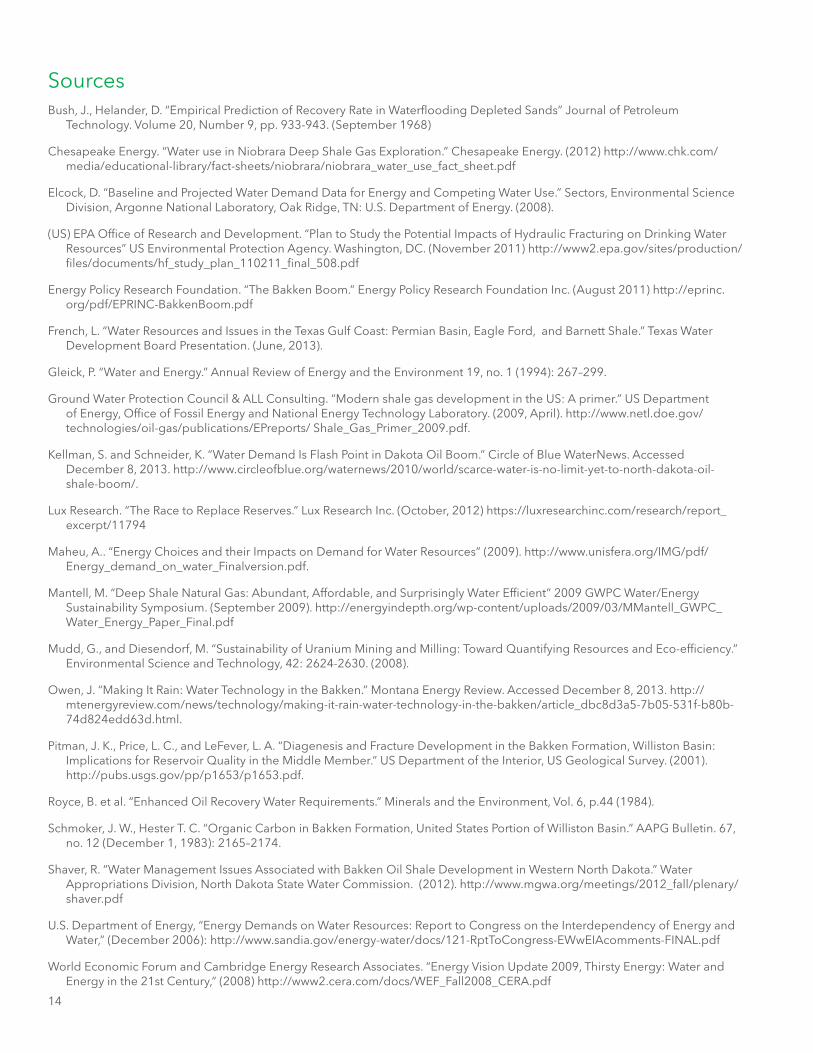
The water supply consisted of two fresh water ponds located approximately one mile apart. Godwin’s HL250 pump was used at each pond. The pumps were outfitted with field intelligence remote monitoring and pressure transducers. Eighteen-inch HDPE piping was run from each pump, converging into a single line running for over 5 miles into a manifold. The manifold directed water into a 40,000 barrel storage tank or in the main frack pond located another 1.5 miles away.
The two pumps are located approximately 1.5 miles apart, but in remote locations that are difficult to access by vehicle. Although the physical distance between the pumps is only 1.5 miles, it takes approximately thirty minutes to drive between them. The labor, fuel and vehicle maintenance costs from switching the pumps on and off manually would be enormous for the producer.
Thankfully for Freeman-McMoran, Godwin has helped bring water monitoring and flow control into the 21st century. Now Freeport-McMoran can monitor and review pumping data over a computer, mobile device or tablet. And more importantly, they have the ability to remotely start and stop pumps to maintain flow and water supply at the optimal levels.
With top flight technology, technical support and experience, Xylem’s Godwin pumps have reduced this oil and gas producer’s costs by sharply decreasing the labor, fuel and time required to monitor and control the flow of water resources. Godwin has also helped to make Freeman-McMoran’s production safer and more environmentally friendly by decreasing the amount of time and travel required to maintain and monitor their operations.
Case study: Water transfer • Godwin
7.5 miles of 18” HDPE piping
40,000 barrel temporary storage tank
300,000 barrel temporary frack pond
13
14
SourcesBush, J., Helander, D. “Empirical Prediction of Recovery Rate in Waterflooding Depleted Sands” Journal of Petroleum
Technology. Volume 20, Number 9, pp. 933-943. (September 1968)
Chesapeake Energy. “Water use in Niobrara Deep Shale Gas Exploration.” Chesapeake Energy. (2012) http://www.chk.com/media/educational-library/fact-sheets/niobrara/niobrara_water_use_fact_sheet.pdf
Elcock, D. “Baseline and Projected Water Demand Data for Energy and Competing Water Use.” Sectors, Environmental Science Division, Argonne National Laboratory, Oak Ridge, TN: U.S. Department of Energy. (2008).
(US) EPA Office of Research and Development. “Plan to Study the Potential Impacts of Hydraulic Fracturing on Drinking Water Resources” US Environmental Protection Agency. Washington, DC. (November 2011) http://www2.epa.gov/sites/production/files/documents/hf_study_plan_110211_final_508.pdf
Energy Policy Research Foundation. “The Bakken Boom.” Energy Policy Research Foundation Inc. (August 2011) http://eprinc.org/pdf/EPRINC-BakkenBoom.pdf
French, L. “Water Resources and Issues in the Texas Gulf Coast: Permian Basin, Eagle Ford, and Barnett Shale.” Texas Water Development Board Presentation. (June, 2013).
Gleick, P. “Water and Energy.” Annual Review of Energy and the Environment 19, no. 1 (1994): 267–299.
Ground Water Protection Council & ALL Consulting. “Modern shale gas development in the US: A primer.” US Department of Energy, Office of Fossil Energy and National Energy Technology Laboratory. (2009, April). http://www.netl.doe.gov/technologies/oil-gas/publications/EPreports/ Shale_Gas_Primer_2009.pdf.
Kellman, S. and Schneider, K. “Water Demand Is Flash Point in Dakota Oil Boom.” Circle of Blue WaterNews. Accessed December 8, 2013. http://www.circleofblue.org/waternews/2010/world/scarce-water-is-no-limit-yet-to-north-dakota-oil-shale-boom/.
Lux Research. “The Race to Replace Reserves.” Lux Research Inc. (October, 2012) https://luxresearchinc.com/research/report_excerpt/11794
Maheu, A.. “Energy Choices and their Impacts on Demand for Water Resources” (2009). http://www.unisfera.org/IMG/pdf/Energy_demand_on_water_Finalversion.pdf.
Mantell, M. “Deep Shale Natural Gas: Abundant, Affordable, and Surprisingly Water Efficient” 2009 GWPC Water/Energy Sustainability Symposium. (September 2009). http://energyindepth.org/wp-content/uploads/2009/03/MMantell_GWPC_Water_Energy_Paper_Final.pdf
Mudd, G., and Diesendorf, M. “Sustainability of Uranium Mining and Milling: Toward Quantifying Resources and Eco-efficiency.” Environmental Science and Technology, 42: 2624-2630. (2008).
Owen, J. “Making It Rain: Water Technology in the Bakken.” Montana Energy Review. Accessed December 8, 2013. http://mtenergyreview.com/news/technology/making-it-rain-water-technology-in-the-bakken/article_dbc8d3a5-7b05-531f-b80b-74d824edd63d.html.
Pitman, J. K., Price, L. C., and LeFever, L. A. “Diagenesis and Fracture Development in the Bakken Formation, Williston Basin: Implications for Reservoir Quality in the Middle Member.” US Department of the Interior, US Geological Survey. (2001). http://pubs.usgs.gov/pp/p1653/p1653.pdf.
Royce, B. et al. “Enhanced Oil Recovery Water Requirements.” Minerals and the Environment, Vol. 6, p.44 (1984).
Schmoker, J. W., Hester T. C. “Organic Carbon in Bakken Formation, United States Portion of Williston Basin.” AAPG Bulletin. 67, no. 12 (December 1, 1983): 2165–2174.
Shaver, R. “Water Management Issues Associated with Bakken Oil Shale Development in Western North Dakota.” Water Appropriations Division, North Dakota State Water Commission. (2012). http://www.mgwa.org/meetings/2012_fall/plenary/shaver.pdf
U.S. Department of Energy, “Energy Demands on Water Resources: Report to Congress on the Interdependency of Energy and Water,” (December 2006): http://www.sandia.gov/energy-water/docs/121-RptToCongress-EWwEIAcomments-FINAL.pdf
World Economic Forum and Cambridge Energy Research Associates. “Energy Vision Update 2009, Thirsty Energy: Water and Energy in the 21st Century,” (2008) http://www2.cera.com/docs/WEF_Fall2008_CERA.pdf
15
SourcesWu, M, Mintz, M., Wang M, and Arora, S. “Water Consumption in the Production of Ethanol and Petroleum Gasoline.”
Environmental Management 44, no. 5 (September 22, 2009): 981–997. doi:10.1007/s00267-009-9370-0.
Wu, M, Mintz, M., Wang M, and Arora, S. “Consumptive Water Use in the Production of Ethanol and Petroleum Gasoline.” Center for Transportation Research Energy Systems Division, Argonne National Laboratory (January 2009) http://www.transportation.anl.gov/pdfs/AF/557.pdf
Figure 1: project trends in Water consumption Elcock (2008).
table 1: Water coefficients in primary energy production Maheu, Audrey. (2009).
table 2: Injection Water use by recovery technology Wu, M., Et al. (January 2009)
table 3: raw Fuel source Water use efficiency Mantell, M. (September 2009).
table 4: estimated Water needs for Hydraulic Fracturing of Horizontal Wells in different shale plays US EPA (November 2011) and others.
table 5: Water consumption from crude recovery to refining for canadian oil-sands-based gasoline Wu, M, Mintz, M., Wang M, and Arora, S. “Consumptive Water Use in the Production of Ethanol and Petroleum Gasoline.” Center for Transportation Research Energy Systems Division, Argonne National Laboratory (January 2009)
i Lux Research. (October, 2012)
ii McKinsey Inc. “Charting Our Water Future” Water Resources Group. (2009) p.5
iii Lux Research. (October, 2012)
iv “Novas Energy USA Open Offices in Houston, Texas to Introduce its Proprietary Enhanced Oil Recovery Technology in the United States” http://www.prweb.com/releases/enhanced_oil_recovery/oil_services/prweb10316946.htm
v Energy Tomorrow. “Bakken Shale”. Energy from Shale. http://www.energyfromshale.org/hydraulic-fracturing/bakken-shale-gas
vi Pittman, et al (2001)
vii Schmoker, et al. (1983)
viii Shaver (2012)
ix Owen (July 2013), Shaver (2012), EPRINC (2011)
x Natural Resources Growth Coalition. “Niobrara Shale Formation. Natural Resources Growth Coaliton website. Accessed Dec 8, 2013. http://nrgcoalition.org/basins/wyoming-niobrara-energy/niobrara-shale-formation/
xi Solutions, Clover Global. “The Niobrara Shale Play – the next Bakken?” Clover Global Solutions, LP - Clover One World SM. Accessed December 8, 2013. http://c1wsolutions.wordpress.com/2013/01/28/the-niobrara-shale-play-the-next-bakken/.
xii Watney, W.L. “Geological Overview of the Niobrara Chalk Natural Gas Play.” University Kansas, Energy Research Center. (2000)
xiii (U.S.), Geological Survey. National Water Summary. U.S. Dept. of the Interior, Geological Survey, 1988. P. 351
xiv Chesepeake Energy (2012)
xv French, Larry (2013)
xvi Galbraith, K. “Waterless Fracking Makes Headway in Texas, Slowly.” Texas Tribune. (March 2013) http://stateimpact.npr.org/texas/2013/03/27/waterless-fracking-makes-headway-in-texas-slowly/
Xylem |'zīl m|1) The tissue in plants that brings water upward from the roots; 2) a leading global water technology company.
We’re 12,000 people unified in a common purpose: creating innovative solutions to meet our world’s water needs. Developing new technologies that will improve the way water is used, conserved, and re-used in the future is central to our work. We move, treat, analyze, and return water to the environment, and we help people use water efficiently, in their homes, buildings, factories and farms. In more than 150 countries, we have strong, long-standing relationships with customers who know us for our powerful combination of leading product brands and applications expertise, backed by a legacy of innovation.
For more information on how Xylem can help you, go to www.xyleminc.com
Xylem, Inc.14125 South Bridge CircleCharlotte, NC 28273Tel 704.409.9700Fax 704.295.9080855-XYL-H2O1 (855-995-4261)www.xyleminc.com
© 2015 Xylem, Inc. AUGUST 2015
XB
037
• X
ylem
Wat
er U
se in
Oil
& G
as •
8/2
015
• N
AC
T