Embed Size (px)
Citation preview
WATER USE BENCHMARKS FOR THERMOELECTRIC
POWER GENERATION
PROJECT COMPLETION REPORT
Research Report of the
Department of Geography and Environmental Resources Southern Illinois University Carbondale
Carbondale, IL 62901
August 15, 2006
Water Use Benchmarks
for Thermoelectric Power Generation ___________________________________________ PROJECT COMPLETION REPORT Prepared for: 2004 USGS National Competitive Grants Program Grant No. 04HQGR0148 Sub-award No. 2005-509-1-00 United States Geological Survey Reston, Virginia 20192 Prepared by: Ben Dziegielewski, Professor Thomas Bik, Researcher Department of Geography and Environmental Resources Southern Illinois University Carbondale Carbondale, Illinois 62901 With the assistance of: Usama Alqalawi, Doctoral Student, Department of Economics Stanley Mubako, Doctoral Student, Environmental Resources and Policy Program Southern Illinois University Carbondale Carbondale, Illinois 62901 and Nathan Eidem, Doctoral Student, Department of Geosciences, Oregon State University - Corvallis, Oregon Shauna Bloom, Doctoral Student, Department of Geography University of Guelph, Guelph, Ontario, Canada N1G 2W1 August 15, 2006 ______________________________________________________________________
v
WATER USE BENCHMARKS FOR THERMOELECTRIC POWER GENERATION
IN THE UNITED STATES
Table of Contents Page Table of Contents...........................................................................................................v List of Appendices ..................................................................................................... viii List of Figures .............................................................................................................. ix List of Tables ............................................................................................................... ix List of Equations ......................................................................................................... xii Acknowledgements.................................................................................................... xiv
EXECUTIVE SUMMARY Study Purpose ..............................................................................................ES-1
Significance of Thermoelectric Water Use ................................................ES-1 Average Rates of Water Use........................................................................ES-2
Regressions of Water Use on Explanatory Variables ..................................ES-4 Technical Efficiency Estimates....................................................................ES-5 Recommendations........................................................................................ES-5
I. INTRODUCTION Purpose............................................................................................................I-1 Background.....................................................................................................I-1 Energy Production in the U.S.in 2003 ......................................................I-1
The Cooling Process ................................................................................I-4 Types of Cooling Systems .......................................................................I-5
Quantifying Thermoelectric Water Use .........................................................I-6 Chapter Synopses............................................................................................I-7
II. THERMOELECTRIC WATER USE
Definitions and Significance of Water Use .................................................. II-1 Historical Thermoelectric Withdrawals........................................................ II-2
Aggregate Data ...................................................................................... II-2 Plant-Level Data .................................................................................... II-4
Previous Studies of Thermoelectric Water Use ........................................... II-6 Determinants of Water Demand ............................................................ II-6 Estimates of Water Requirements .......................................................... II-7 Summary ....................................................................................................... II-8
vi
III. STUDY DESIGN
Study Components ....................................................................................... III-1 Site Visits and Power Plant Surveys............................................................ III-1
Survey Development and Implementation............................................. III-1 Statistical Analysis of Generation Facility Data.......................................... III-3
Multiple Regression Analysis ................................................................ III-3 Stochastic Frontier Analysis .................................................................. III-4
Development of Benchmarks....................................................................... III-8
IV. FINDINGS OF SITE VISITS AND MAIL SURVEYS
Summary of Site Visit Findings...................................................................... IV-1 EIA 767 Reporting / Application of EIA-767 Data to Unit Water Use Calculations………………………………………………………..IV-1 Determinants of Water Flow.................................................................. IV-1 Water Use Management......................................................................... IV-2
Most Knowledgeable Contact Person ................................................... IV-2 Suggestions for Conducting a Questionnaire Survey of Power Generation Facilities .............................................................................. IV-2
Summary of Survey Findings ........................................................................ IV-3 Survey Response Rate .......................................................................... IV-3 Review of Survey Questionnaire Results ............................................ IV-4
Summary of Findings.......................................................................... IV-10
V. STATISTICAL ANALYSIS OF WATER USE IN FOSSIL FUEL PLANTS Database........................................................................................................... V-1 EIA-767 Data Set……………………………… ……………………….V-1 Variables………………………………………… ……………………..V-1 Average Rates of Water Use............................................................................ V-4
Unit Withdrawals by Different Types of Cooling Systems .................... V-4 Average Water Use by Once-through, Recirculating and Closed-Loop Systems ............................................................................. V-6
Most Likely Values................................................................................. V-6 Regression Analysis of Water Use .................................................................. V-7
Once-through Cooling Systems .............................................................. V-7 Closed-loop Systems with Cooling Towers.......................................... V-10 Recirculating Systems with Cooling Ponds or Canals.......................... V-16 Summary………………………………………………………………V-20
Stochastic Frontier Efficiency Analysis......................................................... V-20 Efficiencies of Once-through Cooling Systems.................................... V-20 Closed-loop Systems with Cooling Towers.......................................... V-22
vii
Recirculating Systems with Cooling Ponds or Canals.......................... V-24 Summary ........................................................................................................ V-25
VI. STATISTICAL ANALYSIS OF WATER USE IN NUCLEAR PLANTS Database..........................................................................................................VI-1
Descriptive Statistics.......................................................................................VI-1 Average Rates of Water Use.....................................................................VI-1
Multiple Regression of Water Use..................................................................VI-2 Once-through Cooling Systems .............................................................VI-2 Closed-loop Systems with Cooling Towers...........................................VI-3 Recirculating Systems with Cooling Ponds or Canals...........................VI-4
Stochastic Frontier Efficiency Analysis..........................................................VI-6 Once-through Cooling Systems .............................................................VI-6 Closed-loop Systems with Cooling Towers...........................................VI-8
Summary .........................................................................................................VI-9
VII. WATER-USE BENCHMARKS
Purpose...........................................................................................................VII-1 Technical Water-Use Efficiency....................................................................VII-1 Average Rates of Water Use..........................................................................VII-2 Regression-Based Benchmarks for Fossil Fuel Plants...................................VII-3
Regression Benchmarks for Once-through Cooling Systems...............VII-3 Regression Benchmarks for Closed-loop Systems with Cooling Towers................................................................................................... VI-6 Regression Benchmarks for Recirculating Systems with Cooling Ponds.....................................................................................................VII-7
Regression-Based Benchmarks for Nuclear Plants........................................VII-9 Benchmarks for Once-through Cooling Systems .................................VII-9 Benchmarks for Closed-loop Cooling Systems ................................... VII-9 Benchmarks for Recirculating Systems ..............................................VII-10
Stochastic Frontier Benchmarks in Fossil Plants.........................................VII-11 Stochastic Frontier Benchmarks for Once-through Cooling Systems VII-12 Stochastic Frontier Benchmarks for Closed-loop Systems.................VII-13 Stochastic Frontier Benchmarks for Recirculating Systems...............VII-15
Stochastic Frontier Benchmarks for Nuclear Plants……………………….VII-16 Summary ......................................................................................................VII-17
VIII. CONCLUSIONS AND RECOMMENDATIONS
Study findings .............................................................................................. VIII-1
Recommendations........................................................................................ VIII-3
REFERENCES ........................................................................................ References-1 APPENDICES A. Review of EIA-767 and Selection of Sample of Surveyed Generating Facilities
Purpose.......................................................................................................... A-1 Data Selection of Steam-Generation Facilities Included in the Survey........ A-1 Selection of Steam-Generation Facilities Included in the Survey ................ A-2 Characteristics of Steam-Generation for 2003.............................................. A-2 Plant Characteristics ............................................................................ A-2 Generation Characteristics ................................................................... A-3
Boiler and Cooling System Characteristics ......................................... A-4 Cooling System Type and Generation ................................................. A-8
Other Characteristics of Steam-Generation Facilities in the Survey .......... A-10 Utility Concentration ......................................................................... A-10
Plant and Utility Location.................................................................. A-10 Cooling Water Source........................................................................ A-12
B. Site Visit Procedure
Purpose ..........................................................................................................B-1 Interview - Site Visit Purpose ..............................................................B-1 Protocol .........................................................................................................B-1 Site Visit Interview Discussion Guide .................................................B-3 Generic Contact Letter .........................................................................B-4 On-Site Interview Memorandums:
Site Visit #1, Re-circulating Cooling System with Ponds or Canals.......B-5 Site Visit #2, Closed-Loop Cooling System with Cooling Towers ..........B-6 Site Visit #3, Once Through Cooling System ..........................................B-7 Site Visit #4, Re-circulating Cooling System with Ponds or Canals.......B-8 Site Visit #5, Once Through Cooling System ..........................................B-9
C. Survey Cover Letter, Survey Forms and Tables
Introduction....................................................................................................C-1 Cover Letter for Email Survey.......................................................................C-2 Survey Forms and Tables...............................................................................C-3
D. Review of Survey Responses
Thermoelectric Power Plant Survey Responses ........................................... D-1
viii
ix
LIST OF FIGURES ES-1 Average Rates of Unit Water Withdrawals in Different Types
of Cooling Systems in Fossil Fuel Plants………………………………ES-2 I-1 Water Use in Thermoelectric Cooling Systems...........................................I-4 II-1 Historical U.S. Water Withdrawals by Major Sectors: 1950-2000 ........... II-2 III-1 Single Input and Single Output Case of Technical Efficiency................. III-6
V-1 Average Rates of Unit Water Withdrawals in Different Types of Cooling Systems................................................................................... V-5 V-2 The Effect of Excluding the Highest Values of Unit Water Withdrawals on the Mean in the Data for Closed-loop Systems with Cooling Towers V-12 V-3 The Effect of Excluding the Highest Values of Unit Consumptive Water Use on the Mean in Closed-Loop Systems with Cooling Towers V-15 V-4 The Effect of Excluding the Highest Values of Unit Water Withdrawals on the Mean in the Data for Recirculating Systems with Cooling Ponds or Canals ................................................................. V-17 V-5 Distribution of Technical Efficiency Estimates for Once-Through Cooling Systems for the 1996-2004 Period ............................................. V-22 V-6 Distribution of Technical Efficiency Estimates for Closed-Loop Systems Systems with Cooling Towers for the 1996-2004 Period........................ V-23 V-7 Distribution of Technical Efficiency Estimates for a Subset of Recirculating Systems with Cooling Ponds or Canals and Mixed Systems for the 1996-2004 Period........................................................... V-25 VI-1 Distribution of Technical Efficiency Scores in Once-Through Cooling Systems ....................................................................................................VI-7 VI-2 Distribution of Technical Efficiency Scores in Closed-Loop Systems With Cooling Towers...............................................................................VI-9 VII-1 Change in the Distribution of Unit Water Withdrawals in Once-Through
Systems at 100 Percent Technical Efficiency........................................VII-13 VII-2 Change in the Distribution of Unit Water Withdrawals in Closed-Loop
Systems at 100 Percent Technical Efficiency........................................VII-15 LIST OF TABLES ES-1. Benchmarks of Weighted-average Use Rates of Cooling Water…………...ES-3 ES-2. Regression-based Benchmarks of Average Water Withdrawal Rates……...ES-4 ES-3 Technical Efficiency Estimates for Cooling Systems Based on
Stochastic Production Frontier………………………………………….…ES-5 I-1 Existing Net Electric Generating Capacity and Net Generation by Energy Source in 2003 Summer Season....................................................I-2 I-2 U.S. Net Energy Generation by Source for 2003............................................I-3 II-1 Sectoral Water Withdrawals in the United States 1950-2000 ...................... II-2 II-2 Thermoelectric Withdrawals by Cooling Type............................................. II-3 II-3 Estimated Water Use in EIA-767 Annual Data Sets ................................... II-4 II-4 Number of Plants with CWIS and NPDES permit by Water Source and
x
Cooling System Type.................................................................................... II-5 II-5 Explanatory Variables and Elasticities of Thermoelectric Water Use.......... II-7 II-6 Consumptive Water Use for Electricity Generation ..................................... II-7 V-1 Number of Plants and Cooling Systems Included in the Final Dataset by Year.......................................................................................................... V-2 V-2 Potential Determinants of Thermoelectric Withdrawals in the Database .................................................................................................. V-3 V-3 Comparison of Unit Thermoelectric Withdrawals for Different Types of Cooling System Configurations ................................................................... V-4 V-4 Unit Water Withdrawals by Type of Cooling System.................................. V-6 V-5 Log-linear Regression of Total Water Withdrawals in Once-through Cooling Systems .......................................................................................... V-8 V-6 Regressions of Water Withdrawals per Unit of Generation in Once-through Cooling Systems .......................................................................................... V-9 V-7 Log-linear Regression of Total Consumptive Use in Once-through Cooling Systems .......................................................................................... V-9 V-8 Regression of Unit Consumptive Use in Once-through Cooling Systems ...................................................................................................... V-10 V-9 Regressions of Total Water Withdrawals in Closed-loop Systems with Cooling Towers …………………………... ...................................... V-11 V-10 Regression of Water Withdrawals per Unit Generation in Closed-loop Systems with Cooling Towers ......................................................... V-11 V-11 Regression of Water Withdrawals per Unit Generation in Recirculating Systems with Cooling Towers with Truncated Data .................................. V-12 V-12 Regression of Total Consumptive Use in Recirculating Systems with Cooling Towers ......................................................... V-13 V-13 Linear Regression of Unit Consumptive Use in Closed-loop Systems with Cooling Towers........................................................................................... V-14 V-14 Linear Regression of Unit Consumptive Use in Closed-loop Systems with Cooling Towers Using Truncated Data Set ................................................ V-15 V-15 Log-linear Regression of Total Water Withdrawals in Recirculating Systems with Cooling Ponds or Canals and Mixed Systems ……………..V-16 V-16 Regressions of Water Withdrawal per Unit of Generation in Recirculating
Systems with Cooling Ponds or Canals and Mixed Systems...................... V-17 V-17 Linear Regression Models for Two Groups of Recirculating Cooling Systems with Ponds or Canals and Mixed Systems...................... V-18 V-18 Log-linear Model of Total Consumptive Water Use for Recirculating Cooling Systems ......................................................................................... V-19 V-19 Linear Regression of Unit Consumptive Use in Recirculating Cooling Systems ....................................................................................................... V-19 V-20 Estimates of Stochastic Production Frontier for Once-through Cooling Systems ....................................................................................................... V-21 V-21 Estimates of Stochastic Production Frontier for Closed-loop Cooling Systems with Cooling Towers .................................................................... V-23 V-22 Estimates of Stochastic Production Frontier for Recirculating Cooling Systems ....................................................................................................... V-24
xi
VI-1 Nuclear Unit Water Withdrawals by Type of Cooling System....................VI-1 VI-2 Regressions of Total Water Withdrawals in Nuclear Plants with Once-through Cooling Systems for Double-log Model...............................VI-2 VI-3 Linear Regression of Water Withdrawals per Unit of Generation in Once-through Cooling Systems ...................................................................VI-3 VI-4 Benchmarking Regression of Water Withdrawals per Unit of Generation in Once-through Cooling Systems for Linear Model ..................................VI-3 VI-5 Log-linear Regression of Total Water Withdrawals in Nuclear Plants with Closed-loop Systems with Cooling Towers.................................................VI-4 VI-6 Regressions of Water Withdrawals per Unit of Generation in Nuclear Plants with Closed-loop Systems with Cooling Towers…………………...VI-4 VI-7 Regression of Total Water Withdrawals in Nuclear Recirculating Systems with Cooling Ponds or Canals .....................................................................VI-5 VI-8 Regression of Water Withdrawals per Unit of Generation in Nuclear Recirculating Systems with Cooling Ponds or Canals for Linear Model VI-5 VI-9 Regression of Water Withdrawals per Unit of Generation in Nuclear Recirculating Systems with Cooling Ponds or Canals for Linear Model VI-5 VI-10 Benchmarking Regression of Water Withdrawals per Unit of Generation in Nuclear Recirculating Systems with Cooling Ponds or Canals ...................VI-6 VI-11 Estimates of Stochastic Production Frontier for Once-through Cooling Systems in Nuclear Plants………………………………………… VI-7 VI-12 Estimates of Stochastic Production Frontier for Closed-loop Cooling Systems with Cooling Towers in Nuclear Plants ………………………VI-8 VII-1 Benchmarks of Average Use Rates of Cooling Water................................VII-2 VII-2 Regression Benchmarks for Water Withdrawals by Once-through Cooling Systems in Fossil Fuel Plants......................................................................VII-4 VII-3 Regression Benchmarks for Consumptive Water Use by Once-through Cooling Systems in Fossil Fuel Plants……………………………... …….VII-5 VII-4 Regression Benchmarks for Water Withdrawals by Closed-loop Systems with Cooling Towers in Fossil Fuel Plants ……………………..VII-6 VII-5 Regression Benchmarks for Consumptive Water Use by Closed-loop Systems with Cooling Towers in Fossil Fuel Plants .................................................VII-7 VII-6 Regression Benchmarks for Water Withdrawals by Recirculating Systems with Cooling Ponds in Fossil Fuel Plants …………………….VII-8 VII-7 Regression Benchmarks for Water Withdrawals by Once-through Systems in Fossil Fuel Plants Cooling Ponds in Fossil Fuel Plants..........................VII-9 VII-8 Regression Benchmarks for Water Withdrawals by Closed-loop Systems in Nuclear Plants .......................................................................................VII-10 VII-9 Regression Benchmarks for Water Withdrawals by Recirculating Systems in Nuclear Plants .......................................................................................VII-11 VII-10 Distribution of Benchmark Values for Unit Withdrawals at 100 Percent Technical Efficiency for Once-through Cooling Systems at Fossil Power 3VII-11 Distribution of Benchmark Values for Unit Withdrawals at 100 Percent Technical Efficiency for Closed-loop Cooling Systems at Fossil Power Plants.........................................................................................................VII-14 VII-12 Distribution of Benchmark Values for Unit Withdrawals at 100 Percent
xii
Technical Efficiency for Recirculating Systems at Fossil Power Plants.........................................................................................................VII-16 VII-13 Distribution of Benchmark Values for Unit Withdrawals at 100 Percent Technical Efficiency for Once-through Systems at Nuclear Power Plants.........................................................................................................VII-17
LIST OF EQUATIONS 3.1 Log-Linear Regression Model of Total Annual Withdrawals ....................... III-4 3.2 Input and Output Combinations for Production Technology Definition ....... III-4 3.3 Production Frontier Function......................................................................... III-5 3.4 Input-Oriented Measure of Technical Efficiency for Single Output ............. III-5 3.5 Output-Oriented Measure of Technical Efficiency for Single Output........... III-5 3.6 Stochastic Production Function Model for Panel Data.................................. III-6 3.7 Variables Associated with Technical Inefficiency in Production.................. III-7 3.8 Inefficiency Effects as a Function of a Vector of Plant-Specific Variables and Random Error Term ................................................................................ III-7 3.9 Predictions of Individual Firm Technical Efficiencies from Estimated Stochastic Production Frontiers ..................................................................... III-7 5.1 Operational Efficiency .................................................................................... V-2 5.2 Thermal Efficiency ......................................................................................... V-2 5.3 Significance of the Estimated Stochastic Frontier ........................................ V-20 7.1 Estimated Regression Equation for Once-Through Cooling Systems..........VII-3 7.2 Estimated Regression Equation for Consumptive Use of Water By Once-Through Cooling Systems in Fossil-Fuel Plants.................................VII-5 7.3 Estimated Regression Equation for Unit Withdrawals for Closed-loop Systems with Cooling Towers ......................................................................VII-6 7.4 Estimated Regression Equation for Consumptive Use of Water by Closed-loop Cooling Systems.......................................................................VII-7 7.5 Estimated Linear Regression Equation for Water Withdrawals by Recirculating Systems with Cooling Ponds..................................................VII-8 7.6 Estimated Regression Equation for Unit Withdrawals in Once-Through Cooling Systems ...........................................................................................VII-9 7.7 Regression Equation for Benchmark Withdrawals in Closed-loop Cooling Systems with Cooling Towers ......................................................................VII-9 7.8 Regression Equation for Benchmark Withdrawals in Recirculating Systems Systems with Cooling Ponds or Canals and Mixed Circulating and Once-Through Systems...............................................................................VII-10 7.9 Benchmark Unit Water Withdrawal ...........................................................VII-11 7.10 Stochastic Frontier Model for Once-Through Systems in Fossil Fuel Plants...........................................................................................................VII-12 7.11 Technical Efficiency Score Equation .........................................................VII-12 7.12 Stochastic Frontier Model for Closed-Loop Systems in Fossil Fuel Plants...........................................................................................................VII-12

xiii
7.13 Stochastic Frontier Model for Recirculating Systems in Fossil Fuel Plants...........................................................................................................VII-15 7.14 Stochastic Frontier Model for Once-Through Systems for Nuclear Plants...........................................................................................................VII-16 7.15 Stochastic Frontier Model for Closed-Loop Systems with Cooling towers for Nuclear Plants .............................................................................................VII-17

xiv
ACKNOWLEDGEMENTS
We wish to thank the sponsors of this study, the U.S. Geological Survey Competitive Grants Program and Southern Illinois University Carbondale. Dr. Richard (Dick) Warner, Director Illinois Water Resources Center, served as the Contracting Officer for this study. He and his staff, especially Lisa Merrifield who served as Program Coordinator provided information and assistance during the research. Dr. John E. Schefter, Chief, Office of External Research of the USGS served as the Project Officer. The Department of Geography and Environmental Resources provided matching funds and release time for the leading author Professor Ben Dziegielewski and office space and equipment for the project researchers and graduate assistants.
In conducting the research and preparing the final report we benefited from the help of several individuals. Dr. Tom Bik, the co-author of the final report helped implement the surveys of power plants and drafted Chapter IV and parts of Chapter III of the report as well as all four appendices. He also helped with the final proofreading and editing. The four graduate students shown as co-authors also provided valuable inputs. Usama Alqalawi, a doctoral student in economics, helped develop data bases from the annual data files of the EIA-767 surveys and estimate the regressions and stochastic frontier models. Stanley Mubako, a doctoral student in environmental resources and policy program, conducted various supportive calculations, prepared a number of tables and helped in editing and proof reading of the final report. During the earlier phases of this research two MS students worked on the project. Nathan Eidem managed data bases and gathered literature and Shauna Bloom gathered background information for the initial chapters and implemented the email survey of power plants. The contribution of all co-authors is appreciated.
We also wish to acknowledge Stacy Nicklow who provided copy editing of the final drafts and Olise Mandat who managed project financial records and printing of the final report. Special thanks to Natalie Ko, Collection Manager for the EIA-767 Database, from the U.S. Department of Energy’s Energy Information Administration who provided access to, and information about the EIA data used to develop the thermoelectric water use models.
ES-1
EXECUTIVE SUMMARY
Water Use Benchmarks for Thermoelectric Power Generation by
Ben Dziegielewski, Thomas Bik, Usama Alqalawi, Stanley Mubako, Nathan Eidem, and Shauna Bloom, Southern Illinois University Carbondale
Study Purpose
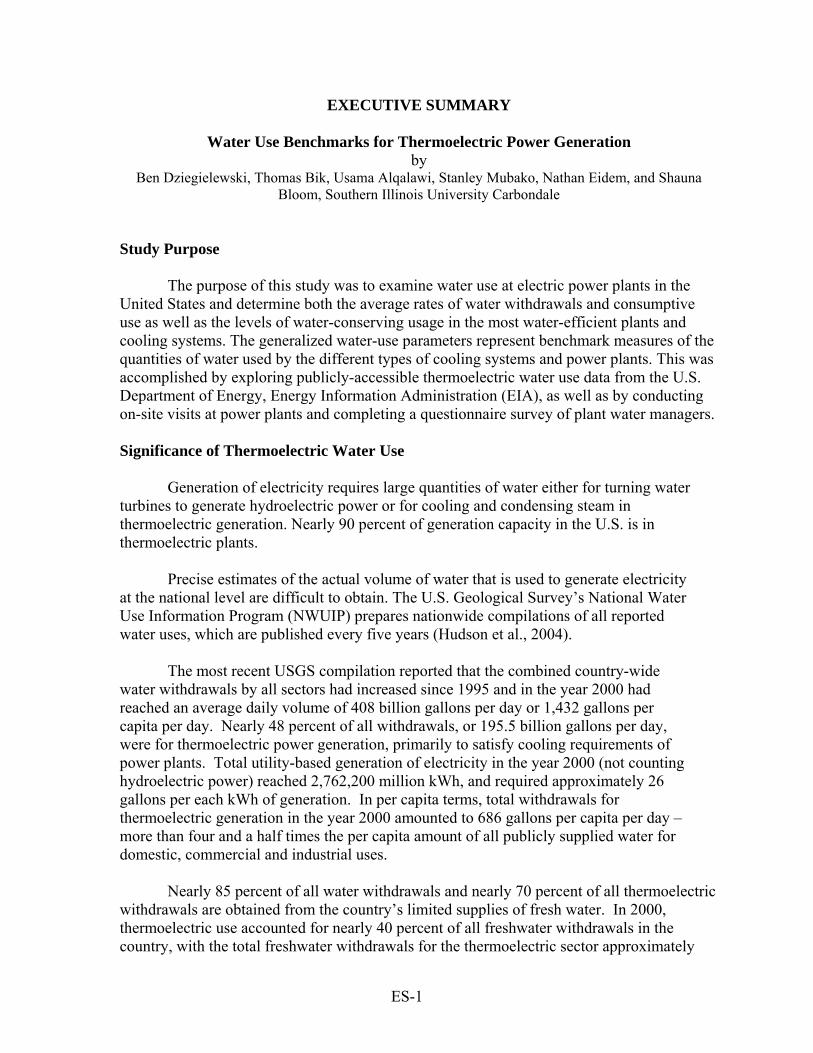
The purpose of this study was to examine water use at electric power plants in the United States and determine both the average rates of water withdrawals and consumptive use as well as the levels of water-conserving usage in the most water-efficient plants and cooling systems. The generalized water-use parameters represent benchmark measures of the quantities of water used by the different types of cooling systems and power plants. This was accomplished by exploring publicly-accessible thermoelectric water use data from the U.S. Department of Energy, Energy Information Administration (EIA), as well as by conducting on-site visits at power plants and completing a questionnaire survey of plant water managers.
Significance of Thermoelectric Water Use
Generation of electricity requires large quantities of water either for turning water turbines to generate hydroelectric power or for cooling and condensing steam in thermoelectric generation. Nearly 90 percent of generation capacity in the U.S. is in thermoelectric plants.
Precise estimates of the actual volume of water that is used to generate electricity
at the national level are difficult to obtain. The U.S. Geological Survey’s National Water Use Information Program (NWUIP) prepares nationwide compilations of all reported water uses, which are published every five years (Hudson et al., 2004).
The most recent USGS compilation reported that the combined country-wide
water withdrawals by all sectors had increased since 1995 and in the year 2000 had reached an average daily volume of 408 billion gallons per day or 1,432 gallons per capita per day. Nearly 48 percent of all withdrawals, or 195.5 billion gallons per day, were for thermoelectric power generation, primarily to satisfy cooling requirements of power plants. Total utility-based generation of electricity in the year 2000 (not counting hydroelectric power) reached 2,762,200 million kWh, and required approximately 26 gallons per each kWh of generation. In per capita terms, total withdrawals for thermoelectric generation in the year 2000 amounted to 686 gallons per capita per day – more than four and a half times the per capita amount of all publicly supplied water for domestic, commercial and industrial uses.
Nearly 85 percent of all water withdrawals and nearly 70 percent of all thermoelectric withdrawals are obtained from the country’s limited supplies of fresh water. In 2000, thermoelectric use accounted for nearly 40 percent of all freshwater withdrawals in the country, with the total freshwater withdrawals for the thermoelectric sector approximately
ES-2
equal to those of the irrigation sector. Despite these high annual withdrawals for thermoelectric power generation, only a few studies of thermoelectric water demands have been conducted. The reason may be that unlike irrigated agriculture where most of the water is evaporated or lost, approximately 98 percent of water withdrawn by thermoelectric sector is returned back to the source.
However, even the “non-consumptive” withdrawals of water for thermoelectric power
plants can have significant impacts on water resources. Power plants are the largest dischargers of thermal pollution that affects both aquatic ecosystems and evaporation rates. Also, the large quantities of water required for power generation must be continuously available for power utilities to provide reliable service to their customers. This quantity of water is therefore “reserved” for power generation and is not available to other user such as irrigators or public water suppliers Average Rates of Water Use
The database used in the statistical analysis was developed primarily from the information in the Department of Energy’s Form EIA-767, and contained 7,365 observations of estimated thermoelectric water withdrawals and consumptive use, for cooling systems in fossil-fuel plants, during the nine-year period from 1996 to 2004. A smaller number of observations was available for nuclear-powered plants because the annual EIA data reporting for this type of plants was discontinued after 2000, and the data were only available from 1996 to 2000.
In addition to the data on water withdrawals and consumptive use, five categories of
likely determinants of cooling water withdrawals were included in the analysis: (1) cooling systems type; (2) fuel type; (3) operational conditions; (4) water sources; and (5) other relevant variables. Additional information about thermoelectric water use was obtained from site visits and interviews at five power generation facilities and questionnaire survey responses from 40 power plants.
Water withdrawals per unit of net generation of electricity were estimated from the
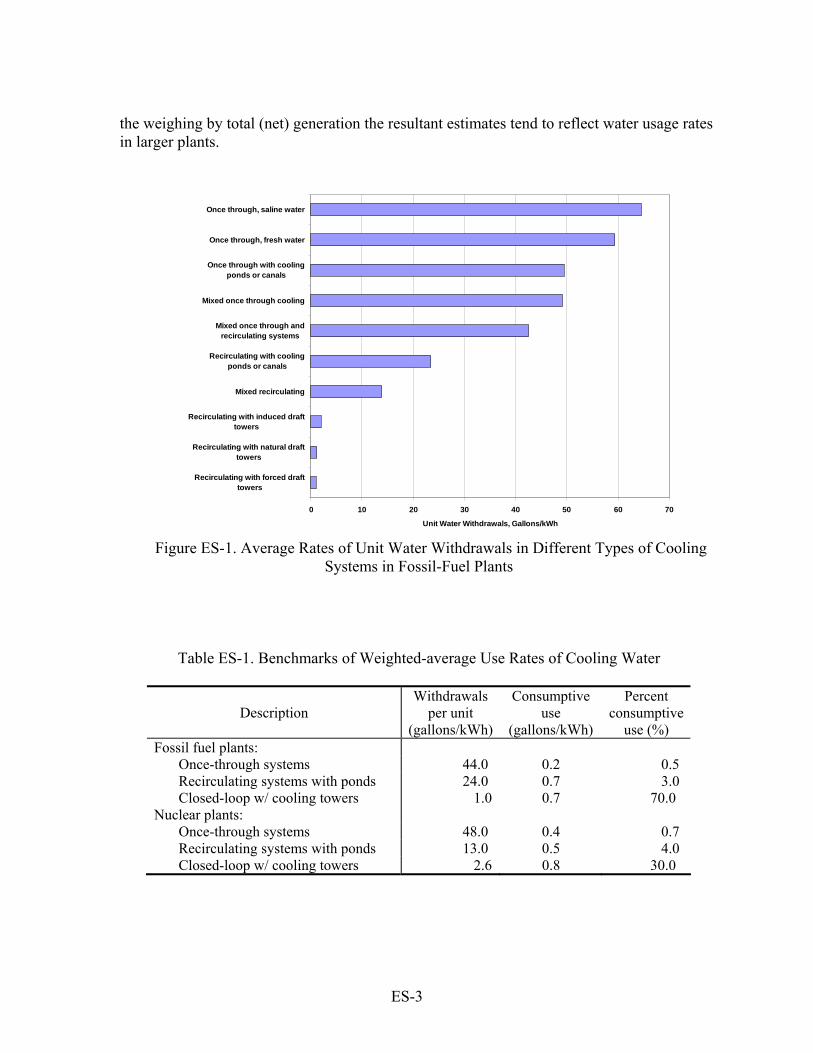
EIA-767 data, and the average unit-use was calculated for ten different types or combinations of cooling systems. A review of the distribution of unit-use estimates determined that these calculated averages were significantly influenced by outlier values. The outliers were removed from the analysis and the mean values of water withdrawals for each cooling system type were recalculated (see Figure ES-1).
Unit withdrawals for once-through systems were estimated to range from
approximately 50 to 65 gal./kWh; for closed-loop systems with cooling towers from 1.0 to 2.0 gal/kWh; and for recirculating systems with cooling ponds or canals and other mixed recirculating systems from 14 to 24 gal/kWh. Net generation weighted averages were also calculated for three general aggregations of the ten cooling system types for both fossil-fuel and nuclear plants. The resultant weighted average water use rates represent water use benchmark measures for these categories of cooling systems (see Table ES-1). Because of
ES-3
the weighing by total (net) generation the resultant estimates tend to reflect water usage rates in larger plants.
0 10 20 30 40 50 60 70
Recirculating with forced drafttowers
Recirculating with natural drafttowers
Recirculating with induced drafttowers
Mixed recirculating
Recirculating with coolingponds or canals
Mixed once through andrecirculating systems
Mixed once through cooling
Once through with coolingponds or canals
Once through, fresh water
Once through, saline water
Unit Water Withdrawals, Gallons/kWh
Figure ES-1. Average Rates of Unit Water Withdrawals in Different Types of Cooling Systems in Fossil-Fuel Plants
Table ES-1. Benchmarks of Weighted-average Use Rates of Cooling Water
Description Withdrawals
per unit (gallons/kWh)
Consumptive use
(gallons/kWh)
Percent consumptive
use (%) Fossil fuel plants:
Once-through systems 44.0 0.2 0.5 Recirculating systems with ponds 24.0 0.7 3.0 Closed-loop w/ cooling towers 1.0 0.7 70.0
Nuclear plants: Once-through systems 48.0 0.4 0.7 Recirculating systems with ponds 13.0 0.5 4.0 Closed-loop w/ cooling towers 2.6 0.8 30.0
ES-4
Regressions of Water Use on Explanatory Variables
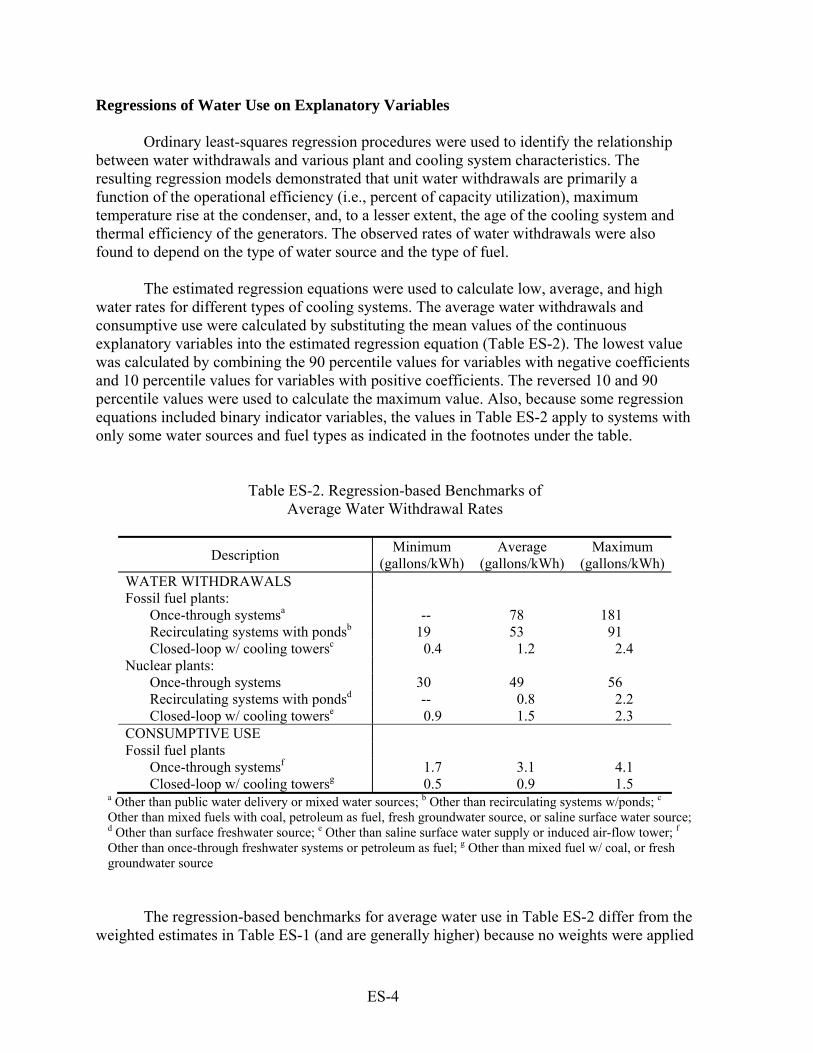
Ordinary least-squares regression procedures were used to identify the relationship between water withdrawals and various plant and cooling system characteristics. The resulting regression models demonstrated that unit water withdrawals are primarily a function of the operational efficiency (i.e., percent of capacity utilization), maximum temperature rise at the condenser, and, to a lesser extent, the age of the cooling system and thermal efficiency of the generators. The observed rates of water withdrawals were also found to depend on the type of water source and the type of fuel.
The estimated regression equations were used to calculate low, average, and high
water rates for different types of cooling systems. The average water withdrawals and consumptive use were calculated by substituting the mean values of the continuous explanatory variables into the estimated regression equation (Table ES-2). The lowest value was calculated by combining the 90 percentile values for variables with negative coefficients and 10 percentile values for variables with positive coefficients. The reversed 10 and 90 percentile values were used to calculate the maximum value. Also, because some regression equations included binary indicator variables, the values in Table ES-2 apply to systems with only some water sources and fuel types as indicated in the footnotes under the table.
Table ES-2. Regression-based Benchmarks of Average Water Withdrawal Rates
Description Minimum (gallons/kWh)
Average (gallons/kWh)
Maximum (gallons/kWh)
WATER WITHDRAWALS Fossil fuel plants:
Once-through systemsa -- 78 181 Recirculating systems with pondsb 19 53 91 Closed-loop w/ cooling towersc 0.4 1.2 2.4
Nuclear plants: Once-through systems 30 49 56 Recirculating systems with pondsd -- 0.8 2.2 Closed-loop w/ cooling towerse 0.9 1.5 2.3
CONSUMPTIVE USE Fossil fuel plants
Once-through systemsf 1.7 3.1 4.1 Closed-loop w/ cooling towersg 0.5 0.9 1.5
a Other than public water delivery or mixed water sources; b Other than recirculating systems w/ponds; c Other than mixed fuels with coal, petroleum as fuel, fresh groundwater source, or saline surface water source; d Other than surface freshwater source; e Other than saline surface water supply or induced air-flow tower; f Other than once-through freshwater systems or petroleum as fuel; g Other than mixed fuel w/ coal, or fresh groundwater source
The regression-based benchmarks for average water use in Table ES-2 differ from the weighted estimates in Table ES-1 (and are generally higher) because no weights were applied
ES-5
during the regression procedure, and because of the added regression effects of the fuel types and water supply source. However, the estimates are generally consistent across the different types of cooling systems. Technical Efficiency Estimates
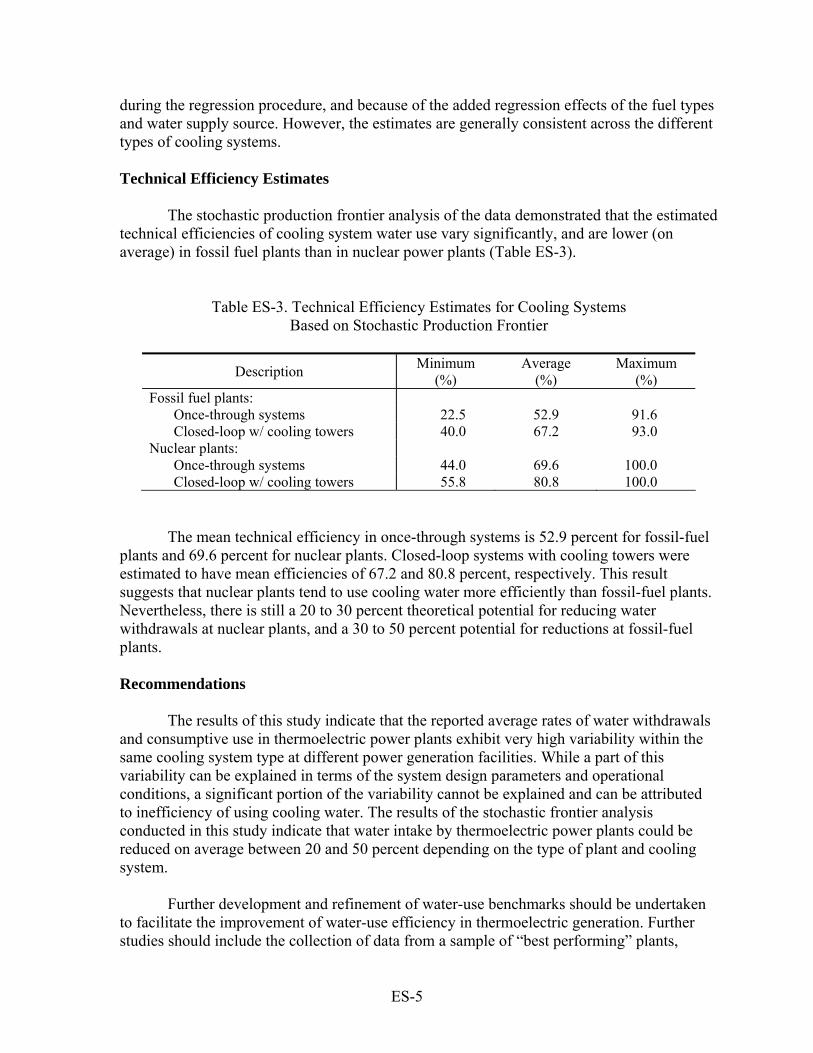
The stochastic production frontier analysis of the data demonstrated that the estimated technical efficiencies of cooling system water use vary significantly, and are lower (on average) in fossil fuel plants than in nuclear power plants (Table ES-3).
Table ES-3. Technical Efficiency Estimates for Cooling Systems Based on Stochastic Production Frontier
Description Minimum (%)
Average (%)
Maximum (%)
Fossil fuel plants: Once-through systems 22.5 52.9 91.6 Closed-loop w/ cooling towers 40.0 67.2 93.0
Nuclear plants: Once-through systems 44.0 69.6 100.0 Closed-loop w/ cooling towers 55.8 80.8 100.0
The mean technical efficiency in once-through systems is 52.9 percent for fossil-fuel plants and 69.6 percent for nuclear plants. Closed-loop systems with cooling towers were estimated to have mean efficiencies of 67.2 and 80.8 percent, respectively. This result suggests that nuclear plants tend to use cooling water more efficiently than fossil-fuel plants. Nevertheless, there is still a 20 to 30 percent theoretical potential for reducing water withdrawals at nuclear plants, and a 30 to 50 percent potential for reductions at fossil-fuel plants. Recommendations
The results of this study indicate that the reported average rates of water withdrawals and consumptive use in thermoelectric power plants exhibit very high variability within the same cooling system type at different power generation facilities. While a part of this variability can be explained in terms of the system design parameters and operational conditions, a significant portion of the variability cannot be explained and can be attributed to inefficiency of using cooling water. The results of the stochastic frontier analysis conducted in this study indicate that water intake by thermoelectric power plants could be reduced on average between 20 and 50 percent depending on the type of plant and cooling system.
Further development and refinement of water-use benchmarks should be undertaken to facilitate the improvement of water-use efficiency in thermoelectric generation. Further studies should include the collection of data from a sample of “best performing” plants,

ES-6
which could be identified using the analysis presented in this study. The benchmark practices at these facilities could serve as standards in the design and operation of wet cooling systems, and guide the process of gradual elimination of inefficient use of water in thermoelectric power generation.
I-1
CHAPTER I INTRODUCTION
PURPOSE
The future economic, social, and environmental costs of meeting water supply needs of the United States (U.S.) depends largely on our ability to understand and manage both present and future water demands. Total water withdrawals in the country continue to increase and, in 2000, were estimated to exceed 408 billion gallons per day (bgd) or 1,430 gallons per capita per day. Nearly 48 percent of all withdrawals are for thermoelectric power generation, primarily to satisfy cooling requirements of power plants. Also, nearly 85 percent of all withdrawals and nearly 70 percent of thermoelectric withdrawals are obtained from limited supplies of fresh water. In 2000, the fresh water withdrawals of the thermoelectric sector (136 bgd) were approximately the same as those of the irrigation sector (137 bgd) (Hutson et al., 2005).
In spite of the large quantities of annual withdrawals of water by thermoelectric
sector, few studies of thermoelectric water demands have been conducted. This lack of attention to thermoelectric water withdrawals may be due to the fact that, unlike irrigated agriculture where most of the water is evaporated or lost, approximately 90 percent of water withdrawn by thermoelectric sector is returned back to the source. However, the substantial withdrawals of water for thermoelectric cooling can have significant impacts on water resources, especially in areas where fresh water supplies are limited.
The principal objective of this research project was to use publicly-accessible
thermoelectric water use data from the U.S. Department of Energy, Energy Information Administration (EIA), and standard analytical procedures to develop generalized water use parameters for thermoelectric water use in the United States. These parameters represent benchmark measures for several categories of thermoelectric facilities, as determined by cooling system type and other plant characteristics. BACKGROUND Energy Production in the U.S. in 2003
According to the statistics available from EIA for 2003, the total U.S electric generating capacity was 948,446 megawatts (MW), of which 57.7 percent (547,249 MW) was at electric utility plants, with the remainder (401,198 MW) at non-utility plants. Coal-fired plants account for the largest percentage of generation capacity followed by natural gas and dual-fired plants, which can burn both petroleum and natural gas. Nuclear and hydroelectric plants each accounted for 10.5 percent of total generating capacity (Table I-1).
Chapter I: Introduction
I-2
Table I-1. U.S. Electric Generating Capacity by Energy Source in 2003
Energy Source
Total Capacity
MW
Percent of Total Capacity
Percent in Electric Utilities
Coal[1] 313,019 33.0 75.5 Natural gas 208,447 22.0 23.1 Dual fired 171,295 18.1 52.1 Hydro-electric[4] 99,216 10.5 91.3 Nuclear 99,209 10.5 61.5 Petroleum[2] 36,429 3.8 57.0 Other renewables[5] 18,199 1.9 5.1 Other gases[3] 1,994 0.2 3.1 Other[6] 638 0.1 2.0 Totals 948,446 100.0 57.7
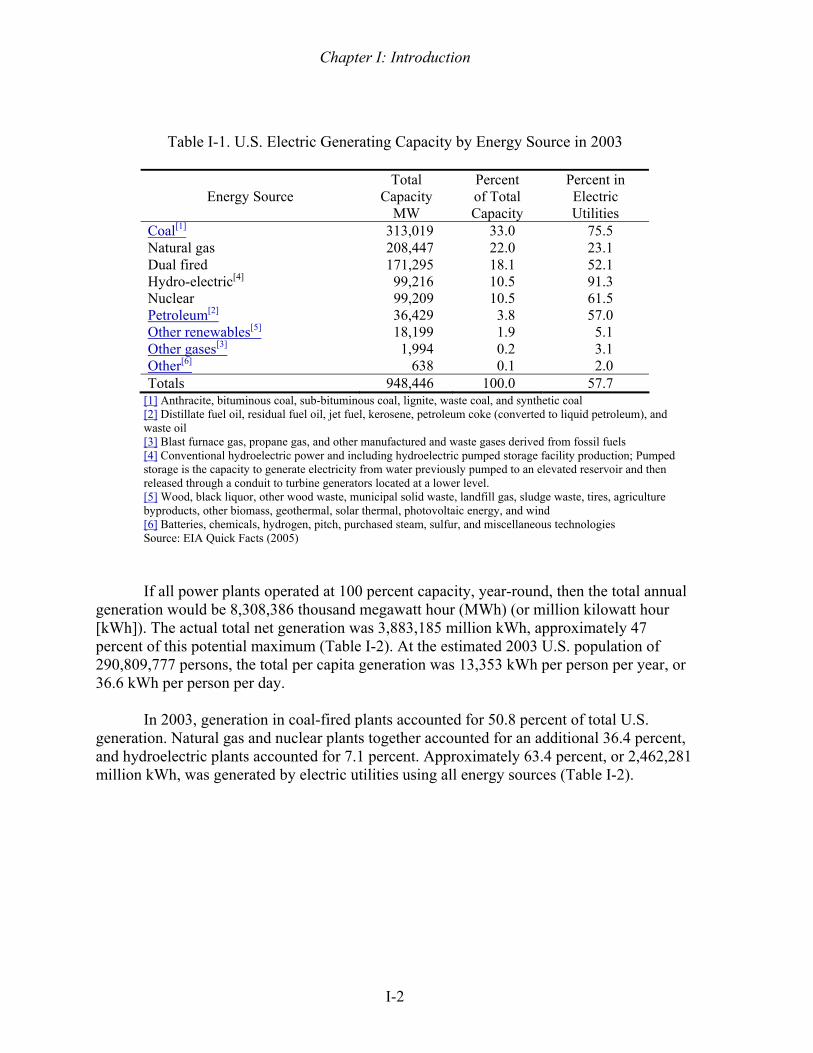
[1] Anthracite, bituminous coal, sub-bituminous coal, lignite, waste coal, and synthetic coal [2] Distillate fuel oil, residual fuel oil, jet fuel, kerosene, petroleum coke (converted to liquid petroleum), and waste oil [3] Blast furnace gas, propane gas, and other manufactured and waste gases derived from fossil fuels [4] Conventional hydroelectric power and including hydroelectric pumped storage facility production; Pumped storage is the capacity to generate electricity from water previously pumped to an elevated reservoir and then released through a conduit to turbine generators located at a lower level. [5] Wood, black liquor, other wood waste, municipal solid waste, landfill gas, sludge waste, tires, agriculture byproducts, other biomass, geothermal, solar thermal, photovoltaic energy, and wind [6] Batteries, chemicals, hydrogen, pitch, purchased steam, sulfur, and miscellaneous technologies Source: EIA Quick Facts (2005) If all power plants operated at 100 percent capacity, year-round, then the total annual
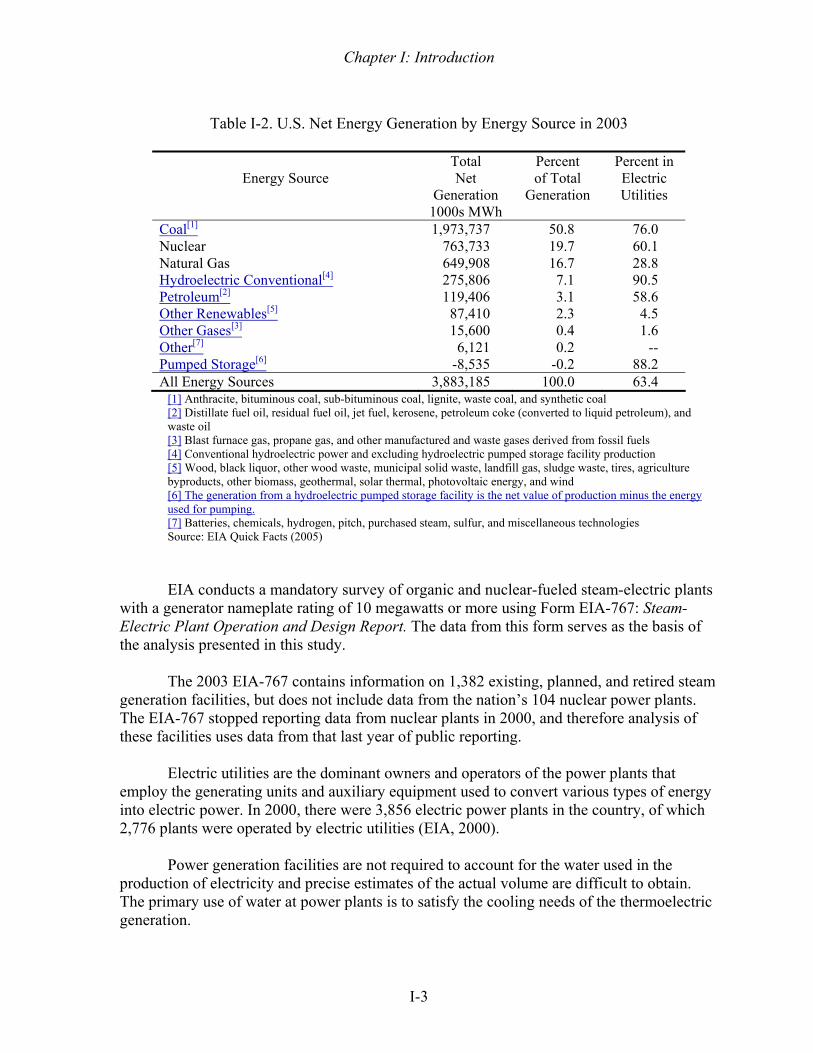
generation would be 8,308,386 thousand megawatt hour (MWh) (or million kilowatt hour [kWh]). The actual total net generation was 3,883,185 million kWh, approximately 47 percent of this potential maximum (Table I-2). At the estimated 2003 U.S. population of 290,809,777 persons, the total per capita generation was 13,353 kWh per person per year, or 36.6 kWh per person per day.
In 2003, generation in coal-fired plants accounted for 50.8 percent of total U.S.
generation. Natural gas and nuclear plants together accounted for an additional 36.4 percent, and hydroelectric plants accounted for 7.1 percent. Approximately 63.4 percent, or 2,462,281 million kWh, was generated by electric utilities using all energy sources (Table I-2).
Chapter I: Introduction
I-3
Table I-2. U.S. Net Energy Generation by Energy Source in 2003
Energy Source Total Net
Generation 1000s MWh
Percent of Total
Generation
Percent in Electric Utilities
Coal[1] 1,973,737 50.8 76.0 Nuclear 763,733 19.7 60.1 Natural Gas 649,908 16.7 28.8 Hydroelectric Conventional[4] 275,806 7.1 90.5 Petroleum[2] 119,406 3.1 58.6 Other Renewables[5] 87,410 2.3 4.5 Other Gases[3] 15,600 0.4 1.6 Other[7] 6,121 0.2 -- Pumped Storage[6] -8,535 -0.2 88.2 All Energy Sources 3,883,185 100.0 63.4
[1] Anthracite, bituminous coal, sub-bituminous coal, lignite, waste coal, and synthetic coal [2] Distillate fuel oil, residual fuel oil, jet fuel, kerosene, petroleum coke (converted to liquid petroleum), and waste oil [3] Blast furnace gas, propane gas, and other manufactured and waste gases derived from fossil fuels [4] Conventional hydroelectric power and excluding hydroelectric pumped storage facility production [5] Wood, black liquor, other wood waste, municipal solid waste, landfill gas, sludge waste, tires, agriculture byproducts, other biomass, geothermal, solar thermal, photovoltaic energy, and wind [6] The generation from a hydroelectric pumped storage facility is the net value of production minus the energy used for pumping. [7] Batteries, chemicals, hydrogen, pitch, purchased steam, sulfur, and miscellaneous technologies Source: EIA Quick Facts (2005)
EIA conducts a mandatory survey of organic and nuclear-fueled steam-electric plants with a generator nameplate rating of 10 megawatts or more using Form EIA-767: Steam-Electric Plant Operation and Design Report. The data from this form serves as the basis of the analysis presented in this study.
The 2003 EIA-767 contains information on 1,382 existing, planned, and retired steam
generation facilities, but does not include data from the nation’s 104 nuclear power plants. The EIA-767 stopped reporting data from nuclear plants in 2000, and therefore analysis of these facilities uses data from that last year of public reporting.
Electric utilities are the dominant owners and operators of the power plants that
employ the generating units and auxiliary equipment used to convert various types of energy into electric power. In 2000, there were 3,856 electric power plants in the country, of which 2,776 plants were operated by electric utilities (EIA, 2000).
Power generation facilities are not required to account for the water used in the
production of electricity and precise estimates of the actual volume are difficult to obtain. The primary use of water at power plants is to satisfy the cooling needs of the thermoelectric generation.
Chapter I: Introduction
I-4
The Cooling Process The main use of water at power plants is for cooling. Nearly 90 percent of electricity in
the United States is produced with thermally-driven, water-cooled generation systems, which require large amounts of water. Three major types of thermoelectric plants can be distinguished, based upon their fuel type and method of generation: conventional steam, nuclear steam, and internal combustion plants. In internal combustion plants, the prime mover is an internal combustion diesel or gas-fired engine. Since no steam or condensation cooling is involved, almost no water is used by internal combustion power generation.
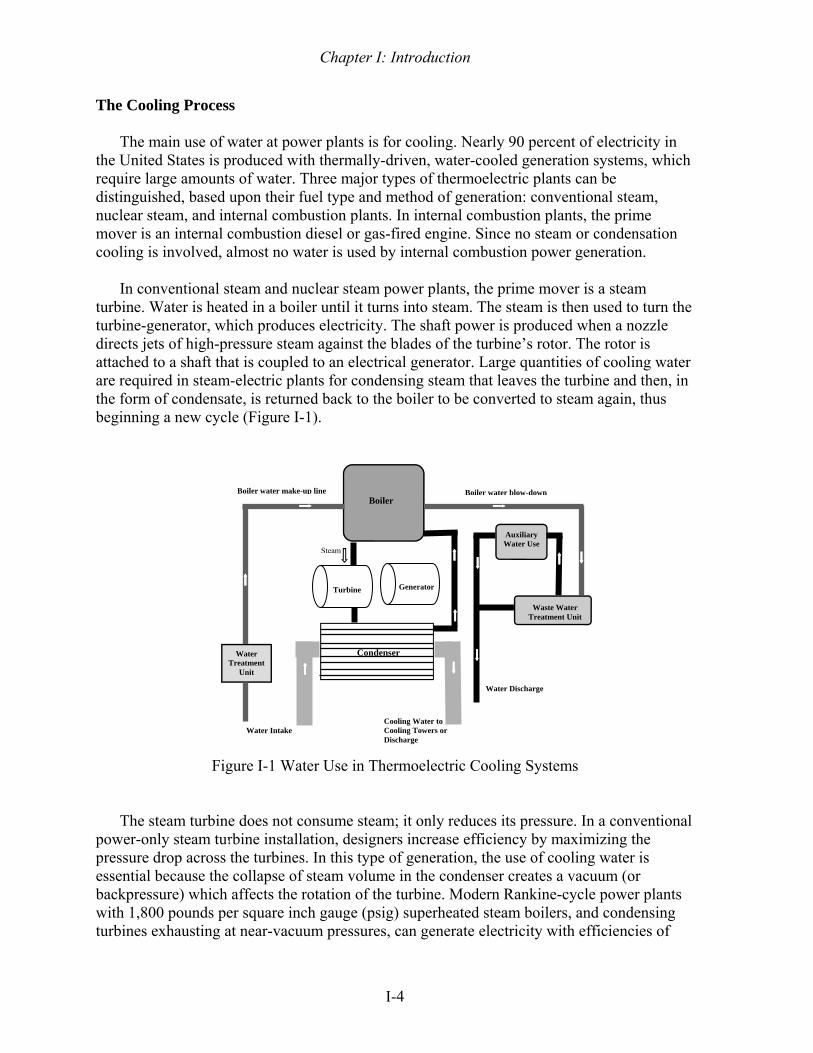
In conventional steam and nuclear steam power plants, the prime mover is a steam
turbine. Water is heated in a boiler until it turns into steam. The steam is then used to turn the turbine-generator, which produces electricity. The shaft power is produced when a nozzle directs jets of high-pressure steam against the blades of the turbine’s rotor. The rotor is attached to a shaft that is coupled to an electrical generator. Large quantities of cooling water are required in steam-electric plants for condensing steam that leaves the turbine and then, in the form of condensate, is returned back to the boiler to be converted to steam again, thus beginning a new cycle (Figure I-1).
Figure I-1 Water Use in Thermoelectric Cooling Systems The steam turbine does not consume steam; it only reduces its pressure. In a conventional
power-only steam turbine installation, designers increase efficiency by maximizing the pressure drop across the turbines. In this type of generation, the use of cooling water is essential because the collapse of steam volume in the condenser creates a vacuum (or backpressure) which affects the rotation of the turbine. Modern Rankine-cycle power plants with 1,800 pounds per square inch gauge (psig) superheated steam boilers, and condensing turbines exhausting at near-vacuum pressures, can generate electricity with efficiencies of
Water Treatment
Unit
Auxiliary Water Use
Waste Water Treatment Unit
BoilerBoiler water blow-downBoiler water make-up line
Water Intake
Water Discharge
Turbine Generator
Condenser
Cooling Water to Cooling Towers or Discharge
Steam
Chapter I: Introduction
I-5
approximately 40 percent. The conventional low-pressure steam turbine generators can operate over a modest backpressure range from 1.0 to 4.0 inches of mercury absolute (Hga) and the optimal efficiency range from 2.0 to 3.5 inches Hga (Micheletti and Burns, 2002). Because the backpressure depends on the removal of “waste” heat by cooling water, the cooling system is an integral part of the power generation process. Types of Cooling Systems
The “waste” heat removed by the cooling system is transferred to the surrounding
environment. In “wet” systems this is done through a combination of evaporation and sensible heating of water or air. In “dry” systems the heat is transferred to the atmosphere through sensible heating. The dry cooling systems are outside the focus of this study and the subsequent discussion is limited only to ‘wet” cooling systems that use water as the cooling medium. The wet systems fall into two broad categories: once-through cooling systems and closed-loop (or recirculating) systems.
In once-through cooling systems, water is withdrawn from a natural water body (such as river, reservoir, estuary, or ocean) and is pumped through a heat exchanger to cool down and condense the steam. After leaving the condenser, the water, with an elevated temperature, is discharged into the receiving water body. Thus, in once-through cooling systems the heat is transferred into a surface water body to which the heated cooling water is discharged.
The once-through method has several advantages. It is the least costly to construct; it
requires less water treatment; and it evaporates less water than evaporative cooling towers. However, it also has some drawbacks. The two most important drawbacks are the large amount of water needed and its contribution to thermal pollution (Gloyna, 1975). A variation of a once-through system is a recirculating system with an evaporation pond or canal. In such a system the heated water is discharged into a pond or canal where its temperature is lowered by mixing with the receiving waters and further cooled by heat exchange and forced evaporation. In systems with cooling ponds, the total volume of water withdrawals is generally lower as compared to the water required for once-through cooling because of different operating conditions.
In wet closed-loop cooling systems, the total volume of water withdrawals can be
reduced by nearly 95 percent compared to the water required for once-through cooling (Harte, 1978). The conventional type of wet cooling system uses towers that are designed to remove heat by pumping hot water to the top of the tower and then allowing it to fall down while contacting the air which comes in from the bottom and/or sides of the tower. As the air passes through the water, it exchanges some of the heat and evaporates some of the water. In cooling towers, as much as 50 percent or more of water is evaporated. The cooled water is collected at the bottom of the tower and is then pumped back to the condenser for reuse. Cooling towers have been increasingly used because they require much less water and land than once-through cooling systems.
Chapter I: Introduction
I-6
QUANTIFYING THERMOELECTRIC WATER USE
Precise estimates of thermoelectric water use at the national level are not available. However, the United States Geological Survey (USGS) under the National Water Use Information Program (NWUIP) regularly prepares nationwide compilations of all reported water use, which are published at five year intervals (Hutson et al., 2005).
In 1995 the total thermoelectric withdrawals were estimated to be 190 bgd with a
corresponding total thermoelectric electric generation of 2,690,000 million kWh (Solley et al., 1998). By combining the 1995 USGS estimates of withdrawals and generation, it is calculated that an average of 25.8 gallons of water were withdrawn to produce each 1.0 kWh of electricity.
The most recent compilation for 2000 estimates the total thermoelectric
withdrawals to be 195.5 billion gallons per day (bgd) or 685 gallons per capita per day. The total annual generation that corresponded with these withdrawals was not reported by USGS but can be estimated using data collected by the EIA. Nationwide total utility generation (excluding 18,183 million kWh of hydropower) for 2000 was estimated to be 2,762,228 million kWh (EIA, 2005). When combined with the USGS estimate of withdrawals, this also results in an estimated average unit withdrawal of 25.8 gallons/kWh.
However, the EIA also reports a substantial quantity of non-utility electric
generation (439,357 million kWh) in 2000 from independent producers. It is unclear from the USGS water-use compilation whether or not water use from these generators is included in the 195.5 bgd total. Also, the 2000 USGS compilation excludes public-supply water deliveries to thermoelectric-power plants, another substantial quantity of water use for this sector. The average unit withdrawals calculated using USGS are conditional on the methodologies used to assemble the data, which may not be consistent in consecutive inventories.
While the USGS water use inventories provide a valuable overview of water use
in the thermoelectric sector, they lack the precision needed to examine water use at generation facilities using different types of cooling systems, different fuel mixes, and different water sources, and they lack the precision to develop water use benchmarks for each of these types of facilities.
The principal source of information on thermoelectric water use in this study is
the average annual rate of cooling water withdrawal data that all generation facilities are required to report to the DOE using the Form EIA 767. As described in other sections of this report, there are technical difficulties that need to be overcome in order to correctly transpose this flow rate data into quantity data that can be used in the calculation of thermoelectric water use benchmarks. Nonetheless, Form EIA 767 serves as the principal source of data for the estimation of water use, as well as power generation, plant characteristics, and virtually all other data required for the analysis presented in this study.
Chapter I: Introduction
I-7
CHAPTER SYNOPSES
This project completion report is organized into seven chapters. This first chapter has
introduced the objectives of this research and provided a background on thermoelectric power generation and its associated water use. Chapter II provides further information on thermoelectric water use and summarizes the findings of previous water use studies in this sector. Chapter III describes the data sources and analytical methods used to examine the historical data on water use. Chapter IV describes the results of site visits and a survey of generating facilities that were conducted as part of this research. An extensive analysis of cooling system-level data in fossil fuel plants is presented in Chapter V. Chapter VI analyzes cooling-system level data in nuclear plants. Chapter VII identifies benchmark quantities for thermoelectric water withdrawals and consumptive use. The conclusions of the study are summarized in Chapter VIII, along with several recommendations for how the study results might influence future research and energy-related water policy.

II-1
CHAPTER II THERMOELECTRIC WATER USE
DEFINITIONS AND SIGNIFICANCE OF WATER USE
The term “water use” is often applied using its broad meaning that denotes the interaction of humans with, and their influence on, the hydrologic cycle and may include both off-stream and in-stream uses such as water withdrawal, delivery, consumptive use, wastewater release, reclaimed wastewater, return flow, hydroelectric power use, and other uses. For the USGS 2000 water use inventory, the term “thermoelectric-power water use” refers only to self-supplied water that is removed from the ground or diverted from surface-water sources, both saline and freshwater, for use in the process of generating electricity with steam-driven turbine generators (Hutson et al., 2004).
The term “water withdrawal” is more precise than the term “water use” because it clearly designates the amount of water that is extracted from natural water sources. In many uses, most of the water withdrawn is returned back to the source. The USGS classifies the difference between withdrawals and return flows (or discharge) as “consumptive use.” This is the quantity of water withdrawn that is evaporated, transpired, incorporated into products or crops, consumed by humans or livestock, or otherwise removed from the immediate water environment. The quantity of water consumed is utilized in calculating regional annual and monthly water budgets, and provides a measure of the volume of water that is not available for repeated use.
“Non-consumptive” withdrawals of water for cooling of thermoelectric power plants can have significant impacts on water resources. For example, the large quantities of water required for power generation must be continuously available for power utilities to provide reliable service to their customers. This quantity of water is therefore “reserved” for power generation and is not available to other user such as irrigators or public water suppliers.
Power plants are also the largest dischargers of thermal pollution. Under §316(a) of
the U.S. Clean Water Act (CWA, 2002), the current controls are likely to be made more stringent in places where receiving streams are being impacted by pollutants other than thermal pollutants. This could potentially lead to plant shut downs, seasonal restrictions on water pumping, or the addition of cooling towers to once-through systems (Veil, 2002).
There are also significant environmental impacts from cooling water intakes. Under
§316(b) of the CWA, the location, design, construction, and capacity of water intakes must reflect the best technology available to minimize adverse environmental impacts. The regulatory schedule (Phase II) of the U.S. Environmental Protection Agency (EPA) requires that all intake facilities must reduce the impingement mortality of water organisms by 80 to 95 percent and in some cases must reduce the intake of small aquatic life (entrainment) by 60 to 90 percent. Some of these regulatory targets can be achieved simply by reducing the rates of water pumping thus reducing the velocity of water at the fish screens.
Chapter II: Thermoelectric Water Use
II-2
HISTORICAL THERMOELECTRIC WITHDRAWALS Aggregate Data
Aggregate data on thermoelectric water withdrawals are collected by the USGS under
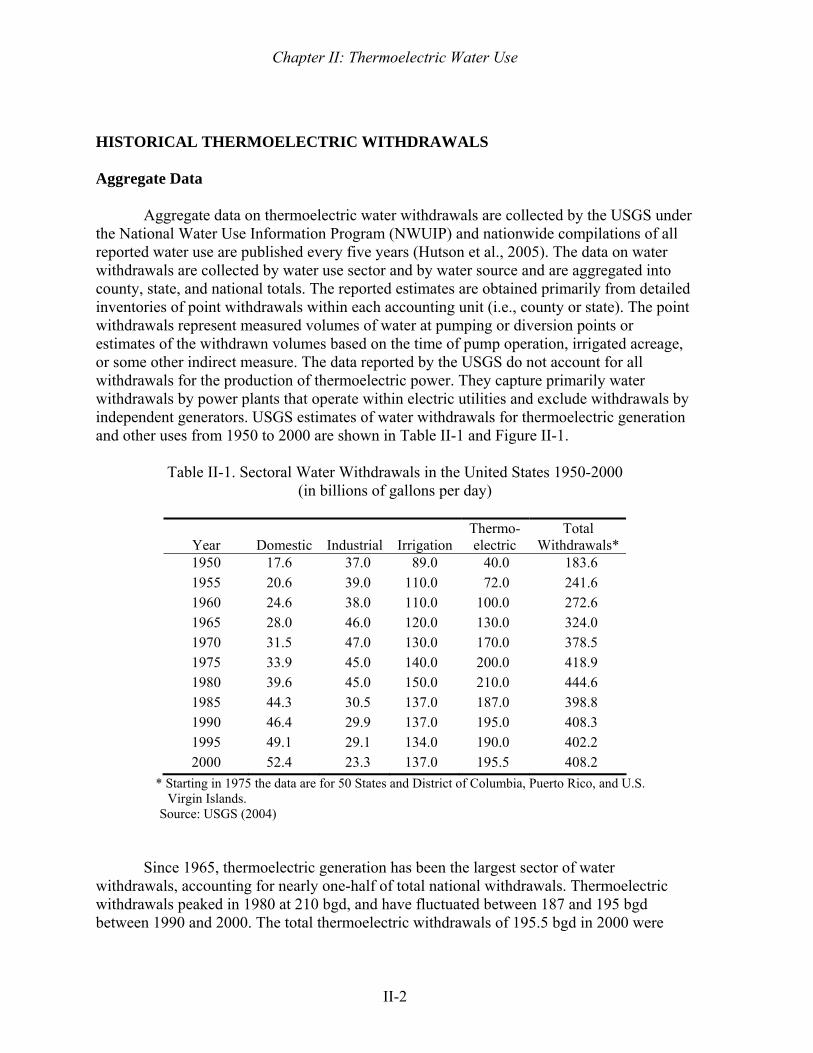
the National Water Use Information Program (NWUIP) and nationwide compilations of all reported water use are published every five years (Hutson et al., 2005). The data on water withdrawals are collected by water use sector and by water source and are aggregated into county, state, and national totals. The reported estimates are obtained primarily from detailed inventories of point withdrawals within each accounting unit (i.e., county or state). The point withdrawals represent measured volumes of water at pumping or diversion points or estimates of the withdrawn volumes based on the time of pump operation, irrigated acreage, or some other indirect measure. The data reported by the USGS do not account for all withdrawals for the production of thermoelectric power. They capture primarily water withdrawals by power plants that operate within electric utilities and exclude withdrawals by independent generators. USGS estimates of water withdrawals for thermoelectric generation and other uses from 1950 to 2000 are shown in Table II-1 and Figure II-1.
Table II-1. Sectoral Water Withdrawals in the United States 1950-2000
(in billions of gallons per day)
Year
Domestic
Industrial
Irrigation
Thermo-electric
Total Withdrawals*
1950 17.6 37.0 89.0 40.0 183.6 1955 20.6 39.0 110.0 72.0 241.6 1960 24.6 38.0 110.0 100.0 272.6 1965 28.0 46.0 120.0 130.0 324.0 1970 31.5 47.0 130.0 170.0 378.5 1975 33.9 45.0 140.0 200.0 418.9 1980 39.6 45.0 150.0 210.0 444.6 1985 44.3 30.5 137.0 187.0 398.8 1990 46.4 29.9 137.0 195.0 408.3 1995 49.1 29.1 134.0 190.0 402.2 2000 52.4 23.3 137.0 195.5 408.2
* Starting in 1975 the data are for 50 States and District of Columbia, Puerto Rico, and U.S. Virgin Islands.
Source: USGS (2004)
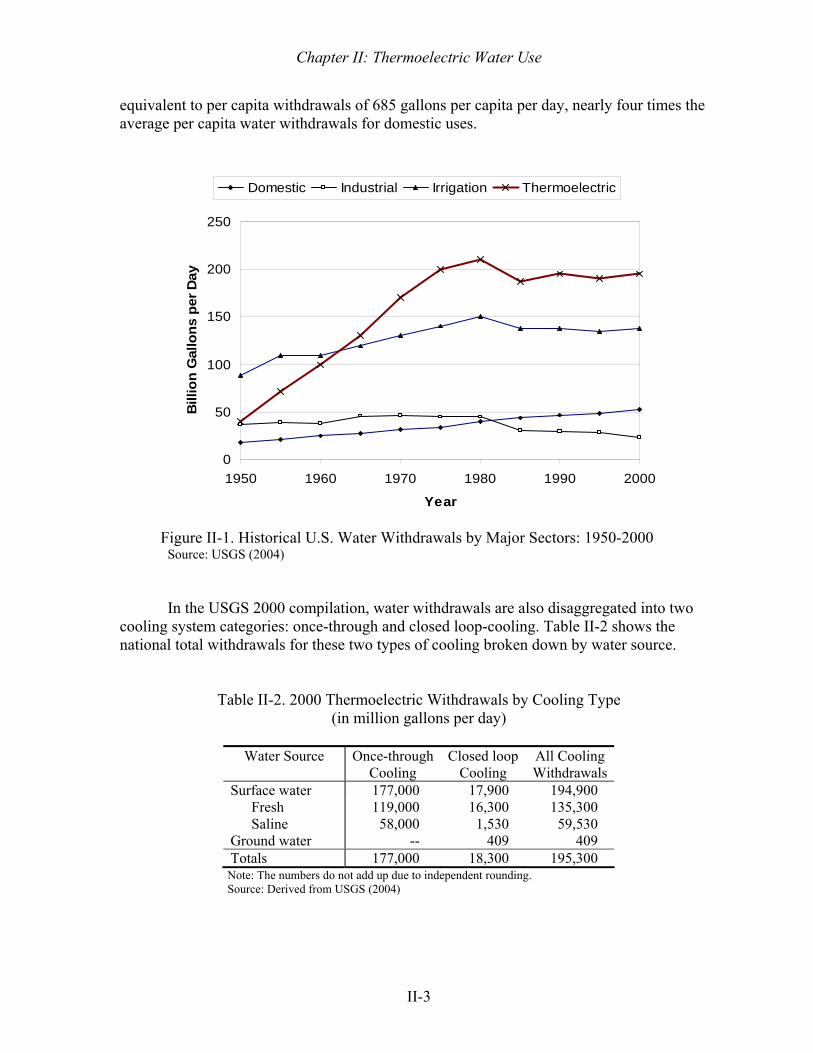
Since 1965, thermoelectric generation has been the largest sector of water
withdrawals, accounting for nearly one-half of total national withdrawals. Thermoelectric withdrawals peaked in 1980 at 210 bgd, and have fluctuated between 187 and 195 bgd between 1990 and 2000. The total thermoelectric withdrawals of 195.5 bgd in 2000 were
Chapter II: Thermoelectric Water Use
II-3
equivalent to per capita withdrawals of 685 gallons per capita per day, nearly four times the average per capita water withdrawals for domestic uses.
0
50
100
150
200
250
1950 1960 1970 1980 1990 2000
Year
Bill
ion
Gal
lons
per
Day
Domestic Industrial Irrigation Thermoelectric
Figure II-1. Historical U.S. Water Withdrawals by Major Sectors: 1950-2000
Source: USGS (2004)
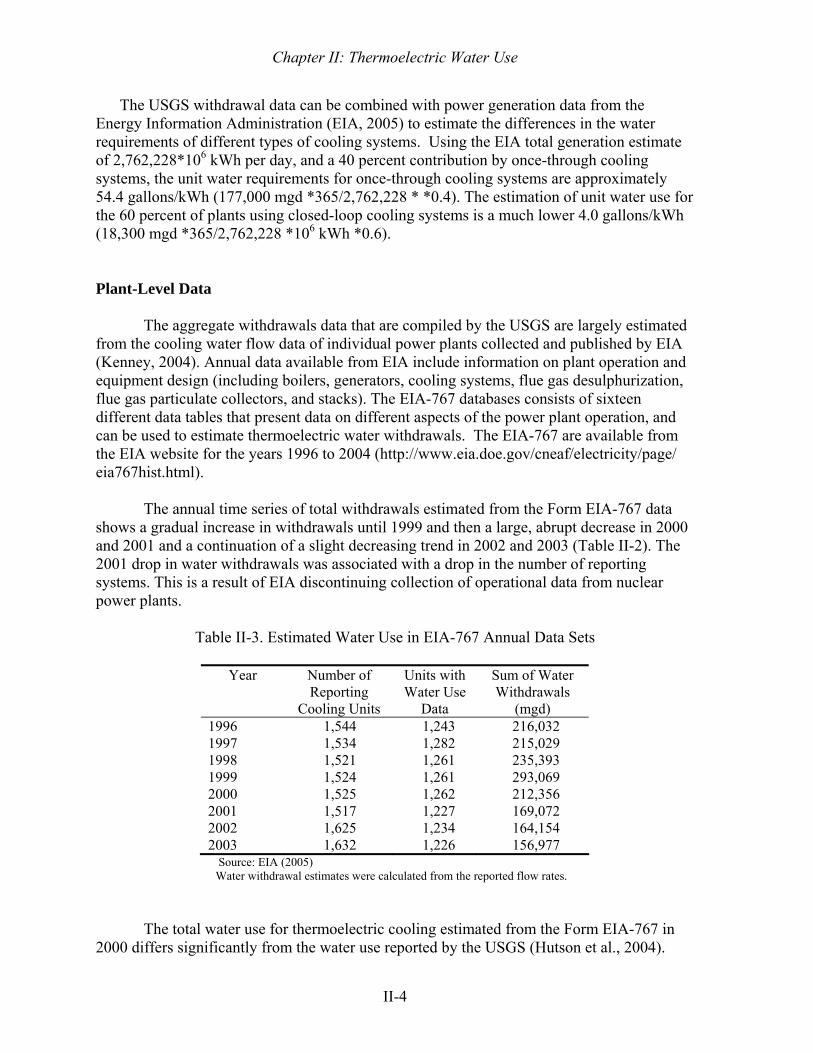
In the USGS 2000 compilation, water withdrawals are also disaggregated into two
cooling system categories: once-through and closed loop-cooling. Table II-2 shows the national total withdrawals for these two types of cooling broken down by water source.
Table II-2. 2000 Thermoelectric Withdrawals by Cooling Type (in million gallons per day)
Water Source Once-through
Cooling Closed loop
Cooling All Cooling Withdrawals
Surface water 177,000 17,900 194,900 Fresh 119,000 16,300 135,300 Saline 58,000 1,530 59,530
Ground water -- 409 409 Totals 177,000 18,300 195,300
Note: The numbers do not add up due to independent rounding. Source: Derived from USGS (2004)
Chapter II: Thermoelectric Water Use
II-4
The USGS withdrawal data can be combined with power generation data from the Energy Information Administration (EIA, 2005) to estimate the differences in the water requirements of different types of cooling systems. Using the EIA total generation estimate of 2,762,228*106 kWh per day, and a 40 percent contribution by once-through cooling systems, the unit water requirements for once-through cooling systems are approximately 54.4 gallons/kWh (177,000 mgd *365/2,762,228 * *0.4). The estimation of unit water use for the 60 percent of plants using closed-loop cooling systems is a much lower 4.0 gallons/kWh (18,300 mgd *365/2,762,228 *106 kWh *0.6).
Plant-Level Data
The aggregate withdrawals data that are compiled by the USGS are largely estimated from the cooling water flow data of individual power plants collected and published by EIA (Kenney, 2004). Annual data available from EIA include information on plant operation and equipment design (including boilers, generators, cooling systems, flue gas desulphurization, flue gas particulate collectors, and stacks). The EIA-767 databases consists of sixteen different data tables that present data on different aspects of the power plant operation, and can be used to estimate thermoelectric water withdrawals. The EIA-767 are available from the EIA website for the years 1996 to 2004 (http://www.eia.doe.gov/cneaf/electricity/page/ eia767hist.html).
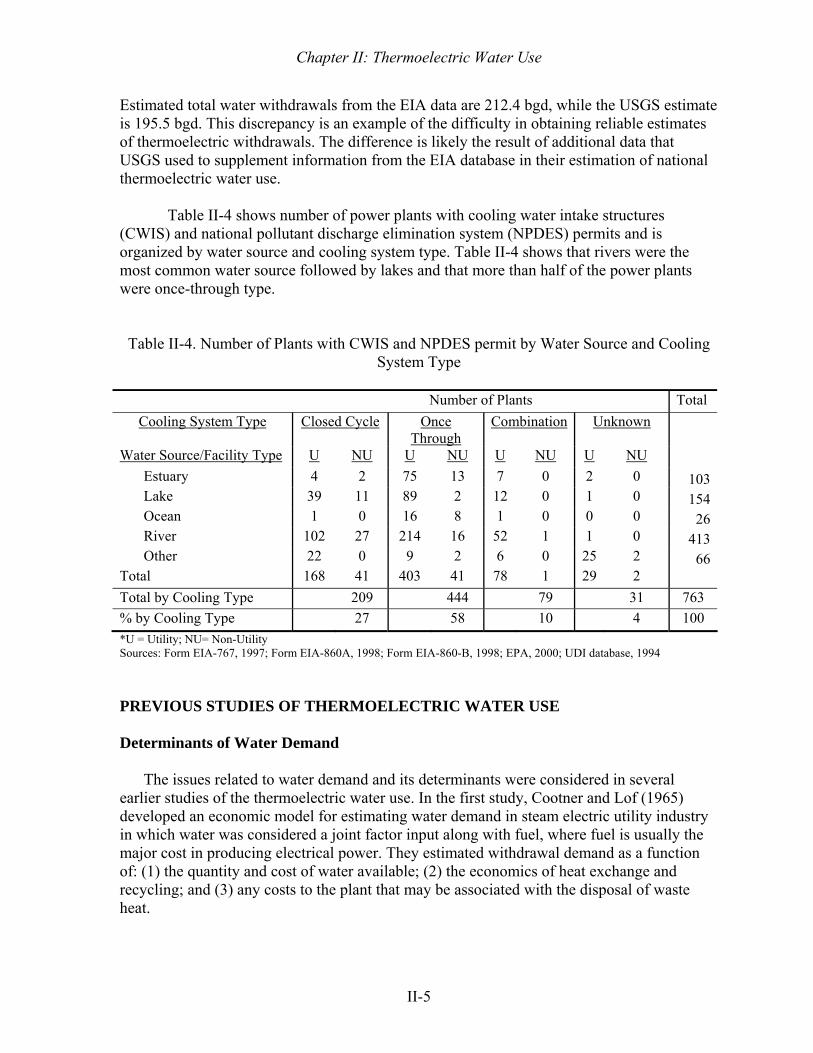
The annual time series of total withdrawals estimated from the Form EIA-767 data
shows a gradual increase in withdrawals until 1999 and then a large, abrupt decrease in 2000 and 2001 and a continuation of a slight decreasing trend in 2002 and 2003 (Table II-2). The 2001 drop in water withdrawals was associated with a drop in the number of reporting systems. This is a result of EIA discontinuing collection of operational data from nuclear power plants.
Table II-3. Estimated Water Use in EIA-767 Annual Data Sets
Year Number of
Reporting Cooling Units
Units with Water Use
Data
Sum of Water Withdrawals
(mgd) 1996 1,544 1,243 216,032 1997 1,534 1,282 215,029 1998 1,521 1,261 235,393 1999 1,524 1,261 293,069 2000 1,525 1,262 212,356 2001 1,517 1,227 169,072 2002 1,625 1,234 164,154 2003 1,632 1,226 156,977
Source: EIA (2005) Water withdrawal estimates were calculated from the reported flow rates.
The total water use for thermoelectric cooling estimated from the Form EIA-767 in
2000 differs significantly from the water use reported by the USGS (Hutson et al., 2004).
Chapter II: Thermoelectric Water Use
II-5
Estimated total water withdrawals from the EIA data are 212.4 bgd, while the USGS estimate is 195.5 bgd. This discrepancy is an example of the difficulty in obtaining reliable estimates of thermoelectric withdrawals. The difference is likely the result of additional data that USGS used to supplement information from the EIA database in their estimation of national thermoelectric water use.
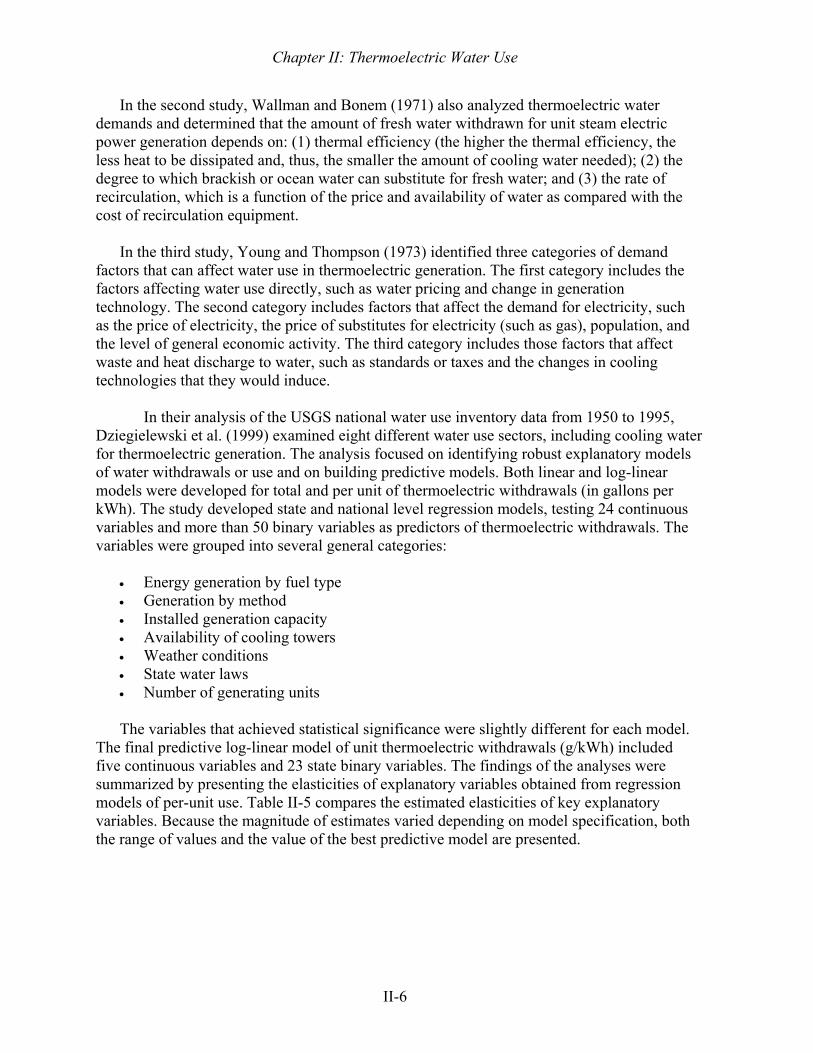
Table II-4 shows number of power plants with cooling water intake structures
(CWIS) and national pollutant discharge elimination system (NPDES) permits and is organized by water source and cooling system type. Table II-4 shows that rivers were the most common water source followed by lakes and that more than half of the power plants were once-through type.
Table II-4. Number of Plants with CWIS and NPDES permit by Water Source and Cooling System Type
Number of Plants Total
Cooling System Type Closed Cycle Once Through
Combination Unknown
Water Source/Facility Type U NU U NU U NU U NU Estuary 4 2 75 13 7 0 2 0 103Lake 39 11 89 2 12 0 1 0 154Ocean 1 0 16 8 1 0 0 0 26River 102 27 214 16 52 1 1 0 413Other 22 0 9 2 6 0 25 2 66
Total 168 41 403 41 78 1 29 2 Total by Cooling Type 209 444 79 31 763 % by Cooling Type 27 58 10 4 100 *U = Utility; NU= Non-Utility Sources: Form EIA-767, 1997; Form EIA-860A, 1998; Form EIA-860-B, 1998; EPA, 2000; UDI database, 1994 PREVIOUS STUDIES OF THERMOELECTRIC WATER USE Determinants of Water Demand
The issues related to water demand and its determinants were considered in several earlier studies of the thermoelectric water use. In the first study, Cootner and Lof (1965) developed an economic model for estimating water demand in steam electric utility industry in which water was considered a joint factor input along with fuel, where fuel is usually the major cost in producing electrical power. They estimated withdrawal demand as a function of: (1) the quantity and cost of water available; (2) the economics of heat exchange and recycling; and (3) any costs to the plant that may be associated with the disposal of waste heat.
Chapter II: Thermoelectric Water Use
II-6
In the second study, Wallman and Bonem (1971) also analyzed thermoelectric water demands and determined that the amount of fresh water withdrawn for unit steam electric power generation depends on: (1) thermal efficiency (the higher the thermal efficiency, the less heat to be dissipated and, thus, the smaller the amount of cooling water needed); (2) the degree to which brackish or ocean water can substitute for fresh water; and (3) the rate of recirculation, which is a function of the price and availability of water as compared with the cost of recirculation equipment.
In the third study, Young and Thompson (1973) identified three categories of demand
factors that can affect water use in thermoelectric generation. The first category includes the factors affecting water use directly, such as water pricing and change in generation technology. The second category includes factors that affect the demand for electricity, such as the price of electricity, the price of substitutes for electricity (such as gas), population, and the level of general economic activity. The third category includes those factors that affect waste and heat discharge to water, such as standards or taxes and the changes in cooling technologies that they would induce.
In their analysis of the USGS national water use inventory data from 1950 to 1995,
Dziegielewski et al. (1999) examined eight different water use sectors, including cooling water for thermoelectric generation. The analysis focused on identifying robust explanatory models of water withdrawals or use and on building predictive models. Both linear and log-linear models were developed for total and per unit of thermoelectric withdrawals (in gallons per kWh). The study developed state and national level regression models, testing 24 continuous variables and more than 50 binary variables as predictors of thermoelectric withdrawals. The variables were grouped into several general categories:
• Energy generation by fuel type • Generation by method • Installed generation capacity • Availability of cooling towers • Weather conditions • State water laws • Number of generating units The variables that achieved statistical significance were slightly different for each model.
The final predictive log-linear model of unit thermoelectric withdrawals (g/kWh) included five continuous variables and 23 state binary variables. The findings of the analyses were summarized by presenting the elasticities of explanatory variables obtained from regression models of per-unit use. Table II-5 compares the estimated elasticities of key explanatory variables. Because the magnitude of estimates varied depending on model specification, both the range of values and the value of the best predictive model are presented.
Chapter II: Thermoelectric Water Use
II-7
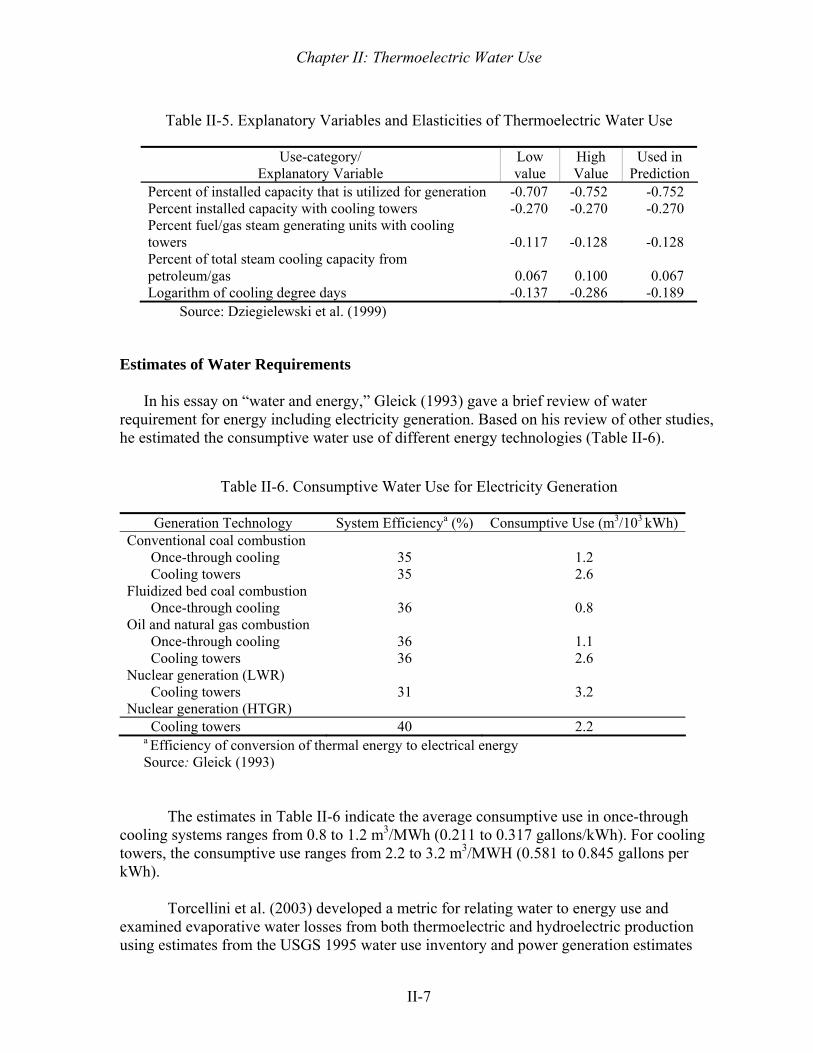
Table II-5. Explanatory Variables and Elasticities of Thermoelectric Water Use
Use-category/
Explanatory Variable Low value
High Value
Used in Prediction
Percent of installed capacity that is utilized for generation -0.707 -0.752 -0.752 Percent installed capacity with cooling towers -0.270 -0.270 -0.270 Percent fuel/gas steam generating units with cooling towers -0.117 -0.128 -0.128 Percent of total steam cooling capacity from petroleum/gas 0.067 0.100 0.067 Logarithm of cooling degree days -0.137 -0.286 -0.189
Source: Dziegielewski et al. (1999)
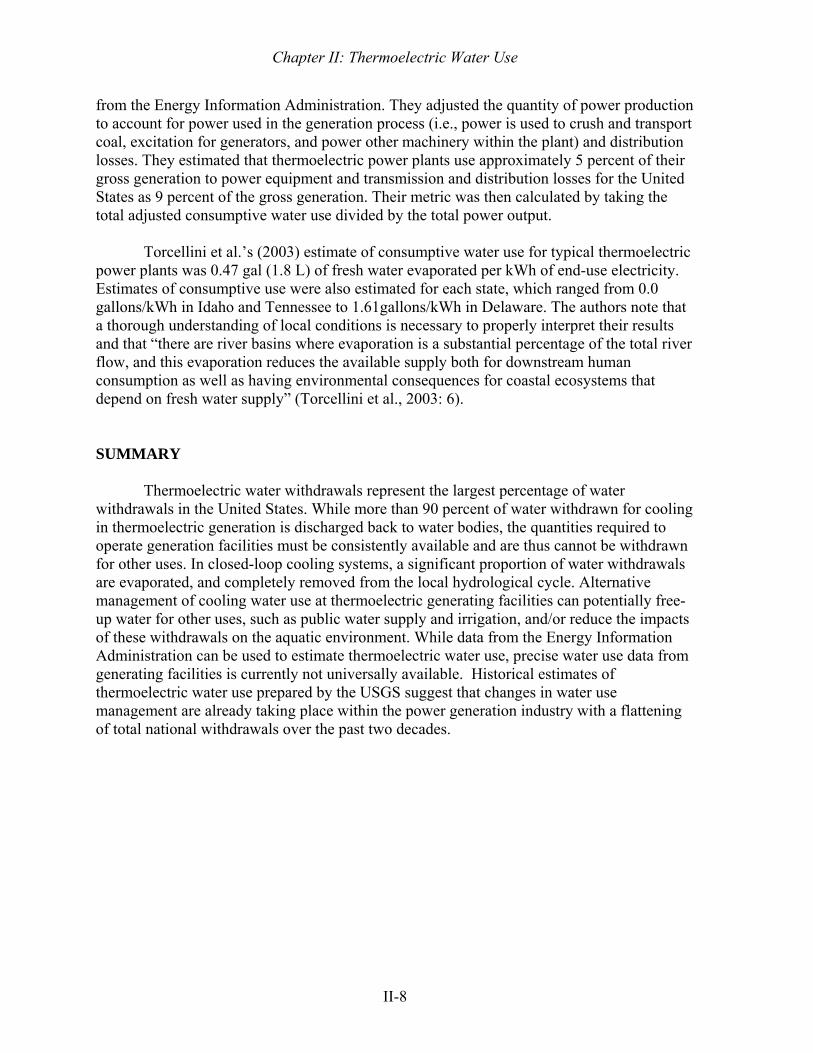
Estimates of Water Requirements In his essay on “water and energy,” Gleick (1993) gave a brief review of water
requirement for energy including electricity generation. Based on his review of other studies, he estimated the consumptive water use of different energy technologies (Table II-6).
Table II-6. Consumptive Water Use for Electricity Generation
Generation Technology System Efficiencya (%) Consumptive Use (m3/103 kWh) Conventional coal combustion
Once-through cooling 35 1.2 Cooling towers 35 2.6
Fluidized bed coal combustion Once-through cooling 36 0.8
Oil and natural gas combustion Once-through cooling 36 1.1 Cooling towers 36 2.6
Nuclear generation (LWR) Cooling towers 31 3.2
Nuclear generation (HTGR) Cooling towers 40 2.2
a Efficiency of conversion of thermal energy to electrical energy Source: Gleick (1993)
The estimates in Table II-6 indicate the average consumptive use in once-through
cooling systems ranges from 0.8 to 1.2 m3/MWh (0.211 to 0.317 gallons/kWh). For cooling towers, the consumptive use ranges from 2.2 to 3.2 m3/MWH (0.581 to 0.845 gallons per kWh).
Torcellini et al. (2003) developed a metric for relating water to energy use and examined evaporative water losses from both thermoelectric and hydroelectric production using estimates from the USGS 1995 water use inventory and power generation estimates
Chapter II: Thermoelectric Water Use
II-8
from the Energy Information Administration. They adjusted the quantity of power production to account for power used in the generation process (i.e., power is used to crush and transport coal, excitation for generators, and power other machinery within the plant) and distribution losses. They estimated that thermoelectric power plants use approximately 5 percent of their gross generation to power equipment and transmission and distribution losses for the United States as 9 percent of the gross generation. Their metric was then calculated by taking the total adjusted consumptive water use divided by the total power output.
Torcellini et al.’s (2003) estimate of consumptive water use for typical thermoelectric power plants was 0.47 gal (1.8 L) of fresh water evaporated per kWh of end-use electricity. Estimates of consumptive use were also estimated for each state, which ranged from 0.0 gallons/kWh in Idaho and Tennessee to 1.61gallons/kWh in Delaware. The authors note that a thorough understanding of local conditions is necessary to properly interpret their results and that “there are river basins where evaporation is a substantial percentage of the total river flow, and this evaporation reduces the available supply both for downstream human consumption as well as having environmental consequences for coastal ecosystems that depend on fresh water supply” (Torcellini et al., 2003: 6). SUMMARY
Thermoelectric water withdrawals represent the largest percentage of water withdrawals in the United States. While more than 90 percent of water withdrawn for cooling in thermoelectric generation is discharged back to water bodies, the quantities required to operate generation facilities must be consistently available and are thus cannot be withdrawn for other uses. In closed-loop cooling systems, a significant proportion of water withdrawals are evaporated, and completely removed from the local hydrological cycle. Alternative management of cooling water use at thermoelectric generating facilities can potentially free-up water for other uses, such as public water supply and irrigation, and/or reduce the impacts of these withdrawals on the aquatic environment. While data from the Energy Information Administration can be used to estimate thermoelectric water use, precise water use data from generating facilities is currently not universally available. Historical estimates of thermoelectric water use prepared by the USGS suggest that changes in water use management are already taking place within the power generation industry with a flattening of total national withdrawals over the past two decades.
III-1
CHAPTER III STUDY DESIGN
STUDY COMPONENTS
The study has three main components: (1) a series of site visits and interviews with power plant personnel; (2) a survey of the U.S. power generation facilities; and (3) the statistical analysis of power generation facility data and other associated information.
SITE VISITS AND POWER PLANT SURVEY
Many of the published research estimates of thermoelectric water withdrawals and consumptive use, including the USGS inventories, are based upon the same source of data, Form EIA 767, even though there are potential ambiguities in the application of these data in the calculation of average and total thermoelectric water use. In order to clarify the way that generation facility managers respond to this survey in practice, and to solicit information from plant managers on factors that influence water use at power generation facilities, the first task in this study was to conduct a series of site visits and a national survey of power plants. The site visits and survey collected information on how water use and power generation are measured and recorded, the accuracy of data reporting in EIA forms, and the applicability of EIA data in the estimation of unit water use ratios (gallons/kWh) for thermoelectric generation facilities. Survey Development and Implementation
Survey development consisted of three steps. The first step was a review of the plant characteristics, power generation, and water use estimates available in 2003 Form EIA-767 database. This review was performed in order to:
(1) Categorize the generation and cooling characteristics of thermoelectric facilities in
the United States; (2) Identify those facilities that would receive mail surveys; and (3) Develop preliminary standardized measures of water use.
The second step of the survey development involved a series of site visits and
personal interviews with plant managers at a sample of thermoelectric generation facilities in the Midwest. The interviews were used to identify the types of on-site water uses, the measurement of these uses, and the water use concerns of plant managers. The site visits provided information on the various types of cooling systems, measurement points, and water use estimation procedures employed by thermoelectric generation facilities. A complete description of the site visit procedures appears in Appendix B.
The final step was the preparation of the questionnaire tool and implementation of the survey. The information collected during the previous components guided both the content
Chapter III: Study Design
III-2
and distribution of the surveys to power plant representatives. Three slightly different versions of the questionnaire were prepared, based upon the primary cooling system type:
(1) once-through cooling systems; (2) re-circulating cooling systems with ponds or canals; and (3) closed-loop cooling systems with cooling towers.
The survey questionnaire consisted of three parts. In the first part of the survey
respondents were presented with a table containing the estimated water use coefficients that had been calculated based on the 2003 EIA-767 data. Respondents were asked to compare these estimates to their own calculations of water use at their facilities and to identify potential sources of variance in water use of the cooling systems in the sample. The second part of the questionnaire consisted of questions pertaining to the measurement and reporting of water use and power generation. The third part provided an opportunity for respondents to provide contact information and general comments pertaining to water use at power generating facilities.
Feedback collected during the site visits had indicated that electronic surveys would be the most effective way to ensure that power generation personnel received the survey, and could easily share it with the administrative and/or water management staff members in their organization who might need to provide approvals or technical information. The Department of Energy was contacted in order to obtain a list of the email addresses of the contact persons for each generation facility. A personalized email form letter describing the study and the survey were sent to the Form EIA-767 administrator at each facility, along with a copy of the appropriate cooling system survey. Form EIA-767 administrators that were responsible for multiple facilities received individualized cover letters and the appropriate surveys for each of their facilities. If email messages were returned due to a bad address, the utility was contacted by phone to see if another contact email address could be obtained. A week after the initial emails were sent, a reminder email was sent to all of the contact persons on the revised mailing list.
It was anticipated that some generating facility email system might have security systems in place that would block the survey email attachments. Therefore, the email cover letter also directed respondents to a web page that contained an explanation of the project and copies of the surveys and associated tables. This web page was posted on the SIUC Geography Department research website, and remained available for several months following the end of the survey collection process.
The detailed review of 2003 Form EIA-767 data (mentioned above) was also used to
identify the generating facilities that were included in the survey sample. The procedure used to identify these facilities is described in detail in Appendix A. Of the 1,382 organically-fueled power generation facilities submitting data in 2003, 669 met the necessary criteria to be included in the survey sample.
Reporting data from the nation’s nuclear power generating facilities are not available in the Form EIA-767 after 2000. The U.S. Nuclear Regulatory Commission was contacted to
Chapter III: Study Design
III-3
obtain a list of those utilities that operate nuclear power generation facilities, and these facilities were contacted by email or telephone and invited to participate in the survey. Several nuclear power plants are operated by utilities that also operate organically-fueled plants. Surveys for these nuclear facilities were sent to the Form EIA-767 manager for that utility. A separate set of coefficient tables was also prepared for the nuclear powered generation facilities based on the most recently available data (2000).
Copies of the survey cover letter, the three versions of the questionnaire, and associated tables appear in Appendix C. The observations made during the site visits and results of the email survey of thermoelectric generation facilities are presented in Chapter IV. STATISTICAL ANALYSIS OF GENERATION FACILITY DATA
The purpose of the statistical analysis was to estimate water use relationships (and water-use coefficients) for discreet types of thermoelectric generation facilities and operating conditions. The results were then used to develop “benchmark” measures that estimate both the average performance, as well as the best potential performance, of each category of cooling systems. Two types of statistical analysis were used: (1) multiple regression analysis, and (2) stochastic frontier analysis. Multiple Regression Analysis
The principal source of data used in the statistical analyses is the Form EIA-767,
Steam Electric Plant Operation and Design Report. EIA-767 provides a fairly comprehensive review of plant characteristics, power generation, and water withdrawal and consumptive use summaries. The EIA-767 survey is conducted annually. Reporting is mandatory under Section 13(b) of the Federal Energy Administration Act of 1974, so the information available from EIA-767 can be considered to be comprehensive. Data in electronic format were available for the years 1996 to 2004.
In addition to the generation and cooling system data, weather data at power generation locations was collected in order to examine the influence of the regional air temperature and rainfall characteristics. This weather data set was developed using the methodologies described in a previous study by the same research team (Dziegielewski et al., 1999).
Multiple regression analyses were performed using the generating facility and
weather data from 1996 to 2004 in order to identify the major determinants of thermoelectric water withdrawals and consumptive use, and to estimate their respective effects on the quantities of cooling water in both once-through and recirculating cooling systems. Four categories of potential influencing factors were examined:
(1) Cooling system type; (2) Fuel type and thermal efficiency; (3) Operational conditions; and (4) Type of water source.
Chapter III: Study Design
III-4
Separate regression models were estimated for three types of cooling systems: once-
through cooling, recirculating systems with cooling ponds or canals, and closed-loop systems with cooling towers. Linear and log-linear models were tested using an ordinary least-squares regression procedure. The log-linear model of total annual withdrawals was specified as:
)ln()ln()ln( ∑ ∑ +++=
jit
kiktkijtjit BcXbaTW ε 3.1
where: itTW is the amount of thermoelectric withdrawals (or consumptive use) in million gallons per day, by cooling system i during year t; ijtX is a set j of determinants represented as continuous variables; iktB is a set k of determinants represented as binary (indicator) variables; a , jb , and kc are the estimated regression coefficients; and itε is the disturbance term.
A similar linear model of withdrawals per unit of net generation was used to further explore the variability of unit withdrawal rates among different plant and cooling system types. Regression models for both total and unit withdrawals for once-through and recirculating cooling systems were estimated using the stepwise regression procedure of the JMP 6.0 software. The data set, specific explanatory variables, and regression results are discussed in Chapter V.
Predictions from the regression models described above were used to generate simple benchmarks of water withdrawals, by cooling system type. However, such benchmarks only represent average conditions among the existing power plants and not the conditions at plants that would be considered to have the best performance in their class. In order to measure the level of performance in terms of technical efficiency of water use, the econometric technique of “stochastic production frontier analysis” was applied to the data set. Stochastic Frontier Analysis
Stochastic frontier regression analysis, is a refinement of the ordinary least-squares regression analysis for the purpose of deriving measures of best performance. It can identify the best performance at the plant level and provide a measure of inefficiency in the process of using water to produce electricity.
Theoretical Background
Frontier analysis is derived from the economic definition of a production technology as a set of feasible input and output combinations, which can be described by the following equation (Kumbhakar and Lovell, 2000):
Y = {(y, x): x can produce y} 3.2
Chapter III: Study Design
III-5
This equation states that the production technology set Y is a set of all combinations of input and output in which input x produces output y. In the case of cooling water, water can be considered as an input in the production of electricity. The boundary of the production technology represents the maximum output that can be obtained from any given input, or alternatively, the minimum input usage required to produce any given output. It therefore represents a standard against which the technical efficiency of production can be measured. Accordingly, a production frontier function can be described as follows:
f(x) = max{y: x∈L(y)} 3.3
where L(y) = {x: (x,y)∈Y } describes the sets of inputs that are feasible for each output. The production frontier provides the upper boundary of production possibilities, and the input-output combination of each producer is located on or beneath the production frontier. Measurement of technical efficiency involves the measurement of distance from the input-output combination to the production frontier graph.
A production frontier utilizes only input and output quantity data. Two measures of
technical efficiency used for this study are input oriented and output oriented. These are often referred to as the Debreu-Farrrell measures of technical efficiency (Kumbhakar and Lovell, 2000) shown in Equations III-2 and III-3, respectively. These two measures assume that producers produce a single output from a single input; in this case, water is used to generate electricity.
According to Kumbhakar and Lovell (2000), if only a single output is produced, the input-oriented measure of technical efficiency is given by the function below:
TEi (x,y) = min{θ: y ≤ f(θx)}. 3.4
Technical efficiency in this case is measured in terms of equi-proportionate contraction of all inputs. An input vector is technically efficient when no equi-proportionate contraction of all inputs is possible. For this study, input related technical efficiency is represented by the factor by which the amount of water use can be decreased from x1 to θx1 and still generate the same amount of electricity (Figure 3.1).
On the other hand, if only a single output is produced, the output-oriented measure of
technical efficiency is given by the function:
TEo (x,y) = [max{Ф: Фy ≤ f(x)}]-1. 3.5
Technical efficiency is measured in terms of equi-proportionate expansion of all outputs. An output vector is called technically efficient when no equi-proportionate expansion of all outputs is possible. The output-related technical efficiency is represented by the factor by which the production of electricity can be increased from y1 to the efficient level of Фy1, using the same amount of water x1 (Figure III-1).
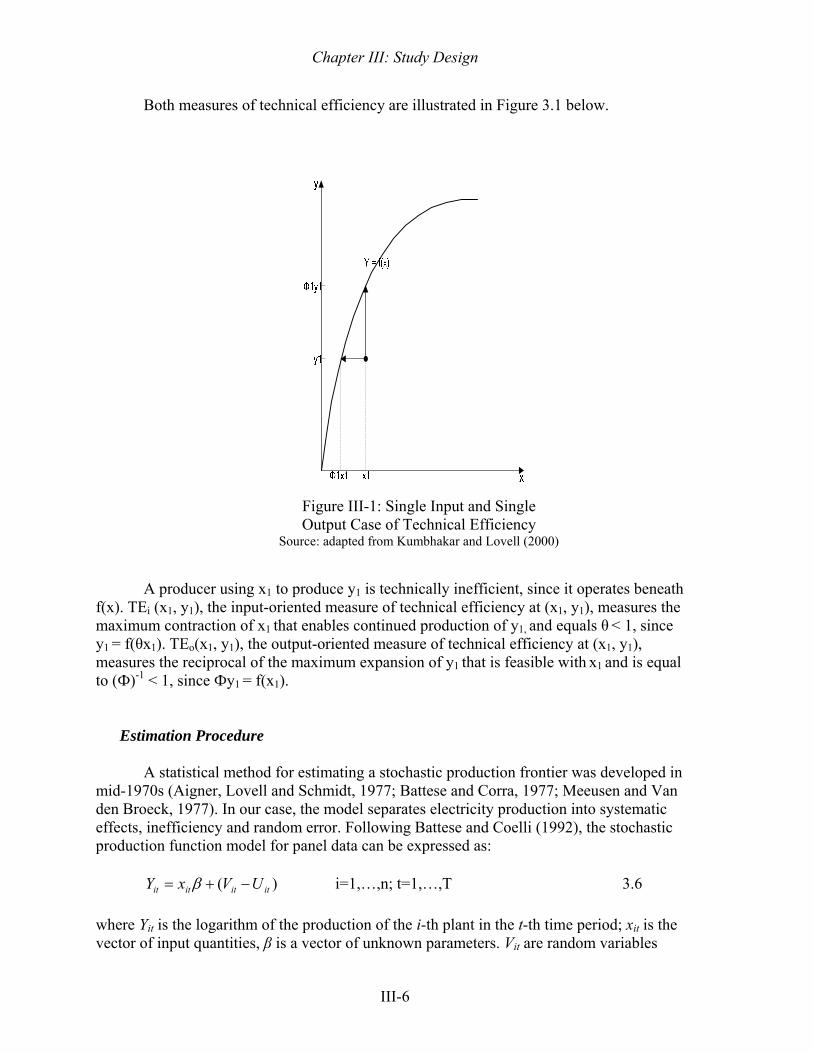
Chapter III: Study Design
III-6
Both measures of technical efficiency are illustrated in Figure 3.1 below.
Figure III-1: Single Input and Single Output Case of Technical Efficiency
Source: adapted from Kumbhakar and Lovell (2000) A producer using x1 to produce y1 is technically inefficient, since it operates beneath
f(x). TEi (x1, y1), the input-oriented measure of technical efficiency at (x1, y1), measures the maximum contraction of x1 that enables continued production of y1, and equals θ < 1, since y1
= f(θx1). TEo(x1, y1), the output-oriented measure of technical efficiency at (x1, y1), measures the reciprocal of the maximum expansion of y1 that is feasible with x1 and is equal to (Ф)-1 < 1, since Фy1
= f(x1).
Estimation Procedure
A statistical method for estimating a stochastic production frontier was developed in mid-1970s (Aigner, Lovell and Schmidt, 1977; Battese and Corra, 1977; Meeusen and Van den Broeck, 1977). In our case, the model separates electricity production into systematic effects, inefficiency and random error. Following Battese and Coelli (1992), the stochastic production function model for panel data can be expressed as:
)( itititit UVxY −+= β i=1,…,n; t=1,…,T 3.6 where Yit is the logarithm of the production of the i-th plant in the t-th time period; xit is the vector of input quantities, β is a vector of unknown parameters. Vit are random variables
Chapter III: Study Design
III-7
assumed to be independently and identically distributed (iid) as N(0,σv2) and independent of
Uit, where
)))(exp(( TtUU iit −−= η 3.7 and where Ui are nonnegative random variables associated with technical inefficiency in production, which are assumed to be “iid” as truncations (at zero) of the normal distributions with mean μ and variance σU
2, and η is a parameter to be estimated.
In order to attempt to identify some of the reasons for differences in efficiencies of individual plants, the predicted technical inefficiency can be regressed upon plant-specific variables (such as type of fuel or source of water). While this is a useful exercise, the two-stage estimation procedure is inconsistent in its assumptions regarding the independence of the inefficiency effects in the two estimation stages. Battese and Coelli (1995) proposed a model in which the inefficiency effects (Ui) are independently distributed as N(mit,σU
2) with truncation at zero and are expressed as an explicit function of a vector of plant-specific variables and a random error term:
δitit zm = 3.8 where zit is a vector of variables which may influence the efficiency of a firm, and δ is a vector of parameters to be estimated.
The FRONTIER Version 4.1 computer program developed by Coelli (1992; 1996) was used in a preliminary analysis of the plant-level data (actually cooling-system level observations) for the period 1996 to 2004 to obtain maximum likelihood estimates of the stochastic frontier production function for each of the two types of cooling systems. The program calculates predictions of individual firm technical efficiencies from estimated stochastic production frontiers. The measure of technical efficiency of the ith sample firm is given as:
),0)(exp(),)(exp(
)exp(iii
iiiii XUYE
XUYEUTE
==−= 3.9
TEi takes a value between zero and one. This prediction of technical efficiencies is
based on the conditional expectation of Equation III-5, given the model specifications.
The maximum likelihood estimates (MLE) for the pooled stochastic production frontier model and those for the technical inefficiency model for the two types of cooling systems based upon a sample of cooling system level data (1996-2004) from EIA 767 are presented in Chapters V and VI.
Chapter III: Study Design
III-8
DEVELOPMENT OF BENCHMARKS
The results of the descriptive data analysis, and the regression and stochastic frontier analyses were used in deriving benchmark values of unit water withdrawals and unit consumptive use in gallons per kilowatt-hour of net energy production. Separate benchmarks of water use were derived for three general types of cooling systems: once-through systems, recirculating systems with ponds or canals, and closed-loop systems with cooling towers.
The data and results of the statistical analyses allowed for the derivation of two types of benchmarks: “average performance” benchmarks and “best performance” benchmarks. The values of the benchmarks are presented and discussed in Chapter VII. The average performance benchmarks are based on the results of the descriptive statistics and regression analyses. The best performance benchmarks are derived from the results of the stochastic frontier analyses.
IV-1
CHAPTER IV FINDINGS OF SITE VISITS AND MAIL SURVEYS
SUMMARY OF SITE VISIT FINDINGS
Site visits were conducted at five power generation facilities. Cooling system types at these facilities included: once-through cooling, re-circulating systems with cooling towers, and re-circulating systems with cooling ponds. None of the plants visited had more than one type of cooling system. Visits began with an interview with the EIA 767 administrator or other staff member, followed by a tour of the facility. A detailed review of the site visit procedure and notes from each facility visit are presented in Appendix B. A summary of the key findings from the site visits is presented below. EIA 767 Reporting / Application of EIA-767 Data to Unit Water Use Calculations
Facility personnel described several potential problems with using the data reported in EIA 767 to calculate the unit water use (gallons/kWh) of power generation facilities. Water quantities are often estimated based upon water pump ratings and hours of pump operation. The assumption of 24 hour/day, 100 percent flows may not apply to all cooling systems. Also, water used for non-cooling needs (i.e., cleaning, flushing, waste disposal, fly ash removal) may delivered by cooling water pumps. These flows may be significant at some facilities and would be reported as of cooling water.
Likewise, on-site use of electricity (i.e., electro-static precipitators) can be substantial
at some facilities. This electric use represents a “service load” and would not be included in the total net generation reported in EIA 767. This can significantly affect the comparability of unit water use calculations among plants with different service loads. All of the interviewees were presented with copies of spreadsheets that were used to calculate the unit water withdrawals for their facility from the data presented in the EIA 767. Only one of the five thought that the calculated estimate did not accurately represent water use and generation at his facility. Determinants of Water Flow
Site visit participants were asked to describe some of the factors that would influence the amount of water used at their facilities. Factors discussed included:
• The need to maintain backpressure when increasing generation requires increased water flows.
• Careful monitoring of the optimal mix between water flows and generation keeps the “cost of pumping” to a minimum, allowing more of the generated power to be sold on the grid.
• Increased water source temperatures require increased cooling water flows. • The quality of groundwater affects the quantity of water used in cooling towers. • Substantial amount of water may be necessary for “ash handling.”
Chapter IV: Findings of Site Visits and Mail Surveys
IV-2
• Flows may need to be decreased to accommodate recreational uses of water
sources that are shared with other users. • NPDES permits were mentioned as a potential influence on water flows; however,
none of the facilities that were visited had ever needed to increase or decrease flows to meet permit requirements.
Water Use Management
Water management concerns appeared to be related to the cooling system type in use at each facility. Managers of plants using ponds needed to pay attention to high intake water temperatures in summer months, while the managers of cooling systems that used well water and cooling towers needed to be mindful of both water quantity and quality. Once-through cooling systems on large water bodies did not need to pay much attention to the quantity of water used. While there could potentially be some problems with exceeding the temperature limits of their discharge permits (NDPES), this had never been a problem for the facilities that were visited.
Most Knowledgeable Contact Person
The initial contact person at each facility was the EIA-767 manager. The duties of this person differed greatly at each facility. The larger utilities that participate in the site visits had a single staff person who responded to all Form-767 inquiries and who referred the research staff to other individuals at the generating facility. The site visits provided little insight into how to design a procedure to ensure that the person most knowledgeable about water use issues at each facility would receive and respond to the email survey. Suggestions for Conducting a Questionnaire Survey of Power Generation Facilities
Survey participants were asked if they thought that power generation plant officials would respond to a voluntary questionnaire survey. They all agreed that few officials would respond to the survey and were unable to suggest any incentives or other actions that would help to improve response rates. It was noted that power plant officials are quite busy and are already required to fill out numerous state and federal forms. Also, all of the informants stated that if they received a survey questionnaire, they would need to forward it to other members of their organization, either for approval, consultation, or both. Several informants suggested that an email survey would have a better chance of success since it could be easily forwarded to other off-site personnel, if necessary.
Chapter IV: Findings of Site Visits and Mail Surveys
IV-3
SUMMARY OF SURVEY FINDINGS
This section describes the survey response rate and provides a summary of the answers to each of the fourteen questions on the survey questionnaire. Survey Response Rate
The target population for the survey phase of this study was all of the U.S. thermoelectric power facilities for which generation and water flow data were available in the 2003 EIA-767 database. Appendix A describes the procedure used to select an initial sample of 669 facilities. Surveys were sent to the EIA 767 administrators who were asked to either complete and return the survey, or forward it to the appropriate person in their organization for completion. A list of email contacts of EIA 767 administrators was obtained from the Energy Information Administration, and all correspondence was conducted using email. The surveys themselves were sent as email attachments and were also made available on a web page that was established to support the study.
Both public and private power generation enterprises often operate more than one
power generation facility, or even more than one electric utility, and often assign the responsibility for completing Form EIA 767 for all of their facilities to a single staff member. Therefore the number of persons who were sent the surveys was smaller than the number of facilities.
Email addresses were unavailable for the contact persons for 36 facilities in the initial
sample and these were dropped from the study. Email messages and electronic copies of the survey were sent to 215 EIA 767 administrators, representing 636 power plants. Of these, 21 email messages were returned as undeliverable and attempts to find other email address, phone numbers, or other contact information were not successful. Eighteen of the contact persons, representing a total of 63 plants sent an email reply that they were not interested in participating in the study. One firm responded that three of the plants included in their list of surveyed facilities had been “mothballed.”
Completed surveys were returned for 38 facilities (21 with cooling towers, 3 with
cooling ponds, 14 with once-through cooling). Several other survey participants responded directly to the project principal investigator by phone, and did not submit a survey. A few others responded via email, with descriptions of water use at their facilities, rather than completing the surveys.
The low response rate is consistent with the predictions made by EIA 767
administrators during the site visits. Indeed, only two of the five facilities that participated in the site visits, returned email surveys sent to their facilities. Several reasons for the lack of response to the survey can be inferred from comments solicited during the site visits or that were provided by survey respondents in email messages or in telephone conversations. These are:
Chapter IV: Findings of Site Visits and Mail Surveys
IV-4
• Surveys are a difficult tool to use to collect information from complex organizations,
such as those of most power generation facilities. Hierarchical administrative structures make it difficult for staff to participate in surveys without prior approvals.
• The EIA 767 administrator may not have access to the information needed to complete the survey form, and may find it too time consuming to obtain the information from other staff members, especially at utilities that operate multiple power generation facilities.
• Privately-owned utilities may consider some of the information requested on the survey to be proprietary, and believe that it is against their best interest to participate.
• There may be a general reluctance by any large organization to provide any information that is not strictly mandated.
• There may be some concern that participating in studies about power generation water use “only results in efforts to further regulate power generation facilities.”
• Several persons who received the survey form contacted the research team to complain that the survey designed was inadequate and could not be used to collect any meaningful information about power generation water use. These individuals declined to participate in the study or to suggest ways to prepare more meaningful survey questionnaires.
Review of Survey Questionnaire Results
Copies of the three different types of survey forms (one for each cooling system type) appear in Appendix C. Detailed responses to the survey appear in Appendix D. These responses have been edited slightly to preserve the anonymity of the respondents, as required under the survey protocol. The following section summarizes the responses to each survey question. Question 1 - How is the average annual rate of cooling water withdrawals estimated for the
cooling systems at your facility? Form EIA 767 requires facilities to report their average annual rate of cooling water
withdrawals. This estimated flow rate is used in the study as the key source of information to calculate the quantity of water used in the production of electricity by each cooling/generating system in the analysis. Survey questions 1 and 2 were used to collect information on how these estimates were prepared, and types of errors that could occur when using these flow rates to estimate quantities of water withdrawals.
All of the once-through facilities estimated water use based on pump operations,
while almost all of the plants using cooling towers had measuring devices in place to record water use volumes. Two of the pond systems estimated water use based on pump operations, while the third measured the make-up water pumped into their cooling pond from another water source to calculate withdrawals, rather than water pumped through the cooling system. Several other methods of estimation and measurement were also mentioned.
Chapter IV: Findings of Site Visits and Mail Surveys
IV-5
Question 2 - Do the water use ratios calculated from the data in Form EIA-767 for your cooling systems appear to be correct?
More than half (25/38) of the respondents considered the estimated water use ratios
calculated from the Form EIA-767 data to be reasonable estimates of water use at their facility. Those respondents answering “no” to the question cited various explanations for the inaccuracy of the estimated ratios.
• Assumptions about the number of pumps in operation and the number of hours of operation are incorrect (once-through systems).
• Misalignment of generation and reported cooling withdrawals. For some facilities cooling water withdrawals can only be reported for all cooling systems together. When the average annual rate of cooling water is known for the entire plant but not the individual cooling system, Form EIA-767 instructions require plant officials to assign the total flow rate to a single cooling system, and to report “EN” for all the remaining systems. For these facilities, the water use coefficient must be calculated by summing generation from all cooling systems, and then to calculate water use using the flow rate reported for the “non-EN” cooling system.
• Some facilities are running cooling water pumps full-time regardless of whether or not generation is operating at full capacity.
• The data in EIA-767 is inaccurate and cannot be used to calculate these ratios. Question 3 - Do water withdrawal ratios for the cooling systems at your facility differ
significantly from the median for your cooling system type? Respondents were presented with a calculation of the median water use for all of the
facilities with cooling systems that were similar to their own, and asked to compare water use at their facility to this median. The majority (25/38) stated that the median value was reasonably close to the estimated values for their own facilities.
All three facilities using cooling ponds thought that the median ratio was significantly
different from the ratios that could be calculated for their facilities. However, no clear reasons were provided as possible sources or this difference. Ten other facilities (five once-through and five cooling-tower facilities) also responded that the median was not representative of the experience at their facilities. Only two of these suggested explanations for the differences. One respondent stated that their pumps operate continuously, regardless of the level of generation. The other respondent noted that each system that uses cooling towers can be considered to be unique because of the wide variation of cooling tower designs and operating practices. Question 4 – What might account for the wide range of unit water use values?
Each survey included a histogram displaying the wide range of unit water use values
calculated for the three different categories of cooling systems. Survey participants were
Chapter IV: Findings of Site Visits and Mail Surveys
IV-6
asked to suggest reasons for the wide range of values that occur in all facilities, regardless of cooling type.
The reason most frequently cited by once-through cooling system respondents was
the way that cooling water withdrawals are estimated or reported. Differences in the frequency and length of time of boiler/generator shutdown times and the designed temperature rise of the condenser(s) in use at each facility were the next most frequently suggested reasons. Other reported conditions included: differences in the interpretation of what constitutes cooling water, differences in inlet water temperature, and the use of condensate coolers in summer months.
All three of the respondents from facilities using re-circulating cooling systems with
ponds cited differences in the way that cooling water withdrawals are estimated or reported as a reason for the wide range of unit water use values. Some of the other conditions suggested were: differences in the frequency and length of time of boiler/generator shutdowns, variable reservoir inflows due to weather conditions, and variable irrigation releases.
The most frequently cited reason for the wide range of unit water use values for
closed-loop cooling systems with towers was differences in intake water quality that result in different blow-down rates. Differences in makeup water measurement, cooling tower and condenser designs, and shut-down times were also suggested. One respondents noted several plant and site characteristics that could influence the unit water use rate:
• recovery systems installed at the facility • use of on-site wells • water used in auxiliary systems at the plant (e.g., lime spray dryers) • ambient conditions at the facility location (humid vs. dry climate, warm vs. cool
climate) • ways that plant design incorporate service water (auxiliary water) used to cool plant
equipment Question 5 - Is it possible to measure or estimate cooling water consumption at your
facility? Although large quantities of water may be used in the power generation cooling
process, all but a small fraction of this water is returned to nearby surface water sources and is considered to be “consumed.”
Less than one-third of once-through cooling systems (4 out of 13 responses) reported
that they were able to measure the consumptive use of water, with several responding that there was no “consumptive” use of water at once-through cooling facilities. The measurement methods used by those who were able to estimate consumptive use included: measurement at outfall weirs, rough evaporative estimates, cooling water pump flow curves, and the “water balance” method.
Chapter IV: Findings of Site Visits and Mail Surveys
IV-7
The majority (18/21) of the respondents with cooling towers reported that it was possible to measure or estimate cooling water consumption, due to the many measuring devices available at these facilities. Two of the three facilities using re-circulating systems with ponds answered that they could measure consumptive use with measuring devices, or prepare estimates based on a “water consumption factor.” Question 6 – What are some of the possible sources of cooling water consumptive use?
One-third of respondents from once-though cooling systems and cooling systems with
ponds stated that there was no consumptive use at their facilities. The remaining respondents from these categories suggested several potential sources of consumptive use:
• water diverted to other uses • vented to atmosphere during startups • result of inaccurate measurement
Several sources of consumptive use were cited by facilities using cooling towers,
including: • tower evaporation • drift • vented steam • water diverted to other uses • blow-down to control cycles and prevent corrosion/scaling of the condenser • water used for ash handling
Question 7 - Are there any non-cooling water needs at your facility that use water from the cooling system?
Ideally, water use coefficients would be calculated using only quantities of water that
were used for cooling. However, water pumped for cooling is often used for other non-cooling needs. If these non-cooling uses are significant they can affect the unit water use values.
Approximately half of the respondents, from all cooling system types, indicated that
there are non-cooling water needs at their facility that use water from the cooling system. The largest uses were processing/washing for once-through facilities, irrigation for facilities with ponds, and scrubber dilution water and ash handling for cooling towers facilities. A complete list of the non-cooling needs and estimated quantities is included in Appendix D. Question 8 - How is NET GENERATION calculated for the generators at your facility?
As with non-cooling water uses, most facilities also use some of the electricity that
they are generating to meet on-site energy needs. Substantial quantities of on-site electric use will influence the value of the unit water use ratio.
Chapter IV: Findings of Site Visits and Mail Surveys
IV-8
Almost all of the facilities responding to the survey indicated that metering is
available to measure both the gross generation and the service load energy for each generator. However, Form EIA-767 does not require the reporting of gross generation. Question 9 - Approximately what percent of gross generation on annual basis does net
generation represent at your facility? Almost all of the responding facilities maintain a record of gross generation for each
generator at their power plant. The reported ranges of the percent of net to gross generation by cooling type were:
• 90 to 100 percent for once-through plants • 94 to 94.7 percent for re-circulating cooling with ponds • 87.5 to 98.6 percent for cooling towers
Question 10 - Does your facility measure and record the ANNUAL TOTAL WATER
WITHDRAWALS for your facility
As discussed previously, the only publicly available water use data for all power generation facilities is the cooling water flow rate reported in Form EIA 767. This flow rate has been used in many studies that estimate water use at power plants. However, actual measures of total withdrawals would greatly simplify the analysis of the relationship of power generation and water use.
For all cooling types, the majority of the surveyed facilities indicated that they do
measure and record the annual total water withdrawals. While they may provide this data for other state and federal agencies, it is not requested on Form EIA 767. Question 11 - Are there any constraints to cooling water withdrawals at your plant?
The main constraints to cooling water withdrawals at once-through facilities were
temperature and volume limitations mandated under NPDES, state permitting requirements, seasonal temperatures, and pumping capacity. Re-circulating facilities with ponds were mainly constrained by state permits, seasonal temperatures, and contractual and water right issues, while cooling towers were constrained by pumping capacity and contractual and water rights.
Chapter IV: Findings of Site Visits and Mail Surveys
IV-9
Question 12 - Do you currently use any “alternative” sources of water at your plant?
The majority of the respondents for once-through plants and re-circulating facilities
with ponds do not use any “alternative” sources of water at their plants; however, ash ponds and wastewater were common for cooling tower plants. Alternative sources that were listed by survey respondents included:
• groundwater/deep wells • city water (treated for boiler make-up) • brackish water and city water • direct rainfall (re-circulating with ponds) • recycled water • storm water sediment ponds
Question 13 - If water intake from your current source had to be reduced, what actions could
be taken at your plant to respond to this reduction? Understanding the actions that facilities would use to reduce water use is another
method of determining those factors that influence cooling water use. For all types of plants, generation reduction is the most likely response to reduce
water use. The installation of cooling towers and supplemental water intake were other methods suggested for reducing water use. Several facilities suggested operating generators at sub-optimal pressures, but one respondent described several detrimental impacts from such actions. Other actions suggested by respondents included:
• alteration of cooling water structures to improve efficiency • irrigation water exchanges or purchases • use sea water • reuse more pond discharge • increase cycles of concentration in cooling towers • increase chemical feed or modify pretreatment chemistry or cooling water
chemistry and treatment Question 14 - What is your title and water management responsibilities?
Information was requested on the title of the person who completed the survey in
order to assess the range of personnel and skills that are dedicated to generating facility water management. The titles of the survey participants included:
• Air Program Coordinator • Environmental Analyst/Supervisor/Specialist/Coordinator/Compliance Engineer • Assistant Plant Superintendent • Area Superintendent • Chemical Supervisor/Chemist
Chapter IV: Findings of Site Visits and Mail Surveys
IV-10
• Operations Superintendent • Performance Engineer/Plant Engineer/Results Engineer, • Power Production Executive Manager • Vice President • Team Leader More than half of the respondents had other recording and reporting responsibilities.
Approximately one-third of all respondents for each type of cooling system also had some management and decision making responsibility relating to plant water use. Summary of Findings
The site visits and the surveys helped to identify important concerns about water measurement and use at thermoelectric power plants, and factors that deserve attention in the development of models to describe thermoelectric water use. This information proved valuable in the design of the data analysis that was used to develop water use benchmarks and other comparative measures of water-use efficiency.
The first important finding is that the generation facilities (i.e., individual generators, also referred to as generating units) can be subdivided into three groups in terms of the continuity or frequency of their operations: base load generation, load following generation, and peak-load generation. Water use per kilowatt-hour of net generation will be affected depending on the type of generation. Because of the technical design characteristics, water pumps in the load-following and peak-load generation may continue to operate at the same flow rate regardless of the actual level of generation. This is likely to produce high ratios of cooling water volume per unit of electricity generation. This finding was taken into consideration by including a variable in the statistical analysis of the EIA 767 data that captured the utilization rate of the generating capacity.
The second critical finding is that the available net generation estimates by each generator (i.e., generating unit) in the EIA-767 database is not the appropriate measure of generation to be compared with the volume of cooling water being used. Cooling water requirements are driven by the amount of gross generation and therefore the amount of heat that needs to be removed. Net generation excludes a fraction of total generation that is used within the plant. While some remedial measures were employed in this research to capture the variance in “service loads” among different systems, future studies of water use in thermoelectric plants would benefit from obtaining gross generation for each generating unit, in order to be able to calculate gross generation for all generating units served by each cooling system.
Other, more specific, findings from the surveys were also taken into account in formulating statistical models of water withdrawals and the development of meaningful benchmarks of thermoelectric water use.
V-1
CHAPTER V STATISTICAL ANALYSIS OF WATER USE
IN FOSSIL FUEL PLANTS
DATABASE EIA-767 Data Set
In a typical thermoelectric power plant, boilers, generators, and cooling systems are interconnected. One cooling system can be connected to several generators or boilers. Likewise, one boiler or generator can also be served by several cooling systems. The data contained in the EIA-767 databases are reported at different levels of observation: electricity generation data are recorded at the generator level, fuel source and quantity data are recorded at the boiler level, and water use data are recorded at the cooling system level.
The analyses in this study are conducted at the “cooling system” level. Form EIA-767’s
multi-level data reporting make it difficult to associate the reported thermoelectric water withdrawals with corresponding amounts of energy generation, fuel type, cooling system type, and other characteristics. Boilers, generators, and cooling systems all need to be correctly aligned before they could be used in the statistical analysis of water use.
The procedure for aligning the data consisted of two steps. First, the interconnected
cooling systems, boilers, and generators were identified and grouped into generation-cooling units (referred to as simply “cooling systems” in the remainder of this report), represented by a unique system identification number (ID). Second, the values of the following seven factors were determined for each newly created unit: (1) total annual water use, (2) cooling system type and age, (3) average cooling water temperature rise in the condenser, (4) type of the fuels burned by the corresponding generators, (5) type of the water sources for cooling, (6) total annual net electricity generation and generation capacity by the corresponding generators, and (7) total annual supplied heat.
The resulting database used in the statistical analysis contained 7,365 observations of
reported thermoelectric water withdrawals and consumptive use for cooling systems in fossil fuel plants during a nine-year period from 1996 to 2004(Table V-1). A preliminary analysis of the estimated unit withdrawals by cooling system type demonstrated that three general categories could be used to group all of the other cooling types (see Table C-1). The number of power plants with sufficient data to include in the analysis varied by year, and ranged from 377 plants in 1996 to 605 plants in 2003. The number of cooling units in the data set also varied by year, ranging from 585 in 1996 to 1,121 in 2001. Variables
In addition to the data on water withdrawals and consumptive use, measurements on a large number of potential explanatory variables were included in the database. Five categories of likely determinants of cooling water withdrawals were examined (Table V-2). These included: (1) specific types of cooling systems; (2) fuel types; (3) operational conditions; (4) water sources, and (5) other variables. Most of the variables created for the
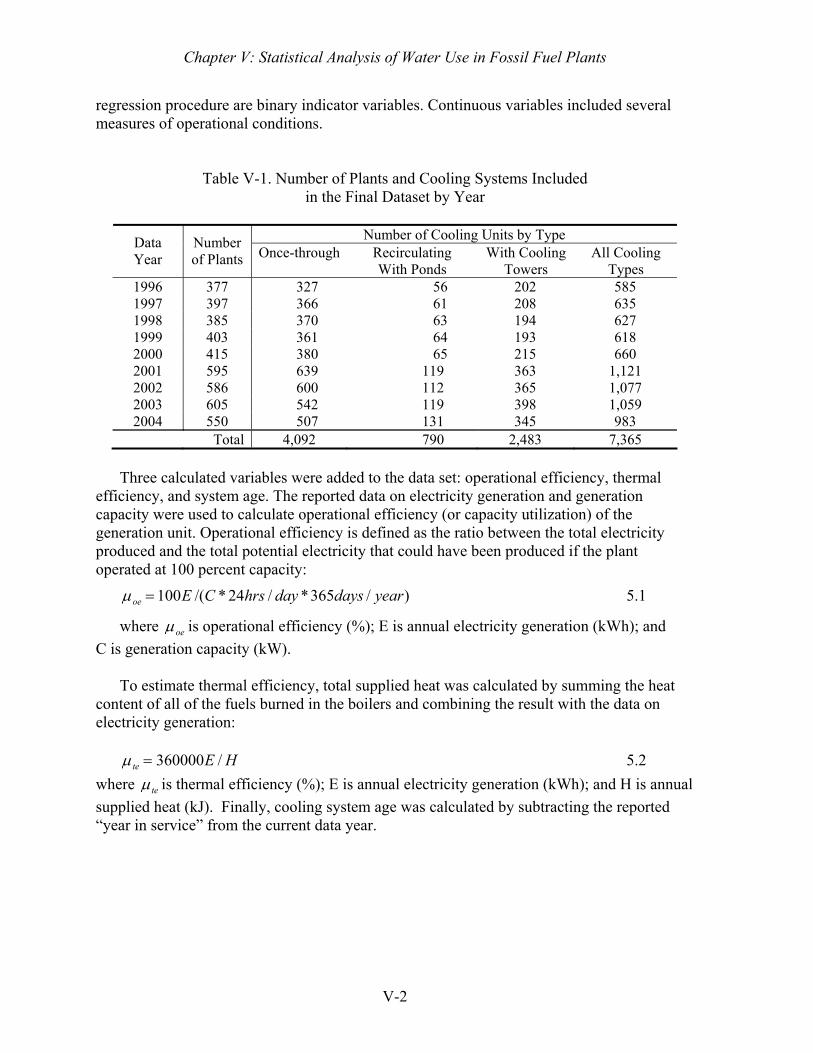
Chapter V: Statistical Analysis of Water Use in Fossil Fuel Plants
V-2
regression procedure are binary indicator variables. Continuous variables included several measures of operational conditions.
Table V-1. Number of Plants and Cooling Systems Included in the Final Dataset by Year
Number of Cooling Units by Type Data
Year Number of Plants Once-through
Recirculating With Ponds
With Cooling Towers
All Cooling Types
1996 377 327 56 202 585 1997 397 366 61 208 635 1998 385 370 63 194 627 1999 403 361 64 193 618 2000 415 380 65 215 660 2001 595 639 119 363 1,121 2002 586 600 112 365 1,077 2003 605 542 119 398 1,059 2004 550 507 131 345 983
Total 4,092 790 2,483 7,365
Three calculated variables were added to the data set: operational efficiency, thermal efficiency, and system age. The reported data on electricity generation and generation capacity were used to calculate operational efficiency (or capacity utilization) of the generation unit. Operational efficiency is defined as the ratio between the total electricity produced and the total potential electricity that could have been produced if the plant operated at 100 percent capacity:
)/365*/24*/(100 yeardaysdayhrsCEoe =μ 5.1
where oeμ is operational efficiency (%); E is annual electricity generation (kWh); and C is generation capacity (kW).
To estimate thermal efficiency, total supplied heat was calculated by summing the heat
content of all of the fuels burned in the boilers and combining the result with the data on electricity generation:
HEte /360000=μ 5.2
where teμ is thermal efficiency (%); E is annual electricity generation (kWh); and H is annual supplied heat (kJ). Finally, cooling system age was calculated by subtracting the reported “year in service” from the current data year.
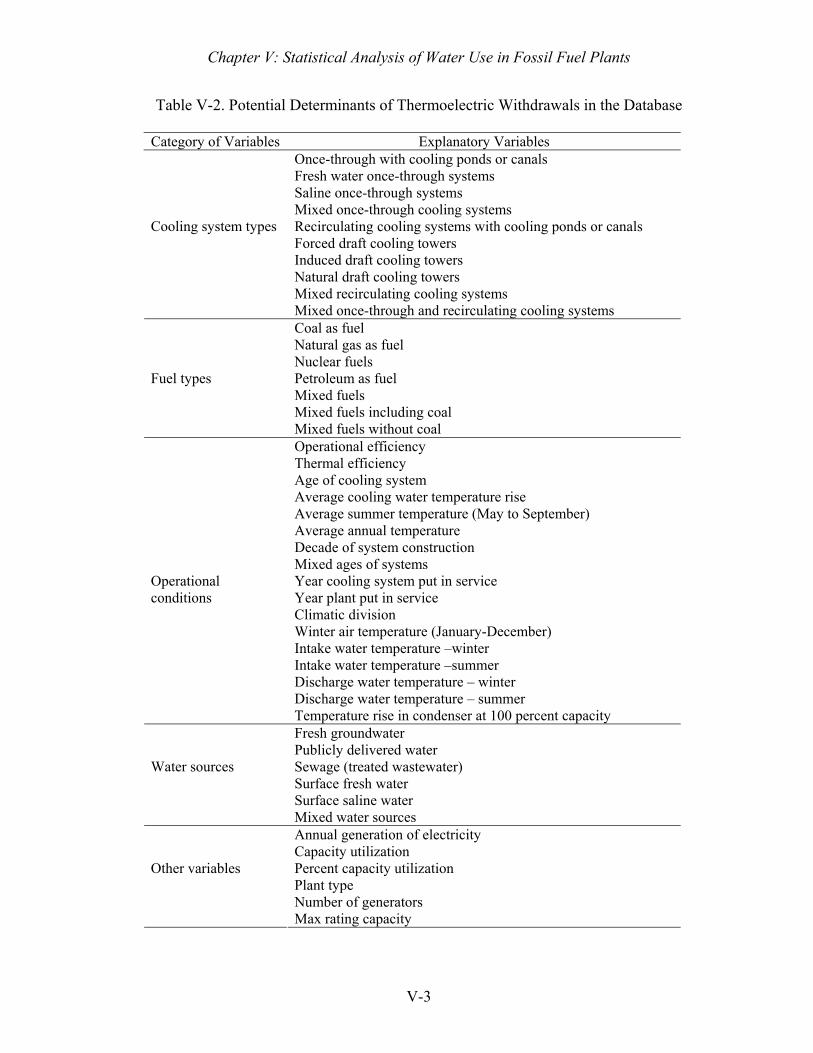
Chapter V: Statistical Analysis of Water Use in Fossil Fuel Plants
V-3
Table V-2. Potential Determinants of Thermoelectric Withdrawals in the Database
Category of Variables Explanatory Variables Once-through with cooling ponds or canals Fresh water once-through systems Saline once-through systems Mixed once-through cooling systems Recirculating cooling systems with cooling ponds or canals Forced draft cooling towers Induced draft cooling towers Natural draft cooling towers Mixed recirculating cooling systems
Cooling system types
Mixed once-through and recirculating cooling systems Coal as fuel Natural gas as fuel Nuclear fuels Petroleum as fuel Mixed fuels Mixed fuels including coal
Fuel types
Mixed fuels without coal Operational efficiency Thermal efficiency Age of cooling system Average cooling water temperature rise Average summer temperature (May to September) Average annual temperature Decade of system construction Mixed ages of systems Year cooling system put in service Year plant put in service Climatic division Winter air temperature (January-December) Intake water temperature –winter Intake water temperature –summer Discharge water temperature – winter Discharge water temperature – summer
Operational conditions
Temperature rise in condenser at 100 percent capacity Fresh groundwater Publicly delivered water Sewage (treated wastewater) Surface fresh water Surface saline water
Water sources
Mixed water sources Annual generation of electricity Capacity utilization Percent capacity utilization Plant type Number of generators
Other variables
Max rating capacity
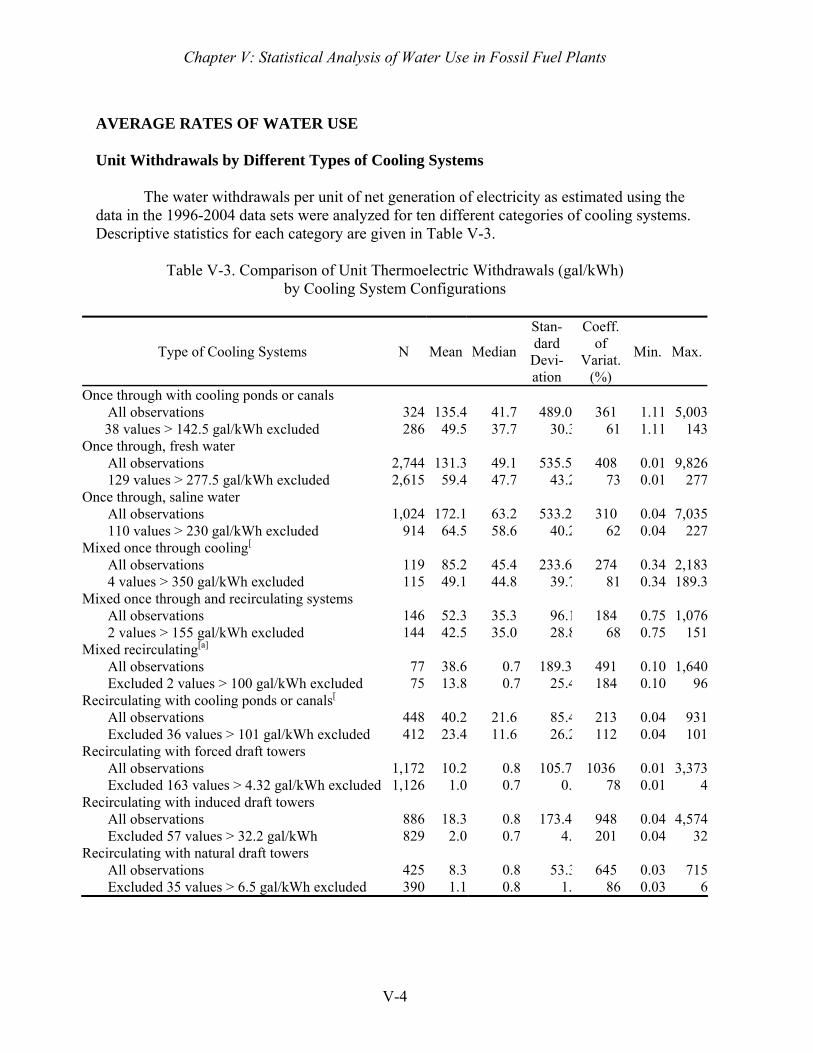
Chapter V: Statistical Analysis of Water Use in Fossil Fuel Plants
V-4
AVERAGE RATES OF WATER USE Unit Withdrawals by Different Types of Cooling Systems
The water withdrawals per unit of net generation of electricity as estimated using the data in the 1996-2004 data sets were analyzed for ten different categories of cooling systems. Descriptive statistics for each category are given in Table V-3.
Table V-3. Comparison of Unit Thermoelectric Withdrawals (gal/kWh) by Cooling System Configurations
Type of Cooling Systems N Mean Median
Stan- dard
Devi- ation
Coeff. of
Variat. (%)
Min. Max.
Once through with cooling ponds or canals All observations 324 135.4 41.7 489.0 361 1.11 5,00338 values > 142.5 gal/kWh excluded 286 49.5 37.7 30.3 61 1.11 143
Once through, fresh water All observations 2,744 131.3 49.1 535.5 408 0.01 9,826129 values > 277.5 gal/kWh excluded 2,615 59.4 47.7 43.2 73 0.01 277
Once through, saline water All observations 1,024 172.1 63.2 533.2 310 0.04 7,035110 values > 230 gal/kWh excluded 914 64.5 58.6 40.2 62 0.04 227
Mixed once through cooling[ All observations 119 85.2 45.4 233.6 274 0.34 2,1834 values > 350 gal/kWh excluded 115 49.1 44.8 39.7 81 0.34 189.3
Mixed once through and recirculating systems All observations 146 52.3 35.3 96.1 184 0.75 1,0762 values > 155 gal/kWh excluded 144 42.5 35.0 28.8 68 0.75 151
Mixed recirculating[a] All observations 77 38.6 0.7 189.3 491 0.10 1,640Excluded 2 values > 100 gal/kWh excluded 75 13.8 0.7 25.4 184 0.10 96
Recirculating with cooling ponds or canals[ All observations 448 40.2 21.6 85.4 213 0.04 931Excluded 36 values > 101 gal/kWh excluded 412 23.4 11.6 26.2 112 0.04 101
Recirculating with forced draft towers All observations 1,172 10.2 0.8 105.7 1036 0.01 3,373Excluded 163 values > 4.32 gal/kWh excluded 1,126 1.0 0.7 0. 78 0.01 4
Recirculating with induced draft towers All observations 886 18.3 0.8 173.4 948 0.04 4,574Excluded 57 values > 32.2 gal/kWh 829 2.0 0.7 4. 201 0.04 32
Recirculating with natural draft towers All observations 425 8.3 0.8 53.3 645 0.03 715Excluded 35 values > 6.5 gal/kWh excluded 390 1.1 0.8 1. 86 0.03 6
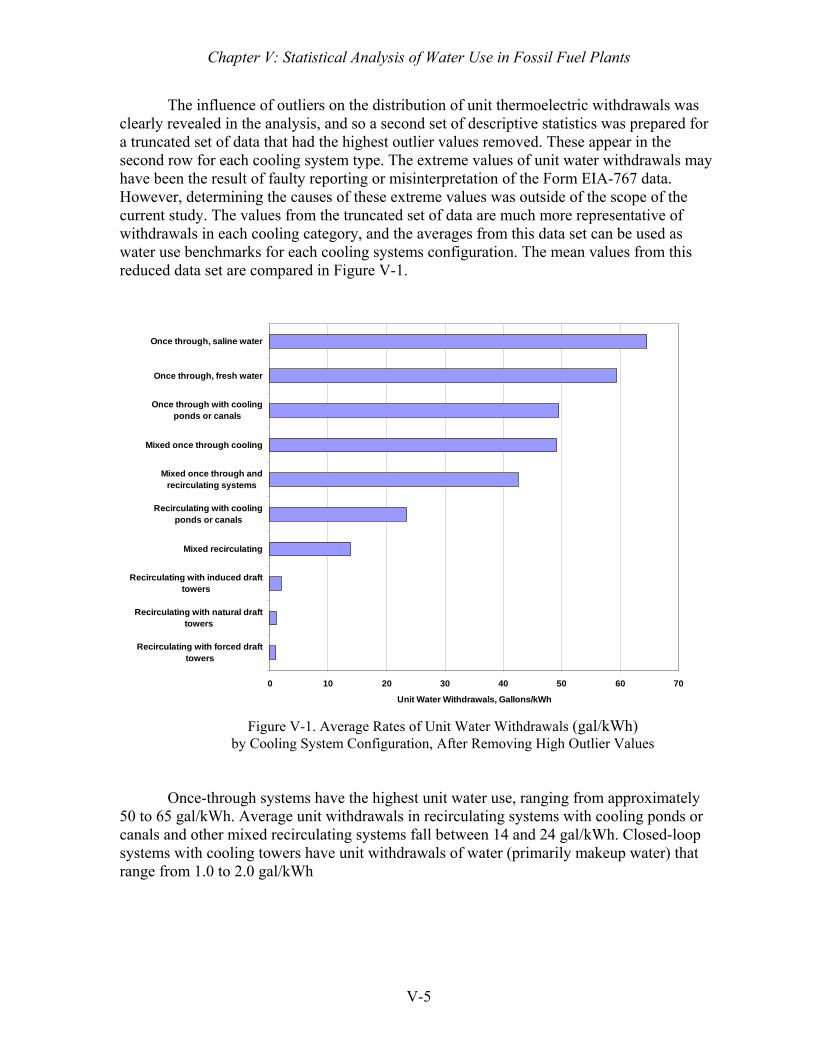
Chapter V: Statistical Analysis of Water Use in Fossil Fuel Plants
V-5
The influence of outliers on the distribution of unit thermoelectric withdrawals was clearly revealed in the analysis, and so a second set of descriptive statistics was prepared for a truncated set of data that had the highest outlier values removed. These appear in the second row for each cooling system type. The extreme values of unit water withdrawals may have been the result of faulty reporting or misinterpretation of the Form EIA-767 data. However, determining the causes of these extreme values was outside of the scope of the current study. The values from the truncated set of data are much more representative of withdrawals in each cooling category, and the averages from this data set can be used as water use benchmarks for each cooling systems configuration. The mean values from this reduced data set are compared in Figure V-1.
0 10 20 30 40 50 60 70
Recirculating with forced drafttowers
Recirculating with natural drafttowers
Recirculating with induced drafttowers
Mixed recirculating
Recirculating with coolingponds or canals
Mixed once through andrecirculating systems
Mixed once through cooling
Once through with coolingponds or canals
Once through, fresh water
Once through, saline water
Unit Water Withdrawals, Gallons/kWh
Figure V-1. Average Rates of Unit Water Withdrawals (gal/kWh) by Cooling System Configuration, After Removing High Outlier Values
Once-through systems have the highest unit water use, ranging from approximately
50 to 65 gal/kWh. Average unit withdrawals in recirculating systems with cooling ponds or canals and other mixed recirculating systems fall between 14 and 24 gal/kWh. Closed-loop systems with cooling towers have unit withdrawals of water (primarily makeup water) that range from 1.0 to 2.0 gal/kWh
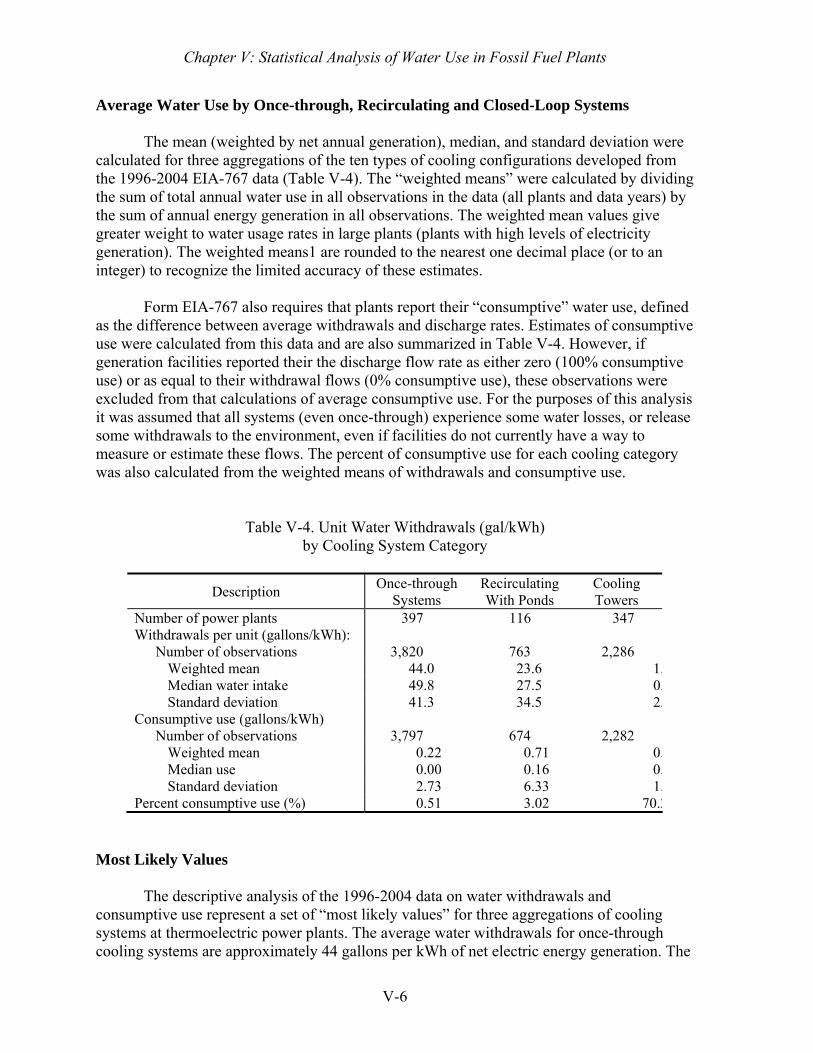
Chapter V: Statistical Analysis of Water Use in Fossil Fuel Plants
V-6
Average Water Use by Once-through, Recirculating and Closed-Loop Systems
The mean (weighted by net annual generation), median, and standard deviation were calculated for three aggregations of the ten types of cooling configurations developed from the 1996-2004 EIA-767 data (Table V-4). The “weighted means” were calculated by dividing the sum of total annual water use in all observations in the data (all plants and data years) by the sum of annual energy generation in all observations. The weighted mean values give greater weight to water usage rates in large plants (plants with high levels of electricity generation). The weighted means1 are rounded to the nearest one decimal place (or to an integer) to recognize the limited accuracy of these estimates.
Form EIA-767 also requires that plants report their “consumptive” water use, defined
as the difference between average withdrawals and discharge rates. Estimates of consumptive use were calculated from this data and are also summarized in Table V-4. However, if generation facilities reported their the discharge flow rate as either zero (100% consumptive use) or as equal to their withdrawal flows (0% consumptive use), these observations were excluded from that calculations of average consumptive use. For the purposes of this analysis it was assumed that all systems (even once-through) experience some water losses, or release some withdrawals to the environment, even if facilities do not currently have a way to measure or estimate these flows. The percent of consumptive use for each cooling category was also calculated from the weighted means of withdrawals and consumptive use.
Table V-4. Unit Water Withdrawals (gal/kWh) by Cooling System Category
Description Once-through Systems
Recirculating With Ponds
Cooling Towers
Number of power plants 397 116 347 Withdrawals per unit (gallons/kWh):
Number of observations 3,820 763 2,286 Weighted mean 44.0 23.6 1.Median water intake 49.8 27.5 0.Standard deviation 41.3 34.5 2.
Consumptive use (gallons/kWh) Number of observations 3,797 674 2,282
Weighted mean 0.22 0.71 0.Median use 0.00 0.16 0.Standard deviation 2.73 6.33 1.
Percent consumptive use (%) 0.51 3.02 70.2 Most Likely Values
The descriptive analysis of the 1996-2004 data on water withdrawals and consumptive use represent a set of “most likely values” for three aggregations of cooling systems at thermoelectric power plants. The average water withdrawals for once-through cooling systems are approximately 44 gallons per kWh of net electric energy generation. The
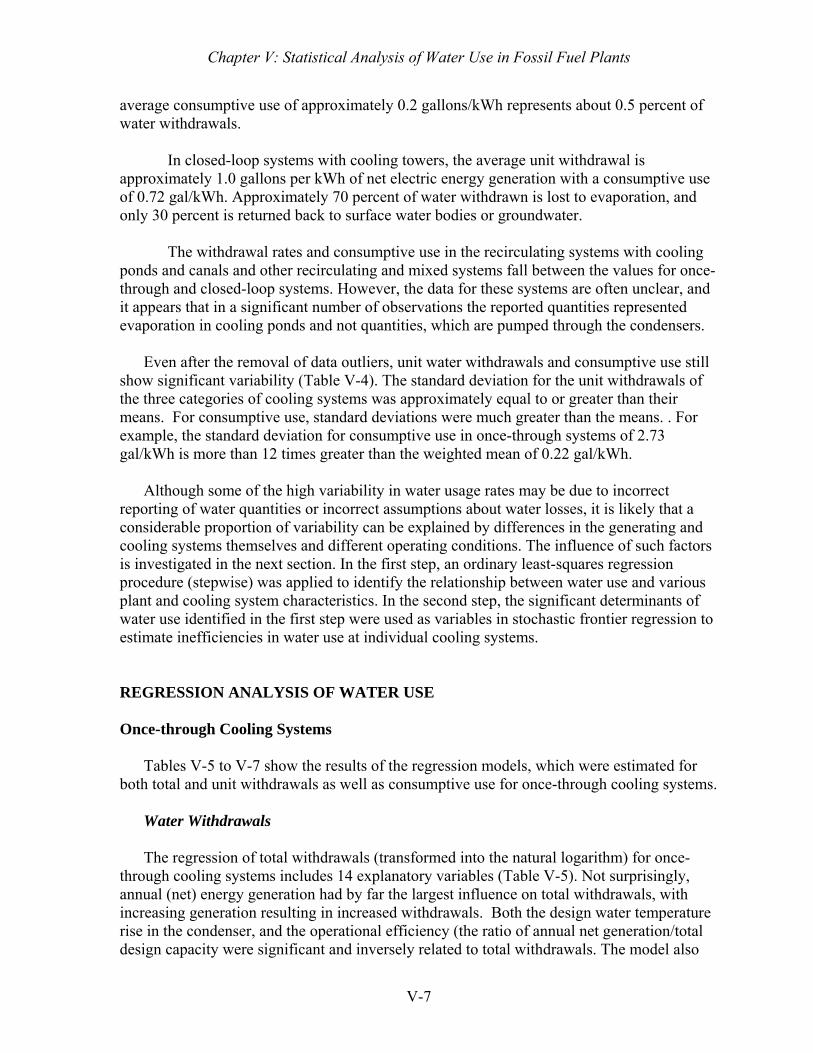
Chapter V: Statistical Analysis of Water Use in Fossil Fuel Plants
V-7
average consumptive use of approximately 0.2 gallons/kWh represents about 0.5 percent of water withdrawals.
In closed-loop systems with cooling towers, the average unit withdrawal is
approximately 1.0 gallons per kWh of net electric energy generation with a consumptive use of 0.72 gal/kWh. Approximately 70 percent of water withdrawn is lost to evaporation, and only 30 percent is returned back to surface water bodies or groundwater.
The withdrawal rates and consumptive use in the recirculating systems with cooling
ponds and canals and other recirculating and mixed systems fall between the values for once-through and closed-loop systems. However, the data for these systems are often unclear, and it appears that in a significant number of observations the reported quantities represented evaporation in cooling ponds and not quantities, which are pumped through the condensers.
Even after the removal of data outliers, unit water withdrawals and consumptive use still
show significant variability (Table V-4). The standard deviation for the unit withdrawals of the three categories of cooling systems was approximately equal to or greater than their means. For consumptive use, standard deviations were much greater than the means. . For example, the standard deviation for consumptive use in once-through systems of 2.73 gal/kWh is more than 12 times greater than the weighted mean of 0.22 gal/kWh.
Although some of the high variability in water usage rates may be due to incorrect
reporting of water quantities or incorrect assumptions about water losses, it is likely that a considerable proportion of variability can be explained by differences in the generating and cooling systems themselves and different operating conditions. The influence of such factors is investigated in the next section. In the first step, an ordinary least-squares regression procedure (stepwise) was applied to identify the relationship between water use and various plant and cooling system characteristics. In the second step, the significant determinants of water use identified in the first step were used as variables in stochastic frontier regression to estimate inefficiencies in water use at individual cooling systems. REGRESSION ANALYSIS OF WATER USE Once-through Cooling Systems
Tables V-5 to V-7 show the results of the regression models, which were estimated for both total and unit withdrawals as well as consumptive use for once-through cooling systems.
Water Withdrawals
The regression of total withdrawals (transformed into the natural logarithm) for once-through cooling systems includes 14 explanatory variables (Table V-5). Not surprisingly, annual (net) energy generation had by far the largest influence on total withdrawals, with increasing generation resulting in increased withdrawals. Both the design water temperature rise in the condenser, and the operational efficiency (the ratio of annual net generation/total design capacity were significant and inversely related to total withdrawals. The model also
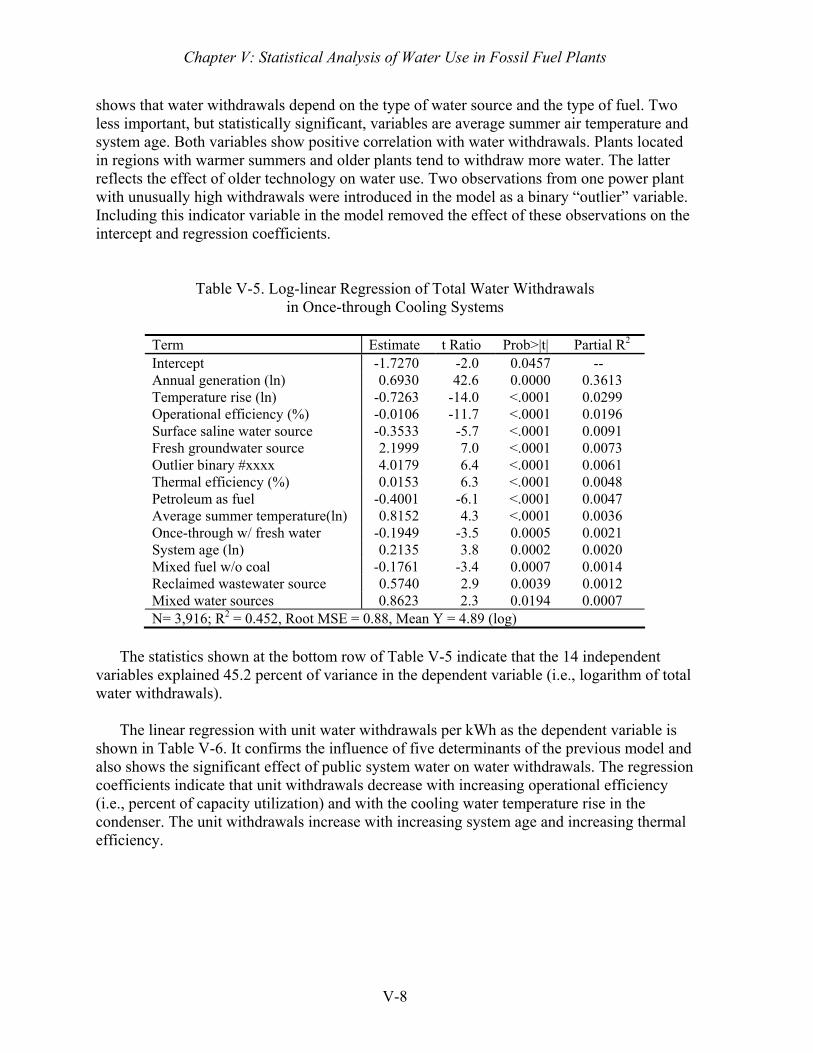
Chapter V: Statistical Analysis of Water Use in Fossil Fuel Plants
V-8
shows that water withdrawals depend on the type of water source and the type of fuel. Two less important, but statistically significant, variables are average summer air temperature and system age. Both variables show positive correlation with water withdrawals. Plants located in regions with warmer summers and older plants tend to withdraw more water. The latter reflects the effect of older technology on water use. Two observations from one power plant with unusually high withdrawals were introduced in the model as a binary “outlier” variable. Including this indicator variable in the model removed the effect of these observations on the intercept and regression coefficients.
Table V-5. Log-linear Regression of Total Water Withdrawals in Once-through Cooling Systems
Term Estimate t Ratio Prob>|t| Partial R2 Intercept -1.7270 -2.0 0.0457 -- Annual generation (ln) 0.6930 42.6 0.0000 0.3613 Temperature rise (ln) -0.7263 -14.0 <.0001 0.0299 Operational efficiency (%) -0.0106 -11.7 <.0001 0.0196 Surface saline water source -0.3533 -5.7 <.0001 0.0091 Fresh groundwater source 2.1999 7.0 <.0001 0.0073 Outlier binary #xxxx 4.0179 6.4 <.0001 0.0061 Thermal efficiency (%) 0.0153 6.3 <.0001 0.0048 Petroleum as fuel -0.4001 -6.1 <.0001 0.0047 Average summer temperature(ln) 0.8152 4.3 <.0001 0.0036 Once-through w/ fresh water -0.1949 -3.5 0.0005 0.0021 System age (ln) 0.2135 3.8 0.0002 0.0020 Mixed fuel w/o coal -0.1761 -3.4 0.0007 0.0014 Reclaimed wastewater source 0.5740 2.9 0.0039 0.0012 Mixed water sources 0.8623 2.3 0.0194 0.0007 N= 3,916; R2 = 0.452, Root MSE = 0.88, Mean Y = 4.89 (log)
The statistics shown at the bottom row of Table V-5 indicate that the 14 independent
variables explained 45.2 percent of variance in the dependent variable (i.e., logarithm of total water withdrawals).
The linear regression with unit water withdrawals per kWh as the dependent variable is
shown in Table V-6. It confirms the influence of five determinants of the previous model and also shows the significant effect of public system water on water withdrawals. The regression coefficients indicate that unit withdrawals decrease with increasing operational efficiency (i.e., percent of capacity utilization) and with the cooling water temperature rise in the condenser. The unit withdrawals increase with increasing system age and increasing thermal efficiency.
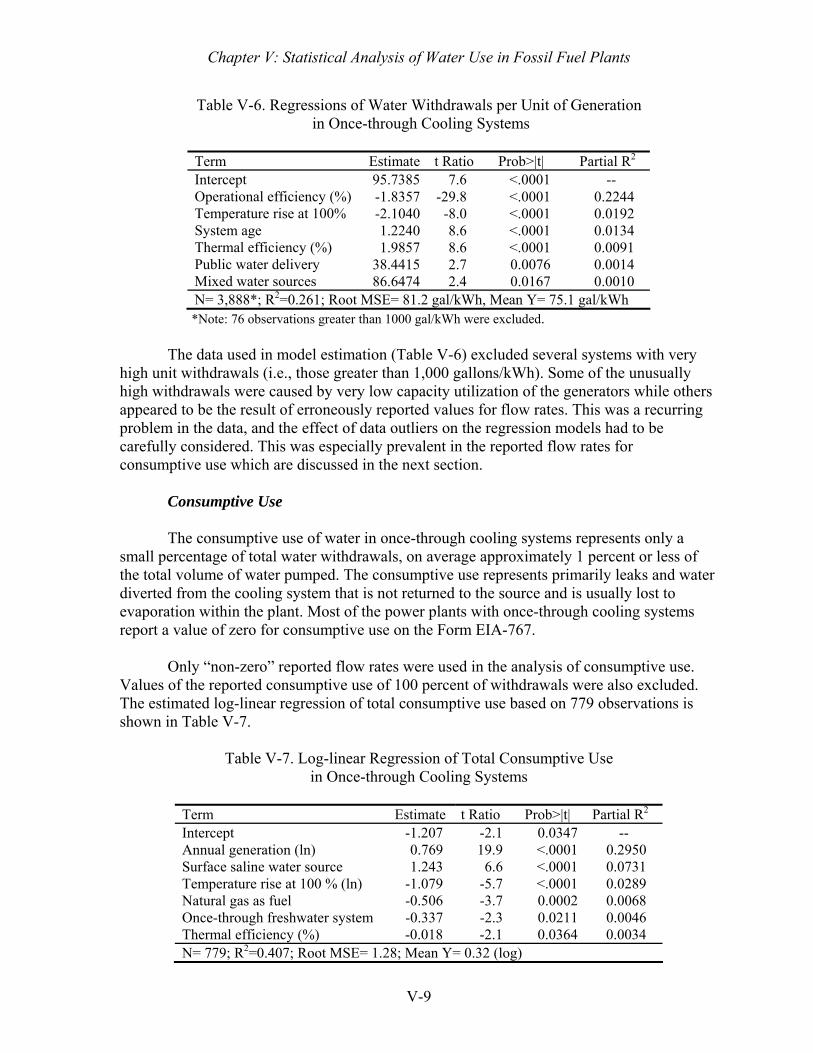
Chapter V: Statistical Analysis of Water Use in Fossil Fuel Plants
V-9
Table V-6. Regressions of Water Withdrawals per Unit of Generation in Once-through Cooling Systems
Term Estimate t Ratio Prob>|t| Partial R2 Intercept 95.7385 7.6 <.0001 -- Operational efficiency (%) -1.8357 -29.8 <.0001 0.2244 Temperature rise at 100% -2.1040 -8.0 <.0001 0.0192 System age 1.2240 8.6 <.0001 0.0134 Thermal efficiency (%) 1.9857 8.6 <.0001 0.0091 Public water delivery 38.4415 2.7 0.0076 0.0014 Mixed water sources 86.6474 2.4 0.0167 0.0010 N= 3,888*; R2=0.261; Root MSE= 81.2 gal/kWh, Mean Y= 75.1 gal/kWh *Note: 76 observations greater than 1000 gal/kWh were excluded.
The data used in model estimation (Table V-6) excluded several systems with very
high unit withdrawals (i.e., those greater than 1,000 gallons/kWh). Some of the unusually high withdrawals were caused by very low capacity utilization of the generators while others appeared to be the result of erroneously reported values for flow rates. This was a recurring problem in the data, and the effect of data outliers on the regression models had to be carefully considered. This was especially prevalent in the reported flow rates for consumptive use which are discussed in the next section.
Consumptive Use
The consumptive use of water in once-through cooling systems represents only a small percentage of total water withdrawals, on average approximately 1 percent or less of the total volume of water pumped. The consumptive use represents primarily leaks and water diverted from the cooling system that is not returned to the source and is usually lost to evaporation within the plant. Most of the power plants with once-through cooling systems report a value of zero for consumptive use on the Form EIA-767.
Only “non-zero” reported flow rates were used in the analysis of consumptive use. Values of the reported consumptive use of 100 percent of withdrawals were also excluded. The estimated log-linear regression of total consumptive use based on 779 observations is shown in Table V-7.
Table V-7. Log-linear Regression of Total Consumptive Use in Once-through Cooling Systems
Term Estimate t Ratio Prob>|t| Partial R2 Intercept -1.207 -2.1 0.0347 -- Annual generation (ln) 0.769 19.9 <.0001 0.2950 Surface saline water source 1.243 6.6 <.0001 0.0731 Temperature rise at 100 % (ln) -1.079 -5.7 <.0001 0.0289 Natural gas as fuel -0.506 -3.7 0.0002 0.0068 Once-through freshwater system -0.337 -2.3 0.0211 0.0046 Thermal efficiency (%) -0.018 -2.1 0.0364 0.0034 N= 779; R2=0.407; Root MSE= 1.28; Mean Y= 0.32 (log)
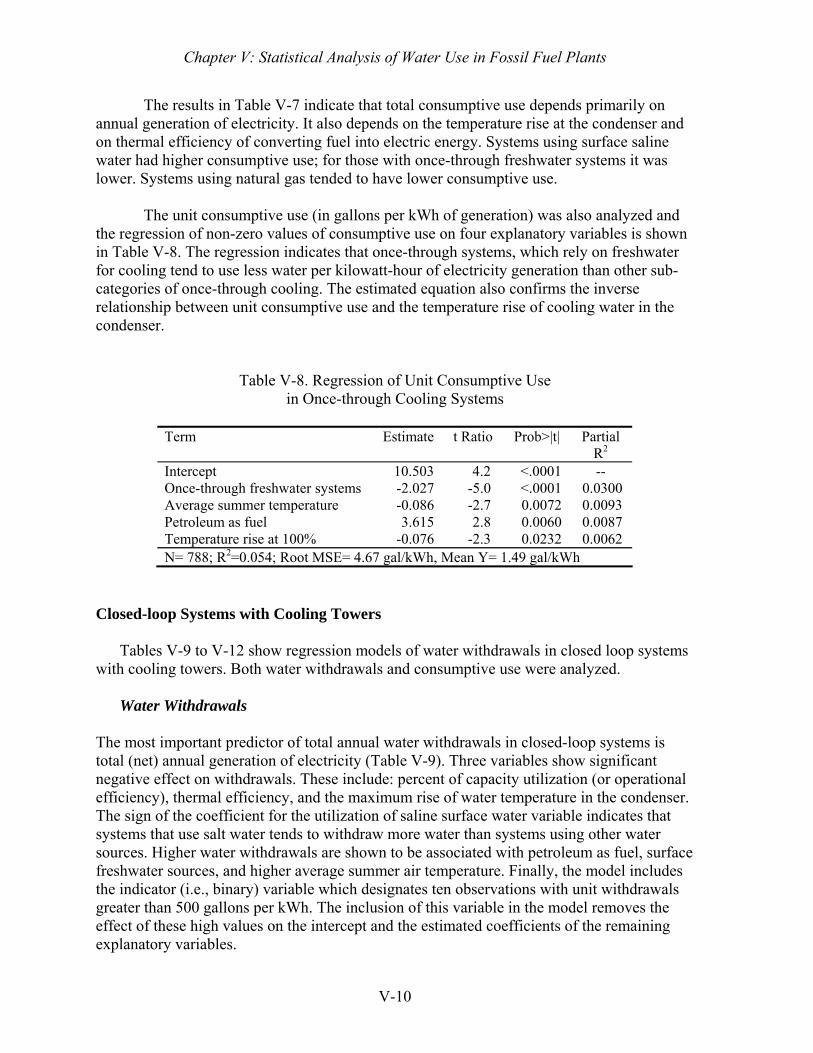
Chapter V: Statistical Analysis of Water Use in Fossil Fuel Plants
V-10
The results in Table V-7 indicate that total consumptive use depends primarily on annual generation of electricity. It also depends on the temperature rise at the condenser and on thermal efficiency of converting fuel into electric energy. Systems using surface saline water had higher consumptive use; for those with once-through freshwater systems it was lower. Systems using natural gas tended to have lower consumptive use.
The unit consumptive use (in gallons per kWh of generation) was also analyzed and the regression of non-zero values of consumptive use on four explanatory variables is shown in Table V-8. The regression indicates that once-through systems, which rely on freshwater for cooling tend to use less water per kilowatt-hour of electricity generation than other sub-categories of once-through cooling. The estimated equation also confirms the inverse relationship between unit consumptive use and the temperature rise of cooling water in the condenser.
Table V-8. Regression of Unit Consumptive Use in Once-through Cooling Systems
Term Estimate t Ratio Prob>|t| Partial
R2 Intercept 10.503 4.2 <.0001 -- Once-through freshwater systems -2.027 -5.0 <.0001 0.0300 Average summer temperature -0.086 -2.7 0.0072 0.0093 Petroleum as fuel 3.615 2.8 0.0060 0.0087 Temperature rise at 100% -0.076 -2.3 0.0232 0.0062 N= 788; R2=0.054; Root MSE= 4.67 gal/kWh, Mean Y= 1.49 gal/kWh
Closed-loop Systems with Cooling Towers
Tables V-9 to V-12 show regression models of water withdrawals in closed loop systems with cooling towers. Both water withdrawals and consumptive use were analyzed.
Water Withdrawals
The most important predictor of total annual water withdrawals in closed-loop systems is total (net) annual generation of electricity (Table V-9). Three variables show significant negative effect on withdrawals. These include: percent of capacity utilization (or operational efficiency), thermal efficiency, and the maximum rise of water temperature in the condenser. The sign of the coefficient for the utilization of saline surface water variable indicates that systems that use salt water tends to withdraw more water than systems using other water sources. Higher water withdrawals are shown to be associated with petroleum as fuel, surface freshwater sources, and higher average summer air temperature. Finally, the model includes the indicator (i.e., binary) variable which designates ten observations with unit withdrawals greater than 500 gallons per kWh. The inclusion of this variable in the model removes the effect of these high values on the intercept and the estimated coefficients of the remaining explanatory variables.
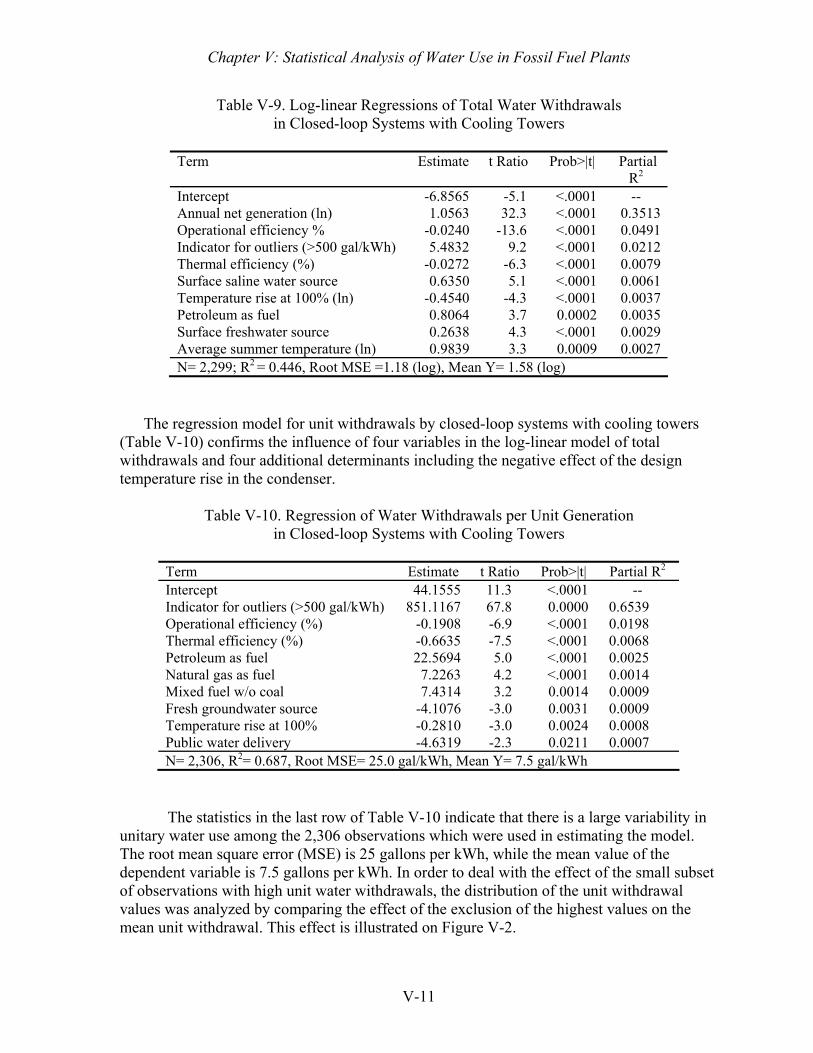
Chapter V: Statistical Analysis of Water Use in Fossil Fuel Plants
V-11
Table V-9. Log-linear Regressions of Total Water Withdrawals in Closed-loop Systems with Cooling Towers
Term Estimate t Ratio Prob>|t| Partial
R2 Intercept -6.8565 -5.1 <.0001 -- Annual net generation (ln) 1.0563 32.3 <.0001 0.3513Operational efficiency % -0.0240 -13.6 <.0001 0.0491Indicator for outliers (>500 gal/kWh) 5.4832 9.2 <.0001 0.0212Thermal efficiency (%) -0.0272 -6.3 <.0001 0.0079Surface saline water source 0.6350 5.1 <.0001 0.0061Temperature rise at 100% (ln) -0.4540 -4.3 <.0001 0.0037Petroleum as fuel 0.8064 3.7 0.0002 0.0035Surface freshwater source 0.2638 4.3 <.0001 0.0029Average summer temperature (ln) 0.9839 3.3 0.0009 0.0027N= 2,299; R2 = 0.446, Root MSE =1.18 (log), Mean Y= 1.58 (log)
The regression model for unit withdrawals by closed-loop systems with cooling towers
(Table V-10) confirms the influence of four variables in the log-linear model of total withdrawals and four additional determinants including the negative effect of the design temperature rise in the condenser.
Table V-10. Regression of Water Withdrawals per Unit Generation
in Closed-loop Systems with Cooling Towers
Term Estimate t Ratio Prob>|t| Partial R2 Intercept 44.1555 11.3 <.0001 -- Indicator for outliers (>500 gal/kWh) 851.1167 67.8 0.0000 0.6539 Operational efficiency (%) -0.1908 -6.9 <.0001 0.0198 Thermal efficiency (%) -0.6635 -7.5 <.0001 0.0068 Petroleum as fuel 22.5694 5.0 <.0001 0.0025 Natural gas as fuel 7.2263 4.2 <.0001 0.0014 Mixed fuel w/o coal 7.4314 3.2 0.0014 0.0009 Fresh groundwater source -4.1076 -3.0 0.0031 0.0009 Temperature rise at 100% -0.2810 -3.0 0.0024 0.0008 Public water delivery -4.6319 -2.3 0.0211 0.0007 N= 2,306, R2= 0.687, Root MSE= 25.0 gal/kWh, Mean Y= 7.5 gal/kWh
The statistics in the last row of Table V-10 indicate that there is a large variability in unitary water use among the 2,306 observations which were used in estimating the model. The root mean square error (MSE) is 25 gallons per kWh, while the mean value of the dependent variable is 7.5 gallons per kWh. In order to deal with the effect of the small subset of observations with high unit water withdrawals, the distribution of the unit withdrawal values was analyzed by comparing the effect of the exclusion of the highest values on the mean unit withdrawal. This effect is illustrated on Figure V-2.
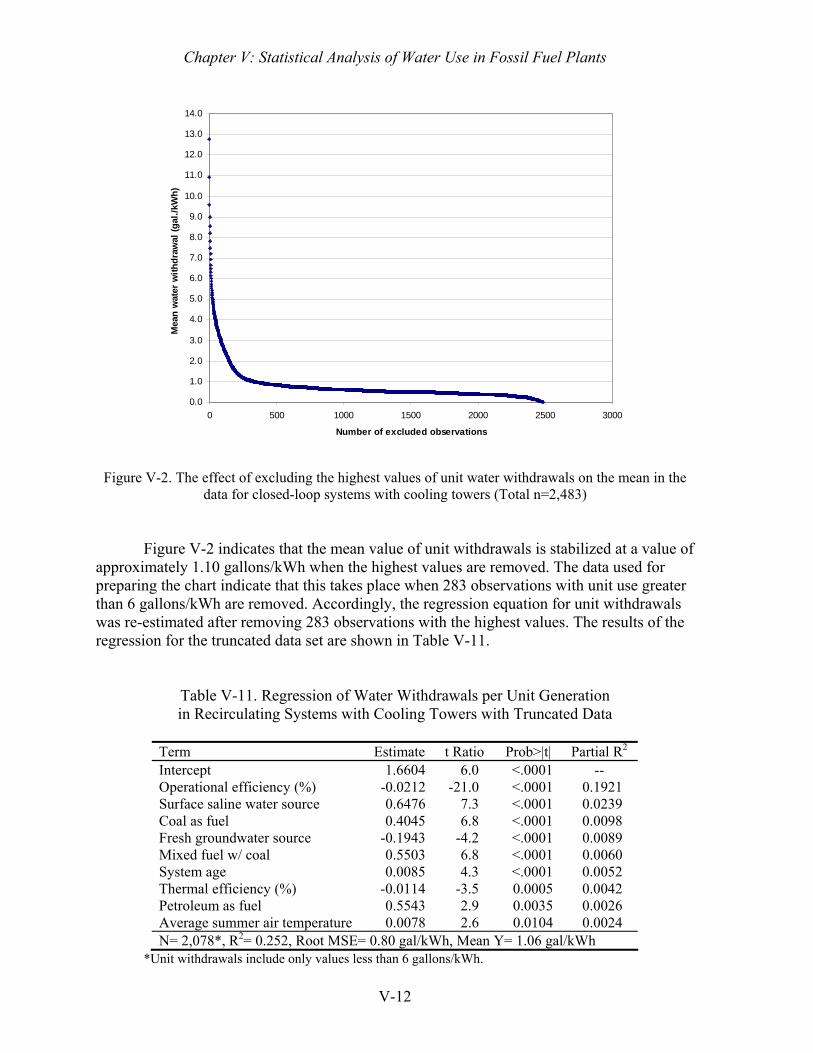
Chapter V: Statistical Analysis of Water Use in Fossil Fuel Plants
V-12
0.0
1.0
2.0
3.0
4.0
5.0
6.0
7.0
8.0
9.0
10.0
11.0
12.0
13.0
14.0
0 500 1000 1500 2000 2500 3000
Number of excluded observations
Mea
n w
ater
with
draw
al (g
al./k
Wh)
Figure V-2. The effect of excluding the highest values of unit water withdrawals on the mean in the data for closed-loop systems with cooling towers (Total n=2,483)
Figure V-2 indicates that the mean value of unit withdrawals is stabilized at a value of approximately 1.10 gallons/kWh when the highest values are removed. The data used for preparing the chart indicate that this takes place when 283 observations with unit use greater than 6 gallons/kWh are removed. Accordingly, the regression equation for unit withdrawals was re-estimated after removing 283 observations with the highest values. The results of the regression for the truncated data set are shown in Table V-11.
Table V-11. Regression of Water Withdrawals per Unit Generation in Recirculating Systems with Cooling Towers with Truncated Data
Term Estimate t Ratio Prob>|t| Partial R2 Intercept 1.6604 6.0 <.0001 -- Operational efficiency (%) -0.0212 -21.0 <.0001 0.1921 Surface saline water source 0.6476 7.3 <.0001 0.0239 Coal as fuel 0.4045 6.8 <.0001 0.0098 Fresh groundwater source -0.1943 -4.2 <.0001 0.0089 Mixed fuel w/ coal 0.5503 6.8 <.0001 0.0060 System age 0.0085 4.3 <.0001 0.0052 Thermal efficiency (%) -0.0114 -3.5 0.0005 0.0042 Petroleum as fuel 0.5543 2.9 0.0035 0.0026 Average summer air temperature 0.0078 2.6 0.0104 0.0024 N= 2,078*, R2= 0.252, Root MSE= 0.80 gal/kWh, Mean Y= 1.06 gal/kWh
*Unit withdrawals include only values less than 6 gallons/kWh.
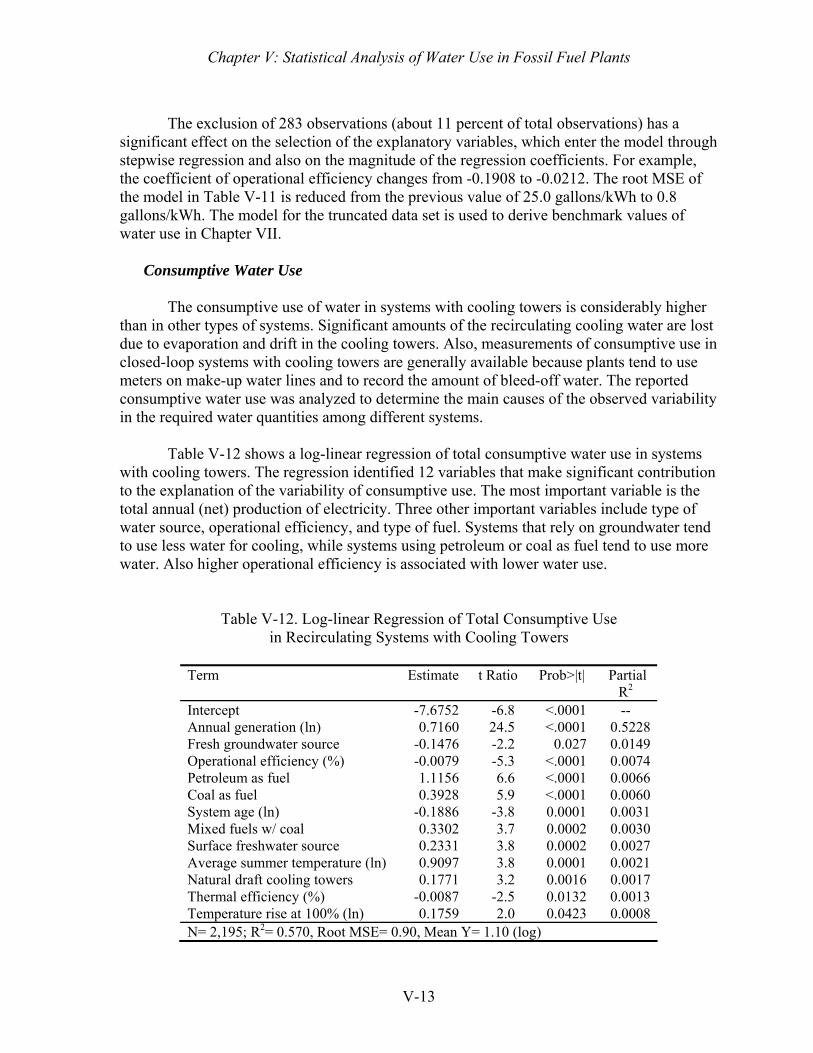
Chapter V: Statistical Analysis of Water Use in Fossil Fuel Plants
V-13
The exclusion of 283 observations (about 11 percent of total observations) has a
significant effect on the selection of the explanatory variables, which enter the model through stepwise regression and also on the magnitude of the regression coefficients. For example, the coefficient of operational efficiency changes from -0.1908 to -0.0212. The root MSE of the model in Table V-11 is reduced from the previous value of 25.0 gallons/kWh to 0.8 gallons/kWh. The model for the truncated data set is used to derive benchmark values of water use in Chapter VII.
Consumptive Water Use
The consumptive use of water in systems with cooling towers is considerably higher than in other types of systems. Significant amounts of the recirculating cooling water are lost due to evaporation and drift in the cooling towers. Also, measurements of consumptive use in closed-loop systems with cooling towers are generally available because plants tend to use meters on make-up water lines and to record the amount of bleed-off water. The reported consumptive water use was analyzed to determine the main causes of the observed variability in the required water quantities among different systems.
Table V-12 shows a log-linear regression of total consumptive water use in systems with cooling towers. The regression identified 12 variables that make significant contribution to the explanation of the variability of consumptive use. The most important variable is the total annual (net) production of electricity. Three other important variables include type of water source, operational efficiency, and type of fuel. Systems that rely on groundwater tend to use less water for cooling, while systems using petroleum or coal as fuel tend to use more water. Also higher operational efficiency is associated with lower water use.
Table V-12. Log-linear Regression of Total Consumptive Use in Recirculating Systems with Cooling Towers
Term Estimate t Ratio Prob>|t| Partial
R2 Intercept -7.6752 -6.8 <.0001 -- Annual generation (ln) 0.7160 24.5 <.0001 0.5228 Fresh groundwater source -0.1476 -2.2 0.027 0.0149 Operational efficiency (%) -0.0079 -5.3 <.0001 0.0074 Petroleum as fuel 1.1156 6.6 <.0001 0.0066 Coal as fuel 0.3928 5.9 <.0001 0.0060 System age (ln) -0.1886 -3.8 0.0001 0.0031 Mixed fuels w/ coal 0.3302 3.7 0.0002 0.0030 Surface freshwater source 0.2331 3.8 0.0002 0.0027 Average summer temperature (ln) 0.9097 3.8 0.0001 0.0021 Natural draft cooling towers 0.1771 3.2 0.0016 0.0017 Thermal efficiency (%) -0.0087 -2.5 0.0132 0.0013 Temperature rise at 100% (ln) 0.1759 2.0 0.0423 0.0008 N= 2,195; R2= 0.570, Root MSE= 0.90, Mean Y= 1.10 (log)
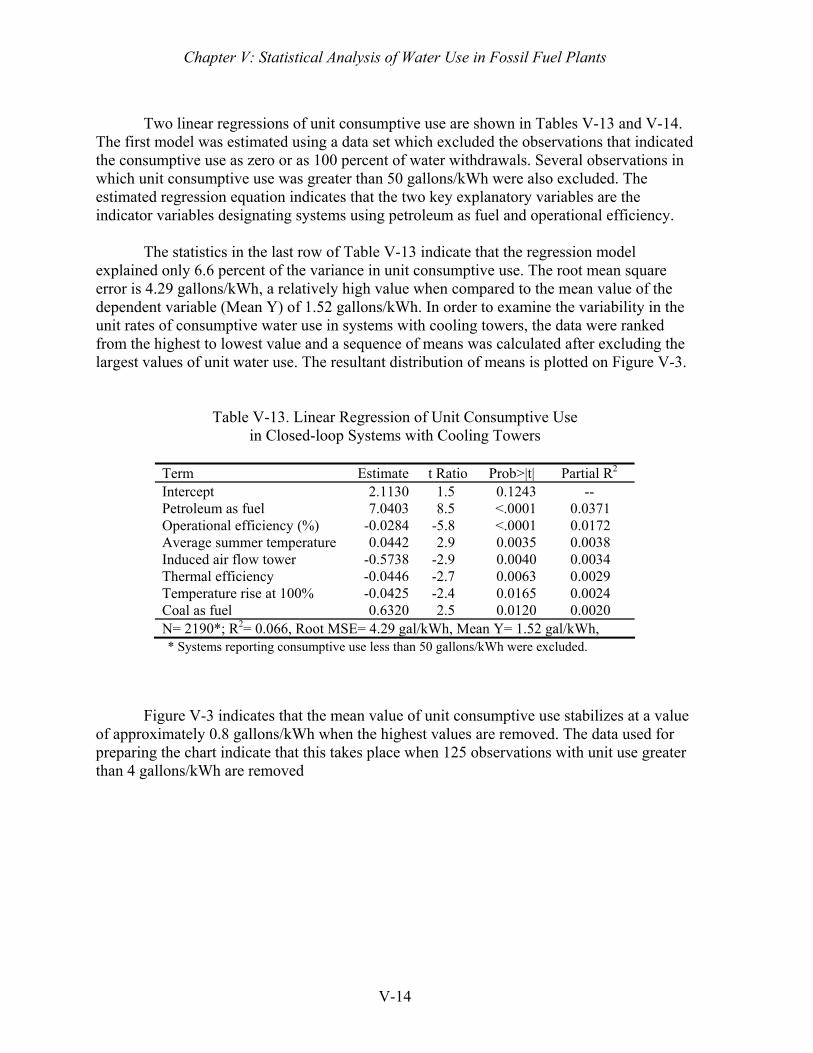
Chapter V: Statistical Analysis of Water Use in Fossil Fuel Plants
V-14
Two linear regressions of unit consumptive use are shown in Tables V-13 and V-14.
The first model was estimated using a data set which excluded the observations that indicated the consumptive use as zero or as 100 percent of water withdrawals. Several observations in which unit consumptive use was greater than 50 gallons/kWh were also excluded. The estimated regression equation indicates that the two key explanatory variables are the indicator variables designating systems using petroleum as fuel and operational efficiency.
The statistics in the last row of Table V-13 indicate that the regression model explained only 6.6 percent of the variance in unit consumptive use. The root mean square error is 4.29 gallons/kWh, a relatively high value when compared to the mean value of the dependent variable (Mean Y) of 1.52 gallons/kWh. In order to examine the variability in the unit rates of consumptive water use in systems with cooling towers, the data were ranked from the highest to lowest value and a sequence of means was calculated after excluding the largest values of unit water use. The resultant distribution of means is plotted on Figure V-3.
Table V-13. Linear Regression of Unit Consumptive Use in Closed-loop Systems with Cooling Towers
Term Estimate t Ratio Prob>|t| Partial R2 Intercept 2.1130 1.5 0.1243 -- Petroleum as fuel 7.0403 8.5 <.0001 0.0371 Operational efficiency (%) -0.0284 -5.8 <.0001 0.0172 Average summer temperature 0.0442 2.9 0.0035 0.0038 Induced air flow tower -0.5738 -2.9 0.0040 0.0034 Thermal efficiency -0.0446 -2.7 0.0063 0.0029 Temperature rise at 100% -0.0425 -2.4 0.0165 0.0024 Coal as fuel 0.6320 2.5 0.0120 0.0020 N= 2190*; R2= 0.066, Root MSE= 4.29 gal/kWh, Mean Y= 1.52 gal/kWh, * Systems reporting consumptive use less than 50 gallons/kWh were excluded.
Figure V-3 indicates that the mean value of unit consumptive use stabilizes at a value
of approximately 0.8 gallons/kWh when the highest values are removed. The data used for preparing the chart indicate that this takes place when 125 observations with unit use greater than 4 gallons/kWh are removed
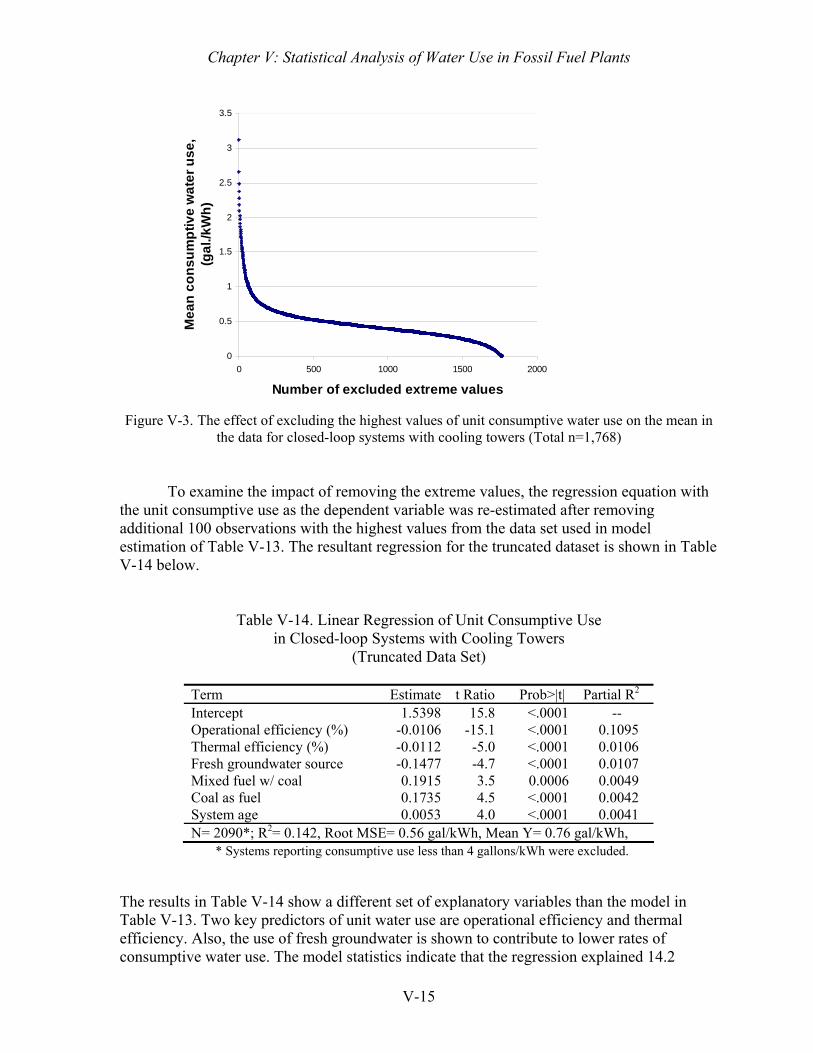
Chapter V: Statistical Analysis of Water Use in Fossil Fuel Plants
V-15
0
0.5
1
1.5
2
2.5
3
3.5
0 500 1000 1500 2000
Number of excluded extreme values
Mea
n co
nsum
ptiv
e w
ater
use
, (g
al./k
Wh)
Figure V-3. The effect of excluding the highest values of unit consumptive water use on the mean in
the data for closed-loop systems with cooling towers (Total n=1,768)
To examine the impact of removing the extreme values, the regression equation with
the unit consumptive use as the dependent variable was re-estimated after removing additional 100 observations with the highest values from the data set used in model estimation of Table V-13. The resultant regression for the truncated dataset is shown in Table V-14 below.
Table V-14. Linear Regression of Unit Consumptive Use
in Closed-loop Systems with Cooling Towers (Truncated Data Set)
Term Estimate t Ratio Prob>|t| Partial R2 Intercept 1.5398 15.8 <.0001 -- Operational efficiency (%) -0.0106 -15.1 <.0001 0.1095 Thermal efficiency (%) -0.0112 -5.0 <.0001 0.0106 Fresh groundwater source -0.1477 -4.7 <.0001 0.0107 Mixed fuel w/ coal 0.1915 3.5 0.0006 0.0049 Coal as fuel 0.1735 4.5 <.0001 0.0042 System age 0.0053 4.0 <.0001 0.0041 N= 2090*; R2= 0.142, Root MSE= 0.56 gal/kWh, Mean Y= 0.76 gal/kWh,
* Systems reporting consumptive use less than 4 gallons/kWh were excluded.
The results in Table V-14 show a different set of explanatory variables than the model in Table V-13. Two key predictors of unit water use are operational efficiency and thermal efficiency. Also, the use of fresh groundwater is shown to contribute to lower rates of consumptive water use. The model statistics indicate that the regression explained 14.2
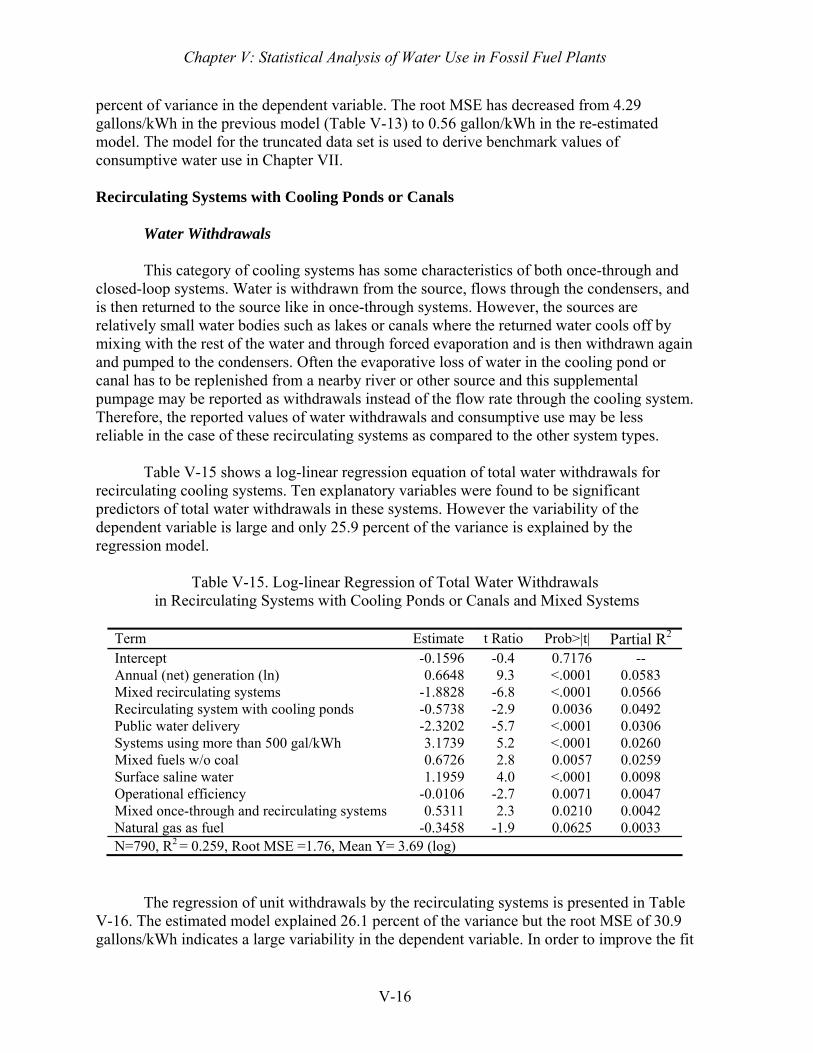
Chapter V: Statistical Analysis of Water Use in Fossil Fuel Plants
V-16
percent of variance in the dependent variable. The root MSE has decreased from 4.29 gallons/kWh in the previous model (Table V-13) to 0.56 gallon/kWh in the re-estimated model. The model for the truncated data set is used to derive benchmark values of consumptive water use in Chapter VII.
Recirculating Systems with Cooling Ponds or Canals
Water Withdrawals
This category of cooling systems has some characteristics of both once-through and closed-loop systems. Water is withdrawn from the source, flows through the condensers, and is then returned to the source like in once-through systems. However, the sources are relatively small water bodies such as lakes or canals where the returned water cools off by mixing with the rest of the water and through forced evaporation and is then withdrawn again and pumped to the condensers. Often the evaporative loss of water in the cooling pond or canal has to be replenished from a nearby river or other source and this supplemental pumpage may be reported as withdrawals instead of the flow rate through the cooling system. Therefore, the reported values of water withdrawals and consumptive use may be less reliable in the case of these recirculating systems as compared to the other system types.
Table V-15 shows a log-linear regression equation of total water withdrawals for
recirculating cooling systems. Ten explanatory variables were found to be significant predictors of total water withdrawals in these systems. However the variability of the dependent variable is large and only 25.9 percent of the variance is explained by the regression model.
Table V-15. Log-linear Regression of Total Water Withdrawals
in Recirculating Systems with Cooling Ponds or Canals and Mixed Systems
Term Estimate t Ratio Prob>|t| Partial R2 Intercept -0.1596 -0.4 0.7176 -- Annual (net) generation (ln) 0.6648 9.3 <.0001 0.0583 Mixed recirculating systems -1.8828 -6.8 <.0001 0.0566 Recirculating system with cooling ponds -0.5738 -2.9 0.0036 0.0492 Public water delivery -2.3202 -5.7 <.0001 0.0306 Systems using more than 500 gal/kWh 3.1739 5.2 <.0001 0.0260 Mixed fuels w/o coal 0.6726 2.8 0.0057 0.0259 Surface saline water 1.1959 4.0 <.0001 0.0098 Operational efficiency -0.0106 -2.7 0.0071 0.0047 Mixed once-through and recirculating systems 0.5311 2.3 0.0210 0.0042 Natural gas as fuel -0.3458 -1.9 0.0625 0.0033 N=790, R2 = 0.259, Root MSE =1.76, Mean Y= 3.69 (log)
The regression of unit withdrawals by the recirculating systems is presented in Table V-16. The estimated model explained 26.1 percent of the variance but the root MSE of 30.9 gallons/kWh indicates a large variability in the dependent variable. In order to improve the fit
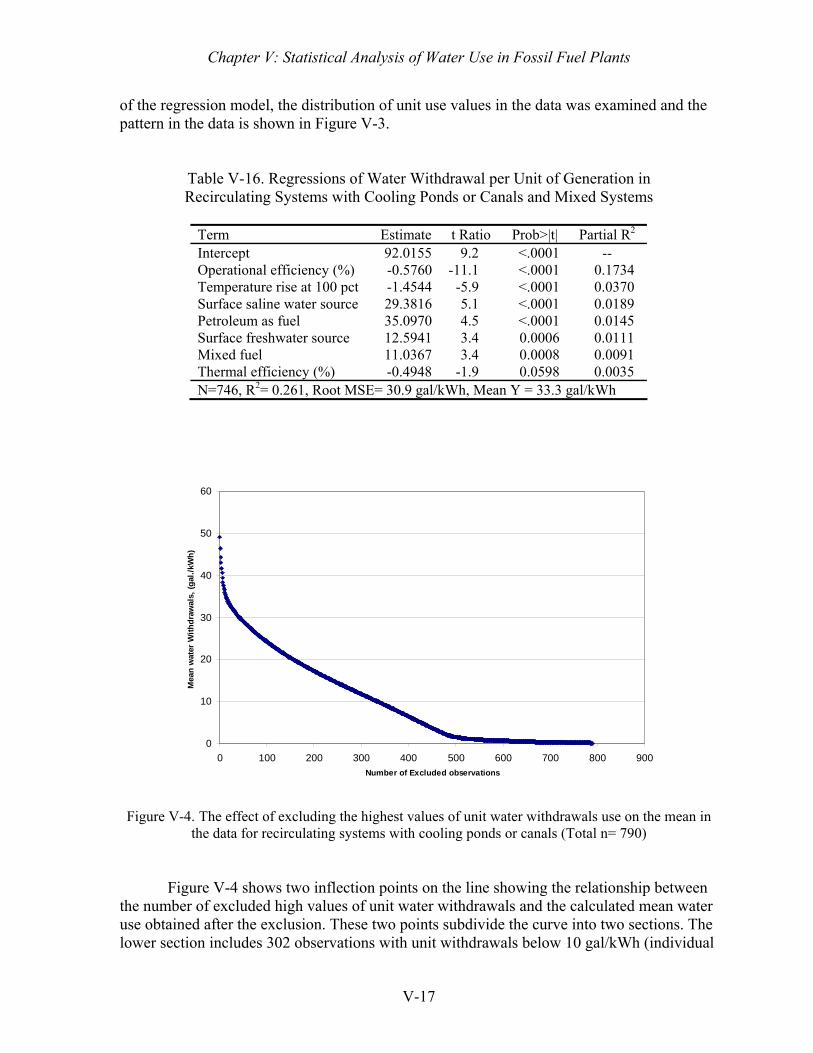
Chapter V: Statistical Analysis of Water Use in Fossil Fuel Plants
V-17
of the regression model, the distribution of unit use values in the data was examined and the pattern in the data is shown in Figure V-3.
Table V-16. Regressions of Water Withdrawal per Unit of Generation in Recirculating Systems with Cooling Ponds or Canals and Mixed Systems
Term Estimate t Ratio Prob>|t| Partial R2 Intercept 92.0155 9.2 <.0001 -- Operational efficiency (%) -0.5760 -11.1 <.0001 0.1734 Temperature rise at 100 pct -1.4544 -5.9 <.0001 0.0370 Surface saline water source 29.3816 5.1 <.0001 0.0189 Petroleum as fuel 35.0970 4.5 <.0001 0.0145 Surface freshwater source 12.5941 3.4 0.0006 0.0111 Mixed fuel 11.0367 3.4 0.0008 0.0091 Thermal efficiency (%) -0.4948 -1.9 0.0598 0.0035 N=746, R2= 0.261, Root MSE= 30.9 gal/kWh, Mean Y = 33.3 gal/kWh
0
10
20
30
40
50
60
0 100 200 300 400 500 600 700 800 900Number of Excluded observations
Mea
n w
ater
With
draw
als,
(gal
./kW
h)
Figure V-4. The effect of excluding the highest values of unit water withdrawals use on the mean in the data for recirculating systems with cooling ponds or canals (Total n= 790)
Figure V-4 shows two inflection points on the line showing the relationship between the number of excluded high values of unit water withdrawals and the calculated mean water use obtained after the exclusion. These two points subdivide the curve into two sections. The lower section includes 302 observations with unit withdrawals below 10 gal/kWh (individual
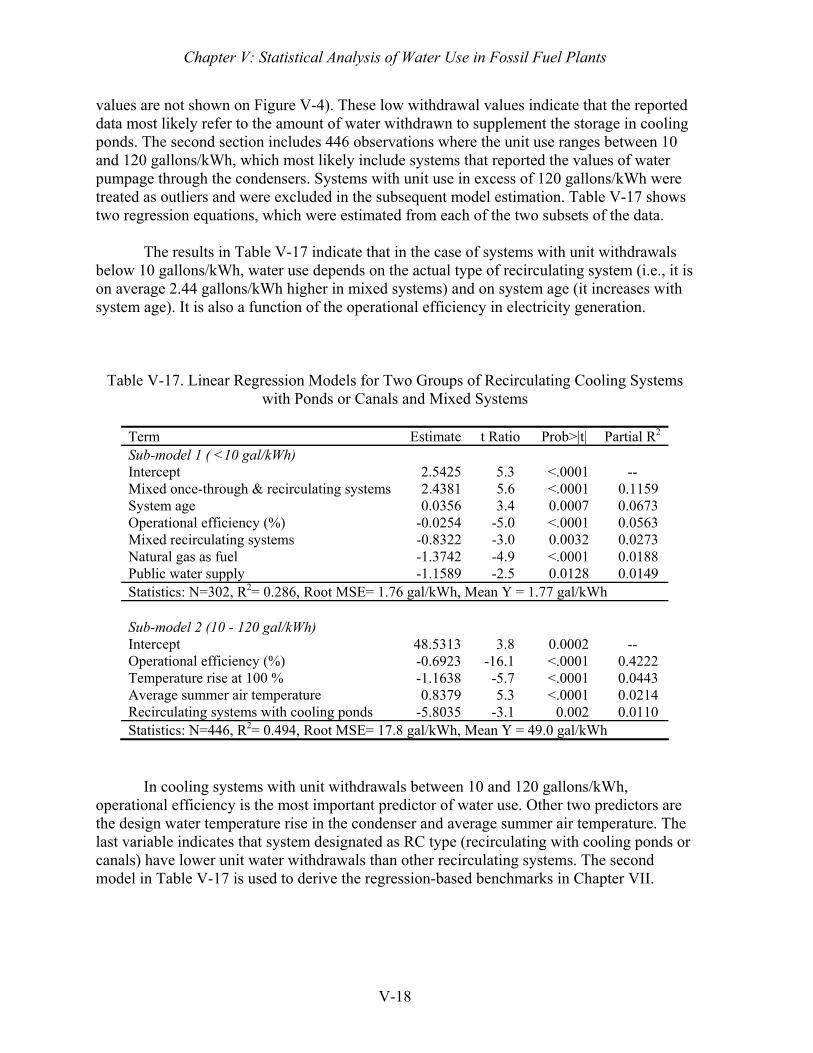
Chapter V: Statistical Analysis of Water Use in Fossil Fuel Plants
V-18
values are not shown on Figure V-4). These low withdrawal values indicate that the reported data most likely refer to the amount of water withdrawn to supplement the storage in cooling ponds. The second section includes 446 observations where the unit use ranges between 10 and 120 gallons/kWh, which most likely include systems that reported the values of water pumpage through the condensers. Systems with unit use in excess of 120 gallons/kWh were treated as outliers and were excluded in the subsequent model estimation. Table V-17 shows two regression equations, which were estimated from each of the two subsets of the data.
The results in Table V-17 indicate that in the case of systems with unit withdrawals below 10 gallons/kWh, water use depends on the actual type of recirculating system (i.e., it is on average 2.44 gallons/kWh higher in mixed systems) and on system age (it increases with system age). It is also a function of the operational efficiency in electricity generation.
Table V-17. Linear Regression Models for Two Groups of Recirculating Cooling Systems
with Ponds or Canals and Mixed Systems
Term Estimate t Ratio Prob>|t| Partial R2 Sub-model 1 ( <10 gal/kWh) Intercept 2.5425 5.3 <.0001 -- Mixed once-through & recirculating systems 2.4381 5.6 <.0001 0.1159 System age 0.0356 3.4 0.0007 0.0673 Operational efficiency (%) -0.0254 -5.0 <.0001 0.0563 Mixed recirculating systems -0.8322 -3.0 0.0032 0.0273 Natural gas as fuel -1.3742 -4.9 <.0001 0.0188 Public water supply -1.1589 -2.5 0.0128 0.0149 Statistics: N=302, R2= 0.286, Root MSE= 1.76 gal/kWh, Mean Y = 1.77 gal/kWh Sub-model 2 (10 - 120 gal/kWh) Intercept 48.5313 3.8 0.0002 -- Operational efficiency (%) -0.6923 -16.1 <.0001 0.4222 Temperature rise at 100 % -1.1638 -5.7 <.0001 0.0443 Average summer air temperature 0.8379 5.3 <.0001 0.0214 Recirculating systems with cooling ponds -5.8035 -3.1 0.002 0.0110 Statistics: N=446, R2= 0.494, Root MSE= 17.8 gal/kWh, Mean Y = 49.0 gal/kWh
In cooling systems with unit withdrawals between 10 and 120 gallons/kWh, operational efficiency is the most important predictor of water use. Other two predictors are the design water temperature rise in the condenser and average summer air temperature. The last variable indicates that system designated as RC type (recirculating with cooling ponds or canals) have lower unit water withdrawals than other recirculating systems. The second model in Table V-17 is used to derive the regression-based benchmarks in Chapter VII.
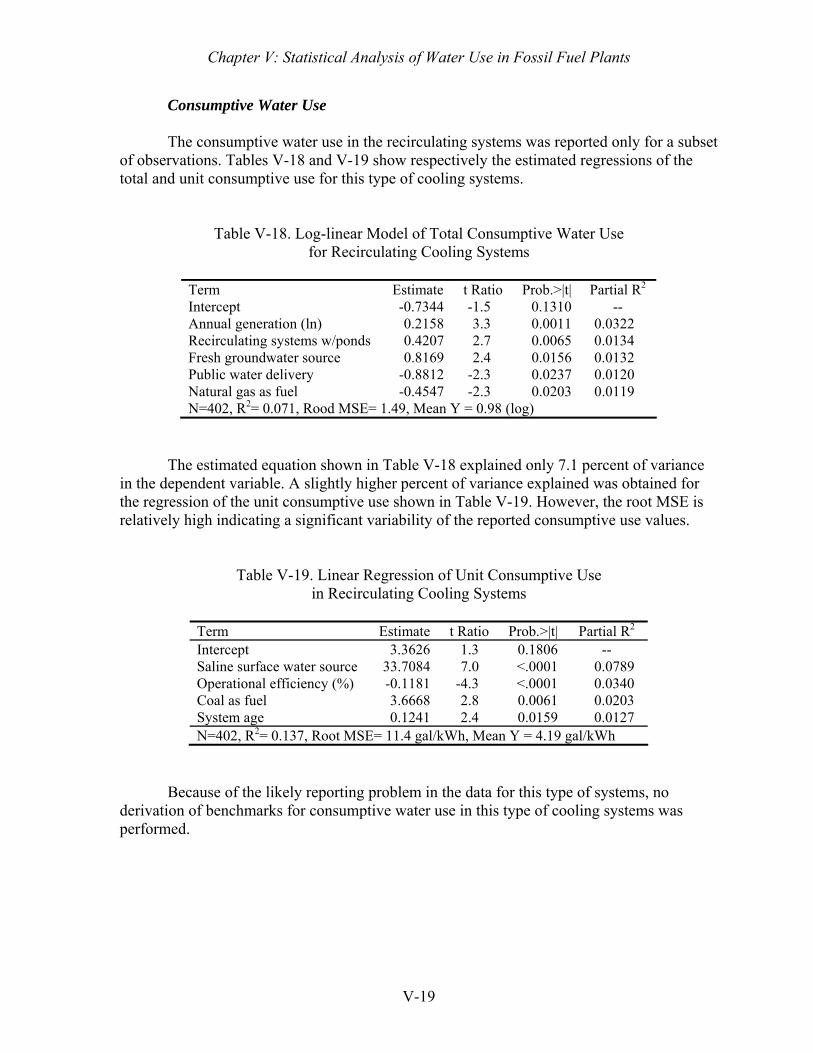
Chapter V: Statistical Analysis of Water Use in Fossil Fuel Plants
V-19
Consumptive Water Use
The consumptive water use in the recirculating systems was reported only for a subset of observations. Tables V-18 and V-19 show respectively the estimated regressions of the total and unit consumptive use for this type of cooling systems.
Table V-18. Log-linear Model of Total Consumptive Water Use for Recirculating Cooling Systems
Term Estimate t Ratio Prob.>|t| Partial R2 Intercept -0.7344 -1.5 0.1310 -- Annual generation (ln) 0.2158 3.3 0.0011 0.0322 Recirculating systems w/ponds 0.4207 2.7 0.0065 0.0134 Fresh groundwater source 0.8169 2.4 0.0156 0.0132 Public water delivery -0.8812 -2.3 0.0237 0.0120 Natural gas as fuel -0.4547 -2.3 0.0203 0.0119 N=402, R2= 0.071, Rood MSE= 1.49, Mean Y = 0.98 (log)
The estimated equation shown in Table V-18 explained only 7.1 percent of variance in the dependent variable. A slightly higher percent of variance explained was obtained for the regression of the unit consumptive use shown in Table V-19. However, the root MSE is relatively high indicating a significant variability of the reported consumptive use values.
Table V-19. Linear Regression of Unit Consumptive Use in Recirculating Cooling Systems
Term Estimate t Ratio Prob.>|t| Partial R2 Intercept 3.3626 1.3 0.1806 -- Saline surface water source 33.7084 7.0 <.0001 0.0789 Operational efficiency (%) -0.1181 -4.3 <.0001 0.0340 Coal as fuel 3.6668 2.8 0.0061 0.0203 System age 0.1241 2.4 0.0159 0.0127 N=402, R2= 0.137, Root MSE= 11.4 gal/kWh, Mean Y = 4.19 gal/kWh
Because of the likely reporting problem in the data for this type of systems, no derivation of benchmarks for consumptive water use in this type of cooling systems was performed.
Chapter V: Statistical Analysis of Water Use in Fossil Fuel Plants
V-20
Summary
The regression models presented in this section can be used to generate benchmarks of water withdrawals and consumptive use for individual cooling systems based on their system-specific characteristics. However, such benchmarks will represent only the average conditions among the existing power plants and cooling systems and not the conditions at plants that would be considered to have the best performance in their category. In order to measure the level of performance in terms of technical efficiency of water use, an econometric technique called stochastic production frontier analysis was used and the results are described in the following section.
STOCHASTIC FRONTIER EFFICIENCY ANALYSIS
The 1996-2004 data from the Form EIA 767 and explanatory variables for once-through, closed-loop, and recirculating systems were reformatted for the estimation of the stochastic production frontier models. The log of total annual energy generation (net) was used as the dependent variable and the log of total water withdrawals and other systems conditions and characteristics were used as independent variables.
The maximum likelihood estimates (MLE) for the pooled stochastic production
frontier model and those for the technical inefficiency model for the three aggregated types of cooling systems are presented in Tables V-20 to V-22. The modeling output also included the estimates of technical efficiency (TEi) for each cooling system during each year of the data. These outputs were used in developing distribution graphs of the estimated technical efficiency. Efficiencies of Once-through Cooling Systems
In the case of once-through cooling systems, as expected, the estimated coefficients of the stochastic frontier are positive and indicate that the log of annual net generation of electric energy is proportional to log of annual water withdrawals and also, to a smaller degree, the percentage of capacity utilization (also known as operational efficiency).
The inefficiency model included five variables which were found to be associated
with the estimated technical efficiency. According to the results, the inefficiency in using water by the once-through cooling systems decreases as the thermal efficiency of generation increases (negative sign) and as the maximum water temperature rise in the condenser at 100 percent generation capacity increases. The technical inefficiency increases with increasing system age and is higher for systems with fresh groundwater supply and systems with public water supply.
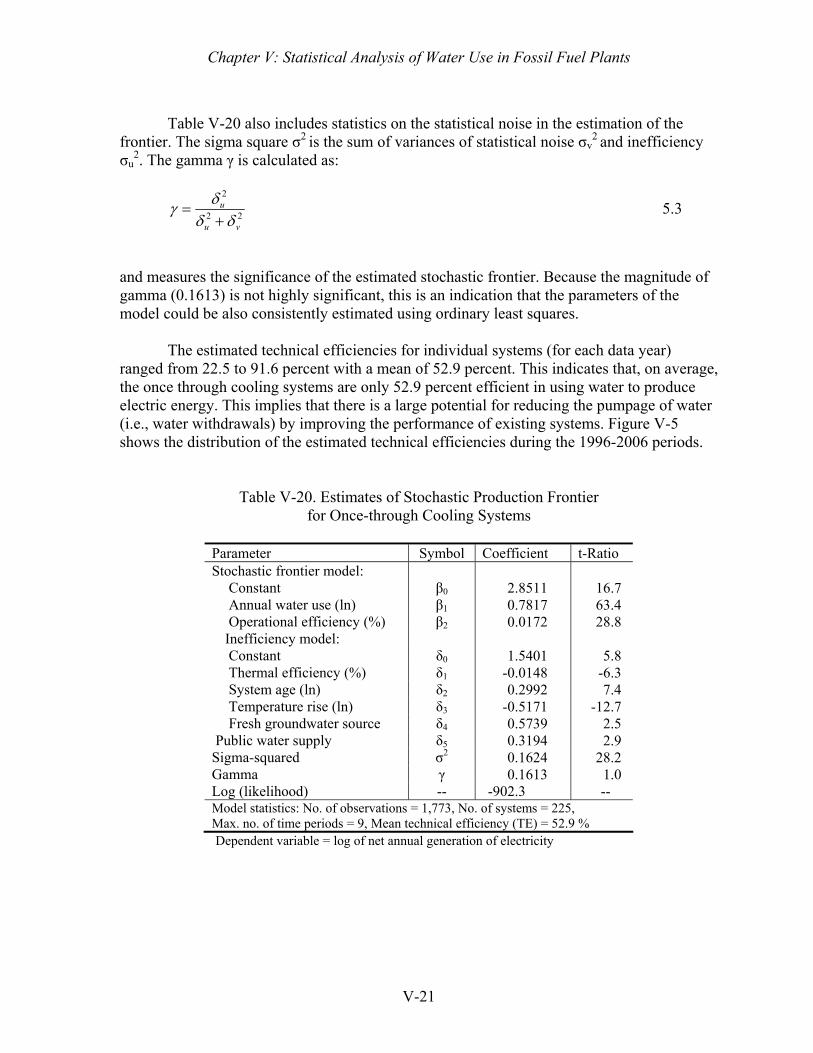
Chapter V: Statistical Analysis of Water Use in Fossil Fuel Plants
V-21
Table V-20 also includes statistics on the statistical noise in the estimation of the
frontier. The sigma square σ2 is the sum of variances of statistical noise σv2 and inefficiency
σu2. The gamma γ is calculated as:
22
2
vu
u
δδδγ+
= 5.3
and measures the significance of the estimated stochastic frontier. Because the magnitude of gamma (0.1613) is not highly significant, this is an indication that the parameters of the model could be also consistently estimated using ordinary least squares.
The estimated technical efficiencies for individual systems (for each data year) ranged from 22.5 to 91.6 percent with a mean of 52.9 percent. This indicates that, on average, the once through cooling systems are only 52.9 percent efficient in using water to produce electric energy. This implies that there is a large potential for reducing the pumpage of water (i.e., water withdrawals) by improving the performance of existing systems. Figure V-5 shows the distribution of the estimated technical efficiencies during the 1996-2006 periods.
Table V-20. Estimates of Stochastic Production Frontier for Once-through Cooling Systems
Parameter Symbol Coefficient t-Ratio Stochastic frontier model:
Constant β0 2.8511 16.7 Annual water use (ln) β1 0.7817 63.4 Operational efficiency (%) β2 0.0172 28.8 Inefficiency model: Constant δ0 1.5401 5.8 Thermal efficiency (%) δ1 -0.0148 -6.3 System age (ln) δ2 0.2992 7.4 Temperature rise (ln) δ3 -0.5171 -12.7 Fresh groundwater source δ4 0.5739 2.5
Public water supply δ5 0.3194 2.9 Sigma-squared σ2 0.1624 28.2 Gamma γ 0.1613 1.0 Log (likelihood) -- -902.3 -- Model statistics: No. of observations = 1,773, No. of systems = 225, Max. no. of time periods = 9, Mean technical efficiency (TE) = 52.9 % Dependent variable = log of net annual generation of electricity
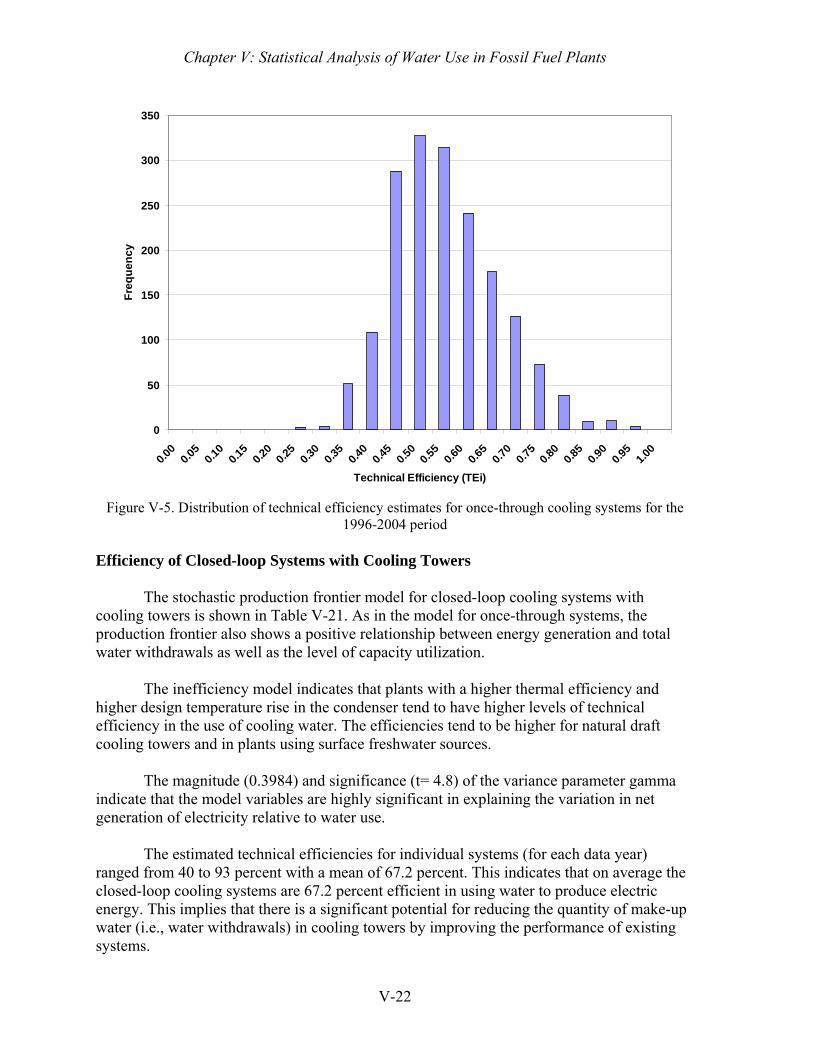
Chapter V: Statistical Analysis of Water Use in Fossil Fuel Plants
V-22
0
50
100
150
200
250
300
350
0.00
0.05
0.10
0.15
0.20
0.25
0.30
0.35
0.40
0.45
0.50
0.55
0.60
0.65
0.70
0.75
0.80
0.85
0.90
0.95
1.00
Technical Efficiency (TEi)
Freq
uenc
y
Figure V-5. Distribution of technical efficiency estimates for once-through cooling systems for the
1996-2004 period Efficiency of Closed-loop Systems with Cooling Towers
The stochastic production frontier model for closed-loop cooling systems with cooling towers is shown in Table V-21. As in the model for once-through systems, the production frontier also shows a positive relationship between energy generation and total water withdrawals as well as the level of capacity utilization.
The inefficiency model indicates that plants with a higher thermal efficiency and higher design temperature rise in the condenser tend to have higher levels of technical efficiency in the use of cooling water. The efficiencies tend to be higher for natural draft cooling towers and in plants using surface freshwater sources.
The magnitude (0.3984) and significance (t= 4.8) of the variance parameter gamma
indicate that the model variables are highly significant in explaining the variation in net generation of electricity relative to water use.
The estimated technical efficiencies for individual systems (for each data year)
ranged from 40 to 93 percent with a mean of 67.2 percent. This indicates that on average the closed-loop cooling systems are 67.2 percent efficient in using water to produce electric energy. This implies that there is a significant potential for reducing the quantity of make-up water (i.e., water withdrawals) in cooling towers by improving the performance of existing systems.
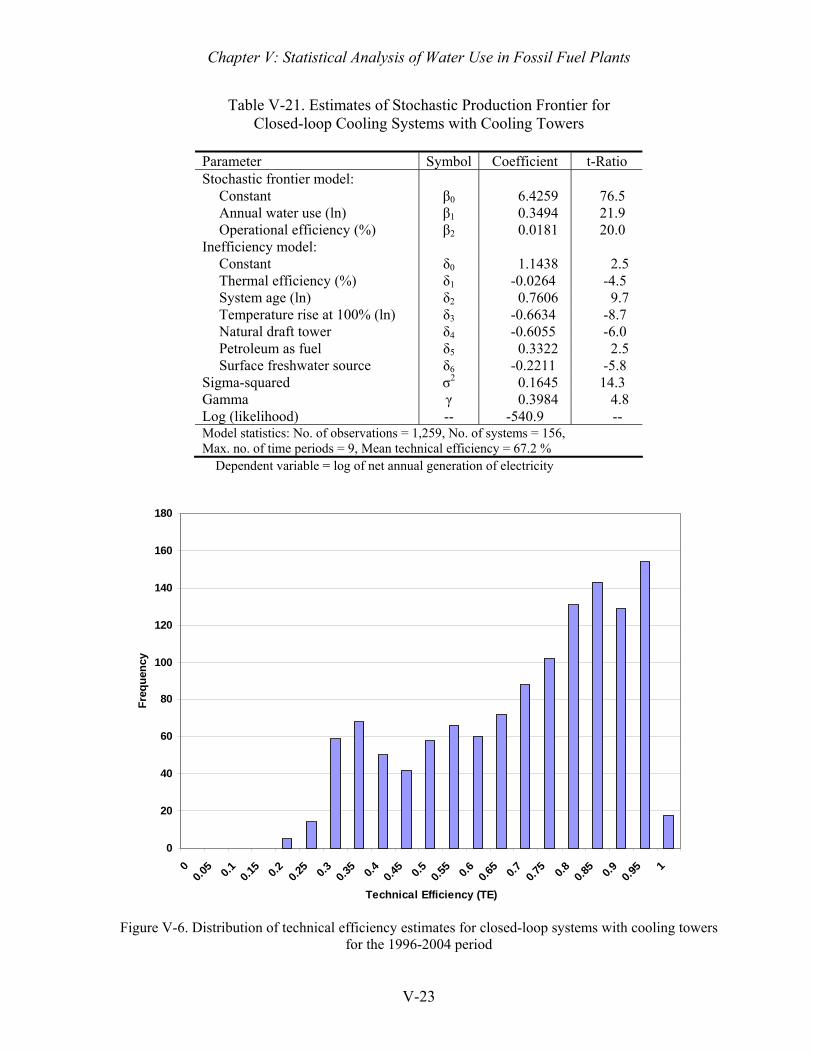
Chapter V: Statistical Analysis of Water Use in Fossil Fuel Plants
V-23
Table V-21. Estimates of Stochastic Production Frontier for Closed-loop Cooling Systems with Cooling Towers
Parameter Symbol Coefficient t-Ratio Stochastic frontier model:
Constant β0 6.4259 76.5 Annual water use (ln) β1 0.3494 21.9 Operational efficiency (%) β2 0.0181 20.0
Inefficiency model: Constant δ0 1.1438 2.5 Thermal efficiency (%) δ1 -0.0264 -4.5 System age (ln) δ2 0.7606 9.7 Temperature rise at 100% (ln) δ3 -0.6634 -8.7 Natural draft tower δ4 -0.6055 -6.0 Petroleum as fuel δ5 0.3322 2.5 Surface freshwater source δ6 -0.2211 -5.8
Sigma-squared σ2 0.1645 14.3 Gamma γ 0.3984 4.8 Log (likelihood) -- -540.9 -- Model statistics: No. of observations = 1,259, No. of systems = 156, Max. no. of time periods = 9, Mean technical efficiency = 67.2 %
Dependent variable = log of net annual generation of electricity
0
20
40
60
80
100
120
140
160
180
00.0
5 0.1 0.15 0.2 0.2
5 0.3 0.35 0.4 0.4
5 0.5 0.55 0.6 0.6
5 0.7 0.75 0.8 0.8
5 0.9 0.95 1
Technical Efficiency (TE)
Freq
uenc
y
Figure V-6. Distribution of technical efficiency estimates for closed-loop systems with cooling towers
for the 1996-2004 period
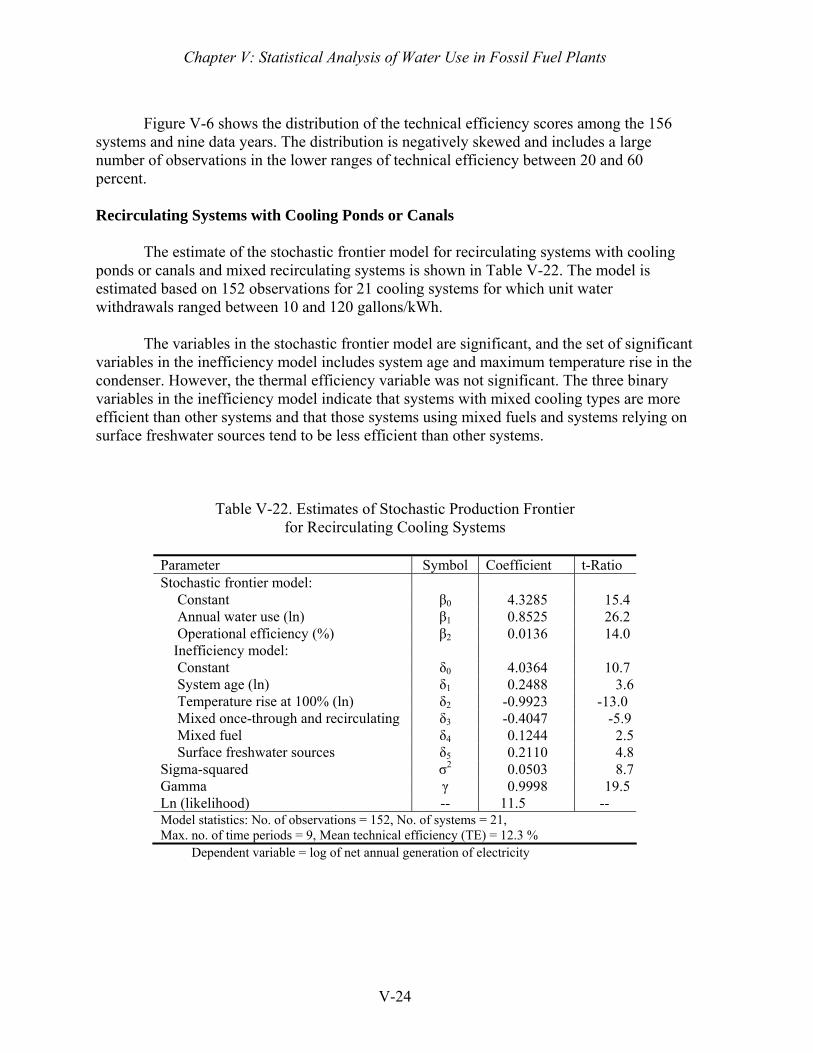
Chapter V: Statistical Analysis of Water Use in Fossil Fuel Plants
V-24
Figure V-6 shows the distribution of the technical efficiency scores among the 156
systems and nine data years. The distribution is negatively skewed and includes a large number of observations in the lower ranges of technical efficiency between 20 and 60 percent. Recirculating Systems with Cooling Ponds or Canals
The estimate of the stochastic frontier model for recirculating systems with cooling ponds or canals and mixed recirculating systems is shown in Table V-22. The model is estimated based on 152 observations for 21 cooling systems for which unit water withdrawals ranged between 10 and 120 gallons/kWh.
The variables in the stochastic frontier model are significant, and the set of significant variables in the inefficiency model includes system age and maximum temperature rise in the condenser. However, the thermal efficiency variable was not significant. The three binary variables in the inefficiency model indicate that systems with mixed cooling types are more efficient than other systems and that those systems using mixed fuels and systems relying on surface freshwater sources tend to be less efficient than other systems.
Table V-22. Estimates of Stochastic Production Frontier for Recirculating Cooling Systems
Parameter Symbol Coefficient t-Ratio Stochastic frontier model:
Constant β0 4.3285 15.4 Annual water use (ln) β1 0.8525 26.2 Operational efficiency (%) β2 0.0136 14.0 Inefficiency model: Constant δ0 4.0364 10.7 System age (ln) δ1 0.2488 3.6 Temperature rise at 100% (ln) δ2 -0.9923 -13.0 Mixed once-through and recirculating δ3 -0.4047 -5.9 Mixed fuel δ4 0.1244 2.5 Surface freshwater sources δ5 0.2110 4.8
Sigma-squared σ2 0.0503 8.7 Gamma γ 0.9998 19.5 Ln (likelihood) -- 11.5 -- Model statistics: No. of observations = 152, No. of systems = 21, Max. no. of time periods = 9, Mean technical efficiency (TE) = 12.3 %
Dependent variable = log of net annual generation of electricity
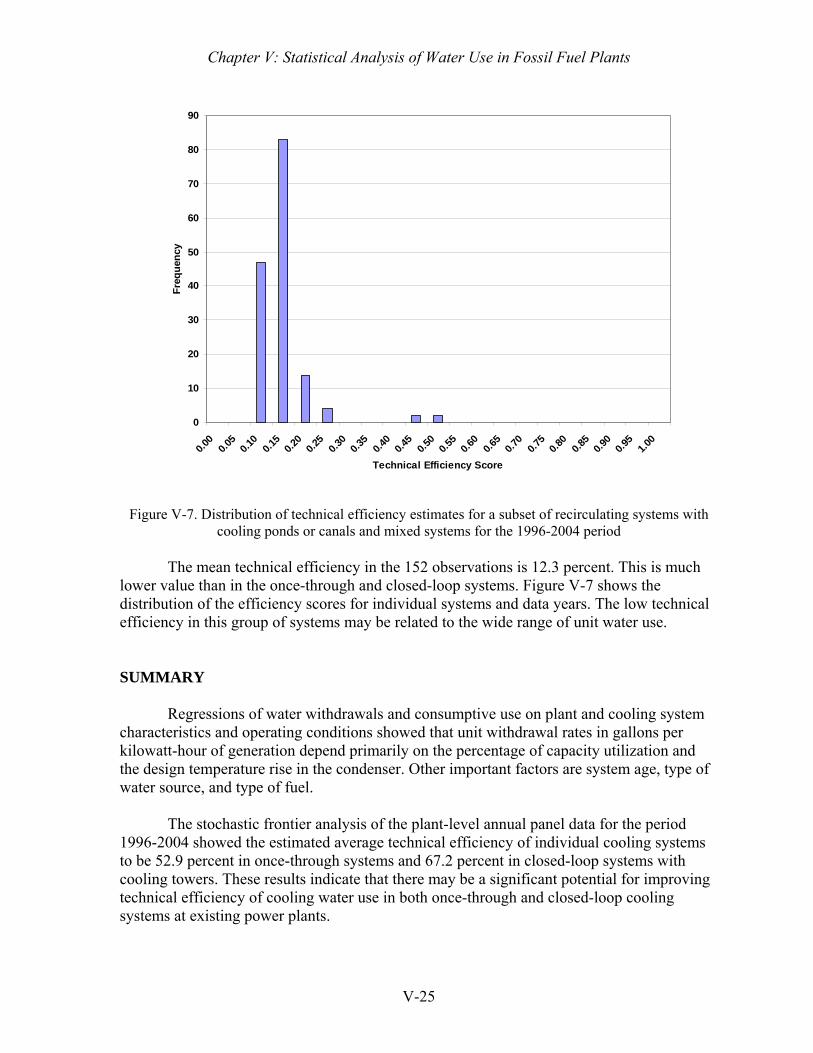
Chapter V: Statistical Analysis of Water Use in Fossil Fuel Plants
V-25
0
10
20
30
40
50
60
70
80
90
0.00
0.05
0.10
0.15
0.20
0.25
0.30
0.35
0.40
0.45
0.50
0.55
0.60
0.65
0.70
0.75
0.80
0.85
0.90
0.95
1.00
Technical Efficiency Score
Freq
uenc
y
Figure V-7. Distribution of technical efficiency estimates for a subset of recirculating systems with cooling ponds or canals and mixed systems for the 1996-2004 period
The mean technical efficiency in the 152 observations is 12.3 percent. This is much
lower value than in the once-through and closed-loop systems. Figure V-7 shows the distribution of the efficiency scores for individual systems and data years. The low technical efficiency in this group of systems may be related to the wide range of unit water use. SUMMARY
Regressions of water withdrawals and consumptive use on plant and cooling system characteristics and operating conditions showed that unit withdrawal rates in gallons per kilowatt-hour of generation depend primarily on the percentage of capacity utilization and the design temperature rise in the condenser. Other important factors are system age, type of water source, and type of fuel.
The stochastic frontier analysis of the plant-level annual panel data for the period 1996-2004 showed the estimated average technical efficiency of individual cooling systems to be 52.9 percent in once-through systems and 67.2 percent in closed-loop systems with cooling towers. These results indicate that there may be a significant potential for improving technical efficiency of cooling water use in both once-through and closed-loop cooling systems at existing power plants.

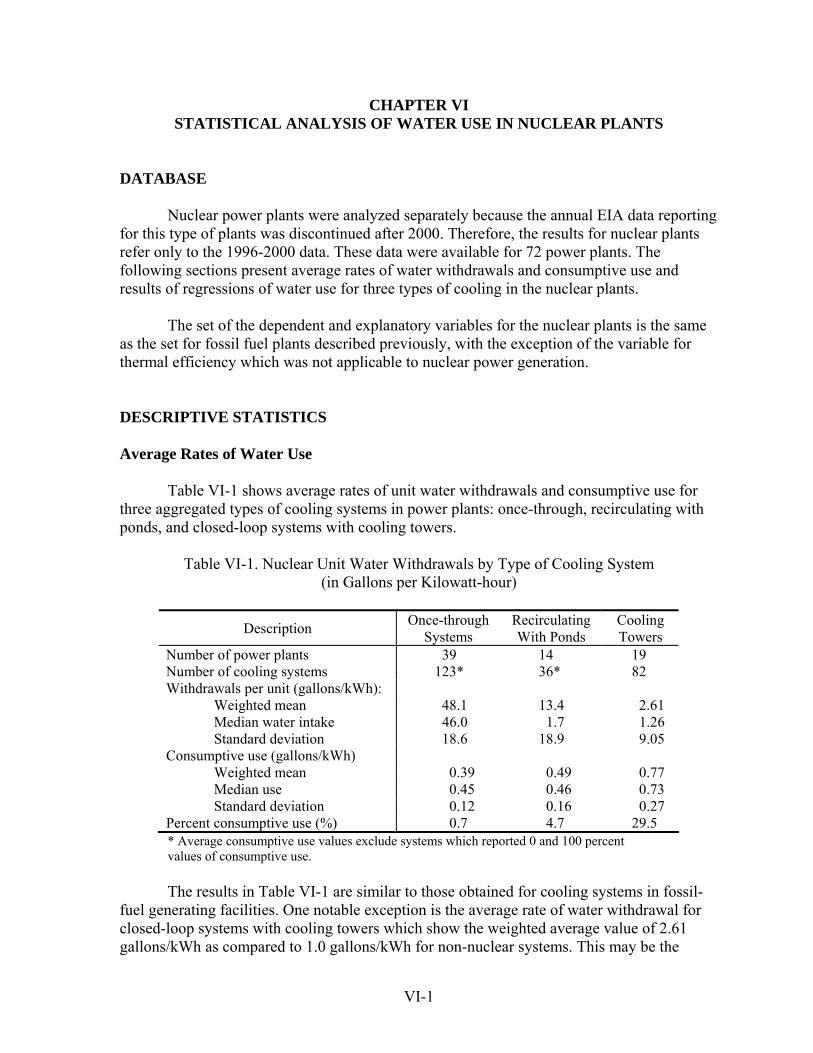
VI-1
CHAPTER VI STATISTICAL ANALYSIS OF WATER USE IN NUCLEAR PLANTS
DATABASE
Nuclear power plants were analyzed separately because the annual EIA data reporting for this type of plants was discontinued after 2000. Therefore, the results for nuclear plants refer only to the 1996-2000 data. These data were available for 72 power plants. The following sections present average rates of water withdrawals and consumptive use and results of regressions of water use for three types of cooling in the nuclear plants.
The set of the dependent and explanatory variables for the nuclear plants is the same as the set for fossil fuel plants described previously, with the exception of the variable for thermal efficiency which was not applicable to nuclear power generation. DESCRIPTIVE STATISTICS Average Rates of Water Use
Table VI-1 shows average rates of unit water withdrawals and consumptive use for three aggregated types of cooling systems in power plants: once-through, recirculating with ponds, and closed-loop systems with cooling towers.
Table VI-1. Nuclear Unit Water Withdrawals by Type of Cooling System
(in Gallons per Kilowatt-hour)
Description Once-through Systems
Recirculating With Ponds
Cooling Towers
Number of power plants 39 14 19 Number of cooling systems 123* 36* 82 Withdrawals per unit (gallons/kWh): Weighted mean 48.1 13.4 2.61 Median water intake 46.0 1.7 1.26 Standard deviation 18.6 18.9 9.05 Consumptive use (gallons/kWh) Weighted mean 0.39 0.49 0.77 Median use 0.45 0.46 0.73 Standard deviation 0.12 0.16 0.27 Percent consumptive use (%) 0.7 4.7 29.5 * Average consumptive use values exclude systems which reported 0 and 100 percent values of consumptive use.
The results in Table VI-1 are similar to those obtained for cooling systems in fossil-
fuel generating facilities. One notable exception is the average rate of water withdrawal for closed-loop systems with cooling towers which show the weighted average value of 2.61 gallons/kWh as compared to 1.0 gallons/kWh for non-nuclear systems. This may be the
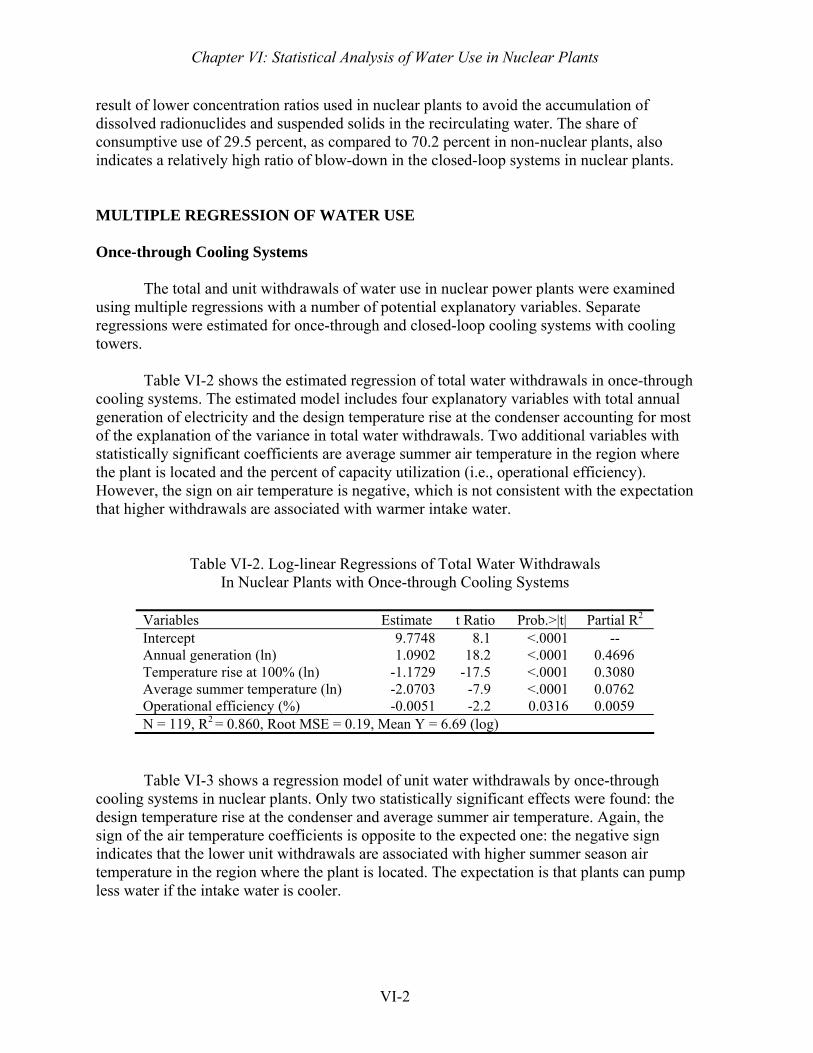
Chapter VI: Statistical Analysis of Water Use in Nuclear Plants
VI-2
result of lower concentration ratios used in nuclear plants to avoid the accumulation of dissolved radionuclides and suspended solids in the recirculating water. The share of consumptive use of 29.5 percent, as compared to 70.2 percent in non-nuclear plants, also indicates a relatively high ratio of blow-down in the closed-loop systems in nuclear plants. MULTIPLE REGRESSION OF WATER USE Once-through Cooling Systems
The total and unit withdrawals of water use in nuclear power plants were examined using multiple regressions with a number of potential explanatory variables. Separate regressions were estimated for once-through and closed-loop cooling systems with cooling towers.
Table VI-2 shows the estimated regression of total water withdrawals in once-through cooling systems. The estimated model includes four explanatory variables with total annual generation of electricity and the design temperature rise at the condenser accounting for most of the explanation of the variance in total water withdrawals. Two additional variables with statistically significant coefficients are average summer air temperature in the region where the plant is located and the percent of capacity utilization (i.e., operational efficiency). However, the sign on air temperature is negative, which is not consistent with the expectation that higher withdrawals are associated with warmer intake water.
Table VI-2. Log-linear Regressions of Total Water Withdrawals In Nuclear Plants with Once-through Cooling Systems
Variables Estimate t Ratio Prob.>|t| Partial R2 Intercept 9.7748 8.1 <.0001 -- Annual generation (ln) 1.0902 18.2 <.0001 0.4696 Temperature rise at 100% (ln) -1.1729 -17.5 <.0001 0.3080 Average summer temperature (ln) -2.0703 -7.9 <.0001 0.0762 Operational efficiency (%) -0.0051 -2.2 0.0316 0.0059 N = 119, R2 = 0.860, Root MSE = 0.19, Mean Y = 6.69 (log)
Table VI-3 shows a regression model of unit water withdrawals by once-through cooling systems in nuclear plants. Only two statistically significant effects were found: the design temperature rise at the condenser and average summer air temperature. Again, the sign of the air temperature coefficients is opposite to the expected one: the negative sign indicates that the lower unit withdrawals are associated with higher summer season air temperature in the region where the plant is located. The expectation is that plants can pump less water if the intake water is cooler.
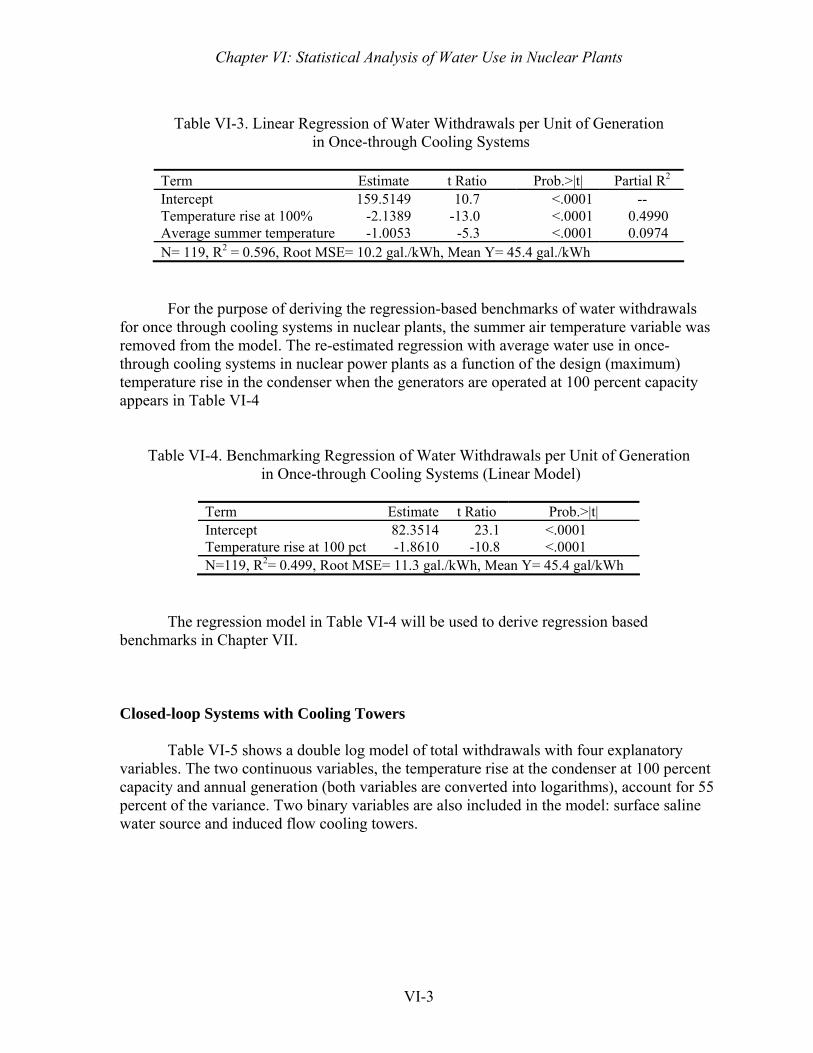
Chapter VI: Statistical Analysis of Water Use in Nuclear Plants
VI-3
Table VI-3. Linear Regression of Water Withdrawals per Unit of Generation
in Once-through Cooling Systems
Term Estimate t Ratio Prob.>|t| Partial R2 Intercept 159.5149 10.7 <.0001 -- Temperature rise at 100% -2.1389 -13.0 <.0001 0.4990 Average summer temperature -1.0053 -5.3 <.0001 0.0974 N= 119, R2 = 0.596, Root MSE= 10.2 gal./kWh, Mean Y= 45.4 gal./kWh
For the purpose of deriving the regression-based benchmarks of water withdrawals for once through cooling systems in nuclear plants, the summer air temperature variable was removed from the model. The re-estimated regression with average water use in once-through cooling systems in nuclear power plants as a function of the design (maximum) temperature rise in the condenser when the generators are operated at 100 percent capacity appears in Table VI-4
Table VI-4. Benchmarking Regression of Water Withdrawals per Unit of Generation
in Once-through Cooling Systems (Linear Model)
Term Estimate t Ratio Prob.>|t| Intercept 82.3514 23.1 <.0001 Temperature rise at 100 pct -1.8610 -10.8 <.0001 N=119, R2= 0.499, Root MSE= 11.3 gal./kWh, Mean Y= 45.4 gal/kWh
The regression model in Table VI-4 will be used to derive regression based benchmarks in Chapter VII. Closed-loop Systems with Cooling Towers
Table VI-5 shows a double log model of total withdrawals with four explanatory variables. The two continuous variables, the temperature rise at the condenser at 100 percent capacity and annual generation (both variables are converted into logarithms), account for 55 percent of the variance. Two binary variables are also included in the model: surface saline water source and induced flow cooling towers.
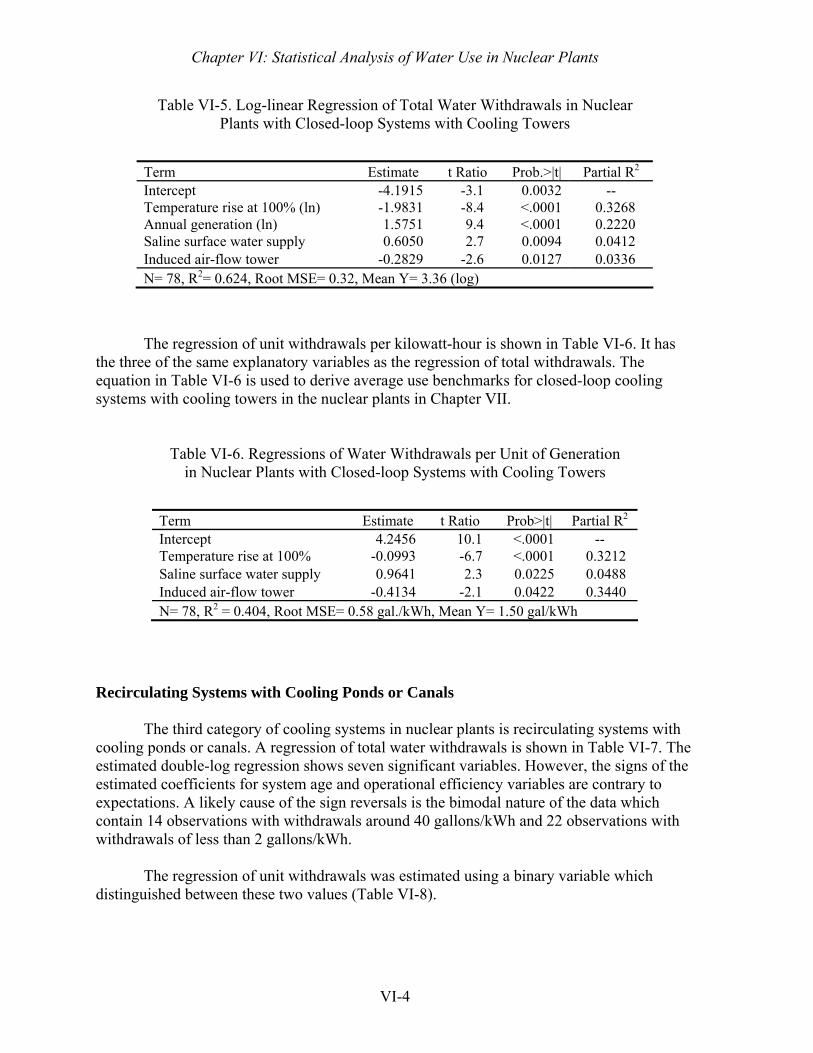
Chapter VI: Statistical Analysis of Water Use in Nuclear Plants
VI-4
Table VI-5. Log-linear Regression of Total Water Withdrawals in Nuclear Plants with Closed-loop Systems with Cooling Towers
The regression of unit withdrawals per kilowatt-hour is shown in Table VI-6. It has the three of the same explanatory variables as the regression of total withdrawals. The equation in Table VI-6 is used to derive average use benchmarks for closed-loop cooling systems with cooling towers in the nuclear plants in Chapter VII.
Table VI-6. Regressions of Water Withdrawals per Unit of Generation
in Nuclear Plants with Closed-loop Systems with Cooling Towers
Recirculating Systems with Cooling Ponds or Canals
The third category of cooling systems in nuclear plants is recirculating systems with cooling ponds or canals. A regression of total water withdrawals is shown in Table VI-7. The estimated double-log regression shows seven significant variables. However, the signs of the estimated coefficients for system age and operational efficiency variables are contrary to expectations. A likely cause of the sign reversals is the bimodal nature of the data which contain 14 observations with withdrawals around 40 gallons/kWh and 22 observations with withdrawals of less than 2 gallons/kWh.
The regression of unit withdrawals was estimated using a binary variable which distinguished between these two values (Table VI-8).
Term Estimate t Ratio Prob.>|t| Partial R2 Intercept -4.1915 -3.1 0.0032 -- Temperature rise at 100% (ln) -1.9831 -8.4 <.0001 0.3268 Annual generation (ln) 1.5751 9.4 <.0001 0.2220 Saline surface water supply 0.6050 2.7 0.0094 0.0412 Induced air-flow tower -0.2829 -2.6 0.0127 0.0336 N= 78, R2= 0.624, Root MSE= 0.32, Mean Y= 3.36 (log)
Term Estimate t Ratio Prob>|t| Partial R2 Intercept 4.2456 10.1 <.0001 -- Temperature rise at 100% -0.0993 -6.7 <.0001 0.3212 Saline surface water supply 0.9641 2.3 0.0225 0.0488 Induced air-flow tower -0.4134 -2.1 0.0422 0.3440 N= 78, R2 = 0.404, Root MSE= 0.58 gal./kWh, Mean Y= 1.50 gal/kWh
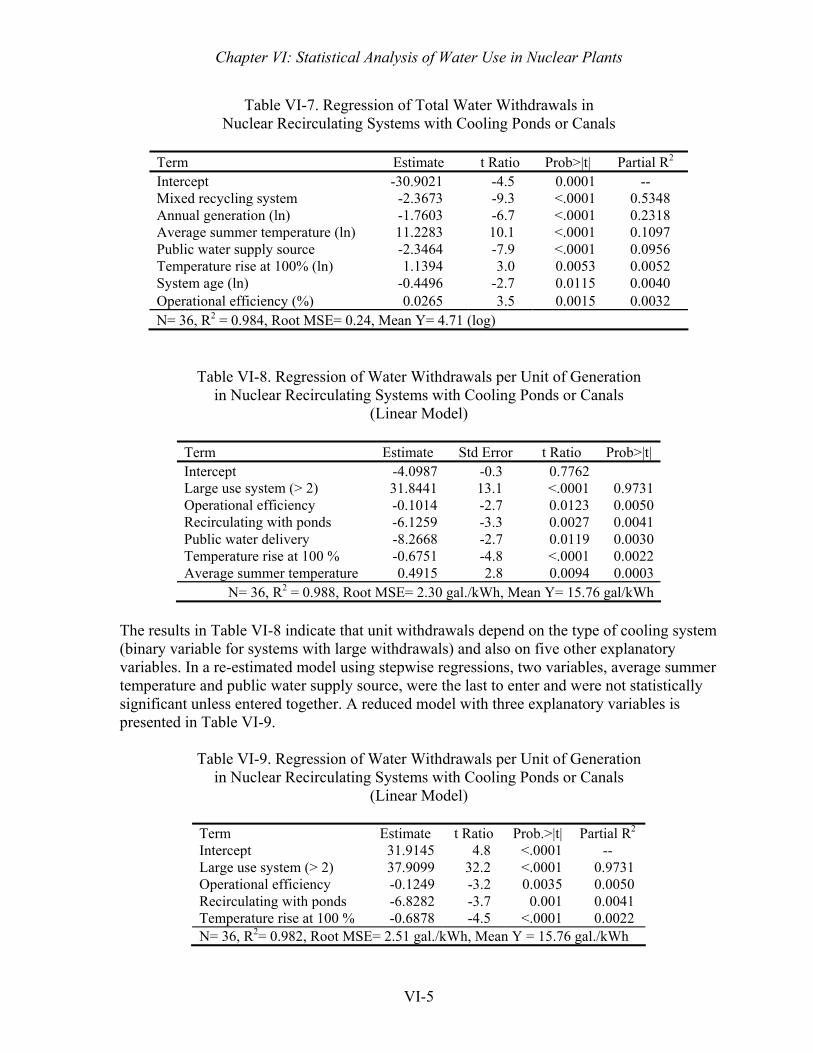
Chapter VI: Statistical Analysis of Water Use in Nuclear Plants
VI-5
Table VI-7. Regression of Total Water Withdrawals in Nuclear Recirculating Systems with Cooling Ponds or Canals
Term Estimate t Ratio Prob>|t| Partial R2 Intercept -30.9021 -4.5 0.0001 -- Mixed recycling system -2.3673 -9.3 <.0001 0.5348 Annual generation (ln) -1.7603 -6.7 <.0001 0.2318 Average summer temperature (ln) 11.2283 10.1 <.0001 0.1097 Public water supply source -2.3464 -7.9 <.0001 0.0956 Temperature rise at 100% (ln) 1.1394 3.0 0.0053 0.0052 System age (ln) -0.4496 -2.7 0.0115 0.0040 Operational efficiency (%) 0.0265 3.5 0.0015 0.0032 N= 36, R2 = 0.984, Root MSE= 0.24, Mean Y= 4.71 (log)
Table VI-8. Regression of Water Withdrawals per Unit of Generation in Nuclear Recirculating Systems with Cooling Ponds or Canals
(Linear Model)
Term Estimate Std Error t Ratio Prob>|t| Intercept -4.0987 -0.3 0.7762 Large use system (> 2) 31.8441 13.1 <.0001 0.9731Operational efficiency -0.1014 -2.7 0.0123 0.0050Recirculating with ponds -6.1259 -3.3 0.0027 0.0041Public water delivery -8.2668 -2.7 0.0119 0.0030Temperature rise at 100 % -0.6751 -4.8 <.0001 0.0022Average summer temperature 0.4915 2.8 0.0094 0.0003
N= 36, R2 = 0.988, Root MSE= 2.30 gal./kWh, Mean Y= 15.76 gal/kWh The results in Table VI-8 indicate that unit withdrawals depend on the type of cooling system (binary variable for systems with large withdrawals) and also on five other explanatory variables. In a re-estimated model using stepwise regressions, two variables, average summer temperature and public water supply source, were the last to enter and were not statistically significant unless entered together. A reduced model with three explanatory variables is presented in Table VI-9.
Table VI-9. Regression of Water Withdrawals per Unit of Generation
in Nuclear Recirculating Systems with Cooling Ponds or Canals (Linear Model)
Term Estimate t Ratio Prob.>|t| Partial R2 Intercept 31.9145 4.8 <.0001 -- Large use system (> 2) 37.9099 32.2 <.0001 0.9731 Operational efficiency -0.1249 -3.2 0.0035 0.0050 Recirculating with ponds -6.8282 -3.7 0.001 0.0041 Temperature rise at 100 % -0.6878 -4.5 <.0001 0.0022 N= 36, R2= 0.982, Root MSE= 2.51 gal./kWh, Mean Y = 15.76 gal./kWh
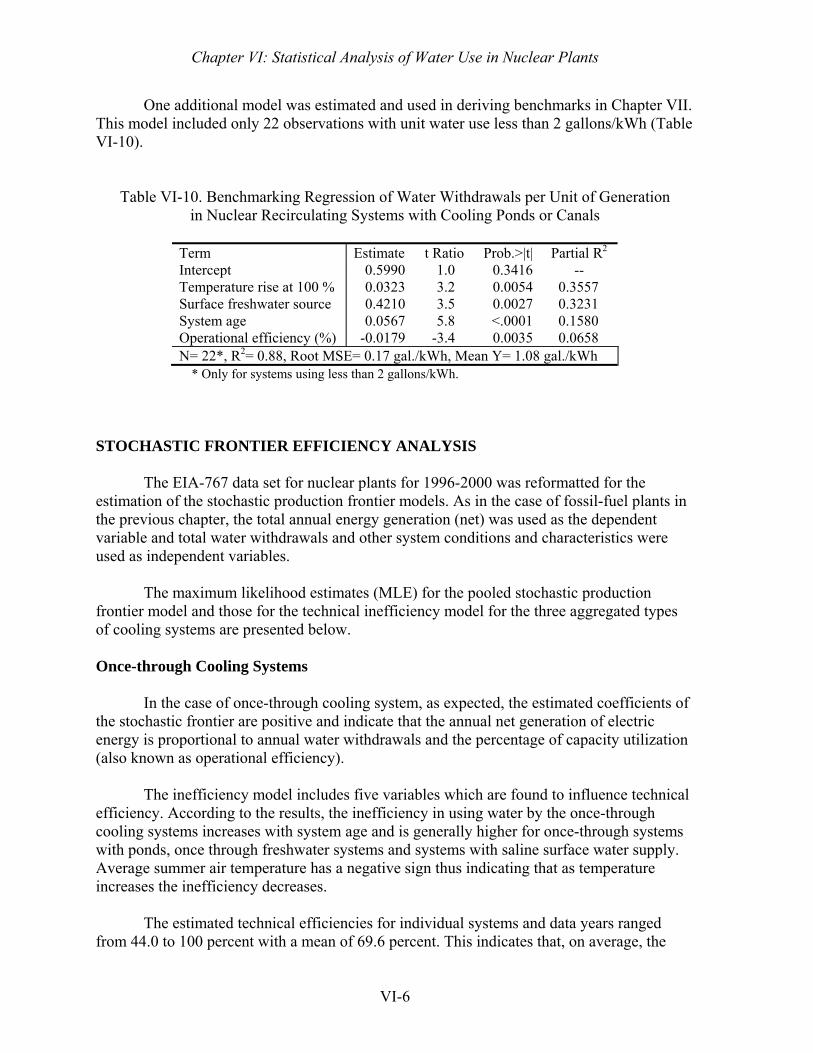
Chapter VI: Statistical Analysis of Water Use in Nuclear Plants
VI-6
One additional model was estimated and used in deriving benchmarks in Chapter VII. This model included only 22 observations with unit water use less than 2 gallons/kWh (Table VI-10).
Table VI-10. Benchmarking Regression of Water Withdrawals per Unit of Generation in Nuclear Recirculating Systems with Cooling Ponds or Canals
Term Estimate t Ratio Prob.>|t| Partial R2 Intercept 0.5990 1.0 0.3416 -- Temperature rise at 100 % 0.0323 3.2 0.0054 0.3557 Surface freshwater source 0.4210 3.5 0.0027 0.3231 System age 0.0567 5.8 <.0001 0.1580 Operational efficiency (%) -0.0179 -3.4 0.0035 0.0658 N= 22*, R2= 0.88, Root MSE= 0.17 gal./kWh, Mean Y= 1.08 gal./kWh
* Only for systems using less than 2 gallons/kWh.
STOCHASTIC FRONTIER EFFICIENCY ANALYSIS
The EIA-767 data set for nuclear plants for 1996-2000 was reformatted for the
estimation of the stochastic production frontier models. As in the case of fossil-fuel plants in the previous chapter, the total annual energy generation (net) was used as the dependent variable and total water withdrawals and other system conditions and characteristics were used as independent variables.
The maximum likelihood estimates (MLE) for the pooled stochastic production
frontier model and those for the technical inefficiency model for the three aggregated types of cooling systems are presented below. Once-through Cooling Systems
In the case of once-through cooling system, as expected, the estimated coefficients of the stochastic frontier are positive and indicate that the annual net generation of electric energy is proportional to annual water withdrawals and the percentage of capacity utilization (also known as operational efficiency).
The inefficiency model includes five variables which are found to influence technical
efficiency. According to the results, the inefficiency in using water by the once-through cooling systems increases with system age and is generally higher for once-through systems with ponds, once through freshwater systems and systems with saline surface water supply. Average summer air temperature has a negative sign thus indicating that as temperature increases the inefficiency decreases.
The estimated technical efficiencies for individual systems and data years ranged
from 44.0 to 100 percent with a mean of 69.6 percent. This indicates that, on average, the
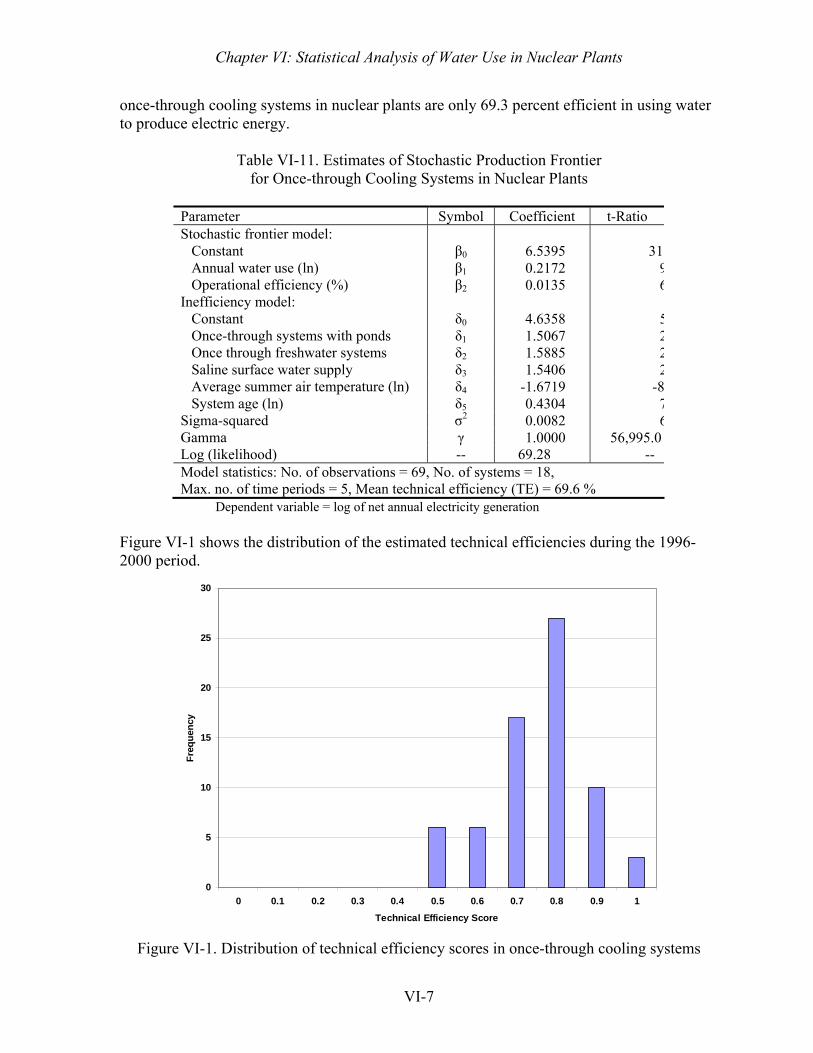
Chapter VI: Statistical Analysis of Water Use in Nuclear Plants
VI-7
once-through cooling systems in nuclear plants are only 69.3 percent efficient in using water to produce electric energy.
Table VI-11. Estimates of Stochastic Production Frontier
for Once-through Cooling Systems in Nuclear Plants
Parameter Symbol Coefficient t-Ratio Stochastic frontier model:
Constant β0 6.5395 31.Annual water use (ln) β1 0.2172 9Operational efficiency (%) β2 0.0135 6
Inefficiency model: Constant δ0 4.6358 5Once-through systems with ponds δ1 1.5067 2Once through freshwater systems δ2 1.5885 2Saline surface water supply δ3 1.5406 2Average summer air temperature (ln) δ4 -1.6719 -8System age (ln) δ5 0.4304 7
Sigma-squared σ2 0.0082 6Gamma γ 1.0000 56,995.0Log (likelihood) -- 69.28 -- Model statistics: No. of observations = 69, No. of systems = 18, Max. no. of time periods = 5, Mean technical efficiency (TE) = 69.6 %
Dependent variable = log of net annual electricity generation Figure VI-1 shows the distribution of the estimated technical efficiencies during the 1996-2000 period.
0
5
10
15
20
25
30
0 0.1 0.2 0.3 0.4 0.5 0.6 0.7 0.8 0.9 1
Technical Efficiency Score
Freq
uenc
y
Figure VI-1. Distribution of technical efficiency scores in once-through cooling systems
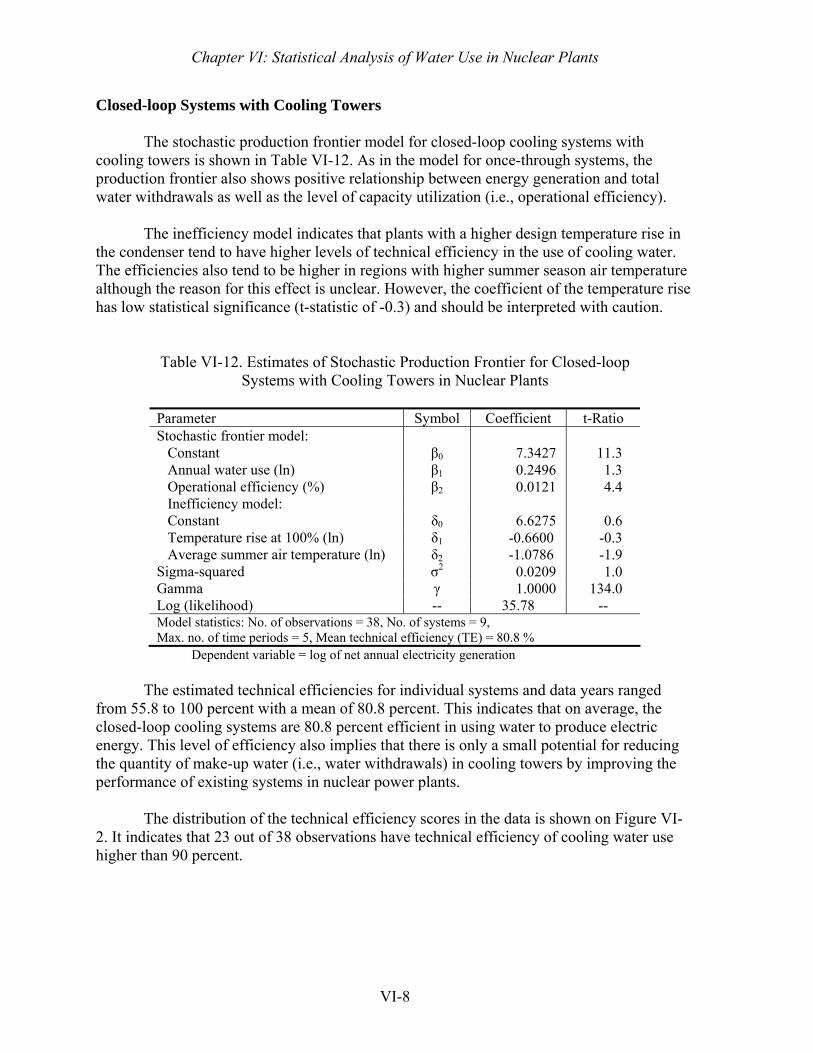
Chapter VI: Statistical Analysis of Water Use in Nuclear Plants
VI-8
Closed-loop Systems with Cooling Towers
The stochastic production frontier model for closed-loop cooling systems with cooling towers is shown in Table VI-12. As in the model for once-through systems, the production frontier also shows positive relationship between energy generation and total water withdrawals as well as the level of capacity utilization (i.e., operational efficiency).
The inefficiency model indicates that plants with a higher design temperature rise in the condenser tend to have higher levels of technical efficiency in the use of cooling water. The efficiencies also tend to be higher in regions with higher summer season air temperature although the reason for this effect is unclear. However, the coefficient of the temperature rise has low statistical significance (t-statistic of -0.3) and should be interpreted with caution.
Table VI-12. Estimates of Stochastic Production Frontier for Closed-loop Systems with Cooling Towers in Nuclear Plants
Parameter Symbol Coefficient t-Ratio Stochastic frontier model:
Constant β0 7.3427 11.3 Annual water use (ln) β1 0.2496 1.3 Operational efficiency (%) β2 0.0121 4.4 Inefficiency model: Constant δ0 6.6275 0.6 Temperature rise at 100% (ln) δ1 -0.6600 -0.3 Average summer air temperature (ln) δ2 -1.0786 -1.9
Sigma-squared σ2 0.0209 1.0 Gamma γ 1.0000 134.0 Log (likelihood) -- 35.78 -- Model statistics: No. of observations = 38, No. of systems = 9, Max. no. of time periods = 5, Mean technical efficiency (TE) = 80.8 %
Dependent variable = log of net annual electricity generation
The estimated technical efficiencies for individual systems and data years ranged from 55.8 to 100 percent with a mean of 80.8 percent. This indicates that on average, the closed-loop cooling systems are 80.8 percent efficient in using water to produce electric energy. This level of efficiency also implies that there is only a small potential for reducing the quantity of make-up water (i.e., water withdrawals) in cooling towers by improving the performance of existing systems in nuclear power plants.
The distribution of the technical efficiency scores in the data is shown on Figure VI-2. It indicates that 23 out of 38 observations have technical efficiency of cooling water use higher than 90 percent.
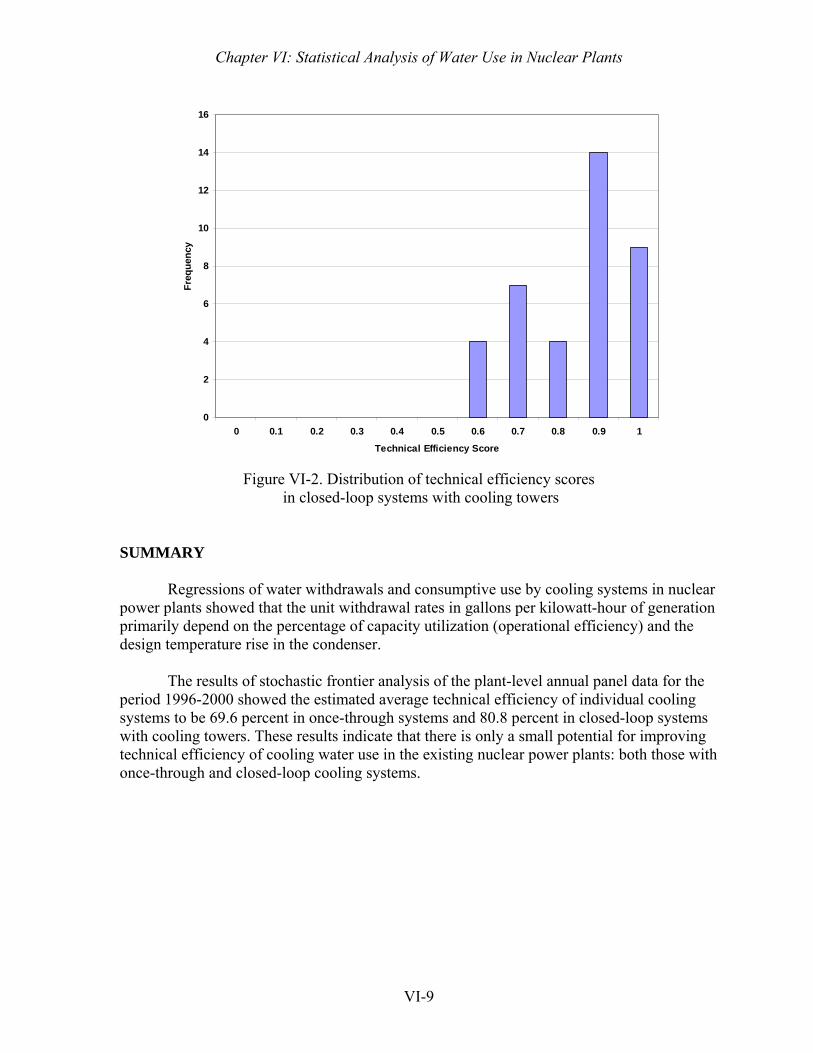
Chapter VI: Statistical Analysis of Water Use in Nuclear Plants
VI-9
0
2
4
6
8
10
12
14
16
0 0.1 0.2 0.3 0.4 0.5 0.6 0.7 0.8 0.9 1
Technical Efficiency Score
Freq
uenc
y
Figure VI-2. Distribution of technical efficiency scores
in closed-loop systems with cooling towers SUMMARY
Regressions of water withdrawals and consumptive use by cooling systems in nuclear power plants showed that the unit withdrawal rates in gallons per kilowatt-hour of generation primarily depend on the percentage of capacity utilization (operational efficiency) and the design temperature rise in the condenser.
The results of stochastic frontier analysis of the plant-level annual panel data for the period 1996-2000 showed the estimated average technical efficiency of individual cooling systems to be 69.6 percent in once-through systems and 80.8 percent in closed-loop systems with cooling towers. These results indicate that there is only a small potential for improving technical efficiency of cooling water use in the existing nuclear power plants: both those with once-through and closed-loop cooling systems.

VII-1
CHAPTER VII
WATER-USE BENCHMARKS PURPOSE
A necessary step in achieving water conservation and water demand management in
the thermoelectric sector of water use is the development of methods to determine appropriate indicator measures and benchmark values for the quantities of water used in the process of electricity generation. Therefore, the main goal of this study was to derive numeric benchmarks that would allow water managers at power plants and water resources management agencies to determine the optimal quantities of water for cooling purposes in thermoelectric generation. Such benchmarks are commonly used in business enterprises, public sector organizations and water utilities (Cromwell and Rubin, 1995; Kingdom et al., 1996; Ammons, 2001).
This chapter defines the efficiency-in-use benchmarks for different types of cooling
systems in thermoelectric generation plants. Benchmarks are developed for each type of cooling system using the results of the multiple regression and stochastic production frontier models presented in the previous chapters. The simplest benchmarks derived in this study are measures of average usage (both water withdrawals and consumptive use) expressed as the number of gallons per kilowatt-hour of net electricity generation. More detailed benchmark indicators are expressed as a function of more than one of the principal determinants of thermoelectric water withdrawals and consumptive use. TECHNICAL WATER-USE EFFICIENCY
The development of water-use benchmarks relies on the concept of efficiency-in-use.
This concept derives from engineering practice where it refers to the ratio of output to input, or technical efficiency. The criterion of technical efficiency is useful in comparing the performance of various products and processes. For example, in steam-electric generation, one cooling system would be considered more efficient than another if it could accomplish the same purpose (of condensing steam by cooling it) while using less water or other inputs (e.g., lower water pressure). In the water use sector, technical efficiency is often considered in the design of water dependent processes and facilities.
When the inputs and outputs are measured in value terms, an alternative expression of
efficiency is obtained and is referred to as economic efficiency. The concept of economic efficiency is based upon the assumptions of neoclassical economics, which presumes that producers will make rational decisions on the quantities of water to use in producing goods and services. However, the exceptionally small impact of the cost of water on production costs and the difficulty in translating water costs into observable unit prices make it unlikely that strictly economic behaviors will be able to completely explain quantities of water use in thermoelectric generation. The concept of efficiency-in-use, as applied in this study,
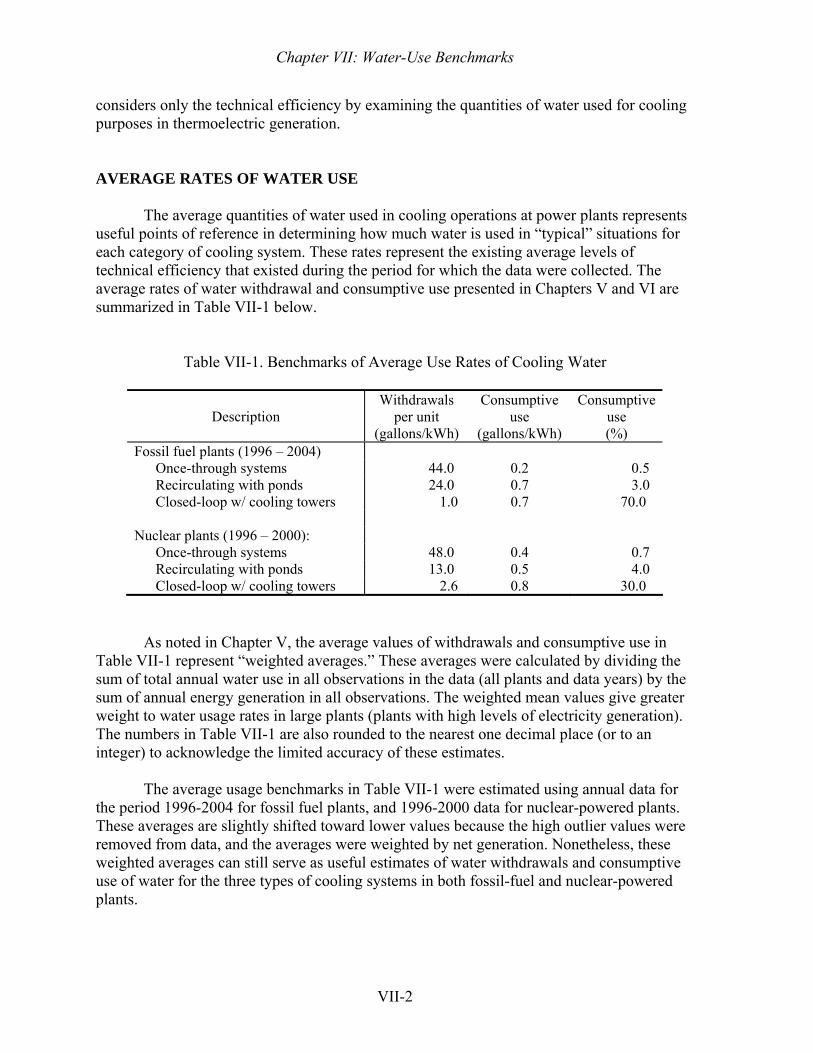
Chapter VII: Water-Use Benchmarks
VII-2
considers only the technical efficiency by examining the quantities of water used for cooling purposes in thermoelectric generation. AVERAGE RATES OF WATER USE
The average quantities of water used in cooling operations at power plants represents useful points of reference in determining how much water is used in “typical” situations for each category of cooling system. These rates represent the existing average levels of technical efficiency that existed during the period for which the data were collected. The average rates of water withdrawal and consumptive use presented in Chapters V and VI are summarized in Table VII-1 below.
Table VII-1. Benchmarks of Average Use Rates of Cooling Water
Description Withdrawals
per unit (gallons/kWh)
Consumptive use
(gallons/kWh)
Consumptive use (%)
Fossil fuel plants (1996 – 2004) Once-through systems 44.0 0.2 0.5 Recirculating with ponds 24.0 0.7 3.0 Closed-loop w/ cooling towers 1.0 0.7 70.0
Nuclear plants (1996 – 2000):
Once-through systems 48.0 0.4 0.7 Recirculating with ponds 13.0 0.5 4.0 Closed-loop w/ cooling towers 2.6 0.8 30.0
As noted in Chapter V, the average values of withdrawals and consumptive use in Table VII-1 represent “weighted averages.” These averages were calculated by dividing the sum of total annual water use in all observations in the data (all plants and data years) by the sum of annual energy generation in all observations. The weighted mean values give greater weight to water usage rates in large plants (plants with high levels of electricity generation). The numbers in Table VII-1 are also rounded to the nearest one decimal place (or to an integer) to acknowledge the limited accuracy of these estimates.
The average usage benchmarks in Table VII-1 were estimated using annual data for
the period 1996-2004 for fossil fuel plants, and 1996-2000 data for nuclear-powered plants. These averages are slightly shifted toward lower values because the high outlier values were removed from data, and the averages were weighted by net generation. Nonetheless, these weighted averages can still serve as useful estimates of water withdrawals and consumptive use of water for the three types of cooling systems in both fossil-fuel and nuclear-powered plants.
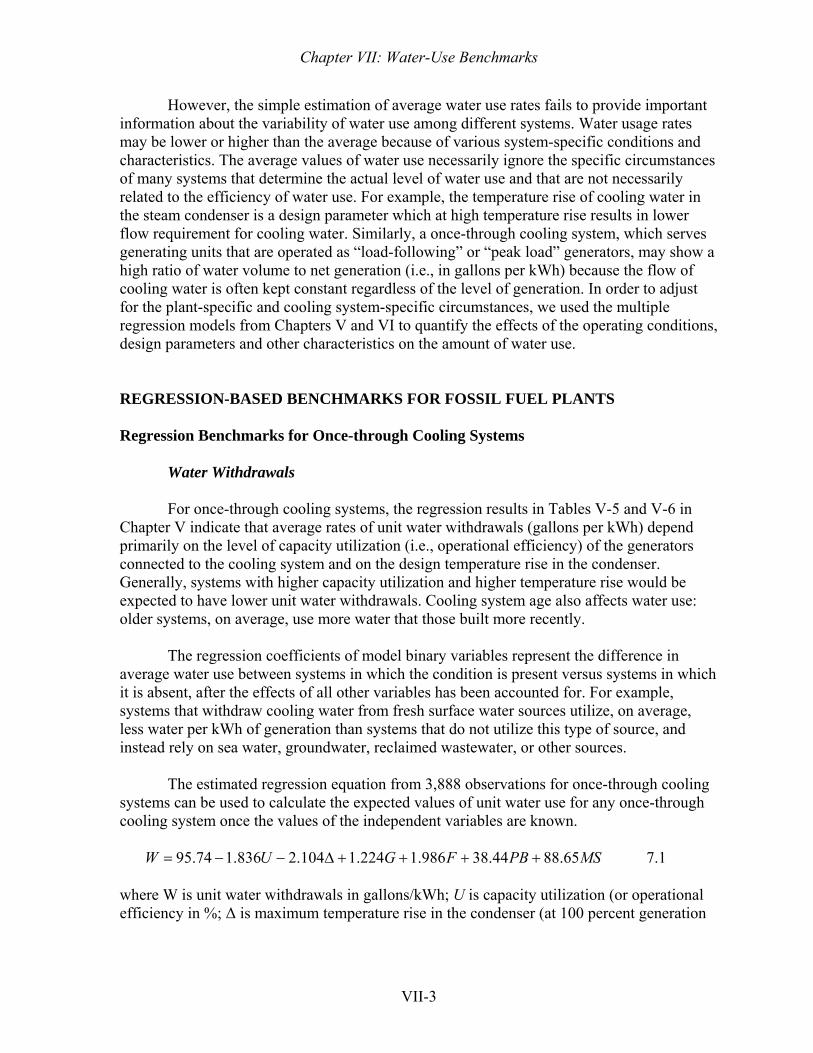
Chapter VII: Water-Use Benchmarks
VII-3
However, the simple estimation of average water use rates fails to provide important information about the variability of water use among different systems. Water usage rates may be lower or higher than the average because of various system-specific conditions and characteristics. The average values of water use necessarily ignore the specific circumstances of many systems that determine the actual level of water use and that are not necessarily related to the efficiency of water use. For example, the temperature rise of cooling water in the steam condenser is a design parameter which at high temperature rise results in lower flow requirement for cooling water. Similarly, a once-through cooling system, which serves generating units that are operated as “load-following” or “peak load” generators, may show a high ratio of water volume to net generation (i.e., in gallons per kWh) because the flow of cooling water is often kept constant regardless of the level of generation. In order to adjust for the plant-specific and cooling system-specific circumstances, we used the multiple regression models from Chapters V and VI to quantify the effects of the operating conditions, design parameters and other characteristics on the amount of water use. REGRESSION-BASED BENCHMARKS FOR FOSSIL FUEL PLANTS Regression Benchmarks for Once-through Cooling Systems
Water Withdrawals
For once-through cooling systems, the regression results in Tables V-5 and V-6 in Chapter V indicate that average rates of unit water withdrawals (gallons per kWh) depend primarily on the level of capacity utilization (i.e., operational efficiency) of the generators connected to the cooling system and on the design temperature rise in the condenser. Generally, systems with higher capacity utilization and higher temperature rise would be expected to have lower unit water withdrawals. Cooling system age also affects water use: older systems, on average, use more water that those built more recently.
The regression coefficients of model binary variables represent the difference in average water use between systems in which the condition is present versus systems in which it is absent, after the effects of all other variables has been accounted for. For example, systems that withdraw cooling water from fresh surface water sources utilize, on average, less water per kWh of generation than systems that do not utilize this type of source, and instead rely on sea water, groundwater, reclaimed wastewater, or other sources.
The estimated regression equation from 3,888 observations for once-through cooling systems can be used to calculate the expected values of unit water use for any once-through cooling system once the values of the independent variables are known.
MSPBFGUW 65.8844.38986.1224.1104.2836.174.95 ++++Δ−−= 7.1 where W is unit water withdrawals in gallons/kWh; U is capacity utilization (or operational efficiency in %; Δ is maximum temperature rise in the condenser (at 100 percent generation
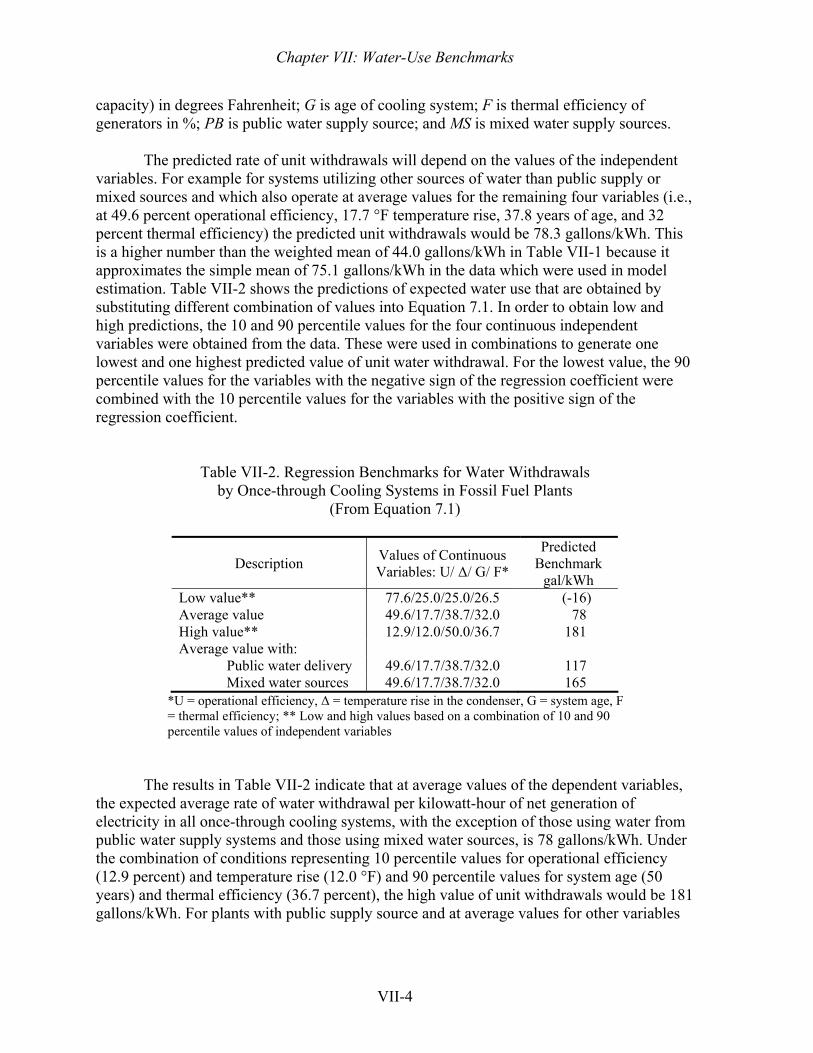
Chapter VII: Water-Use Benchmarks
VII-4
capacity) in degrees Fahrenheit; G is age of cooling system; F is thermal efficiency of generators in %; PB is public water supply source; and MS is mixed water supply sources.
The predicted rate of unit withdrawals will depend on the values of the independent variables. For example for systems utilizing other sources of water than public supply or mixed sources and which also operate at average values for the remaining four variables (i.e., at 49.6 percent operational efficiency, 17.7 °F temperature rise, 37.8 years of age, and 32 percent thermal efficiency) the predicted unit withdrawals would be 78.3 gallons/kWh. This is a higher number than the weighted mean of 44.0 gallons/kWh in Table VII-1 because it approximates the simple mean of 75.1 gallons/kWh in the data which were used in model estimation. Table VII-2 shows the predictions of expected water use that are obtained by substituting different combination of values into Equation 7.1. In order to obtain low and high predictions, the 10 and 90 percentile values for the four continuous independent variables were obtained from the data. These were used in combinations to generate one lowest and one highest predicted value of unit water withdrawal. For the lowest value, the 90 percentile values for the variables with the negative sign of the regression coefficient were combined with the 10 percentile values for the variables with the positive sign of the regression coefficient.
Table VII-2. Regression Benchmarks for Water Withdrawals by Once-through Cooling Systems in Fossil Fuel Plants
(From Equation 7.1)
Description Values of Continuous Variables: U/ Δ/ G/ F*
Predicted Benchmark
gal/kWh Low value** 77.6/25.0/25.0/26.5 (-16) Average value 49.6/17.7/38.7/32.0 78 High value** 12.9/12.0/50.0/36.7 181 Average value with: Public water delivery 49.6/17.7/38.7/32.0 117 Mixed water sources 49.6/17.7/38.7/32.0 165
*U = operational efficiency, Δ = temperature rise in the condenser, G = system age, F = thermal efficiency; ** Low and high values based on a combination of 10 and 90 percentile values of independent variables
The results in Table VII-2 indicate that at average values of the dependent variables, the expected average rate of water withdrawal per kilowatt-hour of net generation of electricity in all once-through cooling systems, with the exception of those using water from public water supply systems and those using mixed water sources, is 78 gallons/kWh. Under the combination of conditions representing 10 percentile values for operational efficiency (12.9 percent) and temperature rise (12.0 °F) and 90 percentile values for system age (50 years) and thermal efficiency (36.7 percent), the high value of unit withdrawals would be 181 gallons/kWh. For plants with public supply source and at average values for other variables
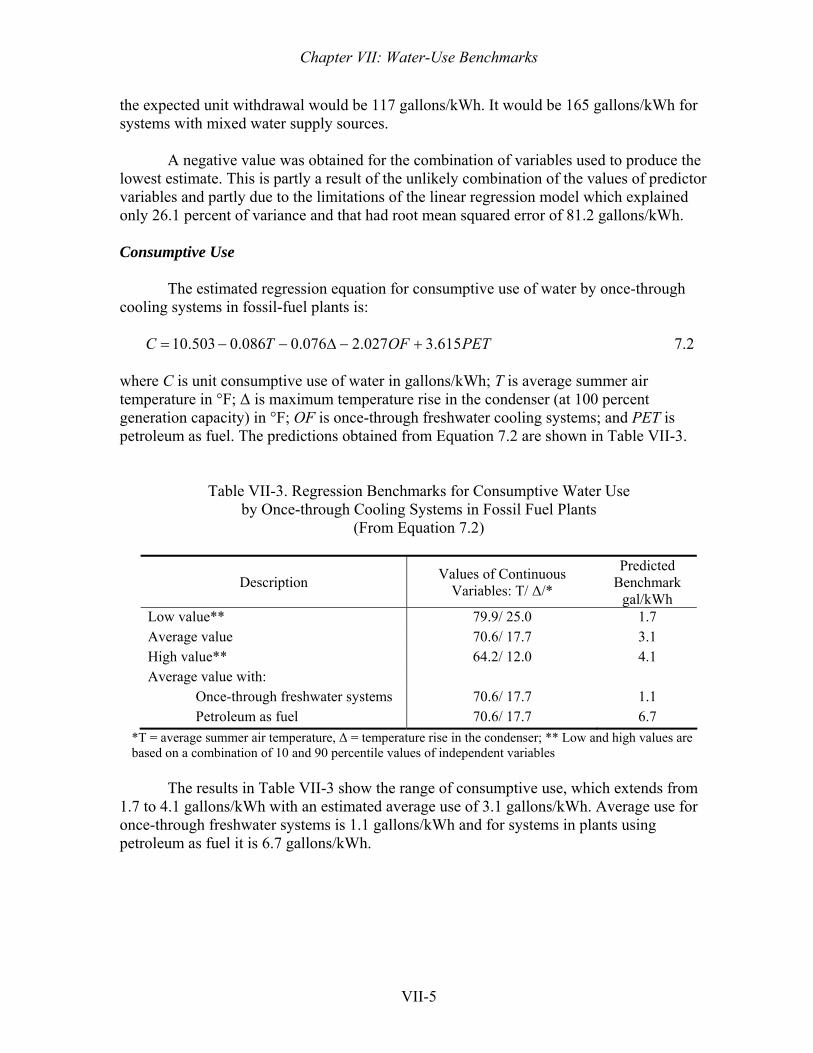
Chapter VII: Water-Use Benchmarks
VII-5
the expected unit withdrawal would be 117 gallons/kWh. It would be 165 gallons/kWh for systems with mixed water supply sources.
A negative value was obtained for the combination of variables used to produce the lowest estimate. This is partly a result of the unlikely combination of the values of predictor variables and partly due to the limitations of the linear regression model which explained only 26.1 percent of variance and that had root mean squared error of 81.2 gallons/kWh. Consumptive Use
The estimated regression equation for consumptive use of water by once-through cooling systems in fossil-fuel plants is:
PETOFTC 615.3027.2076.0086.0503.10 +−Δ−−= 7.2 where C is unit consumptive use of water in gallons/kWh; T is average summer air temperature in °F; Δ is maximum temperature rise in the condenser (at 100 percent generation capacity) in °F; OF is once-through freshwater cooling systems; and PET is petroleum as fuel. The predictions obtained from Equation 7.2 are shown in Table VII-3.
Table VII-3. Regression Benchmarks for Consumptive Water Use by Once-through Cooling Systems in Fossil Fuel Plants
(From Equation 7.2)
Description Values of Continuous Variables: T/ Δ/*
Predicted Benchmark
gal/kWh Low value** 79.9/ 25.0 1.7 Average value 70.6/ 17.7 3.1 High value** 64.2/ 12.0 4.1 Average value with: Once-through freshwater systems 70.6/ 17.7 1.1 Petroleum as fuel 70.6/ 17.7 6.7
*T = average summer air temperature, Δ = temperature rise in the condenser; ** Low and high values are based on a combination of 10 and 90 percentile values of independent variables
The results in Table VII-3 show the range of consumptive use, which extends from
1.7 to 4.1 gallons/kWh with an estimated average use of 3.1 gallons/kWh. Average use for once-through freshwater systems is 1.1 gallons/kWh and for systems in plants using petroleum as fuel it is 6.7 gallons/kWh.
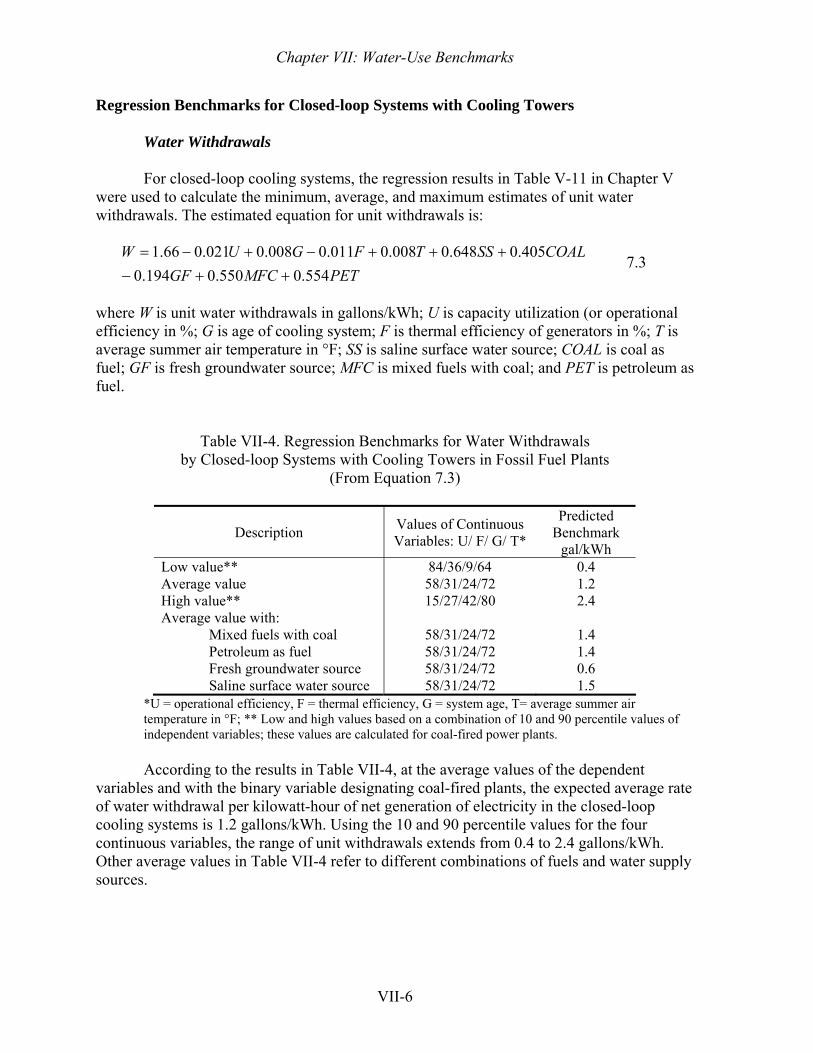
Chapter VII: Water-Use Benchmarks
VII-6
Regression Benchmarks for Closed-loop Systems with Cooling Towers Water Withdrawals For closed-loop cooling systems, the regression results in Table V-11 in Chapter V were used to calculate the minimum, average, and maximum estimates of unit water withdrawals. The estimated equation for unit withdrawals is:
PETMFCGFCOALSSTFGUW
554.0550.0194.0405.0648.0008.0011.0008.0021.066.1
++−+++−+−=
7.3
where W is unit water withdrawals in gallons/kWh; U is capacity utilization (or operational efficiency in %; G is age of cooling system; F is thermal efficiency of generators in %; T is average summer air temperature in °F; SS is saline surface water source; COAL is coal as fuel; GF is fresh groundwater source; MFC is mixed fuels with coal; and PET is petroleum as fuel.
Table VII-4. Regression Benchmarks for Water Withdrawals by Closed-loop Systems with Cooling Towers in Fossil Fuel Plants
(From Equation 7.3)
Description Values of Continuous Variables: U/ F/ G/ T*
Predicted Benchmark
gal/kWh Low value** 84/36/9/64 0.4 Average value 58/31/24/72 1.2 High value** 15/27/42/80 2.4 Average value with: Mixed fuels with coal 58/31/24/72 1.4 Petroleum as fuel 58/31/24/72 1.4 Fresh groundwater source 58/31/24/72 0.6 Saline surface water source 58/31/24/72 1.5
*U = operational efficiency, F = thermal efficiency, G = system age, T= average summer air temperature in °F; ** Low and high values based on a combination of 10 and 90 percentile values of independent variables; these values are calculated for coal-fired power plants.
According to the results in Table VII-4, at the average values of the dependent
variables and with the binary variable designating coal-fired plants, the expected average rate of water withdrawal per kilowatt-hour of net generation of electricity in the closed-loop cooling systems is 1.2 gallons/kWh. Using the 10 and 90 percentile values for the four continuous variables, the range of unit withdrawals extends from 0.4 to 2.4 gallons/kWh. Other average values in Table VII-4 refer to different combinations of fuels and water supply sources.
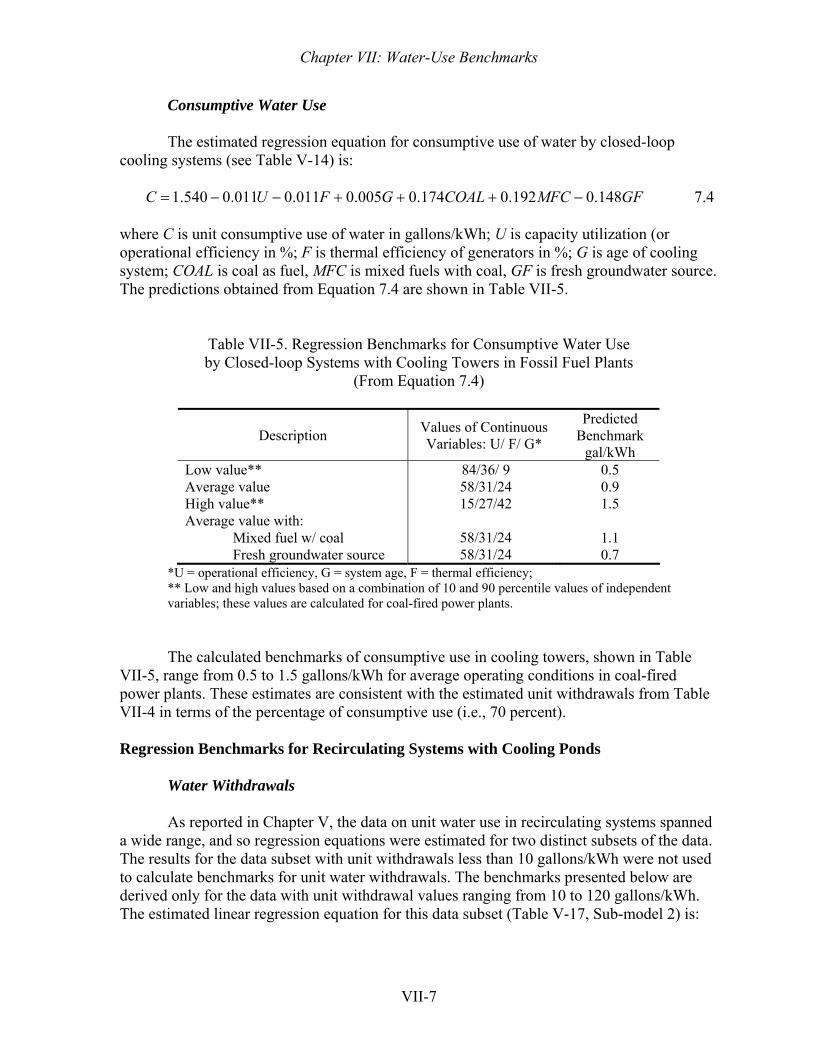
Chapter VII: Water-Use Benchmarks
VII-7
Consumptive Water Use
The estimated regression equation for consumptive use of water by closed-loop cooling systems (see Table V-14) is:
GFMFCCOALGFUC 148.0192.0174.0005.0011.0011.0540.1 −+++−−= 7.4 where C is unit consumptive use of water in gallons/kWh; U is capacity utilization (or operational efficiency in %; F is thermal efficiency of generators in %; G is age of cooling system; COAL is coal as fuel, MFC is mixed fuels with coal, GF is fresh groundwater source. The predictions obtained from Equation 7.4 are shown in Table VII-5.
Table VII-5. Regression Benchmarks for Consumptive Water Use by Closed-loop Systems with Cooling Towers in Fossil Fuel Plants
(From Equation 7.4)
Description Values of Continuous Variables: U/ F/ G*
Predicted Benchmark
gal/kWh Low value** 84/36/ 9 0.5 Average value 58/31/24 0.9 High value** 15/27/42 1.5 Average value with: Mixed fuel w/ coal 58/31/24 1.1 Fresh groundwater source 58/31/24 0.7
*U = operational efficiency, G = system age, F = thermal efficiency; ** Low and high values based on a combination of 10 and 90 percentile values of independent variables; these values are calculated for coal-fired power plants.
The calculated benchmarks of consumptive use in cooling towers, shown in Table VII-5, range from 0.5 to 1.5 gallons/kWh for average operating conditions in coal-fired power plants. These estimates are consistent with the estimated unit withdrawals from Table VII-4 in terms of the percentage of consumptive use (i.e., 70 percent). Regression Benchmarks for Recirculating Systems with Cooling Ponds Water Withdrawals
As reported in Chapter V, the data on unit water use in recirculating systems spanned a wide range, and so regression equations were estimated for two distinct subsets of the data. The results for the data subset with unit withdrawals less than 10 gallons/kWh were not used to calculate benchmarks for unit water withdrawals. The benchmarks presented below are derived only for the data with unit withdrawal values ranging from 10 to 120 gallons/kWh. The estimated linear regression equation for this data subset (Table V-17, Sub-model 2) is:
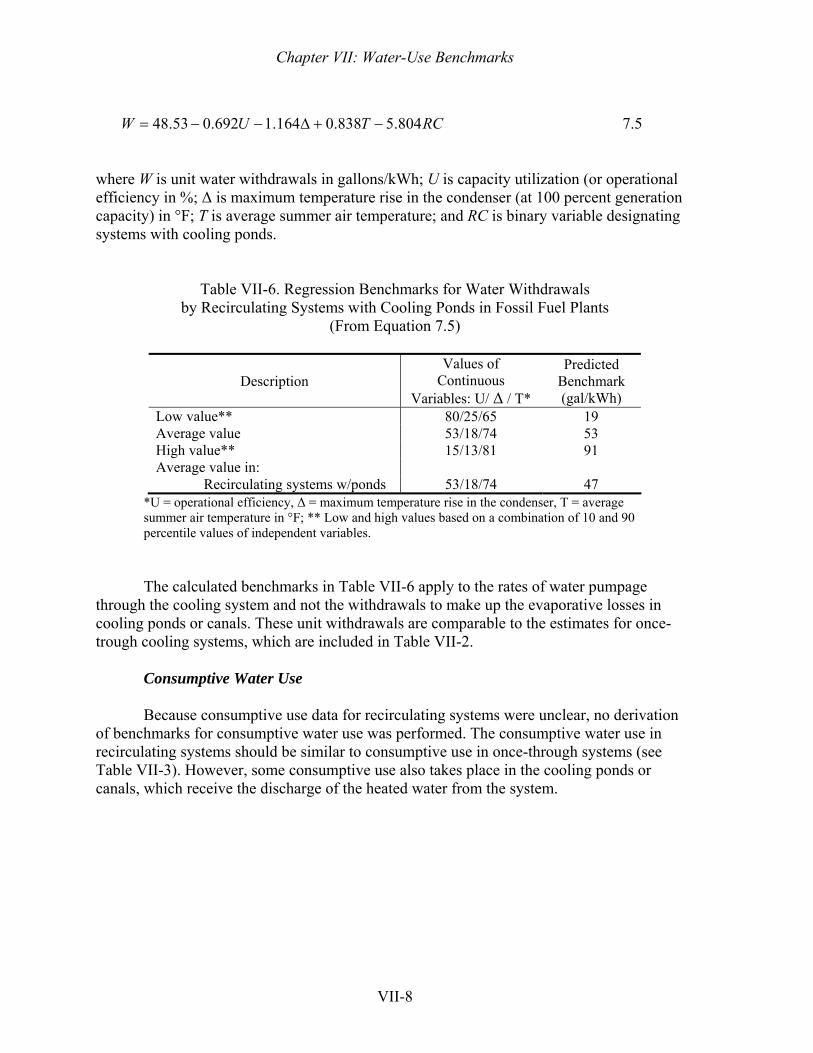
Chapter VII: Water-Use Benchmarks
VII-8
RCTUW 804.5838.0164.1692.053.48 −+Δ−−= 7.5
where W is unit water withdrawals in gallons/kWh; U is capacity utilization (or operational efficiency in %; Δ is maximum temperature rise in the condenser (at 100 percent generation capacity) in °F; T is average summer air temperature; and RC is binary variable designating systems with cooling ponds.
Table VII-6. Regression Benchmarks for Water Withdrawals
by Recirculating Systems with Cooling Ponds in Fossil Fuel Plants (From Equation 7.5)
Description Values of
Continuous Variables: U/ Δ / T*
Predicted Benchmark (gal/kWh)
Low value** 80/25/65 19 Average value 53/18/74 53 High value** 15/13/81 91 Average value in: Recirculating systems w/ponds 53/18/74 47
*U = operational efficiency, Δ = maximum temperature rise in the condenser, T = average summer air temperature in °F; ** Low and high values based on a combination of 10 and 90 percentile values of independent variables.
The calculated benchmarks in Table VII-6 apply to the rates of water pumpage through the cooling system and not the withdrawals to make up the evaporative losses in cooling ponds or canals. These unit withdrawals are comparable to the estimates for once-trough cooling systems, which are included in Table VII-2. Consumptive Water Use
Because consumptive use data for recirculating systems were unclear, no derivation of benchmarks for consumptive water use was performed. The consumptive water use in recirculating systems should be similar to consumptive use in once-through systems (see Table VII-3). However, some consumptive use also takes place in the cooling ponds or canals, which receive the discharge of the heated water from the system.
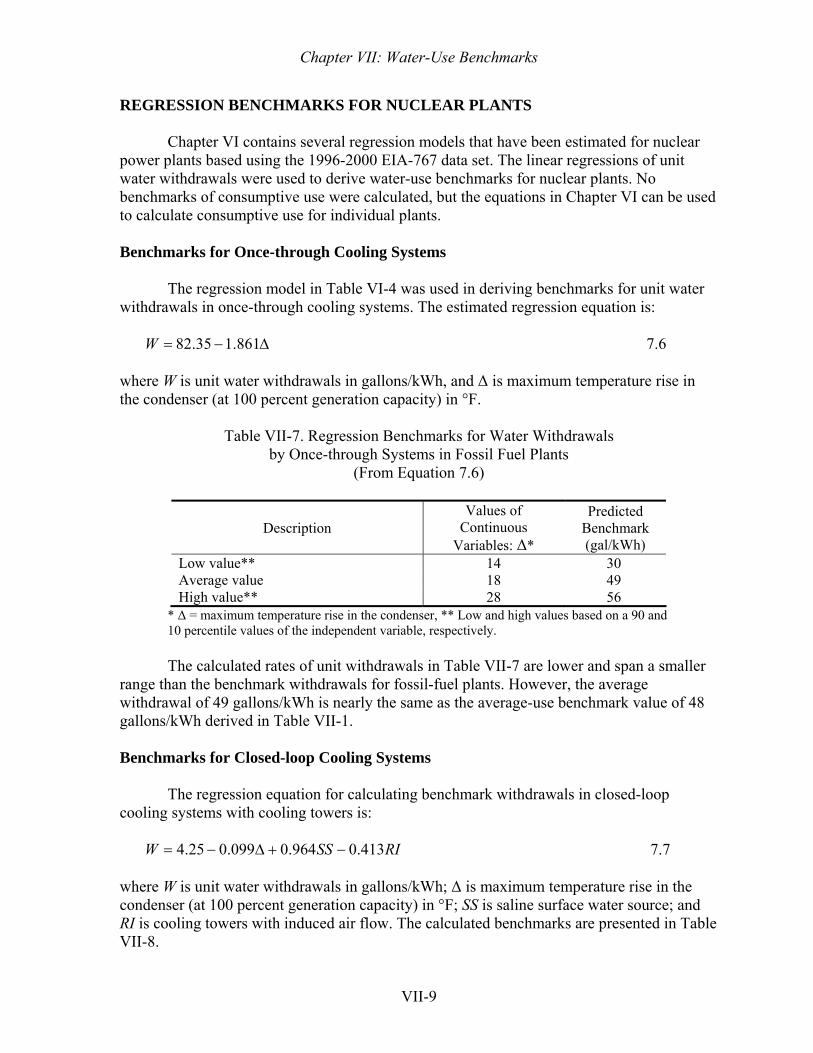
Chapter VII: Water-Use Benchmarks
VII-9
REGRESSION BENCHMARKS FOR NUCLEAR PLANTS
Chapter VI contains several regression models that have been estimated for nuclear power plants based using the 1996-2000 EIA-767 data set. The linear regressions of unit water withdrawals were used to derive water-use benchmarks for nuclear plants. No benchmarks of consumptive use were calculated, but the equations in Chapter VI can be used to calculate consumptive use for individual plants. Benchmarks for Once-through Cooling Systems
The regression model in Table VI-4 was used in deriving benchmarks for unit water withdrawals in once-through cooling systems. The estimated regression equation is:
Δ−= 861.135.82W 7.6 where W is unit water withdrawals in gallons/kWh, and Δ is maximum temperature rise in the condenser (at 100 percent generation capacity) in °F.
Table VII-7. Regression Benchmarks for Water Withdrawals by Once-through Systems in Fossil Fuel Plants
(From Equation 7.6)
Description Values of
Continuous Variables: Δ*
Predicted Benchmark (gal/kWh)
Low value** 14 30 Average value 18 49 High value** 28 56
* Δ = maximum temperature rise in the condenser, ** Low and high values based on a 90 and 10 percentile values of the independent variable, respectively.
The calculated rates of unit withdrawals in Table VII-7 are lower and span a smaller
range than the benchmark withdrawals for fossil-fuel plants. However, the average withdrawal of 49 gallons/kWh is nearly the same as the average-use benchmark value of 48 gallons/kWh derived in Table VII-1. Benchmarks for Closed-loop Cooling Systems
The regression equation for calculating benchmark withdrawals in closed-loop cooling systems with cooling towers is:
RISSW 413.0964.0099.025.4 −+Δ−= 7.7
where W is unit water withdrawals in gallons/kWh; Δ is maximum temperature rise in the condenser (at 100 percent generation capacity) in °F; SS is saline surface water source; and RI is cooling towers with induced air flow. The calculated benchmarks are presented in Table VII-8.
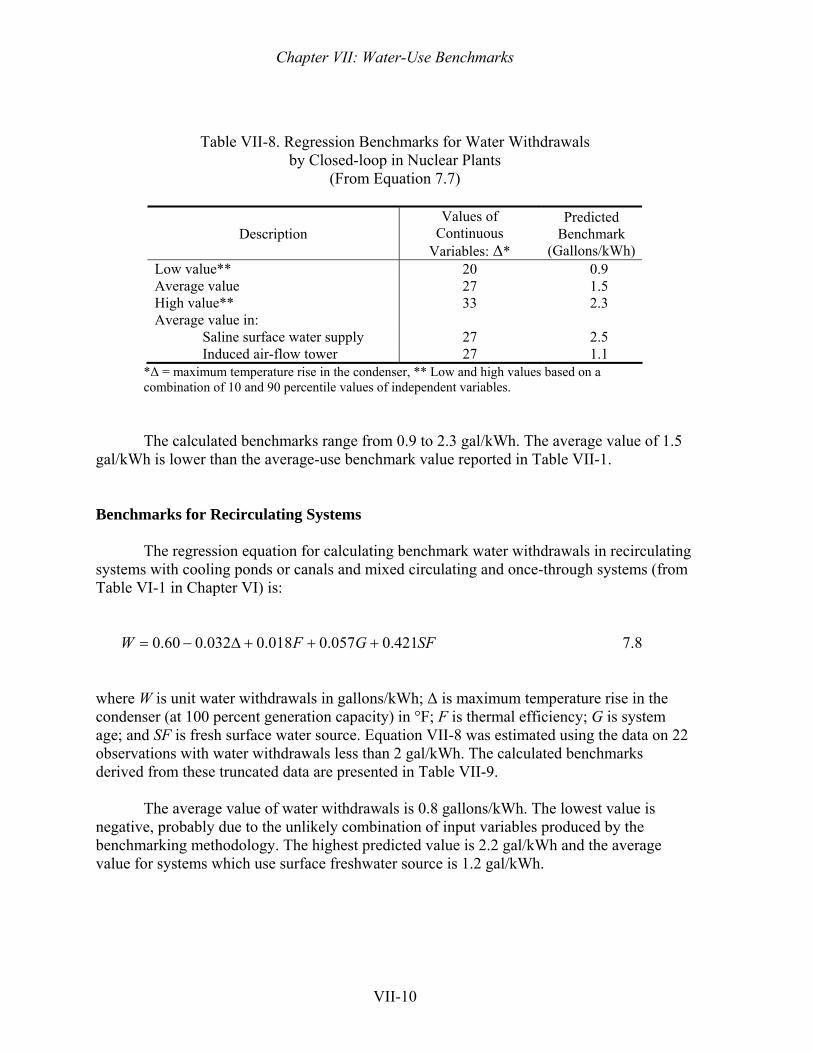
Chapter VII: Water-Use Benchmarks
VII-10
Table VII-8. Regression Benchmarks for Water Withdrawals by Closed-loop in Nuclear Plants
(From Equation 7.7)
Description Values of
Continuous Variables: Δ*
Predicted Benchmark
(Gallons/kWh) Low value** 20 0.9 Average value 27 1.5 High value** 33 2.3 Average value in: Saline surface water supply 27 2.5 Induced air-flow tower 27 1.1
*Δ = maximum temperature rise in the condenser, ** Low and high values based on a combination of 10 and 90 percentile values of independent variables.
The calculated benchmarks range from 0.9 to 2.3 gal/kWh. The average value of 1.5 gal/kWh is lower than the average-use benchmark value reported in Table VII-1. Benchmarks for Recirculating Systems
The regression equation for calculating benchmark water withdrawals in recirculating systems with cooling ponds or canals and mixed circulating and once-through systems (from Table VI-1 in Chapter VI) is:
SFGFW 421.0057.0018.0032.060.0 +++Δ−= 7.8
where W is unit water withdrawals in gallons/kWh; Δ is maximum temperature rise in the condenser (at 100 percent generation capacity) in °F; F is thermal efficiency; G is system age; and SF is fresh surface water source. Equation VII-8 was estimated using the data on 22 observations with water withdrawals less than 2 gal/kWh. The calculated benchmarks derived from these truncated data are presented in Table VII-9.
The average value of water withdrawals is 0.8 gallons/kWh. The lowest value is
negative, probably due to the unlikely combination of input variables produced by the benchmarking methodology. The highest predicted value is 2.2 gal/kWh and the average value for systems which use surface freshwater source is 1.2 gal/kWh.
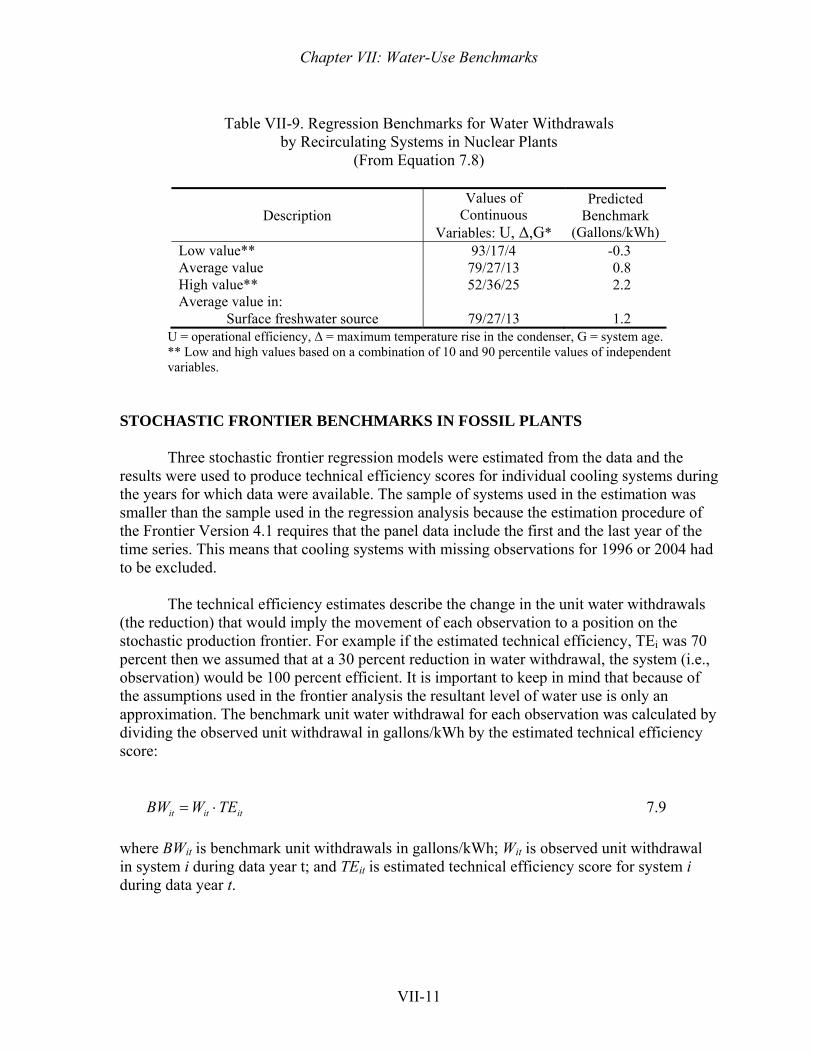
Chapter VII: Water-Use Benchmarks
VII-11
Table VII-9. Regression Benchmarks for Water Withdrawals
by Recirculating Systems in Nuclear Plants (From Equation 7.8)
Description Values of
Continuous Variables: U, Δ,G*
Predicted Benchmark
(Gallons/kWh)Low value** 93/17/4 -0.3 Average value 79/27/13 0.8 High value** 52/36/25 2.2 Average value in: Surface freshwater source 79/27/13 1.2
U = operational efficiency, Δ = maximum temperature rise in the condenser, G = system age. ** Low and high values based on a combination of 10 and 90 percentile values of independent variables.
STOCHASTIC FRONTIER BENCHMARKS IN FOSSIL PLANTS
Three stochastic frontier regression models were estimated from the data and the results were used to produce technical efficiency scores for individual cooling systems during the years for which data were available. The sample of systems used in the estimation was smaller than the sample used in the regression analysis because the estimation procedure of the Frontier Version 4.1 requires that the panel data include the first and the last year of the time series. This means that cooling systems with missing observations for 1996 or 2004 had to be excluded.
The technical efficiency estimates describe the change in the unit water withdrawals (the reduction) that would imply the movement of each observation to a position on the stochastic production frontier. For example if the estimated technical efficiency, TEi was 70 percent then we assumed that at a 30 percent reduction in water withdrawal, the system (i.e., observation) would be 100 percent efficient. It is important to keep in mind that because of the assumptions used in the frontier analysis the resultant level of water use is only an approximation. The benchmark unit water withdrawal for each observation was calculated by dividing the observed unit withdrawal in gallons/kWh by the estimated technical efficiency score:
ititit TEWBW ⋅= 7.9 where BWit is benchmark unit withdrawals in gallons/kWh; Wit is observed unit withdrawal in system i during data year t; and TEit is estimated technical efficiency score for system i during data year t.
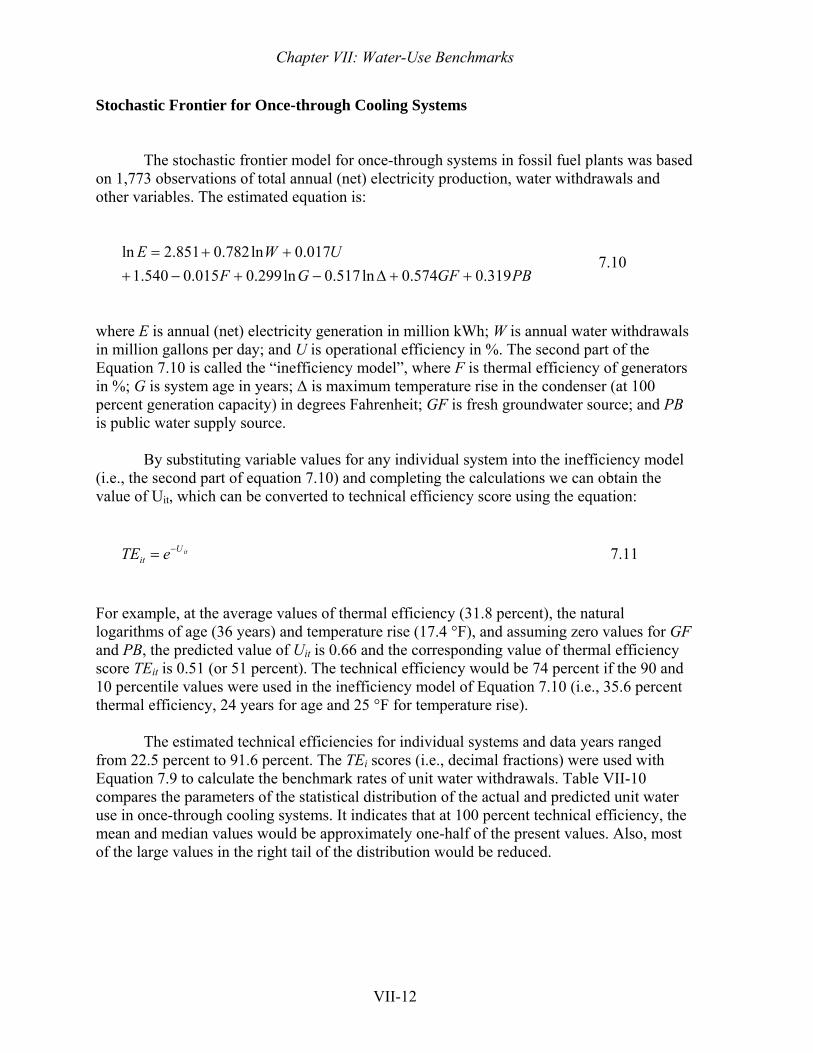
Chapter VII: Water-Use Benchmarks
VII-12
Stochastic Frontier for Once-through Cooling Systems
The stochastic frontier model for once-through systems in fossil fuel plants was based
on 1,773 observations of total annual (net) electricity production, water withdrawals and other variables. The estimated equation is:
PBGFGFUWE
319.0574.0ln517.0ln299.0015.0540.1017.0ln782.0851.2ln
++Δ−+−+++= 7.10
where E is annual (net) electricity generation in million kWh; W is annual water withdrawals in million gallons per day; and U is operational efficiency in %. The second part of the Equation 7.10 is called the “inefficiency model”, where F is thermal efficiency of generators in %; G is system age in years; Δ is maximum temperature rise in the condenser (at 100 percent generation capacity) in degrees Fahrenheit; GF is fresh groundwater source; and PB is public water supply source.
By substituting variable values for any individual system into the inefficiency model (i.e., the second part of equation 7.10) and completing the calculations we can obtain the value of Uit, which can be converted to technical efficiency score using the equation:
itUit eTE −= 7.11
For example, at the average values of thermal efficiency (31.8 percent), the natural logarithms of age (36 years) and temperature rise (17.4 °F), and assuming zero values for GF and PB, the predicted value of Uit is 0.66 and the corresponding value of thermal efficiency score TEit is 0.51 (or 51 percent). The technical efficiency would be 74 percent if the 90 and 10 percentile values were used in the inefficiency model of Equation 7.10 (i.e., 35.6 percent thermal efficiency, 24 years for age and 25 °F for temperature rise).
The estimated technical efficiencies for individual systems and data years ranged from 22.5 percent to 91.6 percent. The TEi scores (i.e., decimal fractions) were used with Equation 7.9 to calculate the benchmark rates of unit water withdrawals. Table VII-10 compares the parameters of the statistical distribution of the actual and predicted unit water use in once-through cooling systems. It indicates that at 100 percent technical efficiency, the mean and median values would be approximately one-half of the present values. Also, most of the large values in the right tail of the distribution would be reduced.
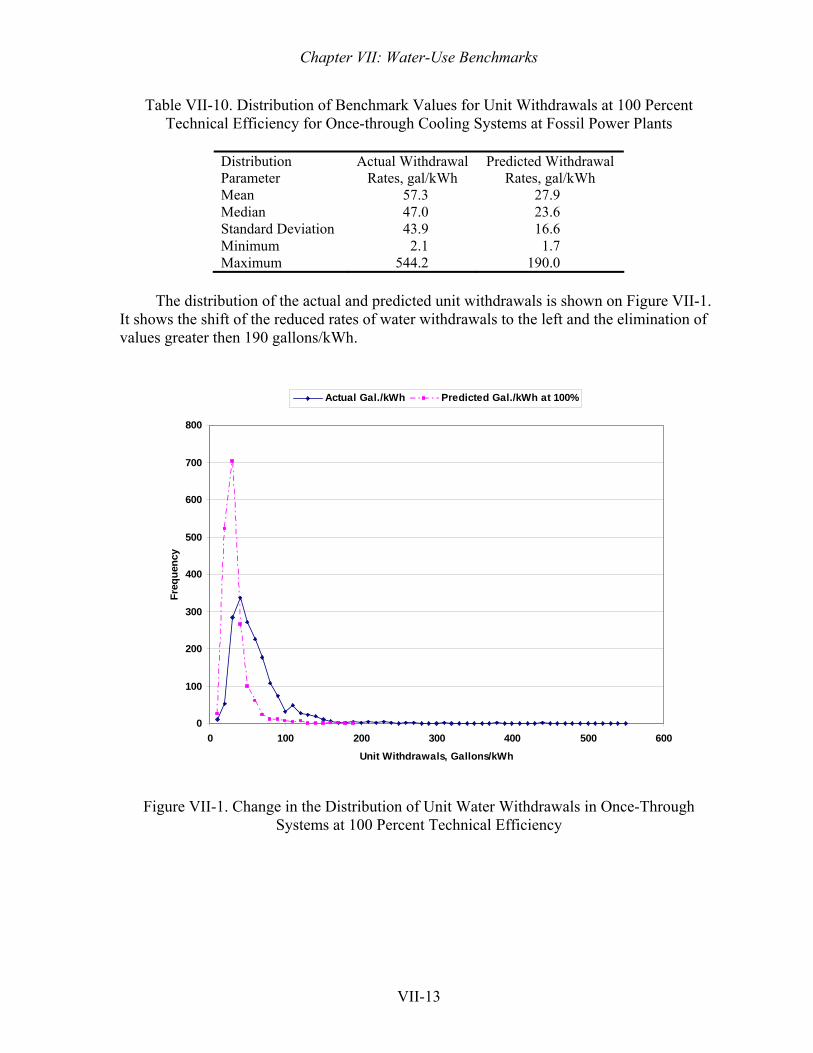
Chapter VII: Water-Use Benchmarks
VII-13
Table VII-10. Distribution of Benchmark Values for Unit Withdrawals at 100 Percent Technical Efficiency for Once-through Cooling Systems at Fossil Power Plants
Distribution Parameter
Actual Withdrawal Rates, gal/kWh
Predicted Withdrawal Rates, gal/kWh
Mean 57.3 27.9 Median 47.0 23.6 Standard Deviation 43.9 16.6 Minimum 2.1 1.7 Maximum 544.2 190.0
The distribution of the actual and predicted unit withdrawals is shown on Figure VII-1.
It shows the shift of the reduced rates of water withdrawals to the left and the elimination of values greater then 190 gallons/kWh.
0
100
200
300
400
500
600
700
800
0 100 200 300 400 500 600
Unit Withdrawals, Gallons/kWh
Freq
uenc
y
Actual Gal./kWh Predicted Gal./kWh at 100%
Figure VII-1. Change in the Distribution of Unit Water Withdrawals in Once-Through Systems at 100 Percent Technical Efficiency
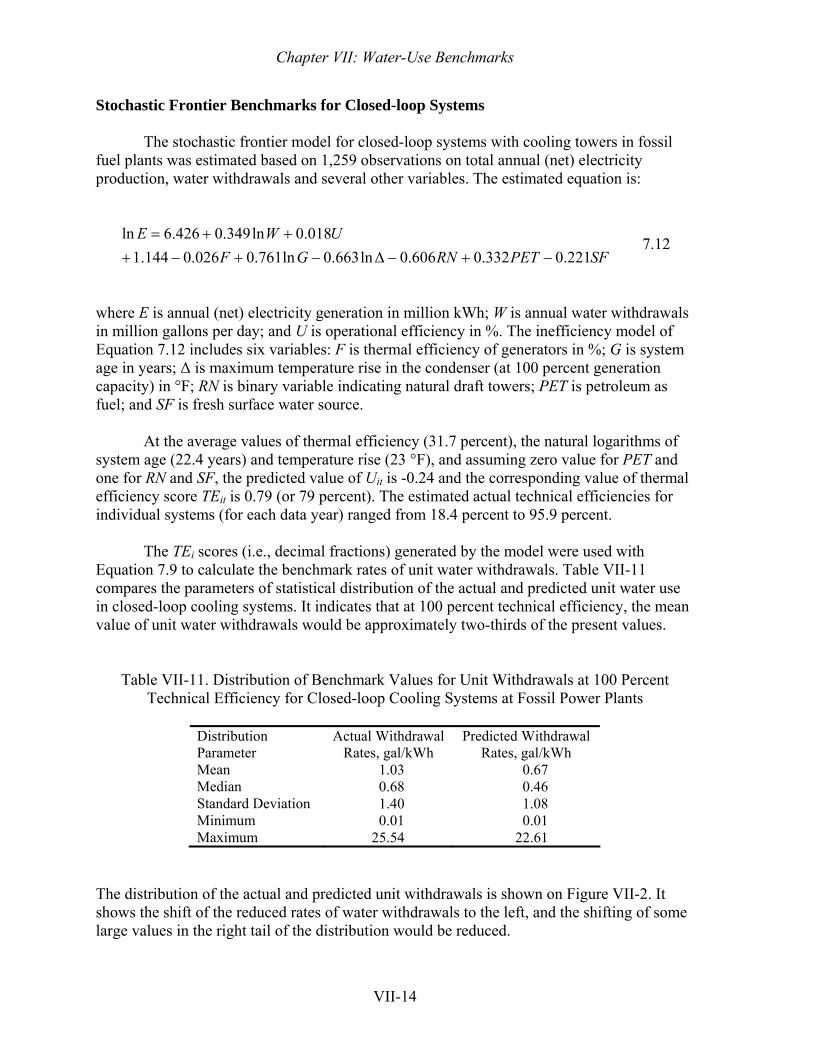
Chapter VII: Water-Use Benchmarks
VII-14
Stochastic Frontier Benchmarks for Closed-loop Systems
The stochastic frontier model for closed-loop systems with cooling towers in fossil fuel plants was estimated based on 1,259 observations on total annual (net) electricity production, water withdrawals and several other variables. The estimated equation is:
SFPETRNGFUWE
221.0332.0606.0ln663.0ln761.0026.0144.1018.0ln349.0426.6ln
−+−Δ−+−+++= 7.12
where E is annual (net) electricity generation in million kWh; W is annual water withdrawals in million gallons per day; and U is operational efficiency in %. The inefficiency model of Equation 7.12 includes six variables: F is thermal efficiency of generators in %; G is system age in years; Δ is maximum temperature rise in the condenser (at 100 percent generation capacity) in °F; RN is binary variable indicating natural draft towers; PET is petroleum as fuel; and SF is fresh surface water source.
At the average values of thermal efficiency (31.7 percent), the natural logarithms of system age (22.4 years) and temperature rise (23 °F), and assuming zero value for PET and one for RN and SF, the predicted value of Uit is -0.24 and the corresponding value of thermal efficiency score TEit is 0.79 (or 79 percent). The estimated actual technical efficiencies for individual systems (for each data year) ranged from 18.4 percent to 95.9 percent.
The TEi scores (i.e., decimal fractions) generated by the model were used with
Equation 7.9 to calculate the benchmark rates of unit water withdrawals. Table VII-11 compares the parameters of statistical distribution of the actual and predicted unit water use in closed-loop cooling systems. It indicates that at 100 percent technical efficiency, the mean value of unit water withdrawals would be approximately two-thirds of the present values.
Table VII-11. Distribution of Benchmark Values for Unit Withdrawals at 100 Percent Technical Efficiency for Closed-loop Cooling Systems at Fossil Power Plants
Distribution Parameter
Actual Withdrawal Rates, gal/kWh
Predicted Withdrawal Rates, gal/kWh
Mean 1.03 0.67 Median 0.68 0.46 Standard Deviation 1.40 1.08 Minimum 0.01 0.01 Maximum 25.54 22.61
The distribution of the actual and predicted unit withdrawals is shown on Figure VII-2. It shows the shift of the reduced rates of water withdrawals to the left, and the shifting of some large values in the right tail of the distribution would be reduced.
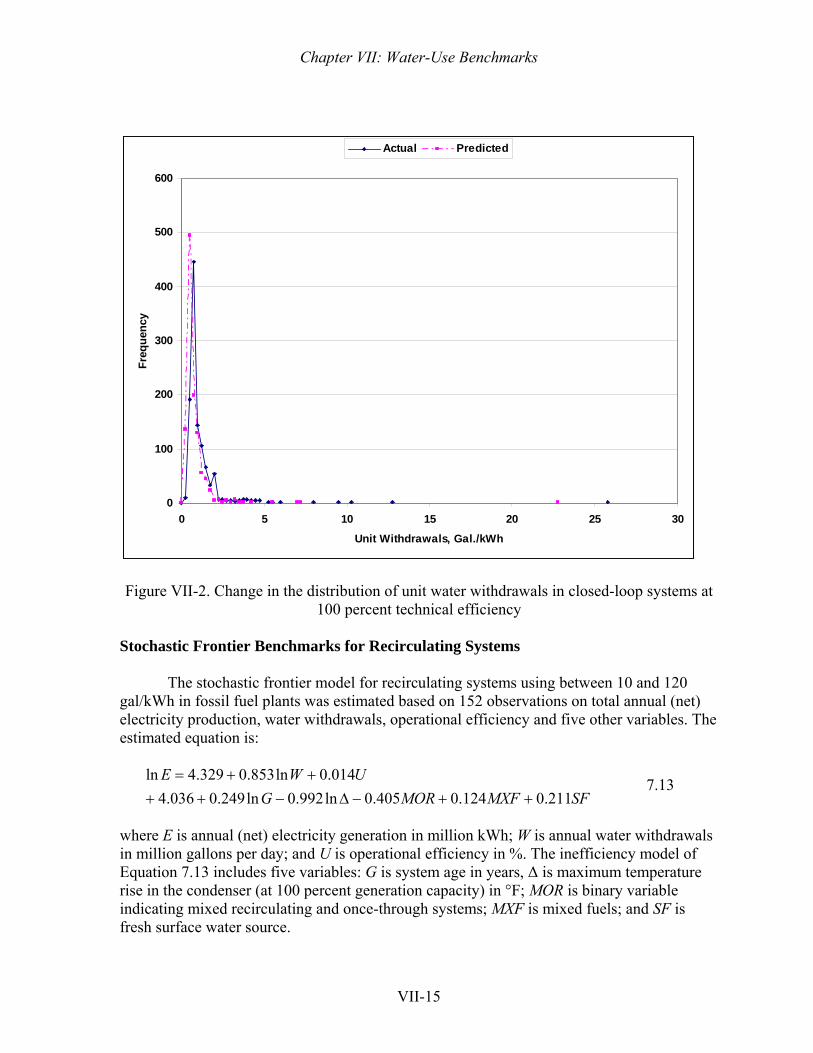
Chapter VII: Water-Use Benchmarks
VII-15
0
100
200
300
400
500
600
0 5 10 15 20 25 30
Unit Withdrawals, Gal./kWh
Freq
uenc
yActual Predicted
Figure VII-2. Change in the distribution of unit water withdrawals in closed-loop systems at
100 percent technical efficiency Stochastic Frontier Benchmarks for Recirculating Systems
The stochastic frontier model for recirculating systems using between 10 and 120
gal/kWh in fossil fuel plants was estimated based on 152 observations on total annual (net) electricity production, water withdrawals, operational efficiency and five other variables. The estimated equation is:
SFMXFMORGUWE
211.0124.0405.0ln992.0ln249.0036.4014.0ln853.0329.4ln
++−Δ−++++= 7.13
where E is annual (net) electricity generation in million kWh; W is annual water withdrawals in million gallons per day; and U is operational efficiency in %. The inefficiency model of Equation 7.13 includes five variables: G is system age in years, Δ is maximum temperature rise in the condenser (at 100 percent generation capacity) in °F; MOR is binary variable indicating mixed recirculating and once-through systems; MXF is mixed fuels; and SF is fresh surface water source.
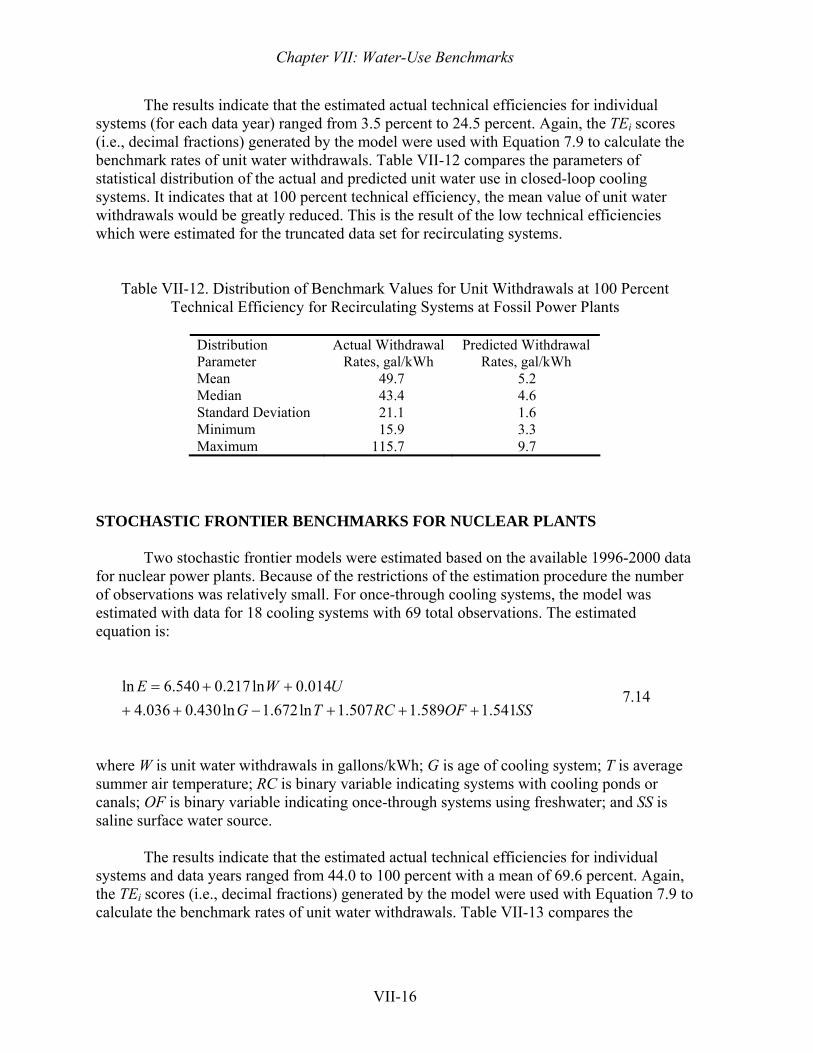
Chapter VII: Water-Use Benchmarks
VII-16
The results indicate that the estimated actual technical efficiencies for individual systems (for each data year) ranged from 3.5 percent to 24.5 percent. Again, the TEi scores (i.e., decimal fractions) generated by the model were used with Equation 7.9 to calculate the benchmark rates of unit water withdrawals. Table VII-12 compares the parameters of statistical distribution of the actual and predicted unit water use in closed-loop cooling systems. It indicates that at 100 percent technical efficiency, the mean value of unit water withdrawals would be greatly reduced. This is the result of the low technical efficiencies which were estimated for the truncated data set for recirculating systems.
Table VII-12. Distribution of Benchmark Values for Unit Withdrawals at 100 Percent Technical Efficiency for Recirculating Systems at Fossil Power Plants
Distribution Parameter
Actual Withdrawal Rates, gal/kWh
Predicted Withdrawal Rates, gal/kWh
Mean 49.7 5.2 Median 43.4 4.6 Standard Deviation 21.1 1.6 Minimum 15.9 3.3 Maximum 115.7 9.7
STOCHASTIC FRONTIER BENCHMARKS FOR NUCLEAR PLANTS
Two stochastic frontier models were estimated based on the available 1996-2000 data for nuclear power plants. Because of the restrictions of the estimation procedure the number of observations was relatively small. For once-through cooling systems, the model was estimated with data for 18 cooling systems with 69 total observations. The estimated equation is:
SSOFRCTGUWE
541.1589.1507.1ln672.1ln430.0036.4014.0ln217.0540.6ln
+++−++++= 7.14
where W is unit water withdrawals in gallons/kWh; G is age of cooling system; T is average summer air temperature; RC is binary variable indicating systems with cooling ponds or canals; OF is binary variable indicating once-through systems using freshwater; and SS is saline surface water source.
The results indicate that the estimated actual technical efficiencies for individual systems and data years ranged from 44.0 to 100 percent with a mean of 69.6 percent. Again, the TEi scores (i.e., decimal fractions) generated by the model were used with Equation 7.9 to calculate the benchmark rates of unit water withdrawals. Table VII-13 compares the
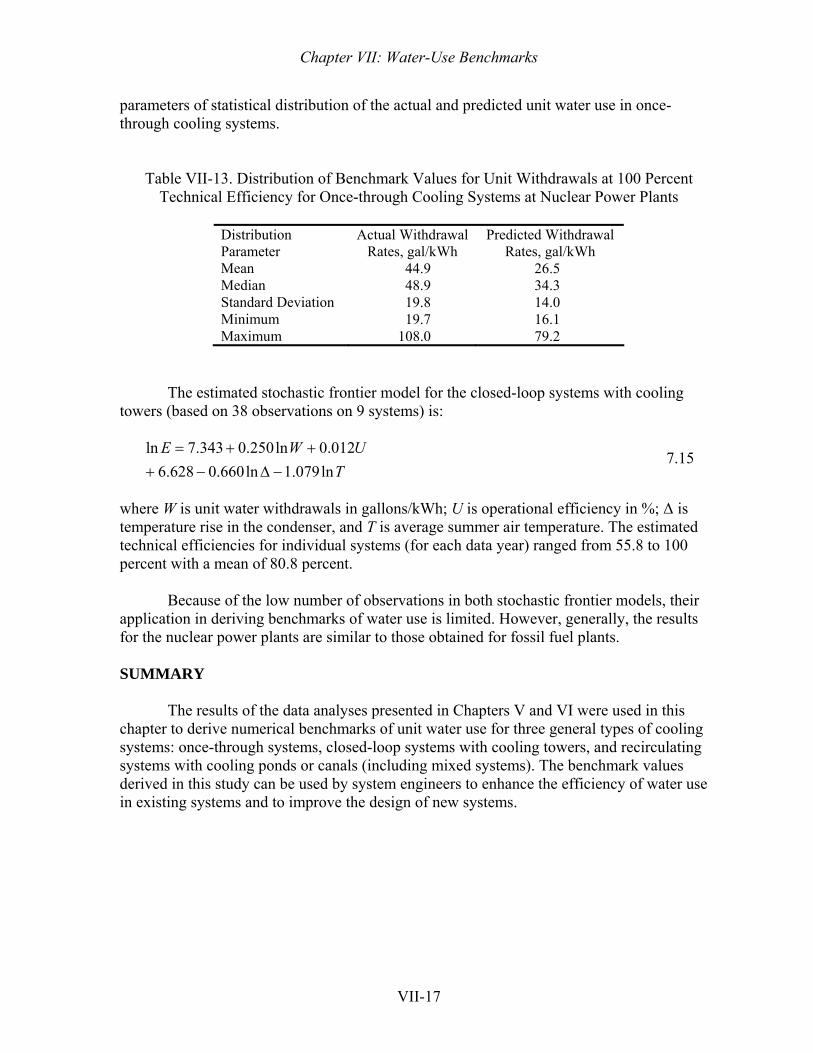
Chapter VII: Water-Use Benchmarks
VII-17
parameters of statistical distribution of the actual and predicted unit water use in once-through cooling systems.
Table VII-13. Distribution of Benchmark Values for Unit Withdrawals at 100 Percent Technical Efficiency for Once-through Cooling Systems at Nuclear Power Plants
Distribution Parameter
Actual Withdrawal Rates, gal/kWh
Predicted Withdrawal Rates, gal/kWh
Mean 44.9 26.5 Median 48.9 34.3 Standard Deviation 19.8 14.0 Minimum 19.7 16.1 Maximum 108.0 79.2
The estimated stochastic frontier model for the closed-loop systems with cooling towers (based on 38 observations on 9 systems) is:
TUWE
ln079.1ln660.0628.6012.0ln250.0343.7ln
−Δ−+++= 7.15
where W is unit water withdrawals in gallons/kWh; U is operational efficiency in %; Δ is temperature rise in the condenser, and T is average summer air temperature. The estimated technical efficiencies for individual systems (for each data year) ranged from 55.8 to 100 percent with a mean of 80.8 percent.
Because of the low number of observations in both stochastic frontier models, their
application in deriving benchmarks of water use is limited. However, generally, the results for the nuclear power plants are similar to those obtained for fossil fuel plants. SUMMARY
The results of the data analyses presented in Chapters V and VI were used in this chapter to derive numerical benchmarks of unit water use for three general types of cooling systems: once-through systems, closed-loop systems with cooling towers, and recirculating systems with cooling ponds or canals (including mixed systems). The benchmark values derived in this study can be used by system engineers to enhance the efficiency of water use in existing systems and to improve the design of new systems.

VIII-1
CHAPTER VIII
CONCLUSIONS AND RECOMMENDATIONS
The purpose of this study was to examine water use at electric power plants and determine both the average rates of water withdrawals and consumptive use as well as to estimate the levels of water usage of the most water-efficient cooling systems. This was accomplished by examining data maintained by the Energy Information Agency of the U.S. Department of Energy and information obtained directly from a sample of power plants.
An important insight achieved through this study is that water conservation is not a priority at the thermal power plants with water-cooled steam turbine generators. Plants with once-through cooling systems are considered to have negligible consumptive use, and their primary water use concerns are limited to the protection of fish at intake screens and the impacts of thermal pollution on the receiving water bodies. In closed-loop systems with cooling towers, large amounts of water are being recirculated through the cooling system but the main concerns are water quality, to prevent the fouling of the cooling system, and vapor drift from cooling towers. Finally, in recirculating systems with cooling ponds or canals, plant managers are concerned mostly with achieving sufficient mixing of water to prevent excessive increases of the water temperature at facility cooling water intakes. The quantity of water pumped through the condensers or the volume lost to evaporation in cooling towers or cooling ponds, while understood and taken into consideration in controlling production costs, are not a primary focus of system managers. Their main concern is power generation and the reliable functioning of the cooling system.
Nevertheless, several participants of this study indicated that better knowledge of water usage rates would be helpful in optimizing the operations of their power plants and that the efficient water-use benchmarks can be most helpful in designing new cooling systems or in retrofitting existing systems. Therefore, the key findings and recommendations of this study focused on their potential applicability to the design and operation of the existing and future power plants and cooling systems. STUDY FINDINGS
The review of pertinent literature, site visits, questionnaire surveys, and analysis of annual data on water withdrawals and consumptive use in thermoelectric power generation revealed several important findings: 1. The estimated water withdrawals and consumptive use per kilowatt-hour of net
generation of electricity show very high variability among different power plants using the same type of cooling systems. The main reason for this variability is the mode of operation of electric generators. Unit water use per kilowatt-hour tends to be lower for cooling systems at “base-load” plants running nearly constantly at high levels of capacity utilization and it tends to be higher in “load following” and “peak load” plants operating at low levels of capacity utilization.

Chapter VIII: Conclusions and Recommendations
VIII-2
2. Once-through cooling systems withdraw the largest quantities of water per kilowatt-hour of generation (on average between 40 and 50 gallons/kWh) but have the lowest consumptive use within the plant (i.e., less than 1 percent of withdrawals). No data on increased evaporation in the receiving water bodies was obtained as a part of this study. The variability of unit water withdrawals among different once-through cooling systems was found to be primarily a function of the operational efficiency (i.e., percent of capacity utilization), designed maximum temperature rise of the condenser, and, to a lesser extent, the age of the cooling system and thermal efficiency of the generators. Lower usage rates were found in recently built systems with high operational efficiency and high temperature rise in the condenser and high thermal efficiency.
3. In closed-loop cooling systems with cooling towers, the average unit withdrawal is
approximately 1.0 gallon/kWh of net electric energy generation with a consumptive use of approximately 70 percent of water withdrawn. The amount of withdrawals for make-up water intake in cooling towers was also found to depend on operational efficiency, thermal efficiency, and system age. The design temperature rise in the condenser was found to be less important than in once-through cooling systems.
4. The withdrawal rates and consumptive use in the recirculating systems with cooling
ponds and canals (and other recirculating and mixed systems) fall between the values for once-through and closed-loop systems. However, the data for these systems are often inconsistent in whether the consumptive use estimate includes both losses to evaporation in cooling ponds as well as the quantities that are pumped through the condensers. In systems reporting withdrawals between 10 and 120 gallons/kWh, the variability of unit withdrawals are found to be a function of operational efficiency, temperature rise, and average summer air temperature at the plant location.
5. In all three types of cooling systems, the observed rates of water withdrawals were also
found to depend on the type of water source and the type of fuel. On average, systems relying on fresh groundwater or public water supply used less water than systems relying on fresh surface water or saline water. With respect to fuel type, plants burning coal, coal mixtures, or petroleum tended to have higher water usage than plants burning natural gas.
6. Nuclear power plants usually operate as base-load generators and tend to have lower
variability of water withdrawal and consumptive use rates; although, the average rates of water usage per kilowatt-hour of net generation are close to those for fossil-fuel plants that have the same cooling system characteristics.
7. In every category of cooling systems analyzed in this study there were observations with
inexplicably high rates of unit water use. When these were excluded from calculations of average values or regression models estimations, the benchmark values of unit water withdrawals derived in this study showed a significant amount of consistency among estimates of average and “best performance” use of water derived through various methods of data analysis.
8. The stochastic production frontier analysis of the data showed that the estimated technical
efficiencies of water use in various plants and cooling systems vary significantly and are
Chapter VIII: Conclusions and Recommendations
VIII-3
lower on average in fossil fuel plants and somewhat higher in nuclear power plants. In once-through systems the mean technical efficiency was 52.9 percent for fossil plants and 69.6 percent for nuclear plants. For closed-loop systems with cooling towers the respective mean efficiencies were 67.2 and 80.8 percent. This finding suggests that while nuclear plants tend to use cooling water more efficiently than plants using fossil fuels there is still 20 to 30 percent potential for reducing water withdrawals in many of those plants and a 30 to 50 percent potential reduction in many fossil-fuel plants.
RECOMMENDATIONS
The complex structure and reliability of the data and difficulty in obtaining feedback from power plant personnel were significant obstacles in achieving the goals set forth for this study. The following recommendations suggest improvements that may facilitate the development of improved methodologies and outcomes for future research in this important sector of water use. 1. The main shortcoming of the currently available data from the EIA-767 form is the lack
of “gross” generation by the generating units. In this study, we used the operational efficiency to capture the effect of gross generation but this approach has its limitations. More useful benchmarks of water usage rates could be developed with gross generation data for each generator in a plant, as it is total generation that really determines the amount of cooling water flow (and/or consumptive use). The current Form EIA-767 only collects monthly and annual total "net generation" by generator (generating unit). We recommend that total annual gross generation for each generator unit be collected by adding an appropriate question to Schedule 5 of EIA-767 form.
2. Further development and refinement of water-use benchmarks should be undertaken as a collaborative effort between the electric power industry and a private or public research institution, and it should involve data collection from a sample of “best performing” plants, which could be identified using the results of this study. The main objective of the study would be to define appropriate standards for the design and operation of wet-cooling systems to eliminate inefficient use of water in thermoelectric power generation.
3. Improved water use efficiencies at power generation facilities are likely to require
significant managerial and financial investments. The findings from this study suggest that reductions in power plant water use are always beneficial to the extent that reductions in the power generated to provide water pumping then become available to sell to customers. However, while this benefit is often considered to be marginal, there clearly appear to be other situations where reduced water usage can provide significant benefits. For example, generating facilities located on shared reservoirs or aquifers may be able to “free-up” water resources for economically important domestic or irrigation uses, or facilities using surface water sources may be able to significantly reduce the impacts of thermal pollution on aquatic resources. Research that can identify those situations that result in the most beneficial reductions of power plant water uses can focus water use efficiency studies on the categories of generating facilities that are most like to welcome improvements in water use efficiency.

References-1
REFERENCES Ammons, David N. Municipal Benchmarks: assessing Local Performance and Establishing Community Standards, Sage Publications: Thousand Oaks. 2001. Battese, G.E. and Coelli, T.J. 1995. “A Model for Technical Inefficiency Effects in a Stochastic Frontier Production Function for Panel Data”, Empirical Economics 20 (p. 325-332). Clean Water Act. 2002. Federal Water Pollution Control Act, as amended through P.L. 107–303, November 27, 2002, http://www.epa.gov/region5/water/pdf/ecwa.pdf Coelli, T.J. 1992. “A Computer Program for Frontier Production Function Estimation; FRONTIER Version 2.0,” Economics Letters 39 (p. 29-32). Coelli, T.J. 1996. A Guide to FRONTIER Version 4.1: A Computer Program for Stochastic Frontier Production and Cost Function Estimation. Center for Efficiency and Productivity Analysis (CEPA) Worling Paper 96/07. University of New England, Armidale, Australia. http://www.une.edu.au/econometrics/cepa.htm Cootner, Paul H., and George O. G. Lof. 1965. Water demand for steam electric generation: An economic projection model. Baltimore: Johns Hopkins Press.
Cromwell, John E. and S.J. Rubin. 1995. Development of Benchmark Measures for Viability Assessment, Prepared for the Pennsylvania Department of Environmental Protection. Apogee Research, Bethesda, MD. Ben Dziegielewski, Subhash Sharma, Tom Bik, Heru Margono, and Xiaoying Yang. 1999. Analysis of Water Use Trends in the United States: 1950 – 1995. Southern Illinois University at Carbondale. Prepared for the United States Geological Survey, Grant No. 99HQGR0222, Subgrant No. 00-312Feb. 28, 2002. Gleick, Peter H., ed. 1993. Water in crisis: A guide to the world’s fresh water resources. New York: Oxford University Press.
Gloyna, Earnest F., Herbert, H. Woodson, and Howard, R. Drew, ed. 1975. Water management by the electric power industry. Center for Research in Water Resources, University of Texas at Austin.
Harte, John., and Mohamed El-Gasseir. 1978. Energy and water. Science 199 (4329): 623-634.
Hutson, Susan S., Nancy L. Barber, Joan F. Kenny, Kristin S. Linsey, Deborah S. Lumia, and Molly A. Maupin, Estimated Use of Water in the United States in 2000, US Geological
References
References-2
Survey (USGS) Circular 1268 (released March 2004, revised April 2004, May 2004, February 2005). Available online at: http://pubs.usgs.gov/circ/2004/circ1268/ Kenny, J.F., ed., 2004, Guidelines for preparation of State water-use estimates for 2000: U.S. Geological Survey Techniques and Methods 4–A4, 49 p., available on the World Wide Web at URL http://water.usgs.gov/watuse/ or http://pubs.usgs.gov/ tm/2005/tm4A4/ Kingdom, Bill, John Knapp, Peter LaChance, and Myron Olstein, Performance Benchmarking for Water Utilities, AWWA Research Foundation and American Water Works Association, Denver, 1996.
Kumbhakar, S.C. and Lovell, C.A.K. 2000. Stochastic Frontier Analysis. Cambridge University Press, U.K.
Michelletti, W.C., and Burns, J.M., 2002, Emerging issues and needs in power plant cooling systems in Proceedings of the Workshop on "Electric Utilities and Water: Emerging Issues and R&D Needs": Pittsburgh, Pennsylvania, July 23-24, 2002, accessed December 1, 2003, at http://www.netl.doe.gov/publications/proceedings/02/EU&W/Micheletti_JMB.PDF Solley, Wayne B., Robert R. Pierce., and Howard A. Perlman. 1998. Estimated water use in the United States in 1995. U.S. Geological Survey Circular 1200.
Torcellini P., N. Long, and R. Judkoff. 2003. Consumptive Water Use for U.S. Power Production. Technical Report for the National Renewable Energy Laboratory NREL/TP-550-33905. December. U.S. Department of Energy, Energy Information Administration, 2005, Net Generation by Energy Source by Type of Producer at http://www.eia.doe.gov/cneaf/electricity/epa/epat1p1.html
U.S. Department of Energy, Energy Information Administration, 2003a, Annual steam-electric plant operation and design data, accessed October 27, 2003 at http://www.eia.doe.gov/cneaf/electricity/page/eia767.html
U.S. Department of Energy, Energy Information Administration, 2003b, Monthly utility power plant database, accessed October 27, 2003 at http://www.eia.doe.gov/cneaf/electricity/page/eia906u.html
U.S. Department of Energy, Energy Information Administration, 2003c, Electricity, chap. 8 of Annual Energy Review 2002: U.S. Department of Energy, DOE/EIA-0384(2002), p. 221-238, accessed October 27, 2003, at http://www.eia.doe.gov/emeu/aer/pdf/pages/sec8.pdf U.S. Department of Energy, 2003. Form EIA-767: Steam Electric Plant Operation and Design Report. (DOE/EIA-0348(2003), Electric Power Annual 2003, December 2004, Energy Information Administration, Office of Coal, Nuclear, Electric and Alternate Fuels, at http://www.eia.doe.gov/cneaf/electricity/epa/epa_sum.html. U.S., Geological Survey 2004. Estimated Use of Water in the United States in 2000, at http://pubs.usgs.gov/circ/2004/circ1268/htdocs/figure14.html U.S., Geological Survey 2004. Estimated Use of Water in the United States in 2000, at
References
References-3
http://pubs.usgs.gov/circ/2004/circ1268/htdocs/table13.html U.S., Geological Survey (undated). National Handbook of Recommended Methods for Water Data Acquisition --Chapter 11-Water Use at: http://water.usgs.gov/pubs/chapter11/ Veil J. 2002. Overview of Water Issues and Regulations Affecting the Electric Utility Industry. Argonne National Laboratory. NETL Workshop, July 23, 2002, http://www.netl.doe.gov/publications/ Wollman, Nathaniel., and Gilbert W. Bonem. 1971. The outlook for water: Quality, quantity, and national growth. Baltimore: Johns Hopkins Press.
Young, H. Peyton., and Russell G. Thompson. 1973. Forecasting water use for electric power generation. Water Resources Research 9 (4): 800-807.

Appendix A-1
APPENDIX A
REVIEW OF EIA-767 AND SELECTION OF SAMPLE OF
SURVEYED GENERATING FACILITIES PURPOSE
The purpose of this appendix is: • To describe the Form EIA-767 dataset; • To describe the process that was use to select the sample of systems that were
included in the national survey of power generation facilities; and • To summarize some of the characteristics of the facilities included in the sample.
FORM EIA-767 The U.S. Department of Energy collects and publishes a substantial quantity of information from energy producers. EIA currently uses seven different data collection forms to produce the Electric Power Annual Report, including the Form EIA-767: Steam Electric Plant Operation and Design Report. (U.S. Department of Energy, 2003).
Form EIA-767 is used to collect information from all U.S. power plants with existing or planned organic-fueled or combustible renewable steam-electric plants with generator nameplate ratings of 10 megawatts or larger on an annual basis. Submission of the form is “mandatory” under Section 13(b) of the Federal Energy Administration Act of 1974. This data is used to “monitor the current status and trends of the electric power industry and to evaluate the future of the industry.” (DOE, 2005: i).
Form EIA-767 also collects information on plant cooling systems that can be used to estimate the quantity of water used by each cooling system operated by each facility. The USGS has used the EIA-767 as one of its primary data sources in the estimation of thermoelectric water use that it prepares every five years (USGS, online). The data from this form was analyzed in this study to evaluate plant water use. The 2003 edition of EIA-767 was also used to select a sample of plants that were contacted and asked to respond to a survey of thermoelectric water use.
After 2000, the DOE/EIA no longer included data for plants using nuclear fuel in the Form EIA-767. Therefore the following review of the power generation facilities information does note include any of these facilities. The comparative tables used in the email survey to nuclear power facilities were based upon a summary of data in the 2000 survey.
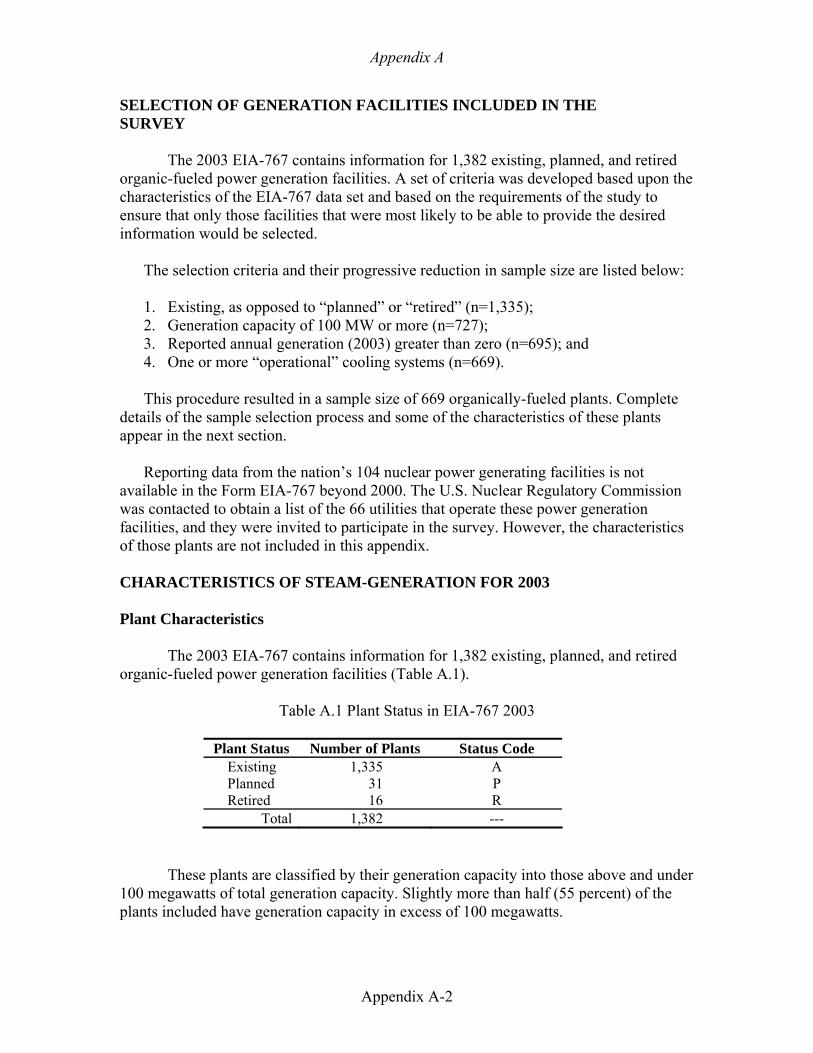
Appendix A
Appendix A-2
SELECTION OF GENERATION FACILITIES INCLUDED IN THE SURVEY
The 2003 EIA-767 contains information for 1,382 existing, planned, and retired organic-fueled power generation facilities. A set of criteria was developed based upon the characteristics of the EIA-767 data set and based on the requirements of the study to ensure that only those facilities that were most likely to be able to provide the desired information would be selected.
The selection criteria and their progressive reduction in sample size are listed below:
1. Existing, as opposed to “planned” or “retired” (n=1,335); 2. Generation capacity of 100 MW or more (n=727); 3. Reported annual generation (2003) greater than zero (n=695); and 4. One or more “operational” cooling systems (n=669).
This procedure resulted in a sample size of 669 organically-fueled plants. Complete
details of the sample selection process and some of the characteristics of these plants appear in the next section.
Reporting data from the nation’s 104 nuclear power generating facilities is not available in the Form EIA-767 beyond 2000. The U.S. Nuclear Regulatory Commission was contacted to obtain a list of the 66 utilities that operate these power generation facilities, and they were invited to participate in the survey. However, the characteristics of those plants are not included in this appendix. CHARACTERISTICS OF STEAM-GENERATION FOR 2003 Plant Characteristics
The 2003 EIA-767 contains information for 1,382 existing, planned, and retired organic-fueled power generation facilities (Table A.1).
Table A.1 Plant Status in EIA-767 2003
Plant Status Number of Plants Status Code Existing 1,335 A Planned 31 P Retired 16 R
Total 1,382 ---
These plants are classified by their generation capacity into those above and under 100 megawatts of total generation capacity. Slightly more than half (55 percent) of the plants included have generation capacity in excess of 100 megawatts.
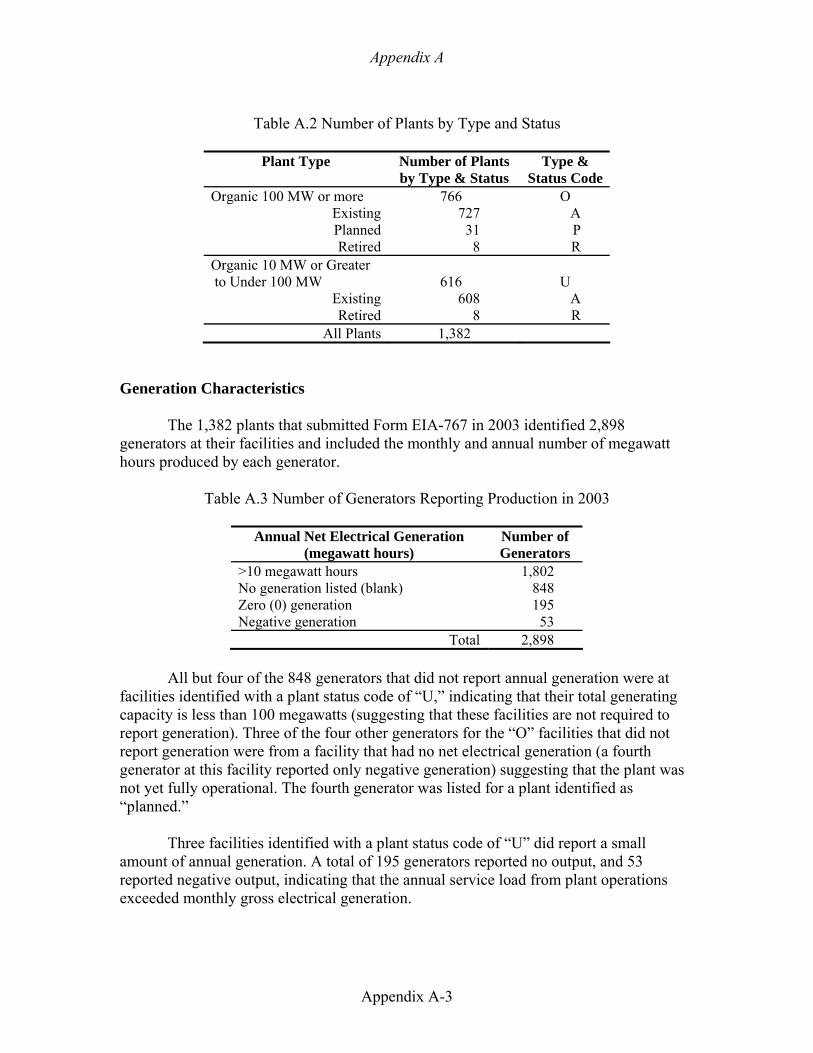
Appendix A
Appendix A-3
Table A.2 Number of Plants by Type and Status
Plant Type Number of Plants
by Type & Status Type &
Status Code Organic 100 MW or more 766 O
Existing 727 A Planned 31 P Retired 8 R
Organic 10 MW or Greater to Under 100 MW 616 U
Existing 608 A Retired 8 R
All Plants 1,382 Generation Characteristics
The 1,382 plants that submitted Form EIA-767 in 2003 identified 2,898 generators at their facilities and included the monthly and annual number of megawatt hours produced by each generator.
Table A.3 Number of Generators Reporting Production in 2003
Annual Net Electrical Generation (megawatt hours)
Number of Generators
>10 megawatt hours 1,802 No generation listed (blank) 848 Zero (0) generation 195 Negative generation 53
Total 2,898
All but four of the 848 generators that did not report annual generation were at facilities identified with a plant status code of “U,” indicating that their total generating capacity is less than 100 megawatts (suggesting that these facilities are not required to report generation). Three of the four other generators for the “O” facilities that did not report generation were from a facility that had no net electrical generation (a fourth generator at this facility reported only negative generation) suggesting that the plant was not yet fully operational. The fourth generator was listed for a plant identified as “planned.”
Three facilities identified with a plant status code of “U” did report a small amount of annual generation. A total of 195 generators reported no output, and 53 reported negative output, indicating that the annual service load from plant operations exceeded monthly gross electrical generation.
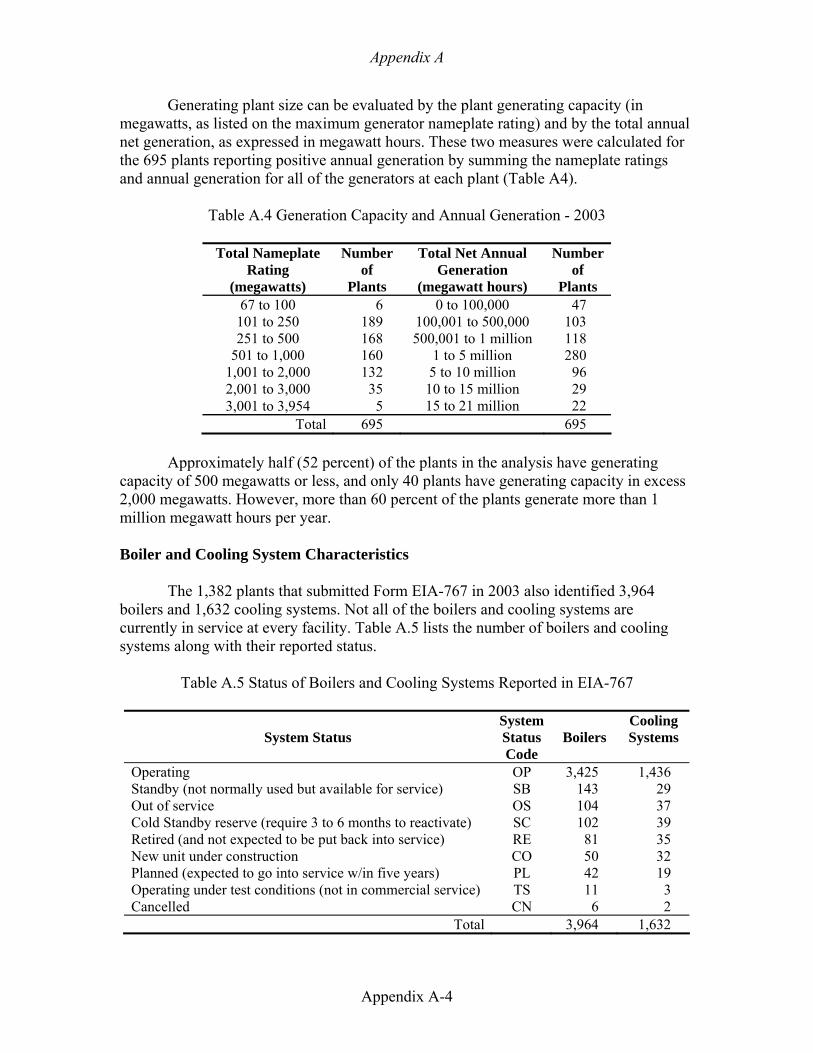
Appendix A
Appendix A-4
Generating plant size can be evaluated by the plant generating capacity (in megawatts, as listed on the maximum generator nameplate rating) and by the total annual net generation, as expressed in megawatt hours. These two measures were calculated for the 695 plants reporting positive annual generation by summing the nameplate ratings and annual generation for all of the generators at each plant (Table A4).
Table A.4 Generation Capacity and Annual Generation - 2003
Total Nameplate Rating
(megawatts)
Number of
Plants
Total Net Annual Generation
(megawatt hours)
Number of
Plants 67 to 100 6 0 to 100,000 47
101 to 250 189 100,001 to 500,000 103 251 to 500 168 500,001 to 1 million 118
501 to 1,000 160 1 to 5 million 280 1,001 to 2,000 132 5 to 10 million 96 2,001 to 3,000 35 10 to 15 million 29 3,001 to 3,954 5 15 to 21 million 22
Total 695 695
Approximately half (52 percent) of the plants in the analysis have generating capacity of 500 megawatts or less, and only 40 plants have generating capacity in excess 2,000 megawatts. However, more than 60 percent of the plants generate more than 1 million megawatt hours per year. Boiler and Cooling System Characteristics
The 1,382 plants that submitted Form EIA-767 in 2003 also identified 3,964 boilers and 1,632 cooling systems. Not all of the boilers and cooling systems are currently in service at every facility. Table A.5 lists the number of boilers and cooling systems along with their reported status.
Table A.5 Status of Boilers and Cooling Systems Reported in EIA-767
System Status
System Status Code
Boilers
Cooling Systems
Operating OP 3,425 1,436 Standby (not normally used but available for service) SB 143 29 Out of service OS 104 37 Cold Standby reserve (require 3 to 6 months to reactivate) SC 102 39 Retired (and not expected to be put back into service) RE 81 35 New unit under construction CO 50 32 Planned (expected to go into service w/in five years) PL 42 19 Operating under test conditions (not in commercial service) TS 11 3 Cancelled CN 6 2
Total 3,964 1,632
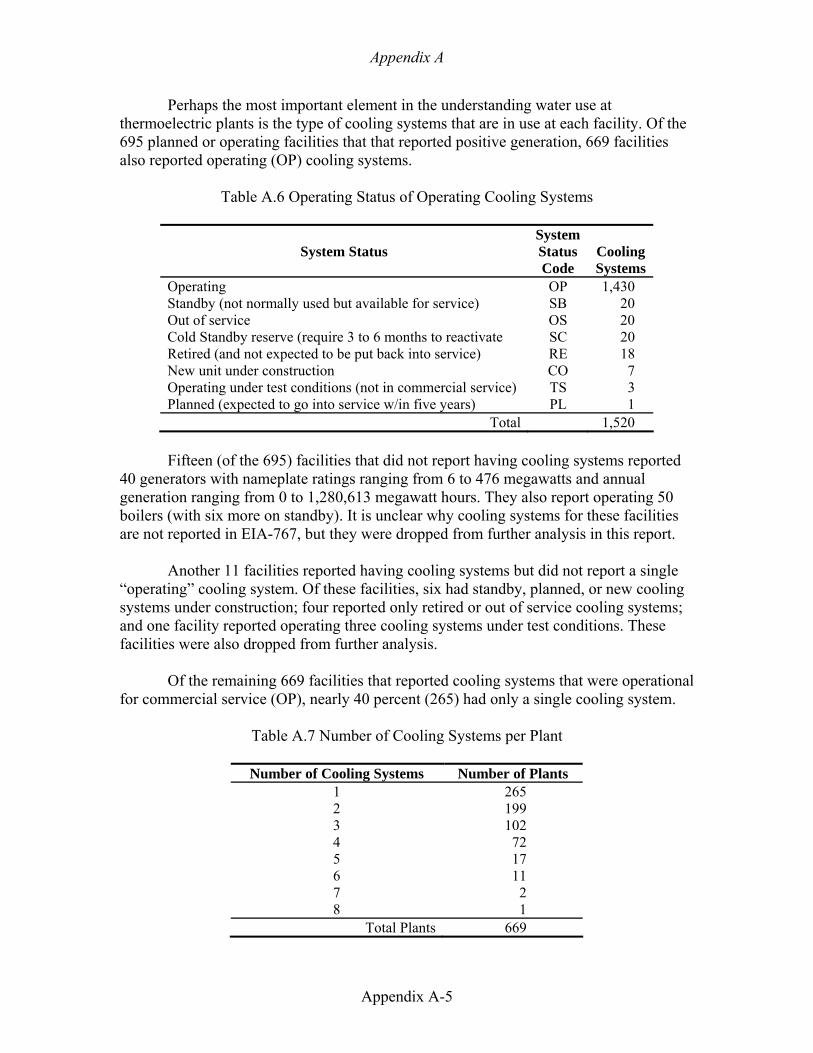
Appendix A
Appendix A-5
Perhaps the most important element in the understanding water use at thermoelectric plants is the type of cooling systems that are in use at each facility. Of the 695 planned or operating facilities that that reported positive generation, 669 facilities also reported operating (OP) cooling systems.
Table A.6 Operating Status of Operating Cooling Systems
System Status
System Status Code
Cooling Systems
Operating OP 1,430 Standby (not normally used but available for service) SB 20 Out of service OS 20 Cold Standby reserve (require 3 to 6 months to reactivate SC 20 Retired (and not expected to be put back into service) RE 18 New unit under construction CO 7 Operating under test conditions (not in commercial service) TS 3 Planned (expected to go into service w/in five years) PL 1
Total 1,520
Fifteen (of the 695) facilities that did not report having cooling systems reported 40 generators with nameplate ratings ranging from 6 to 476 megawatts and annual generation ranging from 0 to 1,280,613 megawatt hours. They also report operating 50 boilers (with six more on standby). It is unclear why cooling systems for these facilities are not reported in EIA-767, but they were dropped from further analysis in this report.
Another 11 facilities reported having cooling systems but did not report a single “operating” cooling system. Of these facilities, six had standby, planned, or new cooling systems under construction; four reported only retired or out of service cooling systems; and one facility reported operating three cooling systems under test conditions. These facilities were also dropped from further analysis.
Of the remaining 669 facilities that reported cooling systems that were operational for commercial service (OP), nearly 40 percent (265) had only a single cooling system.
Table A.7 Number of Cooling Systems per Plant
Number of Cooling Systems Number of Plants 1 265 2 199 3 102 4 72 5 17 6 11 7 2 8 1
Total Plants 669
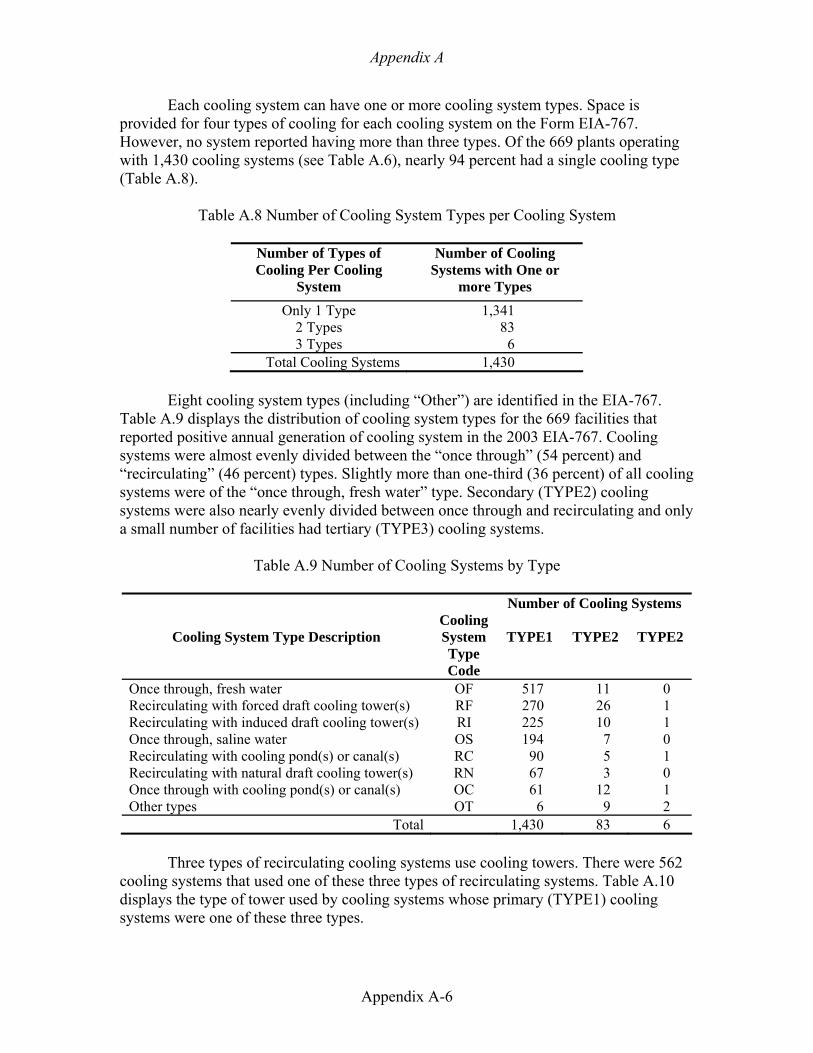
Appendix A
Appendix A-6
Each cooling system can have one or more cooling system types. Space is provided for four types of cooling for each cooling system on the Form EIA-767. However, no system reported having more than three types. Of the 669 plants operating with 1,430 cooling systems (see Table A.6), nearly 94 percent had a single cooling type (Table A.8).
Table A.8 Number of Cooling System Types per Cooling System
Number of Types of Cooling Per Cooling
System
Number of Cooling Systems with One or
more Types Only 1 Type 1,341
2 Types 83 3 Types 6
Total Cooling Systems 1,430
Eight cooling system types (including “Other”) are identified in the EIA-767. Table A.9 displays the distribution of cooling system types for the 669 facilities that reported positive annual generation of cooling system in the 2003 EIA-767. Cooling systems were almost evenly divided between the “once through” (54 percent) and “recirculating” (46 percent) types. Slightly more than one-third (36 percent) of all cooling systems were of the “once through, fresh water” type. Secondary (TYPE2) cooling systems were also nearly evenly divided between once through and recirculating and only a small number of facilities had tertiary (TYPE3) cooling systems.
Table A.9 Number of Cooling Systems by Type
Number of Cooling Systems
Cooling System Type Description Cooling System Type Code
TYPE1
TYPE2
TYPE2
Once through, fresh water OF 517 11 0 Recirculating with forced draft cooling tower(s) RF 270 26 1 Recirculating with induced draft cooling tower(s) RI 225 10 1 Once through, saline water OS 194 7 0 Recirculating with cooling pond(s) or canal(s) RC 90 5 1 Recirculating with natural draft cooling tower(s) RN 67 3 0 Once through with cooling pond(s) or canal(s) OC 61 12 1 Other types OT 6 9 2
Total 1,430 83 6
Three types of recirculating cooling systems use cooling towers. There were 562 cooling systems that used one of these three types of recirculating systems. Table A.10 displays the type of tower used by cooling systems whose primary (TYPE1) cooling systems were one of these three types.
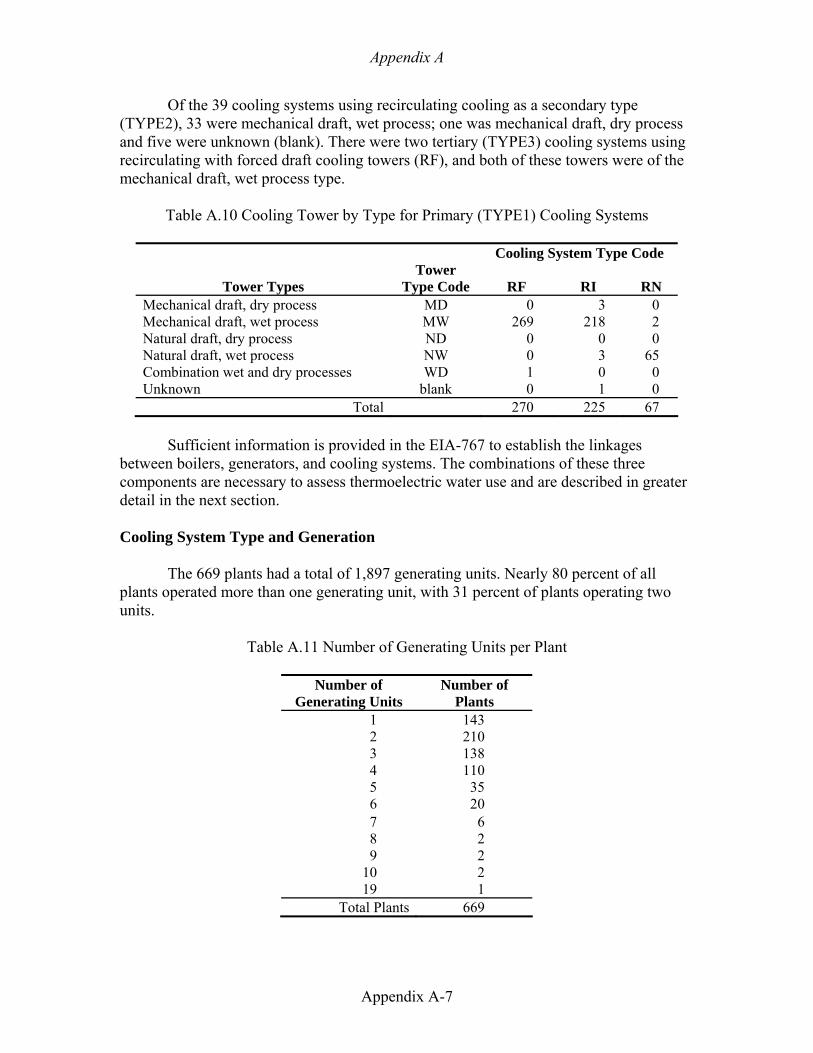
Appendix A
Appendix A-7
Of the 39 cooling systems using recirculating cooling as a secondary type (TYPE2), 33 were mechanical draft, wet process; one was mechanical draft, dry process and five were unknown (blank). There were two tertiary (TYPE3) cooling systems using recirculating with forced draft cooling towers (RF), and both of these towers were of the mechanical draft, wet process type.
Table A.10 Cooling Tower by Type for Primary (TYPE1) Cooling Systems
Cooling System Type Code
Tower Types Tower
Type Code
RF
RI
RN Mechanical draft, dry process MD 0 3 0 Mechanical draft, wet process MW 269 218 2 Natural draft, dry process ND 0 0 0 Natural draft, wet process NW 0 3 65 Combination wet and dry processes WD 1 0 0 Unknown blank 0 1 0
Total 270 225 67
Sufficient information is provided in the EIA-767 to establish the linkages between boilers, generators, and cooling systems. The combinations of these three components are necessary to assess thermoelectric water use and are described in greater detail in the next section. Cooling System Type and Generation
The 669 plants had a total of 1,897 generating units. Nearly 80 percent of all plants operated more than one generating unit, with 31 percent of plants operating two units.
Table A.11 Number of Generating Units per Plant
Number of
Generating Units Number of
Plants 1 143 2 210 3 138 4 110 5 35 6 20 7 6 8 2 9 2
10 2 19 1
Total Plants 669
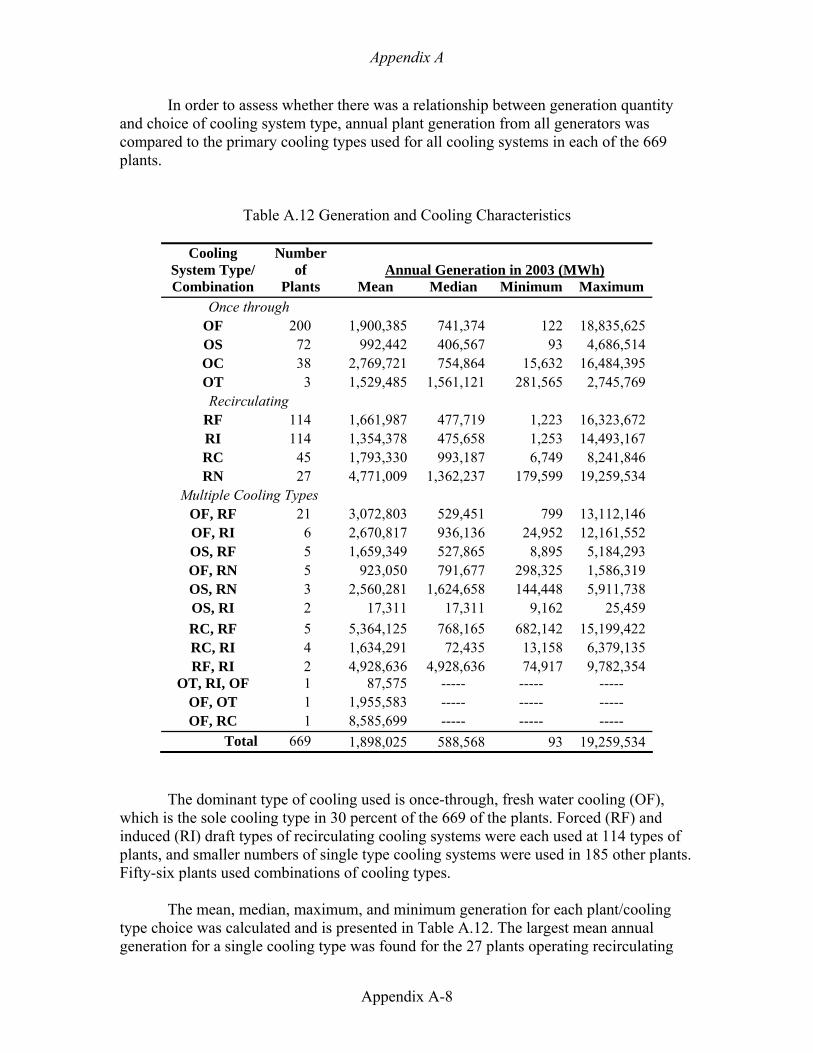
Appendix A
Appendix A-8
In order to assess whether there was a relationship between generation quantity and choice of cooling system type, annual plant generation from all generators was compared to the primary cooling types used for all cooling systems in each of the 669 plants.
Table A.12 Generation and Cooling Characteristics
Cooling System Type/
Number of
Annual Generation in 2003 (MWh)
Combination Plants Mean Median Minimum Maximum Once through
OF 200 1,900,385 741,374 122 18,835,625 OS 72 992,442 406,567 93 4,686,514 OC 38 2,769,721 754,864 15,632 16,484,395 OT 3 1,529,485 1,561,121 281,565 2,745,769 Recirculating
RF 114 1,661,987 477,719 1,223 16,323,672 RI 114 1,354,378 475,658 1,253 14,493,167 RC 45 1,793,330 993,187 6,749 8,241,846 RN 27 4,771,009 1,362,237 179,599 19,259,534
Multiple Cooling Types OF, RF 21 3,072,803 529,451 799 13,112,146 OF, RI 6 2,670,817 936,136 24,952 12,161,552 OS, RF 5 1,659,349 527,865 8,895 5,184,293 OF, RN 5 923,050 791,677 298,325 1,586,319 OS, RN 3 2,560,281 1,624,658 144,448 5,911,738 OS, RI 2 17,311 17,311 9,162 25,459 RC, RF 5 5,364,125 768,165 682,142 15,199,422 RC, RI 4 1,634,291 72,435 13,158 6,379,135 RF, RI 2 4,928,636 4,928,636 74,917 9,782,354
OT, RI, OF 1 87,575 ----- ----- ----- OF, OT 1 1,955,583 ----- ----- ----- OF, RC 1 8,585,699 ----- ----- -----
Total 669 1,898,025 588,568 93 19,259,534
The dominant type of cooling used is once-through, fresh water cooling (OF), which is the sole cooling type in 30 percent of the 669 of the plants. Forced (RF) and induced (RI) draft types of recirculating cooling systems were each used at 114 types of plants, and smaller numbers of single type cooling systems were used in 185 other plants. Fifty-six plants used combinations of cooling types.
The mean, median, maximum, and minimum generation for each plant/cooling type choice was calculated and is presented in Table A.12. The largest mean annual generation for a single cooling type was found for the 27 plants operating recirculating
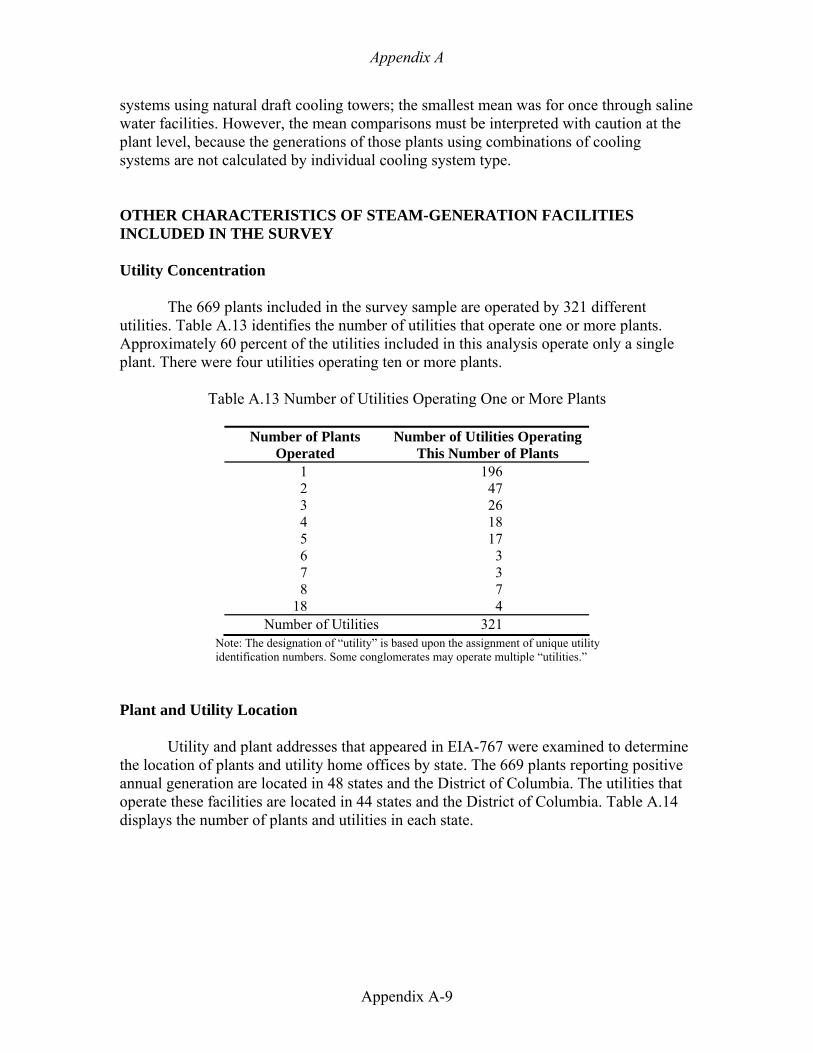
Appendix A
Appendix A-9
systems using natural draft cooling towers; the smallest mean was for once through saline water facilities. However, the mean comparisons must be interpreted with caution at the plant level, because the generations of those plants using combinations of cooling systems are not calculated by individual cooling system type. OTHER CHARACTERISTICS OF STEAM-GENERATION FACILITIES INCLUDED IN THE SURVEY Utility Concentration
The 669 plants included in the survey sample are operated by 321 different utilities. Table A.13 identifies the number of utilities that operate one or more plants. Approximately 60 percent of the utilities included in this analysis operate only a single plant. There were four utilities operating ten or more plants.
Table A.13 Number of Utilities Operating One or More Plants
Number of Plants Operated
Number of Utilities Operating This Number of Plants
1 196 2 47 3 26 4 18 5 17 6 3 7 3 8 7
18 4 Number of Utilities 321
Note: The designation of “utility” is based upon the assignment of unique utility identification numbers. Some conglomerates may operate multiple “utilities.”
Plant and Utility Location
Utility and plant addresses that appeared in EIA-767 were examined to determine the location of plants and utility home offices by state. The 669 plants reporting positive annual generation are located in 48 states and the District of Columbia. The utilities that operate these facilities are located in 44 states and the District of Columbia. Table A.14 displays the number of plants and utilities in each state.
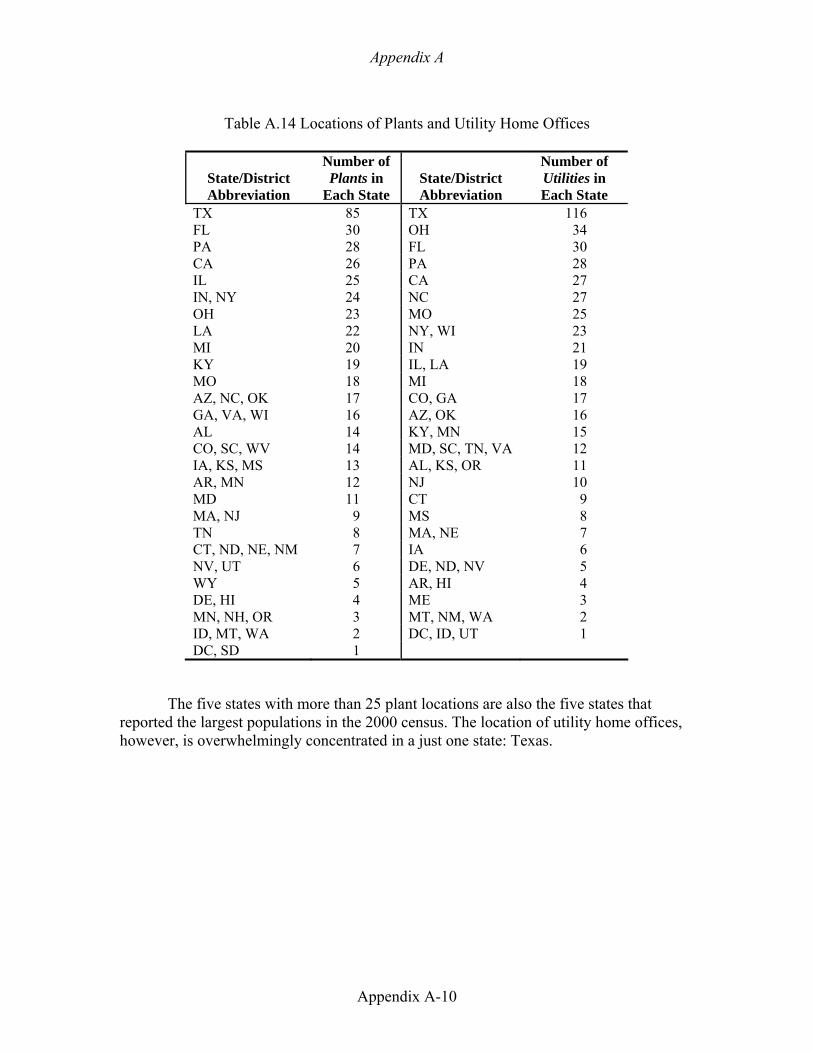
Appendix A
Appendix A-10
Table A.14 Locations of Plants and Utility Home Offices
State/District Abbreviation
Number of Plants in
Each State
State/District Abbreviation
Number of Utilities in Each State
TX 85 TX 116 FL 30 OH 34 PA 28 FL 30 CA 26 PA 28 IL 25 CA 27 IN, NY 24 NC 27 OH 23 MO 25 LA 22 NY, WI 23 MI 20 IN 21 KY 19 IL, LA 19 MO 18 MI 18 AZ, NC, OK 17 CO, GA 17 GA, VA, WI 16 AZ, OK 16 AL 14 KY, MN 15 CO, SC, WV 14 MD, SC, TN, VA 12 IA, KS, MS 13 AL, KS, OR 11 AR, MN 12 NJ 10 MD 11 CT 9 MA, NJ 9 MS 8 TN 8 MA, NE 7 CT, ND, NE, NM 7 IA 6 NV, UT 6 DE, ND, NV 5 WY 5 AR, HI 4 DE, HI 4 ME 3 MN, NH, OR 3 MT, NM, WA 2 ID, MT, WA 2 DC, ID, UT 1 DC, SD 1
The five states with more than 25 plant locations are also the five states that reported the largest populations in the 2000 census. The location of utility home offices, however, is overwhelmingly concentrated in a just one state: Texas.
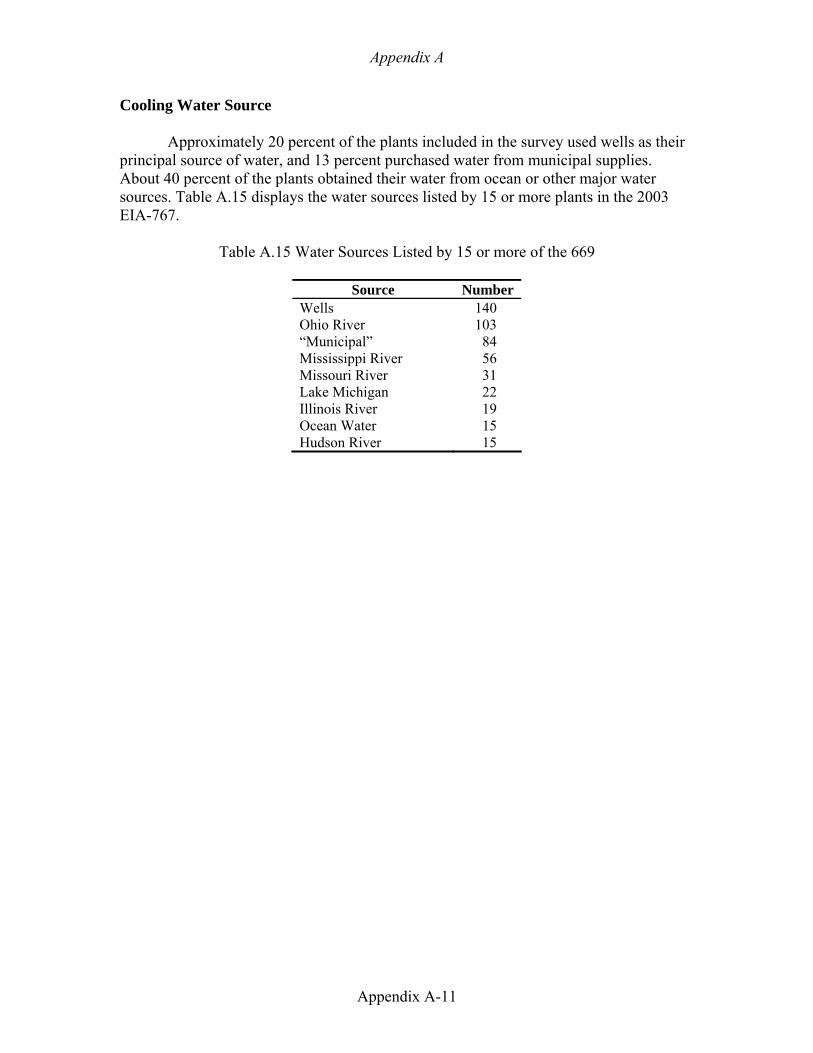
Appendix A
Appendix A-11
Cooling Water Source
Approximately 20 percent of the plants included in the survey used wells as their principal source of water, and 13 percent purchased water from municipal supplies. About 40 percent of the plants obtained their water from ocean or other major water sources. Table A.15 displays the water sources listed by 15 or more plants in the 2003 EIA-767.
Table A.15 Water Sources Listed by 15 or more of the 669
Source Number Wells 140 Ohio River 103 “Municipal” 84 Mississippi River 56 Missouri River 31 Lake Michigan 22 Illinois River 19 Ocean Water 15 Hudson River 15

Appendix B-1
APPENDIX B
SITE VISIT PROCEDURE
PURPOSE
The purpose of this appendix is:
• To describe the protocol that was used to conduct the Personal Interviews and Site Visit component of the research project; and
• To document the field note summaries from the site visits. In order to preserve the anonymity of respondents, information that could potentially be used to identify the personnel or facility has been removed. Interview - Site Visit Purpose
Prior to the development of the survey instrument, a series of on-site personal interviews were conducted with plant water use managers at five Midwestern power generation facilities. The purpose of these interviews was to:
1. Observe power generation water use and water flows from intake to discharge in
different types of facilities; 2. Determine the way that water use is measured (or estimated) and reported in the
EIA-767; 3. Observe a sample of the range of configurations of boiler-generation-cooling
systems, and the influence of these systems on water use; 4. Inquire about significant on-site uses of water and significant determinants of
water use; 5. Obtain feedback on the cooling system level water use coefficients calculated
using 767 data; 6. Establish the level of interest and need for water use benchmarks by plant
managers; and 7. Obtain suggestions for method to conduct the effective dissemination of a mail
survey to power plant representatives. PROTOCOL
The goal of the site visit component was to meet with the EIA-767 contact persons at between five and ten power generation facilities in the Midwest. The cooling system characteristics of all of the power facilities in these states were identified and a representative sample of 20 systems was selected.
A set of interview questions was developed (see Appendix B, page 3) and features of plant operations that would be valuable to observe were identified. Water-use
Appendix B
Appendix B-2
coefficients were calculated for cooling systems at each facility and a comparative table of water use coefficients was prepared. This table was used during the interview to inquire about the accuracy of using EIA-767 to estimate plant water use and to discuss potential determinants of water use at each facility. A generic contact letter was drafted and submitted to the SIUC Human Subjects Committee for approval (see Appendix B, page 4).
A list of contact persons for all of the respondents to the 2003 Form EIA-767 was obtained from the DOE/EIA-767 Survey Manager. The initial contact to plants was made via fax and followed up by personal phone calls.
In some cases, it was found that the utility operated multiple plants, with the responsibility for completion of the Form EIA-767 centralized in central office of the utility. In these cases, multiple follow-up phone calls, faxes, and email messages were needed to determine the proper contact person at the actual power generation facility.
Six utilities eventually agreed to host an interview-site visit. However, in one case where a visit was approved at utility-level, the follow-up at plant-level was not successful and an interview was never scheduled.
Visits were made to five facilities. These consisted of a 60- to 90-minute interview with plant representatives, followed by tours of each facility lasting approximately one hour. Brief field notes were prepared detailing the information obtained during each visit (Appendix B, pages 5 to 10).
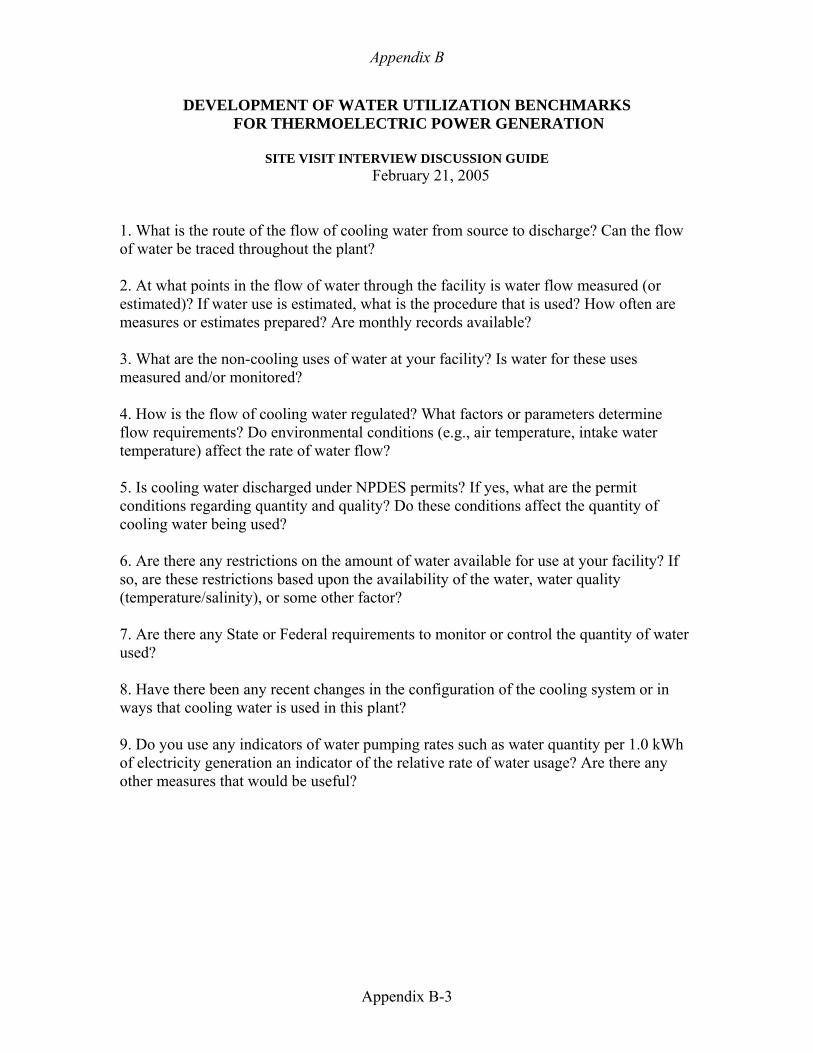
Appendix B
Appendix B-3
DEVELOPMENT OF WATER UTILIZATION BENCHMARKS FOR THERMOELECTRIC POWER GENERATION
SITE VISIT INTERVIEW DISCUSSION GUIDE
February 21, 2005
1. What is the route of the flow of cooling water from source to discharge? Can the flow of water be traced throughout the plant? 2. At what points in the flow of water through the facility is water flow measured (or estimated)? If water use is estimated, what is the procedure that is used? How often are measures or estimates prepared? Are monthly records available? 3. What are the non-cooling uses of water at your facility? Is water for these uses measured and/or monitored? 4. How is the flow of cooling water regulated? What factors or parameters determine flow requirements? Do environmental conditions (e.g., air temperature, intake water temperature) affect the rate of water flow? 5. Is cooling water discharged under NPDES permits? If yes, what are the permit conditions regarding quantity and quality? Do these conditions affect the quantity of cooling water being used? 6. Are there any restrictions on the amount of water available for use at your facility? If so, are these restrictions based upon the availability of the water, water quality (temperature/salinity), or some other factor? 7. Are there any State or Federal requirements to monitor or control the quantity of water used? 8. Have there been any recent changes in the configuration of the cooling system or in ways that cooling water is used in this plant? 9. Do you use any indicators of water pumping rates such as water quantity per 1.0 kWh of electricity generation an indicator of the relative rate of water usage? Are there any other measures that would be useful?

Appendix B
Appendix B-4
Contact Name Contact Date Facility/Utility Name Address Dear Contact Person: I am writing to request your assistance in a study of thermoelectric water use that is being conducted by Dr. Ben Dziegielewski and myself and sponsored by National Institute of Water Resources (NIWR) and Southern Illinois University Carbondale (SIUC). A complete description of the project is available on the NIWR web site: http://water.usgs.gov/wrri/04grants/national/nationalindex.html. The purpose of this project is to develop benchmarks that plant managers can use to evaluate the relative water-use performance of their facilities. We are sending this letter to a sample of the generation facilities in the Midwest, addressed to the person identified in the year 2000, EIA 767 database as the “survey contact.” One of those facilities is PLANT NAME. We are requesting the assistance of generating facility water-use managers to help us to identify the most important technical and managerial components of water use at various types of thermoelectric facilities. Your participation would involve hosting a visit to your facility from the project’s principal investigator, Dr. Ben Dziegielewski. Ben is a civil engineer and geography professor who has conducted numerous studies of water use at residential, commercial, institutional, and industrial facilities. We anticipate that the proposed visit will require approximately one hour of your time and, if possible, would include a brief tour of locations at your facility with water use measuring devices and cooling systems. Also, if possible, Ben will be accompanied by me, or one of his graduate students, who will assist with note-taking and observations. Participation in this study is, of course, completely voluntary, and any information collected during the site visit will not be attributed to your facility by name in any published reports without your expressed permission. I will contact you again by phone next week to find out if it would be possible for you to participate in this study, and to answer any questions that you may have about the project. I will use the phone number listed in the EIA767 database to contact you: (xxx) xxx-xxx, Ext. xxx. I would greatly appreciate it if you would let me know as soon as possible if a different phone number would be more appropriate. You can contact me at 618-453-6023, or <[email protected]>. Finally, if it would be more appropriate to send this request to a different person at your facility, could you please pass this letter along to that person, and then let me know who I should contact. Thank you again for taking the time to consider participating in this project. We anticipate that the final results of this study will be of considerable value to the managers of the more than 1,000 thermoelectric generating facilities across the country. Sincerely, Tom Bik, Researcher Geography Department Southern Illinois University Carbondale Phone: 618-453-6023; Fax: 618-453-6465; [email protected]
This project has been reviewed and approved by the SIUC Human Subjects Committee. Questions concerning your rights as a participant in this research may be addressed to the Committee Chairperson, Office of Research Development and Administration, Southern Illinois University Carbondale, IL 62901-4709. Phone: (618) 453-4533; E-mail: [email protected] .
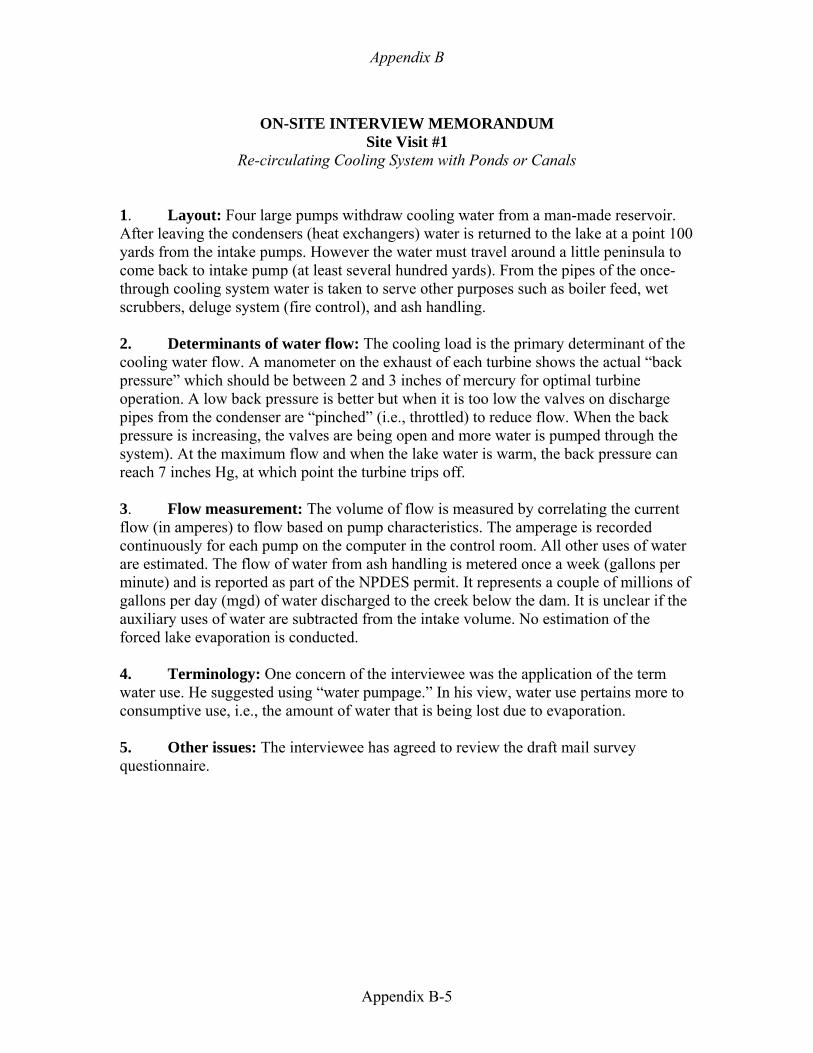
Appendix B
Appendix B-5
ON-SITE INTERVIEW MEMORANDUM
Site Visit #1 Re-circulating Cooling System with Ponds or Canals
1. Layout: Four large pumps withdraw cooling water from a man-made reservoir. After leaving the condensers (heat exchangers) water is returned to the lake at a point 100 yards from the intake pumps. However the water must travel around a little peninsula to come back to intake pump (at least several hundred yards). From the pipes of the once-through cooling system water is taken to serve other purposes such as boiler feed, wet scrubbers, deluge system (fire control), and ash handling. 2. Determinants of water flow: The cooling load is the primary determinant of the cooling water flow. A manometer on the exhaust of each turbine shows the actual “back pressure” which should be between 2 and 3 inches of mercury for optimal turbine operation. A low back pressure is better but when it is too low the valves on discharge pipes from the condenser are “pinched” (i.e., throttled) to reduce flow. When the back pressure is increasing, the valves are being open and more water is pumped through the system). At the maximum flow and when the lake water is warm, the back pressure can reach 7 inches Hg, at which point the turbine trips off. 3. Flow measurement: The volume of flow is measured by correlating the current flow (in amperes) to flow based on pump characteristics. The amperage is recorded continuously for each pump on the computer in the control room. All other uses of water are estimated. The flow of water from ash handling is metered once a week (gallons per minute) and is reported as part of the NPDES permit. It represents a couple of millions of gallons per day (mgd) of water discharged to the creek below the dam. It is unclear if the auxiliary uses of water are subtracted from the intake volume. No estimation of the forced lake evaporation is conducted. 4. Terminology: One concern of the interviewee was the application of the term water use. He suggested using “water pumpage.” In his view, water use pertains more to consumptive use, i.e., the amount of water that is being lost due to evaporation. 5. Other issues: The interviewee has agreed to review the draft mail survey questionnaire.
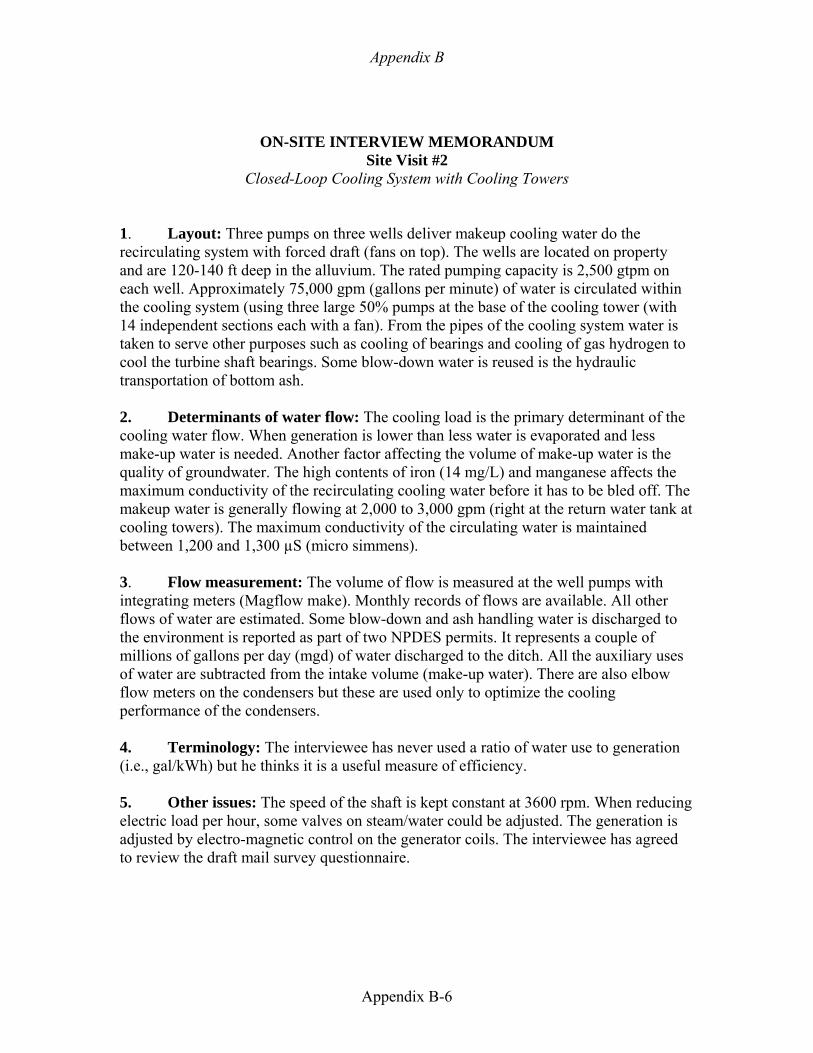
Appendix B
Appendix B-6
ON-SITE INTERVIEW MEMORANDUM Site Visit #2
Closed-Loop Cooling System with Cooling Towers 1. Layout: Three pumps on three wells deliver makeup cooling water do the recirculating system with forced draft (fans on top). The wells are located on property and are 120-140 ft deep in the alluvium. The rated pumping capacity is 2,500 gtpm on each well. Approximately 75,000 gpm (gallons per minute) of water is circulated within the cooling system (using three large 50% pumps at the base of the cooling tower (with 14 independent sections each with a fan). From the pipes of the cooling system water is taken to serve other purposes such as cooling of bearings and cooling of gas hydrogen to cool the turbine shaft bearings. Some blow-down water is reused is the hydraulic transportation of bottom ash. 2. Determinants of water flow: The cooling load is the primary determinant of the cooling water flow. When generation is lower than less water is evaporated and less make-up water is needed. Another factor affecting the volume of make-up water is the quality of groundwater. The high contents of iron (14 mg/L) and manganese affects the maximum conductivity of the recirculating cooling water before it has to be bled off. The makeup water is generally flowing at 2,000 to 3,000 gpm (right at the return water tank at cooling towers). The maximum conductivity of the circulating water is maintained between 1,200 and 1,300 µS (micro simmens). 3. Flow measurement: The volume of flow is measured at the well pumps with integrating meters (Magflow make). Monthly records of flows are available. All other flows of water are estimated. Some blow-down and ash handling water is discharged to the environment is reported as part of two NPDES permits. It represents a couple of millions of gallons per day (mgd) of water discharged to the ditch. All the auxiliary uses of water are subtracted from the intake volume (make-up water). There are also elbow flow meters on the condensers but these are used only to optimize the cooling performance of the condensers. 4. Terminology: The interviewee has never used a ratio of water use to generation (i.e., gal/kWh) but he thinks it is a useful measure of efficiency. 5. Other issues: The speed of the shaft is kept constant at 3600 rpm. When reducing electric load per hour, some valves on steam/water could be adjusted. The generation is adjusted by electro-magnetic control on the generator coils. The interviewee has agreed to review the draft mail survey questionnaire.
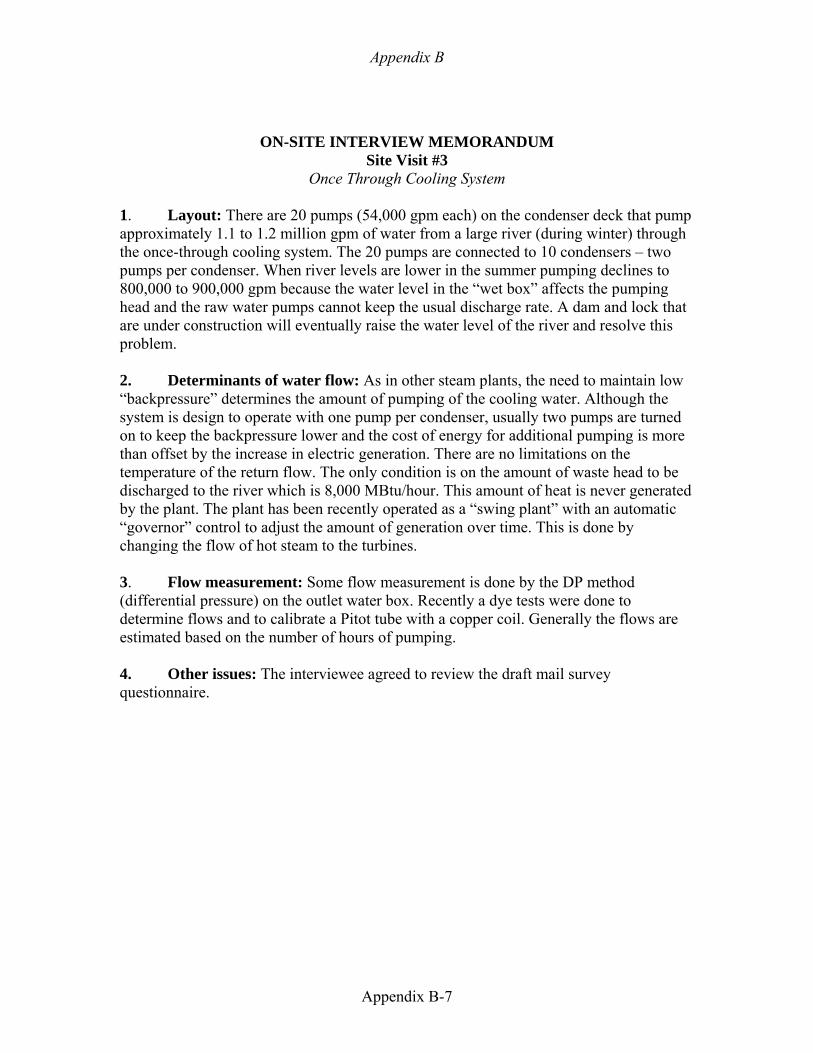
Appendix B
Appendix B-7
ON-SITE INTERVIEW MEMORANDUM Site Visit #3
Once Through Cooling System 1. Layout: There are 20 pumps (54,000 gpm each) on the condenser deck that pump approximately 1.1 to 1.2 million gpm of water from a large river (during winter) through the once-through cooling system. The 20 pumps are connected to 10 condensers – two pumps per condenser. When river levels are lower in the summer pumping declines to 800,000 to 900,000 gpm because the water level in the “wet box” affects the pumping head and the raw water pumps cannot keep the usual discharge rate. A dam and lock that are under construction will eventually raise the water level of the river and resolve this problem. 2. Determinants of water flow: As in other steam plants, the need to maintain low “backpressure” determines the amount of pumping of the cooling water. Although the system is design to operate with one pump per condenser, usually two pumps are turned on to keep the backpressure lower and the cost of energy for additional pumping is more than offset by the increase in electric generation. There are no limitations on the temperature of the return flow. The only condition is on the amount of waste head to be discharged to the river which is 8,000 MBtu/hour. This amount of heat is never generated by the plant. The plant has been recently operated as a “swing plant” with an automatic “governor” control to adjust the amount of generation over time. This is done by changing the flow of hot steam to the turbines. 3. Flow measurement: Some flow measurement is done by the DP method (differential pressure) on the outlet water box. Recently a dye tests were done to determine flows and to calibrate a Pitot tube with a copper coil. Generally the flows are estimated based on the number of hours of pumping. 4. Other issues: The interviewee agreed to review the draft mail survey questionnaire.
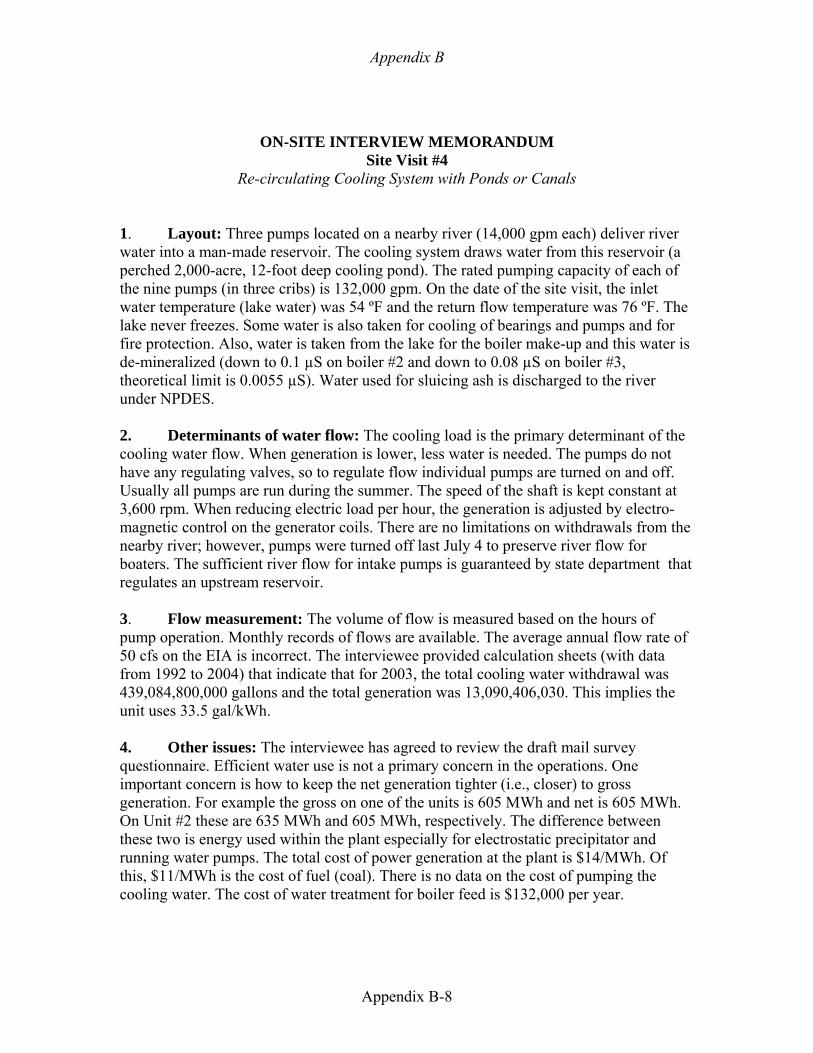
Appendix B
Appendix B-8
ON-SITE INTERVIEW MEMORANDUM Site Visit #4
Re-circulating Cooling System with Ponds or Canals 1. Layout: Three pumps located on a nearby river (14,000 gpm each) deliver river water into a man-made reservoir. The cooling system draws water from this reservoir (a perched 2,000-acre, 12-foot deep cooling pond). The rated pumping capacity of each of the nine pumps (in three cribs) is 132,000 gpm. On the date of the site visit, the inlet water temperature (lake water) was 54 ºF and the return flow temperature was 76 ºF. The lake never freezes. Some water is also taken for cooling of bearings and pumps and for fire protection. Also, water is taken from the lake for the boiler make-up and this water is de-mineralized (down to 0.1 µS on boiler #2 and down to 0.08 µS on boiler #3, theoretical limit is 0.0055 µS). Water used for sluicing ash is discharged to the river under NPDES. 2. Determinants of water flow: The cooling load is the primary determinant of the cooling water flow. When generation is lower, less water is needed. The pumps do not have any regulating valves, so to regulate flow individual pumps are turned on and off. Usually all pumps are run during the summer. The speed of the shaft is kept constant at 3,600 rpm. When reducing electric load per hour, the generation is adjusted by electro-magnetic control on the generator coils. There are no limitations on withdrawals from the nearby river; however, pumps were turned off last July 4 to preserve river flow for boaters. The sufficient river flow for intake pumps is guaranteed by state department that regulates an upstream reservoir. 3. Flow measurement: The volume of flow is measured based on the hours of pump operation. Monthly records of flows are available. The average annual flow rate of 50 cfs on the EIA is incorrect. The interviewee provided calculation sheets (with data from 1992 to 2004) that indicate that for 2003, the total cooling water withdrawal was 439,084,800,000 gallons and the total generation was 13,090,406,030. This implies the unit uses 33.5 gal/kWh. 4. Other issues: The interviewee has agreed to review the draft mail survey questionnaire. Efficient water use is not a primary concern in the operations. One important concern is how to keep the net generation tighter (i.e., closer) to gross generation. For example the gross on one of the units is 605 MWh and net is 605 MWh. On Unit #2 these are 635 MWh and 605 MWh, respectively. The difference between these two is energy used within the plant especially for electrostatic precipitator and running water pumps. The total cost of power generation at the plant is $14/MWh. Of this, $11/MWh is the cost of fuel (coal). There is no data on the cost of pumping the cooling water. The cost of water treatment for boiler feed is $132,000 per year.
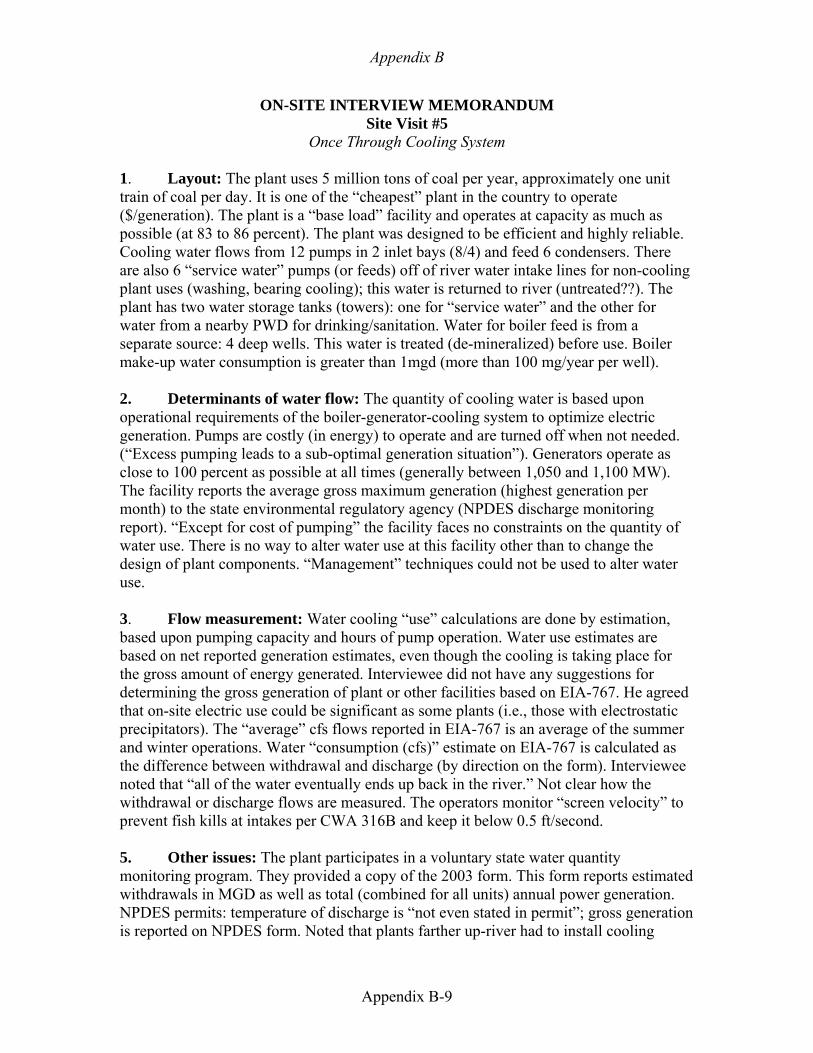
Appendix B
Appendix B-9
ON-SITE INTERVIEW MEMORANDUM Site Visit #5
Once Through Cooling System 1. Layout: The plant uses 5 million tons of coal per year, approximately one unit train of coal per day. It is one of the “cheapest” plant in the country to operate ($/generation). The plant is a “base load” facility and operates at capacity as much as possible (at 83 to 86 percent). The plant was designed to be efficient and highly reliable. Cooling water flows from 12 pumps in 2 inlet bays (8/4) and feed 6 condensers. There are also 6 “service water” pumps (or feeds) off of river water intake lines for non-cooling plant uses (washing, bearing cooling); this water is returned to river (untreated??). The plant has two water storage tanks (towers): one for “service water” and the other for water from a nearby PWD for drinking/sanitation. Water for boiler feed is from a separate source: 4 deep wells. This water is treated (de-mineralized) before use. Boiler make-up water consumption is greater than 1mgd (more than 100 mg/year per well). 2. Determinants of water flow: The quantity of cooling water is based upon operational requirements of the boiler-generator-cooling system to optimize electric generation. Pumps are costly (in energy) to operate and are turned off when not needed. (“Excess pumping leads to a sub-optimal generation situation”). Generators operate as close to 100 percent as possible at all times (generally between 1,050 and 1,100 MW). The facility reports the average gross maximum generation (highest generation per month) to the state environmental regulatory agency (NPDES discharge monitoring report). “Except for cost of pumping” the facility faces no constraints on the quantity of water use. There is no way to alter water use at this facility other than to change the design of plant components. “Management” techniques could not be used to alter water use. 3. Flow measurement: Water cooling “use” calculations are done by estimation, based upon pumping capacity and hours of pump operation. Water use estimates are based on net reported generation estimates, even though the cooling is taking place for the gross amount of energy generated. Interviewee did not have any suggestions for determining the gross generation of plant or other facilities based on EIA-767. He agreed that on-site electric use could be significant as some plants (i.e., those with electrostatic precipitators). The “average” cfs flows reported in EIA-767 is an average of the summer and winter operations. Water “consumption (cfs)” estimate on EIA-767 is calculated as the difference between withdrawal and discharge (by direction on the form). Interviewee noted that “all of the water eventually ends up back in the river.” Not clear how the withdrawal or discharge flows are measured. The operators monitor “screen velocity” to prevent fish kills at intakes per CWA 316B and keep it below 0.5 ft/second. 5. Other issues: The plant participates in a voluntary state water quantity monitoring program. They provided a copy of the 2003 form. This form reports estimated withdrawals in MGD as well as total (combined for all units) annual power generation. NPDES permits: temperature of discharge is “not even stated in permit”; gross generation is reported on NPDES form. Noted that plants farther up-river had to install cooling

Appendix B
Appendix B-10
towers because there is less flow upstream of input of secondary rivers. The interviewee could not provide any suggestions on how to increase survey returns. He did give example of “getting into trouble” by releasing information (unclear how). He was not optimistic about participation of power plant personnel in any type of voluntary survey.

Appendix C-1
APPENDIX C
SURVEY COVER LETTER, SURVEY FORMS AND TABLES INTRODUCTION
This appendix presents the survey forms and tables that were used to conduct the survey component of this study. The eight cooling systems types that are designated in the Form EIA-767 were collapsed into three general categories for the purpose of the survey:
1. OX = Once-Through Cooling Systems; 2. RC = Recirculating Cooling Systems with Ponds and Canals; and 3. RX = Closed –Loop Cooling Systems with Cooling Towers.
The assignment of each cooling system type to a survey category is shown in Table B.1.
Table B.1 Assignment of Cooling Types to Survey Categories
Cooling System Type Description
Cooling System Type Code
Survey Category
Once through, fresh water OF OX Recirculating with forced draft cooling tower(s) RF RX Recirculating with induced draft cooling tower(s) RI RX Once through, saline water OS OX Recirculating with cooling pond(s) or canal(s) RC RC Recirculating with natural draft cooling tower(s) RN RX Once through with cooling pond(s) or canal(s) OC OX Other types OT Not included
While the general form of the survey was the same for all survey categories, the
“check-off” responses differed slightly for each category, resulting in three versions of the survey.
Several questions on each survey asked respondents to compare their own estimates of water use at their facility to a water use coefficient (gal/kWh) that had been calculated from the data available in the 2003 Form EIA-767, as well as to compare water use at their facility to that of others with similar cooling systems. These coefficients were presented in the form of a table. Because information for nuclear power generating facilities was last available in the 2000 Form EIA-767, a separate table was prepared for these facilities.
A cover letter was sent as an email attachment to all Form EIA-767 managers. The cover letter, three sets of surveys, and six coefficient tables appear on the following pages. Please note that these coefficients may not represent actual water use at these facilities.

Appendix C
Appendix C-2
COVER LETTER FOR EMAIL SURVEY Subject Line: Request for your participation in a study of power plant water use Contact Name Power Plant Name/Plant Owner Name City, State Dear Contact Name:
I am writing to request your help in a study of power plant water use. This study is sponsored by National Institutes of Water Resources (NIWR) and is being conducted by researchers from Southern Illinois University Carbondale (SIUC). This research will examine how water is used, and the way that this water use is measured at power plants across the country.
You have received this email message and attached survey form because you are identified as the “contact
person” on the Energy Information Administration’s Form EIA-767, for the year 2003. Attached to this email message is a short survey in the form of a Microsoft Word document. The questions
on the survey ask about the measurement of generation and water use at your facility. A large table of power plant generation and water withdrawals is included with the survey, and you will also be asked to compare water use at your facility to that of other plants throughout the country.
If it would be more appropriate for another person at your facility to respond to this survey, please forward
this email message and attachment to that person immediately. Or, if your utility operates more than one generating facility, please forward this message to the persons who are most knowledgeable about generation and water use measurement at each facility.
The survey will take about 15 or 20 minutes to complete. Please complete and return the survey to us as
soon as possible. If you would prefer to respond using a paper copy of the survey, please let us know by sending a brief reply to this email. If you did not receive, or cannot open the survey attachment, copies of the survey are also available on the SIUC Geography Department website at: http://www.geography.siu.edu/Research/research.html
Your responses to this survey will be treated with confidentiality, and individual survey responses will not
be attributed to either power utilities or responding individuals, without expressed written permission. The findings from this survey will be used in the development of water usage benchmarks for cooling systems at power generation facilities. A Project Completion Report will be prepared for NIWR, and will be available on SIUC Geography Department websites. Copies of the Executive Summary of this report will be emailed to all survey participants.
Your participation in this study will greatly enhance our ability to produce a meaningful analysis of thermoelectric water use in the U.S. However, participation in this study is voluntary, and you are under no obligation to participate. If for any reason your facility is unable to participate in this survey, please notify me immediately by sending a brief reply to this email. Your response will prevent us from sending you follow-up mailings requesting your participation.
If you have any questions about the survey or the research project, please contact me at (618) 453-6021, or
by email at: [email protected]. Thank you for taking the time to consider participating in this research study. Sincerely, Ben Dziegielewski, Professor Department of Geography and Environmental Resources Southern Illinois University Carbondale
This project has been reviewed and approved by the Southern Illinois University Human Subjects Committee. Questions concerning your rights as a participant in this research may be addressed to the Committee Chairperson, Office of Research and Development Administration, Southern Illinois University, Carbondale, IL 62901-4709; Phone: (618) 453-4533.
Appendix C
Once-Through Cooling Systems Survey Appendix C-3
National Survey of Water Use at Thermoelectric Power Plants
A research project sponsored by the
National Institutes for
Water Resources
conducted by the
Department of Geography and Environmental Resources
Southern Illinois University Carbondale Purpose This survey is one part of a research project to study power plant water withdrawals and consumptive use in the United States. The purpose of this research is to improve the understanding of power plant water use and to develop benchmarks that will facilitate water use evaluations by generation facility managers. A complete description of this project is available on the web site of the National Institutes of Water Resources: http://water.usgs.gov/wrri/04grants/national/nationalindex.html. Instructions This survey consists of 14 questions. Please read each question carefully and provide answers based upon your understanding of the water use operations at your generating facility and the power generation industry as a whole. Answer each question by checking the appropriate boxes or typing in a brief response. Please note that the number of pages may increase as you complete the questionnaire, but this will not affect our ability to properly record your answers. A comments section is included at the end of this form, and any comments that you may have would be welcomed. Please return your survey by saving the completed file and attaching it to a reply email message. If you have any questions about this survey or the research project, please contact Ben Dziegielewski at (618) 453-6021, or by email at: [email protected]. This project has been reviewed and approved by the Southern Illinois University Human Subjects Committee. Questions concerning your rights as a participant in this research may be addressed to the Committee Chairperson, Office of Research and Development Administration, Southern Illinois University, Carbondale, IL 62901-4709; Phone: (618) 453-4533. There is no penalty for not participating in this survey.
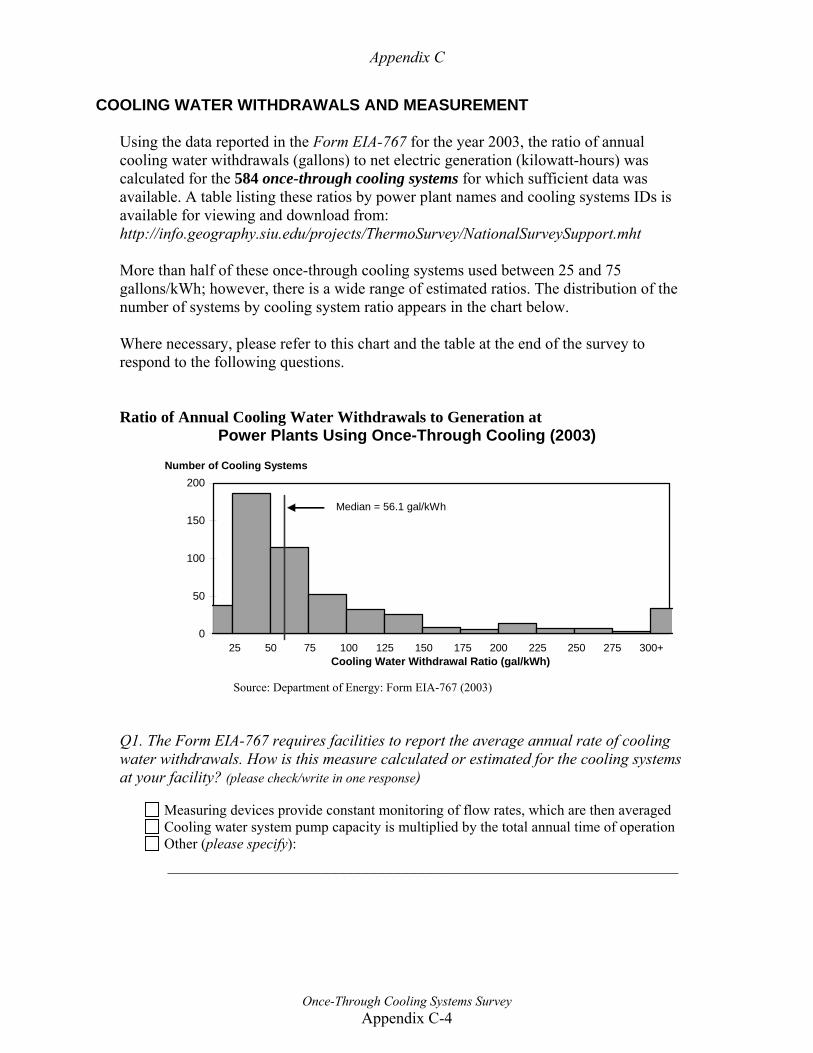
Appendix C
Once-Through Cooling Systems Survey Appendix C-4
COOLING WATER WITHDRAWALS AND MEASUREMENT Using the data reported in the Form EIA-767 for the year 2003, the ratio of annual cooling water withdrawals (gallons) to net electric generation (kilowatt-hours) was calculated for the 584 once-through cooling systems for which sufficient data was available. A table listing these ratios by power plant names and cooling systems IDs is available for viewing and download from: http://info.geography.siu.edu/projects/ThermoSurvey/NationalSurveySupport.mht More than half of these once-through cooling systems used between 25 and 75 gallons/kWh; however, there is a wide range of estimated ratios. The distribution of the number of systems by cooling system ratio appears in the chart below. Where necessary, please refer to this chart and the table at the end of the survey to respond to the following questions. Ratio of Annual Cooling Water Withdrawals to Generation at
Power Plants Using Once-Through Cooling (2003)
0
50
100
150
200
Cooling Water Withdrawal Ratio (gal/kWh)
Median = 56.1 gal/kWh
Number of Cooling Systems
25 50 75 100 125 150 175 200 225 250 275 300+
Source: Department of Energy: Form EIA-767 (2003)
Q1. The Form EIA-767 requires facilities to report the average annual rate of cooling water withdrawals. How is this measure calculated or estimated for the cooling systems at your facility? (please check/write in one response)
Measuring devices provide constant monitoring of flow rates, which are then averaged Cooling water system pump capacity is multiplied by the total annual time of operation Other (please specify): ________________________________________________________________
Appendix C
Once-Through Cooling Systems Survey Appendix C-5
Q2. Please find the withdrawal ratios for the cooling system(s) at your facility in the table of cooling system ratios that is available. Do the ratios that were calculated for your cooling systems appear to be correct?
Don’t know, we are not able to estimate the ratio of cooling water withdrawals to net generation at our facility
Yes, the ratio(s) for our facility are consistent with our own estimates No, these ratios do not accurately represent cooling water use at our facility.
A more accurate estimate of the gallons of water withdrawals per kilowatt-hours of generation can be the determined by: (please specify more accurate data or calculation method):
________________________________________________________________ Q3. Please refer to the chart on the previous page. Do the estimated cooling water withdrawal ratios for the cooling systems at your facility differ significantly from the 56.1 gal/kWh median value for once-through cooling systems? If so, what do you think are the principal reason(s) for this difference?
No, the ratio(s) for our facility do not differ significantly from the median value Yes, the water withdrawals of the cooling system(s) at our facility differ significantly from the national average for once-through cooling system because: (please specify): ________________________________________________________________
Q4. What plant- or system-specific characteristics or conditions do you think contribute to the wide range of once-through cooling system withdrawals ratios that are evident in the figure above and in the table of cooling water withdrawal ratios? (check all that apply and/or write in other relevant factors)
Differences in the way that cooling water withdrawals are estimated or reported Differences in the ratio of net-to-gross generation at each facility Differences in the designed temperature rise of the condenser(s) in use at each facility Differences in maintaining optimal turbine “backpressure” that affect water flow Differences in the frequency and length of time of boiler/generator shutdowns Differences in other conditions/circumstances: (please specify): ________________________________________________________________
Appendix C
Once-Through Cooling Systems Survey Appendix C-6
Q5. Water consumption is defined in EIA-767 as the difference between cooling water withdrawal and discharge. Is it possible to measure or estimate cooling water consumption at your facility?
No, it is not possible to measure or estimate consumptive use of water because: (check all that apply or write in other applicable reasons):
No cooling water discharge measuring devices are available Estimates of discharge based upon equipment characteristics are not possible Other (please specify): _________________________________
Yes, cooling system water consumption was measured (or estimated) at our facility using the following method:
________________________________________________________________
Q6. What are some of the possible sources of cooling water consumptive use at facilities using once-through cooling systems? (check all that apply and/or write in relevant factors)
There is no measurable consumptive water use in once-through cooling systems Significant amounts of cooling water are diverted to other uses in some facilities where the diverted water is lost or evaporated
Inaccurate estimation procedures for cooling systems discharge flow rates (used to calculate consumption) result in inflated estimates of consumptive use
Frequent starting up and shutting down of the generators increases consumptive use because steam is vented to the atmosphere when the boiler is started up and shut down
Other conditions/circumstances: (please specify) ________________________________________________________________
Q7. Are there any non-cooling water needs at your facility that use water from the cooling system?
No, all reported cooling water withdrawals are used only for generation process cooling Yes, there are some non-cooling diversions of water from the cooling water system.
These include: (please describe and estimate quantity of each use): Use 1: _______________ Quantity: _____ mgd/yr Use 2: _______________ Quantity: _____ mgd/yr Use 3: _______________ Quantity: _____ mgd/yr
Appendix C
Once-Through Cooling Systems Survey Appendix C-7
Q8. Form EIA-767 requires that power plants report NET GENERATION for each generator. How is NET GENERATION calculated for the generators at your facility? (please check one and/or write in response)
Metering is available to measure both the gross generation and the service load energy for each generator
Plant–level generation is metered as it is delivered to the grid. Generation for each generator is estimated based on hours of operation or other operational measures. Net generation is calculated by deducting a portion of the total plant service load from the estimated production of each generator.
Service load energy is estimated and deducted from the metered gross generation of each generator unit
Other measurement or estimation procedure (please specify): ___________________________
Q9. Does your facility maintain a record of GROSS GENERATION for EACH generator at your POWER PLANT? If so, approximately what percent of gross generation on annual basis does net generation represent at your facility? (please check one and/or write in response)
Yes, records of gross generation for each generator ARE available. On an annual basis, net generation is equal to approximately % of gross generation
No, it is not possible to measure or record gross generation for each generator Other (please specify): ___________________________
Q10. Does your facility measure and record the ANNUAL TOTAL WATER WITHDRAWALS for your facility?
Yes, records of total water withdrawals ARE available. No, it is not possible to measure total withdrawals for our facility Other (please specify): ___________________________

Appendix C
Once-Through Cooling Systems Survey Appendix C-8
Q11. Are there any constraints to cooling water withdrawals at your plant? (please check all that apply)
Volume limitations mandated under NPDES Temperature limitations mandated under NPDES Water withdrawals are fixed under State permitting requirements High summer water temperatures and/or low flows in the source may require generation reductions to prevent overheating
Other limitation (please specify):
___________________________ Q12. Do you currently use any “alternative” sources of water at your plant? (please check all that apply)
No Yes, these include:
Recycled water from ash ponds Municipal wastewater Brackish groundwater from oil/gas generation Water from mine dewatering operations Other alternative sources (please specify):
___________________________ Q13. If water intake from your current source had to be reduced in response to severe weather conditions or regulatory restrictions, what actions could be taken at your plant to respond to these conditions? (please check all that apply and/or add additional alternatives)
Reduce generation Install cooling towers Operate generators at less than optimal back pressure Obtain supplemental intake waters from other sources (including recycled water) Alter cooling water intakes and/or outflows structures to improve cooling system efficiencies
Other adjustments (please specify):
___________________________

Appendix C
Once-Through Cooling Systems Survey Appendix C-9
RESPONDENT INFORMATION Q14. What is the NAME and Plant ID number of your power plant?
Plant Name: _________ Plant ID #: __________
What is your title and water management responsibilities? (optional) Title: __________________________________________________ Plant water management responsibilities: (please check all that apply)
Complete Form EIA-767 Complete NPDS forms Record water use data Manage cooling controls Monitor plant water use Make decisions on in-plant water management Other: ________________________________________________
If you would be willing to discuss water use at your facility with us via phone or email, please enter your contact information below: Name: _________
Phone: _________
Email: _________
COMMENTS AND SUGGESTIONS Please use the space below to communicate any concerns or comments regarding this study, or contact Ben Dziegielewski at 618-453-6021, or by email at: [email protected] . Thank you for responding to this survey.
PLEASE SAVE YOUR COMPLETED SURVEY DOCUMENT TO THE DESKTOP OF YOUR COMPUTER.
RETURN THE SURVEY BY ATTACHING IT TO A REPLY TO OUR COVER
LETTER, OR SEND A NEW MESSAGE TO: [email protected].
Once completed, the final project report for this study will be available on the research page of the SIUC Geography Department:: http://info.geography.siu.edu/Research/research.html .
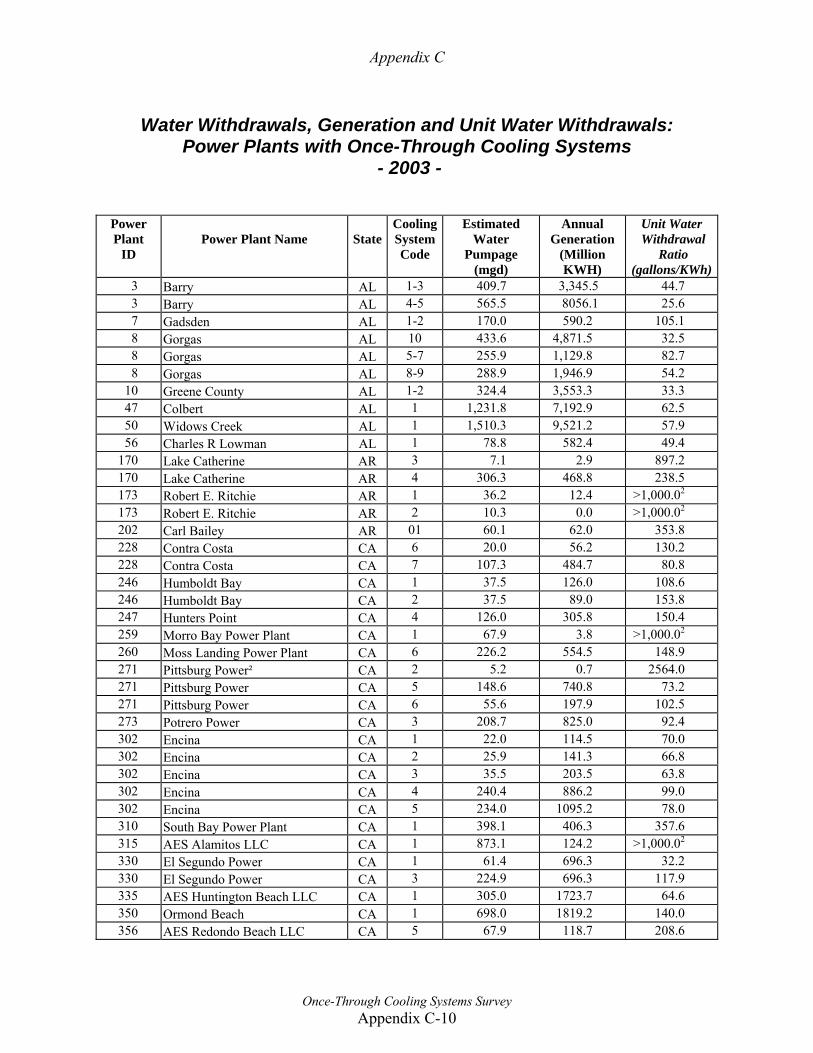
Appendix C
Once-Through Cooling Systems Survey Appendix C-10
Water Withdrawals, Generation and Unit Water Withdrawals:
Power Plants with Once-Through Cooling Systems - 2003 -
Power Plant
ID
Power Plant Name
State
CoolingSystemCode
Estimated Water
Pumpage (mgd)
Annual Generation
(Million KWH)
Unit Water Withdrawal
Ratio (gallons/KWh)
3 Barry AL 1-3 409.7 3,345.5 44.7 3 Barry AL 4-5 565.5 8056.1 25.6 7 Gadsden AL 1-2 170.0 590.2 105.1 8 Gorgas AL 10 433.6 4,871.5 32.5 8 Gorgas AL 5-7 255.9 1,129.8 82.7 8 Gorgas AL 8-9 288.9 1,946.9 54.2
10 Greene County AL 1-2 324.4 3,553.3 33.3 47 Colbert AL 1 1,231.8 7,192.9 62.5 50 Widows Creek AL 1 1,510.3 9,521.2 57.9 56 Charles R Lowman AL 1 78.8 582.4 49.4
170 Lake Catherine AR 3 7.1 2.9 897.2 170 Lake Catherine AR 4 306.3 468.8 238.5 173 Robert E. Ritchie AR 1 36.2 12.4 >1,000.02 173 Robert E. Ritchie AR 2 10.3 0.0 >1,000.02 202 Carl Bailey AR 01 60.1 62.0 353.8 228 Contra Costa CA 6 20.0 56.2 130.2 228 Contra Costa CA 7 107.3 484.7 80.8 246 Humboldt Bay CA 1 37.5 126.0 108.6 246 Humboldt Bay CA 2 37.5 89.0 153.8 247 Hunters Point CA 4 126.0 305.8 150.4 259 Morro Bay Power Plant CA 1 67.9 3.8 >1,000.02 260 Moss Landing Power Plant CA 6 226.2 554.5 148.9 271 Pittsburg Power² CA 2 5.2 0.7 2564.0 271 Pittsburg Power CA 5 148.6 740.8 73.2 271 Pittsburg Power CA 6 55.6 197.9 102.5 273 Potrero Power CA 3 208.7 825.0 92.4 302 Encina CA 1 22.0 114.5 70.0 302 Encina CA 2 25.9 141.3 66.8 302 Encina CA 3 35.5 203.5 63.8 302 Encina CA 4 240.4 886.2 99.0 302 Encina CA 5 234.0 1095.2 78.0 310 South Bay Power Plant CA 1 398.1 406.3 357.6 315 AES Alamitos LLC CA 1 873.1 124.2 >1,000.02 330 El Segundo Power CA 1 61.4 696.3 32.2 330 El Segundo Power CA 3 224.9 696.3 117.9 335 AES Huntington Beach LLC CA 1 305.0 1723.7 64.6 350 Ormond Beach CA 1 698.0 1819.2 140.0 356 AES Redondo Beach LLC CA 5 67.9 118.7 208.6
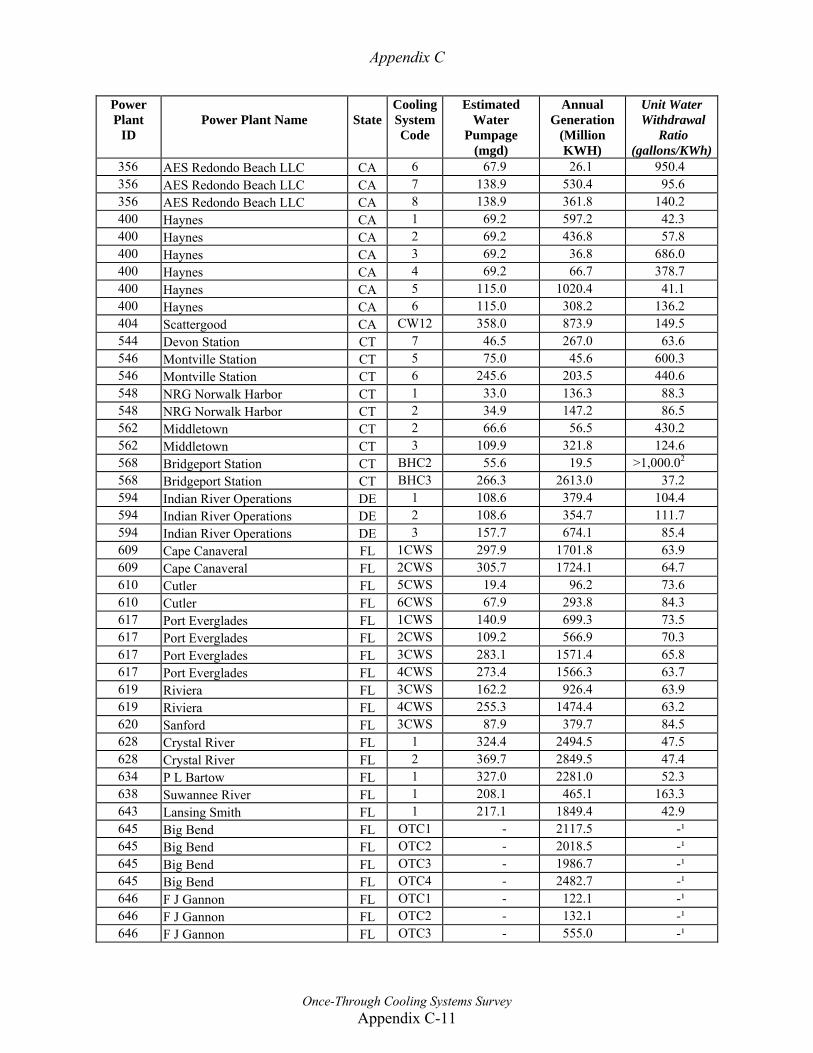
Appendix C
Once-Through Cooling Systems Survey Appendix C-11
Power Plant
ID
Power Plant Name
State
CoolingSystemCode
Estimated Water
Pumpage (mgd)
Annual Generation
(Million KWH)
Unit Water Withdrawal
Ratio (gallons/KWh)
356 AES Redondo Beach LLC CA 6 67.9 26.1 950.4 356 AES Redondo Beach LLC CA 7 138.9 530.4 95.6 356 AES Redondo Beach LLC CA 8 138.9 361.8 140.2 400 Haynes CA 1 69.2 597.2 42.3 400 Haynes CA 2 69.2 436.8 57.8 400 Haynes CA 3 69.2 36.8 686.0 400 Haynes CA 4 69.2 66.7 378.7 400 Haynes CA 5 115.0 1020.4 41.1 400 Haynes CA 6 115.0 308.2 136.2 404 Scattergood CA CW12 358.0 873.9 149.5 544 Devon Station CT 7 46.5 267.0 63.6 546 Montville Station CT 5 75.0 45.6 600.3 546 Montville Station CT 6 245.6 203.5 440.6 548 NRG Norwalk Harbor CT 1 33.0 136.3 88.3 548 NRG Norwalk Harbor CT 2 34.9 147.2 86.5 562 Middletown CT 2 66.6 56.5 430.2 562 Middletown CT 3 109.9 321.8 124.6 568 Bridgeport Station CT BHC2 55.6 19.5 >1,000.02 568 Bridgeport Station CT BHC3 266.3 2613.0 37.2 594 Indian River Operations DE 1 108.6 379.4 104.4 594 Indian River Operations DE 2 108.6 354.7 111.7 594 Indian River Operations DE 3 157.7 674.1 85.4 609 Cape Canaveral FL 1CWS 297.9 1701.8 63.9 609 Cape Canaveral FL 2CWS 305.7 1724.1 64.7 610 Cutler FL 5CWS 19.4 96.2 73.6 610 Cutler FL 6CWS 67.9 293.8 84.3 617 Port Everglades FL 1CWS 140.9 699.3 73.5 617 Port Everglades FL 2CWS 109.2 566.9 70.3 617 Port Everglades FL 3CWS 283.1 1571.4 65.8 617 Port Everglades FL 4CWS 273.4 1566.3 63.7 619 Riviera FL 3CWS 162.2 926.4 63.9 619 Riviera FL 4CWS 255.3 1474.4 63.2 620 Sanford FL 3CWS 87.9 379.7 84.5 628 Crystal River FL 1 324.4 2494.5 47.5 628 Crystal River FL 2 369.7 2849.5 47.4 634 P L Bartow FL 1 327.0 2281.0 52.3 638 Suwannee River FL 1 208.1 465.1 163.3 643 Lansing Smith FL 1 217.1 1849.4 42.9 645 Big Bend FL OTC1 - 2117.5 -¹ 645 Big Bend FL OTC2 - 2018.5 -¹ 645 Big Bend FL OTC3 - 1986.7 -¹ 645 Big Bend FL OTC4 - 2482.7 -¹ 646 F J Gannon FL OTC1 - 122.1 -¹ 646 F J Gannon FL OTC2 - 132.1 -¹ 646 F J Gannon FL OTC3 - 555.0 -¹
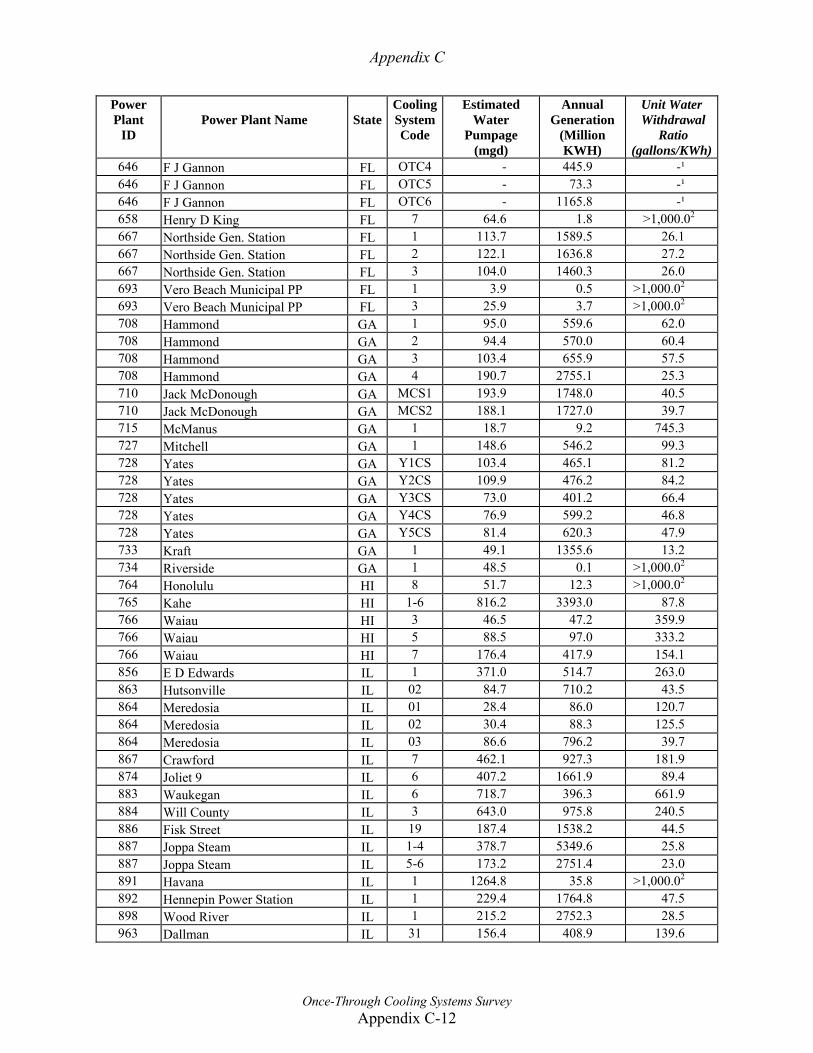
Appendix C
Once-Through Cooling Systems Survey Appendix C-12
Power Plant
ID
Power Plant Name
State
CoolingSystemCode
Estimated Water
Pumpage (mgd)
Annual Generation
(Million KWH)
Unit Water Withdrawal
Ratio (gallons/KWh)
646 F J Gannon FL OTC4 - 445.9 -¹ 646 F J Gannon FL OTC5 - 73.3 -¹ 646 F J Gannon FL OTC6 - 1165.8 -¹ 658 Henry D King FL 7 64.6 1.8 >1,000.02 667 Northside Gen. Station FL 1 113.7 1589.5 26.1 667 Northside Gen. Station FL 2 122.1 1636.8 27.2 667 Northside Gen. Station FL 3 104.0 1460.3 26.0 693 Vero Beach Municipal PP FL 1 3.9 0.5 >1,000.02 693 Vero Beach Municipal PP FL 3 25.9 3.7 >1,000.02 708 Hammond GA 1 95.0 559.6 62.0 708 Hammond GA 2 94.4 570.0 60.4 708 Hammond GA 3 103.4 655.9 57.5 708 Hammond GA 4 190.7 2755.1 25.3 710 Jack McDonough GA MCS1 193.9 1748.0 40.5 710 Jack McDonough GA MCS2 188.1 1727.0 39.7 715 McManus GA 1 18.7 9.2 745.3 727 Mitchell GA 1 148.6 546.2 99.3 728 Yates GA Y1CS 103.4 465.1 81.2 728 Yates GA Y2CS 109.9 476.2 84.2 728 Yates GA Y3CS 73.0 401.2 66.4 728 Yates GA Y4CS 76.9 599.2 46.8 728 Yates GA Y5CS 81.4 620.3 47.9 733 Kraft GA 1 49.1 1355.6 13.2 734 Riverside GA 1 48.5 0.1 >1,000.02 764 Honolulu HI 8 51.7 12.3 >1,000.02 765 Kahe HI 1-6 816.2 3393.0 87.8 766 Waiau HI 3 46.5 47.2 359.9 766 Waiau HI 5 88.5 97.0 333.2 766 Waiau HI 7 176.4 417.9 154.1 856 E D Edwards IL 1 371.0 514.7 263.0 863 Hutsonville IL 02 84.7 710.2 43.5 864 Meredosia IL 01 28.4 86.0 120.7 864 Meredosia IL 02 30.4 88.3 125.5 864 Meredosia IL 03 86.6 796.2 39.7 867 Crawford IL 7 462.1 927.3 181.9 874 Joliet 9 IL 6 407.2 1661.9 89.4 883 Waukegan IL 6 718.7 396.3 661.9 884 Will County IL 3 643.0 975.8 240.5 886 Fisk Street IL 19 187.4 1538.2 44.5 887 Joppa Steam IL 1-4 378.7 5349.6 25.8 887 Joppa Steam IL 5-6 173.2 2751.4 23.0 891 Havana IL 1 1264.8 35.8 >1,000.02 892 Hennepin Power Station IL 1 229.4 1764.8 47.5 898 Wood River IL 1 215.2 2752.3 28.5 963 Dallman IL 31 156.4 408.9 139.6
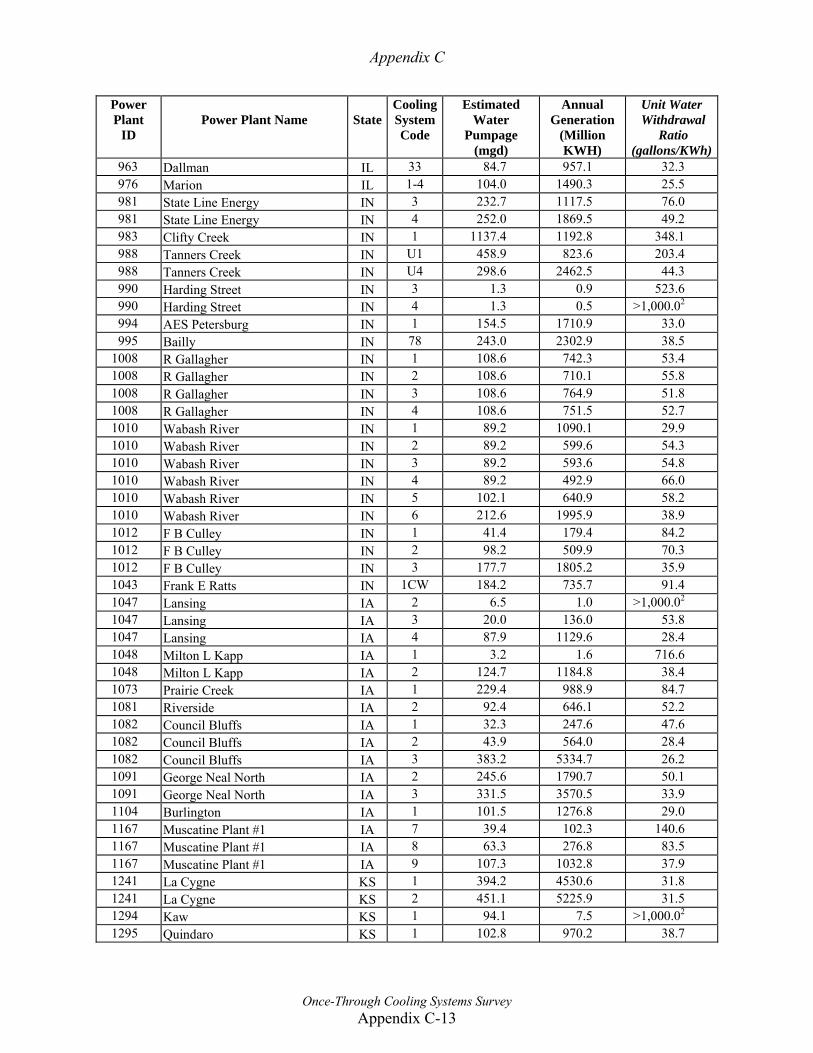
Appendix C
Once-Through Cooling Systems Survey Appendix C-13
Power Plant
ID
Power Plant Name
State
CoolingSystemCode
Estimated Water
Pumpage (mgd)
Annual Generation
(Million KWH)
Unit Water Withdrawal
Ratio (gallons/KWh)
963 Dallman IL 33 84.7 957.1 32.3 976 Marion IL 1-4 104.0 1490.3 25.5 981 State Line Energy IN 3 232.7 1117.5 76.0 981 State Line Energy IN 4 252.0 1869.5 49.2 983 Clifty Creek IN 1 1137.4 1192.8 348.1 988 Tanners Creek IN U1 458.9 823.6 203.4 988 Tanners Creek IN U4 298.6 2462.5 44.3 990 Harding Street IN 3 1.3 0.9 523.6 990 Harding Street IN 4 1.3 0.5 >1,000.02 994 AES Petersburg IN 1 154.5 1710.9 33.0 995 Bailly IN 78 243.0 2302.9 38.5
1008 R Gallagher IN 1 108.6 742.3 53.4 1008 R Gallagher IN 2 108.6 710.1 55.8 1008 R Gallagher IN 3 108.6 764.9 51.8 1008 R Gallagher IN 4 108.6 751.5 52.7 1010 Wabash River IN 1 89.2 1090.1 29.9 1010 Wabash River IN 2 89.2 599.6 54.3 1010 Wabash River IN 3 89.2 593.6 54.8 1010 Wabash River IN 4 89.2 492.9 66.0 1010 Wabash River IN 5 102.1 640.9 58.2 1010 Wabash River IN 6 212.6 1995.9 38.9 1012 F B Culley IN 1 41.4 179.4 84.2 1012 F B Culley IN 2 98.2 509.9 70.3 1012 F B Culley IN 3 177.7 1805.2 35.9 1043 Frank E Ratts IN 1CW 184.2 735.7 91.4 1047 Lansing IA 2 6.5 1.0 >1,000.02 1047 Lansing IA 3 20.0 136.0 53.8 1047 Lansing IA 4 87.9 1129.6 28.4 1048 Milton L Kapp IA 1 3.2 1.6 716.6 1048 Milton L Kapp IA 2 124.7 1184.8 38.4 1073 Prairie Creek IA 1 229.4 988.9 84.7 1081 Riverside IA 2 92.4 646.1 52.2 1082 Council Bluffs IA 1 32.3 247.6 47.6 1082 Council Bluffs IA 2 43.9 564.0 28.4 1082 Council Bluffs IA 3 383.2 5334.7 26.2 1091 George Neal North IA 2 245.6 1790.7 50.1 1091 George Neal North IA 3 331.5 3570.5 33.9 1104 Burlington IA 1 101.5 1276.8 29.0 1167 Muscatine Plant #1 IA 7 39.4 102.3 140.6 1167 Muscatine Plant #1 IA 8 63.3 276.8 83.5 1167 Muscatine Plant #1 IA 9 107.3 1032.8 37.9 1241 La Cygne KS 1 394.2 4530.6 31.8 1241 La Cygne KS 2 451.1 5225.9 31.5 1294 Kaw KS 1 94.1 7.5 >1,000.02 1295 Quindaro KS 1 102.8 970.2 38.7
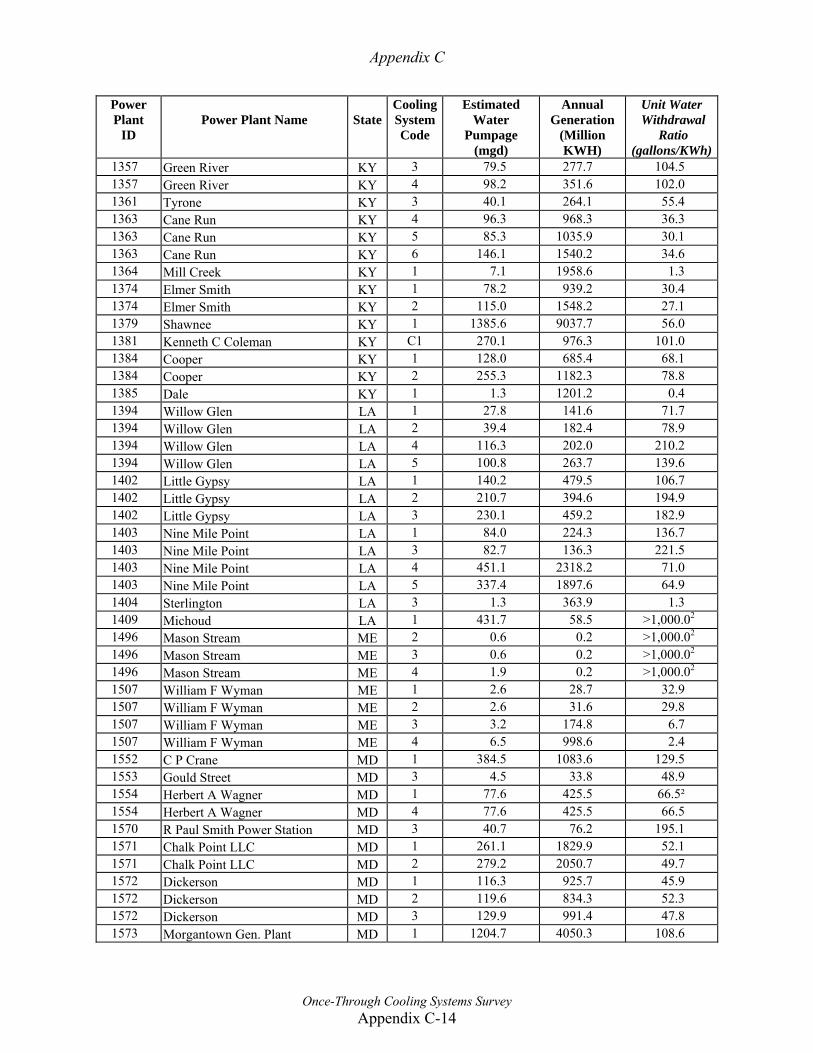
Appendix C
Once-Through Cooling Systems Survey Appendix C-14
Power Plant
ID
Power Plant Name
State
CoolingSystemCode
Estimated Water
Pumpage (mgd)
Annual Generation
(Million KWH)
Unit Water Withdrawal
Ratio (gallons/KWh)
1357 Green River KY 3 79.5 277.7 104.5 1357 Green River KY 4 98.2 351.6 102.0 1361 Tyrone KY 3 40.1 264.1 55.4 1363 Cane Run KY 4 96.3 968.3 36.3 1363 Cane Run KY 5 85.3 1035.9 30.1 1363 Cane Run KY 6 146.1 1540.2 34.6 1364 Mill Creek KY 1 7.1 1958.6 1.3 1374 Elmer Smith KY 1 78.2 939.2 30.4 1374 Elmer Smith KY 2 115.0 1548.2 27.1 1379 Shawnee KY 1 1385.6 9037.7 56.0 1381 Kenneth C Coleman KY C1 270.1 976.3 101.0 1384 Cooper KY 1 128.0 685.4 68.1 1384 Cooper KY 2 255.3 1182.3 78.8 1385 Dale KY 1 1.3 1201.2 0.4 1394 Willow Glen LA 1 27.8 141.6 71.7 1394 Willow Glen LA 2 39.4 182.4 78.9 1394 Willow Glen LA 4 116.3 202.0 210.2 1394 Willow Glen LA 5 100.8 263.7 139.6 1402 Little Gypsy LA 1 140.2 479.5 106.7 1402 Little Gypsy LA 2 210.7 394.6 194.9 1402 Little Gypsy LA 3 230.1 459.2 182.9 1403 Nine Mile Point LA 1 84.0 224.3 136.7 1403 Nine Mile Point LA 3 82.7 136.3 221.5 1403 Nine Mile Point LA 4 451.1 2318.2 71.0 1403 Nine Mile Point LA 5 337.4 1897.6 64.9 1404 Sterlington LA 3 1.3 363.9 1.3 1409 Michoud LA 1 431.7 58.5 >1,000.02 1496 Mason Stream ME 2 0.6 0.2 >1,000.02 1496 Mason Stream ME 3 0.6 0.2 >1,000.02 1496 Mason Stream ME 4 1.9 0.2 >1,000.02 1507 William F Wyman ME 1 2.6 28.7 32.9 1507 William F Wyman ME 2 2.6 31.6 29.8 1507 William F Wyman ME 3 3.2 174.8 6.7 1507 William F Wyman ME 4 6.5 998.6 2.4 1552 C P Crane MD 1 384.5 1083.6 129.5 1553 Gould Street MD 3 4.5 33.8 48.9 1554 Herbert A Wagner MD 1 77.6 425.5 66.5² 1554 Herbert A Wagner MD 4 77.6 425.5 66.5 1570 R Paul Smith Power Station MD 3 40.7 76.2 195.1 1571 Chalk Point LLC MD 1 261.1 1829.9 52.1 1571 Chalk Point LLC MD 2 279.2 2050.7 49.7 1572 Dickerson MD 1 116.3 925.7 45.9 1572 Dickerson MD 2 119.6 834.3 52.3 1572 Dickerson MD 3 129.9 991.4 47.8 1573 Morgantown Gen. Plant MD 1 1204.7 4050.3 108.6
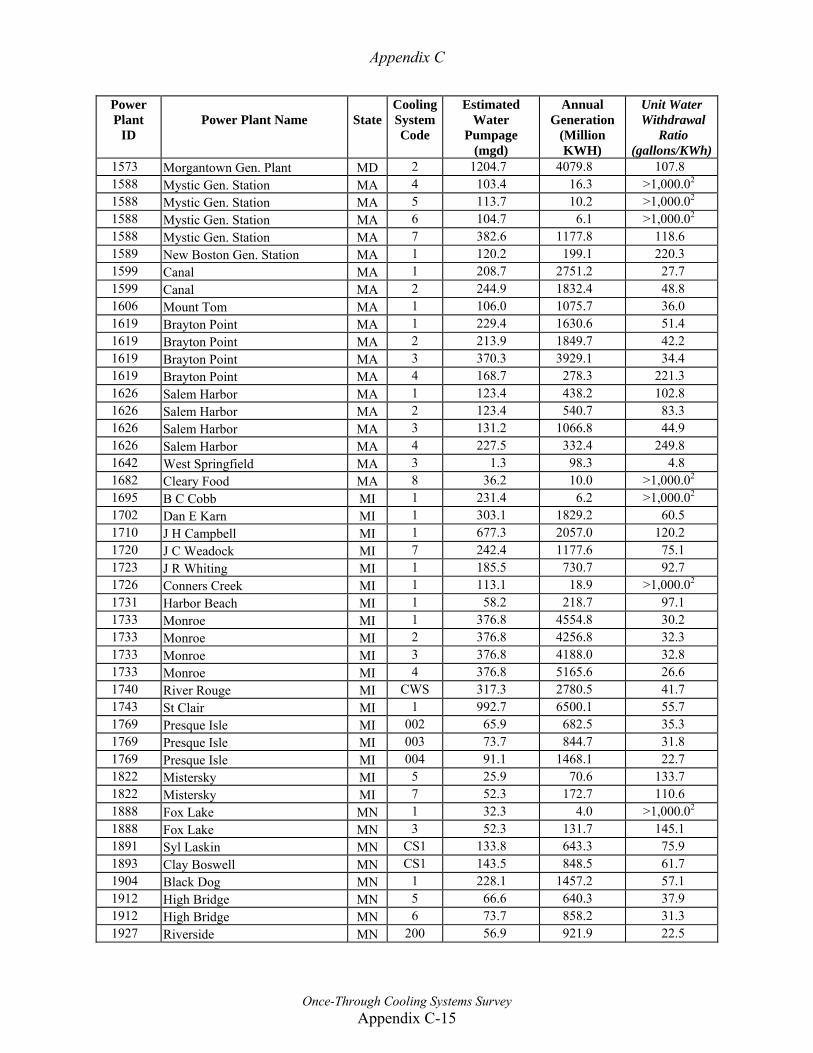
Appendix C
Once-Through Cooling Systems Survey Appendix C-15
Power Plant
ID
Power Plant Name
State
CoolingSystemCode
Estimated Water
Pumpage (mgd)
Annual Generation
(Million KWH)
Unit Water Withdrawal
Ratio (gallons/KWh)
1573 Morgantown Gen. Plant MD 2 1204.7 4079.8 107.8 1588 Mystic Gen. Station MA 4 103.4 16.3 >1,000.02 1588 Mystic Gen. Station MA 5 113.7 10.2 >1,000.02 1588 Mystic Gen. Station MA 6 104.7 6.1 >1,000.02 1588 Mystic Gen. Station MA 7 382.6 1177.8 118.6 1589 New Boston Gen. Station MA 1 120.2 199.1 220.3 1599 Canal MA 1 208.7 2751.2 27.7 1599 Canal MA 2 244.9 1832.4 48.8 1606 Mount Tom MA 1 106.0 1075.7 36.0 1619 Brayton Point MA 1 229.4 1630.6 51.4 1619 Brayton Point MA 2 213.9 1849.7 42.2 1619 Brayton Point MA 3 370.3 3929.1 34.4 1619 Brayton Point MA 4 168.7 278.3 221.3 1626 Salem Harbor MA 1 123.4 438.2 102.8 1626 Salem Harbor MA 2 123.4 540.7 83.3 1626 Salem Harbor MA 3 131.2 1066.8 44.9 1626 Salem Harbor MA 4 227.5 332.4 249.8 1642 West Springfield MA 3 1.3 98.3 4.8 1682 Cleary Food MA 8 36.2 10.0 >1,000.02 1695 B C Cobb MI 1 231.4 6.2 >1,000.02 1702 Dan E Karn MI 1 303.1 1829.2 60.5 1710 J H Campbell MI 1 677.3 2057.0 120.2 1720 J C Weadock MI 7 242.4 1177.6 75.1 1723 J R Whiting MI 1 185.5 730.7 92.7 1726 Conners Creek MI 1 113.1 18.9 >1,000.02 1731 Harbor Beach MI 1 58.2 218.7 97.1 1733 Monroe MI 1 376.8 4554.8 30.2 1733 Monroe MI 2 376.8 4256.8 32.3 1733 Monroe MI 3 376.8 4188.0 32.8 1733 Monroe MI 4 376.8 5165.6 26.6 1740 River Rouge MI CWS 317.3 2780.5 41.7 1743 St Clair MI 1 992.7 6500.1 55.7 1769 Presque Isle MI 002 65.9 682.5 35.3 1769 Presque Isle MI 003 73.7 844.7 31.8 1769 Presque Isle MI 004 91.1 1468.1 22.7 1822 Mistersky MI 5 25.9 70.6 133.7 1822 Mistersky MI 7 52.3 172.7 110.6 1888 Fox Lake MN 1 32.3 4.0 >1,000.02 1888 Fox Lake MN 3 52.3 131.7 145.1 1891 Syl Laskin MN CS1 133.8 643.3 75.9 1893 Clay Boswell MN CS1 143.5 848.5 61.7 1904 Black Dog MN 1 228.1 1457.2 57.1 1912 High Bridge MN 5 66.6 640.3 37.9 1912 High Bridge MN 6 73.7 858.2 31.3 1927 Riverside MN 200 56.9 921.9 22.5
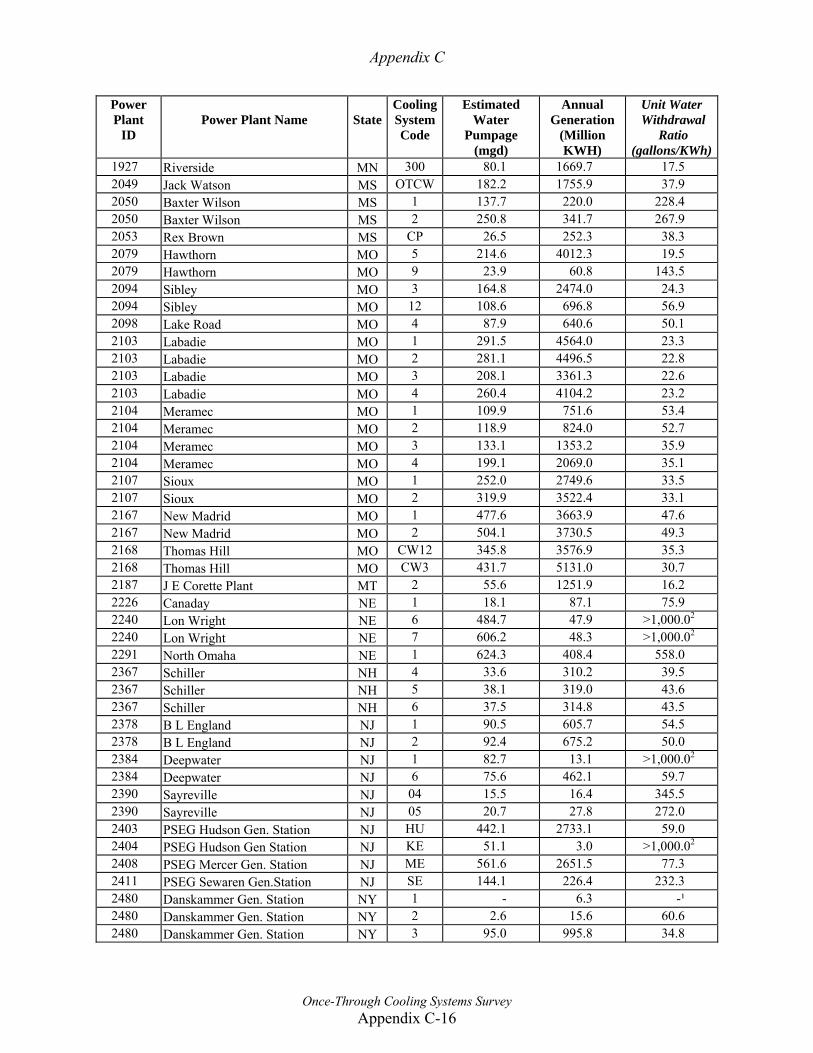
Appendix C
Once-Through Cooling Systems Survey Appendix C-16
Power Plant
ID
Power Plant Name
State
CoolingSystemCode
Estimated Water
Pumpage (mgd)
Annual Generation
(Million KWH)
Unit Water Withdrawal
Ratio (gallons/KWh)
1927 Riverside MN 300 80.1 1669.7 17.5 2049 Jack Watson MS OTCW 182.2 1755.9 37.9 2050 Baxter Wilson MS 1 137.7 220.0 228.4 2050 Baxter Wilson MS 2 250.8 341.7 267.9 2053 Rex Brown MS CP 26.5 252.3 38.3 2079 Hawthorn MO 5 214.6 4012.3 19.5 2079 Hawthorn MO 9 23.9 60.8 143.5 2094 Sibley MO 3 164.8 2474.0 24.3 2094 Sibley MO 12 108.6 696.8 56.9 2098 Lake Road MO 4 87.9 640.6 50.1 2103 Labadie MO 1 291.5 4564.0 23.3 2103 Labadie MO 2 281.1 4496.5 22.8 2103 Labadie MO 3 208.1 3361.3 22.6 2103 Labadie MO 4 260.4 4104.2 23.2 2104 Meramec MO 1 109.9 751.6 53.4 2104 Meramec MO 2 118.9 824.0 52.7 2104 Meramec MO 3 133.1 1353.2 35.9 2104 Meramec MO 4 199.1 2069.0 35.1 2107 Sioux MO 1 252.0 2749.6 33.5 2107 Sioux MO 2 319.9 3522.4 33.1 2167 New Madrid MO 1 477.6 3663.9 47.6 2167 New Madrid MO 2 504.1 3730.5 49.3 2168 Thomas Hill MO CW12 345.8 3576.9 35.3 2168 Thomas Hill MO CW3 431.7 5131.0 30.7 2187 J E Corette Plant MT 2 55.6 1251.9 16.2 2226 Canaday NE 1 18.1 87.1 75.9 2240 Lon Wright NE 6 484.7 47.9 >1,000.02 2240 Lon Wright NE 7 606.2 48.3 >1,000.02 2291 North Omaha NE 1 624.3 408.4 558.0 2367 Schiller NH 4 33.6 310.2 39.5 2367 Schiller NH 5 38.1 319.0 43.6 2367 Schiller NH 6 37.5 314.8 43.5 2378 B L England NJ 1 90.5 605.7 54.5 2378 B L England NJ 2 92.4 675.2 50.0 2384 Deepwater NJ 1 82.7 13.1 >1,000.02 2384 Deepwater NJ 6 75.6 462.1 59.7 2390 Sayreville NJ 04 15.5 16.4 345.5 2390 Sayreville NJ 05 20.7 27.8 272.0 2403 PSEG Hudson Gen. Station NJ HU 442.1 2733.1 59.0 2404 PSEG Hudson Gen Station NJ KE 51.1 3.0 >1,000.02 2408 PSEG Mercer Gen. Station NJ ME 561.6 2651.5 77.3 2411 PSEG Sewaren Gen.Station NJ SE 144.1 226.4 232.3 2480 Danskammer Gen. Station NY 1 - 6.3 -¹ 2480 Danskammer Gen. Station NY 2 2.6 15.6 60.6 2480 Danskammer Gen. Station NY 3 95.0 995.8 34.8
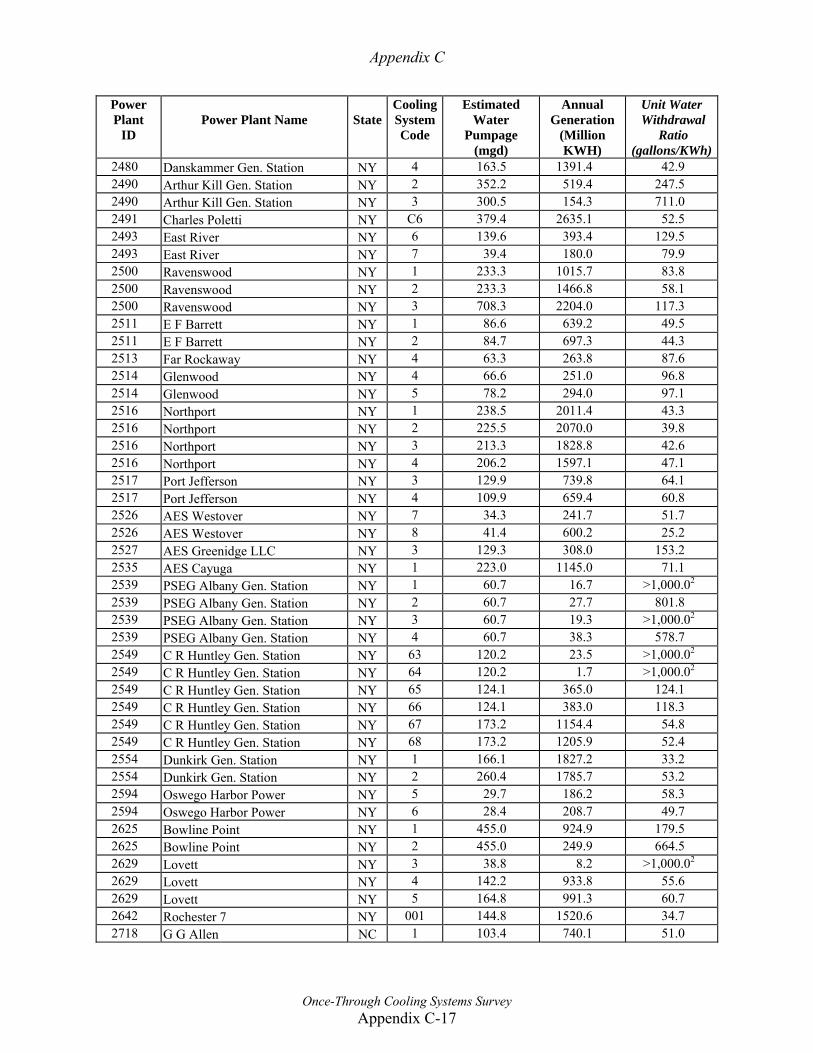
Appendix C
Once-Through Cooling Systems Survey Appendix C-17
Power Plant
ID
Power Plant Name
State
CoolingSystemCode
Estimated Water
Pumpage (mgd)
Annual Generation
(Million KWH)
Unit Water Withdrawal
Ratio (gallons/KWh)
2480 Danskammer Gen. Station NY 4 163.5 1391.4 42.9 2490 Arthur Kill Gen. Station NY 2 352.2 519.4 247.5 2490 Arthur Kill Gen. Station NY 3 300.5 154.3 711.0 2491 Charles Poletti NY C6 379.4 2635.1 52.5 2493 East River NY 6 139.6 393.4 129.5 2493 East River NY 7 39.4 180.0 79.9 2500 Ravenswood NY 1 233.3 1015.7 83.8 2500 Ravenswood NY 2 233.3 1466.8 58.1 2500 Ravenswood NY 3 708.3 2204.0 117.3 2511 E F Barrett NY 1 86.6 639.2 49.5 2511 E F Barrett NY 2 84.7 697.3 44.3 2513 Far Rockaway NY 4 63.3 263.8 87.6 2514 Glenwood NY 4 66.6 251.0 96.8 2514 Glenwood NY 5 78.2 294.0 97.1 2516 Northport NY 1 238.5 2011.4 43.3 2516 Northport NY 2 225.5 2070.0 39.8 2516 Northport NY 3 213.3 1828.8 42.6 2516 Northport NY 4 206.2 1597.1 47.1 2517 Port Jefferson NY 3 129.9 739.8 64.1 2517 Port Jefferson NY 4 109.9 659.4 60.8 2526 AES Westover NY 7 34.3 241.7 51.7 2526 AES Westover NY 8 41.4 600.2 25.2 2527 AES Greenidge LLC NY 3 129.3 308.0 153.2 2535 AES Cayuga NY 1 223.0 1145.0 71.1 2539 PSEG Albany Gen. Station NY 1 60.7 16.7 >1,000.02 2539 PSEG Albany Gen. Station NY 2 60.7 27.7 801.8 2539 PSEG Albany Gen. Station NY 3 60.7 19.3 >1,000.02 2539 PSEG Albany Gen. Station NY 4 60.7 38.3 578.7 2549 C R Huntley Gen. Station NY 63 120.2 23.5 >1,000.02 2549 C R Huntley Gen. Station NY 64 120.2 1.7 >1,000.02 2549 C R Huntley Gen. Station NY 65 124.1 365.0 124.1 2549 C R Huntley Gen. Station NY 66 124.1 383.0 118.3 2549 C R Huntley Gen. Station NY 67 173.2 1154.4 54.8 2549 C R Huntley Gen. Station NY 68 173.2 1205.9 52.4 2554 Dunkirk Gen. Station NY 1 166.1 1827.2 33.2 2554 Dunkirk Gen. Station NY 2 260.4 1785.7 53.2 2594 Oswego Harbor Power NY 5 29.7 186.2 58.3 2594 Oswego Harbor Power NY 6 28.4 208.7 49.7 2625 Bowline Point NY 1 455.0 924.9 179.5 2625 Bowline Point NY 2 455.0 249.9 664.5 2629 Lovett NY 3 38.8 8.2 >1,000.02 2629 Lovett NY 4 142.2 933.8 55.6 2629 Lovett NY 5 164.8 991.3 60.7 2642 Rochester 7 NY 001 144.8 1520.6 34.7 2718 G G Allen NC 1 103.4 740.1 51.0
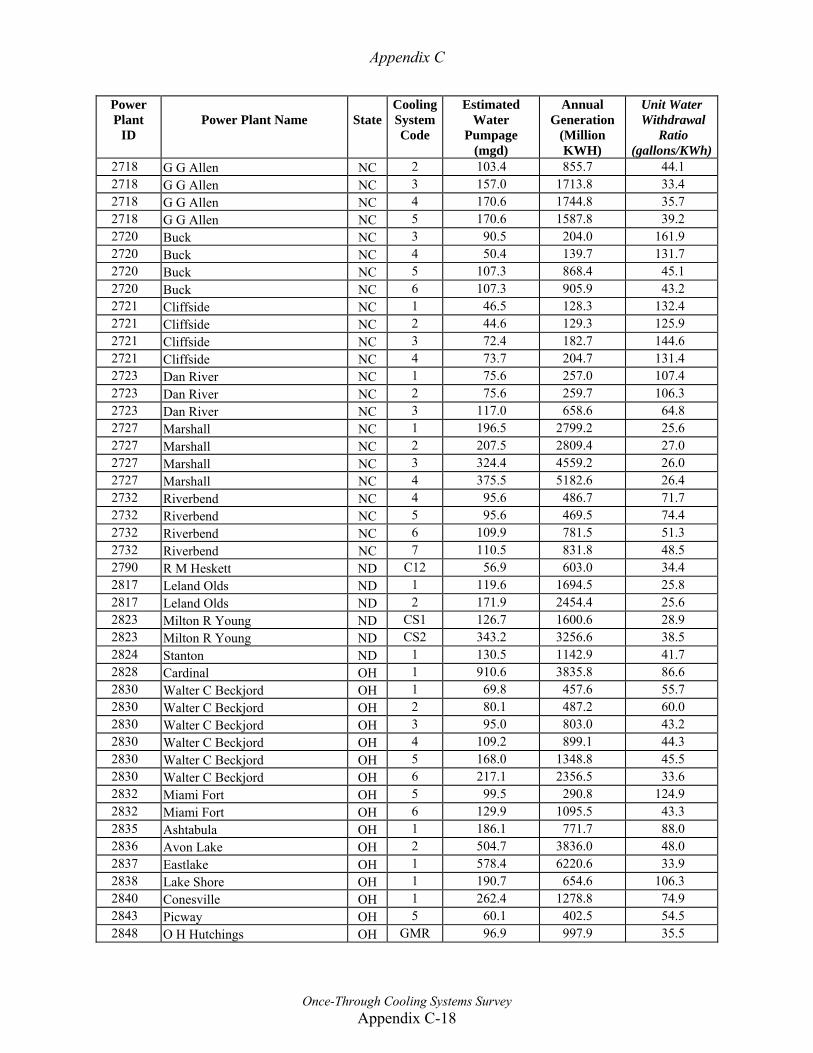
Appendix C
Once-Through Cooling Systems Survey Appendix C-18
Power Plant
ID
Power Plant Name
State
CoolingSystemCode
Estimated Water
Pumpage (mgd)
Annual Generation
(Million KWH)
Unit Water Withdrawal
Ratio (gallons/KWh)
2718 G G Allen NC 2 103.4 855.7 44.1 2718 G G Allen NC 3 157.0 1713.8 33.4 2718 G G Allen NC 4 170.6 1744.8 35.7 2718 G G Allen NC 5 170.6 1587.8 39.2 2720 Buck NC 3 90.5 204.0 161.9 2720 Buck NC 4 50.4 139.7 131.7 2720 Buck NC 5 107.3 868.4 45.1 2720 Buck NC 6 107.3 905.9 43.2 2721 Cliffside NC 1 46.5 128.3 132.4 2721 Cliffside NC 2 44.6 129.3 125.9 2721 Cliffside NC 3 72.4 182.7 144.6 2721 Cliffside NC 4 73.7 204.7 131.4 2723 Dan River NC 1 75.6 257.0 107.4 2723 Dan River NC 2 75.6 259.7 106.3 2723 Dan River NC 3 117.0 658.6 64.8 2727 Marshall NC 1 196.5 2799.2 25.6 2727 Marshall NC 2 207.5 2809.4 27.0 2727 Marshall NC 3 324.4 4559.2 26.0 2727 Marshall NC 4 375.5 5182.6 26.4 2732 Riverbend NC 4 95.6 486.7 71.7 2732 Riverbend NC 5 95.6 469.5 74.4 2732 Riverbend NC 6 109.9 781.5 51.3 2732 Riverbend NC 7 110.5 831.8 48.5 2790 R M Heskett ND C12 56.9 603.0 34.4 2817 Leland Olds ND 1 119.6 1694.5 25.8 2817 Leland Olds ND 2 171.9 2454.4 25.6 2823 Milton R Young ND CS1 126.7 1600.6 28.9 2823 Milton R Young ND CS2 343.2 3256.6 38.5 2824 Stanton ND 1 130.5 1142.9 41.7 2828 Cardinal OH 1 910.6 3835.8 86.6 2830 Walter C Beckjord OH 1 69.8 457.6 55.7 2830 Walter C Beckjord OH 2 80.1 487.2 60.0 2830 Walter C Beckjord OH 3 95.0 803.0 43.2 2830 Walter C Beckjord OH 4 109.2 899.1 44.3 2830 Walter C Beckjord OH 5 168.0 1348.8 45.5 2830 Walter C Beckjord OH 6 217.1 2356.5 33.6 2832 Miami Fort OH 5 99.5 290.8 124.9 2832 Miami Fort OH 6 129.9 1095.5 43.3 2835 Ashtabula OH 1 186.1 771.7 88.0 2836 Avon Lake OH 2 504.7 3836.0 48.0 2837 Eastlake OH 1 578.4 6220.6 33.9 2838 Lake Shore OH 1 190.7 654.6 106.3 2840 Conesville OH 1 262.4 1278.8 74.9 2843 Picway OH 5 60.1 402.5 54.5 2848 O H Hutchings OH GMR 96.9 997.9 35.5
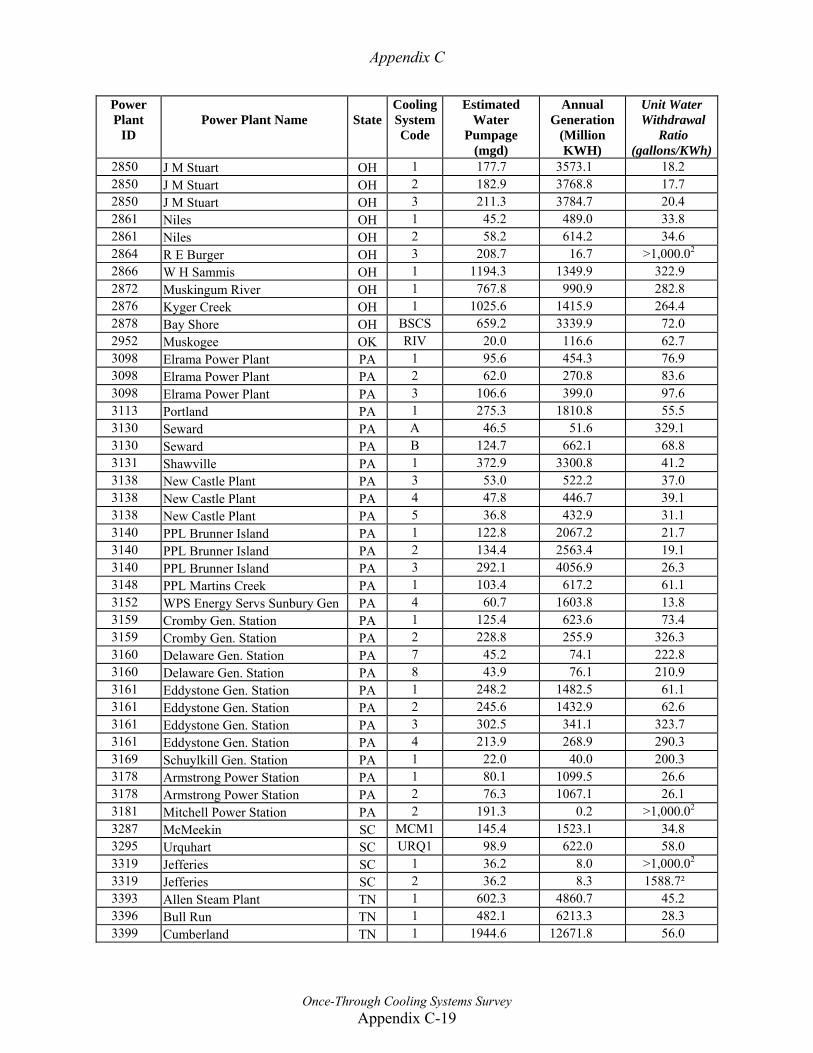
Appendix C
Once-Through Cooling Systems Survey Appendix C-19
Power Plant
ID
Power Plant Name
State
CoolingSystemCode
Estimated Water
Pumpage (mgd)
Annual Generation
(Million KWH)
Unit Water Withdrawal
Ratio (gallons/KWh)
2850 J M Stuart OH 1 177.7 3573.1 18.2 2850 J M Stuart OH 2 182.9 3768.8 17.7 2850 J M Stuart OH 3 211.3 3784.7 20.4 2861 Niles OH 1 45.2 489.0 33.8 2861 Niles OH 2 58.2 614.2 34.6 2864 R E Burger OH 3 208.7 16.7 >1,000.02 2866 W H Sammis OH 1 1194.3 1349.9 322.9 2872 Muskingum River OH 1 767.8 990.9 282.8 2876 Kyger Creek OH 1 1025.6 1415.9 264.4 2878 Bay Shore OH BSCS 659.2 3339.9 72.0 2952 Muskogee OK RIV 20.0 116.6 62.7 3098 Elrama Power Plant PA 1 95.6 454.3 76.9 3098 Elrama Power Plant PA 2 62.0 270.8 83.6 3098 Elrama Power Plant PA 3 106.6 399.0 97.6 3113 Portland PA 1 275.3 1810.8 55.5 3130 Seward PA A 46.5 51.6 329.1 3130 Seward PA B 124.7 662.1 68.8 3131 Shawville PA 1 372.9 3300.8 41.2 3138 New Castle Plant PA 3 53.0 522.2 37.0 3138 New Castle Plant PA 4 47.8 446.7 39.1 3138 New Castle Plant PA 5 36.8 432.9 31.1 3140 PPL Brunner Island PA 1 122.8 2067.2 21.7 3140 PPL Brunner Island PA 2 134.4 2563.4 19.1 3140 PPL Brunner Island PA 3 292.1 4056.9 26.3 3148 PPL Martins Creek PA 1 103.4 617.2 61.1 3152 WPS Energy Servs Sunbury Gen PA 4 60.7 1603.8 13.8 3159 Cromby Gen. Station PA 1 125.4 623.6 73.4 3159 Cromby Gen. Station PA 2 228.8 255.9 326.3 3160 Delaware Gen. Station PA 7 45.2 74.1 222.8 3160 Delaware Gen. Station PA 8 43.9 76.1 210.9 3161 Eddystone Gen. Station PA 1 248.2 1482.5 61.1 3161 Eddystone Gen. Station PA 2 245.6 1432.9 62.6 3161 Eddystone Gen. Station PA 3 302.5 341.1 323.7 3161 Eddystone Gen. Station PA 4 213.9 268.9 290.3 3169 Schuylkill Gen. Station PA 1 22.0 40.0 200.3 3178 Armstrong Power Station PA 1 80.1 1099.5 26.6 3178 Armstrong Power Station PA 2 76.3 1067.1 26.1 3181 Mitchell Power Station PA 2 191.3 0.2 >1,000.02 3287 McMeekin SC MCM1 145.4 1523.1 34.8 3295 Urquhart SC URQ1 98.9 622.0 58.0 3319 Jefferies SC 1 36.2 8.0 >1,000.02 3319 Jefferies SC 2 36.2 8.3 1588.7² 3393 Allen Steam Plant TN 1 602.3 4860.7 45.2 3396 Bull Run TN 1 482.1 6213.3 28.3 3399 Cumberland TN 1 1944.6 12671.8 56.0
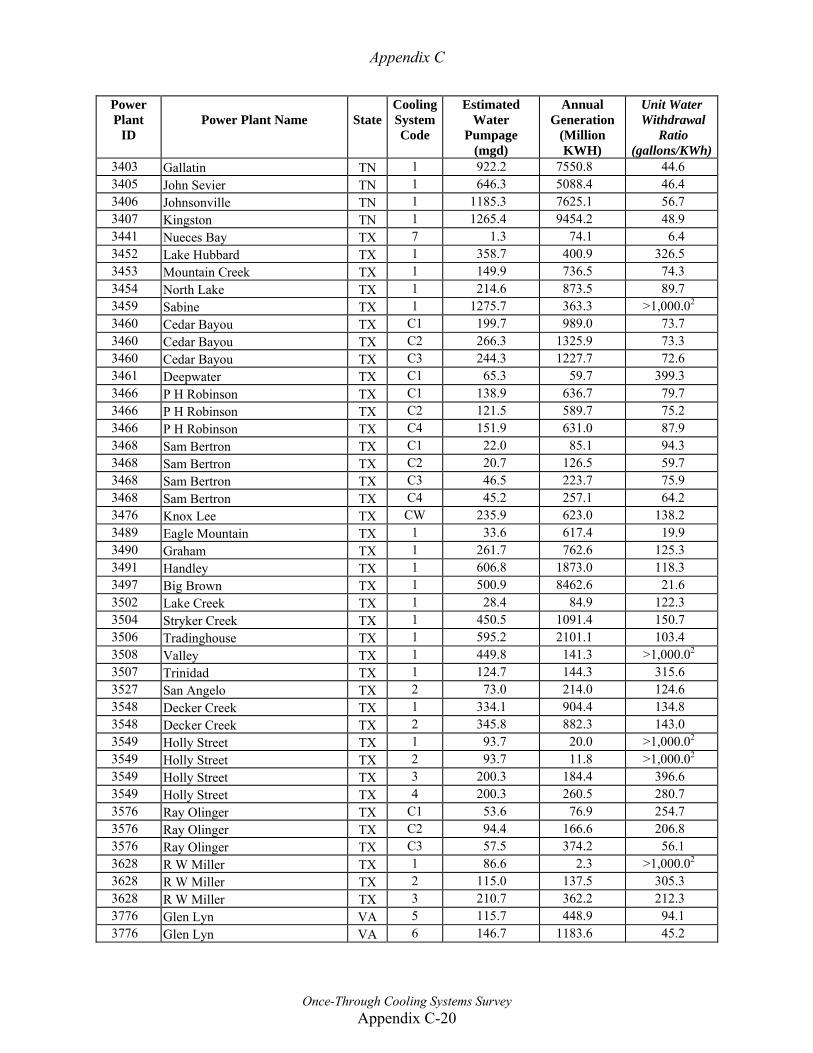
Appendix C
Once-Through Cooling Systems Survey Appendix C-20
Power Plant
ID
Power Plant Name
State
CoolingSystemCode
Estimated Water
Pumpage (mgd)
Annual Generation
(Million KWH)
Unit Water Withdrawal
Ratio (gallons/KWh)
3403 Gallatin TN 1 922.2 7550.8 44.6 3405 John Sevier TN 1 646.3 5088.4 46.4 3406 Johnsonville TN 1 1185.3 7625.1 56.7 3407 Kingston TN 1 1265.4 9454.2 48.9 3441 Nueces Bay TX 7 1.3 74.1 6.4 3452 Lake Hubbard TX 1 358.7 400.9 326.5 3453 Mountain Creek TX 1 149.9 736.5 74.3 3454 North Lake TX 1 214.6 873.5 89.7 3459 Sabine TX 1 1275.7 363.3 >1,000.02 3460 Cedar Bayou TX C1 199.7 989.0 73.7 3460 Cedar Bayou TX C2 266.3 1325.9 73.3 3460 Cedar Bayou TX C3 244.3 1227.7 72.6 3461 Deepwater TX C1 65.3 59.7 399.3 3466 P H Robinson TX C1 138.9 636.7 79.7 3466 P H Robinson TX C2 121.5 589.7 75.2 3466 P H Robinson TX C4 151.9 631.0 87.9 3468 Sam Bertron TX C1 22.0 85.1 94.3 3468 Sam Bertron TX C2 20.7 126.5 59.7 3468 Sam Bertron TX C3 46.5 223.7 75.9 3468 Sam Bertron TX C4 45.2 257.1 64.2 3476 Knox Lee TX CW 235.9 623.0 138.2 3489 Eagle Mountain TX 1 33.6 617.4 19.9 3490 Graham TX 1 261.7 762.6 125.3 3491 Handley TX 1 606.8 1873.0 118.3 3497 Big Brown TX 1 500.9 8462.6 21.6 3502 Lake Creek TX 1 28.4 84.9 122.3 3504 Stryker Creek TX 1 450.5 1091.4 150.7 3506 Tradinghouse TX 1 595.2 2101.1 103.4 3508 Valley TX 1 449.8 141.3 >1,000.02 3507 Trinidad TX 1 124.7 144.3 315.6 3527 San Angelo TX 2 73.0 214.0 124.6 3548 Decker Creek TX 1 334.1 904.4 134.8 3548 Decker Creek TX 2 345.8 882.3 143.0 3549 Holly Street TX 1 93.7 20.0 >1,000.02 3549 Holly Street TX 2 93.7 11.8 >1,000.02 3549 Holly Street TX 3 200.3 184.4 396.6 3549 Holly Street TX 4 200.3 260.5 280.7 3576 Ray Olinger TX C1 53.6 76.9 254.7 3576 Ray Olinger TX C2 94.4 166.6 206.8 3576 Ray Olinger TX C3 57.5 374.2 56.1 3628 R W Miller TX 1 86.6 2.3 >1,000.02 3628 R W Miller TX 2 115.0 137.5 305.3 3628 R W Miller TX 3 210.7 362.2 212.3 3776 Glen Lyn VA 5 115.7 448.9 94.1 3776 Glen Lyn VA 6 146.7 1183.6 45.2
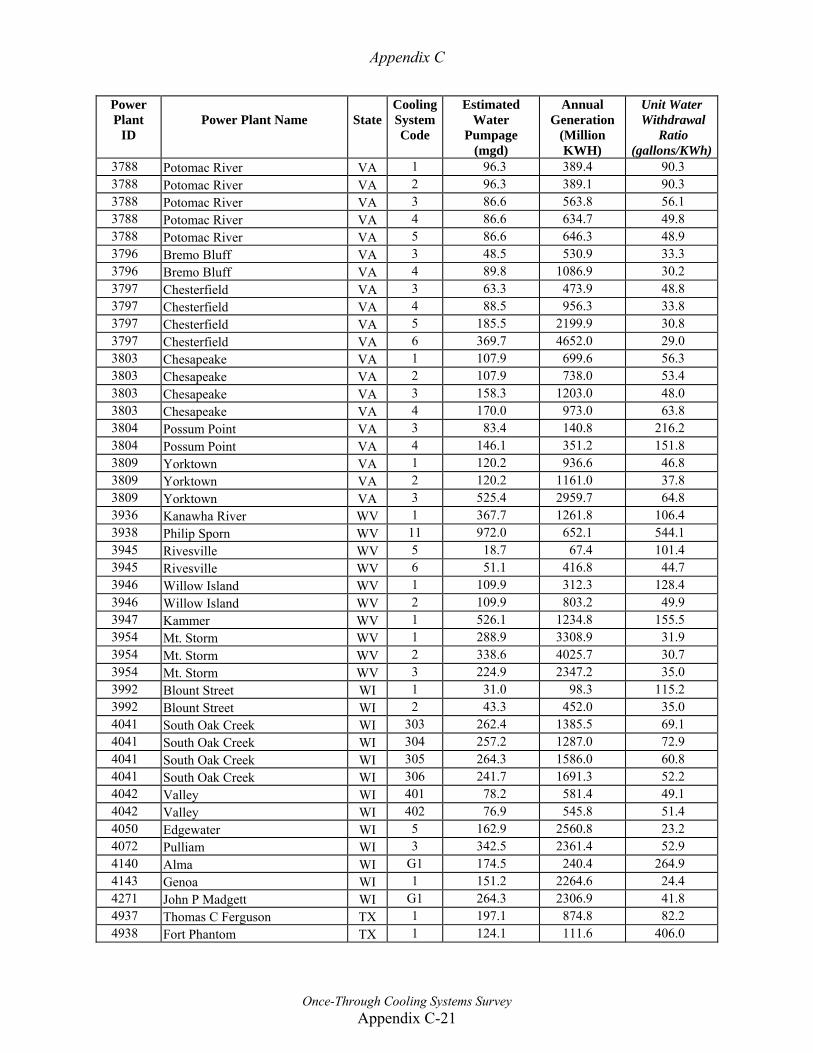
Appendix C
Once-Through Cooling Systems Survey Appendix C-21
Power Plant
ID
Power Plant Name
State
CoolingSystemCode
Estimated Water
Pumpage (mgd)
Annual Generation
(Million KWH)
Unit Water Withdrawal
Ratio (gallons/KWh)
3788 Potomac River VA 1 96.3 389.4 90.3 3788 Potomac River VA 2 96.3 389.1 90.3 3788 Potomac River VA 3 86.6 563.8 56.1 3788 Potomac River VA 4 86.6 634.7 49.8 3788 Potomac River VA 5 86.6 646.3 48.9 3796 Bremo Bluff VA 3 48.5 530.9 33.3 3796 Bremo Bluff VA 4 89.8 1086.9 30.2 3797 Chesterfield VA 3 63.3 473.9 48.8 3797 Chesterfield VA 4 88.5 956.3 33.8 3797 Chesterfield VA 5 185.5 2199.9 30.8 3797 Chesterfield VA 6 369.7 4652.0 29.0 3803 Chesapeake VA 1 107.9 699.6 56.3 3803 Chesapeake VA 2 107.9 738.0 53.4 3803 Chesapeake VA 3 158.3 1203.0 48.0 3803 Chesapeake VA 4 170.0 973.0 63.8 3804 Possum Point VA 3 83.4 140.8 216.2 3804 Possum Point VA 4 146.1 351.2 151.8 3809 Yorktown VA 1 120.2 936.6 46.8 3809 Yorktown VA 2 120.2 1161.0 37.8 3809 Yorktown VA 3 525.4 2959.7 64.8 3936 Kanawha River WV 1 367.7 1261.8 106.4 3938 Philip Sporn WV 11 972.0 652.1 544.1 3945 Rivesville WV 5 18.7 67.4 101.4 3945 Rivesville WV 6 51.1 416.8 44.7 3946 Willow Island WV 1 109.9 312.3 128.4 3946 Willow Island WV 2 109.9 803.2 49.9 3947 Kammer WV 1 526.1 1234.8 155.5 3954 Mt. Storm WV 1 288.9 3308.9 31.9 3954 Mt. Storm WV 2 338.6 4025.7 30.7 3954 Mt. Storm WV 3 224.9 2347.2 35.0 3992 Blount Street WI 1 31.0 98.3 115.2 3992 Blount Street WI 2 43.3 452.0 35.0 4041 South Oak Creek WI 303 262.4 1385.5 69.1 4041 South Oak Creek WI 304 257.2 1287.0 72.9 4041 South Oak Creek WI 305 264.3 1586.0 60.8 4041 South Oak Creek WI 306 241.7 1691.3 52.2 4042 Valley WI 401 78.2 581.4 49.1 4042 Valley WI 402 76.9 545.8 51.4 4050 Edgewater WI 5 162.9 2560.8 23.2 4072 Pulliam WI 3 342.5 2361.4 52.9 4140 Alma WI G1 174.5 240.4 264.9 4143 Genoa WI 1 151.2 2264.6 24.4 4271 John P Madgett WI G1 264.3 2306.9 41.8 4937 Thomas C Ferguson TX 1 197.1 874.8 82.2 4938 Fort Phantom TX 1 124.1 111.6 406.0
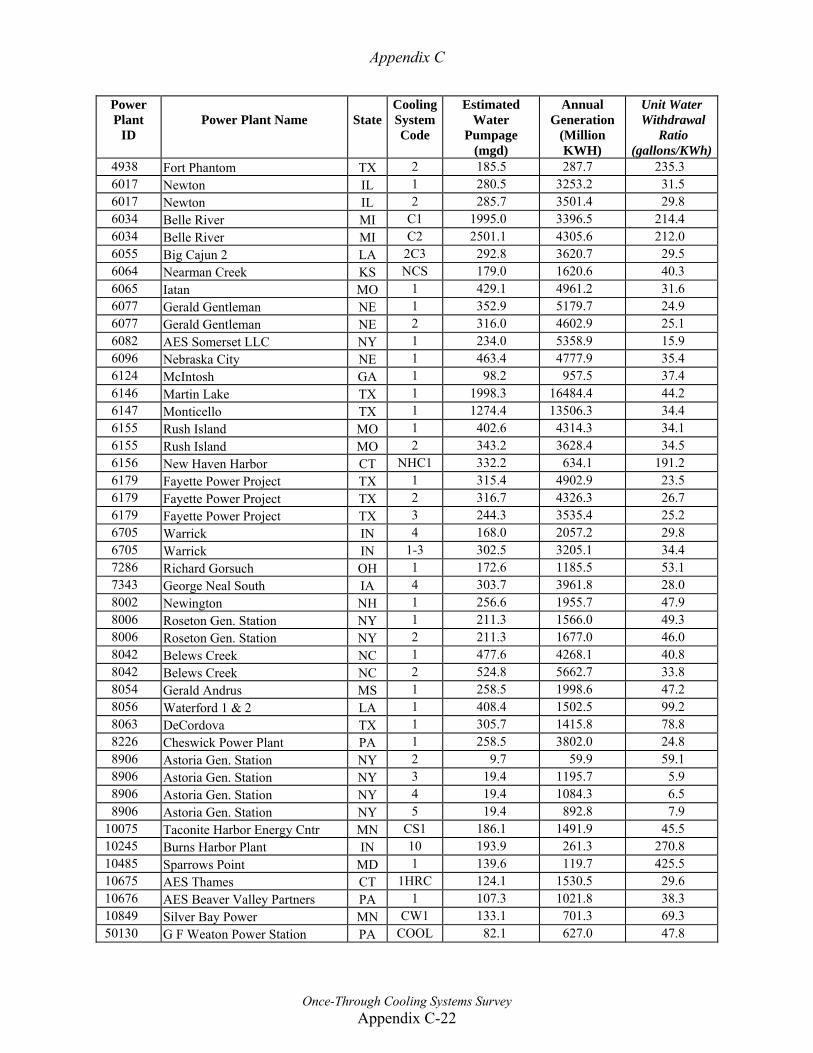
Appendix C
Once-Through Cooling Systems Survey Appendix C-22
Power Plant
ID
Power Plant Name
State
CoolingSystemCode
Estimated Water
Pumpage (mgd)
Annual Generation
(Million KWH)
Unit Water Withdrawal
Ratio (gallons/KWh)
4938 Fort Phantom TX 2 185.5 287.7 235.3 6017 Newton IL 1 280.5 3253.2 31.5 6017 Newton IL 2 285.7 3501.4 29.8 6034 Belle River MI C1 1995.0 3396.5 214.4 6034 Belle River MI C2 2501.1 4305.6 212.0 6055 Big Cajun 2 LA 2C3 292.8 3620.7 29.5 6064 Nearman Creek KS NCS 179.0 1620.6 40.3 6065 Iatan MO 1 429.1 4961.2 31.6 6077 Gerald Gentleman NE 1 352.9 5179.7 24.9 6077 Gerald Gentleman NE 2 316.0 4602.9 25.1 6082 AES Somerset LLC NY 1 234.0 5358.9 15.9 6096 Nebraska City NE 1 463.4 4777.9 35.4 6124 McIntosh GA 1 98.2 957.5 37.4 6146 Martin Lake TX 1 1998.3 16484.4 44.2 6147 Monticello TX 1 1274.4 13506.3 34.4 6155 Rush Island MO 1 402.6 4314.3 34.1 6155 Rush Island MO 2 343.2 3628.4 34.5 6156 New Haven Harbor CT NHC1 332.2 634.1 191.2 6179 Fayette Power Project TX 1 315.4 4902.9 23.5 6179 Fayette Power Project TX 2 316.7 4326.3 26.7 6179 Fayette Power Project TX 3 244.3 3535.4 25.2 6705 Warrick IN 4 168.0 2057.2 29.8 6705 Warrick IN 1-3 302.5 3205.1 34.4 7286 Richard Gorsuch OH 1 172.6 1185.5 53.1 7343 George Neal South IA 4 303.7 3961.8 28.0 8002 Newington NH 1 256.6 1955.7 47.9 8006 Roseton Gen. Station NY 1 211.3 1566.0 49.3 8006 Roseton Gen. Station NY 2 211.3 1677.0 46.0 8042 Belews Creek NC 1 477.6 4268.1 40.8 8042 Belews Creek NC 2 524.8 5662.7 33.8 8054 Gerald Andrus MS 1 258.5 1998.6 47.2 8056 Waterford 1 & 2 LA 1 408.4 1502.5 99.2 8063 DeCordova TX 1 305.7 1415.8 78.8 8226 Cheswick Power Plant PA 1 258.5 3802.0 24.8 8906 Astoria Gen. Station NY 2 9.7 59.9 59.1 8906 Astoria Gen. Station NY 3 19.4 1195.7 5.9 8906 Astoria Gen. Station NY 4 19.4 1084.3 6.5 8906 Astoria Gen. Station NY 5 19.4 892.8 7.9
10075 Taconite Harbor Energy Cntr MN CS1 186.1 1491.9 45.5 10245 Burns Harbor Plant IN 10 193.9 261.3 270.8 10485 Sparrows Point MD 1 139.6 119.7 425.5 10675 AES Thames CT 1HRC 124.1 1530.5 29.6 10676 AES Beaver Valley Partners PA 1 107.3 1021.8 38.3 10849 Silver Bay Power MN CW1 133.1 701.3 69.3 50130 G F Weaton Power Station PA COOL 82.1 627.0 47.8
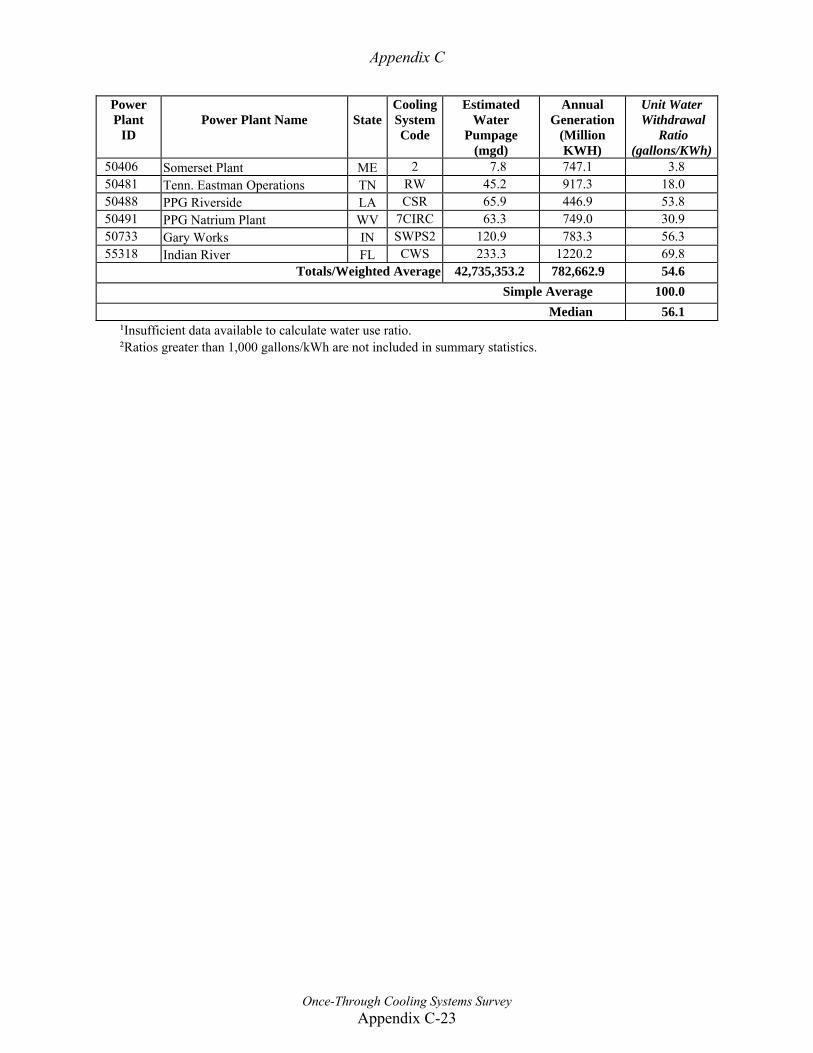
Appendix C
Once-Through Cooling Systems Survey Appendix C-23
Power Plant
ID
Power Plant Name
State
CoolingSystemCode
Estimated Water
Pumpage (mgd)
Annual Generation
(Million KWH)
Unit Water Withdrawal
Ratio (gallons/KWh)
50406 Somerset Plant ME 2 7.8 747.1 3.8 50481 Tenn. Eastman Operations TN RW 45.2 917.3 18.0 50488 PPG Riverside LA CSR 65.9 446.9 53.8 50491 PPG Natrium Plant WV 7CIRC 63.3 749.0 30.9 50733 Gary Works IN SWPS2 120.9 783.3 56.3 55318 Indian River FL CWS 233.3 1220.2 69.8
Totals/Weighted Average 42,735,353.2 782,662.9 54.6 Simple Average 100.0
Median 56.1 ¹Insufficient data available to calculate water use ratio. ²Ratios greater than 1,000 gallons/kWh are not included in summary statistics.

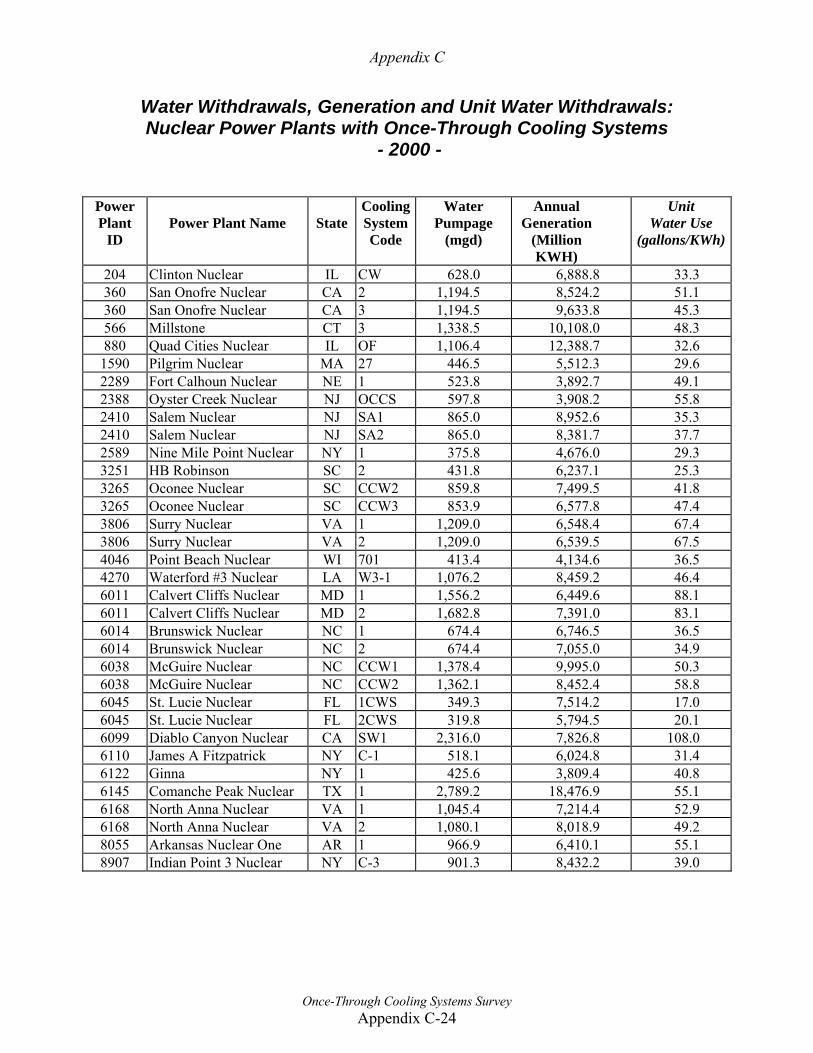
Appendix C
Once-Through Cooling Systems Survey Appendix C-24
Water Withdrawals, Generation and Unit Water Withdrawals: Nuclear Power Plants with Once-Through Cooling Systems
- 2000 -
Power Plant
ID
Power Plant Name
State
CoolingSystemCode
Water Pumpage
(mgd)
Annual Generation
(Million KWH)
Unit Water Use
(gallons/KWh)
204 Clinton Nuclear IL CW 628.0 6,888.8 33.3 360 San Onofre Nuclear CA 2 1,194.5 8,524.2 51.1 360 San Onofre Nuclear CA 3 1,194.5 9,633.8 45.3 566 Millstone CT 3 1,338.5 10,108.0 48.3 880 Quad Cities Nuclear IL OF 1,106.4 12,388.7 32.6
1590 Pilgrim Nuclear MA 27 446.5 5,512.3 29.6 2289 Fort Calhoun Nuclear NE 1 523.8 3,892.7 49.1 2388 Oyster Creek Nuclear NJ OCCS 597.8 3,908.2 55.8 2410 Salem Nuclear NJ SA1 865.0 8,952.6 35.3 2410 Salem Nuclear NJ SA2 865.0 8,381.7 37.7 2589 Nine Mile Point Nuclear NY 1 375.8 4,676.0 29.3 3251 HB Robinson SC 2 431.8 6,237.1 25.3 3265 Oconee Nuclear SC CCW2 859.8 7,499.5 41.8 3265 Oconee Nuclear SC CCW3 853.9 6,577.8 47.4 3806 Surry Nuclear VA 1 1,209.0 6,548.4 67.4 3806 Surry Nuclear VA 2 1,209.0 6,539.5 67.5 4046 Point Beach Nuclear WI 701 413.4 4,134.6 36.5 4270 Waterford #3 Nuclear LA W3-1 1,076.2 8,459.2 46.4 6011 Calvert Cliffs Nuclear MD 1 1,556.2 6,449.6 88.1 6011 Calvert Cliffs Nuclear MD 2 1,682.8 7,391.0 83.1 6014 Brunswick Nuclear NC 1 674.4 6,746.5 36.5 6014 Brunswick Nuclear NC 2 674.4 7,055.0 34.9 6038 McGuire Nuclear NC CCW1 1,378.4 9,995.0 50.3 6038 McGuire Nuclear NC CCW2 1,362.1 8,452.4 58.8 6045 St. Lucie Nuclear FL 1CWS 349.3 7,514.2 17.0 6045 St. Lucie Nuclear FL 2CWS 319.8 5,794.5 20.1 6099 Diablo Canyon Nuclear CA SW1 2,316.0 7,826.8 108.0 6110 James A Fitzpatrick NY C-1 518.1 6,024.8 31.4 6122 Ginna NY 1 425.6 3,809.4 40.8 6145 Comanche Peak Nuclear TX 1 2,789.2 18,476.9 55.1 6168 North Anna Nuclear VA 1 1,045.4 7,214.4 52.9 6168 North Anna Nuclear VA 2 1,080.1 8,018.9 49.2 8055 Arkansas Nuclear One AR 1 966.9 6,410.1 55.1 8907 Indian Point 3 Nuclear NY C-3 901.3 8,432.2 39.0


Appendix C
Re-circulating Cooling Systems with Ponds & Canals Survey
Appendix C-25
National Survey of Water Use at Thermoelectric Power Plants
A research project sponsored by the
National Institutes for
Water Resources
conducted by the
Department of Geography and Environmental Resources
Southern Illinois University Carbondale Purpose This survey is one part of a research project to study power plant water withdrawals and consumptive use in the United States. The purpose of this research is to improve the understanding of power plant water use and to develop benchmarks that will facilitate water use evaluations by generation facility managers. A complete description of this project is available on the web site of the National Institutes of Water Resources: http://water.usgs.gov/wrri/04grants/national/nationalindex.html. Instructions This survey consists of 14 questions. Please read each question carefully and provide answers based upon your understanding of the water use operations at your generating facility and the power generation industry as a whole. Answer each question by checking the appropriate boxes or typing in a brief response. Please note that the number of pages may increase as you complete the questionnaire, but this will not affect our ability to properly record your answers. A comments section is included at the end of this form and any comments that you may have would be welcomed. Please return your survey by saving the completed file and attaching it to a reply email message. If you have any questions about this survey or the research project, please contact Ben Dziegielewski at (618) 453-6021, or by email at: [email protected]. This project has been reviewed and approved by the Southern Illinois University Human Subjects Committee. Questions concerning your rights as a participant in this research may be addressed to the Committee Chairperson, Office of Research and Development Administration, Southern Illinois University, Carbondale, IL 62901-4709; Phone: (618) 453-4533. There is no penalty for not participating in this survey.
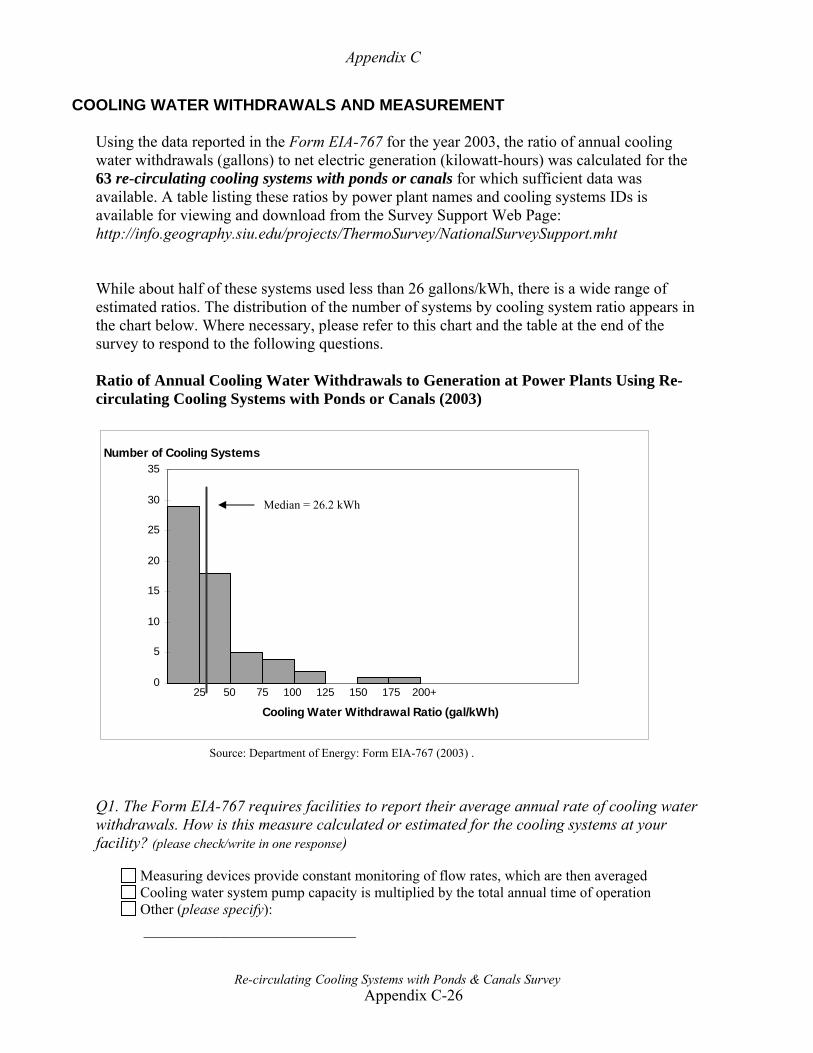
Appendix C
Re-circulating Cooling Systems with Ponds & Canals Survey
Appendix C-26
COOLING WATER WITHDRAWALS AND MEASUREMENT Using the data reported in the Form EIA-767 for the year 2003, the ratio of annual cooling water withdrawals (gallons) to net electric generation (kilowatt-hours) was calculated for the 63 re-circulating cooling systems with ponds or canals for which sufficient data was available. A table listing these ratios by power plant names and cooling systems IDs is available for viewing and download from the Survey Support Web Page: http://info.geography.siu.edu/projects/ThermoSurvey/NationalSurveySupport.mht While about half of these systems used less than 26 gallons/kWh, there is a wide range of estimated ratios. The distribution of the number of systems by cooling system ratio appears in the chart below. Where necessary, please refer to this chart and the table at the end of the survey to respond to the following questions. Ratio of Annual Cooling Water Withdrawals to Generation at Power Plants Using Re-circulating Cooling Systems with Ponds or Canals (2003)
Source: Department of Energy: Form EIA-767 (2003) .
Q1. The Form EIA-767 requires facilities to report their average annual rate of cooling water withdrawals. How is this measure calculated or estimated for the cooling systems at your facility? (please check/write in one response)
Measuring devices provide constant monitoring of flow rates, which are then averaged Cooling water system pump capacity is multiplied by the total annual time of operation Other (please specify): _____________________________
0
5
10
15
20
25
30
35
Cooling Water Withdrawal Ratio (gal/kWh) 25 50 75 100 125 150 175 200+
Number of Cooling Systems
Median = 26.2 kWh

Appendix C
Re-circulating Cooling Systems with Ponds & Canals Survey
Appendix C-27
Q2. Please find the withdrawal ratios for the cooling system(s) at your facility in the table that is available on the Survey Support Web Page (see above). Do the ratios that were calculated for your cooling systems appear to be correct?
Don’t know, we are not able to estimate the ratio of cooling water withdrawals to net generation at our facility
Yes, the ratio(s) for our facility are consistent with our own estimates No, these ratios do not accurately represent cooling water use at our facility.
A more accurate estimate of the gallons of water withdrawals per kilowatt-hours of generation can be the determined by: (please specify more accurate data or calculation method):
________________________________________________________________________ Q3. Please refer to the chart on the previous page. Do the estimated cooling water withdrawal ratios for the cooling systems at your facility differ significantly from the 26.2 gal/kWh median value for re-circulating cooling systems with ponds and canals? If so, what do you think are the principal reason(s) for this difference?
No, the ratio(s) for our facility do not differ significantly from the median value Yes, the water withdrawals of the cooling system(s) at our facility differ significantly from the national average for re-circulating cooling systems with ponds and canals because: (please specify): ________________________________________________________________________
Q4. What plant- or system-specific characteristics or conditions do you think contribute to the wide range of withdrawals ratios that are evident in the figure above and in the table of cooling water withdrawal ratios? (check all that apply and/or write in other relevant factors)
Differences in the way that cooling water withdrawals are estimated or reported Differences in the ratio of net-to-gross generation at each facility Differences in the size of cooling pond relative to the amount of waste heat generated Differences in the design of cooling ponds, such as dikes that that ensure good mixing and cooling of the re-circulating water, or the distance between intake and outflow structures
Differences in the designed temperature rise of the condenser(s) in use at each facility Differences in maintaining optimal turbine “backpressure” that affect water flow Differences in the frequency and length of time of boiler/generator shutdowns Differences in other conditions/circumstances: (please specify): ________________________________________________________________________
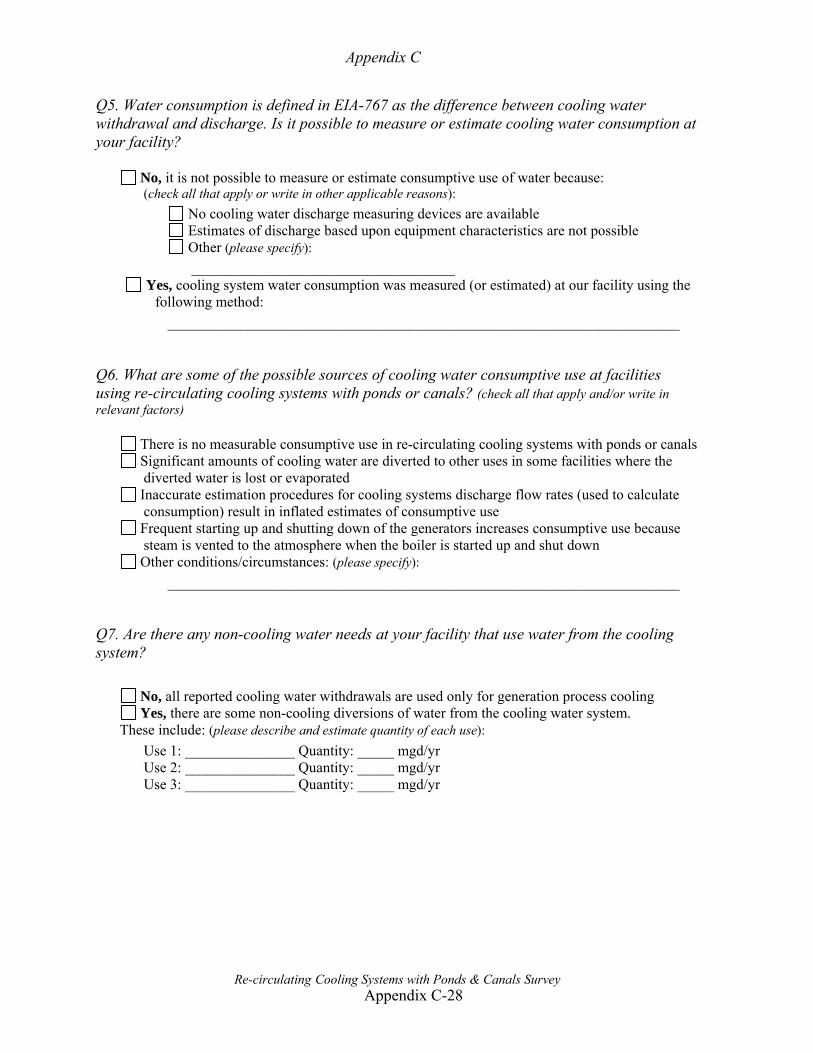
Appendix C
Re-circulating Cooling Systems with Ponds & Canals Survey
Appendix C-28
Q5. Water consumption is defined in EIA-767 as the difference between cooling water withdrawal and discharge. Is it possible to measure or estimate cooling water consumption at your facility?
No, it is not possible to measure or estimate consumptive use of water because: (check all that apply or write in other applicable reasons):
No cooling water discharge measuring devices are available Estimates of discharge based upon equipment characteristics are not possible Other (please specify): ____________________________________
Yes, cooling system water consumption was measured (or estimated) at our facility using the following method:
______________________________________________________________________
Q6. What are some of the possible sources of cooling water consumptive use at facilities using re-circulating cooling systems with ponds or canals? (check all that apply and/or write in relevant factors)
There is no measurable consumptive use in re-circulating cooling systems with ponds or canals Significant amounts of cooling water are diverted to other uses in some facilities where the diverted water is lost or evaporated
Inaccurate estimation procedures for cooling systems discharge flow rates (used to calculate consumption) result in inflated estimates of consumptive use
Frequent starting up and shutting down of the generators increases consumptive use because steam is vented to the atmosphere when the boiler is started up and shut down
Other conditions/circumstances: (please specify): ______________________________________________________________________
Q7. Are there any non-cooling water needs at your facility that use water from the cooling system?
No, all reported cooling water withdrawals are used only for generation process cooling Yes, there are some non-cooling diversions of water from the cooling water system.
These include: (please describe and estimate quantity of each use): Use 1: _______________ Quantity: _____ mgd/yr Use 2: _______________ Quantity: _____ mgd/yr Use 3: _______________ Quantity: _____ mgd/yr
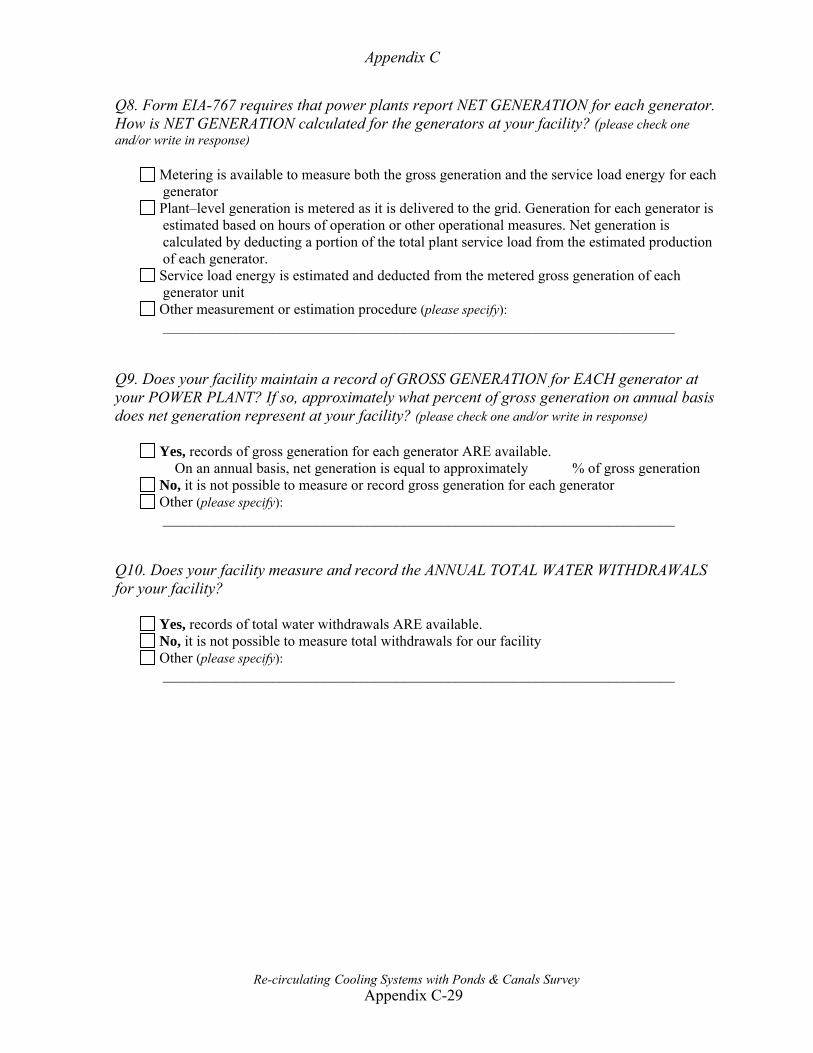
Appendix C
Re-circulating Cooling Systems with Ponds & Canals Survey
Appendix C-29
Q8. Form EIA-767 requires that power plants report NET GENERATION for each generator. How is NET GENERATION calculated for the generators at your facility? (please check one and/or write in response)
Metering is available to measure both the gross generation and the service load energy for each generator
Plant–level generation is metered as it is delivered to the grid. Generation for each generator is estimated based on hours of operation or other operational measures. Net generation is calculated by deducting a portion of the total plant service load from the estimated production of each generator.
Service load energy is estimated and deducted from the metered gross generation of each generator unit
Other measurement or estimation procedure (please specify): ______________________________________________________________________
Q9. Does your facility maintain a record of GROSS GENERATION for EACH generator at your POWER PLANT? If so, approximately what percent of gross generation on annual basis does net generation represent at your facility? (please check one and/or write in response)
Yes, records of gross generation for each generator ARE available. On an annual basis, net generation is equal to approximately % of gross generation
No, it is not possible to measure or record gross generation for each generator Other (please specify): ______________________________________________________________________
Q10. Does your facility measure and record the ANNUAL TOTAL WATER WITHDRAWALS for your facility?
Yes, records of total water withdrawals ARE available. No, it is not possible to measure total withdrawals for our facility Other (please specify): ______________________________________________________________________
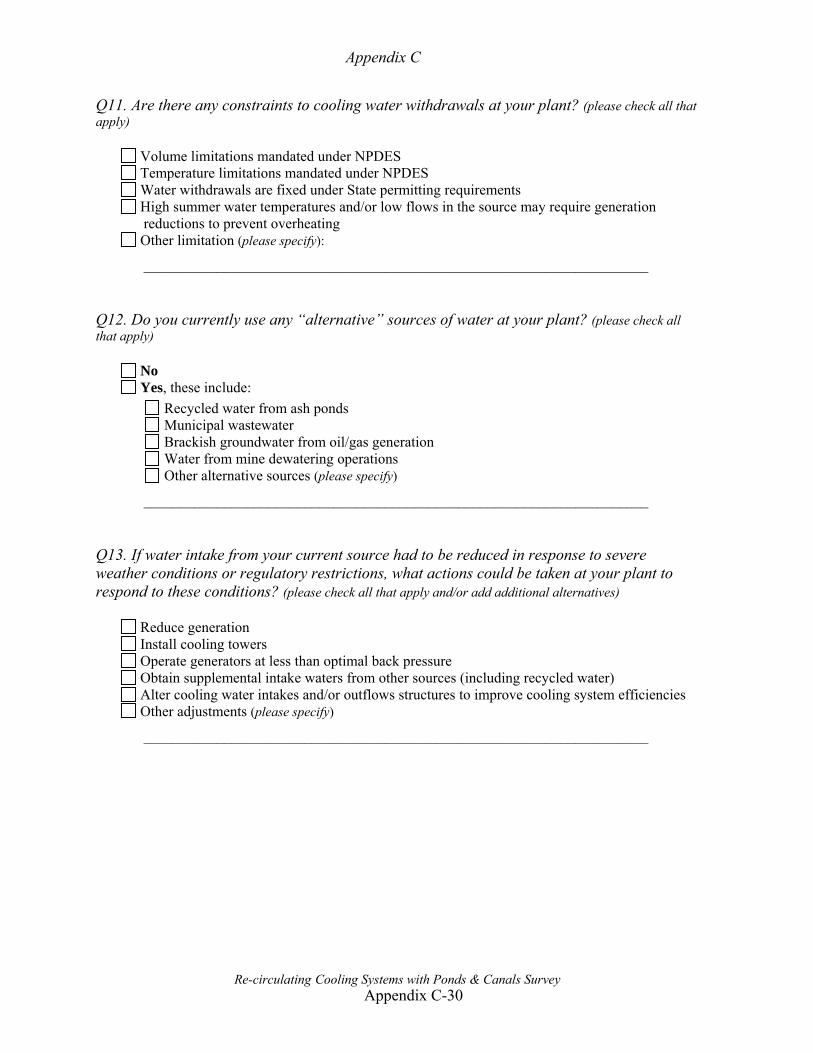
Appendix C
Re-circulating Cooling Systems with Ponds & Canals Survey
Appendix C-30
Q11. Are there any constraints to cooling water withdrawals at your plant? (please check all that apply)
Volume limitations mandated under NPDES Temperature limitations mandated under NPDES Water withdrawals are fixed under State permitting requirements High summer water temperatures and/or low flows in the source may require generation reductions to prevent overheating
Other limitation (please specify):
_____________________________________________________________________ Q12. Do you currently use any “alternative” sources of water at your plant? (please check all that apply)
No Yes, these include:
Recycled water from ash ponds Municipal wastewater Brackish groundwater from oil/gas generation Water from mine dewatering operations Other alternative sources (please specify)
_____________________________________________________________________ Q13. If water intake from your current source had to be reduced in response to severe weather conditions or regulatory restrictions, what actions could be taken at your plant to respond to these conditions? (please check all that apply and/or add additional alternatives)
Reduce generation Install cooling towers Operate generators at less than optimal back pressure Obtain supplemental intake waters from other sources (including recycled water) Alter cooling water intakes and/or outflows structures to improve cooling system efficiencies Other adjustments (please specify)
_____________________________________________________________________

Appendix C
Re-circulating Cooling Systems with Ponds & Canals Survey
Appendix C-31
RESPONDENT INFORMATION Q14. What is the NAME and Plant ID number of your power plant?
Plant Name: _____________ Plant ID #: _______________
What is your title and water management responsibilities? (optional) Title: ___________________________________________________ Plant water management responsibilities: (please check all that apply)
Complete Form EIA-767 Complete NPDS forms Record water use data Manage cooling controls Monitor plant water use Make decisions on in-plant water management Other
_____________________________________________________
If you would be willing to discuss water use at your facility with us via phone or email, please enter your contact information below: Name: _________________________________________
Phone: _________________________________________
Email: __________________________________________
COMMENTS AND SUGGESTIONS Please use the space below to communicate any concerns or comments regarding this study, or contact Ben Dziegielewski at 618-453-6021, or by email at: [email protected] . Thank you for responding to this survey.
PLEASE SAVE YOUR COMPLETED SURVEY DOCUMENT TO THE DESKTOP OF YOUR COMPUTER.
RETURN THE SURVEY BY ATTACHING IT TO A REPLY TO OUR COVER LETTER,
OR SEND A NEW MESSAGE TO: [email protected]. The project completion report for this study will be available on the research page of the SIUC Geography Department: http://info.geography.siu.edu/Research/research.html .
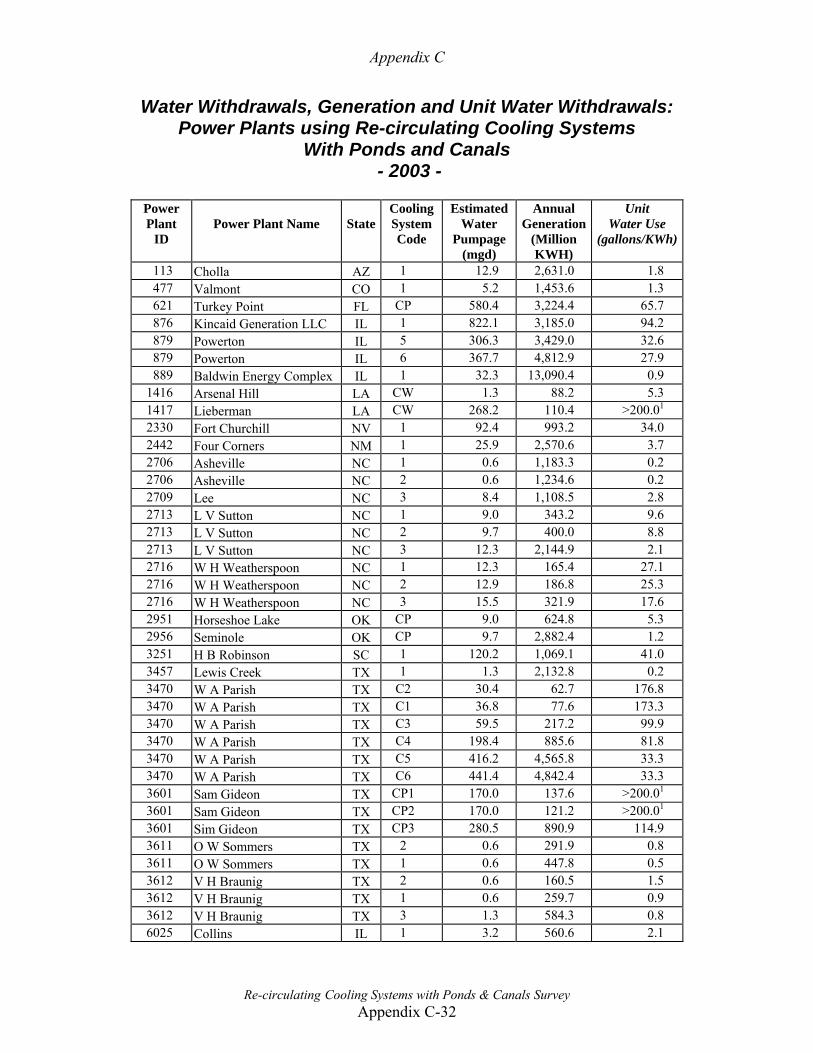
Appendix C
Re-circulating Cooling Systems with Ponds & Canals Survey Appendix C-32
Water Withdrawals, Generation and Unit Water Withdrawals: Power Plants using Re-circulating Cooling Systems
With Ponds and Canals - 2003 -
Power Plant
ID
Power Plant Name
State
Cooling System Code
Estimated Water
Pumpage (mgd)
Annual Generation
(Million KWH)
Unit Water Use
(gallons/KWh)
113 Cholla AZ 1 12.9 2,631.0 1.8 477 Valmont CO 1 5.2 1,453.6 1.3 621 Turkey Point FL CP 580.4 3,224.4 65.7 876 Kincaid Generation LLC IL 1 822.1 3,185.0 94.2 879 Powerton IL 5 306.3 3,429.0 32.6 879 Powerton IL 6 367.7 4,812.9 27.9 889 Baldwin Energy Complex IL 1 32.3 13,090.4 0.9
1416 Arsenal Hill LA CW 1.3 88.2 5.3 1417 Lieberman LA CW 268.2 110.4 >200.01 2330 Fort Churchill NV 1 92.4 993.2 34.0 2442 Four Corners NM 1 25.9 2,570.6 3.7 2706 Asheville NC 1 0.6 1,183.3 0.2 2706 Asheville NC 2 0.6 1,234.6 0.2 2709 Lee NC 3 8.4 1,108.5 2.8 2713 L V Sutton NC 1 9.0 343.2 9.6 2713 L V Sutton NC 2 9.7 400.0 8.8 2713 L V Sutton NC 3 12.3 2,144.9 2.1 2716 W H Weatherspoon NC 1 12.3 165.4 27.1 2716 W H Weatherspoon NC 2 12.9 186.8 25.3 2716 W H Weatherspoon NC 3 15.5 321.9 17.6 2951 Horseshoe Lake OK CP 9.0 624.8 5.3 2956 Seminole OK CP 9.7 2,882.4 1.2 3251 H B Robinson SC 1 120.2 1,069.1 41.0 3457 Lewis Creek TX 1 1.3 2,132.8 0.2 3470 W A Parish TX C2 30.4 62.7 176.8 3470 W A Parish TX C1 36.8 77.6 173.3 3470 W A Parish TX C3 59.5 217.2 99.9 3470 W A Parish TX C4 198.4 885.6 81.8 3470 W A Parish TX C5 416.2 4,565.8 33.3 3470 W A Parish TX C6 441.4 4,842.4 33.3 3601 Sam Gideon TX CP1 170.0 137.6 >200.01 3601 Sam Gideon TX CP2 170.0 121.2 >200.01 3601 Sim Gideon TX CP3 280.5 890.9 114.9 3611 O W Sommers TX 2 0.6 291.9 0.8 3611 O W Sommers TX 1 0.6 447.8 0.5 3612 V H Braunig TX 2 0.6 160.5 1.5 3612 V H Braunig TX 1 0.6 259.7 0.9 3612 V H Braunig TX 3 1.3 584.3 0.8 6025 Collins IL 1 3.2 560.6 2.1
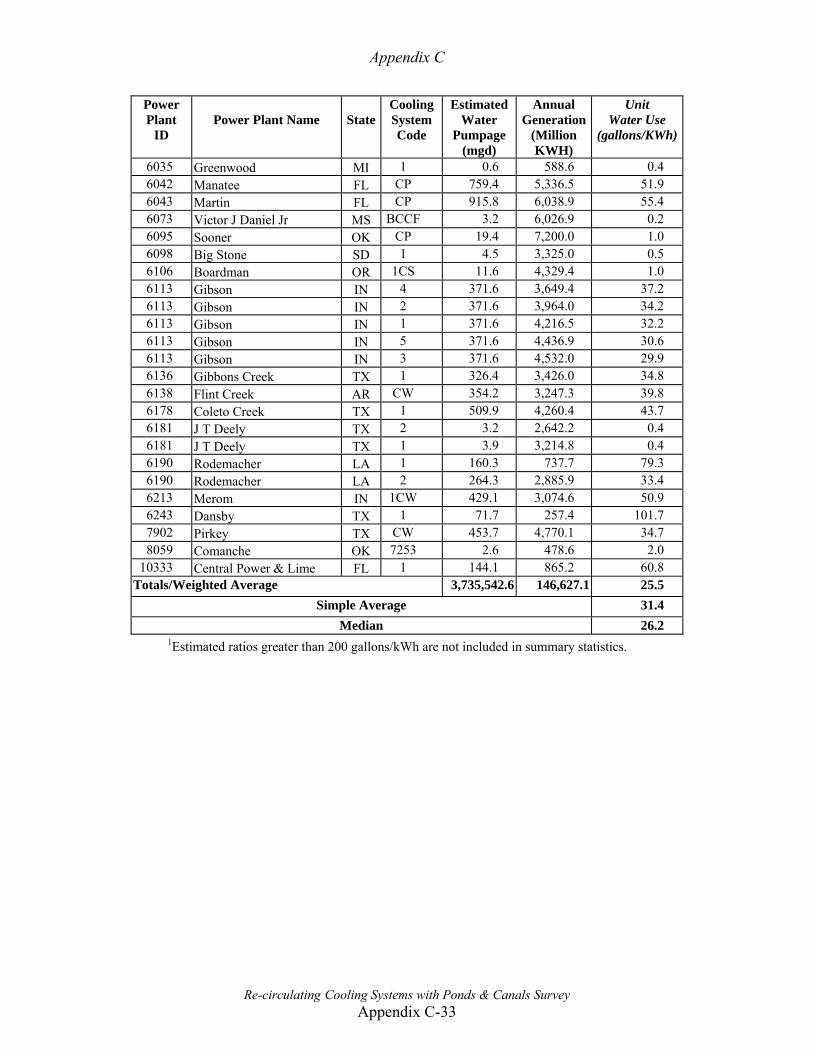
Appendix C
Re-circulating Cooling Systems with Ponds & Canals Survey Appendix C-33
Power Plant
ID
Power Plant Name
State
Cooling System Code
Estimated Water
Pumpage (mgd)
Annual Generation
(Million KWH)
Unit Water Use
(gallons/KWh)
6035 Greenwood MI 1 0.6 588.6 0.4 6042 Manatee FL CP 759.4 5,336.5 51.9 6043 Martin FL CP 915.8 6,038.9 55.4 6073 Victor J Daniel Jr MS BCCF 3.2 6,026.9 0.2 6095 Sooner OK CP 19.4 7,200.0 1.0 6098 Big Stone SD 1 4.5 3,325.0 0.5 6106 Boardman OR 1CS 11.6 4,329.4 1.0 6113 Gibson IN 4 371.6 3,649.4 37.2 6113 Gibson IN 2 371.6 3,964.0 34.2 6113 Gibson IN 1 371.6 4,216.5 32.2 6113 Gibson IN 5 371.6 4,436.9 30.6 6113 Gibson IN 3 371.6 4,532.0 29.9 6136 Gibbons Creek TX 1 326.4 3,426.0 34.8 6138 Flint Creek AR CW 354.2 3,247.3 39.8 6178 Coleto Creek TX 1 509.9 4,260.4 43.7 6181 J T Deely TX 2 3.2 2,642.2 0.4 6181 J T Deely TX 1 3.9 3,214.8 0.4 6190 Rodemacher LA 1 160.3 737.7 79.3 6190 Rodemacher LA 2 264.3 2,885.9 33.4 6213 Merom IN 1CW 429.1 3,074.6 50.9 6243 Dansby TX 1 71.7 257.4 101.7 7902 Pirkey TX CW 453.7 4,770.1 34.7 8059 Comanche OK 7253 2.6 478.6 2.0
10333 Central Power & Lime FL 1 144.1 865.2 60.8 Totals/Weighted Average 3,735,542.6 146,627.1 25.5
Simple Average 31.4 Median 26.2
1Estimated ratios greater than 200 gallons/kWh are not included in summary statistics.
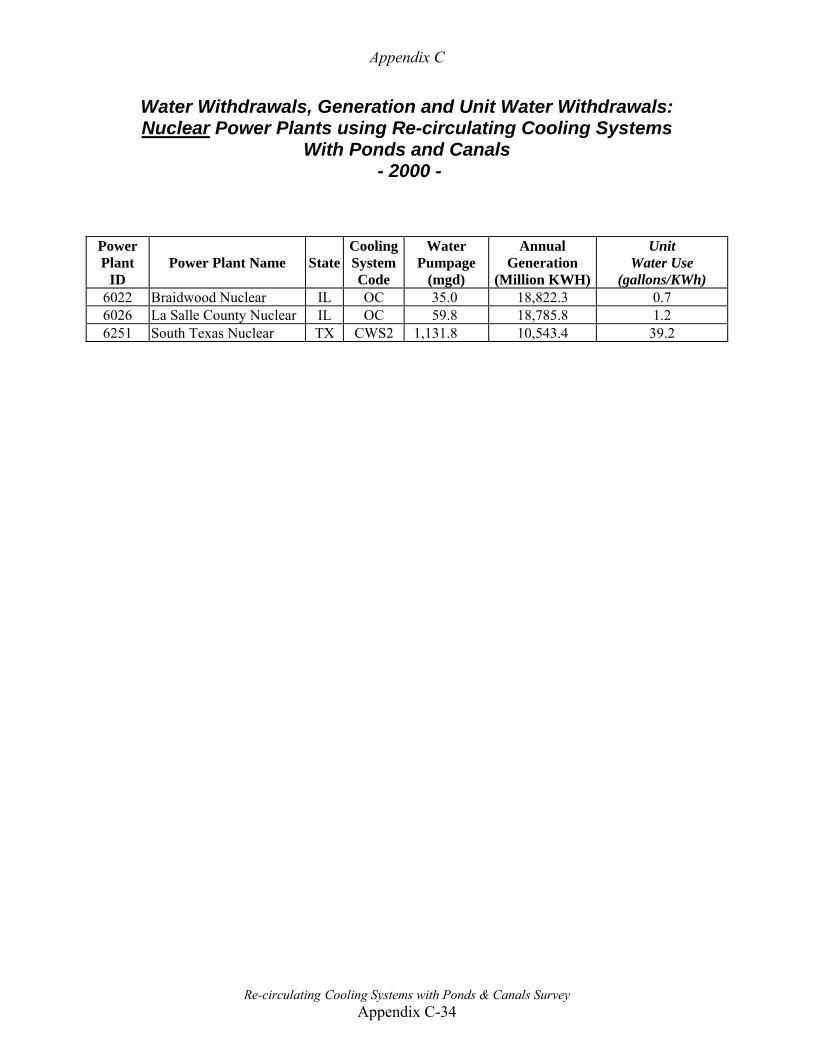
Appendix C
Re-circulating Cooling Systems with Ponds & Canals Survey Appendix C-34
Water Withdrawals, Generation and Unit Water Withdrawals: Nuclear Power Plants using Re-circulating Cooling Systems
With Ponds and Canals - 2000 -
Power Plant
ID
Power Plant Name
State
CoolingSystemCode
Water Pumpage
(mgd)
Annual Generation
(Million KWH)
Unit Water Use
(gallons/KWh) 6022 Braidwood Nuclear IL OC 35.0 18,822.3 0.7 6026 La Salle County Nuclear IL OC 59.8 18,785.8 1.2 6251 South Texas Nuclear TX CWS2 1,131.8 10,543.4 39.2

Appendix C
Closed –Loop Cooling Systems with Cooling Towers Survey Appendix C-35
National Survey of Water Use at Thermoelectric Power Plants
A research project sponsored by the
National Institutes for
Water Resources
conducted by the
Department of Geography and Environmental Resources
Southern Illinois University Carbondale Purpose This survey is one part of a research project to study power plant water withdrawals and consumptive use in the United States. The purpose of this research is to improve the understanding of power plant water use and to develop benchmarks that will facilitate water use evaluations by generation facility managers. A complete description of this project is available on the web site of the National Institutes of Water Resources: http://water.usgs.gov/wrri/04grants/national/nationalindex.html. Instructions This survey consists of 14 questions. Please read each question carefully and provide answers based upon your understanding of the water use operations at your generating facility and the power generation industry as a whole. Answer each question by checking the appropriate boxes or typing in a brief response. Please note that the number of pages may increase as you complete the questionnaire, but this will not affect our ability to properly record your answers. A comments section is included at the end of this form and any comments that you may have would be welcomed. Please return your survey by saving the completed file and attaching it to a reply email message. If you have any questions about this survey or the research project, please contact Ben Dziegielewski at (618) 453-6021, or by email at: [email protected]. This project has been reviewed and approved by the Southern Illinois University Human Subjects Committee. Questions concerning your rights as a participant in this research may be addressed to the Committee Chairperson, Office of Research and Development Administration, Southern Illinois University, Carbondale, IL 62901-4709; Phone: (618) 453-4533. There is no penalty for not participating in this survey.
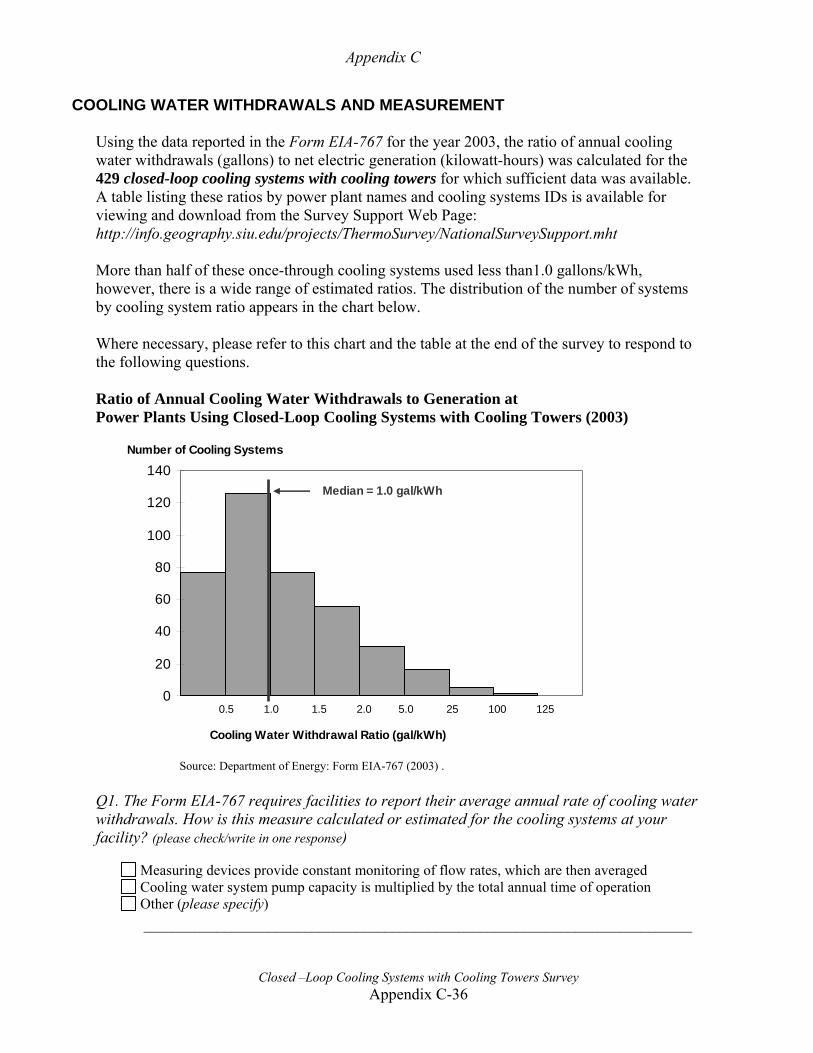
Appendix C
Closed –Loop Cooling Systems with Cooling Towers Survey Appendix C-36
COOLING WATER WITHDRAWALS AND MEASUREMENT Using the data reported in the Form EIA-767 for the year 2003, the ratio of annual cooling water withdrawals (gallons) to net electric generation (kilowatt-hours) was calculated for the 429 closed-loop cooling systems with cooling towers for which sufficient data was available. A table listing these ratios by power plant names and cooling systems IDs is available for viewing and download from the Survey Support Web Page: http://info.geography.siu.edu/projects/ThermoSurvey/NationalSurveySupport.mht More than half of these once-through cooling systems used less than1.0 gallons/kWh, however, there is a wide range of estimated ratios. The distribution of the number of systems by cooling system ratio appears in the chart below. Where necessary, please refer to this chart and the table at the end of the survey to respond to the following questions. Ratio of Annual Cooling Water Withdrawals to Generation at Power Plants Using Closed-Loop Cooling Systems with Cooling Towers (2003)
0
20
40
60
80
100
120
140Number of Cooling Systems
Cooling Water Withdrawal Ratio (gal/kWh)
0.5 1.0 1.5 2.0 5.0 25 100 125
Median = 1.0 gal/kWh
Source: Department of Energy: Form EIA-767 (2003) .
Q1. The Form EIA-767 requires facilities to report their average annual rate of cooling water withdrawals. How is this measure calculated or estimated for the cooling systems at your facility? (please check/write in one response)
Measuring devices provide constant monitoring of flow rates, which are then averaged Cooling water system pump capacity is multiplied by the total annual time of operation Other (please specify) ___________________________________________________________________________

Appendix C
Closed –Loop Cooling Systems with Cooling Towers Survey Appendix C-37
Q2. Please find the withdrawal ratios for the cooling system(s) at your facility in the table that is available on the Survey Support Web Page (see above). Do the ratios that were calculated for your cooling systems appear to be correct?
Don’t know, we are not able to estimate the ratio of cooling water withdrawals to net generation at our facility
Yes, the ratio(s) for our facility are consistent with our own estimates No, these ratios do not accurately represent cooling water use at our facility.
A more accurate estimate of the gallons of water withdrawals per kilowatt-hours of generation can be the determined by: (please specify more accurate data or calculation method):
___________________________________________________________________________ Q3. Please refer to the chart on the previous page. Do the estimated cooling water withdrawal ratios for the cooling systems at your facility differ significantly from the 1.0 gal/kWh median value for closed-loop cooling systems with cooling towers? If so, what do you think are the principal reason(s) for this difference?
No, the ratio(s) for our facility do not differ significantly from the median value Yes, the water withdrawals of the cooling system(s) at our facility differ significantly from the national average for closed-loop cooling systems with cooling towers because: (please specify): ___________________________________________________________________________
Q4. What plant- or system-specific characteristics or conditions do you think contribute to the wide range of cooling system withdrawal ratios that are evident in the figure above and in the table of cooling water withdrawal ratios? (check all that apply and/or write in other relevant factors)
The estimation/measurement of makeup water is imprecise and could be in error There are large differences in the blow-down rates of different cooling towers Some differences in cooling tower designs result in different amounts of water drift Differences in water quality require different blow-down rates for optimal system performance Differences in the ratio of net-to-gross generation at each facility Differences in the designed temperature rise of the condenser(s) in use at each facility Differences in maintaining optimal turbine “backpressure” that affect water flow Differences in the frequency and length of time of boiler/generator shutdowns Differences in other conditions/circumstances: (please specify) ___________________________________________________________________________
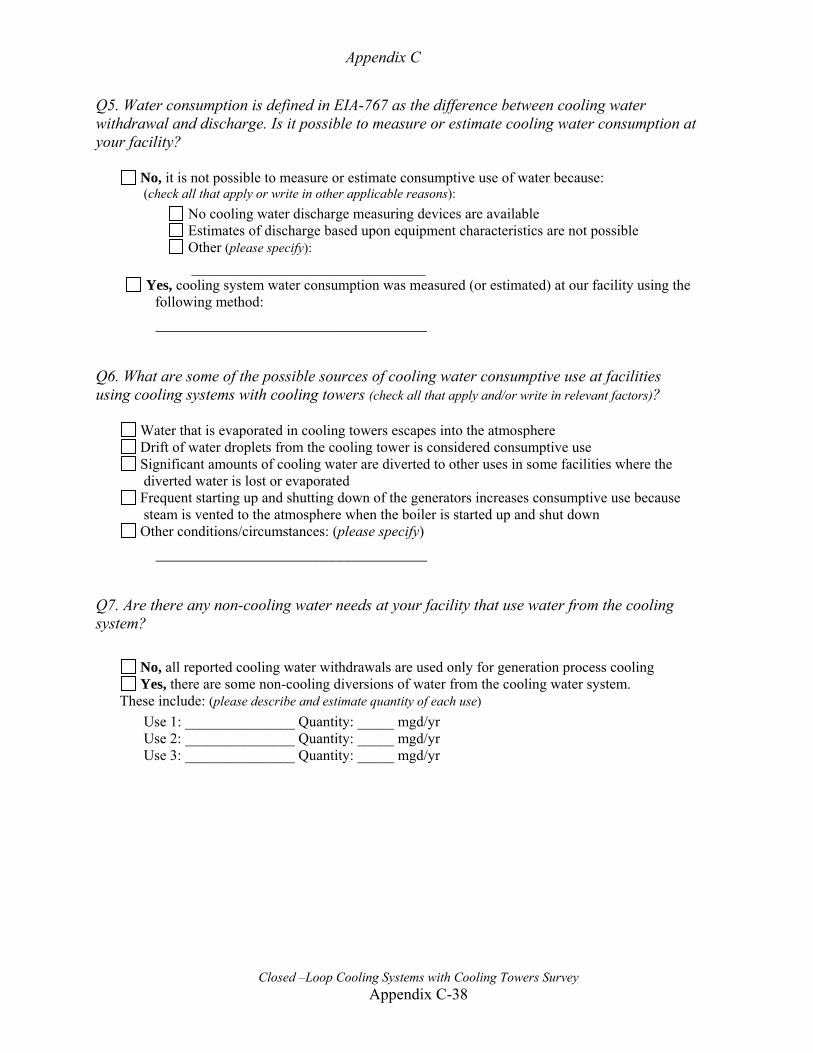
Appendix C
Closed –Loop Cooling Systems with Cooling Towers Survey Appendix C-38
Q5. Water consumption is defined in EIA-767 as the difference between cooling water withdrawal and discharge. Is it possible to measure or estimate cooling water consumption at your facility?
No, it is not possible to measure or estimate consumptive use of water because: (check all that apply or write in other applicable reasons):
No cooling water discharge measuring devices are available Estimates of discharge based upon equipment characteristics are not possible Other (please specify): ________________________________
Yes, cooling system water consumption was measured (or estimated) at our facility using the following method: __________________________________
Q6. What are some of the possible sources of cooling water consumptive use at facilities using cooling systems with cooling towers (check all that apply and/or write in relevant factors)?
Water that is evaporated in cooling towers escapes into the atmosphere Drift of water droplets from the cooling tower is considered consumptive use Significant amounts of cooling water are diverted to other uses in some facilities where the diverted water is lost or evaporated
Frequent starting up and shutting down of the generators increases consumptive use because steam is vented to the atmosphere when the boiler is started up and shut down
Other conditions/circumstances: (please specify) __________________________________
Q7. Are there any non-cooling water needs at your facility that use water from the cooling system?
No, all reported cooling water withdrawals are used only for generation process cooling Yes, there are some non-cooling diversions of water from the cooling water system.
These include: (please describe and estimate quantity of each use) Use 1: _______________ Quantity: _____ mgd/yr Use 2: _______________ Quantity: _____ mgd/yr Use 3: _______________ Quantity: _____ mgd/yr
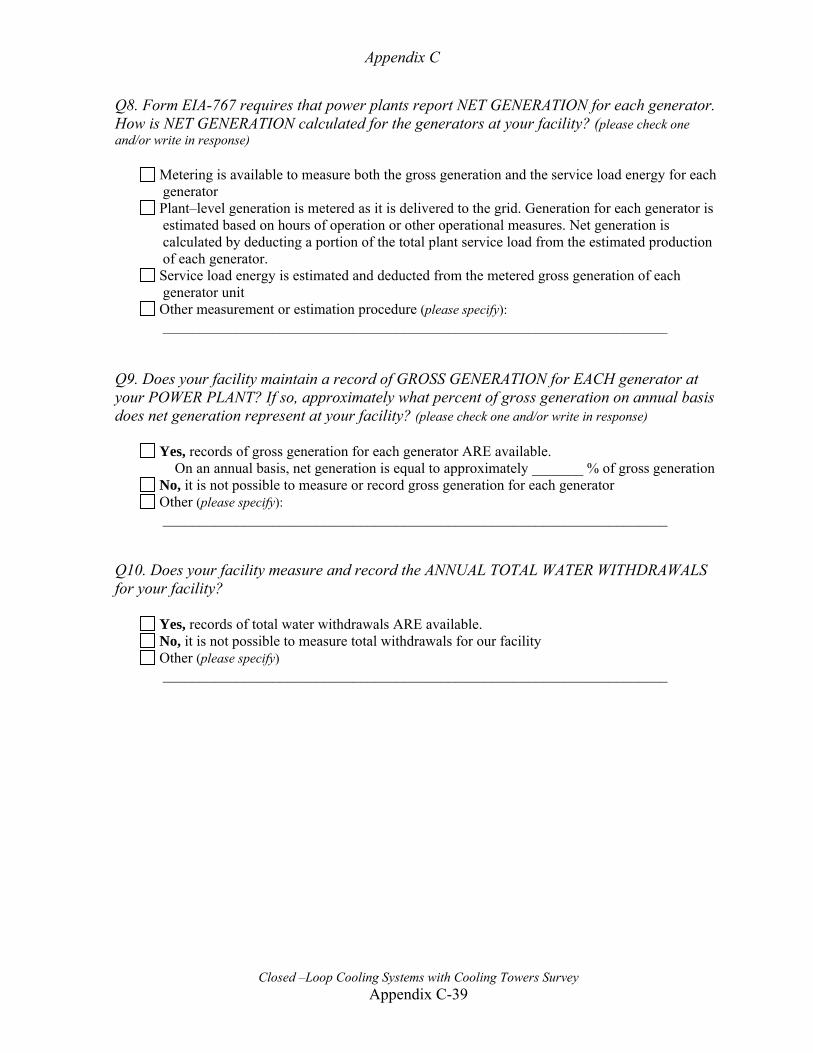
Appendix C
Closed –Loop Cooling Systems with Cooling Towers Survey Appendix C-39
Q8. Form EIA-767 requires that power plants report NET GENERATION for each generator. How is NET GENERATION calculated for the generators at your facility? (please check one and/or write in response)
Metering is available to measure both the gross generation and the service load energy for each generator
Plant–level generation is metered as it is delivered to the grid. Generation for each generator is estimated based on hours of operation or other operational measures. Net generation is calculated by deducting a portion of the total plant service load from the estimated production of each generator.
Service load energy is estimated and deducted from the metered gross generation of each generator unit
Other measurement or estimation procedure (please specify): _____________________________________________________________________
Q9. Does your facility maintain a record of GROSS GENERATION for EACH generator at your POWER PLANT? If so, approximately what percent of gross generation on annual basis does net generation represent at your facility? (please check one and/or write in response)
Yes, records of gross generation for each generator ARE available. On an annual basis, net generation is equal to approximately _______ % of gross generation
No, it is not possible to measure or record gross generation for each generator Other (please specify): _____________________________________________________________________
Q10. Does your facility measure and record the ANNUAL TOTAL WATER WITHDRAWALS for your facility?
Yes, records of total water withdrawals ARE available. No, it is not possible to measure total withdrawals for our facility Other (please specify) _____________________________________________________________________
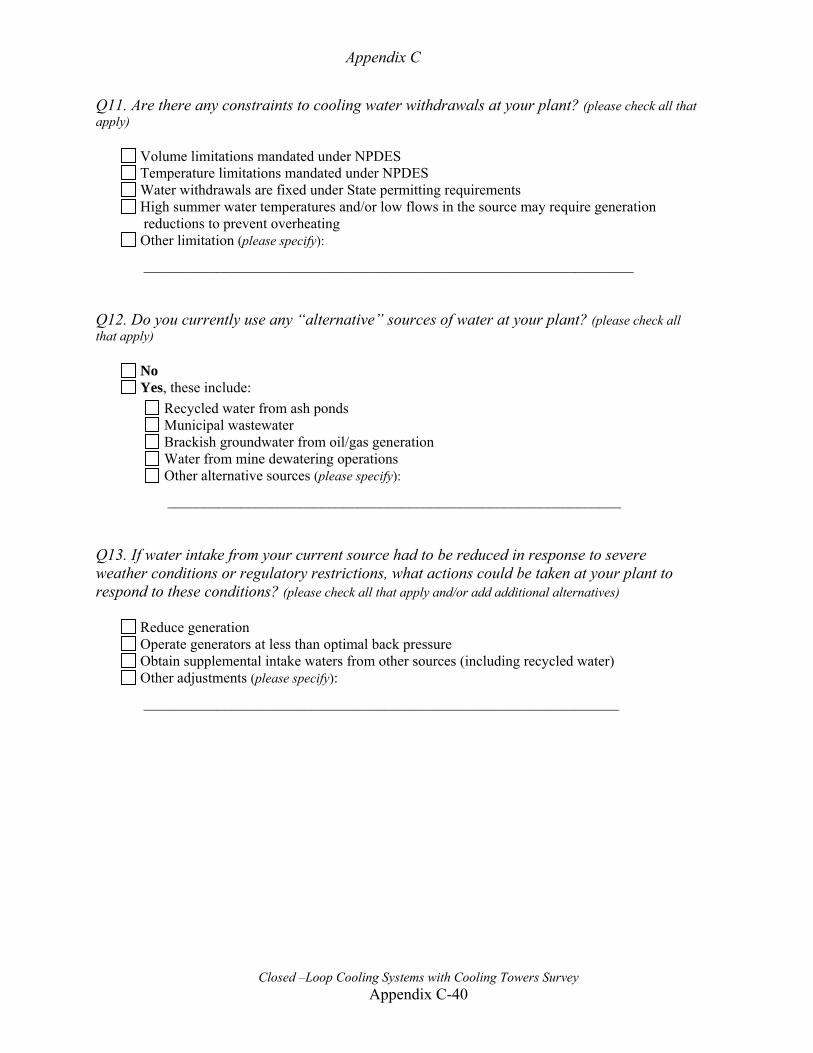
Appendix C
Closed –Loop Cooling Systems with Cooling Towers Survey Appendix C-40
Q11. Are there any constraints to cooling water withdrawals at your plant? (please check all that apply)
Volume limitations mandated under NPDES Temperature limitations mandated under NPDES Water withdrawals are fixed under State permitting requirements High summer water temperatures and/or low flows in the source may require generation reductions to prevent overheating
Other limitation (please specify):
___________________________________________________________________ Q12. Do you currently use any “alternative” sources of water at your plant? (please check all that apply)
No Yes, these include:
Recycled water from ash ponds Municipal wastewater Brackish groundwater from oil/gas generation Water from mine dewatering operations Other alternative sources (please specify):
______________________________________________________________ Q13. If water intake from your current source had to be reduced in response to severe weather conditions or regulatory restrictions, what actions could be taken at your plant to respond to these conditions? (please check all that apply and/or add additional alternatives)
Reduce generation Operate generators at less than optimal back pressure Obtain supplemental intake waters from other sources (including recycled water) Other adjustments (please specify):
_________________________________________________________________

Appendix C
Closed –Loop Cooling Systems with Cooling Towers Survey Appendix C-41
RESPONDENT INFORMATION Q14. What is the NAME and Plant ID number of your power plant?
Plant Name: ________________ Plant ID #: __________________
What is your title and water management responsibilities? (optional) Title: __________________________________________________ Plant water management responsibilities: (please check all that apply)
Complete Form EIA-767 Complete NPDS forms Record water use data Manage cooling controls Monitor plant water use Make decisions on in-plant water management Other
____________________________________
If you would be willing to discuss water use at your facility with us via phone or email, please enter your contact information below: Name: ___________
Phone: ___________
Email: ____________
COMMENTS AND SUGGESTIONS Please use the space below to communicate any concerns or comments regarding this study, or contact Ben Dziegielewski at 618-453-6021, or by email at: [email protected] . Thank you for responding to this survey.
PLEASE SAVE YOUR COMPLETED SURVEY DOCUMENT TO THE DESKTOP OF YOUR COMPUTER.
RETURN THE SURVEY BY ATTACHING IT TO A REPLY TO OUR COVER LETTER,
OR SEND A NEW MESSAGE TO: [email protected]. Once completed, the final project report for this study will be available on the research page of the SIUC Geography Department: http://info.geography.siu.edu/Research/research.html .
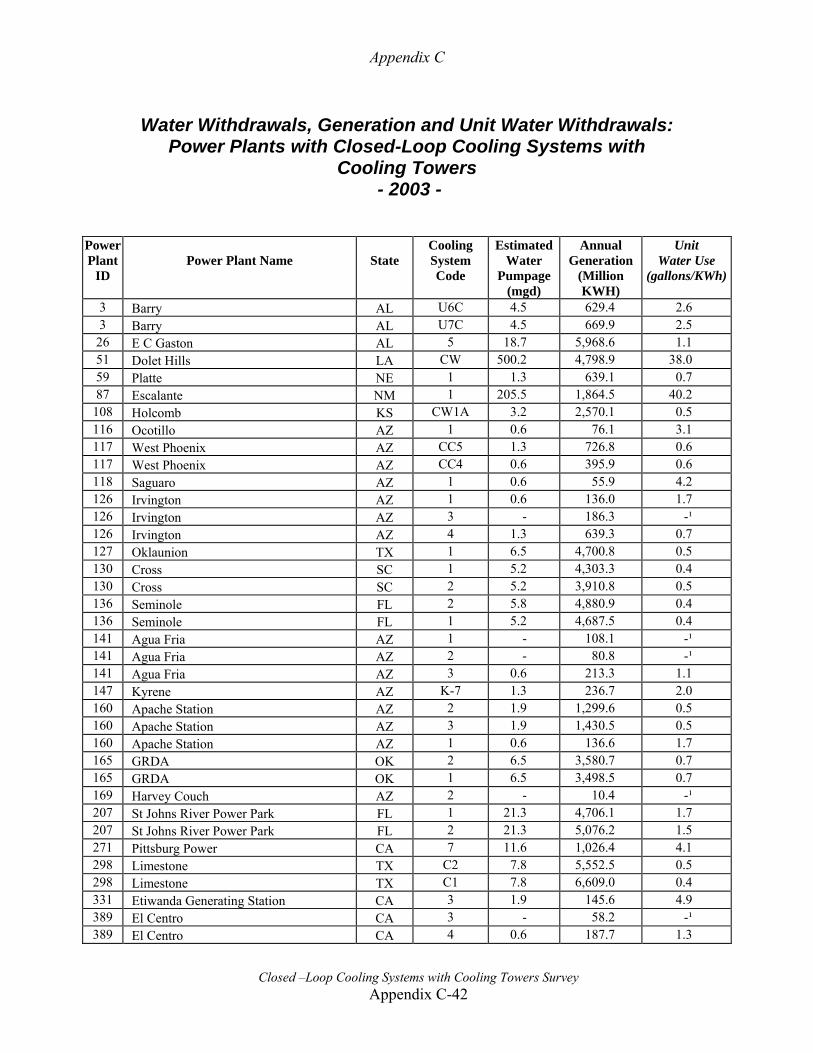
Appendix C
Closed –Loop Cooling Systems with Cooling Towers Survey Appendix C-42
Water Withdrawals, Generation and Unit Water Withdrawals:
Power Plants with Closed-Loop Cooling Systems with Cooling Towers
- 2003 -
Power Plant
ID
Power Plant Name
State
Cooling System Code
Estimated Water
Pumpage (mgd)
Annual Generation
(Million KWH)
Unit Water Use
(gallons/KWh)
3 Barry AL U6C 4.5 629.4 2.6 3 Barry AL U7C 4.5 669.9 2.5
26 E C Gaston AL 5 18.7 5,968.6 1.1 51 Dolet Hills LA CW 500.2 4,798.9 38.0 59 Platte NE 1 1.3 639.1 0.7 87 Escalante NM 1 205.5 1,864.5 40.2
108 Holcomb KS CW1A 3.2 2,570.1 0.5 116 Ocotillo AZ 1 0.6 76.1 3.1 117 West Phoenix AZ CC5 1.3 726.8 0.6 117 West Phoenix AZ CC4 0.6 395.9 0.6 118 Saguaro AZ 1 0.6 55.9 4.2 126 Irvington AZ 1 0.6 136.0 1.7 126 Irvington AZ 3 - 186.3 -¹ 126 Irvington AZ 4 1.3 639.3 0.7 127 Oklaunion TX 1 6.5 4,700.8 0.5 130 Cross SC 1 5.2 4,303.3 0.4 130 Cross SC 2 5.2 3,910.8 0.5 136 Seminole FL 2 5.8 4,880.9 0.4 136 Seminole FL 1 5.2 4,687.5 0.4 141 Agua Fria AZ 1 - 108.1 -¹ 141 Agua Fria AZ 2 - 80.8 -¹ 141 Agua Fria AZ 3 0.6 213.3 1.1 147 Kyrene AZ K-7 1.3 236.7 2.0 160 Apache Station AZ 2 1.9 1,299.6 0.5 160 Apache Station AZ 3 1.9 1,430.5 0.5 160 Apache Station AZ 1 0.6 136.6 1.7 165 GRDA OK 2 6.5 3,580.7 0.7 165 GRDA OK 1 6.5 3,498.5 0.7 169 Harvey Couch AZ 2 - 10.4 -¹ 207 St Johns River Power Park FL 1 21.3 4,706.1 1.7 207 St Johns River Power Park FL 2 21.3 5,076.2 1.5 271 Pittsburg Power CA 7 11.6 1,026.4 4.1 298 Limestone TX C2 7.8 5,552.5 0.5 298 Limestone TX C1 7.8 6,609.0 0.4 331 Etiwanda Generating Station CA 3 1.9 145.6 4.9 389 El Centro CA 3 - 58.2 -¹ 389 El Centro CA 4 0.6 187.7 1.3
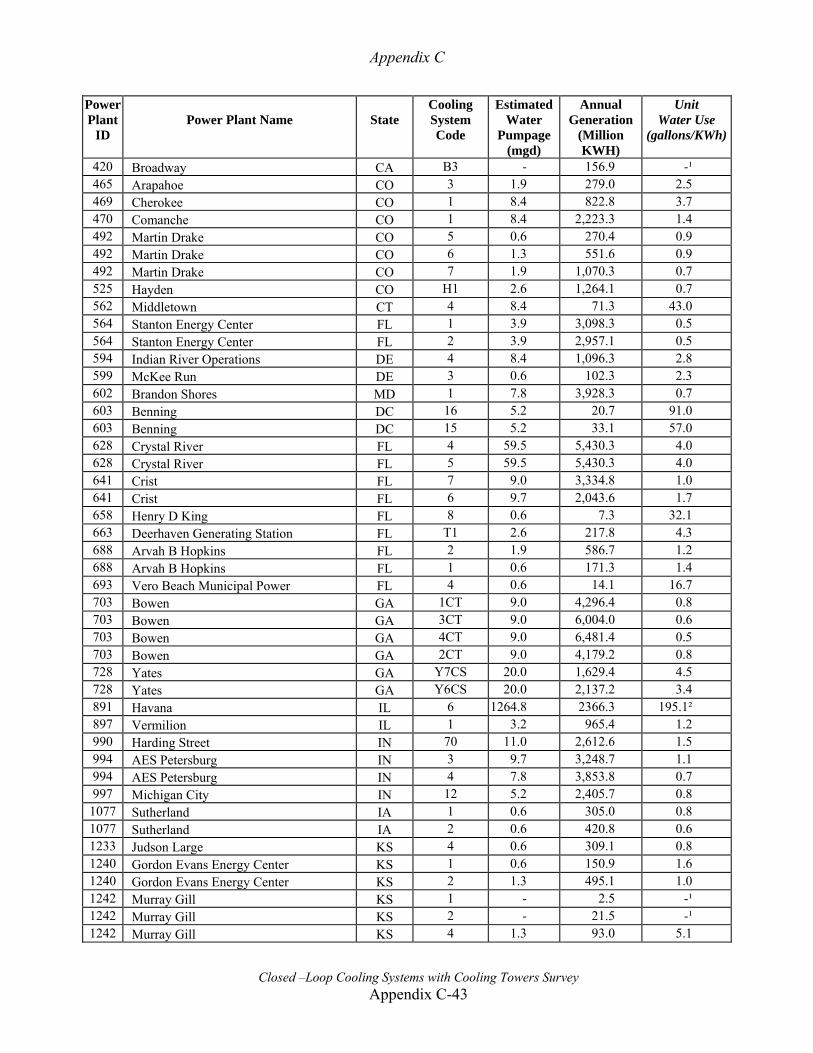
Appendix C
Closed –Loop Cooling Systems with Cooling Towers Survey Appendix C-43
Power Plant
ID
Power Plant Name
State
Cooling System Code
Estimated Water
Pumpage (mgd)
Annual Generation
(Million KWH)
Unit Water Use
(gallons/KWh)
420 Broadway CA B3 - 156.9 -¹ 465 Arapahoe CO 3 1.9 279.0 2.5 469 Cherokee CO 1 8.4 822.8 3.7 470 Comanche CO 1 8.4 2,223.3 1.4 492 Martin Drake CO 5 0.6 270.4 0.9 492 Martin Drake CO 6 1.3 551.6 0.9 492 Martin Drake CO 7 1.9 1,070.3 0.7 525 Hayden CO H1 2.6 1,264.1 0.7 562 Middletown CT 4 8.4 71.3 43.0 564 Stanton Energy Center FL 1 3.9 3,098.3 0.5 564 Stanton Energy Center FL 2 3.9 2,957.1 0.5 594 Indian River Operations DE 4 8.4 1,096.3 2.8 599 McKee Run DE 3 0.6 102.3 2.3 602 Brandon Shores MD 1 7.8 3,928.3 0.7 603 Benning DC 16 5.2 20.7 91.0 603 Benning DC 15 5.2 33.1 57.0 628 Crystal River FL 4 59.5 5,430.3 4.0 628 Crystal River FL 5 59.5 5,430.3 4.0 641 Crist FL 7 9.0 3,334.8 1.0 641 Crist FL 6 9.7 2,043.6 1.7 658 Henry D King FL 8 0.6 7.3 32.1 663 Deerhaven Generating Station FL T1 2.6 217.8 4.3 688 Arvah B Hopkins FL 2 1.9 586.7 1.2 688 Arvah B Hopkins FL 1 0.6 171.3 1.4 693 Vero Beach Municipal Power FL 4 0.6 14.1 16.7 703 Bowen GA 1CT 9.0 4,296.4 0.8 703 Bowen GA 3CT 9.0 6,004.0 0.6 703 Bowen GA 4CT 9.0 6,481.4 0.5 703 Bowen GA 2CT 9.0 4,179.2 0.8 728 Yates GA Y7CS 20.0 1,629.4 4.5 728 Yates GA Y6CS 20.0 2,137.2 3.4 891 Havana IL 6 1264.8 2366.3 195.1² 897 Vermilion IL 1 3.2 965.4 1.2 990 Harding Street IN 70 11.0 2,612.6 1.5 994 AES Petersburg IN 3 9.7 3,248.7 1.1 994 AES Petersburg IN 4 7.8 3,853.8 0.7 997 Michigan City IN 12 5.2 2,405.7 0.8 1077 Sutherland IA 1 0.6 305.0 0.8 1077 Sutherland IA 2 0.6 420.8 0.6 1233 Judson Large KS 4 0.6 309.1 0.8 1240 Gordon Evans Energy Center KS 1 0.6 150.9 1.6 1240 Gordon Evans Energy Center KS 2 1.3 495.1 1.0 1242 Murray Gill KS 1 - 2.5 -¹ 1242 Murray Gill KS 2 - 21.5 -¹ 1242 Murray Gill KS 4 1.3 93.0 5.1
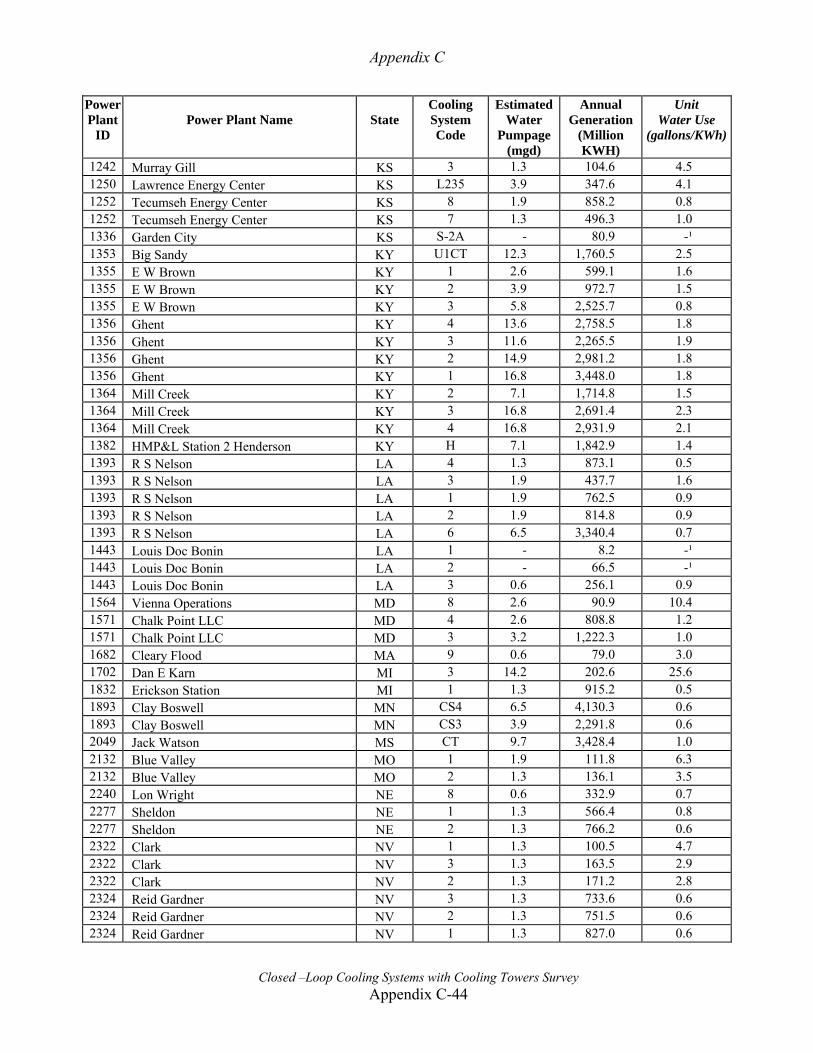
Appendix C
Closed –Loop Cooling Systems with Cooling Towers Survey Appendix C-44
Power Plant
ID
Power Plant Name
State
Cooling System Code
Estimated Water
Pumpage (mgd)
Annual Generation
(Million KWH)
Unit Water Use
(gallons/KWh)
1242 Murray Gill KS 3 1.3 104.6 4.5 1250 Lawrence Energy Center KS L235 3.9 347.6 4.1 1252 Tecumseh Energy Center KS 8 1.9 858.2 0.8 1252 Tecumseh Energy Center KS 7 1.3 496.3 1.0 1336 Garden City KS S-2A - 80.9 -¹ 1353 Big Sandy KY U1CT 12.3 1,760.5 2.5 1355 E W Brown KY 1 2.6 599.1 1.6 1355 E W Brown KY 2 3.9 972.7 1.5 1355 E W Brown KY 3 5.8 2,525.7 0.8 1356 Ghent KY 4 13.6 2,758.5 1.8 1356 Ghent KY 3 11.6 2,265.5 1.9 1356 Ghent KY 2 14.9 2,981.2 1.8 1356 Ghent KY 1 16.8 3,448.0 1.8 1364 Mill Creek KY 2 7.1 1,714.8 1.5 1364 Mill Creek KY 3 16.8 2,691.4 2.3 1364 Mill Creek KY 4 16.8 2,931.9 2.1 1382 HMP&L Station 2 Henderson KY H 7.1 1,842.9 1.4 1393 R S Nelson LA 4 1.3 873.1 0.5 1393 R S Nelson LA 3 1.9 437.7 1.6 1393 R S Nelson LA 1 1.9 762.5 0.9 1393 R S Nelson LA 2 1.9 814.8 0.9 1393 R S Nelson LA 6 6.5 3,340.4 0.7 1443 Louis Doc Bonin LA 1 - 8.2 -¹ 1443 Louis Doc Bonin LA 2 - 66.5 -¹ 1443 Louis Doc Bonin LA 3 0.6 256.1 0.9 1564 Vienna Operations MD 8 2.6 90.9 10.4 1571 Chalk Point LLC MD 4 2.6 808.8 1.2 1571 Chalk Point LLC MD 3 3.2 1,222.3 1.0 1682 Cleary Flood MA 9 0.6 79.0 3.0 1702 Dan E Karn MI 3 14.2 202.6 25.6 1832 Erickson Station MI 1 1.3 915.2 0.5 1893 Clay Boswell MN CS4 6.5 4,130.3 0.6 1893 Clay Boswell MN CS3 3.9 2,291.8 0.6 2049 Jack Watson MS CT 9.7 3,428.4 1.0 2132 Blue Valley MO 1 1.9 111.8 6.3 2132 Blue Valley MO 2 1.3 136.1 3.5 2240 Lon Wright NE 8 0.6 332.9 0.7 2277 Sheldon NE 1 1.3 566.4 0.8 2277 Sheldon NE 2 1.3 766.2 0.6 2322 Clark NV 1 1.3 100.5 4.7 2322 Clark NV 3 1.3 163.5 2.9 2322 Clark NV 2 1.3 171.2 2.8 2324 Reid Gardner NV 3 1.3 733.6 0.6 2324 Reid Gardner NV 2 1.3 751.5 0.6 2324 Reid Gardner NV 1 1.3 827.0 0.6
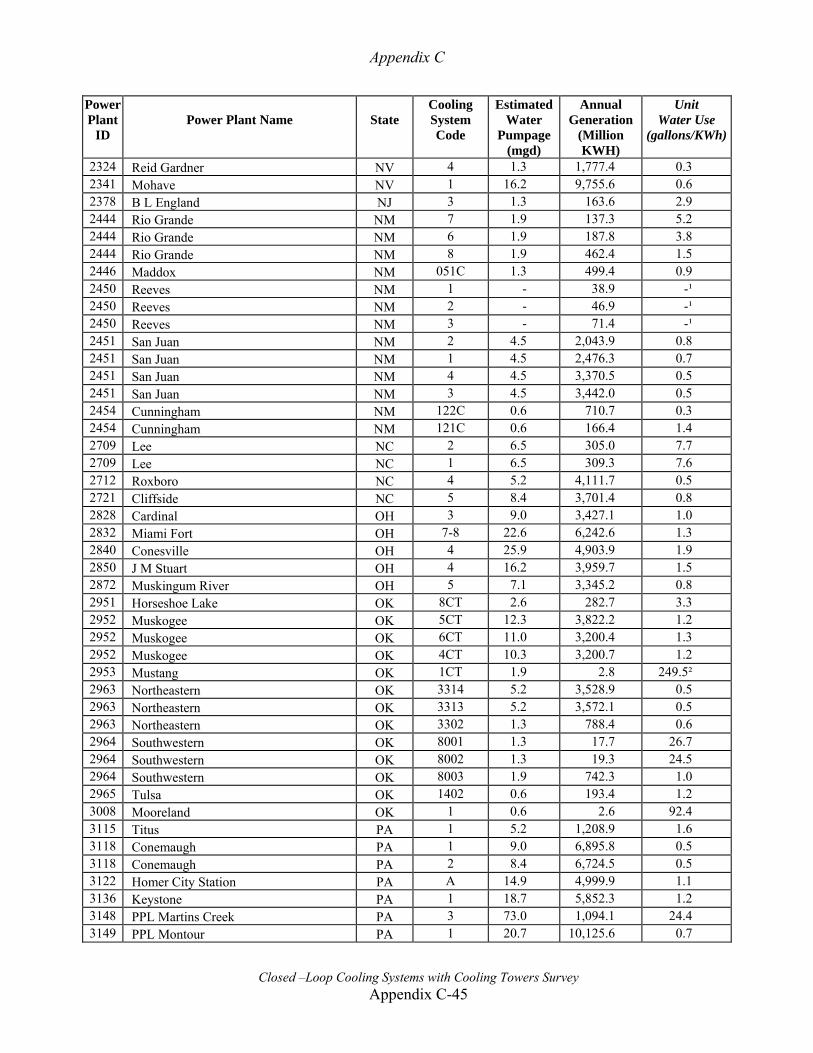
Appendix C
Closed –Loop Cooling Systems with Cooling Towers Survey Appendix C-45
Power Plant
ID
Power Plant Name
State
Cooling System Code
Estimated Water
Pumpage (mgd)
Annual Generation
(Million KWH)
Unit Water Use
(gallons/KWh)
2324 Reid Gardner NV 4 1.3 1,777.4 0.3 2341 Mohave NV 1 16.2 9,755.6 0.6 2378 B L England NJ 3 1.3 163.6 2.9 2444 Rio Grande NM 7 1.9 137.3 5.2 2444 Rio Grande NM 6 1.9 187.8 3.8 2444 Rio Grande NM 8 1.9 462.4 1.5 2446 Maddox NM 051C 1.3 499.4 0.9 2450 Reeves NM 1 - 38.9 -¹ 2450 Reeves NM 2 - 46.9 -¹ 2450 Reeves NM 3 - 71.4 -¹ 2451 San Juan NM 2 4.5 2,043.9 0.8 2451 San Juan NM 1 4.5 2,476.3 0.7 2451 San Juan NM 4 4.5 3,370.5 0.5 2451 San Juan NM 3 4.5 3,442.0 0.5 2454 Cunningham NM 122C 0.6 710.7 0.3 2454 Cunningham NM 121C 0.6 166.4 1.4 2709 Lee NC 2 6.5 305.0 7.7 2709 Lee NC 1 6.5 309.3 7.6 2712 Roxboro NC 4 5.2 4,111.7 0.5 2721 Cliffside NC 5 8.4 3,701.4 0.8 2828 Cardinal OH 3 9.0 3,427.1 1.0 2832 Miami Fort OH 7-8 22.6 6,242.6 1.3 2840 Conesville OH 4 25.9 4,903.9 1.9 2850 J M Stuart OH 4 16.2 3,959.7 1.5 2872 Muskingum River OH 5 7.1 3,345.2 0.8 2951 Horseshoe Lake OK 8CT 2.6 282.7 3.3 2952 Muskogee OK 5CT 12.3 3,822.2 1.2 2952 Muskogee OK 6CT 11.0 3,200.4 1.3 2952 Muskogee OK 4CT 10.3 3,200.7 1.2 2953 Mustang OK 1CT 1.9 2.8 249.5² 2963 Northeastern OK 3314 5.2 3,528.9 0.5 2963 Northeastern OK 3313 5.2 3,572.1 0.5 2963 Northeastern OK 3302 1.3 788.4 0.6 2964 Southwestern OK 8001 1.3 17.7 26.7 2964 Southwestern OK 8002 1.3 19.3 24.5 2964 Southwestern OK 8003 1.9 742.3 1.0 2965 Tulsa OK 1402 0.6 193.4 1.2 3008 Mooreland OK 1 0.6 2.6 92.4 3115 Titus PA 1 5.2 1,208.9 1.6 3118 Conemaugh PA 1 9.0 6,895.8 0.5 3118 Conemaugh PA 2 8.4 6,724.5 0.5 3122 Homer City Station PA A 14.9 4,999.9 1.1 3136 Keystone PA 1 18.7 5,852.3 1.2 3148 PPL Martins Creek PA 3 73.0 1,094.1 24.4 3149 PPL Montour PA 1 20.7 10,125.6 0.7

Appendix C
Closed –Loop Cooling Systems with Cooling Towers Survey Appendix C-46
Power Plant
ID
Power Plant Name
State
Cooling System Code
Estimated Water
Pumpage (mgd)
Annual Generation
(Million KWH)
Unit Water Use
(gallons/KWh)
3179 Hatfields Ferry Power Station PA 1 6.5 4,993.0 0.5 3179 Hatfields Ferry Power Station PA 2 6.5 5,503.6 0.4 3280 Canadys Steam SC CAN3 3.2 782.7 1.5 3319 Jefferies SC 3 16.8 1,997.3 3.1 3438 J L Bates TX 1 2.6 331.7 2.8 3439 Laredo TX 1 1.3 72.6 6.5 3442 La Palma TX 4 1.9 67.3 10.5 3455 Parkdale TX 1 - 12.2 -¹ 3456 Newman TX 4 1.3 618.3 0.8 3456 Newman TX 1 0.6 278.8 0.8 3456 Newman TX 2 0.6 275.1 0.9 3456 Newman TX 3 0.6 457.6 0.5 3464 Greens Bayou TX C5 2.6 253.8 3.7 3469 T H Wharton TX C2 - 55.3 -¹ 3482 Jones TX 151C 1.9 892.4 0.8 3482 Jones TX 152C 1.9 1,083.8 0.7 3484 Nichols TX 142C 0.6 189.7 1.2 3484 Nichols TX 143C 0.6 527.6 0.4 3484 Nichols TX 141C 0.6 258.4 0.9 3485 Plant X TX 115C 2.6 376.4 2.5 3485 Plant X TX 114C 1.3 729.9 0.6 3494 Permian Basin TX 5 0.6 40.0 5.9 3494 Permian Basin TX 6 3.2 1,802.7 0.7 3500 Collin TX 1 99.5 98.9 367.4² 3526 Rio Pecos TX 5 - 8.0 -¹ 3526 Rio Pecos TX 6 0.6 79.9 3.0 3561 Bryan TX 6 0.6 15.8 14.9 3613 W B Tuttle TX 1 - 1.3 -¹ 3613 W B Tuttle TX 3 - 1.3 -¹ 3613 W B Tuttle TX 4 - 15.2 -¹ 3644 Carbon UT 1 1.3 520.2 0.9 3644 Carbon UT 2 1.9 851.1 0.8 3648 Gadsby UT 1 - 17.6 -¹ 3648 Gadsby UT 2 - 40.5 -¹ 3648 Gadsby UT 3 - 100.1 -¹ 3775 Clinch River VA 1 9.0 1,452.1 2.3 3845 Transalta Centralia Gen WA 70 1.3 87.0 5.4 3845 Transalta Centralia Gen WA CW21 10.3 5,685.8 0.7 3845 Transalta Centralia Gen WA CW22 10.3 5,375.8 0.7 3935 John E Amos WV 1 9.0 5,087.2 0.6 3935 John E Amos WV 3 17.4 8,391.1 0.8 3935 John E Amos WV 2 9.0 5,040.8 0.7 3943 Fort Martin Power Station WV 2 5.8 3,663.5 0.6 3943 Fort Martin Power Station WV 1 5.8 4,195.1 0.5 3944 Harrison Power Station WV 1 12.9 8,638.8 0.5
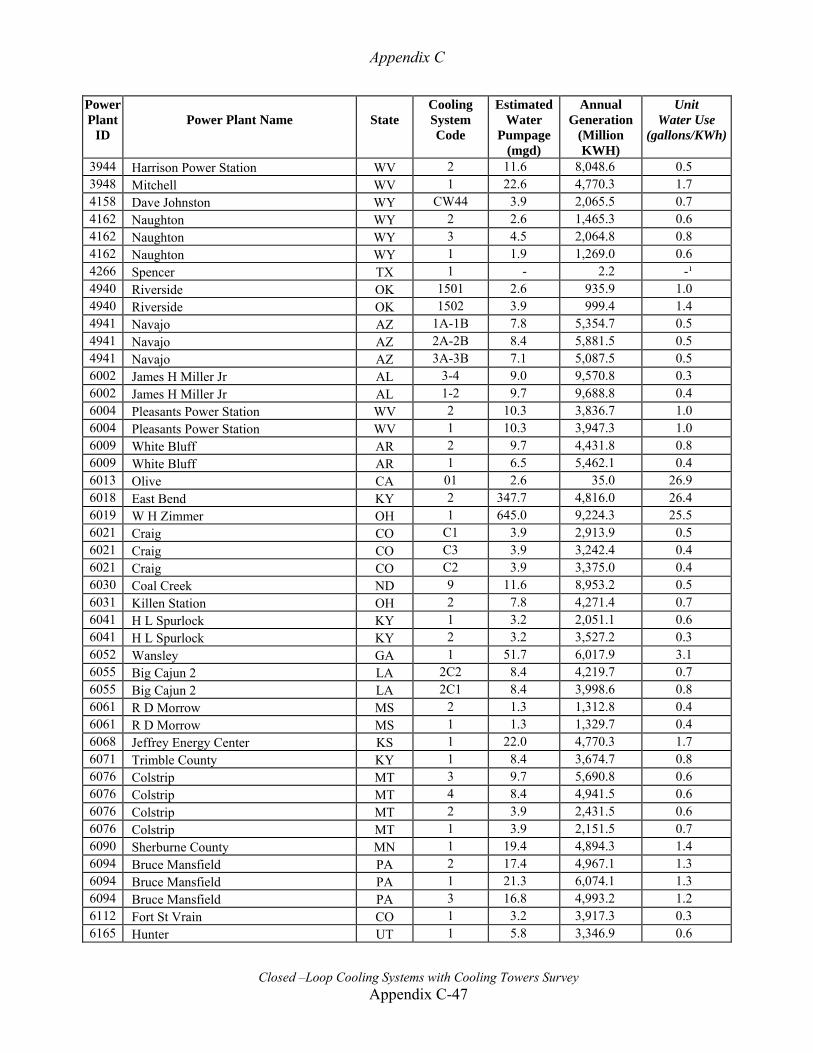
Appendix C
Closed –Loop Cooling Systems with Cooling Towers Survey Appendix C-47
Power Plant
ID
Power Plant Name
State
Cooling System Code
Estimated Water
Pumpage (mgd)
Annual Generation
(Million KWH)
Unit Water Use
(gallons/KWh)
3944 Harrison Power Station WV 2 11.6 8,048.6 0.5 3948 Mitchell WV 1 22.6 4,770.3 1.7 4158 Dave Johnston WY CW44 3.9 2,065.5 0.7 4162 Naughton WY 2 2.6 1,465.3 0.6 4162 Naughton WY 3 4.5 2,064.8 0.8 4162 Naughton WY 1 1.9 1,269.0 0.6 4266 Spencer TX 1 - 2.2 -¹ 4940 Riverside OK 1501 2.6 935.9 1.0 4940 Riverside OK 1502 3.9 999.4 1.4 4941 Navajo AZ 1A-1B 7.8 5,354.7 0.5 4941 Navajo AZ 2A-2B 8.4 5,881.5 0.5 4941 Navajo AZ 3A-3B 7.1 5,087.5 0.5 6002 James H Miller Jr AL 3-4 9.0 9,570.8 0.3 6002 James H Miller Jr AL 1-2 9.7 9,688.8 0.4 6004 Pleasants Power Station WV 2 10.3 3,836.7 1.0 6004 Pleasants Power Station WV 1 10.3 3,947.3 1.0 6009 White Bluff AR 2 9.7 4,431.8 0.8 6009 White Bluff AR 1 6.5 5,462.1 0.4 6013 Olive CA 01 2.6 35.0 26.9 6018 East Bend KY 2 347.7 4,816.0 26.4 6019 W H Zimmer OH 1 645.0 9,224.3 25.5 6021 Craig CO C1 3.9 2,913.9 0.5 6021 Craig CO C3 3.9 3,242.4 0.4 6021 Craig CO C2 3.9 3,375.0 0.4 6030 Coal Creek ND 9 11.6 8,953.2 0.5 6031 Killen Station OH 2 7.8 4,271.4 0.7 6041 H L Spurlock KY 1 3.2 2,051.1 0.6 6041 H L Spurlock KY 2 3.2 3,527.2 0.3 6052 Wansley GA 1 51.7 6,017.9 3.1 6055 Big Cajun 2 LA 2C2 8.4 4,219.7 0.7 6055 Big Cajun 2 LA 2C1 8.4 3,998.6 0.8 6061 R D Morrow MS 2 1.3 1,312.8 0.4 6061 R D Morrow MS 1 1.3 1,329.7 0.4 6068 Jeffrey Energy Center KS 1 22.0 4,770.3 1.7 6071 Trimble County KY 1 8.4 3,674.7 0.8 6076 Colstrip MT 3 9.7 5,690.8 0.6 6076 Colstrip MT 4 8.4 4,941.5 0.6 6076 Colstrip MT 2 3.9 2,431.5 0.6 6076 Colstrip MT 1 3.9 2,151.5 0.7 6090 Sherburne County MN 1 19.4 4,894.3 1.4 6094 Bruce Mansfield PA 2 17.4 4,967.1 1.3 6094 Bruce Mansfield PA 1 21.3 6,074.1 1.3 6094 Bruce Mansfield PA 3 16.8 4,993.2 1.2 6112 Fort St Vrain CO 1 3.2 3,917.3 0.3 6165 Hunter UT 1 5.8 3,346.9 0.6
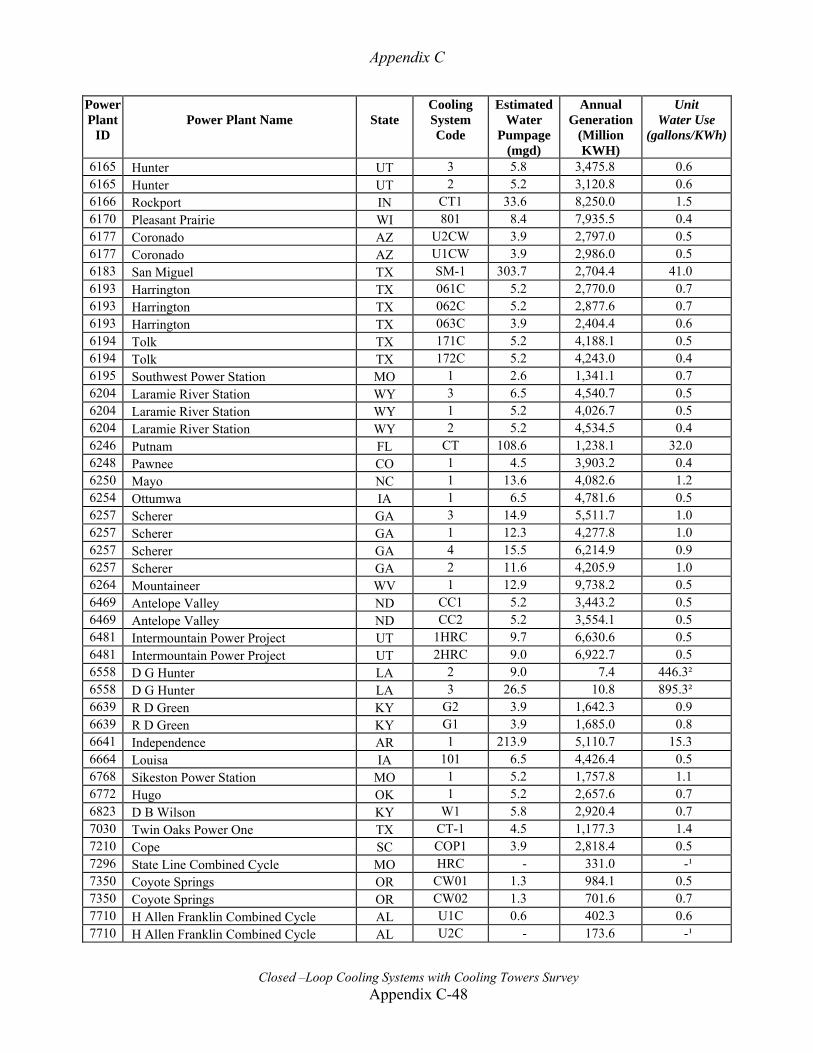
Appendix C
Closed –Loop Cooling Systems with Cooling Towers Survey Appendix C-48
Power Plant
ID
Power Plant Name
State
Cooling System Code
Estimated Water
Pumpage (mgd)
Annual Generation
(Million KWH)
Unit Water Use
(gallons/KWh)
6165 Hunter UT 3 5.8 3,475.8 0.6 6165 Hunter UT 2 5.2 3,120.8 0.6 6166 Rockport IN CT1 33.6 8,250.0 1.5 6170 Pleasant Prairie WI 801 8.4 7,935.5 0.4 6177 Coronado AZ U2CW 3.9 2,797.0 0.5 6177 Coronado AZ U1CW 3.9 2,986.0 0.5 6183 San Miguel TX SM-1 303.7 2,704.4 41.0 6193 Harrington TX 061C 5.2 2,770.0 0.7 6193 Harrington TX 062C 5.2 2,877.6 0.7 6193 Harrington TX 063C 3.9 2,404.4 0.6 6194 Tolk TX 171C 5.2 4,188.1 0.5 6194 Tolk TX 172C 5.2 4,243.0 0.4 6195 Southwest Power Station MO 1 2.6 1,341.1 0.7 6204 Laramie River Station WY 3 6.5 4,540.7 0.5 6204 Laramie River Station WY 1 5.2 4,026.7 0.5 6204 Laramie River Station WY 2 5.2 4,534.5 0.4 6246 Putnam FL CT 108.6 1,238.1 32.0 6248 Pawnee CO 1 4.5 3,903.2 0.4 6250 Mayo NC 1 13.6 4,082.6 1.2 6254 Ottumwa IA 1 6.5 4,781.6 0.5 6257 Scherer GA 3 14.9 5,511.7 1.0 6257 Scherer GA 1 12.3 4,277.8 1.0 6257 Scherer GA 4 15.5 6,214.9 0.9 6257 Scherer GA 2 11.6 4,205.9 1.0 6264 Mountaineer WV 1 12.9 9,738.2 0.5 6469 Antelope Valley ND CC1 5.2 3,443.2 0.5 6469 Antelope Valley ND CC2 5.2 3,554.1 0.5 6481 Intermountain Power Project UT 1HRC 9.7 6,630.6 0.5 6481 Intermountain Power Project UT 2HRC 9.0 6,922.7 0.5 6558 D G Hunter LA 2 9.0 7.4 446.3² 6558 D G Hunter LA 3 26.5 10.8 895.3² 6639 R D Green KY G2 3.9 1,642.3 0.9 6639 R D Green KY G1 3.9 1,685.0 0.8 6641 Independence AR 1 213.9 5,110.7 15.3 6664 Louisa IA 101 6.5 4,426.4 0.5 6768 Sikeston Power Station MO 1 5.2 1,757.8 1.1 6772 Hugo OK 1 5.2 2,657.6 0.7 6823 D B Wilson KY W1 5.8 2,920.4 0.7 7030 Twin Oaks Power One TX CT-1 4.5 1,177.3 1.4 7210 Cope SC COP1 3.9 2,818.4 0.5 7296 State Line Combined Cycle MO HRC - 331.0 -¹ 7350 Coyote Springs OR CW01 1.3 984.1 0.5 7350 Coyote Springs OR CW02 1.3 701.6 0.7 7710 H Allen Franklin Combined Cycle AL U1C 0.6 402.3 0.6 7710 H Allen Franklin Combined Cycle AL U2C - 173.6 -¹
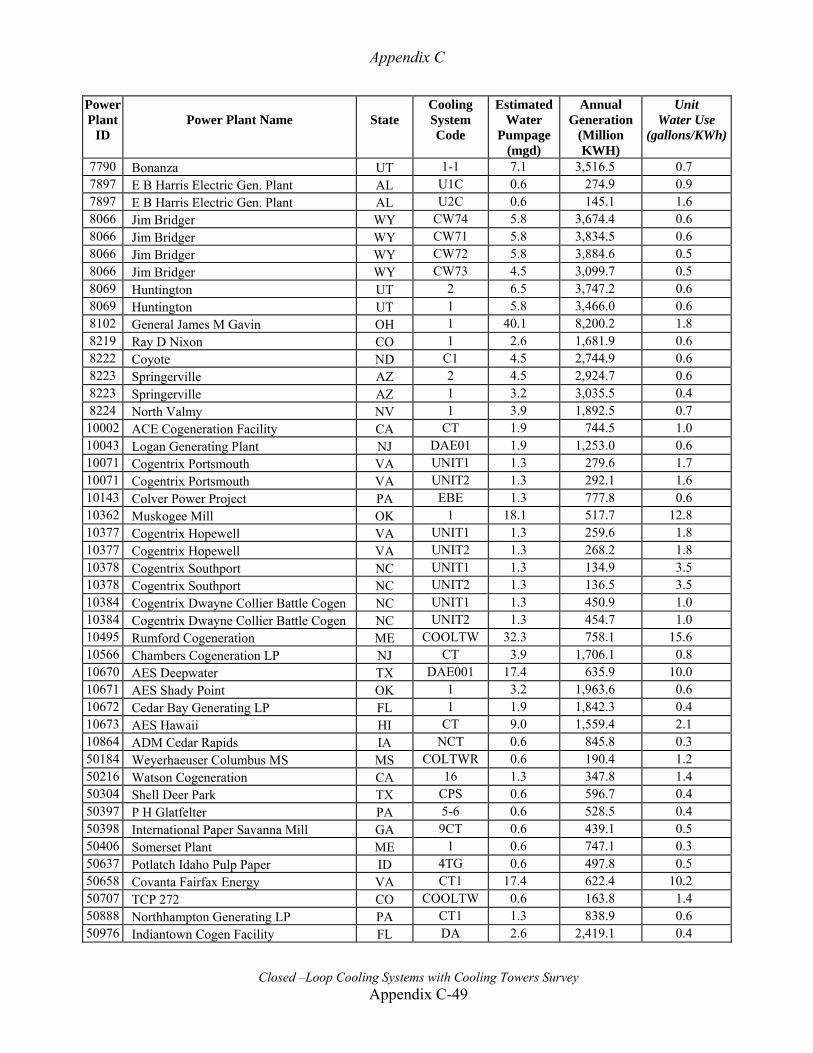
Appendix C
Closed –Loop Cooling Systems with Cooling Towers Survey Appendix C-49
Power Plant
ID
Power Plant Name
State
Cooling System Code
Estimated Water
Pumpage (mgd)
Annual Generation
(Million KWH)
Unit Water Use
(gallons/KWh)
7790 Bonanza UT 1-1 7.1 3,516.5 0.7 7897 E B Harris Electric Gen. Plant AL U1C 0.6 274.9 0.9 7897 E B Harris Electric Gen. Plant AL U2C 0.6 145.1 1.6 8066 Jim Bridger WY CW74 5.8 3,674.4 0.6 8066 Jim Bridger WY CW71 5.8 3,834.5 0.6 8066 Jim Bridger WY CW72 5.8 3,884.6 0.5 8066 Jim Bridger WY CW73 4.5 3,099.7 0.5 8069 Huntington UT 2 6.5 3,747.2 0.6 8069 Huntington UT 1 5.8 3,466.0 0.6 8102 General James M Gavin OH 1 40.1 8,200.2 1.8 8219 Ray D Nixon CO 1 2.6 1,681.9 0.6 8222 Coyote ND C1 4.5 2,744.9 0.6 8223 Springerville AZ 2 4.5 2,924.7 0.6 8223 Springerville AZ 1 3.2 3,035.5 0.4 8224 North Valmy NV 1 3.9 1,892.5 0.7
10002 ACE Cogeneration Facility CA CT 1.9 744.5 1.0 10043 Logan Generating Plant NJ DAE01 1.9 1,253.0 0.6 10071 Cogentrix Portsmouth VA UNIT1 1.3 279.6 1.7 10071 Cogentrix Portsmouth VA UNIT2 1.3 292.1 1.6 10143 Colver Power Project PA EBE 1.3 777.8 0.6 10362 Muskogee Mill OK 1 18.1 517.7 12.8 10377 Cogentrix Hopewell VA UNIT1 1.3 259.6 1.8 10377 Cogentrix Hopewell VA UNIT2 1.3 268.2 1.8 10378 Cogentrix Southport NC UNIT1 1.3 134.9 3.5 10378 Cogentrix Southport NC UNIT2 1.3 136.5 3.5 10384 Cogentrix Dwayne Collier Battle Cogen NC UNIT1 1.3 450.9 1.0 10384 Cogentrix Dwayne Collier Battle Cogen NC UNIT2 1.3 454.7 1.0 10495 Rumford Cogeneration ME COOLTW 32.3 758.1 15.6 10566 Chambers Cogeneration LP NJ CT 3.9 1,706.1 0.8 10670 AES Deepwater TX DAE001 17.4 635.9 10.0 10671 AES Shady Point OK 1 3.2 1,963.6 0.6 10672 Cedar Bay Generating LP FL 1 1.9 1,842.3 0.4 10673 AES Hawaii HI CT 9.0 1,559.4 2.1 10864 ADM Cedar Rapids IA NCT 0.6 845.8 0.3 50184 Weyerhaeuser Columbus MS MS COLTWR 0.6 190.4 1.2 50216 Watson Cogeneration CA 16 1.3 347.8 1.4 50304 Shell Deer Park TX CPS 0.6 596.7 0.4 50397 P H Glatfelter PA 5-6 0.6 528.5 0.4 50398 International Paper Savanna Mill GA 9CT 0.6 439.1 0.5 50406 Somerset Plant ME 1 0.6 747.1 0.3 50637 Potlatch Idaho Pulp Paper ID 4TG 0.6 497.8 0.5 50658 Covanta Fairfax Energy VA CT1 17.4 622.4 10.2 50707 TCP 272 CO COOLTW 0.6 163.8 1.4 50888 Northhampton Generating LP PA CT1 1.3 838.9 0.6 50976 Indiantown Cogen Facility FL DA 2.6 2,419.1 0.4
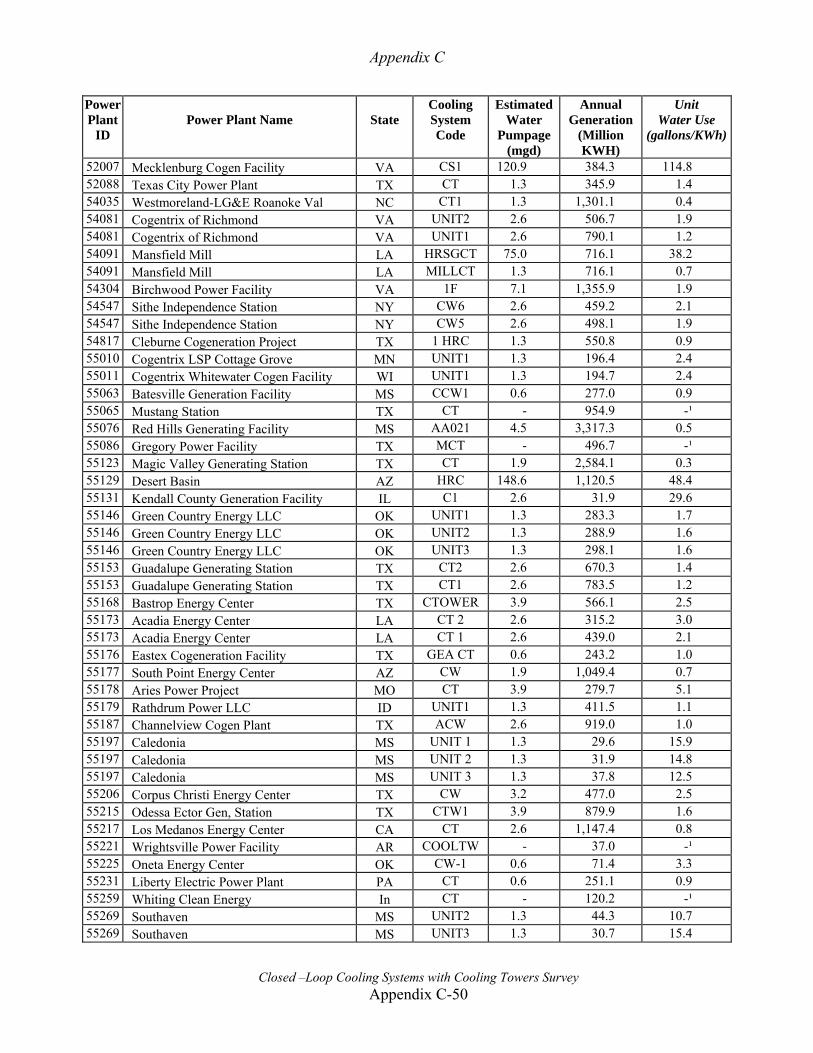
Appendix C
Closed –Loop Cooling Systems with Cooling Towers Survey Appendix C-50
Power Plant
ID
Power Plant Name
State
Cooling System Code
Estimated Water
Pumpage (mgd)
Annual Generation
(Million KWH)
Unit Water Use
(gallons/KWh)
52007 Mecklenburg Cogen Facility VA CS1 120.9 384.3 114.8 52088 Texas City Power Plant TX CT 1.3 345.9 1.4 54035 Westmoreland-LG&E Roanoke Val NC CT1 1.3 1,301.1 0.4 54081 Cogentrix of Richmond VA UNIT2 2.6 506.7 1.9 54081 Cogentrix of Richmond VA UNIT1 2.6 790.1 1.2 54091 Mansfield Mill LA HRSGCT 75.0 716.1 38.2 54091 Mansfield Mill LA MILLCT 1.3 716.1 0.7 54304 Birchwood Power Facility VA 1F 7.1 1,355.9 1.9 54547 Sithe Independence Station NY CW6 2.6 459.2 2.1 54547 Sithe Independence Station NY CW5 2.6 498.1 1.9 54817 Cleburne Cogeneration Project TX 1 HRC 1.3 550.8 0.9 55010 Cogentrix LSP Cottage Grove MN UNIT1 1.3 196.4 2.4 55011 Cogentrix Whitewater Cogen Facility WI UNIT1 1.3 194.7 2.4 55063 Batesville Generation Facility MS CCW1 0.6 277.0 0.9 55065 Mustang Station TX CT - 954.9 -¹ 55076 Red Hills Generating Facility MS AA021 4.5 3,317.3 0.5 55086 Gregory Power Facility TX MCT - 496.7 -¹ 55123 Magic Valley Generating Station TX CT 1.9 2,584.1 0.3 55129 Desert Basin AZ HRC 148.6 1,120.5 48.4 55131 Kendall County Generation Facility IL C1 2.6 31.9 29.6 55146 Green Country Energy LLC OK UNIT1 1.3 283.3 1.7 55146 Green Country Energy LLC OK UNIT2 1.3 288.9 1.6 55146 Green Country Energy LLC OK UNIT3 1.3 298.1 1.6 55153 Guadalupe Generating Station TX CT2 2.6 670.3 1.4 55153 Guadalupe Generating Station TX CT1 2.6 783.5 1.2 55168 Bastrop Energy Center TX CTOWER 3.9 566.1 2.5 55173 Acadia Energy Center LA CT 2 2.6 315.2 3.0 55173 Acadia Energy Center LA CT 1 2.6 439.0 2.1 55176 Eastex Cogeneration Facility TX GEA CT 0.6 243.2 1.0 55177 South Point Energy Center AZ CW 1.9 1,049.4 0.7 55178 Aries Power Project MO CT 3.9 279.7 5.1 55179 Rathdrum Power LLC ID UNIT1 1.3 411.5 1.1 55187 Channelview Cogen Plant TX ACW 2.6 919.0 1.0 55197 Caledonia MS UNIT 1 1.3 29.6 15.9 55197 Caledonia MS UNIT 2 1.3 31.9 14.8 55197 Caledonia MS UNIT 3 1.3 37.8 12.5 55206 Corpus Christi Energy Center TX CW 3.2 477.0 2.5 55215 Odessa Ector Gen, Station TX CTW1 3.9 879.9 1.6 55217 Los Medanos Energy Center CA CT 2.6 1,147.4 0.8 55221 Wrightsville Power Facility AR COOLTW - 37.0 -¹ 55225 Oneta Energy Center OK CW-1 0.6 71.4 3.3 55231 Liberty Electric Power Plant PA CT 0.6 251.1 0.9 55259 Whiting Clean Energy In CT - 120.2 -¹ 55269 Southaven MS UNIT2 1.3 44.3 10.7 55269 Southaven MS UNIT3 1.3 30.7 15.4
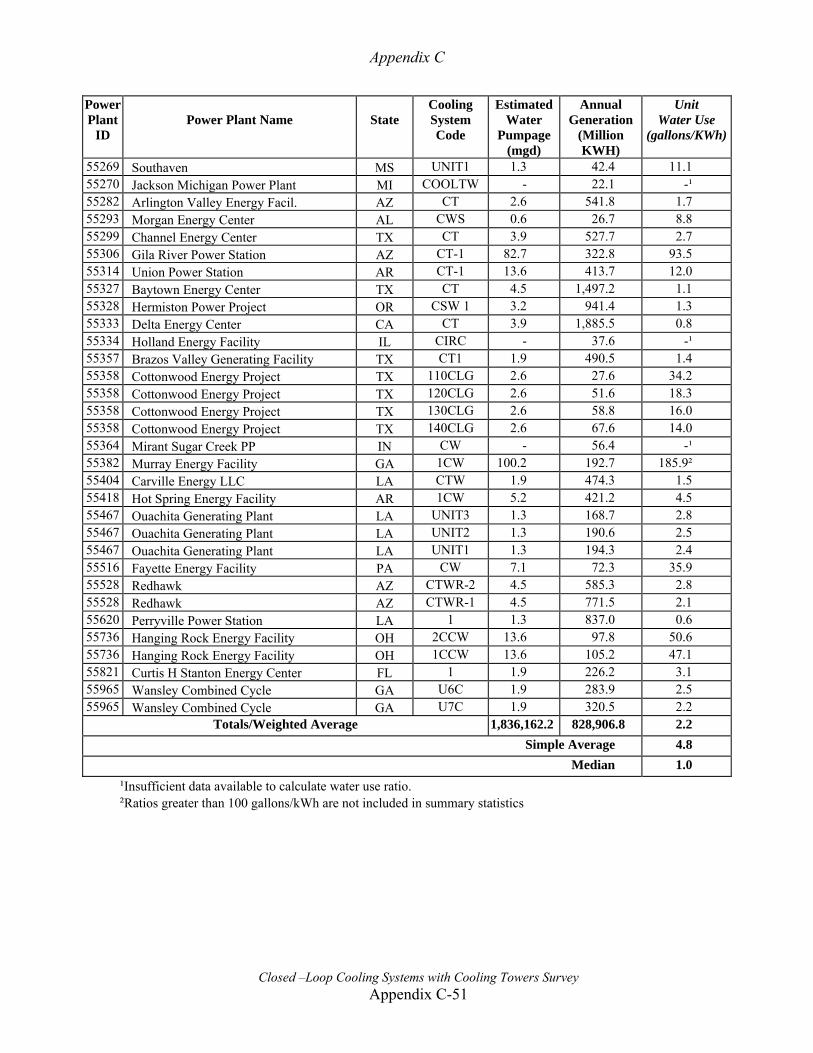
Appendix C
Closed –Loop Cooling Systems with Cooling Towers Survey Appendix C-51
Power Plant
ID
Power Plant Name
State
Cooling System Code
Estimated Water
Pumpage (mgd)
Annual Generation
(Million KWH)
Unit Water Use
(gallons/KWh)
55269 Southaven MS UNIT1 1.3 42.4 11.1 55270 Jackson Michigan Power Plant MI COOLTW - 22.1 -¹ 55282 Arlington Valley Energy Facil. AZ CT 2.6 541.8 1.7 55293 Morgan Energy Center AL CWS 0.6 26.7 8.8 55299 Channel Energy Center TX CT 3.9 527.7 2.7 55306 Gila River Power Station AZ CT-1 82.7 322.8 93.5 55314 Union Power Station AR CT-1 13.6 413.7 12.0 55327 Baytown Energy Center TX CT 4.5 1,497.2 1.1 55328 Hermiston Power Project OR CSW 1 3.2 941.4 1.3 55333 Delta Energy Center CA CT 3.9 1,885.5 0.8 55334 Holland Energy Facility IL CIRC - 37.6 -¹ 55357 Brazos Valley Generating Facility TX CT1 1.9 490.5 1.4 55358 Cottonwood Energy Project TX 110CLG 2.6 27.6 34.2 55358 Cottonwood Energy Project TX 120CLG 2.6 51.6 18.3 55358 Cottonwood Energy Project TX 130CLG 2.6 58.8 16.0 55358 Cottonwood Energy Project TX 140CLG 2.6 67.6 14.0 55364 Mirant Sugar Creek PP IN CW - 56.4 -¹ 55382 Murray Energy Facility GA 1CW 100.2 192.7 185.9² 55404 Carville Energy LLC LA CTW 1.9 474.3 1.5 55418 Hot Spring Energy Facility AR 1CW 5.2 421.2 4.5 55467 Ouachita Generating Plant LA UNIT3 1.3 168.7 2.8 55467 Ouachita Generating Plant LA UNIT2 1.3 190.6 2.5 55467 Ouachita Generating Plant LA UNIT1 1.3 194.3 2.4 55516 Fayette Energy Facility PA CW 7.1 72.3 35.9 55528 Redhawk AZ CTWR-2 4.5 585.3 2.8 55528 Redhawk AZ CTWR-1 4.5 771.5 2.1 55620 Perryville Power Station LA 1 1.3 837.0 0.6 55736 Hanging Rock Energy Facility OH 2CCW 13.6 97.8 50.6 55736 Hanging Rock Energy Facility OH 1CCW 13.6 105.2 47.1 55821 Curtis H Stanton Energy Center FL 1 1.9 226.2 3.1 55965 Wansley Combined Cycle GA U6C 1.9 283.9 2.5 55965 Wansley Combined Cycle GA U7C 1.9 320.5 2.2
Totals/Weighted Average 1,836,162.2 828,906.8 2.2 Simple Average 4.8
Median 1.0 ¹Insufficient data available to calculate water use ratio. ²Ratios greater than 100 gallons/kWh are not included in summary statistics
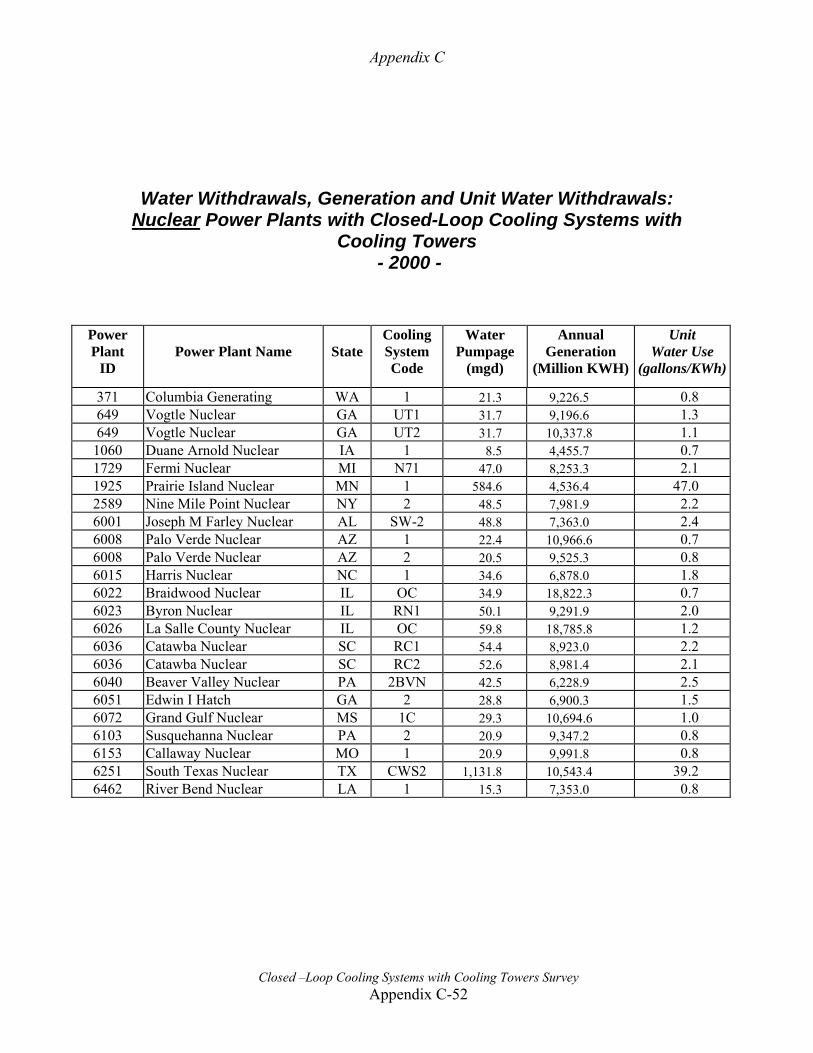
Appendix C
Closed –Loop Cooling Systems with Cooling Towers Survey Appendix C-52
Water Withdrawals, Generation and Unit Water Withdrawals: Nuclear Power Plants with Closed-Loop Cooling Systems with
Cooling Towers - 2000 -
Power Plant
ID
Power Plant Name
State
Cooling System Code
Water Pumpage
(mgd)
Annual Generation
(Million KWH)
Unit Water Use
(gallons/KWh)
371 Columbia Generating WA 1 21.3 9,226.5 0.8 649 Vogtle Nuclear GA UT1 31.7 9,196.6 1.3 649 Vogtle Nuclear GA UT2 31.7 10,337.8 1.1
1060 Duane Arnold Nuclear IA 1 8.5 4,455.7 0.7 1729 Fermi Nuclear MI N71 47.0 8,253.3 2.1 1925 Prairie Island Nuclear MN 1 584.6 4,536.4 47.0 2589 Nine Mile Point Nuclear NY 2 48.5 7,981.9 2.2 6001 Joseph M Farley Nuclear AL SW-2 48.8 7,363.0 2.4 6008 Palo Verde Nuclear AZ 1 22.4 10,966.6 0.7 6008 Palo Verde Nuclear AZ 2 20.5 9,525.3 0.8 6015 Harris Nuclear NC 1 34.6 6,878.0 1.8 6022 Braidwood Nuclear IL OC 34.9 18,822.3 0.7 6023 Byron Nuclear IL RN1 50.1 9,291.9 2.0 6026 La Salle County Nuclear IL OC 59.8 18,785.8 1.2 6036 Catawba Nuclear SC RC1 54.4 8,923.0 2.2 6036 Catawba Nuclear SC RC2 52.6 8,981.4 2.1 6040 Beaver Valley Nuclear PA 2BVN 42.5 6,228.9 2.5 6051 Edwin I Hatch GA 2 28.8 6,900.3 1.5 6072 Grand Gulf Nuclear MS 1C 29.3 10,694.6 1.0 6103 Susquehanna Nuclear PA 2 20.9 9,347.2 0.8 6153 Callaway Nuclear MO 1 20.9 9,991.8 0.8 6251 South Texas Nuclear TX CWS2 1,131.8 10,543.4 39.2 6462 River Bend Nuclear LA 1 15.3 7,353.0 0.8
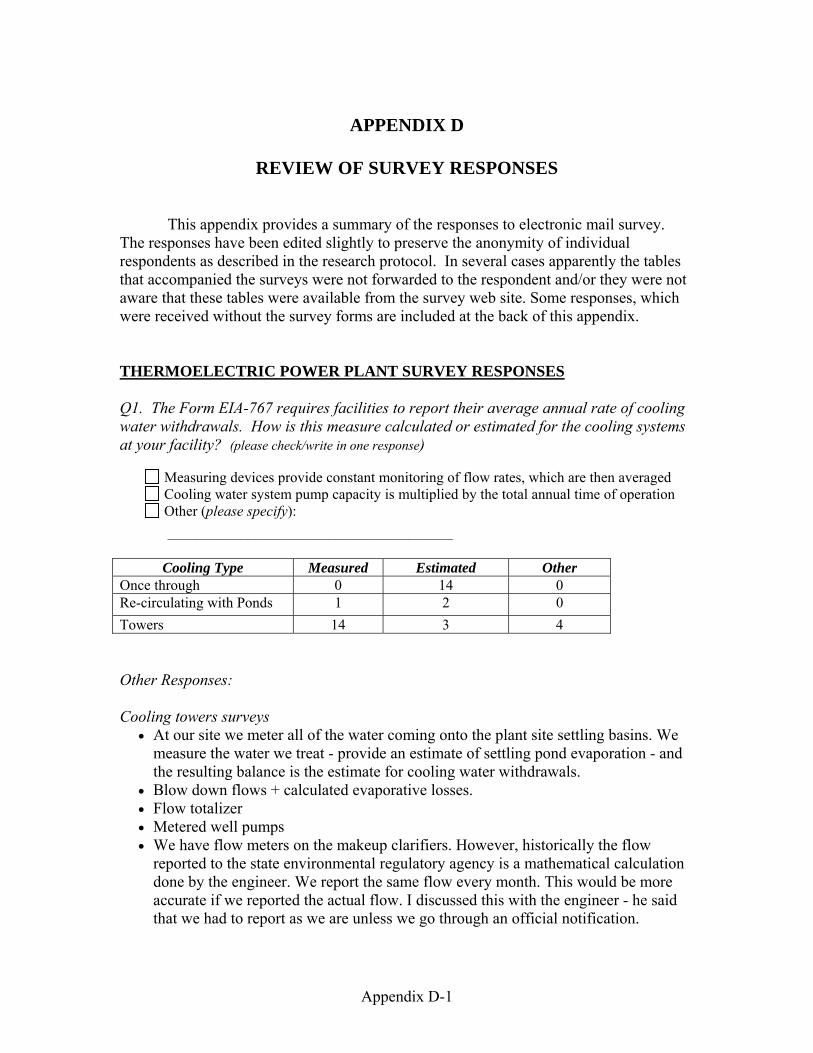
Appendix D-1
APPENDIX D
REVIEW OF SURVEY RESPONSES
This appendix provides a summary of the responses to electronic mail survey. The responses have been edited slightly to preserve the anonymity of individual respondents as described in the research protocol. In several cases apparently the tables that accompanied the surveys were not forwarded to the respondent and/or they were not aware that these tables were available from the survey web site. Some responses, which were received without the survey forms are included at the back of this appendix. THERMOELECTRIC POWER PLANT SURVEY RESPONSES Q1. The Form EIA-767 requires facilities to report their average annual rate of cooling water withdrawals. How is this measure calculated or estimated for the cooling systems at your facility? (please check/write in one response)
Measuring devices provide constant monitoring of flow rates, which are then averaged Cooling water system pump capacity is multiplied by the total annual time of operation Other (please specify): _______________________________________
Cooling Type Measured Estimated Other
Once through 0 14 0 Re-circulating with Ponds 1 2 0 Towers 14 3 4 Other Responses: Cooling towers surveys
• At our site we meter all of the water coming onto the plant site settling basins. We measure the water we treat - provide an estimate of settling pond evaporation - and the resulting balance is the estimate for cooling water withdrawals.
• Blow down flows + calculated evaporative losses. • Flow totalizer • Metered well pumps • We have flow meters on the makeup clarifiers. However, historically the flow
reported to the state environmental regulatory agency is a mathematical calculation done by the engineer. We report the same flow every month. This would be more accurate if we reported the actual flow. I discussed this with the engineer - he said that we had to report as we are unless we go through an official notification.
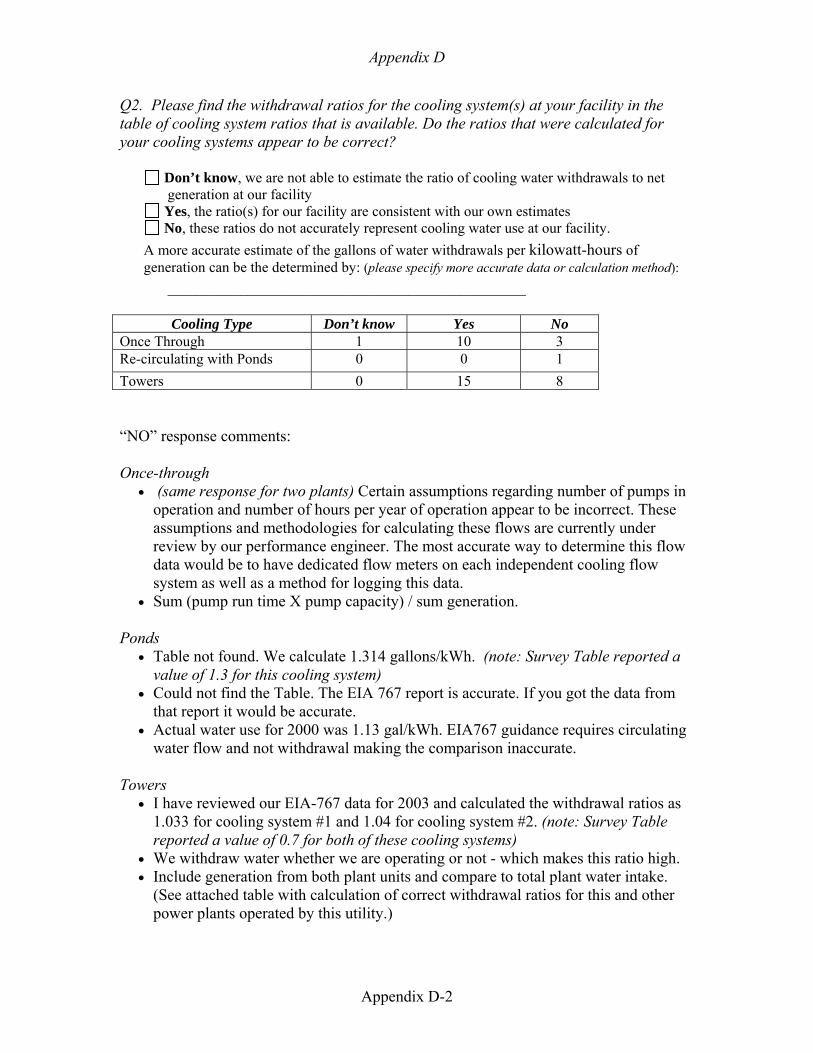
Appendix D
Appendix D-2
Q2. Please find the withdrawal ratios for the cooling system(s) at your facility in the table of cooling system ratios that is available. Do the ratios that were calculated for your cooling systems appear to be correct?
Don’t know, we are not able to estimate the ratio of cooling water withdrawals to net generation at our facility
Yes, the ratio(s) for our facility are consistent with our own estimates No, these ratios do not accurately represent cooling water use at our facility.
A more accurate estimate of the gallons of water withdrawals per kilowatt-hours of generation can be the determined by: (please specify more accurate data or calculation method):
_________________________________________________
Cooling Type Don’t know Yes No Once Through 1 10 3 Re-circulating with Ponds 0 0 1 Towers 0 15 8 “NO” response comments: Once-through
• (same response for two plants) Certain assumptions regarding number of pumps in operation and number of hours per year of operation appear to be incorrect. These assumptions and methodologies for calculating these flows are currently under review by our performance engineer. The most accurate way to determine this flow data would be to have dedicated flow meters on each independent cooling flow system as well as a method for logging this data.
• Sum (pump run time X pump capacity) / sum generation. Ponds
• Table not found. We calculate 1.314 gallons/kWh. (note: Survey Table reported a value of 1.3 for this cooling system)
• Could not find the Table. The EIA 767 report is accurate. If you got the data from that report it would be accurate.
• Actual water use for 2000 was 1.13 gal/kWh. EIA767 guidance requires circulating water flow and not withdrawal making the comparison inaccurate.
Towers
• I have reviewed our EIA-767 data for 2003 and calculated the withdrawal ratios as 1.033 for cooling system #1 and 1.04 for cooling system #2. (note: Survey Table reported a value of 0.7 for both of these cooling systems)
• We withdraw water whether we are operating or not - which makes this ratio high. • Include generation from both plant units and compare to total plant water intake.
(See attached table with calculation of correct withdrawal ratios for this and other power plants operated by this utility.)
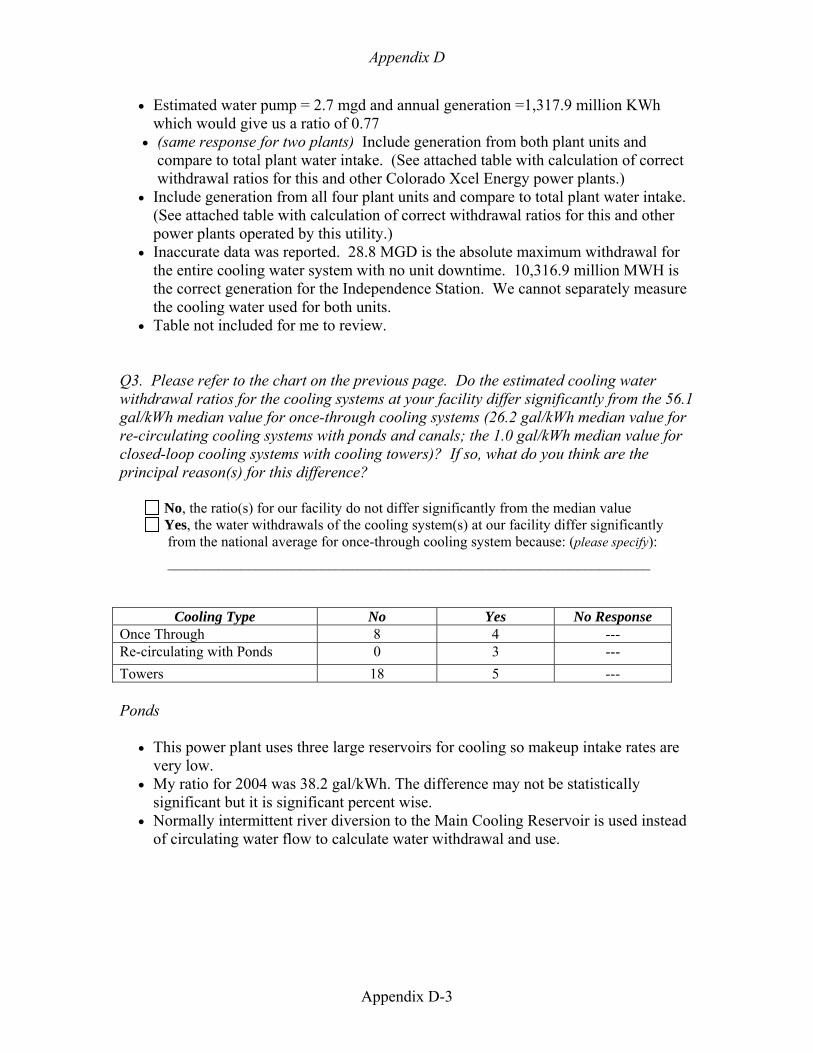
Appendix D
Appendix D-3
• Estimated water pump = 2.7 mgd and annual generation =1,317.9 million KWh which would give us a ratio of 0.77
• (same response for two plants) Include generation from both plant units and compare to total plant water intake. (See attached table with calculation of correct withdrawal ratios for this and other Colorado Xcel Energy power plants.)
• Include generation from all four plant units and compare to total plant water intake. (See attached table with calculation of correct withdrawal ratios for this and other power plants operated by this utility.)
• Inaccurate data was reported. 28.8 MGD is the absolute maximum withdrawal for the entire cooling water system with no unit downtime. 10,316.9 million MWH is the correct generation for the Independence Station. We cannot separately measure the cooling water used for both units.
• Table not included for me to review. Q3. Please refer to the chart on the previous page. Do the estimated cooling water withdrawal ratios for the cooling systems at your facility differ significantly from the 56.1 gal/kWh median value for once-through cooling systems (26.2 gal/kWh median value for re-circulating cooling systems with ponds and canals; the 1.0 gal/kWh median value for closed-loop cooling systems with cooling towers)? If so, what do you think are the principal reason(s) for this difference?
No, the ratio(s) for our facility do not differ significantly from the median value Yes, the water withdrawals of the cooling system(s) at our facility differ significantly from the national average for once-through cooling system because: (please specify): __________________________________________________________________
Cooling Type No Yes No Response Once Through 8 4 --- Re-circulating with Ponds 0 3 --- Towers 18 5 --- Ponds
• This power plant uses three large reservoirs for cooling so makeup intake rates are very low.
• My ratio for 2004 was 38.2 gal/kWh. The difference may not be statistically significant but it is significant percent wise.
• Normally intermittent river diversion to the Main Cooling Reservoir is used instead of circulating water flow to calculate water withdrawal and use.
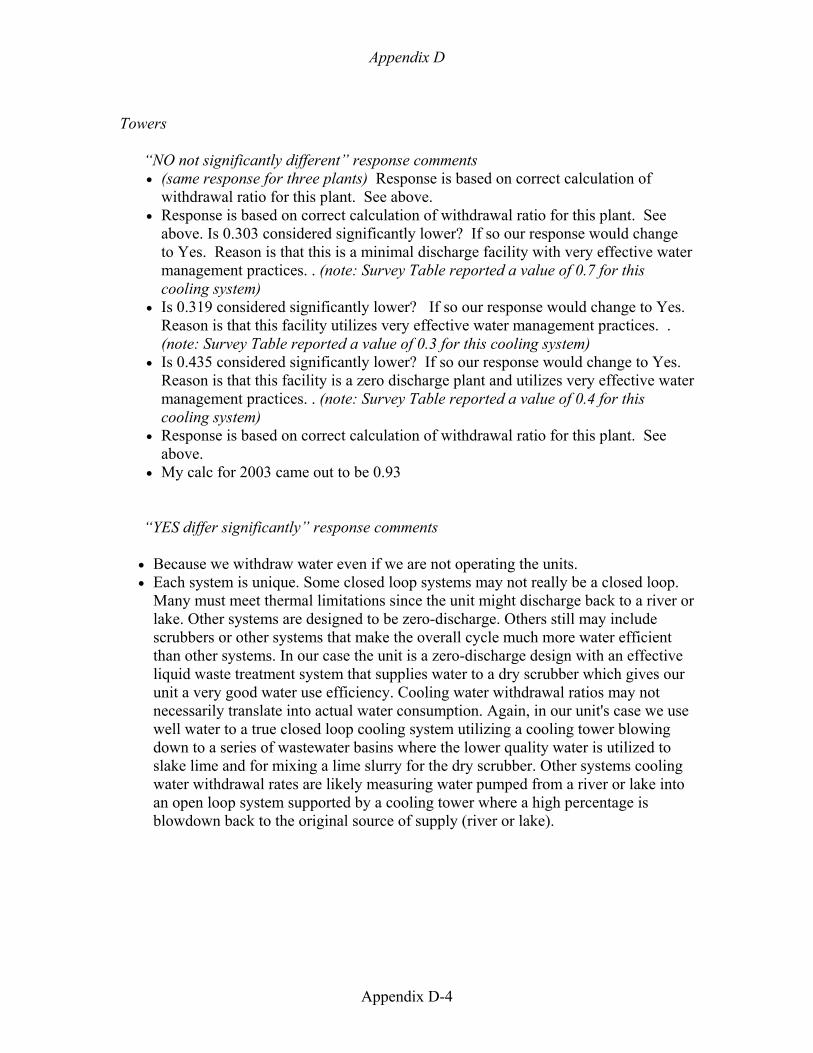
Appendix D
Appendix D-4
Towers
“NO not significantly different” response comments • (same response for three plants) Response is based on correct calculation of
withdrawal ratio for this plant. See above. • Response is based on correct calculation of withdrawal ratio for this plant. See
above. Is 0.303 considered significantly lower? If so our response would change to Yes. Reason is that this is a minimal discharge facility with very effective water management practices. . (note: Survey Table reported a value of 0.7 for this cooling system)
• Is 0.319 considered significantly lower? If so our response would change to Yes. Reason is that this facility utilizes very effective water management practices. . (note: Survey Table reported a value of 0.3 for this cooling system)
• Is 0.435 considered significantly lower? If so our response would change to Yes. Reason is that this facility is a zero discharge plant and utilizes very effective water management practices. . (note: Survey Table reported a value of 0.4 for this cooling system)
• Response is based on correct calculation of withdrawal ratio for this plant. See above.
• My calc for 2003 came out to be 0.93
“YES differ significantly” response comments • Because we withdraw water even if we are not operating the units. • Each system is unique. Some closed loop systems may not really be a closed loop.
Many must meet thermal limitations since the unit might discharge back to a river or lake. Other systems are designed to be zero-discharge. Others still may include scrubbers or other systems that make the overall cycle much more water efficient than other systems. In our case the unit is a zero-discharge design with an effective liquid waste treatment system that supplies water to a dry scrubber which gives our unit a very good water use efficiency. Cooling water withdrawal ratios may not necessarily translate into actual water consumption. Again, in our unit's case we use well water to a true closed loop cooling system utilizing a cooling tower blowing down to a series of wastewater basins where the lower quality water is utilized to slake lime and for mixing a lime slurry for the dry scrubber. Other systems cooling water withdrawal rates are likely measuring water pumped from a river or lake into an open loop system supported by a cooling tower where a high percentage is blowdown back to the original source of supply (river or lake).
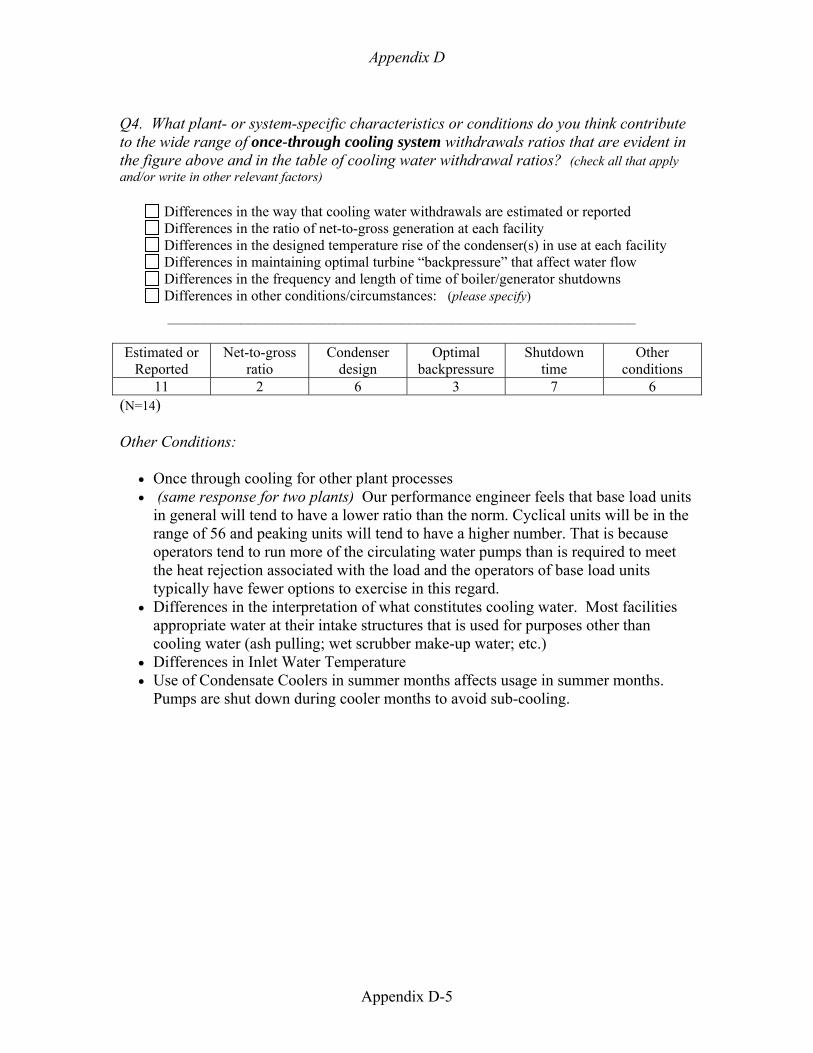
Appendix D
Appendix D-5
Q4. What plant- or system-specific characteristics or conditions do you think contribute to the wide range of once-through cooling system withdrawals ratios that are evident in the figure above and in the table of cooling water withdrawal ratios? (check all that apply and/or write in other relevant factors)
Differences in the way that cooling water withdrawals are estimated or reported Differences in the ratio of net-to-gross generation at each facility Differences in the designed temperature rise of the condenser(s) in use at each facility Differences in maintaining optimal turbine “backpressure” that affect water flow Differences in the frequency and length of time of boiler/generator shutdowns Differences in other conditions/circumstances: (please specify) ________________________________________________________________
Estimated or
Reported Net-to-gross
ratio Condenser
design Optimal
backpressure Shutdown
time Other
conditions 11 2 6 3 7 6
(N=14) Other Conditions:
• Once through cooling for other plant processes • (same response for two plants) Our performance engineer feels that base load units
in general will tend to have a lower ratio than the norm. Cyclical units will be in the range of 56 and peaking units will tend to have a higher number. That is because operators tend to run more of the circulating water pumps than is required to meet the heat rejection associated with the load and the operators of base load units typically have fewer options to exercise in this regard.
• Differences in the interpretation of what constitutes cooling water. Most facilities appropriate water at their intake structures that is used for purposes other than cooling water (ash pulling; wet scrubber make-up water; etc.)
• Differences in Inlet Water Temperature • Use of Condensate Coolers in summer months affects usage in summer months.
Pumps are shut down during cooler months to avoid sub-cooling.
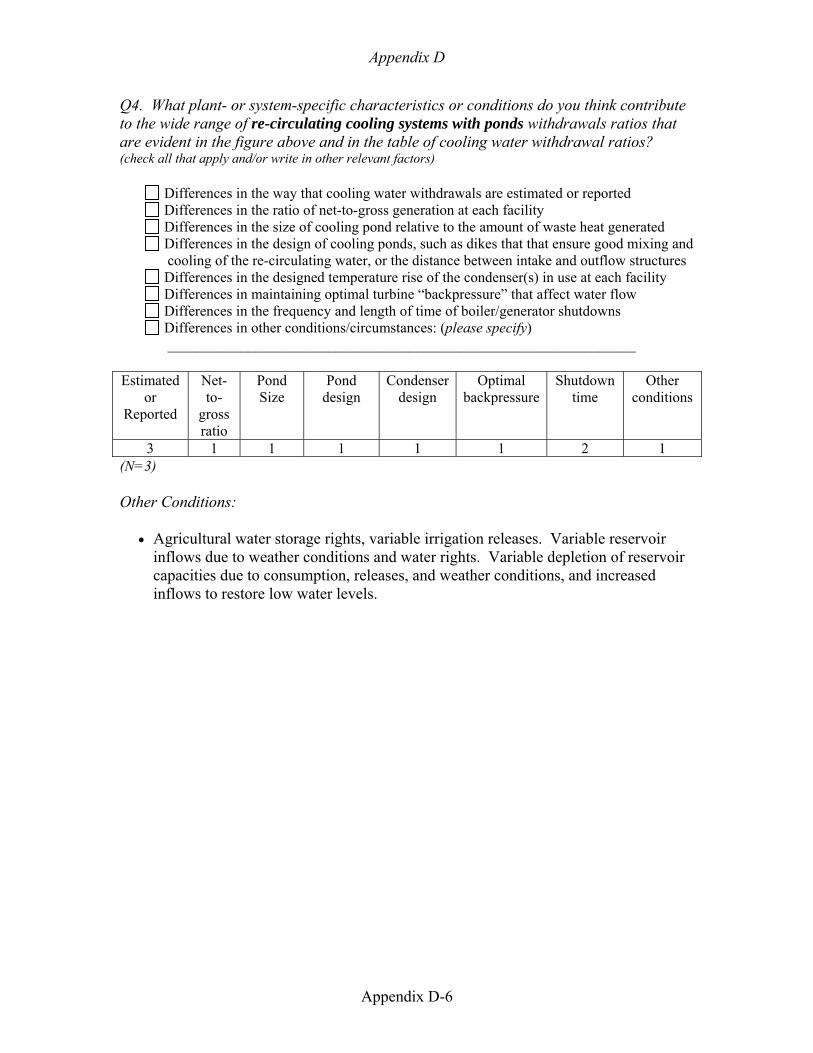
Appendix D
Appendix D-6
Q4. What plant- or system-specific characteristics or conditions do you think contribute to the wide range of re-circulating cooling systems with ponds withdrawals ratios that are evident in the figure above and in the table of cooling water withdrawal ratios? (check all that apply and/or write in other relevant factors)
Differences in the way that cooling water withdrawals are estimated or reported Differences in the ratio of net-to-gross generation at each facility Differences in the size of cooling pond relative to the amount of waste heat generated Differences in the design of cooling ponds, such as dikes that that ensure good mixing and cooling of the re-circulating water, or the distance between intake and outflow structures
Differences in the designed temperature rise of the condenser(s) in use at each facility Differences in maintaining optimal turbine “backpressure” that affect water flow Differences in the frequency and length of time of boiler/generator shutdowns Differences in other conditions/circumstances: (please specify) ________________________________________________________________
Estimated
or Reported
Net-to-
gross ratio
Pond Size
Pond design
Condenser design
Optimal backpressure
Shutdown time
Other conditions
3 1 1 1 1 1 2 1 (N=3) Other Conditions:
• Agricultural water storage rights, variable irrigation releases. Variable reservoir inflows due to weather conditions and water rights. Variable depletion of reservoir capacities due to consumption, releases, and weather conditions, and increased inflows to restore low water levels.
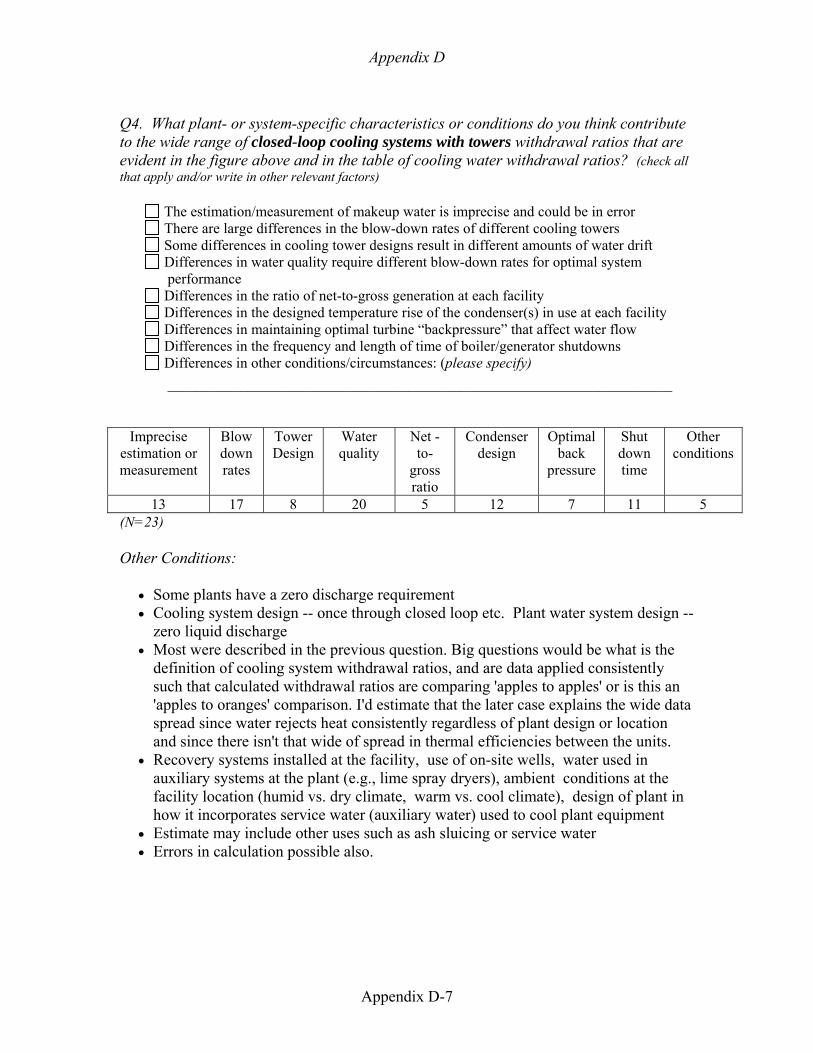
Appendix D
Appendix D-7
Q4. What plant- or system-specific characteristics or conditions do you think contribute to the wide range of closed-loop cooling systems with towers withdrawal ratios that are evident in the figure above and in the table of cooling water withdrawal ratios? (check all that apply and/or write in other relevant factors)
The estimation/measurement of makeup water is imprecise and could be in error There are large differences in the blow-down rates of different cooling towers Some differences in cooling tower designs result in different amounts of water drift Differences in water quality require different blow-down rates for optimal system performance
Differences in the ratio of net-to-gross generation at each facility Differences in the designed temperature rise of the condenser(s) in use at each facility Differences in maintaining optimal turbine “backpressure” that affect water flow Differences in the frequency and length of time of boiler/generator shutdowns Differences in other conditions/circumstances: (please specify) _____________________________________________________________________
Imprecise
estimation or measurement
Blow down rates
Tower Design
Water quality
Net -to-
gross ratio
Condenser design
Optimal back
pressure
Shut down time
Other conditions
13 17 8 20 5 12 7 11 5 (N=23) Other Conditions:
• Some plants have a zero discharge requirement • Cooling system design -- once through closed loop etc. Plant water system design --
zero liquid discharge • Most were described in the previous question. Big questions would be what is the
definition of cooling system withdrawal ratios, and are data applied consistently such that calculated withdrawal ratios are comparing 'apples to apples' or is this an 'apples to oranges' comparison. I'd estimate that the later case explains the wide data spread since water rejects heat consistently regardless of plant design or location and since there isn't that wide of spread in thermal efficiencies between the units.
• Recovery systems installed at the facility, use of on-site wells, water used in auxiliary systems at the plant (e.g., lime spray dryers), ambient conditions at the facility location (humid vs. dry climate, warm vs. cool climate), design of plant in how it incorporates service water (auxiliary water) used to cool plant equipment
• Estimate may include other uses such as ash sluicing or service water • Errors in calculation possible also.
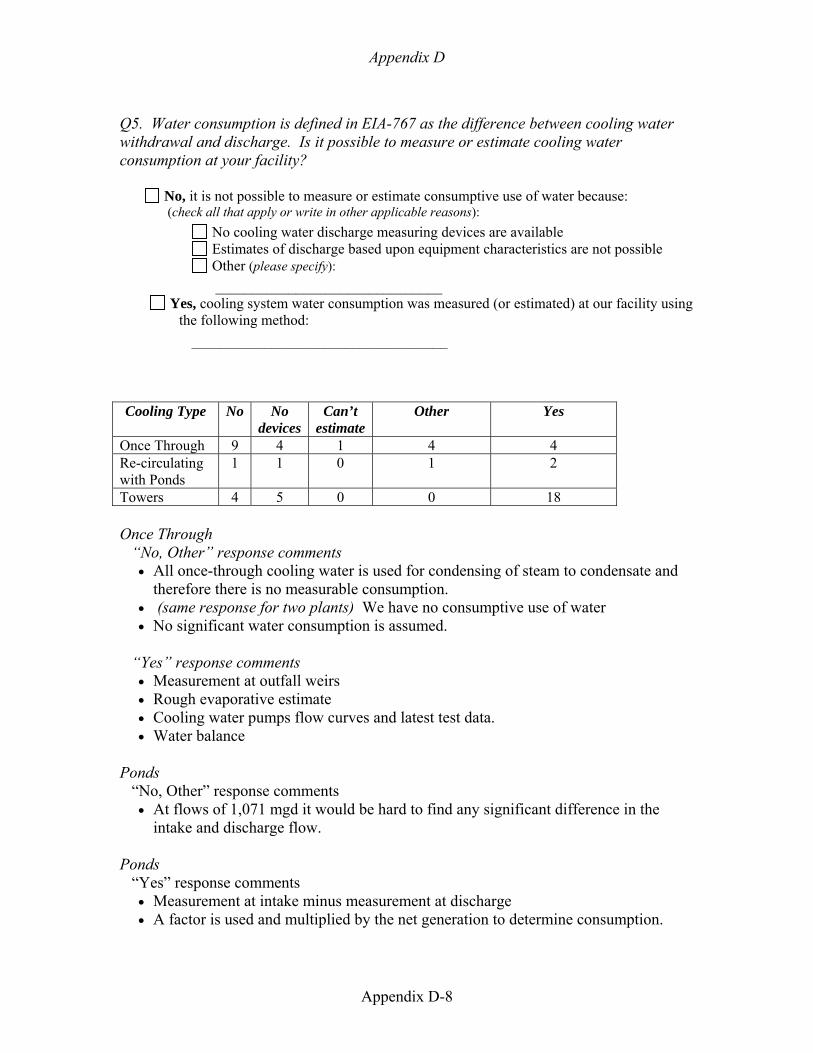
Appendix D
Appendix D-8
Q5. Water consumption is defined in EIA-767 as the difference between cooling water withdrawal and discharge. Is it possible to measure or estimate cooling water consumption at your facility?
No, it is not possible to measure or estimate consumptive use of water because: (check all that apply or write in other applicable reasons):
No cooling water discharge measuring devices are available Estimates of discharge based upon equipment characteristics are not possible Other (please specify): _______________________________
Yes, cooling system water consumption was measured (or estimated) at our facility using the following method:
___________________________________
Cooling Type No No
devices Can’t
estimateOther Yes
Once Through 9 4 1 4 4 Re-circulating with Ponds
1 1 0 1 2
Towers 4 5 0 0 18 Once Through
“No, Other” response comments • All once-through cooling water is used for condensing of steam to condensate and
therefore there is no measurable consumption. • (same response for two plants) We have no consumptive use of water • No significant water consumption is assumed.
“Yes” response comments • Measurement at outfall weirs • Rough evaporative estimate • Cooling water pumps flow curves and latest test data. • Water balance
Ponds
“No, Other” response comments • At flows of 1,071 mgd it would be hard to find any significant difference in the
intake and discharge flow. Ponds
“Yes” response comments • Measurement at intake minus measurement at discharge • A factor is used and multiplied by the net generation to determine consumption.
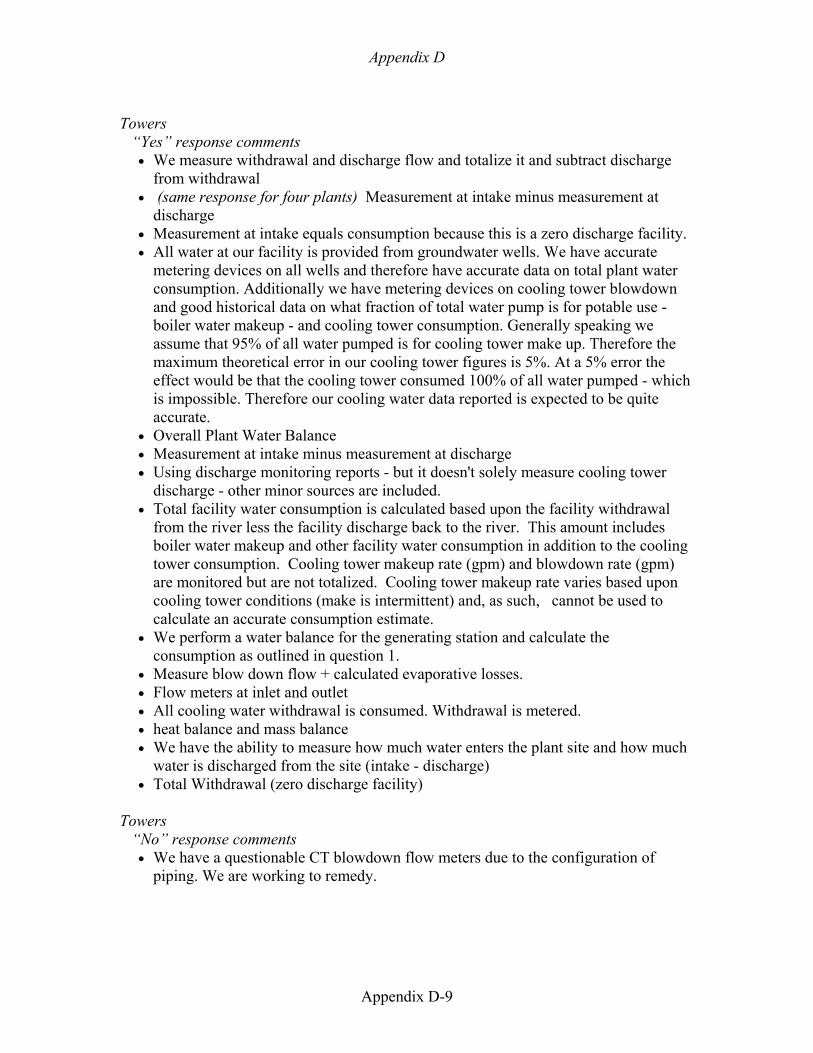
Appendix D
Appendix D-9
Towers
“Yes” response comments • We measure withdrawal and discharge flow and totalize it and subtract discharge
from withdrawal • (same response for four plants) Measurement at intake minus measurement at
discharge • Measurement at intake equals consumption because this is a zero discharge facility. • All water at our facility is provided from groundwater wells. We have accurate
metering devices on all wells and therefore have accurate data on total plant water consumption. Additionally we have metering devices on cooling tower blowdown and good historical data on what fraction of total water pump is for potable use - boiler water makeup - and cooling tower consumption. Generally speaking we assume that 95% of all water pumped is for cooling tower make up. Therefore the maximum theoretical error in our cooling tower figures is 5%. At a 5% error the effect would be that the cooling tower consumed 100% of all water pumped - which is impossible. Therefore our cooling water data reported is expected to be quite accurate.
• Overall Plant Water Balance • Measurement at intake minus measurement at discharge • Using discharge monitoring reports - but it doesn't solely measure cooling tower
discharge - other minor sources are included. • Total facility water consumption is calculated based upon the facility withdrawal
from the river less the facility discharge back to the river. This amount includes boiler water makeup and other facility water consumption in addition to the cooling tower consumption. Cooling tower makeup rate (gpm) and blowdown rate (gpm) are monitored but are not totalized. Cooling tower makeup rate varies based upon cooling tower conditions (make is intermittent) and, as such, cannot be used to calculate an accurate consumption estimate.
• We perform a water balance for the generating station and calculate the consumption as outlined in question 1.
• Measure blow down flow + calculated evaporative losses. • Flow meters at inlet and outlet • All cooling water withdrawal is consumed. Withdrawal is metered. • heat balance and mass balance • We have the ability to measure how much water enters the plant site and how much
water is discharged from the site (intake - discharge) • Total Withdrawal (zero discharge facility)
Towers
“No” response comments • We have a questionable CT blowdown flow meters due to the configuration of
piping. We are working to remedy.
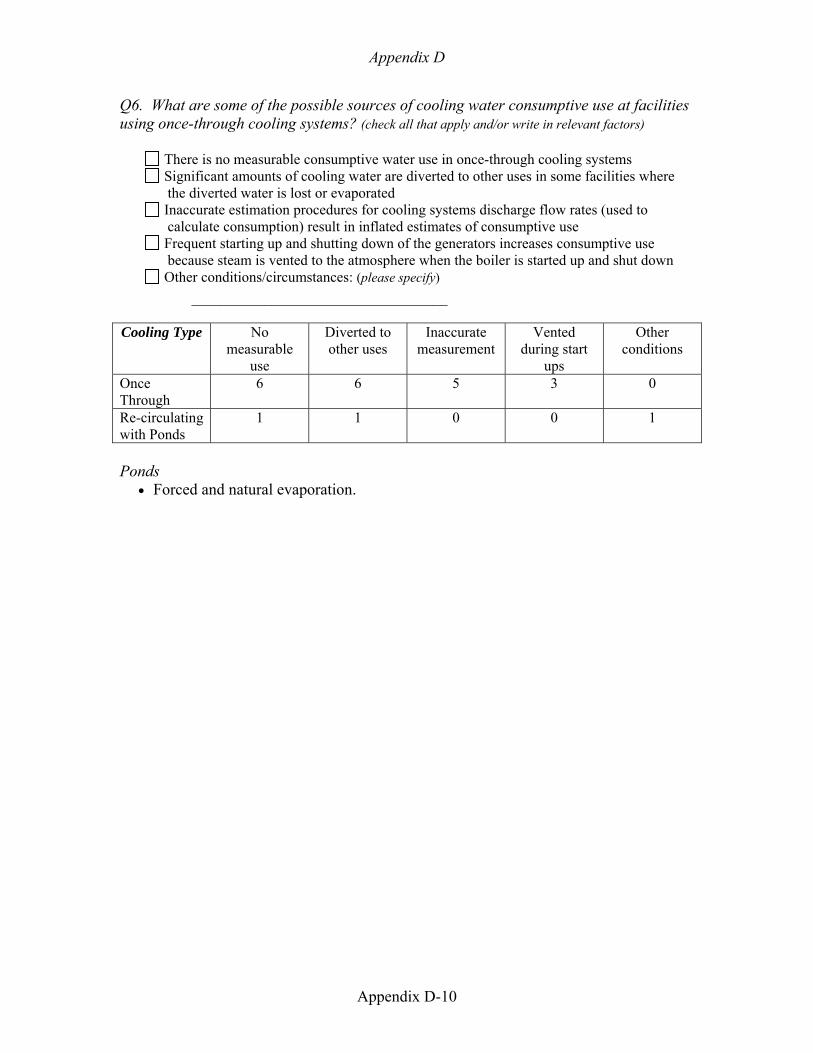
Appendix D
Appendix D-10
Q6. What are some of the possible sources of cooling water consumptive use at facilities using once-through cooling systems? (check all that apply and/or write in relevant factors)
There is no measurable consumptive water use in once-through cooling systems Significant amounts of cooling water are diverted to other uses in some facilities where the diverted water is lost or evaporated
Inaccurate estimation procedures for cooling systems discharge flow rates (used to calculate consumption) result in inflated estimates of consumptive use
Frequent starting up and shutting down of the generators increases consumptive use because steam is vented to the atmosphere when the boiler is started up and shut down
Other conditions/circumstances: (please specify) ___________________________________
Cooling Type No
measurable use
Diverted to other uses
Inaccurate measurement
Vented during start
ups
Other conditions
Once Through
6 6 5 3 0
Re-circulating with Ponds
1 1 0 0 1
Ponds
• Forced and natural evaporation.
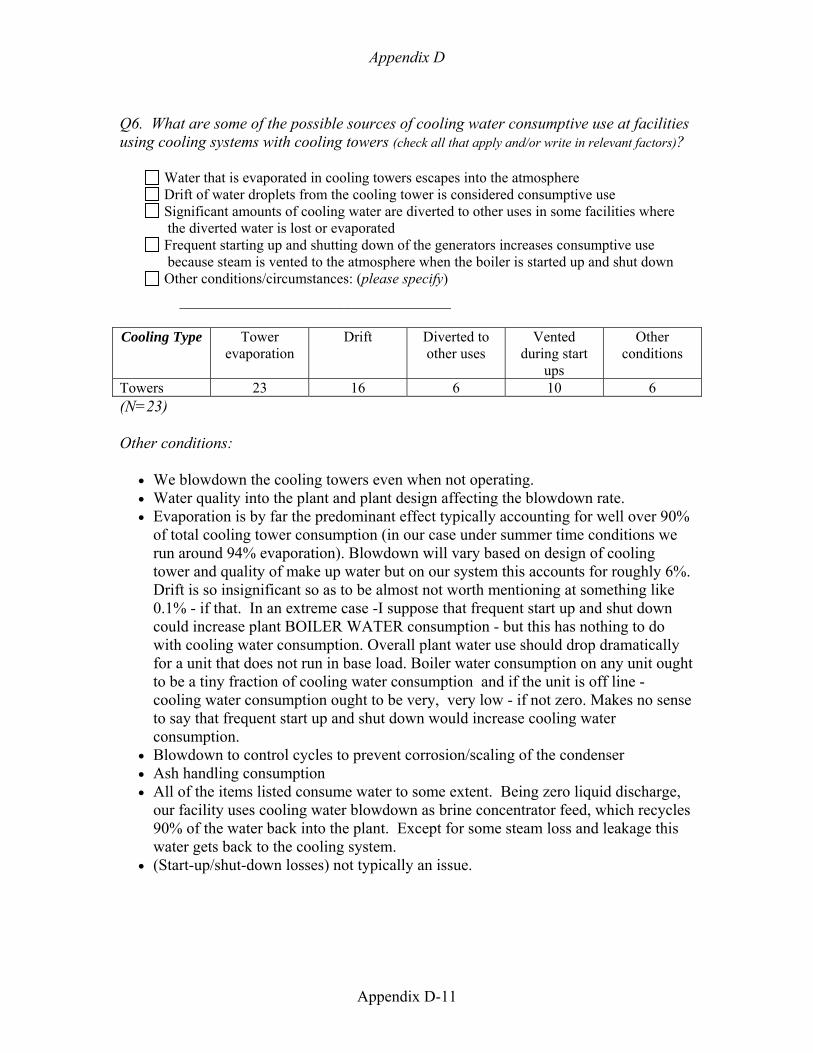
Appendix D
Appendix D-11
Q6. What are some of the possible sources of cooling water consumptive use at facilities using cooling systems with cooling towers (check all that apply and/or write in relevant factors)?
Water that is evaporated in cooling towers escapes into the atmosphere Drift of water droplets from the cooling tower is considered consumptive use Significant amounts of cooling water are diverted to other uses in some facilities where the diverted water is lost or evaporated
Frequent starting up and shutting down of the generators increases consumptive use because steam is vented to the atmosphere when the boiler is started up and shut down
Other conditions/circumstances: (please specify) __________________________________
Cooling Type Tower
evaporation Drift Diverted to
other uses Vented
during start ups
Other conditions
Towers 23 16 6 10 6 (N=23) Other conditions:
• We blowdown the cooling towers even when not operating. • Water quality into the plant and plant design affecting the blowdown rate. • Evaporation is by far the predominant effect typically accounting for well over 90%
of total cooling tower consumption (in our case under summer time conditions we run around 94% evaporation). Blowdown will vary based on design of cooling tower and quality of make up water but on our system this accounts for roughly 6%. Drift is so insignificant so as to be almost not worth mentioning at something like 0.1% - if that. In an extreme case -I suppose that frequent start up and shut down could increase plant BOILER WATER consumption - but this has nothing to do with cooling water consumption. Overall plant water use should drop dramatically for a unit that does not run in base load. Boiler water consumption on any unit ought to be a tiny fraction of cooling water consumption and if the unit is off line - cooling water consumption ought to be very, very low - if not zero. Makes no sense to say that frequent start up and shut down would increase cooling water consumption.
• Blowdown to control cycles to prevent corrosion/scaling of the condenser • Ash handling consumption • All of the items listed consume water to some extent. Being zero liquid discharge,
our facility uses cooling water blowdown as brine concentrator feed, which recycles 90% of the water back into the plant. Except for some steam loss and leakage this water gets back to the cooling system.
• (Start-up/shut-down losses) not typically an issue.
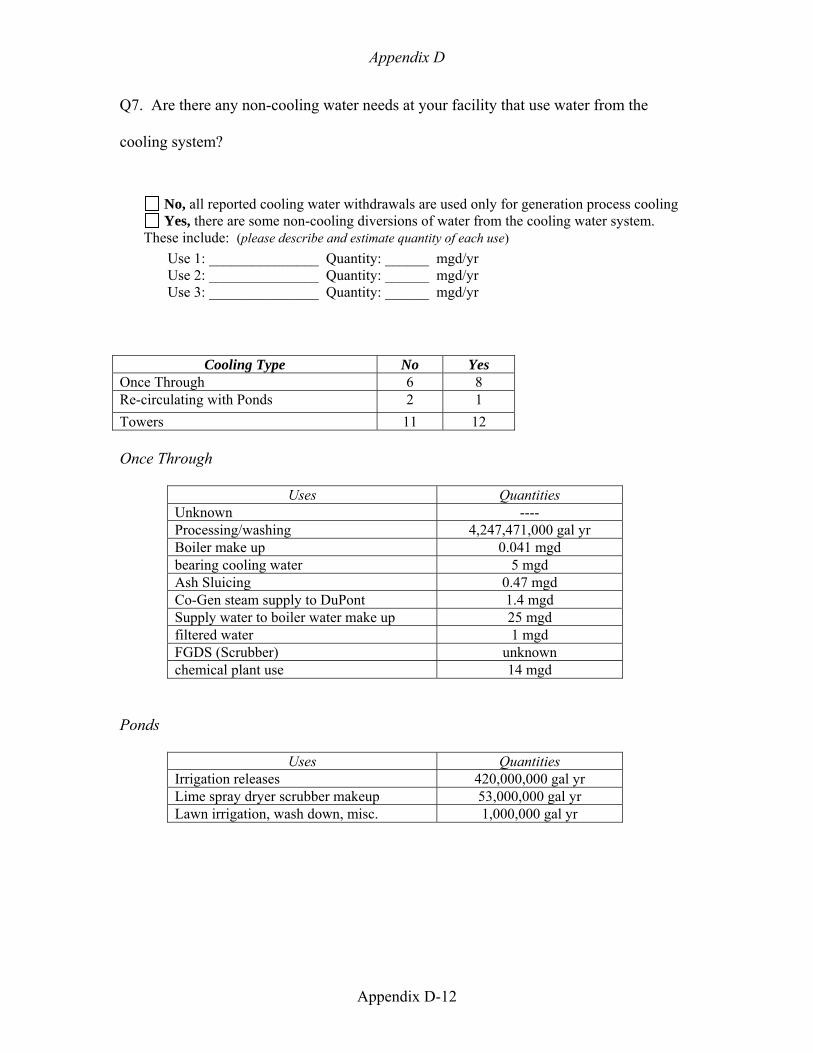
Appendix D
Appendix D-12
Q7. Are there any non-cooling water needs at your facility that use water from the
cooling system?
No, all reported cooling water withdrawals are used only for generation process cooling Yes, there are some non-cooling diversions of water from the cooling water system.
These include: (please describe and estimate quantity of each use) Use 1: _______________ Quantity: ______ mgd/yr Use 2: _______________ Quantity: ______ mgd/yr Use 3: _______________ Quantity: ______ mgd/yr
Cooling Type No Yes Once Through 6 8 Re-circulating with Ponds 2 1 Towers 11 12 Once Through
Uses Quantities Unknown ---- Processing/washing 4,247,471,000 gal yr Boiler make up 0.041 mgd bearing cooling water 5 mgd Ash Sluicing 0.47 mgd Co-Gen steam supply to DuPont 1.4 mgd Supply water to boiler water make up 25 mgd filtered water 1 mgd FGDS (Scrubber) unknown chemical plant use 14 mgd
Ponds
Uses Quantities Irrigation releases 420,000,000 gal yr Lime spray dryer scrubber makeup 53,000,000 gal yr Lawn irrigation, wash down, misc. 1,000,000 gal yr
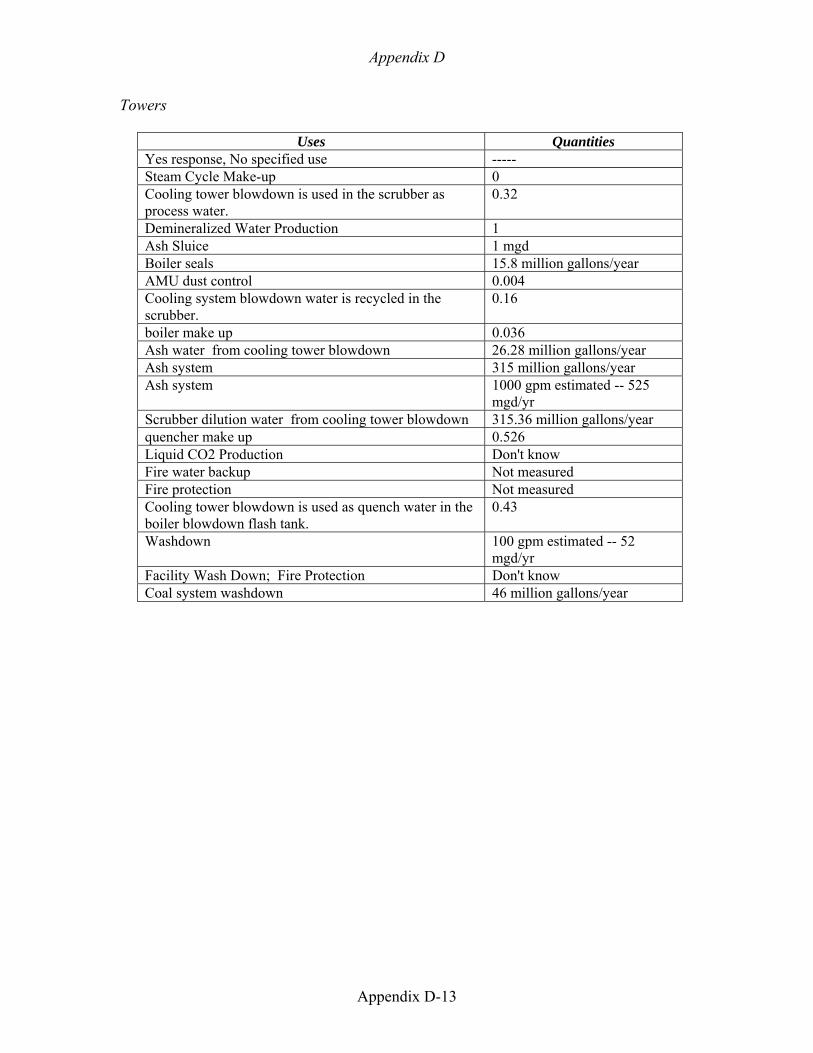
Appendix D
Appendix D-13
Towers
Uses Quantities Yes response, No specified use ----- Steam Cycle Make-up 0 Cooling tower blowdown is used in the scrubber as process water.
0.32
Demineralized Water Production 1 Ash Sluice 1 mgd Boiler seals 15.8 million gallons/year AMU dust control 0.004 Cooling system blowdown water is recycled in the scrubber.
0.16
boiler make up 0.036 Ash water from cooling tower blowdown 26.28 million gallons/year Ash system 315 million gallons/year Ash system 1000 gpm estimated -- 525
mgd/yr Scrubber dilution water from cooling tower blowdown 315.36 million gallons/year quencher make up 0.526 Liquid CO2 Production Don't know Fire water backup Not measured Fire protection Not measured Cooling tower blowdown is used as quench water in the boiler blowdown flash tank.
0.43
Washdown 100 gpm estimated -- 52 mgd/yr
Facility Wash Down; Fire Protection Don't know Coal system washdown 46 million gallons/year
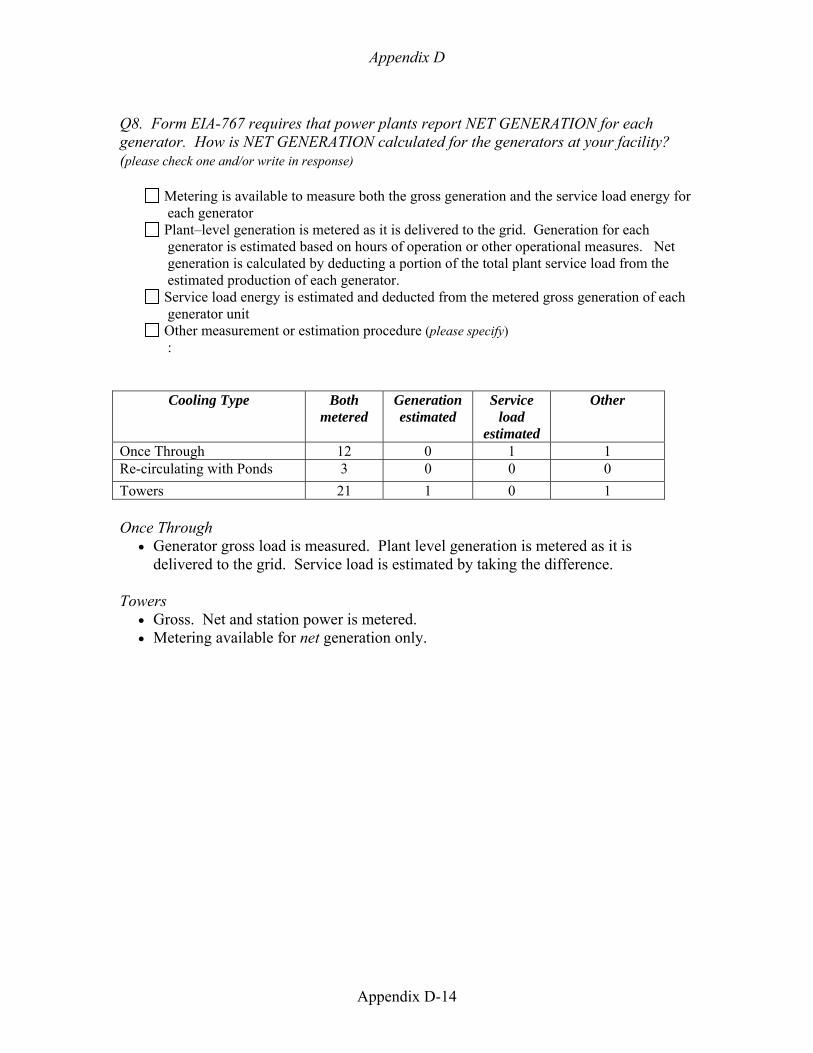
Appendix D
Appendix D-14
Q8. Form EIA-767 requires that power plants report NET GENERATION for each generator. How is NET GENERATION calculated for the generators at your facility? (please check one and/or write in response)
Metering is available to measure both the gross generation and the service load energy for each generator
Plant–level generation is metered as it is delivered to the grid. Generation for each generator is estimated based on hours of operation or other operational measures. Net generation is calculated by deducting a portion of the total plant service load from the estimated production of each generator.
Service load energy is estimated and deducted from the metered gross generation of each generator unit
Other measurement or estimation procedure (please specify) :
Cooling Type Both metered
Generation estimated
Service load
estimated
Other
Once Through 12 0 1 1 Re-circulating with Ponds 3 0 0 0 Towers 21 1 0 1 Once Through
• Generator gross load is measured. Plant level generation is metered as it is delivered to the grid. Service load is estimated by taking the difference.
Towers
• Gross. Net and station power is metered. • Metering available for net generation only.
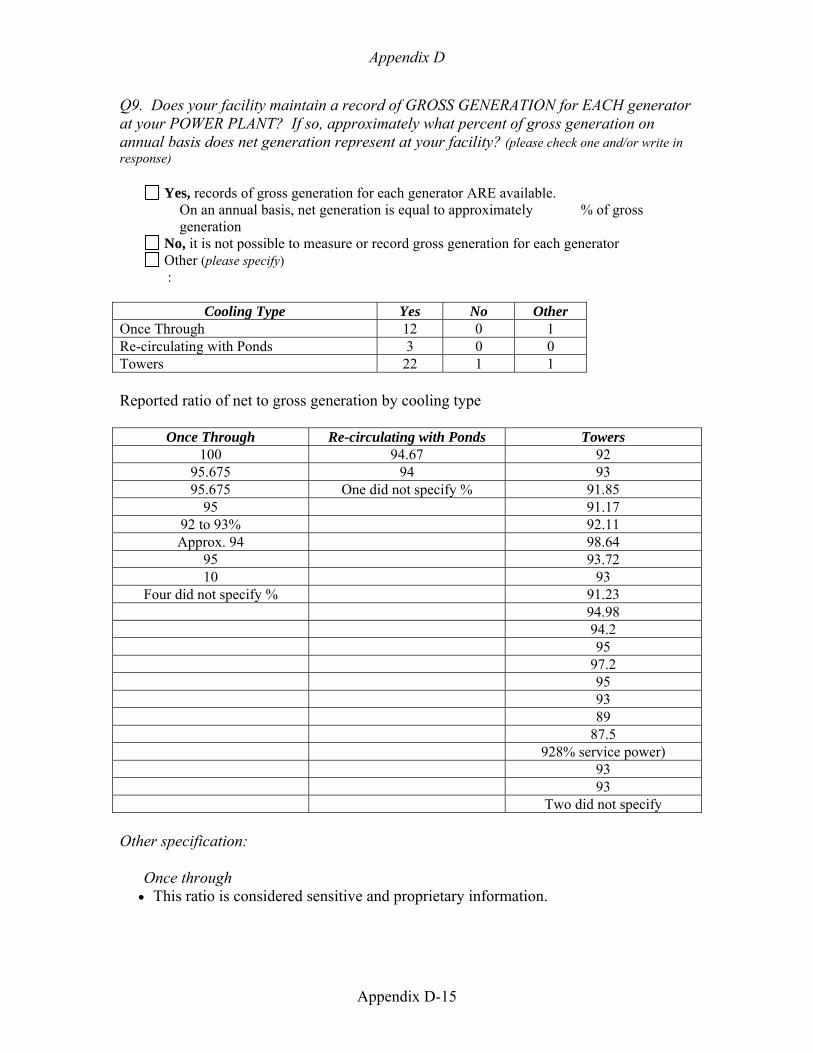
Appendix D
Appendix D-15
Q9. Does your facility maintain a record of GROSS GENERATION for EACH generator at your POWER PLANT? If so, approximately what percent of gross generation on annual basis does net generation represent at your facility? (please check one and/or write in response)
Yes, records of gross generation for each generator ARE available. On an annual basis, net generation is equal to approximately % of gross generation
No, it is not possible to measure or record gross generation for each generator Other (please specify) :
Cooling Type Yes No Other
Once Through 12 0 1 Re-circulating with Ponds 3 0 0 Towers 22 1 1 Reported ratio of net to gross generation by cooling type
Once Through Re-circulating with Ponds Towers 100 94.67 92
95.675 94 93 95.675 One did not specify % 91.85
95 91.17 92 to 93% 92.11 Approx. 94 98.64
95 93.72 10 93
Four did not specify % 91.23 94.98 94.2 95 97.2 95 93 89 87.5 928% service power) 93 93 Two did not specify Other specification:
Once through • This ratio is considered sensitive and proprietary information.
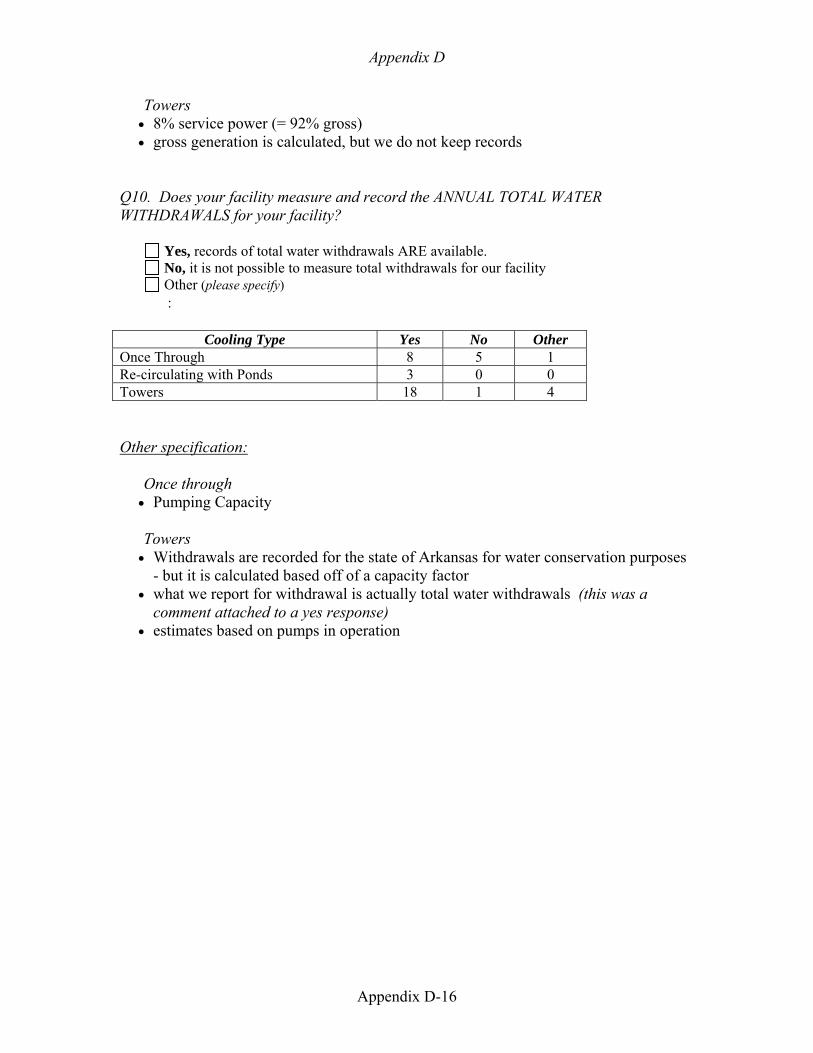
Appendix D
Appendix D-16
Towers • 8% service power (= 92% gross) • gross generation is calculated, but we do not keep records
Q10. Does your facility measure and record the ANNUAL TOTAL WATER WITHDRAWALS for your facility?
Yes, records of total water withdrawals ARE available. No, it is not possible to measure total withdrawals for our facility Other (please specify) :
Cooling Type Yes No Other
Once Through 8 5 1 Re-circulating with Ponds 3 0 0 Towers 18 1 4 Other specification:
Once through • Pumping Capacity
Towers • Withdrawals are recorded for the state of Arkansas for water conservation purposes
- but it is calculated based off of a capacity factor • what we report for withdrawal is actually total water withdrawals (this was a
comment attached to a yes response) • estimates based on pumps in operation
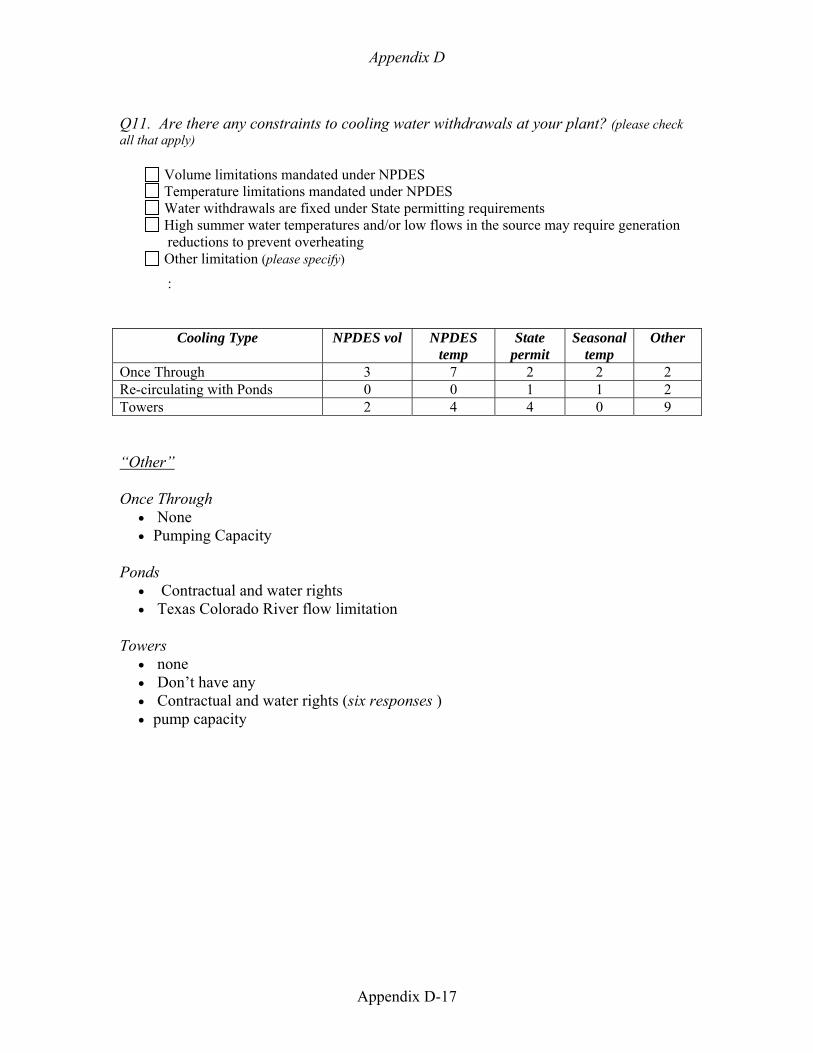
Appendix D
Appendix D-17
Q11. Are there any constraints to cooling water withdrawals at your plant? (please check all that apply)
Volume limitations mandated under NPDES Temperature limitations mandated under NPDES Water withdrawals are fixed under State permitting requirements High summer water temperatures and/or low flows in the source may require generation reductions to prevent overheating
Other limitation (please specify)
:
Cooling Type NPDES vol NPDES temp
State permit
Seasonal temp
Other
Once Through 3 7 2 2 2 Re-circulating with Ponds 0 0 1 1 2 Towers 2 4 4 0 9 “Other” Once Through
• None • Pumping Capacity
Ponds
• Contractual and water rights • Texas Colorado River flow limitation
Towers
• none • Don’t have any • Contractual and water rights (six responses ) • pump capacity
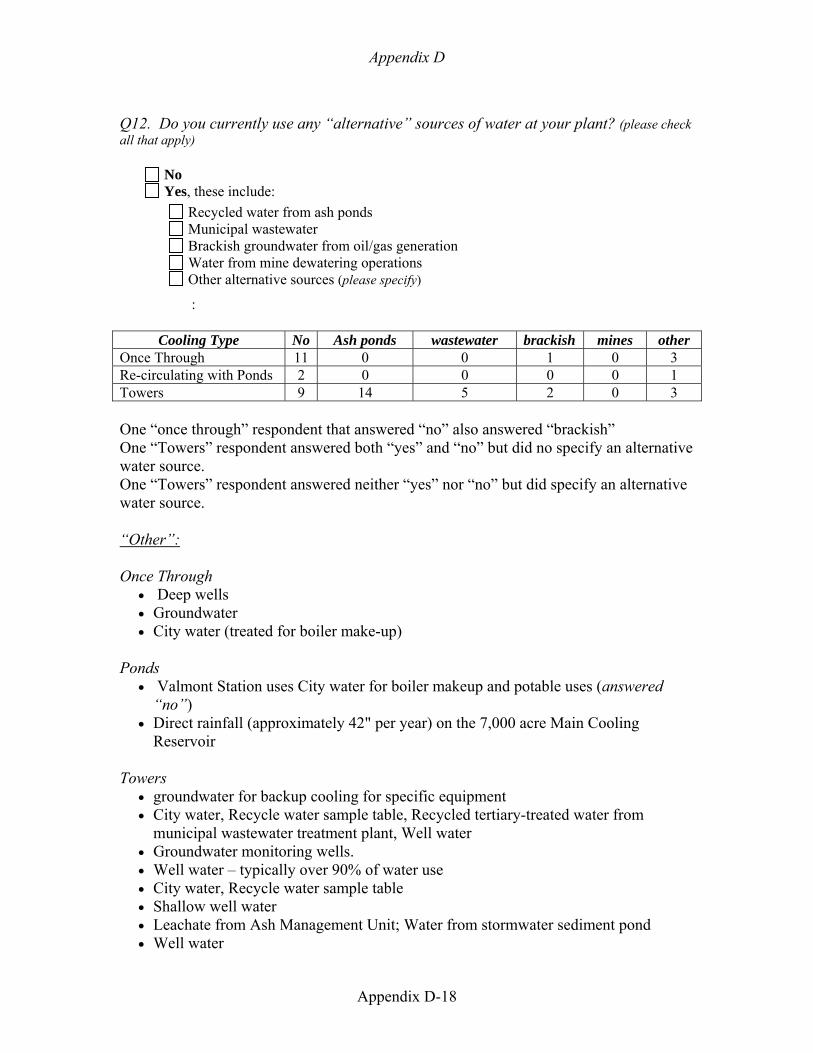
Appendix D
Appendix D-18
Q12. Do you currently use any “alternative” sources of water at your plant? (please check all that apply)
No Yes, these include:
Recycled water from ash ponds Municipal wastewater Brackish groundwater from oil/gas generation Water from mine dewatering operations Other alternative sources (please specify)
:
Cooling Type No Ash ponds wastewater brackish mines other Once Through 11 0 0 1 0 3 Re-circulating with Ponds 2 0 0 0 0 1 Towers 9 14 5 2 0 3 One “once through” respondent that answered “no” also answered “brackish” One “Towers” respondent answered both “yes” and “no” but did no specify an alternative water source. One “Towers” respondent answered neither “yes” nor “no” but did specify an alternative water source. “Other”: Once Through
• Deep wells • Groundwater • City water (treated for boiler make-up)
Ponds
• Valmont Station uses City water for boiler makeup and potable uses (answered “no”)
• Direct rainfall (approximately 42" per year) on the 7,000 acre Main Cooling Reservoir
Towers
• groundwater for backup cooling for specific equipment • City water, Recycle water sample table, Recycled tertiary-treated water from
municipal wastewater treatment plant, Well water • Groundwater monitoring wells. • Well water – typically over 90% of water use • City water, Recycle water sample table • Shallow well water • Leachate from Ash Management Unit; Water from stormwater sediment pond • Well water
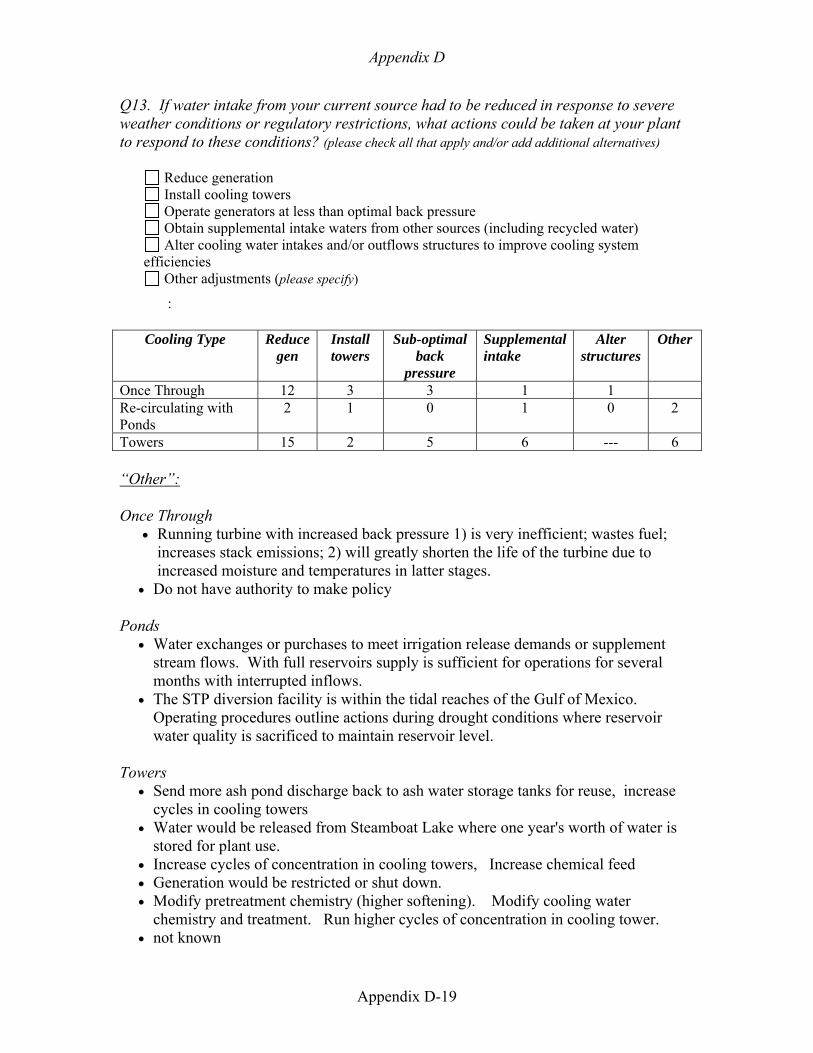
Appendix D
Appendix D-19
Q13. If water intake from your current source had to be reduced in response to severe weather conditions or regulatory restrictions, what actions could be taken at your plant to respond to these conditions? (please check all that apply and/or add additional alternatives)
Reduce generation Install cooling towers Operate generators at less than optimal back pressure Obtain supplemental intake waters from other sources (including recycled water) Alter cooling water intakes and/or outflows structures to improve cooling system
efficiencies Other adjustments (please specify)
:
Cooling Type Reduce gen
Install towers
Sub-optimal back
pressure
Supplemental intake
Alter structures
Other
Once Through 12 3 3 1 1 Re-circulating with Ponds
2 1 0 1 0 2
Towers 15 2 5 6 --- 6 “Other”: Once Through
• Running turbine with increased back pressure 1) is very inefficient; wastes fuel; increases stack emissions; 2) will greatly shorten the life of the turbine due to increased moisture and temperatures in latter stages.
• Do not have authority to make policy Ponds
• Water exchanges or purchases to meet irrigation release demands or supplement stream flows. With full reservoirs supply is sufficient for operations for several months with interrupted inflows.
• The STP diversion facility is within the tidal reaches of the Gulf of Mexico. Operating procedures outline actions during drought conditions where reservoir water quality is sacrificed to maintain reservoir level.
Towers
• Send more ash pond discharge back to ash water storage tanks for reuse, increase cycles in cooling towers
• Water would be released from Steamboat Lake where one year's worth of water is stored for plant use.
• Increase cycles of concentration in cooling towers, Increase chemical feed • Generation would be restricted or shut down. • Modify pretreatment chemistry (higher softening). Modify cooling water
chemistry and treatment. Run higher cycles of concentration in cooling tower. • not known
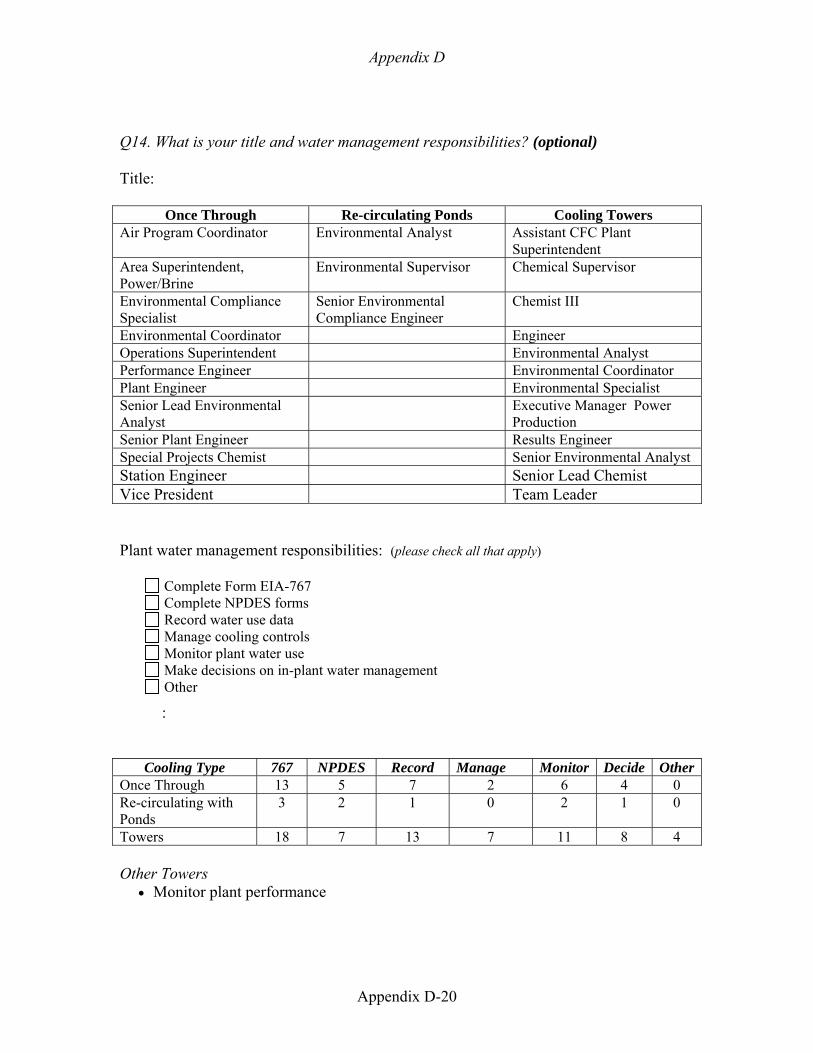
Appendix D
Appendix D-20
Q14. What is your title and water management responsibilities? (optional) Title:
Once Through Re-circulating Ponds Cooling Towers Air Program Coordinator Environmental Analyst Assistant CFC Plant
Superintendent Area Superintendent, Power/Brine
Environmental Supervisor Chemical Supervisor
Environmental Compliance Specialist
Senior Environmental Compliance Engineer
Chemist III
Environmental Coordinator Engineer Operations Superintendent Environmental Analyst Performance Engineer Environmental Coordinator Plant Engineer Environmental Specialist Senior Lead Environmental Analyst
Executive Manager Power Production
Senior Plant Engineer Results Engineer Special Projects Chemist Senior Environmental Analyst Station Engineer Senior Lead Chemist Vice President Team Leader Plant water management responsibilities: (please check all that apply)
Complete Form EIA-767 Complete NPDES forms Record water use data Manage cooling controls Monitor plant water use Make decisions on in-plant water management Other
:
Cooling Type 767 NPDES Record Manage Monitor Decide OtherOnce Through 13 5 7 2 6 4 0 Re-circulating with Ponds
3 2 1 0 2 1 0
Towers 18 7 13 7 11 8 4 Other Towers
• Monitor plant performance
Appendix D
Appendix D-21
Other Comments: Towers Comment #1 Additional non-cooling water needs at the facility (Q7) also include waste ash pub mills (not separately measured from cooling towers), lime spray dryers (dependent on unit size, removal rate, and system efficiency) and service water (not separated from circulating water cooling towers). Towers Comment #2 Independence is a two-unit facility. The cooling water is known for the entire plant but we can't quantify individual unit totals - so the annual generation for this facility should be 10,316.9 million MWH. Also - see comments in other questions for corrected numbers. The system was reported as EN on the survey but the attached table makes it appear that the numbers are for only one unit.
Appendix D
Appendix D-22
NON-SURVEY EMAIL RESPONSES Several plant managers and engineers responded to the survey request by telephoning the PI, or by emailing written comments that generally described water use and reporting at their facilities. No attempt was made to record the telephone feedback. Of the written email responses, only one is reproduced in this appendix. The text has been edited to retain the anonymity of the respondent. Rec’d via email 8/26/05 Mr. Dziegielewski, I am responsible for compliance and reporting of UTILITY NAME water use in accordance with our surface water withdrawal permits issued by the STATE AGENCY. Rather than responding individually to your questionnaire for each of our plants, I will respond in general and identify exceptions. I'll be happy to discuss any questions you may have regarding these responses. First, some background on the state of water use and regulation in STATE: Over the past 15 years, STATE awareness of water resources issues has increased dramatically - regulatorily, politically and publicly - as a result of a water war among CONTINGENT STATES, and two periods of extended severe drought. As the withdrawer of the largest amount of water in the state, UTILITY NAME has been closely following these issues and has examined our own impact, processes and tracking methods. Most of those involved have only recently begun to realize the difference between water withdrawals and water consumption. To illustrate the significance of this difference, UTILITY NAME withdrawals in 2003 averaged 2,614 MGD, but only 164 MGD was not immediately returned to the source. Beginning in 2003 at STATE AGENCY's request, we agreed to annually voluntarily report our consumptive use, in addition to the past requirements to report withdrawals. Since our NPDES permits do not require monitoring of discharge flow rates and we typically have no meters installed to do so, we have reached agreement with STATE AGENCY on consumptive use determination methodology (which may vary from plant to plant, depending on specific design configurations). Your list includes these UTILITY NAME plants: Once-through cooling: FIVE PLANT ID’s LISTED Closed-loop cooling: FIVE PLANT ID’s LISTED Nuclear closed-loop: TWO PLANT ID’s LISTED The following responses apply to all plants and categories unless otherwise noted:
Appendix D
Appendix D-23
1. Withdrawals are intake pump nameplate ratings multiplied by pump run time. This number represents withdrawal for all uses at the plants - not just cooling water.
2. The withdrawal and generation numbers are close enough to leave as is, but the ratios can be misleading. Once-thru Plants XXX and XXX are old, less efficient and rarely generate. They should probably be omitted from your survey since their cooling water flow will remain at full flow when the unit is on standby, or when flow is needed to prevent condenser biofouling. None of your numbers for the closed-loop plants, including nuclear, considered return flows (i.e., cooling tower blowdown), which reduce the unit water use 25 to 60 percent.
3. With the exceptions above, the ratios are in the ball park. 4. The wide range of numbers is likely dominated by reporting/tracking differences or, as
in #2, once-thru plants with constant pumping during variable or low generation periods.
5. STATE AGENCY agrees with the following consumption determination methods: Once-through plants' consumption is considered zero since the negligible water loss is much less than one percent of the cooling water flow, which itself is conservatively calculated. Consumptive use of closed-loop systems is conservatively calculated by multiplying plant capacity factor times the engineered maximum cooling tower evaporation potential.
6. All other consumptive use is negligible compared to the evaporation and drift from the cooling towers.
7. The reported withdrawals include all uses at the plant. We do not track those flows. 8. Not conversant in net generation calculations, but they are tracked very accurately. 9. Ditto for gross generation. 10. Daily withdrawals are reported each month to STATE AGENCY. Average monthly
and annual consumption is reported each year. 11. STATE withdrawal permits have limits for average monthly and maximum 24-hour
withdrawals. Some on smaller rivers have restrictions during low river flows. None have ever caused load cuts to comply with the withdrawal permit.
12. Three of our plants use less than 1 MGD of ground water for process water make-up. There are no other alternative sources, and none have alternative cooling water sources.
13. See #11. 14. See plant listing above. I track, report, analyze, and advise plant managers on water
use. They make the decisions and operate the plant. Again, feel free to call me for clarification.
RESPONDENT NAME TITLE CONTACT INFORMATION