Embed Size (px)
Citation preview
ORIGINAL ARTICLE
Water use at Luxor, Egypt: consumption analysis and future
demand forecasting
Ayman A. Ahmed • Graham E. Fogg •
Mohsen A. Gameh
Received: 14 September 2013 / Accepted: 13 December 2013
� Springer-Verlag Berlin Heidelberg 2013
Abstract Water resources in Egypt are becoming scarce
and the demand for clean drinking water supply is one of
the most important priorities of the Egyptian government in
recent years. Analyzing water use and future demand
forecasting is a primitive clue for water demand manage-
ment. Water in Luxor is used for agricultural, residential,
institutional, commercial, and touristic purposes. The
results of water use analysis indicated that for the time
period from 1983 to 2012, agriculture is the highest con-
sumer of water which reached about 94.76–97.38 % fol-
lowed by residential water consumption (1.90–3.05 %),
institutional water consumption (0.71–1.75 %), and tour-
istic water consumption (0.02–0.43 %), respectively. The
future demand forecasting results revealed that the present
situation may continue to rise in the next 50 years which
will increase the water demand with a water deficit ranging
between 15 and 114 MCM/year. To fill the gap between the
present water consumption and future residential, institu-
tional, commercial, and touristic water demand, additional
municipal facilities, and improvement and management of
water supply/demand are needed. To cope with the pre-
dicted future water demand, it is recommended to improve
the on-farm irrigation, reduce the demand for irrigation
water, rationalize the irrigation water use, and enhance the
integrated role of water users in integrated water resources
management.
Keywords Water consumption � Water demand
forecasting � Luxor � Egypt
Introduction
Water resources in Egypt are becoming scarce. Surface-water
resources originating from the Nile are now fully exploited,
while groundwater sources are being brought into full pro-
duction (Nassar and El-Korashey 2003; Aly 2007; Abdin and
Gaafar 2009; Abdin et al. 2011). According to the 1959
agreement with Sudan, Egypt is entitled to 55.5 BCM of the
water resource available with 18.5 BCM allocated to Sudan
and an amount of*10 BCM allocated for water losses from
the impounded area of the dam (Salman 2010). The Aswan
High Dam (AHD) was constructed *6 km south of Aswan
and commenced operation in 1968. The AHD is the major
flow-regulating structure on theRiverNile.Downstream from
the AHD, the Nile water is diverted from the main channel
into an intensive network of irrigation canals to provide water
for agricultural use (Abu-Zeid 1991; EEAA 2005).
The demand for clean drinking water supply is one of the
most important priorities of the Egyptian government in the
recent years. Since construction of the High Dam, growing
population, economic growth and agricultural expansion
lead to extensive water consumption and increasing water
demand. Moreover, climate change and degradation of
groundwater quality imposed more challenges on future
water demand (El Tahlawi et al. 2008; Ahmed 2009, 2013;
El-Nahry and Doluschitz 2010; Ahmed and Ali 2011;
Elwaseif et al. 2012; McCarl et al. 2013).
A. A. Ahmed (&)
Geology Department, Faculty of Science, Sohag University,
Sohag, Egypt
e-mail: [email protected]
G. E. Fogg
Land, Air and Water Resources Department,
University of California, Davis, USA
M. A. Gameh
Soil and Water Science Department, Faculty of Agriculture,
Assiut University, Assiut, Egypt
123
Environ Earth Sci
DOI 10.1007/s12665-013-3021-8
Water in Luxor is used for agricultural, residential,
institutional, commercial, and touristic purposes. Manage-
ment of water demand and filling the gap between present
and future water demand is a complex process which
requires better identification of water users, water con-
sumption and water demand. Luxor in Upper Egypt is of
special concern due to its importance as a famous touristic
site that currently attracts more than 4 million tourists per
year from all over the world as well as the great changes in
population, economy, and agriculture since the construc-
tion of the High Dam. Consequently, the objective of this
work is to estimate the past, present and future water
demand at Luxor to help planners and decision makers on
management water resources and water demand.
Study area
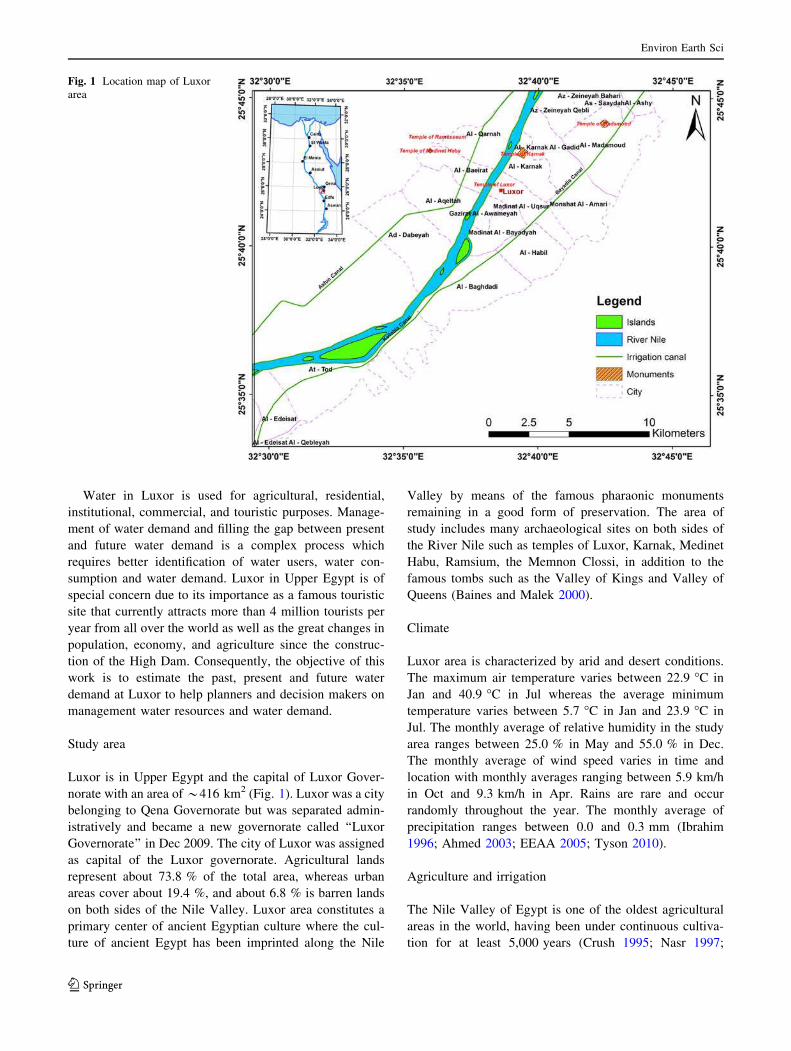
Luxor is in Upper Egypt and the capital of Luxor Gover-
norate with an area of*416 km2 (Fig. 1). Luxor was a city
belonging to Qena Governorate but was separated admin-
istratively and became a new governorate called ‘‘Luxor
Governorate’’ in Dec 2009. The city of Luxor was assigned
as capital of the Luxor governorate. Agricultural lands
represent about 73.8 % of the total area, whereas urban
areas cover about 19.4 %, and about 6.8 % is barren lands
on both sides of the Nile Valley. Luxor area constitutes a
primary center of ancient Egyptian culture where the cul-
ture of ancient Egypt has been imprinted along the Nile
Valley by means of the famous pharaonic monuments
remaining in a good form of preservation. The area of
study includes many archaeological sites on both sides of
the River Nile such as temples of Luxor, Karnak, Medinet
Habu, Ramsium, the Memnon Clossi, in addition to the
famous tombs such as the Valley of Kings and Valley of
Queens (Baines and Malek 2000).
Climate
Luxor area is characterized by arid and desert conditions.
The maximum air temperature varies between 22.9 �C in
Jan and 40.9 �C in Jul whereas the average minimum
temperature varies between 5.7 �C in Jan and 23.9 �C in
Jul. The monthly average of relative humidity in the study
area ranges between 25.0 % in May and 55.0 % in Dec.
The monthly average of wind speed varies in time and
location with monthly averages ranging between 5.9 km/h
in Oct and 9.3 km/h in Apr. Rains are rare and occur
randomly throughout the year. The monthly average of
precipitation ranges between 0.0 and 0.3 mm (Ibrahim
1996; Ahmed 2003; EEAA 2005; Tyson 2010).
Agriculture and irrigation
The Nile Valley of Egypt is one of the oldest agricultural
areas in the world, having been under continuous cultiva-
tion for at least 5,000 years (Crush 1995; Nasr 1997;
Fig. 1 Location map of Luxor
area
Environ Earth Sci
123
Sallam 2003). Before construction of the High Dam, only
one crop per year was produced by flood irrigation. After
construction of the High Dam, the production was changed
completely to perennial irrigation whereby water is avail-
able at any time throughout the year, thus producing two
or more crops annually (Abu-Zeid 1997; Abu-Zeid and
El-Shibini 1997; Hegazi and El Bagouri 2002).
The entire valley is mainly used for agricultural activi-
ties except for the areas of settlements. The edges of the
valley on the east and west flanks are marked by new
cultivated fringes. Crops are cultivated in a 2- or 3-year
crop rotation divided into winter, summer, and Nili
(autumn) crops. Winter cultivation season starts in Octo-
ber–November and summer season starts in May–June
(Rosenzweig and Hillel 1994; Abou Hussein and Sawan
2010).
There are two main canals in the study area that take
water directly from the Nile upstream of the Esna barrage;
these are the Asfun and Al-Kallabiyya canals (Fig. 1). The
old Esna barrage was constructed in 1908 on the Nile
170 km downstream of Aswan, and 61 km upstream of
Luxor, to guarantee basin irrigation in the southern reaches
of Upper Egypt. In 1994 the new Esna barrage was
constructed 1.2 km downstream of the existing structure.
The total cultivated area observed at Luxor is about 79,000
feddan.
Geologic setting
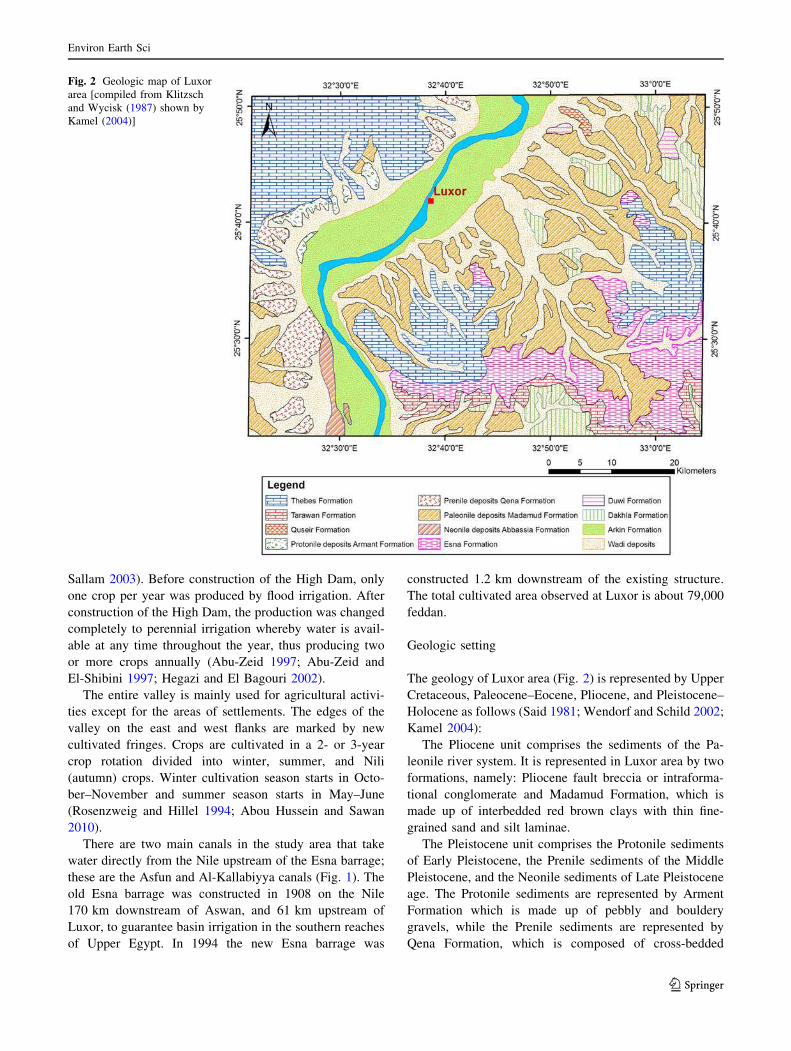
The geology of Luxor area (Fig. 2) is represented by Upper
Cretaceous, Paleocene–Eocene, Pliocene, and Pleistocene–
Holocene as follows (Said 1981; Wendorf and Schild 2002;
Kamel 2004):
The Pliocene unit comprises the sediments of the Pa-
leonile river system. It is represented in Luxor area by two
formations, namely: Pliocene fault breccia or intraforma-
tional conglomerate and Madamud Formation, which is
made up of interbedded red brown clays with thin fine-
grained sand and silt laminae.
The Pleistocene unit comprises the Protonile sediments
of Early Pleistocene, the Prenile sediments of the Middle
Pleistocene, and the Neonile sediments of Late Pleistocene
age. The Protonile sediments are represented by Arment
Formation which is made up of pebbly and bouldery
gravels, while the Prenile sediments are represented by
Qena Formation, which is composed of cross-bedded
Fig. 2 Geologic map of Luxor
area [compiled from Klitzsch
and Wycisk (1987) shown by
Kamel (2004)]
Environ Earth Sci
123
fluvial sands with minor gravel and clay beds and the
Abbassia Formation, which is made up of massive loosely
consolidated gravel of polygenetic origin.
The Holocene unit is represented by the Neonile sedi-
ments (Arkin Formation). It is made up of silt, micaceous
sand, and clays. The recent alluvial cover comprises
unconsolidated sediments represented by Nile flood plain
unit and attains a total thickness of 18.5 m, made up of two
sequential layers, silty clay and clay layers.
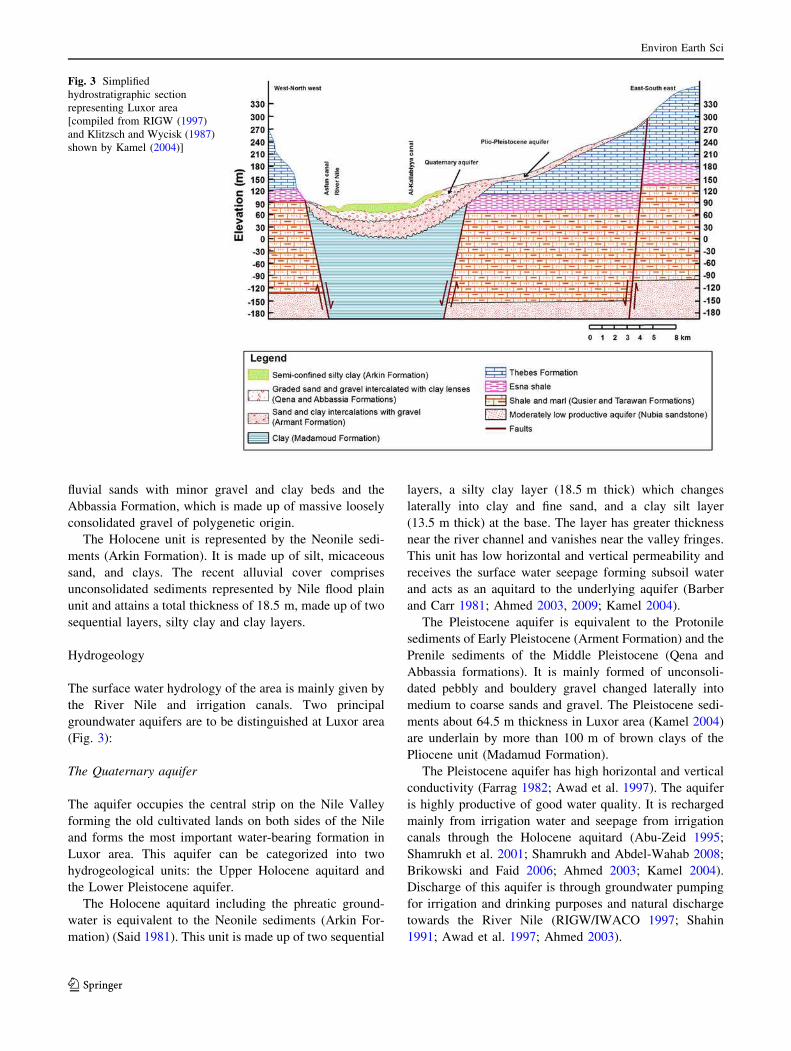
Hydrogeology
The surface water hydrology of the area is mainly given by
the River Nile and irrigation canals. Two principal
groundwater aquifers are to be distinguished at Luxor area
(Fig. 3):
The Quaternary aquifer
The aquifer occupies the central strip on the Nile Valley
forming the old cultivated lands on both sides of the Nile
and forms the most important water-bearing formation in
Luxor area. This aquifer can be categorized into two
hydrogeological units: the Upper Holocene aquitard and
the Lower Pleistocene aquifer.
The Holocene aquitard including the phreatic ground-
water is equivalent to the Neonile sediments (Arkin For-
mation) (Said 1981). This unit is made up of two sequential
layers, a silty clay layer (18.5 m thick) which changes
laterally into clay and fine sand, and a clay silt layer
(13.5 m thick) at the base. The layer has greater thickness
near the river channel and vanishes near the valley fringes.
This unit has low horizontal and vertical permeability and
receives the surface water seepage forming subsoil water
and acts as an aquitard to the underlying aquifer (Barber
and Carr 1981; Ahmed 2003, 2009; Kamel 2004).
The Pleistocene aquifer is equivalent to the Protonile
sediments of Early Pleistocene (Arment Formation) and the
Prenile sediments of the Middle Pleistocene (Qena and
Abbassia formations). It is mainly formed of unconsoli-
dated pebbly and bouldery gravel changed laterally into
medium to coarse sands and gravel. The Pleistocene sedi-
ments about 64.5 m thickness in Luxor area (Kamel 2004)
are underlain by more than 100 m of brown clays of the
Pliocene unit (Madamud Formation).
The Pleistocene aquifer has high horizontal and vertical
conductivity (Farrag 1982; Awad et al. 1997). The aquifer
is highly productive of good water quality. It is recharged
mainly from irrigation water and seepage from irrigation
canals through the Holocene aquitard (Abu-Zeid 1995;
Shamrukh et al. 2001; Shamrukh and Abdel-Wahab 2008;
Brikowski and Faid 2006; Ahmed 2003; Kamel 2004).
Discharge of this aquifer is through groundwater pumping
for irrigation and drinking purposes and natural discharge
towards the River Nile (RIGW/IWACO 1997; Shahin
1991; Awad et al. 1997; Ahmed 2003).
Fig. 3 Simplified
hydrostratigraphic section
representing Luxor area
[compiled from RIGW (1997)
and Klitzsch and Wycisk (1987)
shown by Kamel (2004)]
Environ Earth Sci
123
The Pliocene–Pleistocene aquifer
This aquifer represents the secondary aquifer in the study
area and is exposed at the outer fringes of the Nile aquifer
system adjacent to the floodplain. It is composed of clay,
sand, and gravel (Awad et al. 1997; Kamel 2004; Ismail
et al. 2005). The aquifer has more thickness near the
Quaternary aquifer and decreases towards the Eocene
limestone boundary on both sides of the Nile valley. At the
valley fringes, the groundwater in this aquifer is under
phreatic conditions. This aquifer is of low productivity.
The recharge of this aquifer is mainly from excess irriga-
tion from the reclaimed and desert lands and from deeper
aquifer systems (RIGW 1997). Discharge of this aquifer is
through the groundwater pumping or to adjacent ground-
water aquifers (Awad et al. 1997).
Methodology
Definition of water users
The water users at Luxor area could be classified into
agricultural, institutional, residential, touristic, and com-
mercial. Agricultural water consumption includes water
used for irrigation purposes. Institutional water consump-
tion includes public facilities dedicated to public service
including schools, governmental buildings and hospitals.
Residential water consumption includes water use for
drinking and domestic purposes. Touristic water con-
sumption includes the water used by tourists. Commercial
water consumption includes private facilities providing or
distributing a product or service such as hotels, restaurants,
or office buildings. Industrial water consumption includes
facilities that mostly manufacture or process materials.
Commercial and institutional users of water could be
grouped together for analytical purposes because the dis-
tinction between commercial and institutional units is
somewhat arbitrary such as the distinction between private
and public schools.
Estimation of water consumption
The estimation of water consumption in million cubic
meters (MCM) for the different water users at Luxor could
be summarized as follows:
Agricultural water consumption
CROPWAT 8.0, a computer program for irrigation plan-
ning and management (FAO 1992, 1998), is used for the
calculation of crop water requirements based on soil, cli-
mate and crop data (Smith 1992, 1993). The model
calculates reference evapotranspiration (ET0) based on the
FAO Penman–Monteith method (Allen et al. 1998) as
follows (Eq. 1):
ET0 ¼ 0:408D Rn � Gð Þ þ c 900=T þ 273ð ÞU2 es � eað Þf g=
Dþ c 1þ 0:34U2ð Þ ð1Þ
where ET0, reference evapotranspiration (mmday-1); Rn,
net radiation at the crop surface (MJm-2day-1); G, soil
heat flux density (MJm-2day-1); T, mean daily air tem-
perature at 2 m height (C0); U2, wind speed at 2 m height
(ms-1); es, saturation vapor pressure (kPa); ea, actual vapor
pressure (kPa); es-ea, saturation vapor pressure deficit
(kPa); D, slope vapor pressure curve (kPa �C-1); c, psy-
chrometric constant (kPa �C-1).
ETC is termed as the crop water requirement which is
defined as the depth of water needed to meet the water loss
through evapotranspiration of a disease-free crop, growing
in fields under non-restricting soil conditions including soil
water and fertility and achieving full production under the
given growing environment (Doorenbos and Pruitt 1977;
Doorenbos and Kassam 1979; Zhiming et al. 2007). The
CROPWAT program first computes Penman–Monteith
reference evapotranspiration (ET0) and then adjusts this
generalized variable for each crop using seasonal growth
curves (KC parameters) as follows (Eq. 2):
ETC ¼ KC�ET0 ð2Þ
where KC is the crop coefficient which is defined as ratio of
the actual crop evapotranspiration (ETC) to reference crop
evapotranspiration (ET0) (Doorenbos and Pruitt 1975,
1977; Burman et al. 1980a, b; Allen et al. 1998, 2005;
Allen 2003). Crops grown at Luxor area were used for
calculation of crop water requirements according to the
crop pattern listed in Table 3.
Residential water consumption
Residential water consumption at Luxor was calculated
based on the population in Luxor city and the average of
daily water use. The average water consumption in Luxor
is considered as 160 L/person/day (EEAA 2005; MHUUD
2007) and assuming a constant per capita consumption rate
for the study period.
Institutional and commercial water consumption
Municipal water use is gathered for recent years for the pur-
pose of estimating the rate of yearlywater consumption for the
different institutional and commercial sectors at the study
area. The total daily average of water consumption is esti-
mated at 17.88 m3/day/establishment. The total institutional
and commercial water consumption is calculated as follows
(Eq. 3):
Environ Earth Sci
123
WIC ¼Xn
s¼1
ðWs�SsÞ ð3Þ
where WIC, institutional and commercial total water con-
sumption for n sectors; Ws, water consumption rate for
sector S; Ss, Size of sector S.
Touristic water consumption
Most projections assumed that tourists consume more
water than city residents do. The touristic water con-
sumption was calculated using an average of 400 L/person/
day (Abraham and Bakr 2000; Lamei 2009; Charalambous
et al. 2012).
Water demand
The water demand at Luxor area is calculated in MCM as
the total water consumption as follows (Eq. 4):
WD ¼Xn
U¼1
ðWUÞ ð4Þ
where WD, water demand; WU, water consumption for user
U.
Forecasting the future water demand
Regression analysis
The linear regression analysis is used for analyzing the
future water demand at Luxor. Regression analysis is a
statistical technique that attempts to explore and model the
relationship between two or more variables. A linear
regression model attempts to explain the relationship
between two or more variables using a straight line (Wal-
pole et al. 2007; Dowdy et al. 2004). The statistical relation
between the years of observation (the independent variable
termed as X) and water consumption (the dependent vari-
able termed as Y) may be expressed as follows (Eq. 5):
Y ¼ b0 þ b1xþ e ð5Þ
In this model, the mean value of Y, abbreviated as E(Y),
is assumed to follow the linear relation (Eq. 6):
EðYÞ ¼ b0 þ b1x ð6Þ
The actual values of Y are assumed to be the sum of the
mean value, E(Y) and a random error term (e) as follows
(Eq. 7):
Y ¼EðYÞ þ e
¼b0 þ b1xþ eð7Þ
The slope, b1, and the intercept, b0, of the line EðYÞ ¼
b0 þ b1x are called regression coefficients. The random
error term, 2, is assumed to follow the normal distribution
with a mean of 0 and variance of r2. Since Y is the sum of
this random term and the mean value, E Yð Þ; which is a
constant, the variance of Y at any given value of X is also
r2. Therefore, at any given value of x, say xi, the dependent
variable Y follows a normal distribution with a mean of
¼ b0 þ b1xi and a standard deviation of r2(Walpole et al.
2007; Dowdy et al. 2004).
The regression line can be estimated by estimating the
coefficients b1 andb0 for an observed data set. The estimates,
bb1 and bb0, could be calculated efficiently using the least
squares method (Tucson 2005; Johnson and Bhattacharyya
2010). The least-squares line is determined such that the sum
of the squares of the deviations of the data points from the
line is a minimum. (Johnson and Kuby 2012).
In the present study, the statistical software package
SPSS 17.0 (2007) is used in the present study for regression
analysis and estimating the regression coefficients to be
used for building the statistical model for the future fore-
casting of water demand.
Building the statistical model for future forecasting
According to the regression analysis, the projected future
water demand (Y) is a random variable that is related to the
future projected years of observation (X) by the following
relation (Eq. 8):
Yi ¼ b0 þ b1xi þ ei i ¼ 1; . . .. . .. . .. . .; n ð8Þ
where, Yi denotes the projected future water demand cor-
responding to the ith projected year of observation (X) set at
the value Xi. The terms e1, ……, n are the unknown error
components that are superimposed on the true linear rela-
tion. These are unobservable random variables, which we
assume are independently and normally distributed with
mean zero and an unknown standard deviation r. The
parameters b0 and b1, which together locate the straight
line, are unknown.
Projected future scenarios
Four scenarios could be expected for projected water
demand at Luxor area up to 2050 as follows: scenario 1:
linear increase in agricultural, residential, institutional and
touristic water consumption. scenario 2: stabilization in
agricultural water consumption and linear increase in res-
idential, institutional and touristic water consumption.
scenario 3: stabilization in agricultural and institutional
water consumption and linear increase in residential and
touristic water consumption. scenario 4: stabilization in
agricultural, institutional and touristic water consumption
and linear increase in residential water consumption.
Environ Earth Sci
123
Data acquisition
Climatic data
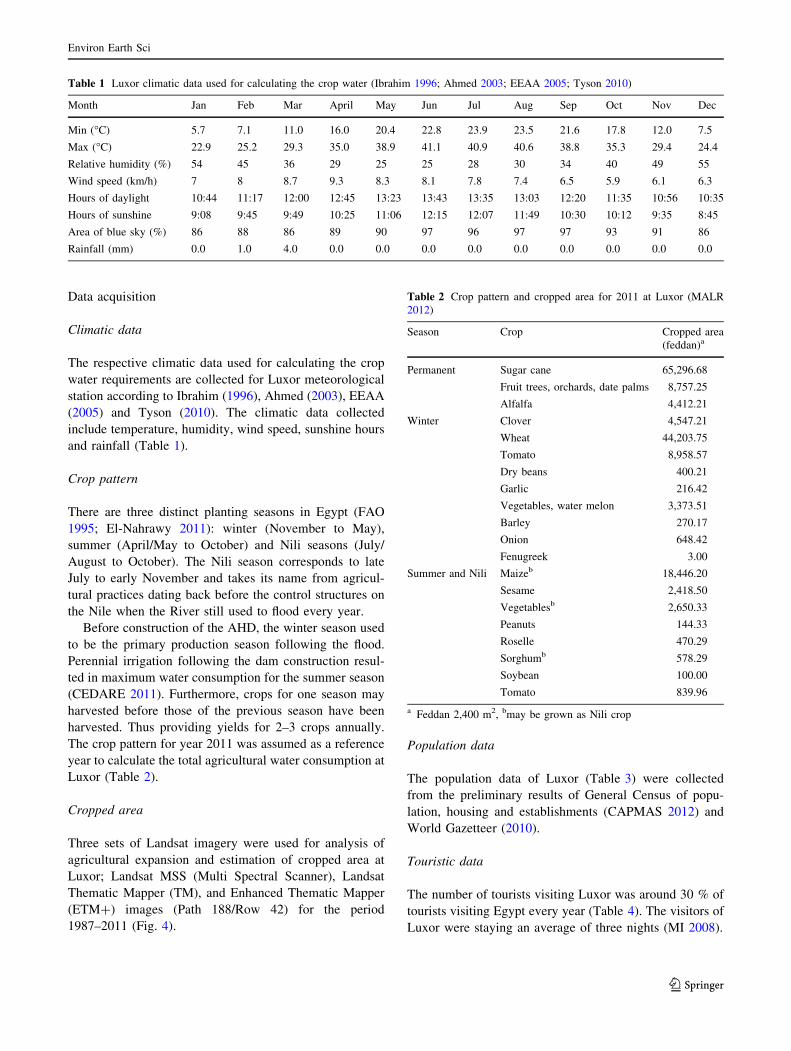
The respective climatic data used for calculating the crop
water requirements are collected for Luxor meteorological
station according to Ibrahim (1996), Ahmed (2003), EEAA
(2005) and Tyson (2010). The climatic data collected
include temperature, humidity, wind speed, sunshine hours
and rainfall (Table 1).
Crop pattern
There are three distinct planting seasons in Egypt (FAO
1995; El-Nahrawy 2011): winter (November to May),
summer (April/May to October) and Nili seasons (July/
August to October). The Nili season corresponds to late
July to early November and takes its name from agricul-
tural practices dating back before the control structures on
the Nile when the River still used to flood every year.
Before construction of the AHD, the winter season used
to be the primary production season following the flood.
Perennial irrigation following the dam construction resul-
ted in maximum water consumption for the summer season
(CEDARE 2011). Furthermore, crops for one season may
harvested before those of the previous season have been
harvested. Thus providing yields for 2–3 crops annually.
The crop pattern for year 2011 was assumed as a reference
year to calculate the total agricultural water consumption at
Luxor (Table 2).
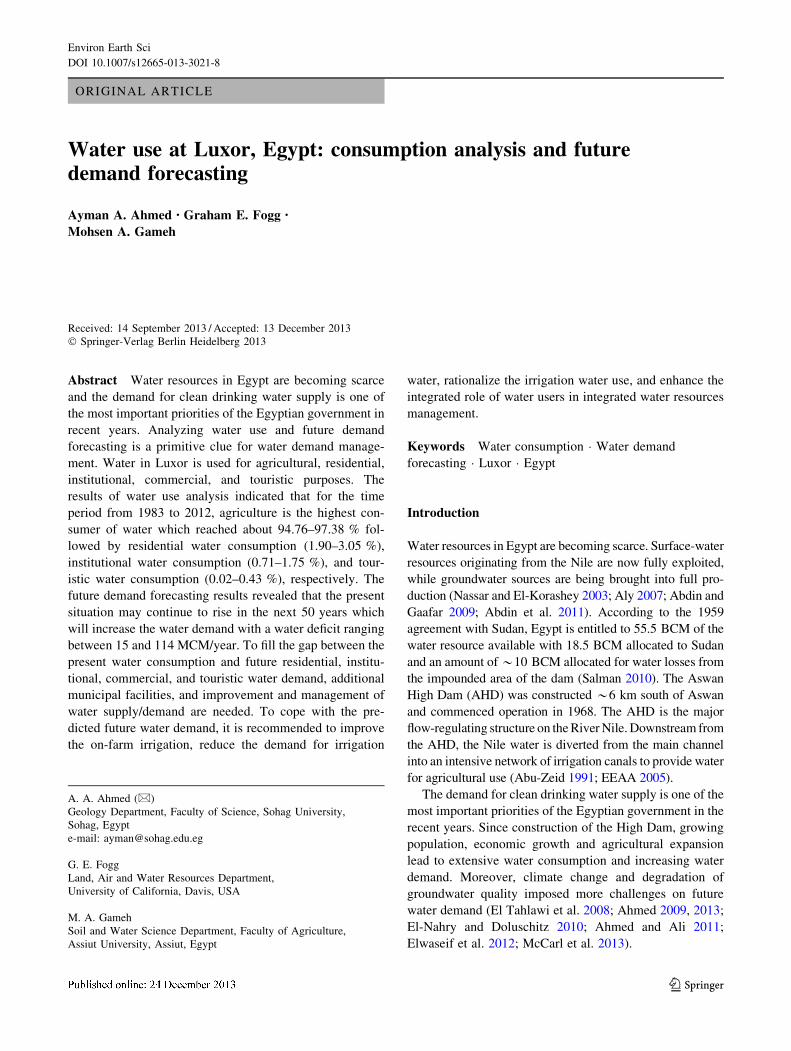
Cropped area
Three sets of Landsat imagery were used for analysis of
agricultural expansion and estimation of cropped area at
Luxor; Landsat MSS (Multi Spectral Scanner), Landsat
Thematic Mapper (TM), and Enhanced Thematic Mapper
(ETM?) images (Path 188/Row 42) for the period
1987–2011 (Fig. 4).
Population data
The population data of Luxor (Table 3) were collected
from the preliminary results of General Census of popu-
lation, housing and establishments (CAPMAS 2012) and
World Gazetteer (2010).
Touristic data
The number of tourists visiting Luxor was around 30 % of
tourists visiting Egypt every year (Table 4). The visitors of
Luxor were staying an average of three nights (MI 2008).
Table 1 Luxor climatic data used for calculating the crop water (Ibrahim 1996; Ahmed 2003; EEAA 2005; Tyson 2010)
Month Jan Feb Mar April May Jun Jul Aug Sep Oct Nov Dec
Min (�C) 5.7 7.1 11.0 16.0 20.4 22.8 23.9 23.5 21.6 17.8 12.0 7.5
Max (�C) 22.9 25.2 29.3 35.0 38.9 41.1 40.9 40.6 38.8 35.3 29.4 24.4
Relative humidity (%) 54 45 36 29 25 25 28 30 34 40 49 55
Wind speed (km/h) 7 8 8.7 9.3 8.3 8.1 7.8 7.4 6.5 5.9 6.1 6.3
Hours of daylight 10:44 11:17 12:00 12:45 13:23 13:43 13:35 13:03 12:20 11:35 10:56 10:35
Hours of sunshine 9:08 9:45 9:49 10:25 11:06 12:15 12:07 11:49 10:30 10:12 9:35 8:45
Area of blue sky (%) 86 88 86 89 90 97 96 97 97 93 91 86
Rainfall (mm) 0.0 1.0 4.0 0.0 0.0 0.0 0.0 0.0 0.0 0.0 0.0 0.0
Table 2 Crop pattern and cropped area for 2011 at Luxor (MALR
2012)
Season Crop Cropped area
(feddan)a
Permanent Sugar cane 65,296.68
Fruit trees, orchards, date palms 8,757.25
Alfalfa 4,412.21
Winter Clover 4,547.21
Wheat 44,203.75
Tomato 8,958.57
Dry beans 400.21
Garlic 216.42
Vegetables, water melon 3,373.51
Barley 270.17
Onion 648.42
Fenugreek 3.00
Summer and Nili Maizeb 18,446.20
Sesame 2,418.50
Vegetablesb 2,650.33
Peanuts 144.33
Roselle 470.29
Sorghumb 578.29
Soybean 100.00
Tomato 839.96
a Feddan 2,400 m2, bmay be grown as Nili crop
Environ Earth Sci
123
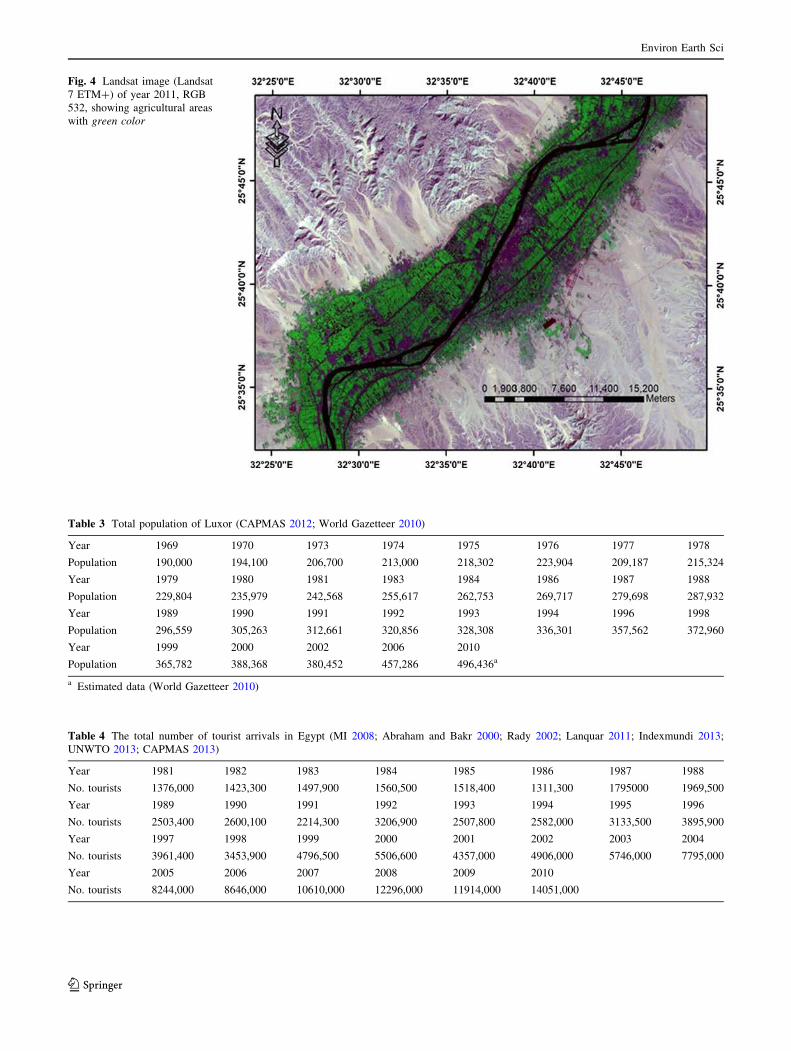
Fig. 4 Landsat image (Landsat
7 ETM?) of year 2011, RGB
532, showing agricultural areas
with green color
Table 3 Total population of Luxor (CAPMAS 2012; World Gazetteer 2010)
Year 1969 1970 1973 1974 1975 1976 1977 1978
Population 190,000 194,100 206,700 213,000 218,302 223,904 209,187 215,324
Year 1979 1980 1981 1983 1984 1986 1987 1988
Population 229,804 235,979 242,568 255,617 262,753 269,717 279,698 287,932
Year 1989 1990 1991 1992 1993 1994 1996 1998
Population 296,559 305,263 312,661 320,856 328,308 336,301 357,562 372,960
Year 1999 2000 2002 2006 2010
Population 365,782 388,368 380,452 457,286 496,436a
a Estimated data (World Gazetteer 2010)
Table 4 The total number of tourist arrivals in Egypt (MI 2008; Abraham and Bakr 2000; Rady 2002; Lanquar 2011; Indexmundi 2013;
UNWTO 2013; CAPMAS 2013)
Year 1981 1982 1983 1984 1985 1986 1987 1988
No. tourists 1376,000 1423,300 1497,900 1560,500 1518,400 1311,300 1795000 1969,500
Year 1989 1990 1991 1992 1993 1994 1995 1996
No. tourists 2503,400 2600,100 2214,300 3206,900 2507,800 2582,000 3133,500 3895,900
Year 1997 1998 1999 2000 2001 2002 2003 2004
No. tourists 3961,400 3453,900 4796,500 5506,600 4357,000 4906,000 5746,000 7795,000
Year 2005 2006 2007 2008 2009 2010
No. tourists 8244,000 8646,000 10610,000 12296,000 11914,000 14051,000
Environ Earth Sci
123
Institutional and commercial data
The institutional and commercial data are represented by
the establishments consuming water (Table 5).
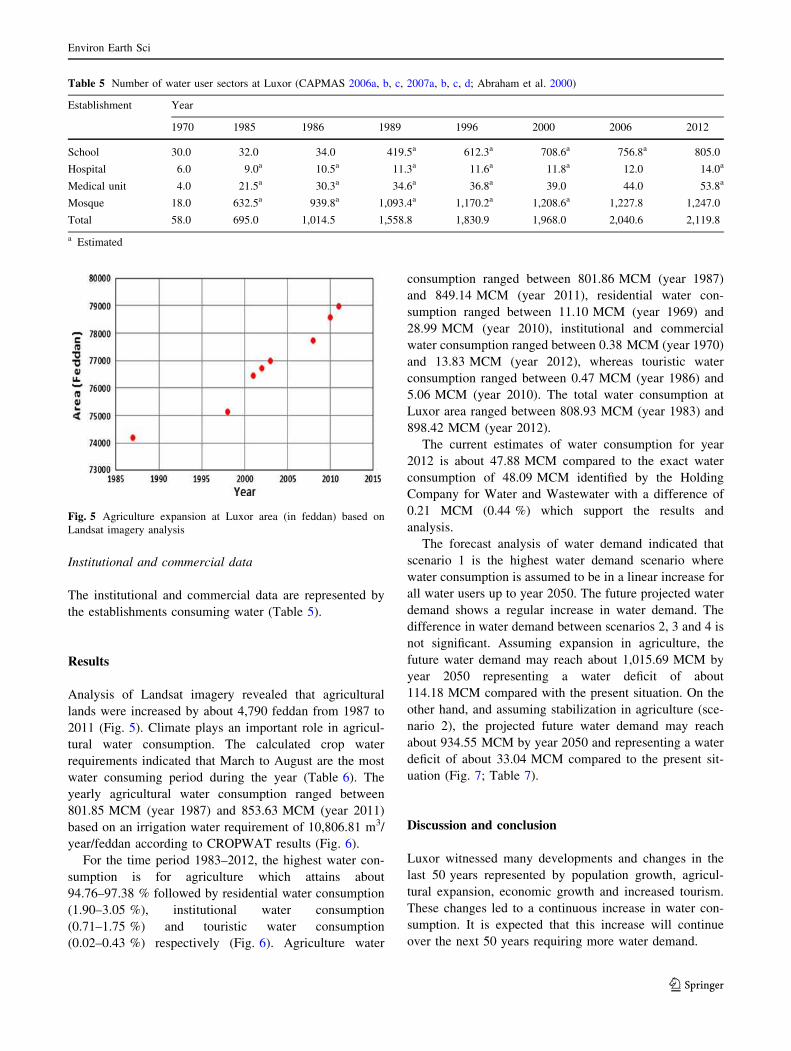
Results
Analysis of Landsat imagery revealed that agricultural
lands were increased by about 4,790 feddan from 1987 to
2011 (Fig. 5). Climate plays an important role in agricul-
tural water consumption. The calculated crop water
requirements indicated that March to August are the most
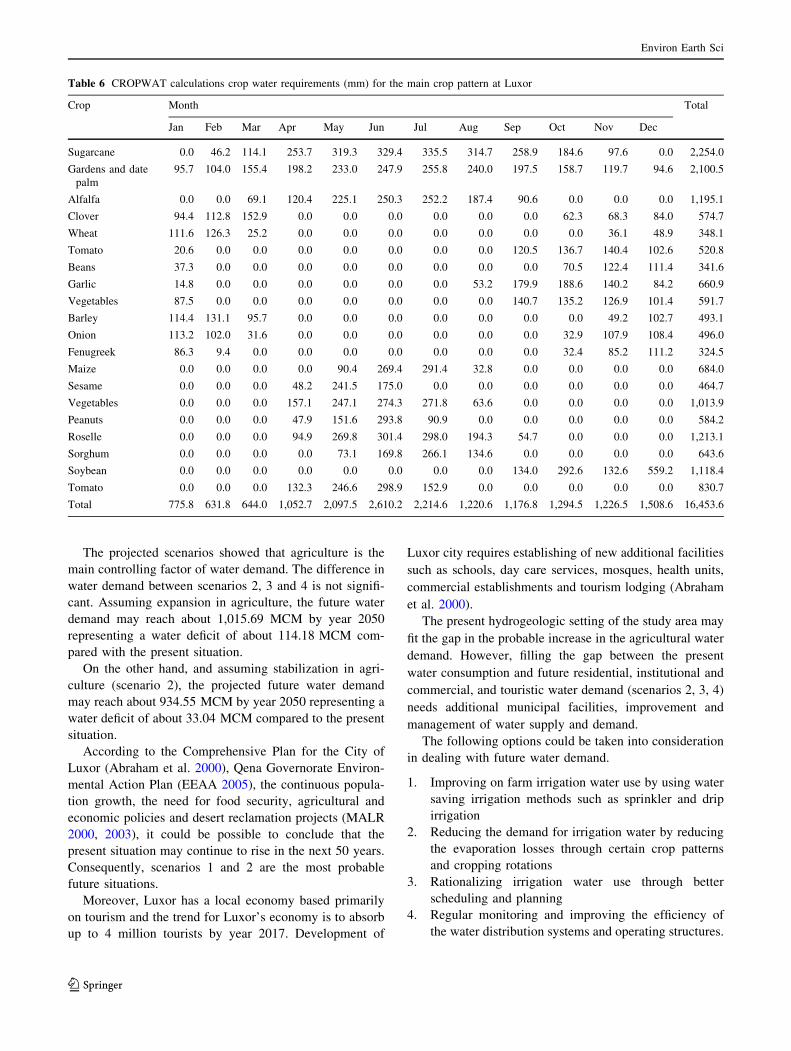
water consuming period during the year (Table 6). The
yearly agricultural water consumption ranged between
801.85 MCM (year 1987) and 853.63 MCM (year 2011)
based on an irrigation water requirement of 10,806.81 m3/
year/feddan according to CROPWAT results (Fig. 6).
For the time period 1983–2012, the highest water con-
sumption is for agriculture which attains about
94.76–97.38 % followed by residential water consumption
(1.90–3.05 %), institutional water consumption
(0.71–1.75 %) and touristic water consumption
(0.02–0.43 %) respectively (Fig. 6). Agriculture water
consumption ranged between 801.86 MCM (year 1987)
and 849.14 MCM (year 2011), residential water con-
sumption ranged between 11.10 MCM (year 1969) and
28.99 MCM (year 2010), institutional and commercial
water consumption ranged between 0.38 MCM (year 1970)
and 13.83 MCM (year 2012), whereas touristic water
consumption ranged between 0.47 MCM (year 1986) and
5.06 MCM (year 2010). The total water consumption at
Luxor area ranged between 808.93 MCM (year 1983) and
898.42 MCM (year 2012).
The current estimates of water consumption for year
2012 is about 47.88 MCM compared to the exact water
consumption of 48.09 MCM identified by the Holding
Company for Water and Wastewater with a difference of
0.21 MCM (0.44 %) which support the results and
analysis.
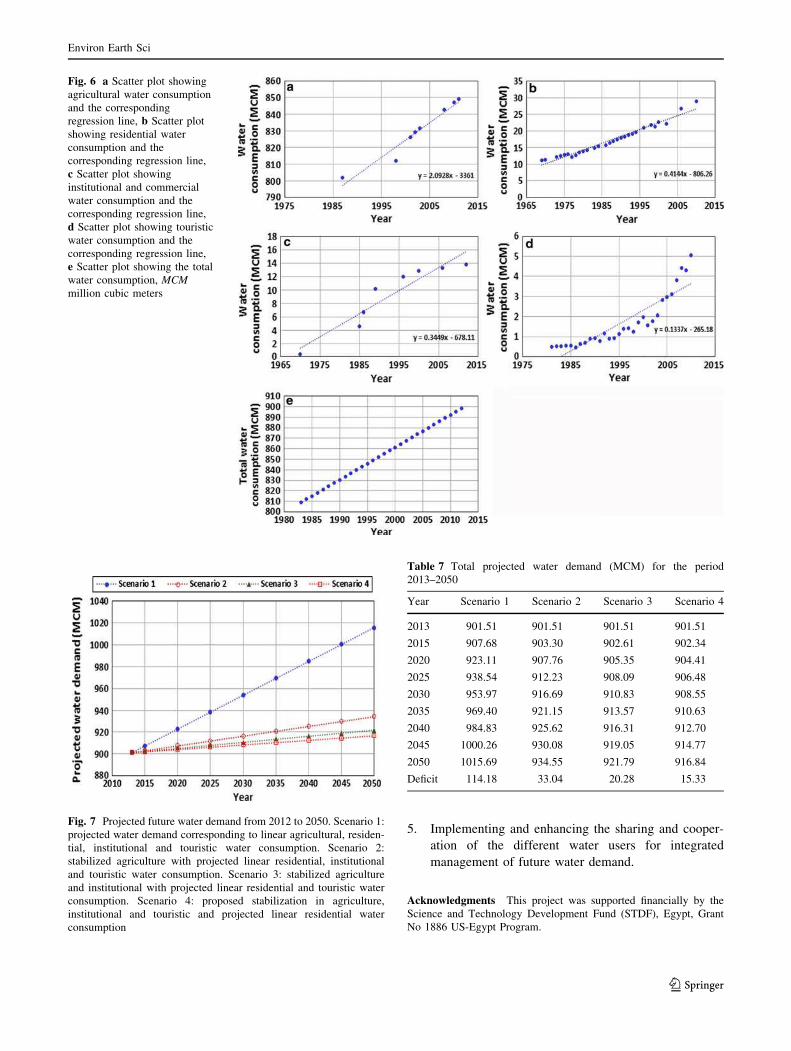
The forecast analysis of water demand indicated that
scenario 1 is the highest water demand scenario where
water consumption is assumed to be in a linear increase for
all water users up to year 2050. The future projected water
demand shows a regular increase in water demand. The
difference in water demand between scenarios 2, 3 and 4 is
not significant. Assuming expansion in agriculture, the
future water demand may reach about 1,015.69 MCM by
year 2050 representing a water deficit of about
114.18 MCM compared with the present situation. On the
other hand, and assuming stabilization in agriculture (sce-
nario 2), the projected future water demand may reach
about 934.55 MCM by year 2050 and representing a water
deficit of about 33.04 MCM compared to the present sit-
uation (Fig. 7; Table 7).
Discussion and conclusion
Luxor witnessed many developments and changes in the
last 50 years represented by population growth, agricul-
tural expansion, economic growth and increased tourism.
These changes led to a continuous increase in water con-
sumption. It is expected that this increase will continue
over the next 50 years requiring more water demand.
Table 5 Number of water user sectors at Luxor (CAPMAS 2006a, b, c, 2007a, b, c, d; Abraham et al. 2000)
Establishment Year
1970 1985 1986 1989 1996 2000 2006 2012
School 30.0 32.0 34.0 419.5a 612.3a 708.6a 756.8a 805.0
Hospital 6.0 9.0a 10.5a 11.3a 11.6a 11.8a 12.0 14.0a
Medical unit 4.0 21.5a 30.3a 34.6a 36.8a 39.0 44.0 53.8a
Mosque 18.0 632.5a 939.8a 1,093.4a 1,170.2a 1,208.6a 1,227.8 1,247.0
Total 58.0 695.0 1,014.5 1,558.8 1,830.9 1,968.0 2,040.6 2,119.8
a Estimated
Fig. 5 Agriculture expansion at Luxor area (in feddan) based on
Landsat imagery analysis
Environ Earth Sci
123
The projected scenarios showed that agriculture is the
main controlling factor of water demand. The difference in
water demand between scenarios 2, 3 and 4 is not signifi-
cant. Assuming expansion in agriculture, the future water
demand may reach about 1,015.69 MCM by year 2050
representing a water deficit of about 114.18 MCM com-
pared with the present situation.
On the other hand, and assuming stabilization in agri-
culture (scenario 2), the projected future water demand
may reach about 934.55 MCM by year 2050 representing a
water deficit of about 33.04 MCM compared to the present
situation.
According to the Comprehensive Plan for the City of
Luxor (Abraham et al. 2000), Qena Governorate Environ-
mental Action Plan (EEAA 2005), the continuous popula-
tion growth, the need for food security, agricultural and
economic policies and desert reclamation projects (MALR
2000, 2003), it could be possible to conclude that the
present situation may continue to rise in the next 50 years.
Consequently, scenarios 1 and 2 are the most probable
future situations.
Moreover, Luxor has a local economy based primarily
on tourism and the trend for Luxor’s economy is to absorb
up to 4 million tourists by year 2017. Development of
Luxor city requires establishing of new additional facilities
such as schools, day care services, mosques, health units,
commercial establishments and tourism lodging (Abraham
et al. 2000).
The present hydrogeologic setting of the study area may
fit the gap in the probable increase in the agricultural water
demand. However, filling the gap between the present
water consumption and future residential, institutional and
commercial, and touristic water demand (scenarios 2, 3, 4)
needs additional municipal facilities, improvement and
management of water supply and demand.
The following options could be taken into consideration
in dealing with future water demand.
1. Improving on farm irrigation water use by using water
saving irrigation methods such as sprinkler and drip
irrigation
2. Reducing the demand for irrigation water by reducing
the evaporation losses through certain crop patterns
and cropping rotations
3. Rationalizing irrigation water use through better
scheduling and planning
4. Regular monitoring and improving the efficiency of
the water distribution systems and operating structures.
Table 6 CROPWAT calculations crop water requirements (mm) for the main crop pattern at Luxor
Crop Month Total
Jan Feb Mar Apr May Jun Jul Aug Sep Oct Nov Dec
Sugarcane 0.0 46.2 114.1 253.7 319.3 329.4 335.5 314.7 258.9 184.6 97.6 0.0 2,254.0
Gardens and date
palm
95.7 104.0 155.4 198.2 233.0 247.9 255.8 240.0 197.5 158.7 119.7 94.6 2,100.5
Alfalfa 0.0 0.0 69.1 120.4 225.1 250.3 252.2 187.4 90.6 0.0 0.0 0.0 1,195.1
Clover 94.4 112.8 152.9 0.0 0.0 0.0 0.0 0.0 0.0 62.3 68.3 84.0 574.7
Wheat 111.6 126.3 25.2 0.0 0.0 0.0 0.0 0.0 0.0 0.0 36.1 48.9 348.1
Tomato 20.6 0.0 0.0 0.0 0.0 0.0 0.0 0.0 120.5 136.7 140.4 102.6 520.8
Beans 37.3 0.0 0.0 0.0 0.0 0.0 0.0 0.0 0.0 70.5 122.4 111.4 341.6
Garlic 14.8 0.0 0.0 0.0 0.0 0.0 0.0 53.2 179.9 188.6 140.2 84.2 660.9
Vegetables 87.5 0.0 0.0 0.0 0.0 0.0 0.0 0.0 140.7 135.2 126.9 101.4 591.7
Barley 114.4 131.1 95.7 0.0 0.0 0.0 0.0 0.0 0.0 0.0 49.2 102.7 493.1
Onion 113.2 102.0 31.6 0.0 0.0 0.0 0.0 0.0 0.0 32.9 107.9 108.4 496.0
Fenugreek 86.3 9.4 0.0 0.0 0.0 0.0 0.0 0.0 0.0 32.4 85.2 111.2 324.5
Maize 0.0 0.0 0.0 0.0 90.4 269.4 291.4 32.8 0.0 0.0 0.0 0.0 684.0
Sesame 0.0 0.0 0.0 48.2 241.5 175.0 0.0 0.0 0.0 0.0 0.0 0.0 464.7
Vegetables 0.0 0.0 0.0 157.1 247.1 274.3 271.8 63.6 0.0 0.0 0.0 0.0 1,013.9
Peanuts 0.0 0.0 0.0 47.9 151.6 293.8 90.9 0.0 0.0 0.0 0.0 0.0 584.2
Roselle 0.0 0.0 0.0 94.9 269.8 301.4 298.0 194.3 54.7 0.0 0.0 0.0 1,213.1
Sorghum 0.0 0.0 0.0 0.0 73.1 169.8 266.1 134.6 0.0 0.0 0.0 0.0 643.6
Soybean 0.0 0.0 0.0 0.0 0.0 0.0 0.0 0.0 134.0 292.6 132.6 559.2 1,118.4
Tomato 0.0 0.0 0.0 132.3 246.6 298.9 152.9 0.0 0.0 0.0 0.0 0.0 830.7
Total 775.8 631.8 644.0 1,052.7 2,097.5 2,610.2 2,214.6 1,220.6 1,176.8 1,294.5 1,226.5 1,508.6 16,453.6
Environ Earth Sci
123
5. Implementing and enhancing the sharing and cooper-
ation of the different water users for integrated
management of future water demand.
Acknowledgments This project was supported financially by the
Science and Technology Development Fund (STDF), Egypt, Grant
No 1886 US-Egypt Program.
Fig. 6 a Scatter plot showing
agricultural water consumption
and the corresponding
regression line, b Scatter plot
showing residential water
consumption and the
corresponding regression line,
c Scatter plot showing
institutional and commercial
water consumption and the
corresponding regression line,
d Scatter plot showing touristic
water consumption and the
corresponding regression line,
e Scatter plot showing the total
water consumption, MCM
million cubic meters
Fig. 7 Projected future water demand from 2012 to 2050. Scenario 1:
projected water demand corresponding to linear agricultural, residen-
tial, institutional and touristic water consumption. Scenario 2:
stabilized agriculture with projected linear residential, institutional
and touristic water consumption. Scenario 3: stabilized agriculture
and institutional with projected linear residential and touristic water
consumption. Scenario 4: proposed stabilization in agriculture,
institutional and touristic and projected linear residential water
consumption
Table 7 Total projected water demand (MCM) for the period
2013–2050
Year Scenario 1 Scenario 2 Scenario 3 Scenario 4
2013 901.51 901.51 901.51 901.51
2015 907.68 903.30 902.61 902.34
2020 923.11 907.76 905.35 904.41
2025 938.54 912.23 908.09 906.48
2030 953.97 916.69 910.83 908.55
2035 969.40 921.15 913.57 910.63
2040 984.83 925.62 916.31 912.70
2045 1000.26 930.08 919.05 914.77
2050 1015.69 934.55 921.79 916.84
Deficit 114.18 33.04 20.28 15.33
Environ Earth Sci
123
References
Abdin AE, Gaafar I (2009) Egyptian water policies towards
increasing its value, paper presented at MELIA workshop,
Istanbul 21–23 March 2009
Abdin AE, Afify A, Adel A (2011) Comparative analysis of Egyptian
water policy and water framework directive. Options Mediter-
rannees, A n� 98, 2011—dialogues on Mediterranean water
challenges: rational water use, water price versus value and
lessons learned from the European Water Framework Directive
Abou Hussein SD, Sawan OM (2010) The utilization of agricultural
waste as one of the environmental issues in Egypt (a case study).
J App Sci Res 6(8):1116–1124
Abraham G, Bakr A (2000) Comprehensive development plan for the
City of Luxor, Egypt-Investment project#4, Investment portfolio
for the development of infrastructure serving New Luxor and El
Toad. Abt Associates Inc
Abraham G, Bakr A, Lane J (2000) The comprehensive development
of the City of Luxor project, Egypt-Final structure plan, vol 2.
Supplementary documents. Abt Associates Inc
Abu-Zeid M (1991) Water resources assessment for Egypt. Ministry
of Water Resources and Irrigation, Egypt
Abu-Zeid M (1995) Major policies and programs for irrigation
drainage and water resources development in Egypt. Options
Mediterraneennes, Ser. B/no 9, Egyptian Agricultural Profile
Abu-Zeid M (1997) Egypt’s water policy for the 21st century, IXth
World Water Congress of IWRA, a special session on water
management under scarcity conditions: the Egyptian experience,
Montreal, Canada, Sept 1997
Abu-Zeid M, El-Shibini FZ (1997) Egypt’s high aswan dam. Water
Res Dev 13(2):209–217
Ahmed AA (2003) The impact of hydrogeological conditions on the
archaeological sites at some localities between Qena and Aswan,
Egypt. Ph. D. Thesis, Geology Department, Faculty of Science,
South Valley University, Sohag, Egypt
Ahmed AA (2009) Using generic and pesticide DRASTIC GIS-based
models for vulnerability assessment of the Quaternary aquifer at
Sohag, Egypt. Hydrogeol J 17(5):1203–1217
Ahmed AA (2013) Fluoride in Quaternary groundwater aquifer, Nile
Valley, Luxor, Egypt. Arabian J Geosci 1–15
Ahmed AA, Ali MH (2011) Hydrochemical evolution and variation
of groundwater and its environmental impact at Sohag, Egypt.
Arabian J Geosci 4(3–4):339–352
Allen RG (2003) Crop coefficients. Encyclopedia of water Science.
doi:10.1081/E-EWS120010037
Allen RG, Pereira LS, Raes D, Smith M (1998) Crop evapotraspi-
ration: guidelines for computing crop water requirements. FAO
irrigation and drainage, Paper No. 65. FAO, Rome, Italy, p 300
Allen RG, Pereira LS, Smith M, Raes D, Wright JL (2005) FAO-56
dual crop coefficient method for estimating evaporation from
soil and application extensions. ASCE 131(1):2–13. doi:10.1061/
(ASCE)0733-9437
Aly AA (2007) Managing water in a sustainable manner. Eleventh
International Water Technology Conference, IWTC11 2007
Sharm El-Sheikh, Egypt
Awad MA, El Arabi NE, Hamza MS (1997) Use of solute chemistry
and isotopes to identify sources of groundwater recharge in the
Nile Aquifer Sysytem, Upper Egypt. Ground Water
35(2):223–226
Baines J, and Malek J (2000) Cultural atlas of ancient Egypt.
Checkmark Books, Rev. Ed., p 240
Barber W, Carr DP (1981) Water management capabilities of the
alluvial aquifer system of the Nile Valley, Upper Egypt.
Technical Report No. 11, Water Master Plan, Ministry of
Irrigation, Cairo
Brikowski TH, Faid A (2006) Pathline-calibrated groundwater flow
models of Nile Valley aquifers, Esna, Upper Egypt. J Hydrol
324:195–209
Burman RD, Nixon PR, Wright JL, Pruitt WO (1980a) Water
requirements, In: Jensen ME (ed), Design of farm irrigation
systems, ASAE Mono, Am Soc Agric Eng, St. Joseph, MI,
189–232
Burman RD, Wright JL, Nixon PR, Hill RW (1980b) Irrigation
management-water requirements and water balance. In: Irriga-
tion, Challenges of the 80s, Proc. of the Second National
Irrigation Symposium, Am Soc Agric Eng, St. Joseph, MI,
141–153
CAPMAS (Central Agency for Public Mobilization and Statistics),
Egypt (2006c) Preliminary results of general census of popula-
tion, housing and establishments, Egypt, p 142, March 2007
CAPMAS (Central Agency for Public Mobilization and Statistics),
Egypt (2006a) quarterly bulletin of industrial production, Ref
68-12600/2005
CAPMAS (Central Agency for Public Mobilization and Statistics),
Egypt (2006b) quarterly bulletin of industrial production, Ref
65-12600/2006
CAPMAS (Central Agency for Public Mobilization and Statistics),
Egypt (2007d) bulletin of water collection, refining and
distribution
CAPMAS (Central Agency for Public Mobilization and Statistics),
Egypt (2007a) quarterly bulletin of industrial production, Ref
66-12600/2006
CAPMAS (Central Agency for Public Mobilization and Statistics),
Egypt (2007b) quarterly bulletin of industrial production, Ref
67-12600/2006
CAPMAS (Central Agency for Public Mobilization and Statistics),
Egypt (2007c) quarterly bulletin of industrial production, Ref
65-12600/2007
CAPMAS (Central Agency for Public Mobilization and Statistics),
Egypt (2012) Population census database, Refs no. 1-212,
71-12511, 135-0135/11/77, 71-12511/78, 71-12511/79,
71-12511/80, 71-12511/81, 71/15211/82, 71/14511/88,
71-12511/84, 1977, 1980, 1981, 71-12511/1995, 1987,
71-12511/94, 1989, 71-12511/90, 71-12511/91, 71-12511/92,
1993, 1994, 71-12511/98, 71-12511/97, 71-12511/99, 71-12511/
2000, 71-12511/98, 2006
CAPMAS (Central Agency for Public Mobilization and Statistics),
Egypt (2013) Number of tourists and nights
CEDARE (2011) Water use efficiency and economic approach—
National study Egypt. Plan Bleu UNEP/MAP Regional Activity
Centre
Charalambous K, Bruggeman A, Lange MA (2012) The impact of
climate change on water use in the tourism sector of Cyprus.
Energy, environment and water research centre, The Cyprus
Institute, Nicosia
Crush J (1995) Power of development. Jonathan crush and contrib-
utors, New York, p 323
Doorenbos J, Kassam AH (1979) Yield response to water. FAO
irrigation and drainage paper No. 33, FAO, Rome, Italy, p 193
Doorenbos J, Pruitt W (1975) Guidelines for predicting crop water
requirements, irrigation and drainage Paper no. 24, FAO-ONU,
Rome, Italy, p 168
Doorenbos J, Pruitt W (1977) Crop evapotranspiration. FAO irriga-
tion and drainage Paper 24. p 180
Dowdy S, Weardon S, Chilko D (2004) Statistics for research. 3rd
edn. Wiley Inc. Publication, New York
EEAA ‘‘Ministry of State for Environmental Affairs, Egypt’’ (2005)
Qena Governorate Environmental Action Plan. Egyptian Envi-
ronmental Affairs Agency, SEAM Programme, Entec UK Ltd.,
ERM
Environ Earth Sci
123
El Tahlawi M, Farrag A, Ahmed S (2008) Groundwater of Egypt: ‘‘an
environmental overview’’. Environ Geol 55(3):639–652
El-Nahrawy MA (2011) Country pasture/forage resource profiles-
Egypt. FAO
El-Nahry AH, Doluschitz R (2010) Climate change and its impacts on
the coastal zone of the Nile Delta, Egypt. Environ Earth Sci
59(7):1497–1506
Elwaseif M, Ismail A, Abdalla M, Abdel-Rahman M, Hafez M (2012)
Geophysical and hydrological investigations at the west bank of
Nile River (Luxor, Egypt). Environ Earth Sci 67(3):911–921
FAO (1992) CROPWAT, a computer program for irrigation planning
and management by M. Smith. FAO irrigation and drainage
paper No. 26. Rome
FAO (1995) Irrigation in Africa in figures, water reports No. 7, Rome,
FAO
FAO (1998) Irrigation and Drainage Series No. 56 ‘‘Crop evapo-
transpiration—guidelines for computing crop water require-
ments’’ and No. 33 titled ‘‘Yield response to water’’
Farrag AA (1982) Hydrogeological studies on the quaternary water-
bearing sediments in the area between Assiut and Aswan. M.Sc.
Thesis. Geol Dept., Assiut Univ., Egypt
Hegazi AM, El Bagouri IH (2002) National action plan for combating
desertification, provisional. Arab Republic of Egypt, p 41
Rosenzweig C, Hillel, D (1994) Egyptian agriculture in the 21st
Century. IIASA, CP-94-12
Ibrahim MT (1996) The dimensions of arid climate of the Nile Valley
and its effects on human activity. M.Sc. Thesis, Geography
Department, Faculty of Arts, South Valley University, Sohag,
Egypt
Ismail A, Anderson NL, Rogers JD (2005) Hydrogeophysical
Investigation at Luxor, Southern Egypt. JEEG 10(1):35–49
Johnson RA, Bhattacharyya GK (2010) Statistics—principles and
methods. 6th edn. Wiley, Inc, New York
Johnson R, Kuby P (2012) Elementary statistics, 11th edn. Cengage
Learning, Brooks/Cole
Kamel ER (2004) Geology of Luxor area and its relationship to
groundwater uprising under the Pharaohs Temples. M. Sc. Thesis,
Aswan Faculty of Science, South Valley University, Egypt
Klitzsch E, Wycisk P (1987) Geology of the sedimentary basins of
Northern Sudan and bordering areas. Berl Geowiss Abh A
75(1):97–136
Lamei A (2009) A technical economic model for integrated water
resources management in tourism dependent arid coastal regions;
the case of Sharm El Sheikh, Egypt
MALR (2000) Mubarak national scheme for settling and developing
newly reclaimed lands. Publication from the Ministry of
Agriculture and Land Reclamation, Egypt
MALR (2003) Information on the size of public land reclamation by
the Ministry of Agriculture and Land Reclamation, Egypt,
compiled by Kheiry Sherif, Ministry of Agriculture and Land
Reclamation, Egypt
MALR (2012) Crops cultivated at Luxor Governorate. Ministry of
Agriculture and Land Reclamation, Egypt
McCarl BA, Musumba M, Smith JB, Kirshen P, Jones R, El-Ganzori
A, Ali MA, Kotb M, El-Shinnawy I, El-Agizy M (2013) Climate
change vulnerability and adaptation strategies in Egypt’s agri-
cultural sector. Mitigation and Adaptation Strategies for Global
Change 1–13
MHUUD ‘‘Ministry of Housing, Utilities and Urban Development,
Egypt’’ (2007) Luxor database, Governorate information and
Decision support Center
MI ‘‘Ministry of Interior, Egypt’’ (2008) Total number of tourists in
Egypt and Luxor, 1994–2008. General Department of Tourism
and Antiquities Police
Nasr ML (1997) Social dimensions of the policy of the use of water.
Options Mediterraneennes, SeE A/n031, 1997 Seminaires
Mediterraneens
Nassar A, El-Korashey R (2003) Sustainable development and reuse
of wastewater. Seventh International Water Technology Confer-
ence Egypt 1–3 April 2003
RIGW ‘‘Research Institute for Groundwater, Egypt’’ (1997) Hydro-
geological maps of Egypt, scale 1:100,000. Water Research
Center, Ministry of Public Works and Water Resources, Egypt
RIGW/IWACO (1997) Water quality monitoring programme (TN/
70.00067/WQM/97/20)
Said R (1981) The geological evolution of the River Nile. Springer,
New York Inc, p 151
Sallam GA (2003) Quality control and quality assurance of subsurface
drainage Projects in Egypt. Diffuse Pollution Conference Dublin
2003:3–149
Salman SM (2010) Water resources in the Sudan North–South peace
process: past experience and future Trends. African Foundation
for International Law, Yusuf AA (ed) African Yearbook of
International Law, 299–328
Shahin M (1991) Assessment of groundwater resources in Egypt. IHE
Report Series no. 23. The Netherlands: international institute for
hydraulic and environmental engineering
Shamrukh M, Abdel-Wahab A (2008) Riverbank filtration for
sustainable water supply: application to a large-scale facility
on the Nile River. Clean Techn Environ Policy 10:351–358.
doi:10.1007/s10098-007-0143-2
Shamrukh M, Corapcioglu MY, Hassona FA (2001) Modeling the
effect of chemical fertilizers on groundwater quality in the Nile
Valley aquifer, Egypt. 39(1):59-67, Groundwater-January-Feb-
ruary 2001
Smith M (1992) CROPWAT. A computer program for irrigation
planning and management. Irrig Drain Paper 46, FAO, Rome
Smith M (1993) CLIMAT for CROPWAT. A climatic database for
irrigation planning and management. Irrig Drain Paper 49, FAO,
Rome
SPSS Inc. (2007) SPSS advanced statistics 17. SPSS Inc., USA
Indexmundi (2013) Egypt-international tourism, number of arrivals.
http://www.indexmundi.com/facts/egypt/international-tourism
Lanquar R (2011) Tourism in the Mediterranean: scenarios up to
2030. Mediterranean prospects, Uropean Commision, p 44
Rady A (2002) Tourism and sustainable development in Egypt. Plan
Blue, p 47
Tucson AZ (2005) ReliaSoft Corporation, life data analysis reference,
ReliaSoft Publishing
Tyson P (2010) Sunshine guide to Luxor and the Valley of the Kings,
www.climates.com
UNWTO (2013) Tourism highlights. World Tourism Organization,
p 16
Walpole RE, Myers RH, Myers SL, Ye K (2007) Probability and
statistics for engineers and scientists. 8th edn. Pearson Education
International
Wendorf F, Schild R (2002) Implications of incipient social
complexity in the Late Neolithic in Egyptian Sahara. In Egypt
and Nubia: gifts of the desert, Friedman R (ed), London, 13–20
World Gazetteer– Egypt (2010) Egypt: largest cities and towns and
statistics of their population (retrieved 27 July 2010), http://
www.world-gazetteer.com
Zhiming F, Dengwei L, Yuehong Z (2007) Water requirements and
irrigation scheduling of spring maize using GIS and CropWat
model in Beijing–Tianjin–Hebei region. Chinese Geogr Sci
17(1):056–063. doi:10.1007/s11769-007-0056-3
Environ Earth Sci
123