Embed Size (px)
Citation preview

Water temperature of Alpinestreams in response todischarge and radiation
By
George Charles Pea
A thesis submitted for the degree of Master of Science
School of Environment and Life SciencesUniversity of Salford
UK
October 2017

Abstract
The aim of this study is to examine the relationships between water tem-perature, discharge and their response to shortwave radiation in a highlyglacierised Alpine basin. Due to the high altitude, the Alps have one of thehighest solar radiation budgets in Europe and demonstrated almost doublethe rate of warming of the Northern Hemisphere. Understanding the effectradiation has on stream temperature is key as this is the primary controlon water quality due to its influence on chemical, biological and physicalprocesses. Studies of the Aletschgletscher basin have highlighted a paradox-ical relationship between water temperature and air temperature; howeverthere is limited research on the relationship between water temperature andsolar radiation, which is of importance as radiation is the primary energyinput (up to 80%) to Alpine proglacial streams. The river Massa in Can-ton Valais, Switzerland is the study areas, where the highly glacierised basin(65.9%) from which the rivers are sourced has shown high sensitivity to cli-matic warming. This is evident as Aletschgletscher has been recorded (2003)to be retreating by 20m a year. Hydrological data acquired from FOEN andshortwave radiation from Zermatt were analysed at high and low resolutionsfor the spring, summer and autumn. As expected seasonal runoff and radi-ation trends correlate with a lag time of up to 6 weeks between their peaks(2012), and water temperature has shown the paradoxical trend in summer;when radiation is at its highest levels water temperature decreases. Thiscorresponds with the early ablation period when levels of discharge begin toincrease, extending the cool tongue of water. During the ablation season wa-ter temperature has the highest range and undergoes periods of warm surgesthough radiation is still low. Stream temperature decreases from its peak ata high rate as discharge increases from the winter minima of approximately0.5 m3s−1 to 3.5 m3s−1. While flow level is relatively low it proves to be thetipping point and demonstrates how radiation has a positive correlation withwater temperature in spring but a negative correlation in summer due to the
i

increased runoff. The years 2003-2012 have shown water temperatures topeak between 1 April and 12 May, up to 2 months prior to radiation peaks.The implications of these findings are that water quality will deteriorate asstream flow decreases.
ii

Contents
Abstract i
List of tables iv
List of figures v
Acknowledgements ix
Declaration x
1 Introduction 11.1 Background . . . . . . . . . . . . . . . . . . . . . . . . . . . . 11.2 Climate change in the Alps . . . . . . . . . . . . . . . . . . . . 31.3 Glacier albedo . . . . . . . . . . . . . . . . . . . . . . . . . . . 5
1.3.1 Stream albedo . . . . . . . . . . . . . . . . . . . . . . . 51.4 Biological processes . . . . . . . . . . . . . . . . . . . . . . . . 61.5 Chemical Processes . . . . . . . . . . . . . . . . . . . . . . . . 71.6 Aim . . . . . . . . . . . . . . . . . . . . . . . . . . . . . . . . 81.7 Thesis outline . . . . . . . . . . . . . . . . . . . . . . . . . . . 9
2 Controls on stream temperature 102.1 Introduction . . . . . . . . . . . . . . . . . . . . . . . . . . . . 102.2 Stream temperature and flow regimes . . . . . . . . . . . . . . 102.3 Energy inputs . . . . . . . . . . . . . . . . . . . . . . . . . . . 142.4 Predicting stream temperature . . . . . . . . . . . . . . . . . . 152.5 Morphology of glacial rivers . . . . . . . . . . . . . . . . . . . 162.6 Overview . . . . . . . . . . . . . . . . . . . . . . . . . . . . . . 172.7 Hypotheses and objectives . . . . . . . . . . . . . . . . . . . . 17
3 Methodology 193.1 Introduction . . . . . . . . . . . . . . . . . . . . . . . . . . . . 19
iii

3.2 Selection of study area . . . . . . . . . . . . . . . . . . . . . . 193.3 Data acquisition . . . . . . . . . . . . . . . . . . . . . . . . . . 213.4 Data analysis . . . . . . . . . . . . . . . . . . . . . . . . . . . 22
4 Results 234.1 Annual trends . . . . . . . . . . . . . . . . . . . . . . . . . . . 234.2 Diurnal variation . . . . . . . . . . . . . . . . . . . . . . . . . 43
5 Discussion 505.1 Seasonal trends . . . . . . . . . . . . . . . . . . . . . . . . . . 505.2 Diurnal trends . . . . . . . . . . . . . . . . . . . . . . . . . . . 545.3 Stream morphology and topography . . . . . . . . . . . . . . . 555.4 Future implications . . . . . . . . . . . . . . . . . . . . . . . . 56
6 Conclusion 616.1 Future regimes and further research . . . . . . . . . . . . . . . 62
References 63
iv

List of Tables
3.1 Basin characteristics of the chosen study area, basin area (%)and basin glaciated (%). . . . . . . . . . . . . . . . . . . . . . 20
4.1 Mean radiation (W m−2) in Zermatt for the period 2003-2012. 244.2 Monthly percentage of total radiation and discharge for the
year 2012. . . . . . . . . . . . . . . . . . . . . . . . . . . . . . 244.3 Statistics of hourly discharge (m3s−1) of Massa for the period
2003-2012. . . . . . . . . . . . . . . . . . . . . . . . . . . . . . 254.4 Statistics of hourly water temperature (◦C) of Massa for the
period 2003-2012. The minimum temperature has not beenincluded due all the observed years experiencing minima of0 ◦C . . . . . . . . . . . . . . . . . . . . . . . . . . . . . . . . 26
4.5 Monthly minimum, maximum, range and standard deviationof water temperature (◦C) for the months March- October 2012. 34
4.6 Annual total discharge (106 m3) for the years 2003-2012 andthe daily total of discharge from the day at which water tem-perature begins to decrease from the annual peak. With thepercentage of the annual total added. . . . . . . . . . . . . . . 38
4.7 Total discharge (106m3) from the January 1 up until the daywater temperature decreases and the percentage of the annualtotal. . . . . . . . . . . . . . . . . . . . . . . . . . . . . . . . . 39
v

List of Figures
1.1 Retreat of Gornergletscher. Bottom image 1880s, top 2014(source: World View of Global Warming, 2015). . . . . . . . . 2
1.2 Annual temperature anomalies (◦C) between 1901 and 2004in Switzerland and the Northern Hemisphere (Rebetez andReinhard, 2008). . . . . . . . . . . . . . . . . . . . . . . . . . 4
1.3 Annual Swiss Alps mean air temperatures (◦C) for the period1900-2003 (Zemp et al., 2006). . . . . . . . . . . . . . . . . . . 4
1.4 Relationship between discharge (m3s−1) and albedo (α) in aproglacial stream draining from Place Glacier, Canada (Han,1997). . . . . . . . . . . . . . . . . . . . . . . . . . . . . . . . 6
1.5 Relationship between electrical conductivity (uS/cm) and dis-charge (m3s−1)in a proglacial Alpine stream (Dzikowski andJobard, 2012). . . . . . . . . . . . . . . . . . . . . . . . . . . . 8
2.1 Development of subglacial drainage system (a) May-June, (b)July and (c) August-September (Brown, 2002). . . . . . . . . 12
2.2 Average diurnal runoff (mm h−1) curves for 5 months of aglacial river in the Austrian Alps (Milner & Petts, 1994). . . . 13
2.3 Factors controlling stream temperature, black arrows repre-senting associations with water exchanges (Moore et al., 2005). 15
3.1 Map of Switzerland with Aletschgletscher basin and gauginglocations. Zermatt also shown (Collins & Taylor, 1990). . . . . 21
4.1 Seasonal variation of discharge (m3s−1) as the black series andwater temperature (◦C) as the blue series of the Massa for theyears 2003 (a) to 2012 (j). . . . . . . . . . . . . . . . . . . . . 32
4.2 Seven day average of Massa water temperature (x20 ◦C) inblue, Zermatt radiation (W m−2) in red and discharge (m3s−1)in black of the year 2012 with the dashed line representing thesummer solstice. . . . . . . . . . . . . . . . . . . . . . . . . . . 33
vi

4.3 Daily average of hourly water temperature (◦C) in blue anddischarge (m3s−1) in black for the Massa between the Juliandays 91 and 152, 2012. . . . . . . . . . . . . . . . . . . . . . . 35
4.4 Daily average of hourly shortwave radiation (W m−2) with li-nes added to highlight the increase of radiation over the periodbetween the Julian days 91 and 152, 2012. . . . . . . . . . . . 36
4.5 Daily average of hourly water temperature (◦C) in blue anddischarge (m3s−1) in black between the Julian days 91 and152, 2003-2012. . . . . . . . . . . . . . . . . . . . . . . . . . . 37
4.6 Daily average of hourly shortwave radiation (W m−2) betweenthe Julian days 91 and 152, 2003-2012. . . . . . . . . . . . . . 38
4.7 Hourly variations of discharge (m3s−1) (black) and water tem-perature (◦C) (blue) between the Julian days 285 and 298,2012. . . . . . . . . . . . . . . . . . . . . . . . . . . . . . . . . 40
4.8 Hourly variations of radiation (W m2) (red) and water tem-perature (◦C) (blue) between the Julian days 110 and 117,2012. . . . . . . . . . . . . . . . . . . . . . . . . . . . . . . . . 41
4.9 Hourly variations of radiation (W m2) (red) and water tem-perature (◦C) (blue) between the Julian days 150 and 158,2012. . . . . . . . . . . . . . . . . . . . . . . . . . . . . . . . . 42
4.10 Hourly variations of discharge (m3s−1) between the Julian days110 and 117, 2012. . . . . . . . . . . . . . . . . . . . . . . . . 42
4.11 Hourly variations of discharge (m3s−1) between the Julian days150 and 158, 2012. . . . . . . . . . . . . . . . . . . . . . . . . 43
4.12 Hysteresis plots of the hourly diurnal variation of water tem-perature (◦C) and discharge (m3s−1). Each graph at weeklyintervals between the dates 14 May and 4 June 2012. 14 May(A), 21 May (B), 28 May (C) and 4 June (D). . . . . . . . . . 45
4.13 Diurnal variation of water temperature (◦C), discharge (m3s−1)and shortwave radiation (W m−2), for 26 April 2012. . . . . . 47
4.14 Hysteresis plots of shortwave radiation (W m2) and water tem-perature (◦C) for the dates 26/04/2012 (a) and 03/07/2012(b). Key times and arrows added to indicate temporal variation. 48
4.15 Hysteresis plot of diurnal variation of water temperature (◦C)and discharge (m3s−1) for 14 May 2012 of the Massa, with thedirection of the series represented by the arrows. . . . . . . . . 49
5.1 Schematic representation of monthly variations of water tem-perature, discharge and radiation. With the point of the sum-mer solstice added. . . . . . . . . . . . . . . . . . . . . . . . . 53
vii

5.2 Plot of the hourly discharge (m3s−1) and water temperature(◦C) for Massa 2012. . . . . . . . . . . . . . . . . . . . . . . . 54
5.3 Satellite image of the upper reach of Massa demonstratingareas of topographical shading 04/10/2009 (GoogleEarth, 2017). 56
5.4 Annual mean temperature (◦C) in Switzerland from 1864 to2015. Shown are the mean values of the individual years(black) and the smoothed curve (red) (Meteosuisse, 2016). . . 57
5.5 Schematic diagram of the transient snowline movement deter-mining the proportion of the basin that receives snowfall orrain (Collins, 1998). . . . . . . . . . . . . . . . . . . . . . . . . 58
5.6 Schematic diagram of the relationships between energy input,water temperature and discharge in a river draining from anAlpine glacier (Collins, 2009). . . . . . . . . . . . . . . . . . . 59
5.7 Thought experiment to show how temperature increases throughtime coupled with declining ice area might first increase andthen reduce discharge from the ice-covered area of a basin(Collins et al., 2013). . . . . . . . . . . . . . . . . . . . . . . . 60
viii
Acknowledgements
Firstly I wish to express my deepest gratitude to the late Professor DavidN. Collins whom without it would not have been possible to complete mystudies. His enthusiasm and dedication to the study of Alpine environmentsis what motivated me to remain at the University of Salford and continuemy studies under his guidance. I am forever thankful for the memories andfriendship shared with David.
Also I’d like to thank my supervisor Dr Neil Entwistle for his assistance inhelping the completion of my research and also the contribution to manymemorable trips. Many thanks also to Dr Rob Williamson and my fellowpost-graduate Kirk Larsen for having the time and patience to assist me andoffer guidance throughout my time as a student. Finally I’m thankful forthe support from my family and friends throughout these two challengingyears.
ix

Declaration
This is to certify that the copy of my thesis, which I have presented forconsideration for my postgraduate degree embodies the results of my owncourse of research, has been composed by myself and has been seen by mysupervisor before presentation.
Signature Date
x
1
Introduction
1.1 Background
Air temperature in the European Alps has risen by a mean annual totalof 2 ◦C during the 20th century, which is approximately twice the warmingrate of the northern hemisphere annual average (Gobiet et al., 2014). Theprimary impact of this increased warming is the retreat of Alpine glaciers; anestimated 50% of the original glacier volume has vanished since the end ofthe Little Ice Age in 1850 (Wegmann et al., 1998). This is of great concernas more than one-sixth of world’s population rely on glaciers/ seasonal snowpacks for their fresh water supply (Barnett et al., 2005). Figure 1.1 showsan example of the extent to which Alpine glaciers have retreated betweenthe 1880s and the present decade. The particular glacier in the example isGornergletscher.
Knowledge concerning the impacts of climate change on Alpine hydrologyand the dynamics of proglacial streams is key to the understanding of waterquality and future implications of glacial retreat. High mountainous stre-ams are ideal study areas for the effects of climate change on water qualitydue to these systems having little to no human interference and reflect analmost complete natural river system. Water temperature is a major fac-tor of stream quality. Numerous physical, chemical and biological processesin aquatic systems are driven by temperature (Brown and Hannah, 2008).Stream temperature has a major control on aquatic habitat due to it’s influ-ence on species distributions, dissolved oxygen concentrations and the growthand also the development rate of organisms (Webb et al., 2008). Hari et al.,(2006) found a strong correlation between the increase of water and air tem-
1

Figure 1.1: Retreat of Gornergletscher. Bottom image 1880s, top 2014(source: World View of Global Warming, 2015).
perature in Alpine basins and the sharp decline of brown trout populationsin Western European streams. Findings such as these show how crucial wa-ter temperature is on the quality of aquatic habitats. As well as a majorwater quality parameter, stream temperature is also a key indicator of thewater source as each has specific thermal characteristics (Brown et al., 2006).Irrespective of discharge, meltwater exits the glacier around 1 ◦C; however,warming downstream is driven by energy input and flow. Proglacial streamshave displayed fast responses to meteorological forcing making water suscep-tible to changes downstream (Magnusson et al., 2012) and radiation fluxesaccount for more than 70% of heat input. With the exception of shaded stre-ams radiation is the primary driver of summer water temperature variabilityand therefore stream albedo has the potential to be a significant influence onheat inputs. Shortwave radiation increases with altitude due to the reductionof clouds, ozone, aerosols and air molecules and as a result the Alps possessone of the highest UV radiation levels in Europe (Schmucki and Philipona,2002).
Albedo is the reflectance of a surface, and in water it is known to varywith turbidity, aeration, suspended sediment concentration, algae and theroughness of stream surface (Cogley, 1979; Webb et al., 2008). Howeverit is largely dependent on the angle of radiation input. Albedo of water istherefore a function of latitude (Cogley, 1979). Leach and Moore (2010)measured albedo of a low gradient stream between 0.05 and 0.1; however thetype of mountain stream focused in this thesis are of higher gradient and
2

flow in bouldered channels where water becomes increasingly aerated.
1.2 Climate change in the Alps
The Alps are highly sensitive to climatic warming in comparison to the restof the Northern Hemisphere. Figure 2.1 compares the annual temperatureanomalies in Switzerland and the northern hemisphere between 1901- 2004.Monthly mean temperatures were gathered from 12 weather stations in Swit-zerland and then homogenised (Rebetez and Reinhard, 2008). From 1980there is a clear period of enhanced warming in both data sets however theSwiss series has an accelerated rate of increase. Gehrig-Fasel et al., (2007)highlighted this accelerated warming through the analysis of measurementsfrom 24 MeteoSuisse weather stations situated between 1650-2450m, Figure2.2 shows the annual mean temperatures (◦C) steadily increasing from 1900through to 2003 the bold black line representing the 10 year mean. There area variety of fluctuations during this period with a general pause from 1960-1980 before there is a steep increase. This thesis focuses on measurementsacquired only between 2003-2012, this period is too short to display any longtime temperature changes.
Air temperature and precipitation are the two greatest climatic factors influ-encing the health of a glacier (Zemp et al., 2006). The scenario presented byZemp et al., (2006) predicts Alpine glaciers to completely disappear withindecades as much of the ice is located below 3000m a.s.l. Negative glaciermass-balance in the Alps is resulting in a reduction of glacier and snow-meltcontributing to Alpine streams with groundwater becoming a major source(Brown et al., 2007). This shift in water sourcing has a significant effecton the water chemistry and biology as groundwater is solute rich and has ahigher temperature in comparison to snow and ice melt water.
3

Figure 1.2: Annual temperature anomalies (◦C) between 1901 and 2004 inSwitzerland and the Northern Hemisphere (Rebetez and Reinhard, 2008).
Figure 1.3: Annual Swiss Alps mean air temperatures (◦C) for the period1900-2003 (Zemp et al., 2006).
4

1.3 Glacier albedo
Climatic warming in the Swiss Alps has resulted in a decrease of snow days(Ceppi et al., 2012; Marty, 2008; Scherrer et al., 2004). The amount ofsnowfall in the winter months determines the temperature and duration ofthe following spring and summer due to the SAF effect. Surface albedo withinthe basin increases with a higher amount of snowfall. If the previous winterwas mild, experiencing reduced snowfall, water temperatures are expectedto be lower in the following months. This occurs as the ablation season willbegin earlier due to less snow reflecting incoming radiation and increasingthe rate of glacier ice melt. Furthermore the higher and sooner the transientsnowline rises the longer and larger area of ice and snow there is to melttherefore increasing runoff. Additionally as the snowline elevation increasesthe greater the area in which precipitation falls as rainfall increases (Collins,1998; 2009).
1.3.1 Stream albedo
Richards and Moore (2011) addressed the dependence of stream albedo ondischarge at a study site downstream of Place Glacier, Canada in a relativelylow gradient step pool in a boulder dominated channel. A positive correla-tion between discharge and albedo was found (Figure 1.4) during this studyperiod. This was consistent with the study hypothesis of increasing aerationinfluencing the albedo of the water surface. Stream surface albedo increasedfrom around 0.1 (10% reflected) at lower flows to 0.4 (40% reflected) at higherflows. Due to Alpine glaciers retreating, discharge will soon reach a tippingpoint and begin to decrease due to reduced glacial mass. Therefore bearingthese findings in mind albedo will begin to decrease and water temperatureswill rise. However the effect of suspended sediment and its role on albedohas not been addressed, which could be of importance as suspended sedimenthas demonstrated to increase water albedo further (Han, 1997).
5

Figure 1.4: Relationship between discharge (m3s−1) and albedo (α) in aproglacial stream draining from Place Glacier, Canada (Han, 1997).
1.4 Biological processes
Proglacial streams are a severe environment highly characterised by the se-diment load and water temperature. Steffan (1971) outlined that habitats inrivers sourced from glaciers are considerably different from other fresh waterhabitats and he therefore placed them in a distinct biotope termed kryal.Water temperature has the influence to render the river catchment a suit-able habitat for native species. The control temperature has on biologicalprocesses is immense, as it directly influences physiology, metabolic rates ofaquatic species and the nutrient cycle process (Fisher, 1995). As previouslydiscussed in section 1.1, there has been a noticeable correlation between thecatchment of brown trout in Western European Alpine rivers and rising airtemperatures in the late 20th century. Hari et al., (2006) discussed that dueto water temperatures increasing, brown trout have declined as habitats arebeing pushed upstream to cooler climates; however this movement has beenblocked by typical Swiss Alpine streams on average possessing 1-2 verticalbarriers with drops of 15cm or more every 100m. This loss of habitat is a ma-jor contribution to their population decline and displays the fragile nature ofaquatic habitats when water temperature changes (Hari et al., 2006).
In terms of biota in proglacial streams these are mainly in the form of micro-
6

organisms such as bacteria dominated biofilms (Battin et al., 2001; Rott etal., 2006). These aquatic lifeforms also have a specific range of temperaturethat they can survive and so any change in this can restrict their habitat.Alpine proglacial stream discharge levels are directly influenced by the meteo-rological conditions, therefore with climate change the river thermal patternswill be altered affecting the sensitive biota (Poole and Berman, 2001). It isexpected that with the retreat of glaciers in the long term, stream tempera-tures will increase the composition of particles in the stream and the nutrientcycle rate (Milner et al., 2010).
1.5 Chemical Processes
Proglacial streams have three principal water sources with their own chemi-cal and thermal characteristics. These sources include precipitation, ice/snowmelt and groundwater. Glacier fed streams have high levels of suspended se-diment and solutes. Solute in the runoff is acquired from the atmospherein the form of precipitation, dry deposition and from chemical weatheringof subglacial and ice marginal rock (Bundi, 2009). Such reactions includesulphide oxidation and carbonation (Brown et al., 1994). Electrical con-ductivity is an efficient method of establishing the solute concentration ofrivers, thus the system from which the particular discharge has originated.Discharge sourcing from groundwater flow has a higher temperature thanglacier melt and is solute rich due to an increased residence time with theunderlying geology (Singh and Hasnain, 2002). Snow-packs influence Alpineriver basins to a high extent by controlling peak stream discharge in theearly summer due to retainment of meltwater in the ablation zone. Runoffresulting from snow-pack melt has a generally low level of suspended sedi-ment and a low temperature. In contrast glacier/ ice melt hosts a large levelof sediment yields which have been flushed out from newly exposed subgla-cial sediment (Bundi, 2009). The final source for Alpine proglacial streamsis precipitation. The chemical characteristics of this include a poor solutelevel and a high temperature.
Negative correlation exists between electrical conductivity and discharge, asdischarge increases solute concentration/ electrical conductivity decreasesdue to a higher volume of water diluting the solutes. Furthermore Col-lins (1979) explained this inverse relationship exists due to solute enrichedgroundwater being mixed with relatively solute free supraglacial water (seeFigure 1.5). As discussed groundwater has a higher temperature and solute
7

concentration than snow and ice melt. Understanding water sources of Al-pine streams and rivers is key especially in regions such as Switzerland thatdepend on hydropower for much of their energy. High solute concentrationcan affect these dam systems by eroding components such as turbines anddepositing sediment, disrupting the mechanical processes of the dams. Wil-liams et al., (2016) expressed the importance of understanding the soluteconcentration of rivers through models so as to predict the extent of ero-sion in the hydroelectricity dam component. This knowledge is critical whendetermining whether a catchment is viable for an efficient hydroelectricityscheme or not.
Figure 1.5: Relationship between electrical conductivity (uS/cm) and dis-charge (m3s−1)in a proglacial Alpine stream (Dzikowski and Jobard, 2012).
1.6 Aim
The aim of this study is to determine the dominant controls currently ope-rating on water temperature in streams emerging from glaciers with a viewto predicting how such controls may change in a warming climate.
8

1.7 Thesis outline
This thesis is over six chapters. Chapter 1 comprises seven sections, the pri-mary focus of the chapter is the introduction and background of the currentunderstanding. The chapter concludes by outlining the aim and hypothesisesof the thesis.
Chapter 2 encompasses the controls on stream temperature in five sectionsalso including a section as an overview and highlights research gaps. Chap-ter 2 concludes with the objectives and hypotheses. Chapter 3 discusses themethod of acquiring the data used in the results and also the justificationof the chosen study area. The results are presented in Chapter 4 and areorganised in two sections; Annual trends and Diurnal variation. Chapter 5the Discussion outlines the key findings of the results and their importance.This chapter is organised into four sections; Seasonal trends, Diurnal trends,Stream morphology and topography and finally Future implications. To con-clude the thesis chapter 6 discusses whether the aims and objectives outlinedwere achieved and suggests future implications.
9

2
Controls on streamtemperature
2.1 Introduction
This chapter will address the controls on stream temperature and the typi-cal thermal and flow regimes of an Alpine proglacial stream using researchfrom previous studies. There are numerous factors that control stream tem-perature including albedo, meteorological parameters, stream morphology,level of discharge and water source. Flow regimes in glacierised basins arestrongly controlled by the glacier therefore the process of the drainage systemof Alpine glaciers has been explored.
2.2 Stream temperature and flow regimes
Stream temperature is a primary water quality parameter but the studyof interaction between stream temperature and flow is limited (Constantz,1998). In the Alps climate change is the main factor affecting water qualitybut not the only factor with land use evolution, deforestation and other hu-man activities also contributing to the degradation of water quality (Delplaet al., 2009). Meltwater exits Aletschgletscher at around 1 ◦C irrespective offlow, which creates a tongue of cold water extending from the glacier; as thewater flows across the proglacial basin it is heated and continues to warmfurther downstream. Alpine proglacial stream temperature varies diurnallyand seasonally due to numerous natural variables including air temperature,
10

precipitation, groundwater exchanges, discharge and solar radiation. Alpineproglacial streams often possess stretches of water with large surface area tovolume ratios and therefore reflect high diurnal variations in stream tempe-rature due to greater rate of penetration from solar radiation (Constantz,1998). Large seasonal variations in stream temperature are also to be ex-pected due to the wide range of solar radiation and air temperature regimesthat Alpine environments possess.
Flow regimes in glacierised catchments are strongly controlled by the glaciermass balance when basins are 20%+ glaciated. The generation of dischargefrom snow and ice melt generally is inverse to flow regimes of temperate flu-vial environments as maximum flow occurs in summer when precipitation islowest (Brown, 2002; Fountain and Tangborn, 1985). The volume of waterin the proglacial stream determines the length of time available for heat ex-changes as a higher volume of water increases velocity, which would thereforereduce interaction time a parcel of water has with the surrounding environ-ment (Brown et al., 2006). There is a great variation of discharge seasonallywith lower levels in the winter months due to glacier accumulation and pre-cipitation in the form of snow in contrast to spring and summer with highdischarge from the ablation period and precipitation falling as rain (Husset al., 2008). Groundwater possesses a higher temperature than meltwaterand so increased groundwater contributions to Alpine streams result in hig-her water temperatures, particularly in the winter and early spring whenmeltwater contribution is low (Milner et al., 2009).
In winter, precipitation in Alpine glaciated basins falls in the form of snowwith temperatures only getting high enough in spring to melt the snow-packs and ice. Snow does not have any immediate positive effect on runoffbut increases surface albedo of the glacier and the reattainment of water.Figure 2.1 shows the schematic representation of the seasonal developmentof subglacial drainage system in an Alpine glacier from the early melt sea-son in May and June (a), (b) July and through to (c) August- September(Brown, 2002). As radiation and air temperatures increase in early springthe ablation period begins, discharge does not respond immediately to thisincreased rate of melt due to much of the water being withheld by ice anddelayed by snow-packs, this lag time can extend into the summer months aswater is often held within subglacial pockets and ice dammed lakes (Collins,1984). The snow covered surface of the glacier in spring delays the melt wa-ter draining from the glacier and the conduit systems forming. In contrastprecipitation during summer can have an immediate effect on runoff as thereis little snow on the glacier and the subglacial drainage system has formedto efficiently release water from melt and rain. Rainfall on bare glacier ice
11

runs off almost immediately into the subglacial passages. Towards the end ofsummer, discharge decreases as the supply of subglacial and englacial waterhas been drained (Benn & Evans, 2014).
Figure 2.1: Development of subglacial drainage system (a) May-June, (b)July and (c) August-September (Brown, 2002).
The flow regime of Alpine proglacial streams also varies diurnally, particularlyin the ablation season as the discharge responds greatly to air temperatureand precipitation fluctuations (Fenn, 1985). The diurnal variation of glacialrivers in the melt season typically follows the regime of a late afternoon peakand a recession through the evening and night. Figure 2.2 shows the average24 hour runoff (mm h−1) curves over 5 months from a glacial river in the
12

Austrian Alps (Milner & Petts, 1994). This basin is 84% glaciated whichis significantly higher than the basin selected for the area of study in thisthesis; these curves display a clear transformation of runoff levels from May toAugust with little diurnal variation in May to a significant one in September.Daily discharge peaks often lag behind air temperature peaks by up to a fewhours (in the later ablation season) due to the distance meltwater has totravel through the subglacial drainage system (shown in Figure 2.1). Thislag time is extended in periods when the glacier is still covered with snowsuch as spring and the early months of summer as Figure 2.1(a) displays(Benn & Evans, 2014).
Figure 2.2: Average diurnal runoff (mm h−1) curves for 5 months of a glacialriver in the Austrian Alps (Milner & Petts, 1994).
13

2.3 Energy inputs
For many mountain glaciers shortwave radiation flux is the main energy in-put for ablation (Wagnon et al., 1999). This is greater for glaciers that havebeen retreating for sometime with the exposure of side moraines which de-posit dust and debris on the glacial ice reducing the surface albedo, which isthe case with most glaciers in the Alps (Oerlemans et al., 2009). Shortwaveradiation drives the biological and physical processes at the earth’s surfacewhile atmospheric components (aerosols, CO2, ozone, water vapour etc) in-teract with solar shortwave radiation by scattering or attenuating dependingon the concentration of gas and particulate matter in the atmosphere; suchinteractions result in atmospheric heating or re-radiated energy in the formof longwave radiation. Shortwave radiation peaks at solar noon in contrast tolongwave radiation which remains relatively constant (Lowney, 2000).
Recent studies on glacierised basins have revealed the complex thermal beha-viour of proglacial streams (Brown et al., 2006; Cadbury et al., 2008; Webbet al., 2008). Solar radiation is a crucial environmental factor in Alpine wa-ter due to the natural increase of ultraviolet radiation flux with elevation(Sommaruga, 2001). Figure 2.3 shows a schematic view of factors controllingstream temperature with the black arrows representing energy fluxes associ-ated with water exchanges (Moore et al., 2005). There is limited vegetationin the proglacial area to obstruct incoming solar radiation, then the onlyshading will be the topography or cloud cover. Topographical shading is amajor influence on proglacial streams in the Alps due to the steep banks andnarrow valleys that are typical in the region. Latitude also is a key factor in-fluencing shading as Canton Valais is situated at 46.1905◦ latitude thereforethe angle of the sun is fairly acute. Water exits the portal of Aletschgletscherat <1 ◦C (Collins, 2009), as the water flows downstream from the terminusthrough the proglacial field it is heated by solar radiation. Heat transferwithin river systems is complex, additional energy exchanges that influenceproglacial stream temperature include: channel friction, groundwater flow,condensation, evaporation, bed heat conduction and air temperature (Cais-sie, 2006).
Stream bed friction is also considered a primary energy source in proglacialstreams, this process is most prevalent in high gradient streams, the Massaand Gornera for example (Chikita et al., 2010). The surface area of thestream increases with discharge therefore bed friction is greater however theheat capacity of the stream has increased therefore friction remains at asteady level. A previous study at a proglacial stream fed by the Gulkan
14

Glacier, Alaska in the summer of 2006 resulted in net shortwave radiationand stream bed friction occupying ca.70% of the total thermal input to thestream (Chikita et al., 2010).
Figure 2.3: Factors controlling stream temperature, black arrows represen-ting associations with water exchanges (Moore et al., 2005).
2.4 Predicting stream temperature
The use of models that predict or simulate stream temperatures is beco-ming increasingly important. There are two categories of water temperaturemodels; statistical and deterministic. Statistical models are relatively simpleand require minimal data inputs while deterministic models require numerousinput data such as depth and velocity (Benyahya et al., 2007). An exampleof a simple energy balance equation is presented in Box 1 (Magnusson et al.,2012). The equation describes the downstream change of temperature 4T (◦C) over a stream reach length L(m) and average width w(m). Q (W m−2) is the heat flux across the stream surface c (J kg−1 K−1) the specific heatcapacity of the water, p (kg m−3) the water density. 4 z (m) the change ofaltitude from upstream reaches to downstream, gravitational acceleration g(m s−2), stream discharge as q (m3s−1) and residual temperature change as4T r(
◦C).
15

Box 1
4T(t) =Q(t)w(t)
q(t)
L
cp+g4zc
+ 4Tr(t)
This equation predicts how temperature will change on a stream reach as aresult of surface heat transfer and frictional heating. Surface heat exchangecools and warms the stream at a rate proportional to the heat flux, thelength of the stream and average width, and inversely proportional to dis-charge (Magnusson et al., 2012). Models predicting water temperature fromglaciers with a negative mass balance are proving to be of greater impor-tance as thermal and flow regimes are expected to be altered (Collins et al.,2013).
2.5 Morphology of glacial rivers
Fluvial processes of glacier-fed streams are characterised heavily by mor-phology. Typically the proglacial stream channel is braided in the outwashplain due to the high sediment load flushed from the glacier and aggrada-tion; these channels migrate laterally across the valley floor (Milner & Petts,1994). Hickin (1993) suggests that fluvial hydrosystems of glacial rivers havethree stages of progression:
1. Highly unstable, braided form, steeply graded and possesses a highwidth to depth ratio;
2. Wandering type with irregular sinuous, laterally mobile, often withsecondary channels separated by vegetated islands;
3. Relatively stable with a meandering single channel, high sinuosity anda reduced width to depth ratio.
Each stage resembles a different thermal regime. The first stage possesses ahigh width to depth ratio reach, which will have a lower heat capacity anda larger surface area of water in contact to with the environment, so heatingwill occur at a high rate here in comparison with the other stages. Down-stream vegetation increases, with this riparian shading reducing the directcontact with solar radiation and stream warming processes. Once the riverforms a single channel the surface area will decrease and heat capacity incre-ase reducing the rate of warming by meteorological parameters. Friction is
16

greater in wide shallow streams and less in narrower, deep streams. There-fore stream bed friction will be more dominant in stages 1 and 2 (Milner &Petts, 1994).
2.6 Overview
Previous studies expressed the complexities of proglacial streams and thebasin’s sensitivity to climatic warming (Cadbury et al., 2008; Collins, 2009;Webb et al., 2008). Shortwave radiation is the primary energy input of pro-glacial streams and is a controlling factor of runoff and water temperaturehowever there is limited research on the diurnal and seasonal variation ofwater temperature; discharge and their responses to radiation fluctuations.Alpine glaciers are in a period of accelerated retreat in response to increasingair temperatures. Understanding the seasonal and annual thermal characte-ristics of Alpine proglacial streams is important. The Alps have displayed asignificant response to climate change therefore the thermal regimes acrossthe seasons and years are to be observed as the effects temperature has onthe quality of water in terms of habitats and biota but also the dependencythat the region has on glacial and snow-pack melt as a fresh water source foragriculture, industry, consumption and hydroelectric purposes.
2.7 Hypotheses and objectives
The objectives of the thesis are as follow;
1. To analyse the diurnal, seasonal and annual variations of stream tem-perature and discharge in a year of high recorded shortwave radiationlevels.
2. To identify the level of flow in which stream temperature decreases.
3. To assess the control shortwave radiation has on stream temperature.
4. To understand why water temperature decreases in late spring andearly summer when radiation peaks.
The hypotheses for the thesis are listed below.
1. Stream temperature is warmest in spring when discharge is low andshortwave radiation is high.
17

2. Discharge is the primary control on alpine stream temperature.
3. A paradoxical relationship exists between stream temperature and short-wave radiation.
18

3
Methodology
3.1 Introduction
The primary control of stream temperature will be identified through radia-tion, water temperature and discharge measurements. It would be expectedthat as solar radiation levels peak during the ablation season, water tempe-rature would also peak. The ablation season shall be under close scrutiny inorder to understand the transforming relationship between water tempera-ture and discharge as radiation rises.
3.2 Selection of study area
The basin of the river Massa was selected for study. Table 3.1 displaysthe characteristics of this basin. This river is situated close to Zermatt,a town located in the Central Swiss Alps of the Canton of Valais at thesouthern end of the Matter Valley (MeteoSwiss). Zermatt is also the locationin which shortwave radiation levels are recorded. The European Alps areone of the most intensively studied mountain ranges in the world (Haeberli& Beniston, 1998) and this region provides access to multiple weather andgauging stations which are situated at a variety of elevations with areasof permanent and seasonal snow cover. Decades of data are also availablebecause of the continuous monitoring undertaken by numerous researchers.The Massa has been chosen as the Aletschgletscher is the most voluminousglacier in the Alps and is an indicator of long-term climate trends as it isnot sensitive to short-term climate fluctuations in which smaller glaciers in
19

Table 3.1: Basin characteristics of the chosen study area, basin area (%) andbasin glaciated (%).
River Basin area (km2) Basin glaciated (%)
Massa 195 65.9
the Alps have shown; such as the period of advance in the 1920s and 1980s(Jouvet et al., 2011).
The climatic conditions in the Matter valley have a continental character withlow precipitation and high-radiation budgets (Randin et al., 2009). Averageannual precipitation is only approximately 475 mm, which is one of the lowestin Switzerland. This low precipitation is due to the valley surrounded byhigh peaks that often exceed 4,000m a.s.l. in elevation (Hill, 2012). CantonValais therefore is extremely reliant on glacial melt as a fresh water sourcethus studying the quality of this water and the forces controlling it is highlyimportant.
The river Massa draining from Aletschgletscher is the primary focus of thestudy. Aletschgletscher is the largest glacier in the Alps with the basinmeasuring 195km2, 65.9% of which is glaciated. The gauging station in whichthe water temperature and discharge measurements derive is situated 1458ma.s.l. (2.4km from the glacial portal), which is the lowest point of the basinthat ranges up to Aletschhorn at 4194m a.s.l. The mean annual runoff (1957-2005) of the basin is 2.112m (Collins, 2008). The river is approximately 7kmlong and passes through the Massa gorge and onwards into the Rhone.
The basin areas (km2) and total glaciated area of the basin (%) for the studyareas are shown in Table 1.1. Almost two thirds of Massa’s basin is glaciatedand it is Alpine and high Alpine in character it is also classed as a hydrologicalresearch basin by the Swiss National Hydrological and Geological Survey andtherefore human interference is minimal (Braun and Renner, 1992). Figure3.1 display maps of the study basins and region with the gauging stationsadded.
20

Figure 3.1: Map of Switzerland with Aletschgletscher basin and gauginglocations. Zermatt also shown (Collins & Taylor, 1990).
3.3 Data acquisition
Hydrological data was gathered from the Swiss Federal Office of the Envi-ronment (FOEN); this method of data allows in depth analysis as it is ata high resolution and measurements are collected on the hour everyday forthe whole year from a gauging station situated on the river. Local shortwaveradiation data was not available at the Massa river site and therefore hourlymeasurements from Zermatt have been used. The possible implications ofthe unavailability of local shortwave radiation measurements to the Massa isthat it will not express the true levels of radiation of the basin as the basinis situated at a higher altitude and approximately 45km away from Zermatt;however the radiation data will still show the temporal variations at a regi-onal scale. Continuous hourly data is also available for the years 2003-2012which allows precise comparisons and time series with water temperature
21

and discharge.
3.4 Data analysis
The years 2003-2012 are analysed since there are complete and continuousannual records of radiation, water temperature and discharge measurements.Hourly measurements of discharge at Massa were processed into annual datasets for the calendar years 2003-2012 by manually selecting and separatingdata recorded into different years. Annual trends are analysed by calculatingthe mean, maximum, minimum and standard deviation of water temperatureand discharge in order to assess trends between the parameters. This methodof analysis has been used by Brown et al., (2006). Annual mean radiationwill be analysed to signify the years with the highest and lowest totals. Anobjective is to analyse seasonal runoff and thermal regimes of the Massa,which is achieved by hydrographs of water temperature and discharge similarto those of Collins (2009); however both parameters are plotted on the samegraph for a clearer illustration of potential relationships. The year 2012 ischosen to analyse seasonal, diurnal and daily measurements in depth as thisis the most recent year with complete data available. Moreover previousstudies have not analysed a year as recent as 2012. Seasonal radiation also isanalysed, however this has high hourly fluctuations and therefore is processedinto a series of weekly means so it can be compared with discharge andtemperature.
Brown et al., (2006) analyses hourly air temperature and water temperatureover a weekly period, the same method of analysis is used in this thesis;however using shortwave radiation measurements not air temperature. Thiswill contribute to the objective of understanding the diurnal and daily re-lationship between radiation and water temperature and also the controlthat radiation has on water temperature. To understand the level of flow atwhich stream temperatures cease to surge and decrease from the peak willbe achieved by analysing the daily average water temperatures and outliningthe point at which the decrease begins. This analysis will also contributeto the understanding why stream temperature decreases in late spring andearly summer when radiation peaks.
22

4
Results
Annual, seasonal and diurnal analysis of radiation, discharge, water tempe-rature from the Massa river are presented in this section.
4.1 Annual trends
The average annual radiation for the years 2003-2012 is shown in Table 4.1.2012 has the highest average radiation with 2004 having the lowest. As 2012has the highest average annual radiation for the recorded years and is thelatest year with complete data it shall be the year chosen to have furtheranalysis. The monthly percentage of the total annual radiation for 2012is displayed in Table 4.2. May, June, July and August have the highestpercentages, with the year having 50.11% of the years total radiation. Junehas the highest percentage of 13.05% and December with the lowest of 2.49%.It was expected that June would have the highest total radiation due to itbeing the month of the summer solstice (20 June). Seasonal radiation levelsfollow that of a typical mid-latitude region.
23

Table 4.1: Mean radiation (W m−2) in Zermatt for the period 2003-2012.
Year Mean
2003 162.452004 154.22005 157.752006 157.422007 158.72008 156.222009 164.192010 160.052011 161.782012 164.46
Table 4.2: Monthly percentage of total radiation and discharge for the year2012.Month % of total annual discharge % of total annual radiation
January 0.24 2.98February 0.16 5.89March 0.53 9.28April 0.89 10.45May 5.62 12.65June 19.93 13.05July 25.98 12.84August 28.72 11.57September 12.18 8.49October 4.24 5.89November 0.68 3.67December 0.37 2.49
Annual records of discharge from Massa were processed and analysed for theyears 2003 to 2012. Table 4.3 displays the mean annual discharge for eachof these years. 2003 has the highest total discharge out of the 10 observedyears; this year is recorded as a warm year due to central Europe suffering aheat wave. The all time Swiss heat record of 41.5 ◦C was set on 11 August,2003 (Met Office, 2015). Massa follows a typical runoff regime of a highlyglacierised Alpine basin. Between the months November and March dischargelevels are at the winter minima due to there being little to no meltwater and
24

precipitation falling primarily as snow. Maximum discharge occurs throughthe months June-September known as the ablation period. Table 4.2 showsthe percentage of the total annual discharge for each month in 2012 fromthe Massa, it has a typical flow regime of an Alpine glacial basin as 86.8%of the annual total discharge was in four months; June, July, August andSeptember with the winter months accounting for less than 10% of annualrunoff. August was the highest with 28.72% of the years discharge, Februarythe lowest with 0.16%. Mean annual water temperature for the years 2003to 2012 are show in Table 4.4. With the exception of 2010 there is a trend ofyears with higher discharge possessing lower water temperatures. The year2003 demonstrates this relationship having the highest average discharge andalso the lowest average water temperatures.
Table 4.3: Statistics of hourly discharge (m3s−1) of Massa for the period2003-2012.
Year Mean Min Max Std. Dev.
2003 20.2 0.15 118.95 28.212004 14.49 0.2 95.24 19.182005 15.5 0.22 106.29 21.022006 15.07 0.06 109.07 21.262007 15.64 0.35 102.12 18.452008 15.5 0.28 108.73 21.812009 16.6 0.15 91.85 21.452010 14.2 0.19 109.12 20.552011 16.44 0.21 122.3 202012 15.96 0.14 120.82 21.28
25

Table 4.4: Statistics of hourly water temperature (◦C) of Massa for the period2003-2012. The minimum temperature has not been included due all theobserved years experiencing minima of 0 ◦C
Year Mean Max Std. Dev.
2003 0.89 4.28 0.512004 0.92 4.4 0.542005 0.92 4.32 0.552006 1.22 2.81 0.622007 1.18 4.41 0.572008 1.21 5.02 0.552009 1.15 4.89 0.532010 1.07 3.88 0.512011 0.93 3.82 0.462012 0.98 4.62 0.52
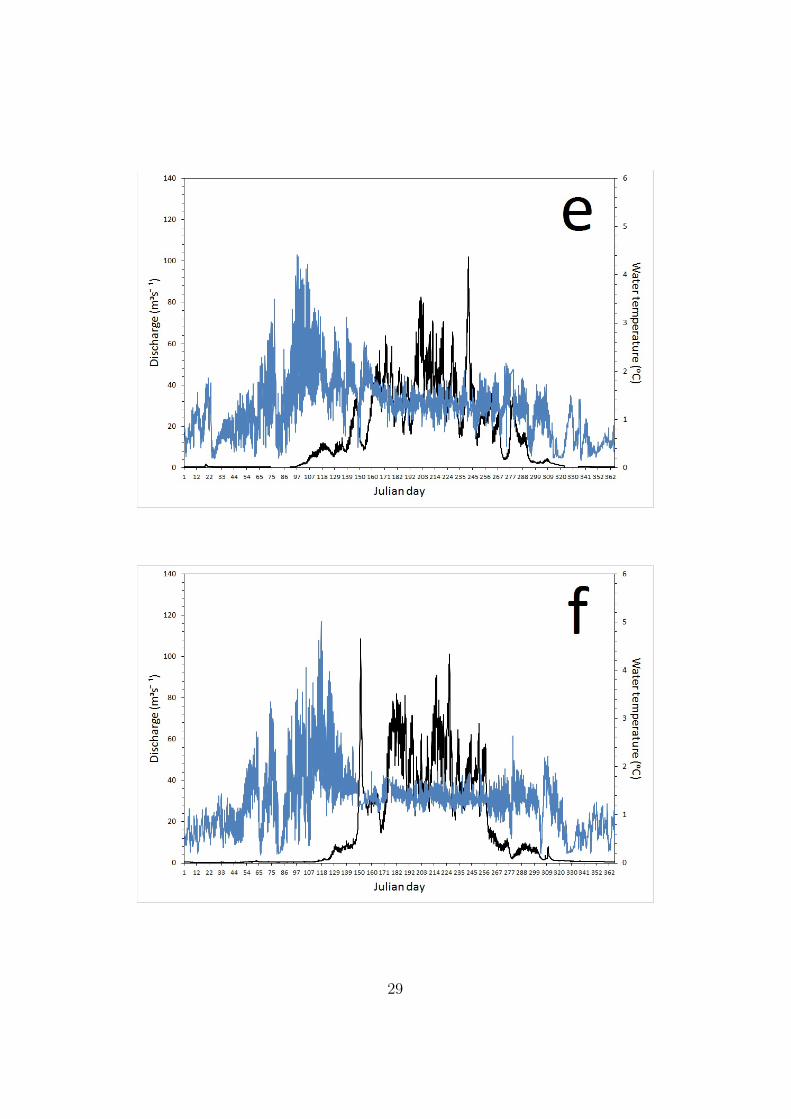
The seasonal hydrographs of water temperature (blue) and discharge (black)are shown on Figure 4.1 for the years 2003 (a) to 2012 (j). There is a similarpattern throughout the years with water temperature peaking between theJulian days 92 and 133. Figure 4.1 (j) displays the hourly data taken from theMassa, which illustrates the seasonal relationship between discharge (black)and water temperature (blue) over 2012. The hourly measurements for 2012have been processed into seven day averages as seasonal trends for watertemperature and discharge are to be analysed with radiation; which has ahigh diurnal range therefore this seven-day average smooths out the series fora clearer, clean observation. There is a clear apparent seasonal relationshipbetween discharge and water temperature which can be identified throughoutthe years. Typically discharge is low during the winter months until the lateablation period where it rapidly increases from 7.35 m3s−1 in to the peakof 120 m3s−1 in just 45 days. Discharge continues to increase through thesummer until early August when it peaks then rapidly decreases over 80days back to low levels of winter. Discharge decreases earlier than it wouldbe expected. Water temperature on the other hand peaks in early Maywhen discharge is still low, but from that point there is a gradual decreaseuntil the end of summer. There are distinctive warm water pulses in Marchand April which can be observed in Figure 4.1. The relationship betweenwater temperature and discharge follow that discussed previously in whichthe highest periods of discharge will show a response in water temperaturesdecreasing.
26

27

28
29

30

31

Figure 4.1: Seasonal variation of discharge (m3s−1) as the black series andwater temperature (◦C) as the blue series of the Massa for the years 2003 (a)to 2012 (j).
Analysing the relationship between seasonal water temperature, dischargeand radiation is a key objective. The year 2012 was observed in depth dueto it possessing the highest total radiation over the years and it is the mostrecent year with complete data (see Table 4.1). Hourly data has been pro-cessed into weekly averages to give a smoother series (Figure 4.2). The pointof the summer solstice has been added also to outline the longest day of theyear in terms of daylight. There is a clear curve in the radiation series acrossthe year with the peak in the week of the summer solstice, which was ex-pected. In contrast water temperature peaks in late April, two months priorto radiation as it would be expected that a strong positive correlation wouldexist between these two parameters due to radiation being a major energyinput in proglacial streams. This negative correlation occurs across ablationseason as radiation is at its highest, and then water temperature graduallydecreases after its peak. There is little response to these high radiation levelsuntil the week of Julian day 287 where water temperature decreases at ahigher rate back to the winter minima.
32

Figure 4.2: Seven day average of Massa water temperature (x20 ◦C) in blue,Zermatt radiation (W m−2) in red and discharge (m3s−1) in black of the year2012 with the dashed line representing the summer solstice.
The monthly maximum, minimum, range and standard deviation of watertemperature (◦C) for March-October 2012 for the Massa have been processedfrom hourly measurements (Table 4.5). The lowest maximum temperaturesoccur in June, July and August, which are regarded as the peak of theablation season due to the highest temperatures. Additionally, these monthshost the lowest range which signify little diurnal variation in temperature.The highest maximum temperature and range occur in April, which is in theearly ablation season; temperature and radiation have only begun to increase.With the range being so high this shows the month possesses a high diurnalvariation in water temperature. This month shall be under close observationto analyse the diurnal variation between water temperature, radiation anddischarge.
The seasonal relationship between discharge and radiation is more apparentas Figure 4.2 illustrates. This graph has been constructed with hourly mea-surements processed into weekly averages. As discussed radiation (red) peaks
33

in the week of the summer solstice which in 2012 was 20 June. In comparison,discharge has a greater rate of increase seasonally than radiation, with levelsstaying around the winter minima until mid-April in which the increase be-gins. Radiation however has a gradual rise beginning late January, with theseasonal curve clearly evident. A lag-time exists between these two parame-ters with the highest radiation values occurring prior to the peak discharge.Furthermore discharge is still climbing during the summer solstice and doesnot reach its peak until approximately 50 days later. Peak discharge for thisyear occurs when radiation is on the decrease, which shows that there is notan immediate response from discharge to radiation.
Table 4.5: Monthly minimum, maximum, range and standard deviation ofwater temperature (◦C) for the months March- October 2012.
Month Max Min Range Std. Dev.
March 2.79 0.14 2.65 0.47April 4.62 0.53 4.19 0.61May 2.35 0.5 1.84 0.37June 1.68 0.85 0.83 0.15July 1.57 0.75 0.82 0.14August 1.73 0.78 0.95 0.18September 1.74 0.64 1.11 0.2October 2.12 0 2.12 0.42
An objective was to understand why water temperature decreases in theperiod when radiation is high. Water temperatures surge during the earlyablation season. Figure 4.3 shows the daily average water temperature anddischarge between the Julian days 91 and 152, which have been selected asthis is the period in which discharge increases from its winter minima. Inthe period between days 91 and 116 there are large fluctuations in watertemperature, but here in contrast discharge varies little and remains at alow level. Discharge begins to rise from the days 117 to 122, in responseaverage daily water temperature decreases from 2.33 ◦C to 1.25 ◦C in just aperiod of 4 days. The trend is repeated as rising discharge shows a potentialrelationship with decreasing water temperatures; however temperature incre-ases as discharge decreases from the peak on Julian day 122, average dailydischarge decrease from 6.78 m3s−1 to 3.67 m3s−1 on day 128, in the sameperiod water temperature increases from 1.36 ◦C to 1.84 ◦C. Towards the endof the observed period this trend is recognisable further, in this time framewater temperature does not surge. Furthermore stream temperature begins
34

to decrease as discharge continues to rise. Average daily radiation for thesame period is shown in Figure 4.4, while there is much daily variation thereis a clear steady increase as the added lines show. There does not appear tobe a correlation with water temperature as expected.
Figure 4.3: Daily average of hourly water temperature (◦C) in blue anddischarge (m3s−1) in black for the Massa between the Julian days 91 and152, 2012.
35

Figure 4.4: Daily average of hourly shortwave radiation (W m−2) with linesadded to highlight the increase of radiation over the period between theJulian days 91 and 152, 2012.
In order to determine if the trends in Figures 4.3 and 4.4 were consistent forall the years between 2003-2012 the same analysis is demonstrated in Figure4.5 and 4.6 but this has been produced with the hourly measurements for allthe years 2003-2012 averaged to form a daily basis. There is less variationin the series which produces recognisable trend between discharge and watertemperature. The tipping point at which water temperature stops increasingand then begins to decrease on Julian day 116 which in a regular year isApril 26th. At this tipping point the discharge level is 3.54m3s−1. Radiationhowever is still steadily rising throughout this period (Figure 4.6).
The level of discharge at which stream temperatures cease to surge and de-crease from the peak were determined by analysing the daily average watertemperatures and outlining the point at which the decline begins. The totalrun off from that day and the annual total run off were calculated. Table 4.6displays these results with the percentage of the annual total at which thedaily total amounts. The highest percentages are in the years 2012 and 2006with the lowest in 2008 and 2003. Water temperatures in 2008 decreasedfrom the peak with only 0.02% of the annual discharge for that day while in
36

comparison 0.16% of the annual discharge was needed for water temperaturesto respond in 2012. The percentage of the annual total discharge at whichwater temperatures decrease is shown in Table 4.7 for the years 2003-2012,which was calculated by the sum of the discharge from the start of the yearup until the day stream temperatures decreases from the peak and cease topulse.
Figure 4.5: Daily average of hourly water temperature (◦C) in blue anddischarge (m3s−1) in black between the Julian days 91 and 152, 2003-2012.
37
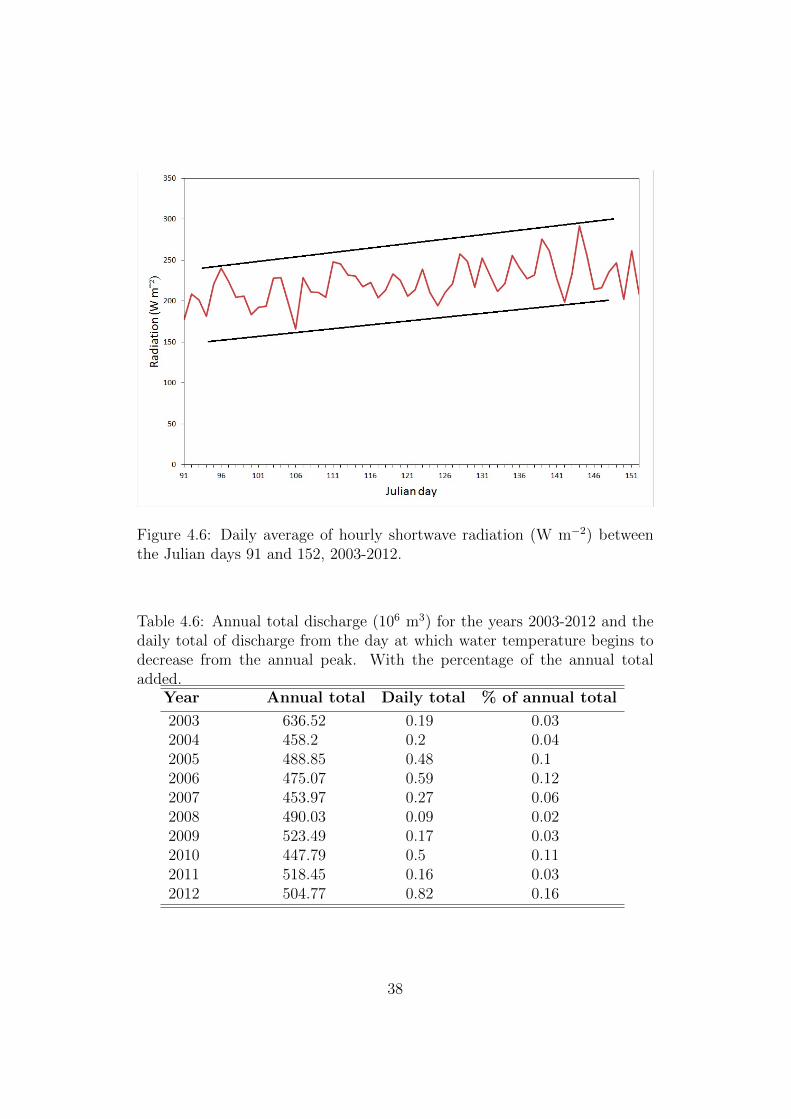
Figure 4.6: Daily average of hourly shortwave radiation (W m−2) betweenthe Julian days 91 and 152, 2003-2012.
Table 4.6: Annual total discharge (106 m3) for the years 2003-2012 and thedaily total of discharge from the day at which water temperature begins todecrease from the annual peak. With the percentage of the annual totaladded.
Year Annual total Daily total % of annual total
2003 636.52 0.19 0.032004 458.2 0.2 0.042005 488.85 0.48 0.12006 475.07 0.59 0.122007 453.97 0.27 0.062008 490.03 0.09 0.022009 523.49 0.17 0.032010 447.79 0.5 0.112011 518.45 0.16 0.032012 504.77 0.82 0.16
38

Table 4.7: Total discharge (106m3) from the January 1 up until the day watertemperature decreases and the percentage of the annual total.
Year Total prior to water temp decrease % of annual total
2003 5.32 0.842004 9.02 1.972005 8.42 1.722006 7.98 1.682007 4.43 0.982008 4.68 0.962009 7.24 1.382010 6.42 1.432011 2.91 0.562012 13.79 2.73
The Massa experiences warm pulses in the autumn and early winter (Figure4.1). The Julian days 285-298 were observed closely as this period possessedthe peak water temperatures for the post ablation season. The hourly variati-ons of discharge (black series) and water temperature (blue series) are shownin Figure 4.7. Discharge reduces at a high rate from 20.12m3s−1 for day285 to 2.51m3s−1 on day 290, while in response water temperature fluctuatesfrom 0.17 ◦C to 2.12 ◦C.
39

Figure 4.7: Hourly variations of discharge (m3s−1) (black) and water tempe-rature (◦C) (blue) between the Julian days 285 and 298, 2012.
The hourly variation of radiation and stream temperature beginning Julianday 110 (19 April) leading up to the peak of water temperature on Julian day117 (26 April) is shown in Figure 4.8. There is a potential pattern betweenboth series with a lag time of a couple hours between peak radiation andpeak stream temperature; however the daily maximum and minimum valuesexpress a relationship across the whole 8 days, suggesting that radiation isthe primary controller of stream temperature. For comparison the day ofpeak radiation and the preceding week was analysed at the same resolution.Figure 4.9 displays the hourly variation between water temperature and radi-ation for the Julian days 150-158. Radiation levels are higher, however watertemperature deviates little with a standard deviation of 0.16 compared to thedays 110-117 that has a standard deviation of 0.79. The discharge for theseperiods are shown in Figures 4.10 and 4.11, which illustrate that levels areconsiderably higher for the period 150-158 in comparison to 110-117 wherelevels demonstrate the winter minima. The data series for Figures 4.8 and4.9 were plotted with both axis values the same in order to demonstrate thedecrease of water temperatures during peak radiation. These results deter-mine radiation to be a major control of stream temperature in the ablationseason; contrastingly in the summer it has a reduced influence on stream
40

temperature.
Figure 4.8: Hourly variations of radiation (W m2) (red) and water tempera-ture (◦C) (blue) between the Julian days 110 and 117, 2012.
41

Figure 4.9: Hourly variations of radiation (W m2) (red) and water tempera-ture (◦C) (blue) between the Julian days 150 and 158, 2012.
Figure 4.10: Hourly variations of discharge (m3s−1) between the Julian days110 and 117, 2012.
42

Figure 4.11: Hourly variations of discharge (m3s−1) between the Julian days150 and 158, 2012.
4.2 Diurnal variation
The early ablation season is the principle focus of the research as streamtemperatures surge and peak whilst radiation levels are still low. The hourlymeasurements of water temperature and discharge were compared to assessthe transforming relationship over four weeks in 2012. Starting 14 May andending 4 June, four single days exactly a week apart from each other wereassessed. This period was chosen because average stream temperature beginsto decrease. Figure 4.12 display hysteresis plots for each of these days. Thefirst of the series shows a loop with a tall flat shape, there is little diurnalvariation in discharge with the range only 2.76m3s−1. In contrast there isa high variation in temperature ranging between 0.82-1.89 ◦C, over 1 ◦C oftemperature change in a single day. Out of the four days assessed 14 Maypossessed the highest temperature. The 21 May shows a similar shape to thatof the week before however with a much decreased range in water temperaturewith it only ranging between 1.12-1.52 ◦C. Also discharge is much lower, withthe peak of the day only 8.92m3s−1, with a range of only 1.13m3s−1. Graph(C), the third week of the observed period, still follows the trend of a thin,stretched loop. However, there is a clear increase of discharge with associated
43

diurnal variation. The mean discharge for this day is 20.39m3s−1 with a rangeof 4.58m3s−1. These values are much higher than the previous two weeks.The temperature of this day ranges from 1.06 ◦C to 1.57 ◦C, which is lowerthan the previous week and the range and maximum temperature are higher.However, on mean the hourly water temperature for the day is slightly coolerat 1.23 ◦C. Figure 4.12 (D) illustrates a sudden increase of discharge for thatday compared to the week before. The mean flow for the day is 38.51m3s−1,almost a 100% increase of the discharge from Figure 4.14 (C). The range isnarrower at 2.13m3s−1, the height of the loop illustrates this. Contrastinglywater temperature is far lower. The minimum has dropped just below 1 ◦Cand the maximum has decreased to 1.23 ◦C. The range in considerably lowwith the temperature only differing 0.24 ◦C throughout the day.
44

Figure 4.12: Hysteresis plots of the hourly diurnal variation of water temperature (◦C) and discharge (m3s−1). Eachgraph at weekly intervals between the dates 14 May and 4 June 2012. 14 May (A), 21 May (B), 28 May (C) and 4June (D).
45

The diurnal variation of solar radiation, discharge and water temperature isshown in Figure 4.13. These particular measurements are for 26 April 2012as this is the day of peak water temperature, and the trends reflect those ofa typical glacier fed Alpine stream. There is an expected lag time betweenpeak radiation at 11:00 and peak discharge at 19:00 due to the length oftime the melt water takes to be released from the glacier’s terminus. Watertemperature has a lag time of 4 hours following peak radiation and decreasesas discharge levels reaches 1.13m3s−1.
Hysteresis plots were also generated for radiation and water temperatureto demonstrate the diurnal relationship between the two. Figure 4.14 showthe diurnal variation of water temperature and radiation for the Julian days117(a) and 185 (b). These days were selected to signify the contrast betweena day in the early ablation period when water temperature surges and aday during the peak ablation season when discharge and radiation are attheir highest. There is a clear difference between the water temperature withgraph (a) resembling a high diurnal variation with a minimum temperature of1.42 ◦C and a maximum of 4.62 ◦C, while in contrast (b) had a lower minimumand maximum temperature of 1 ◦C and 1.35 ◦C. The diurnal pattern wassimilar however with temperatures peaking around 14:00-15:00. The diurnalvariation of radiation for both days was expected with peak levels aroundmidday and at a similar level with (b) possessing a slightly higher peak of1048 W m−2 compared to 1000 W m−2, however (a) possessed a total of 1022W m−2 which is greater than (b).
46

Figure 4.13: Diurnal variation of water temperature (◦C), discharge (m3s−1)and shortwave radiation (W m−2), for 26 April 2012.
47

Figure 4.14: Hysteresis plots of shortwave radiation (W m2) and water tem-perature (◦C) for the dates 26/04/2012 (a) and 03/07/2012 (b). Key timesand arrows added to indicate temporal variation.
In conclusion for this period under close observation, the overall diurnal
48

pattern indicates that as discharge increases water temperature decreases.Figure 4.12 (D) displays this well, illustrating that the day with the highestrecorded discharge also has the lowest recorded temperatures. Additionally,there is a positive relationship between the diurnal variation of these twoparameters as when there is a high range between minimum and maximumdaily discharge the same can be said with water temperature vice-versa. Todisplay the evolution of the hysteresis loops throughout the period the sameaxis was used for all four graphs, however due to the high range between allfour the true shapes of the loops are misrepresented. Figure 4.15 displays themeasurements for 14 May however at an axis which complements the rangeof data. A different axis was used for the comparison with the other datesbecause it illustrates the different levels of water temperature and discharge.Arrows have been added to aid the direction of the measurements through theday, although it is not a perfect loop it still shows well the diurnal variationof water temperature and discharge and the strong relationship they possesswith one another.
Figure 4.15: Hysteresis plot of diurnal variation of water temperature (◦C)and discharge (m3s−1) for 14 May 2012 of the Massa, with the direction ofthe series represented by the arrows.
49
5
Discussion
The results demonstrate a high temporal variation in water temperature anddischarge of the Massa, which is similar to other studies focussing on glacier-fed streams (Brown et al., 2006; Collins, 2009). Radiation followed the ex-pected seasonal curve with the maximum levels near the summer solstice (20June). The basin has responded to climatic warming, with Aletschgletscherretreating significantly in the last 140 years. The results suggest that streamtemperature is also sensitive in this environment and very much a function ofincoming solar radiation and the level of flow (Constantz, 1998; Magnussonet al., 2012).
5.1 Seasonal trends
Solar radiation has been highlighted as the primary energy input of proglacialstreams (Chikita et al., 2010; Webb et al., 2008). Analysis of the seasonalvariation of thermal regimes of the Massa (Figure 4.2) conclude that watertemperature increases with the radiation curve from January until the endof April. In Figure 4.2 between the months of March and May 2012 weeklyaverage shortwave radiation and water temperature correlate strongly withr2=0.82 (p=0.002). This is consistent with the hypothesis that solar radia-tion is a primary parameter determining the thermal regime of Alpine water(Brown et al., 2006; Sommaruga, 2001). However water temperature peaks33 days prior to radiation at this point the stream is cooler and no longerexperiencing warm or cool pulses, which signifies the determining influencerunoff has on water temperature.
50

As the ablation season extends into late May and June (2003-2012) runoffhas an enhanced influence on the summer thermal regime of the Massa. Wa-ter temperature starts decreasing from its peak when daily average dischargeincreases to approximately 3.5m3s−1 (Figure 4.5), from this point the streamis cooler and no longer experiencing warm pulses instead possessing the mi-nimum hourly temperature range illustrated in Figure 4.1 (j). Table 4.5expresses this well showing the range of water temperature at the lowest insummer months June-September in the year 2012. 3.5m3s−1 demonstratesthe approximate daily average level of flow at which the Massa reaches a heatcapacity that stream temperature is not determined by direct solar radiationbut by discharge. This supports the interpretation that water temperatureis primarily a function of discharge as radiation levels are at it’s yearly peakin this period.
Water temperatures not only surge in early spring but also at the climax ofthe ablation season when discharge levels decrease. Figure 4.7 compares thehourly trends between water temperature (blue) and discharge (black). Wa-ter temperatures surge when discharge reaches approximately 2.3m3s−1. Day295-298 signify the adverse relationship between the two parameters as watertemperature decreases as discharge rises, reflecting the trends in Figure 4.5.Stream temperature is higher in early spring and Autumn due to groundwa-ter having a significant contributor to runoff, this source of water is warmerthan meltwater therefore prior to the ablation period water temperatures willsurge when meltwater is minimal (Milner et al., 2009).
Figure 5.1 provides a schematic plot of the monthly trends of water tempe-rature, discharge and radiation with the point of the summer solstice addedfrom the years analysed. The lag between peak radiation and discharge isbecause the earth absorbs radiation before releasing it into the atmospheretherefore not immediately increasing air temperatures which drive melt. Thehighest recorded water temperatures are when discharge is lowest due to thestream heat capacity decreasing, as reflected in Figure 5.2. During the hig-hest discharge levels, water temperature is also generally low as the scattershows. There is no real correlation between these two parameters with r2=0.08 (p=2.18 10−162).
The hysteresis plots in Figure 4.15 demonstrate how radiation in summer (3July) has a reduced diurnal influence on stream temperature compared to aday in spring (26 April). Although both show similar trends there is a largedifference in the range, minimum and maximum of the days even though (b)has a higher total level of radiation. The significant differing factor betweenthe two days is the total discharge with (a) experiencing 25.32m3s−1 and
51

(b) 1821.59m3s−1, which supports the interpretation that an increased runoffgenerated from snow and ice melt significantly controls the water temperatureeven though radiation is at its highest due to a shift in the main contributingwater source, an increased heat capacity and reduced residence time.
Tables 4.6 and 4.7 express how an insignificant proportion of the annual ru-noff can have an effect on stream temperatures. Water temperature diverselyreact to a small proportion of the total annual runoff with the stream tempe-ratures reducing from their peaks on days with a total runoff between 0.02%and 0.16% of the annual total. The amount of runoff between the start ofthe calendar year and the day in which water temperatures decrease fromtheir spring peak is low with only 0.56%-2.73% of the total annual dischargeoccurring (Table 4.7), which signifies how the thermal regimes of glacier-fedAlpine streams are very much controlled by runoff.
52

Figure 5.1: Schematic representation of monthly variations of water tem-perature, discharge and radiation. With the point of the summer solsticeadded.
53

Figure 5.2: Plot of the hourly discharge (m3s−1) and water temperature (◦C)for Massa 2012.
5.2 Diurnal trends
The results have suggested that the diurnal variability of discharge determi-nes the thermal regime of glacier-fed streams on a diurnal basis. As dischargeincreases through the early ablation season the diurnal range of water tem-perature decreases (Figure 4.12). Not only does the variation decrease butthe mean temperature also is reduced. Hysteresis plots are appropriate foranalysing temporal variation of hydrological data on diurnal scale as it high-lights patterns cyclically. The tall, narrow cycles (Figure 4.12 (a)) situatedclose to the Y axis signify days in which discharge has a low diurnal vari-ation and reduced maximum. Figure 4.14 demonstrates the transformingpatterns of the diurnal variation of discharge and stream temperature sig-nificantly, the loops laterally move across the plot and reduce in size as theweeks progress, this signifies how higher discharge reduces the variability ofstream temperature. This is due to a higher volume of water in which incre-ases velocity of the stream therefore reducing the transit time through theproglacial environment.
54

Lag times exist between the peaks of each variable on a diurnal basis (Fi-gure 4.8). Water temperature peaks in the early afternoon and dischargein the evening, this suggests that water temperature responds rapidly to at-mospheric variation. Discharge lags radiation due to the delayed drainageof meltwater exiting Aletschgletscher; these diurnal patterns are consistentwith previous studies of glacier-fed streams (Constantz, 1998; Constantz etal., 1994). Stream temperature does not vary significantly at night, sugges-ting that stream bed friction is maintaining the constant temperature.
5.3 Stream morphology and topography
River morphology and basin topography have to be taken into considera-tion as these have proven to be complex in proglacial fields and determinethe variability of runoff and thermal regimes (Magnusson et al., 2012). TheMassa is a typical proglacial Alpine stream with expected topography andriver morphology of a highly glacierised basin. This includes it possessing aboulder dominated channel, areas of steep sided V shaped channels, high gra-dients and high levels of suspended sediment that lead to the development ofbraided channels (Maizels, 1979). Distance between the glacier terminus andgauging station is increasing yearly, as these glaciers retreat the influencesof meteorological will be greater (Chikita et al., 2010). Areas of the Massaflow through a steep sided valley and gorge prior to the downstream gaugingstation (Figure 5.3), and so the water temperature will have limited energyinput from solar radiation due to shading and narrow deep channels. Figure4.10 illustrates the significant effect the topographical shading can have onthe thermal dynamics of Alpine streams due to radiation being a primaryenergy input. Stream bed friction is limited also in these areas due to themorphology of the channel. In contrast the proglacial field immediate to theglacier terminus stream bed friction will have a larger energy input due tothe wide shallow channel, additionally radiation will have a greater influencehere due to the higher stream surface area and reduced shading (Magnussonet al., 2012).
55

Figure 5.3: Satellite image of the upper reach of Massa demonstrating areasof topographical shading 04/10/2009 (GoogleEarth, 2017).
5.4 Future implications
There has been much debate whether we are currently in a global warmingpause; however as Figure 5.4 clearly shows the annual mean temperatures inSwitzerland are still increasing. Implications of this are very concerning dueto the sensitivity the region has shown with rising transient snowline, lesswinter snowfall and retreating glaciers. The transient snowline is a majorfactor when predicting the future regimes of high Alpine hydrology. Theelevation of the 0 ◦C isotherm determines whether the catchment receivesprecipitation in the form of snow or rain, Figure 5.5 displays a schematicdiagram of how the vertical movement of the 0 ◦C isotherm determines thearea of a basin snow covered or snow free (Collins, 1998). The increasing ele-vation of the snowline due to global warming is resulting in the basin having
56

a reduced area covered by snow therefore a lower albedo which in turn incre-ases melt. The higher the previous winter precipitation the lower in elevationthe snowline will be, therefore delaying the rise of discharge in the followingmonths. Inevitably the distance between the glacier terminus and gaugingstation is increasing; therefore the proglacial streams are interacting with thesurrounding environment for a longer period of time. The higher residenceand transit time increase the amount of time solar radiation has to pene-trate the stream, at such a high altitude where UV radiation has significantinfluence (Brown et al., 2006). This will increase water temperature beforeit reaches the gauging station. However, bearing in mind that discharge isexpected to increase with temperature the volume of water to be heated willresult in a decrease water temperature. The relationship between energy in-put (shortwave radiation), water temperature and discharge can be observedin the schematic diagram shown in Figure 5.6. The findings of the presentstudy are consistent with previous studies on the relationships determiningwater temperature in a glacier-fed Alpine river (Collins, 2009).
Figure 5.4: Annual mean temperature (◦C) in Switzerland from 1864 to 2015.Shown are the mean values of the individual years (black) and the smoothedcurve (red) (Meteosuisse, 2016).
57

Figure 5.5: Schematic diagram of the transient snowline movement deter-mining the proportion of the basin that receives snowfall or rain (Collins,1998).
58

Figure 5.6: Schematic diagram of the relationships between energy input,water temperature and discharge in a river draining from an Alpine glacier(Collins, 2009).
Future implications of continued negative glacier mass balance of Aletschg-letscher will ultimately result in mean discharge decreasing. Figure 5.7 showsthe effect of increasing air temperatures will have on glacier mass and dis-charge. To begin, discharge will have a negative correlation with glacier massdue to higher levels of icemelt, however as time progresses and mass decre-ases discharge will hit a tipping point and mean levels will decrease due toless ice available for ablation (Collins et al., 2013). A decrease of dischargewill increase the residence time over the proglacial field and reduce the heatcapacity of the stream resulting in higher water temperatures. The thermalregime of the Massa will be altered due to groundwater, snow melt and preci-pitation contributions becoming dominant water sources. Water temperaturewill therefore reflect air and groundwater temperatures.
59

Figure 5.7: Thought experiment to show how temperature increases throughtime coupled with declining ice area might first increase and then reducedischarge from the ice-covered area of a basin (Collins et al., 2013).
60

6
Conclusion
The research demonstrates that the relationships between radiation, streamtemperature and discharge vary seasonally and demonstrate complexity. Short-wave radiation has the most significant effect on stream temperature in themonths January- April; however, once runoff rises from the winter minimumwater temperature becomes very much a function of discharge which supportsthe third hypothesis. A primary objective of the report was to understandwhy water temperature decreases in spring when radiation remains the same;the results and research support that this occurs in late April and May dueto the higher rate of ablation resulting in discharge increasing. Higher runoffincreases the heat capacity of the stream as a larger volume and velocityreduces the residence time, therefore less time for radiation to penetrate thestream along with a larger volume of water to be heated resulting in a coolertemperature.
Discharge has an inverse effect on water temperature not only on a seaso-nal scale but also across annual and diurnal cycles. Periods of high dischargehave resulted in cooler water temperatures due to a higher volume of meltwa-ter released from the glacier’s terminus at approximately 0 ◦C. This patterncan be observed annually and diurnally (Figure 4.12). As demonstrated inthe results water temperature responds significantly to a small change indischarge, due to the sensitivity to and dependence of proglacial streamson solar radiation as an energy input, where small increases in volume andvelocity maximise the heat capacity so that minimal heating occurs. Ad-ditionally, stream temperature is sensitive to discharge since during periodsof low flow groundwater (higher temperature than meltwater) is a primarysource of streams; however once discharge generated from snow and ice meltis added to the system the mean water temperature is reduced. All these
61

factors contribute to why stream temperature adversely reacts to a small in-crease of discharge. Another main objective was to identify the level of flowat which a glacier-fed stream’s temperature decreases from it’s peak to thereduced summer levels, for the years 2003-2012 which was 3.54m3s−1. Thishas not been highlighted in previous literature. Also the proportion of theannual discharge at which stream temperatures decrease has been determined(Table 4.7).
The final objective of this thesis was the evaluation of the influence radiationhas on water temperatures seasonally and diurnally. Proglacial streams havebeen highlighted to be extremely sensitive to meteorological parameters withradiation a primary energy input (Constantz, 1998; Oerlemans et al., 2009;Sommaruga, 2001). The Massa has reflected this as stream temperature hasa strong positive correlation with radiation fluctuations diurnally and in theearly ablation period, r2=0.82 demonstrated this close relationship, howe-ver in the months May - September when radiation peaks, the Massa doesnot express this sensitivity as the heat capacity of the stream is high dueto increased discharge. The trends on Figure 4.13 highlight the sensitivityproglacial streams have to meteorological forcings as water temperature cor-relates with radiation with only a 3 hour offset. Therefore water temperaturehas a positive correlation to radiation and a negative correlation to dischargeand the heat capacity of the stream. There has been a consistent relations-hip between the data sets with peak discharge lagging behind peak watertemperature and radiation on a diurnal scale and also seasonal. In additionto this relationship, water temperature and discharge negatively correlate ona diurnal, daily, seasonal and annual scale which signifies discharge been theprimary control of stream temperature in glacier-fed rivers.
6.1 Future regimes and further research
Runoff from Alpine glacier-fed rivers like that of the Massa will reflect preci-pitation in the future as the deglaciation discharge dividend (DDD) continues(Figure 5.7). This therefore will alter the thermal regime of rivers and causeaccelerated habitat destruction for species like brown trout due to enhancedwater temperature (Hari et al., 2006). Switzerland is highly reliant on seaso-nal glacier meltwater as a fresh water source and for hydroelectric purposes,therefore the continued observation of Alpine hydrology is key due to thepotential decrease of discharge expected when glacier mass hits a tippingpoint.
62

Further research to analyse the input of streambed friction and the contribu-tion to runoff meltwater, groundwater and precipitation have is of importancedue to the DDD, knowledge of the dominant source will give understandingto future +thermal and flow regimes of proglacial streams with meltwaterexpecting to be less of a significant contributor as glacier mass decreases.Predicting water temperature of proglacial streams draining from a retrea-ting glacier will also be of increasing importance due to the sensitivity pro-glacial streams have to meteorological parameters, especially with residencetime increasing due to the greater distance between the glacier terminus andgauging station.
63

References
Barnett, Tim P, Adam, Jennifer C, and Lettenmaier, Dennis P (2005). Poten-tial impacts of a warming climate on water availability in snow-dominatedregions. Nature 438 (7066), 303–309.
Battin, Tom J, Wille, Anton, Sattler, Birgit, and Psenner, Roland (2001).Phylogenetic and functional heterogeneity of sediment biofilms along en-vironmental gradients in a glacial stream. Applied and Environmental Mi-crobiology 67 (2), 799–807.
Benyahya, Loubna, Caissie, Daniel, St-Hilaire, Andre, Ouarda, Taha BMJ,and Bobee, Bernard (2007). A review of statistical water temperature mo-dels. Canadian Water Resources Journal 32 (3), 179–192.
Braun, LN and Renner, CB (1992). Application of a conceptual runoff mo-del in different physiographic regions of Switzerland. Hydrological SciencesJournal 37 (3), 217–231.
Brown, GH, Sharp, MJ, Tranter, M, Gurnell, AM, and Nienow, PW (1994).Impact of post-mixing chemical reactions on the major ion chemistry ofbulk meltwaters draining the haut glacier d’arolla, valais, Switzerland.Hydrological Processes 8 (5), 465–480.
Brown, Giles H (2002). Glacier meltwater hydrochemistry. Applied Geoche-mistry 17 (7), 855–883.
Brown, Lee E and Hannah, David M (2008). Spatial heterogeneity of watertemperature across an alpine river basin. Hydrological Processes 22 (7),954–967.
Brown, Lee E, Hannah, David M, and Milner, Alexander M (2006). Thermalvariability and stream flow permanency in an alpine river system. RiverResearch and Applications 22 (4), 493–501.
Brown, Lee E, Hannah, David M, and Milner, Alexander M (2007). Vulne-rability of alpine stream biodiversity to shrinking glaciers and snowpacks.Global Change Biology 13 (5), 958–966.
64

Cadbury, SL, Hannah, DM, Milner, AM, Pearson, CP, and Brown, LE (2008).Stream temperature dynamics within a New Zealand glacierized river ba-sin. River Research and Applications 24 (1), 68–89.
Caissie, Daniel (2006). The thermal regime of rivers: a review. FreshwaterBiology 51 (8), 1389–1406.
Ceppi, Paulo, Scherrer, Simon C, Fischer, Andreas M, and Appenzeller,Christof (2012). Revisiting Swiss temperature trends 1959–2008. Interna-tional Journal of Climatology 32 (2), 203–213.
Chikita, Kazuhisa A, Kaminaga, Ryo, Kudo, Isao, Wada, Tomoyuki, andKim, Yongwon (2010). Parameters determining water temperature of aproglacial stream: the Phelan Creek and the Gulkana Glacier, Alaska. Riverresearch and applications 26 (8), 995–1004.
Cogley, J Graham (1979). The albedo of water as a function of latitude.Monthly Weather Review 107 (6), 775–781.
Collins, David N (1984). Climatic variation and runoff from Alpine glaciers.Zeitschrift fur Gletscherkunde und Glazialgeologie 20, 127–145.
Collins, David N (1998). Outburst and rainfall-induced peak runoff eventsin highly glacierized Alpine basins. Hydrological processes 12 (15), 2369–2381.
Collins, David N (2008). Climatic warming, glacier recession and runoff fromAlpine basins after the Little Ice Age maximum. Annals of Glaciology48 (1), 119–124.
Collins, David N (2009). “Seasonal variations of water temperature and dis-charge in rivers draining ice-free and partially-glacierised Alpine basins”.In: Northern Research Basins Symposium. Vol. 17, 67–74.
Collins, David N, Davenport, Joshua L, and Stoffel, Markus (2013). Climaticvariation and runoff from partially-glacierised Himalayan tributary basinsof the Ganges. Science of the Total Environment 468, S48–S59.
Constantz, Jim (1998). Interaction between stream temperature, streamflow,and groundwater exchanges in alpine streams. Water resources research34 (7), 1609–1615.
Constantz, Jim, Thomas, Carole L, and Zellweger, Gary (1994). Influence ofdiurnal variations in stream temperature on streamflow loss and ground-water recharge. Water resources research 30 (12), 3253–3264.
Delpla, I, Jung, A-V, Baures, E, Clement, M, and Thomas, O (2009). Impactsof climate change on surface water quality in relation to drinking waterproduction. Environment International 35 (8), 1225–1233.
Dzikowski, Marc and Jobard, Sylvain (2012). Mixing law versus dischargeand electrical conductivity relationships: application to an alpine proglacialstream. Hydrological Processes 26 (18), 2724–2732.
65

Fenn, CR (1985). Spatial and temporal variations in electrical conductivityin a pro-glacial stream system. Journal of Glaciology 31 (108), 108–114.
Fisher, Stuart G (1995). Stream Ecology: Structure and Function of RunningWaters. Science 270 (5243), 1858–1859.
Fountain, Andrew G and Tangborn, Wendell V (1985). The effect of glacierson streamflow variations. Water Resources Research 21 (4), 579–586.
Gobiet, Andreas, Kotlarski, Sven, Beniston, Martin, Heinrich, Georg, Raj-czak, Jan, and Stoffel, Markus (2014). 21st century climate change in theEuropean Alpsfffdfffdfffda review. Science of the Total Environment 493,1138–1151.
Han, Luoheng (1997). Spectral reflectance with varying suspended sedimentconcentrations in clear and algae-laden waters. Photogrammetric Engineer-ing and Remote Sensing 63 (6), 701–705.
Hari, Renata E, Livingstone, David M, Siber, Rosi, BURKHARDT-HOLM,PATRICIA, and Guettinger, Herbert (2006). Consequences of climaticchange for water temperature and brown trout populations in Alpine riversand streams. Global Change Biology 12 (1), 10–26.
Hill, Margot (2012). Climate change and water governance: Adaptive capacityin Chile and Switzerland. Vol. 54. Springer Science & Business Media.
Huss, Matthias, Farinotti, Daniel, Bauder, Andreas, and Funk, Martin (2008).Modelling runoff from highly glacierized alpine drainage basins in a chan-ging climate. Hydrological processes 22 (19), 3888–3902.
Jouvet, Guillaume, Huss, Matthias, Funk, Martin, and Blatter, Heinz (2011).Modelling the retreat of Grosser Aletschgletscher, Switzerland, in a chan-ging climate. Journal of Glaciology 57 (206), 1033–1045.
Lowney, Cynthia L (2000). Stream temperature variation in regulated rivers:Evidence for a spatial pattern in daily minimum and maximum magnitu-des. Water Resources Research 36 (10), 2947–2955.
Magnusson, Jan, Jonas, Tobias, and Kirchner, James W (2012). Tempera-ture dynamics of a proglacial stream: Identifying dominant energy balancecomponents and inferring spatially integrated hydraulic geometry. WaterResources Research 48 (6).
Maizels, Judith K (1979). Proglacial aggradation and changes in braidedchannel patterns during a period of glacier advance: an Alpine example.Geografiska Annaler. Series A. Physical Geography, 87–101.
Marty, Christoph (2008). Regime shift of snow days in Switzerland. Geophy-sical Research Letters 35 (12).
Milner, Alexander M, Brown, Lee E, and Hannah, David M (2009). Hyd-roecological response of river systems to shrinking glaciers. HydrologicalProcesses 23 (1), 62–77.
66

Milner, Alexander M and Petts, Geoffrey E (1994). Glacial rivers: physicalhabitat and ecology. Freshwater Biology 32 (2), 295–307.
Milner, AM, Brittain, JE, Brown, LE, and Hannah, DM (2010). Water sour-ces and habitat of Alpine streams. In: Alpine Waters. Springer, 175–191.
Moore, R Dan, Spittlehouse, DL, and Story, Anthony (2005). RIPARIANMICROCLIMATE AND STREAM TEMPERATURE RESPONSE TOFOREST HARVESTING: A REVIEW1. Journal of the American WaterResources Association 41 (4), 813.
Oerlemans, J, Giesen, RH, and Van den Broeke, MR (2009). Retreating al-pine glaciers: increased melt rates due to accumulation of dust (Vadret daMorteratsch, Switzerland). Journal of Glaciology 55 (192), 729–736.
Poole, Geoffrey C and Berman, Cara H (2001). An ecological perspective onin-stream temperature: natural heat dynamics and mechanisms of human-causedthermal degradation. Environmental management 27 (6), 787–802.
Randin, Christophe F, Engler, Robin, Normand, Signe, Zappa, Massimili-ano, Zimmermann, Niklaus E, Pearman, Peter B, Vittoz, Pascal, Thuiller,Wilfried, and Guisan, Antoine (2009). Climate change and plant distribu-tion: local models predict high-elevation persistence. Global Change Bio-logy 15 (6), 1557–1569.
Rebetez, M and Reinhard, M (2008). Monthly air temperature trends inSwitzerland 1901–2000 and 1975–2004. Theoretical and Applied Climato-logy 91 (1-4), 27–34.
Rott, E, Cantonati, M, Fureder, L, and Pfister, P (2006). Benthic algae inhigh altitude streams of the Alps–a neglected component of the aquaticbiota. Hydrobiologia 562 (1), 195–216.
Scherrer, Simon C, Appenzeller, Christof, and Laternser, Martin (2004).Trends in Swiss Alpine snow days: The role of local-and large-scale cli-mate variability. Geophysical Research Letters 31 (13).
Schmucki, Daniel A and Philipona, Rolf (2002). Ultraviolet radiation in theAlps: the altitude effect. Optical Engineering 41 (12), 3090–3095.
Singh, Abhay Kumar and Hasnain, SI (2002). Aspects of weathering andsolute acquisition processes controlling chemistry of sub-Alpine proglacialstreams of Garhwal Himalaya, India. Hydrological Processes 16 (4), 835–849.
Sommaruga, Ruben (2001). The role of solar UV radiation in the ecologyof alpine lakes. Journal of Photochemistry and Photobiology B: Biology62 (1), 35–42.
Wagnon, Patrick, Ribstein, Pierre, Kaser, Georg, and Berton, Philippe (1999).Energy balance and runoff seasonality of a Bolivian glacier. Global and pla-netary change 22 (1), 49–58.
67

Webb, Bruce W, Hannah, David M, Moore, R Dan, Brown, Lee E, andNobilis, Franz (2008). Recent advances in stream and river temperatureresearch. Hydrological Processes 22 (7), 902–918.
Wegmann, Matthias, Gudmundsson, G Hilmar, and Haeberli, Wilfried (1998).Permafrost changes in rock walls and the retreat of Alpine glaciers: a ther-mal modelling approach. Permafrost and Periglacial Processes 9 (1), 23–33.
Zemp, Michael, Haeberli, Wilfried, Hoelzle, Martin, and Paul, Frank (2006).Alpine glaciers to disappear within decades? Geophysical Research Letters33 (13).
68