Embed Size (px)
Citation preview

Water Technologies: A Global Opportunity Scan for US Companies
Contents: 1. Industry Overview:
Water Technologies industry at a glance * The water technologies industry sub sectors * Global growth rates / trends
2. U.S. Export trends
Top Markets * Best markets * Best markets 3. Industry Export factors Emerging Technologies * Unique industry factors for global trade 4. Export Resource Development
Tradecraft or A‐Z of exporting process
5. Key Industry Supports and Trade Data
Events * Industry Associations * Team Web Link

2 Water Technologies Industry Global Opportunity Scan
Water: A Global Opportunity Scan for US Companies
Water Industry Overview The U.S. water export industry provides the globe with services that cater to wastewater treatment and water purification for industrial or municipal use.
Subsectors of Water Industry
Chart 1
Water Sub‐Sectors NAICS Code
Hydroelectric Power Generation 221111 Water Supply Systems, Irrigation, Distribution, Treatment, Filtration 221310 Water Plant Construction Management 237110 Treatment Chemicals Akalis and Chlorine 325181 Treatment Chemicals Surface Active Agents 325613 Plastic Tubing, Pipes, Hoses, and Pipe Fittings Manufacturing 326122 Metal Containment Tanks Manufacturing 332420 Fluid Power Valves and Hose Fittings Manufacturing 332912 Waterworks & Municipal System Valves Manufacturing 333291 Water Purification Equipment Manufacturing 333319 Turbine and Turbine Generator Sets Manufacturing 333611 Pumps and Pumping Equipment Manufacturing 333911 Measuring and Dispensing Pumps Manufacturing 333913 Merchant Wholesaler Industrial Water Treatment Equipment 423830 Merchant Wholesaler Municipal Water Treatment Equipment 423850 Water Quality & Control Administration 924110 Source: US Census Bureau
Industry Growth Rates Since 2000, the U.S. Water Export Industry has grown at a compound annual growth rate (CAGR) of 5.50%. The total size of the market in 2010 was $115 billion. The fastest growing sector of the market was in the export of treatment chemicals for the purification of water, which grew at a CAGR of 6.66%. As can be seen in the Water Industry Growth Rate below, in 2010, the global market for purification chemicals outpaced water services and machinery 6 to 1 (see Figure 1). The water service and industry machinery export market looks to be saturated because of its low 0.62% CAGR. Fabricated metal products (CAGR 4.32%) as well as turbine & power generation sets (CAGR 6.60%) markets continue to grow. In 2009, the water industry growth rates declined because of the global recession that occurred in 2008 to 2009. Since the growth rates returned to pre‐crisis levels in 2010, this serves as evidence of strong continuous growth in this market.
3 Water Technologies Industry Global Opportunity Scan
Figure 1
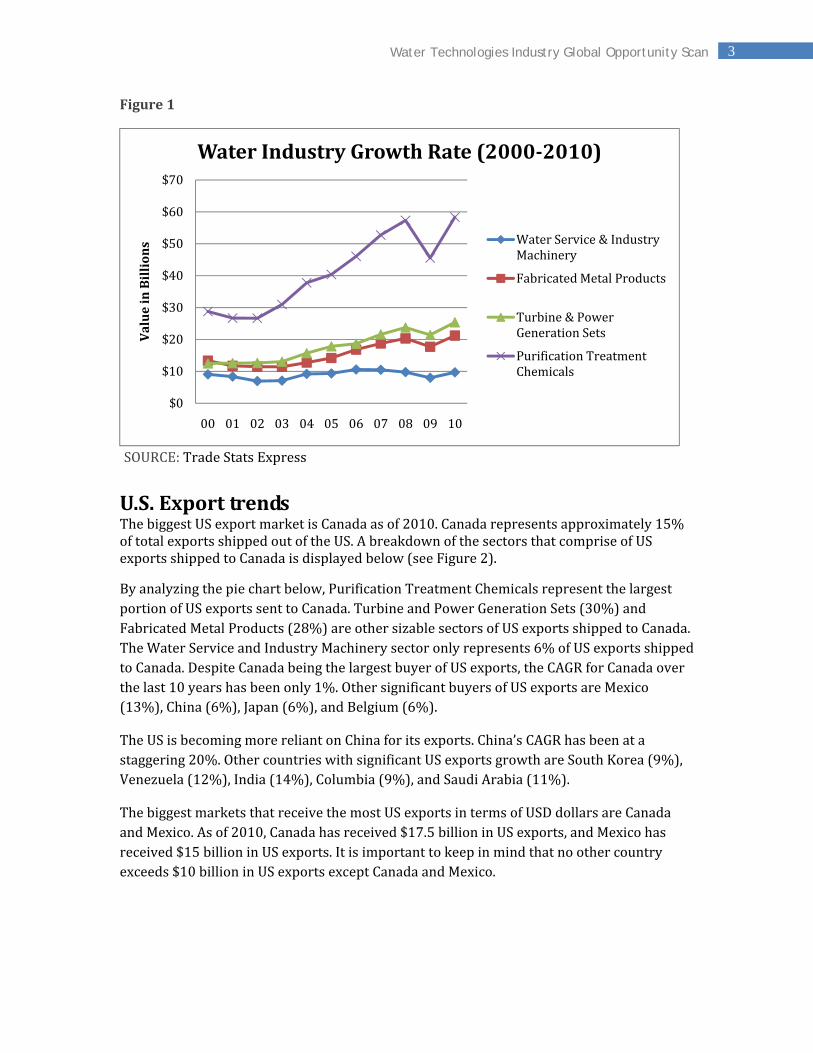
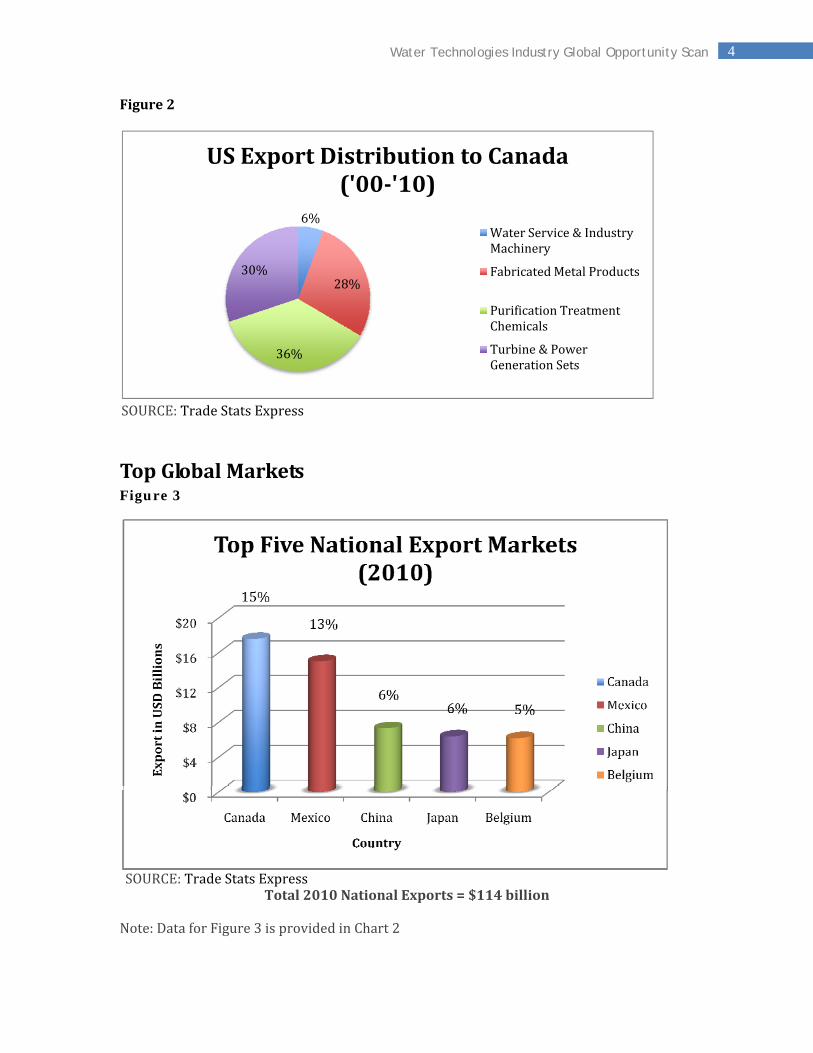
U.S. Export trends The biggest US export market is Canada as of 2010. Canada represents approximately 15% of total exports shipped out of the US. A breakdown of the sectors that comprise of US exports shipped to Canada is displayed below (see Figure 2).
By analyzing the pie chart below, Purification Treatment Chemicals represent the largest portion of US exports sent to Canada. Turbine and Power Generation Sets (30%) and Fabricated Metal Products (28%) are other sizable sectors of US exports shipped to Canada. The Water Service and Industry Machinery sector only represents 6% of US exports shipped to Canada. Despite Canada being the largest buyer of US exports, the CAGR for Canada over the last 10 years has been only 1%. Other significant buyers of US exports are Mexico (13%), China (6%), Japan (6%), and Belgium (6%).
The US is becoming more reliant on China for its exports. China’s CAGR has been at a staggering 20%. Other countries with significant US exports growth are South Korea (9%), Venezuela (12%), India (14%), Columbia (9%), and Saudi Arabia (11%).
The biggest markets that receive the most US exports in terms of USD dollars are Canada and Mexico. As of 2010, Canada has received $17.5 billion in US exports, and Mexico has received $15 billion in US exports. It is important to keep in mind that no other country exceeds $10 billion in US exports except Canada and Mexico.
$0
$10
$20
$30
$40
$50
$60
$70
00 01 02 03 04 05 06 07 08 09 10
Value in Billions
Water Industry Growth Rate (20002010)
Water Service & Industry Machinery
Fabricated Metal Products
Turbine & Power Generation Sets
Purification Treatment Chemicals
SOURCE: Trade Stats Express
4 Water Technologies Industry Global Opportunity Scan
Figure 2
Top Global Markets Figure 3
Total 2010 National Exports = $114 billion
Note: Data for Figure 3 is provided in Chart 2
6%
28%
36%
30%
US Export Distribution to Canada ('00'10)
Water Service & Industry Machinery
Fabricated Metal Products
Purification Treatment Chemicals
Turbine & Power Generation Sets
SOURCE: Trade Stats Express
SOURCE: Trade Stats Express

5 Water Technologies Industry Global Opportunity Scan
Figure 4
Total 2010 National Imports = $94 billion
Top 25 Global Markets for Water (NAICS 332912, 325181, 333319, 333611) Chart 2
National Market 2008 2009 2010 CAGR ('00‐'10) Canada $18,041,947,017 $14,620,423,671 $17,567,345,040 1%Mexico $14,978,670,880 $12,844,636,008 $15,002,515,464 4%Japan $6,199,477,442 $4,411,652,385 $6,368,623,965 0%Belgium $5,818,794,575 $4,780,692,684 $6,171,316,133 5%China $5,629,714,014 $5,818,276,284 $7,303,054,275 20%South Korea $4,455,863,171 $3,809,386,986 $5,802,692,605 9%United Kingdom $4,468,908,451 $3,915,543,085 $4,183,337,159 1%Netherlands $5,567,330,277 $2,553,536,292 $3,123,470,406 3%Germany $3,849,849,226 $2,835,920,161 $4,077,478,678 5%Brazil $4,545,383,150 $3,281,722,710 $4,507,820,354 8%Taiwan $2,870,171,238 $2,249,956,324 $3,360,306,649 1%Singapore $2,701,035,478 $2,384,327,787 $2,980,411,700 8%France $2,383,891,601 $2,270,917,575 $2,270,132,214 2%Australia $1,775,829,330 $1,726,913,086 $1,944,781,652 5%Venezuela $2,056,069,843 $1,500,396,089 $2,485,354,970 12%
SOURCE: Trade Stats Express

6 Water Technologies Industry Global Opportunity Scan
Italy $1,373,199,210 $1,192,694,564 $1,270,533,166 0%India $1,463,242,742 $1,763,932,997 $2,310,261,582 14%Colombia $1,559,418,634 $1,128,487,801 $1,483,096,997 9%Saudi Arabia $1,588,351,667 $1,771,943,526 $1,078,229,802 11%Hong Kong $998,593,287 $939,311,498 $1,115,231,383 5%SOURCE: Trade Stats Express
Figure 5
Total 2010 Geographic Imports = $331 billion
Figure 6
Total 2010 Geographic Exports = $533 billion
SOURCE: Trade Stats Express
SOURCE: Trade Stats Express
7 Water Technologies Industry Global Opportunity Scan
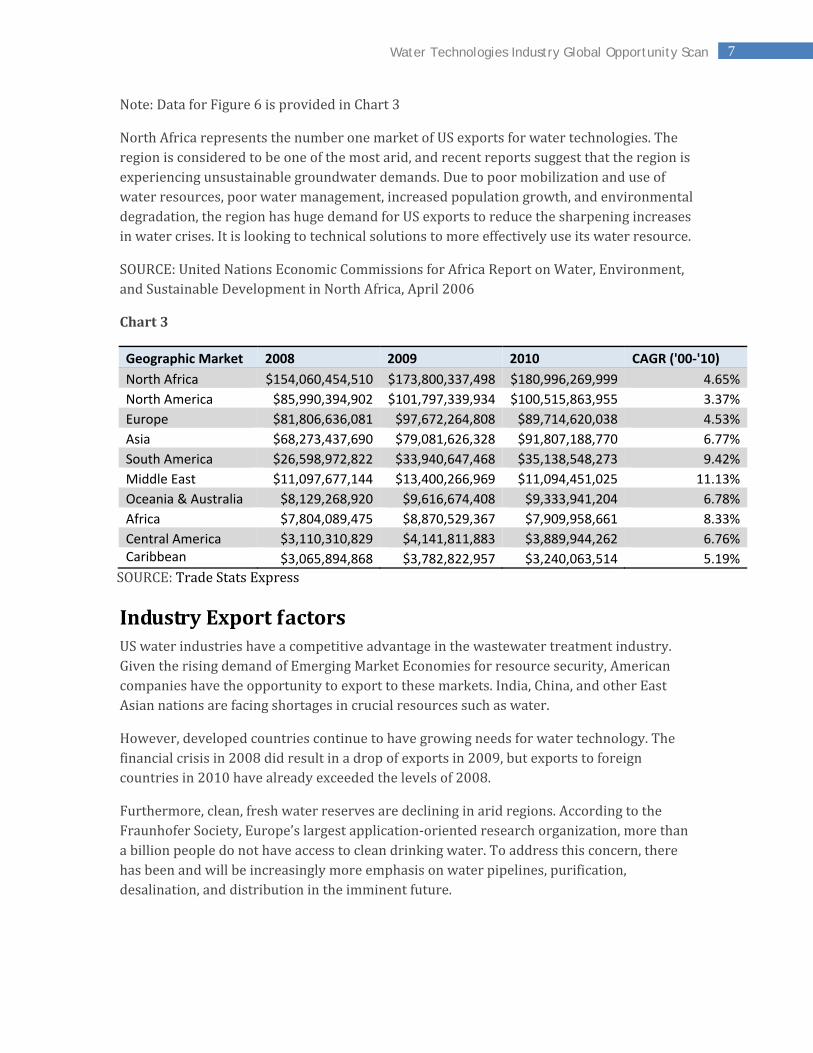
Note: Data for Figure 6 is provided in Chart 3
North Africa represents the number one market of US exports for water technologies. The region is considered to be one of the most arid, and recent reports suggest that the region is experiencing unsustainable groundwater demands. Due to poor mobilization and use of water resources, poor water management, increased population growth, and environmental degradation, the region has huge demand for US exports to reduce the sharpening increases in water crises. It is looking to technical solutions to more effectively use its water resource.
SOURCE: United Nations Economic Commissions for Africa Report on Water, Environment, and Sustainable Development in North Africa, April 2006
Chart 3
Geographic Market 2008 2009 2010 CAGR ('00‐'10) North Africa $154,060,454,510 $173,800,337,498 $180,996,269,999 4.65%North America $85,990,394,902 $101,797,339,934 $100,515,863,955 3.37%Europe $81,806,636,081 $97,672,264,808 $89,714,620,038 4.53%Asia $68,273,437,690 $79,081,626,328 $91,807,188,770 6.77%South America $26,598,972,822 $33,940,647,468 $35,138,548,273 9.42%Middle East $11,097,677,144 $13,400,266,969 $11,094,451,025 11.13%Oceania & Australia $8,129,268,920 $9,616,674,408 $9,333,941,204 6.78%Africa $7,804,089,475 $8,870,529,367 $7,909,958,661 8.33%Central America $3,110,310,829 $4,141,811,883 $3,889,944,262 6.76%Caribbean $3,065,894,868 $3,782,822,957 $3,240,063,514 5.19%
Industry Export factors US water industries have a competitive advantage in the wastewater treatment industry. Given the rising demand of Emerging Market Economies for resource security, American companies have the opportunity to export to these markets. India, China, and other East Asian nations are facing shortages in crucial resources such as water.
However, developed countries continue to have growing needs for water technology. The financial crisis in 2008 did result in a drop of exports in 2009, but exports to foreign countries in 2010 have already exceeded the levels of 2008.
Furthermore, clean, fresh water reserves are declining in arid regions. According to the Fraunhofer Society, Europe’s largest application‐oriented research organization, more than a billion people do not have access to clean drinking water. To address this concern, there has been and will be increasingly more emphasis on water pipelines, purification, desalination, and distribution in the imminent future.
SOURCE: Trade Stats Express

8 Water Technologies Industry Global Opportunity Scan
Emerging Applications for Water Technologies
As global freshwater sources become scarcer, new technologies are being applied to areas in wastewater treatment and recycling the use of water in more cost‐effective manners. Presented below are a few of the upcoming areas of water technology innovation:
• Nanotechnology in Water Treatment: Nanotechnology is being used to remove harmful chemicals efficiently.
• Ceramic Membranes: Ceramic membranes are more resistant to chemical decay and are more durable.
• Sunlight Photocatalysis: Natural systems that incorporate sunlight can treat water quality issues instead of utilizing expensive UV light installments.
• Mobile water purification systems: Cheap and cost‐effective products to filter water are growing. Examples include biodegradable water filtration ‘teabags’, water filtration straws, and water purification systems with solar power capability
• Forward Osmosis (FO): While reverse osmosis dominates in the desalination industry, there has been increasing growth in the application of forward osmosis, especially hybrid systems that incorporate FO technology.
SOURCE: Water‐Technology.net
Key Resources to Expanding Your Global Business The following set of links will redirect you to a series of standard considerations when developing your export markets.
Export Resources
• Trade Information Center – Comprehensive resource for information on all U.S. federal government export assistance programs http://trade.gov/
• Import Administration – Works to protect U.S. firms against unfair trade practices http://www.trade.gov/ia/
• Market Access and Compliance – Obtains market access for American firms that encounter foreign barriers to trade. http://trade.gov/mac/
• U.S. Commercial Service – Promotes U.S. exports abroad. http://www.trade.gov/cs/
• BuyUSA – Brings suppliers of U.S. products and services together with international companies outside the United States, and give both groups the advocacy and services they need to succeed http://www.buyusa.gov/home/
• Export.gov – “How to” manual for understanding government regulations. http://export.gov/
• Bureau of the Census – Maintains foreign trade statistics http://www.census.gov/econ/

9 Water Technologies Industry Global Opportunity Scan
Key Trade Events Like most industries, there are many key industry events where US companies gain leverage to accomplish their international expansion goals.
Key Global Trade Events in the Water Technology Industry Minnesota Water Technology Export Round TableMay 25, 2011 Minneapolis, Minnesota http://www.wtcsd.org/Resources/WEMI/Events/Minnesota%20%20Trade%20Office.pdf
American Water Works Association Annual Conference & ExpositionJune 12‐16, 2011 Washington, D.C. http://www.awwa.org/ACE11/index.cfm
Associated Water Technologies 2011 Annual Convention and ExpositionSeptember 14‐17, 2011 Atlanta, Georgia http://www.awt.org/annualConvention/
WEFTEC Water Environment Federation October 15‐19, 2011 Los Angeles, CA http://www.weftec.org/
WaterWorld Middle East October 24‐26, 2011 Qatar http://www.waterworldmiddleeast.com/index.html
9th Everything About Water Expo 2012February 25‐27, 2012 New Delhi, India http://www.wtcsd.org/Resources/WEMI/Events/EXPO%202012%20‐%20Brochure%5B1%5D.pdf
Additional Events can be found at: http://www.wtcsd.org/wemi/events.
Key US Industry Associations and Industry Intelligence Sources
Association of Water Technology: http://awt.org/
World Trade Center San Diego: http://www.wtcsd.org/wemi
Census Bureau: www.census.gov/econ

10 Water Technologies Industry Global Opportunity Scan
National Trade Data Bank: www.stat‐usa.gov
Trade Stats Express: http://tse.export.gov/TSE/TSEHome.aspx
Industry Statistics Sampler: http://www.census.gov/cgi‐bin/naics/index.cgi
Water and Wastewater Industry: http://www.water‐technology.net/
UN Water: http://www.unwater.org/statistics_use.html
North American Industry Classification System (NAICS): http://www.census.gov/eos/www/naics/index.html
Water Environment Federation: http://wef.org/
American Water Works Association: http://www.awwa.org


![MASTERED Book Scan 4.0 performance scanningqidenus.com/technologies/wp-content/uploads/02...MASTERED Book Scan 4.0 [def.: semi-automatic book scanner] This partially automatised book](https://img.pdfslide.us/doc/110x75/6005de3dc13d5f72b20e37e5/mastered-book-scan-40-performance-mastered-book-scan-40-def-semi-automatic.jpg)


![Investment Opportunity in Advanced Greenhouse Technologies USA, Inc. [Sept 17 2014]](https://img.pdfslide.us/doc/110x75/577cc3c61a28aba711971f35/investment-opportunity-in-advanced-greenhouse-technologies-usa-inc-sept.jpg)