Embed Size (px)
Citation preview

City of Armstrong Water System 2019 Annual Report
Page i
Water System 2019 Annual Report
Kerry Fox Water / Wastewater Technician Prepared May 2020

City of Armstrong Water System 2019 Annual Report
Page i
Contents 2019 Water System Summary ...................................................................................................................... 1
System Description ................................................................................................................................... 1
Comment on Source, Treatment and Distribution Events........................................................................ 1
System Classification / Operator Training ................................................................................................ 1
Bacteriological Summary .............................................................................................................................. 1
Chemical Summary ................................................................................................................................... 2
Source Sampling ........................................................................................................................................ 2
Chlorine Residual ...................................................................................................................................... 2
2019 Water System Works – Completed or Ongoing ............................................................................... 2
2019 Plans ................................................................................................................................................. 3
General Comments ................................................................................................................................... 3
Backflow Prevention Program ...................................................................................................................... 3
Appendix 1 – Monitoring Results .................................................................................................................. 4
Water Sampling Sites ................................................................................................................................ 5
Annual Water Graphs ............................................................................................................................... 6
Drinking Water Reports ............................................................................................................................ 9
Raw Water Reports ................................................................................................................................. 34
Trihalomethane (THM) Reports .............................................................................................................. 45
Schedule “A” Water Testing Results ....................................................................................................... 49
Water Quality (SCADA Automatic Report) .............................................................................................. 56
Total Flow (SCADA Automatic Report).................................................................................................... 73
UV System Performance Report (SCADA Automatic Report) ................................................................. 86
Appendix 2 – Emergency Response Deviation Plan ............................................................................. 99
Appendix 3 - Certificates ........................................................................................................................... 105

City of Armstrong Water System 2019 Annual Report
Page 1
2019 Water System Summary System Description
The following annual report is for the City of Armstrong’s drinking water system. In addition to the City of Armstrong connections, the City’s water systems also services 35 residential properties located along our water main and six water districts all located within the Township of Spallumcheen. The water supply for the City’s system is primarily a surface source with 99.62% (1,203,056 m3) taken from Fortune Creek in 2019. The water is released from the North and South Silver Star lakes to Fortune Creek then diverted to the water treatment plant where it is treated with ultra violet (UV) lights and chlorinated and then diverted to reservoirs 1, 2 and then to reservoir 3 which are located at the end of Reservoir Road in the Township of Spallumcheen. From the three reservoirs the treated water flows by gravity into the City. The remaining 0.38% (4,535 m3) of the water supply came from two deep wells located within the City (the Fire Hall Well and Pleasant Valley (PV) Well). The surface water is of very good quality with the only treatment being UV and chlorination. The Fire hall and PV Well also has disinfection capabilities using a 12% Hypo Chlorite solution. The system has continuous chlorine residual and turbidity monitoring through a SCADA system at the water treatment plant and the distribution line leaving the reservoirs.
Comment on Source, Treatment and Distribution Events
2019 was an excellent year as far as water quality. High turbidity occurred on April 2, 25 and 26 at 10 NTU’s due to equipment maintenance but averages for those days were below 0.50 NTU’s and UVT’s of 89.6%, 73.7% and 78.1% respectively for those days. The plant was able to keep functioning and we did not have to switch to ground water source.
System Classification / Operator Training EOCP has classified system as level two water treatment system (WT2). At present, we have:
• 1 employee certified at water treatment level two (WT2) and water distribution level two (WD2) • 3 employees certified at water treatment level one (WT1) and water distribution level one
(WD1) • 1 employee certified at water distribution level one (WD1)
Bacteriological Summary In 2019 a total of 88 samples were analysed by Caro; 10 raw water samples, 72 Drinking water samples, 3 Trihalomethane (THM) samples, 1 Schedule ‘A’ surface source and 1 Schedule ‘A’ for each well.
6 drinking water samples were taken per month from a combination of the 8 sample locations, 2 samples are taken from the start of the water system, 2 from the middle of the water system and 4 from the end of the system. Sampling occurred at 2 separate times during the month, with 1 sample from each of the locations to ensure continuous and current monitoring of our system. The results are posted under Appendix 1 “Monitoring Results – Drinking Water”.

City of Armstrong Water System 2019 Annual Report
Page 2
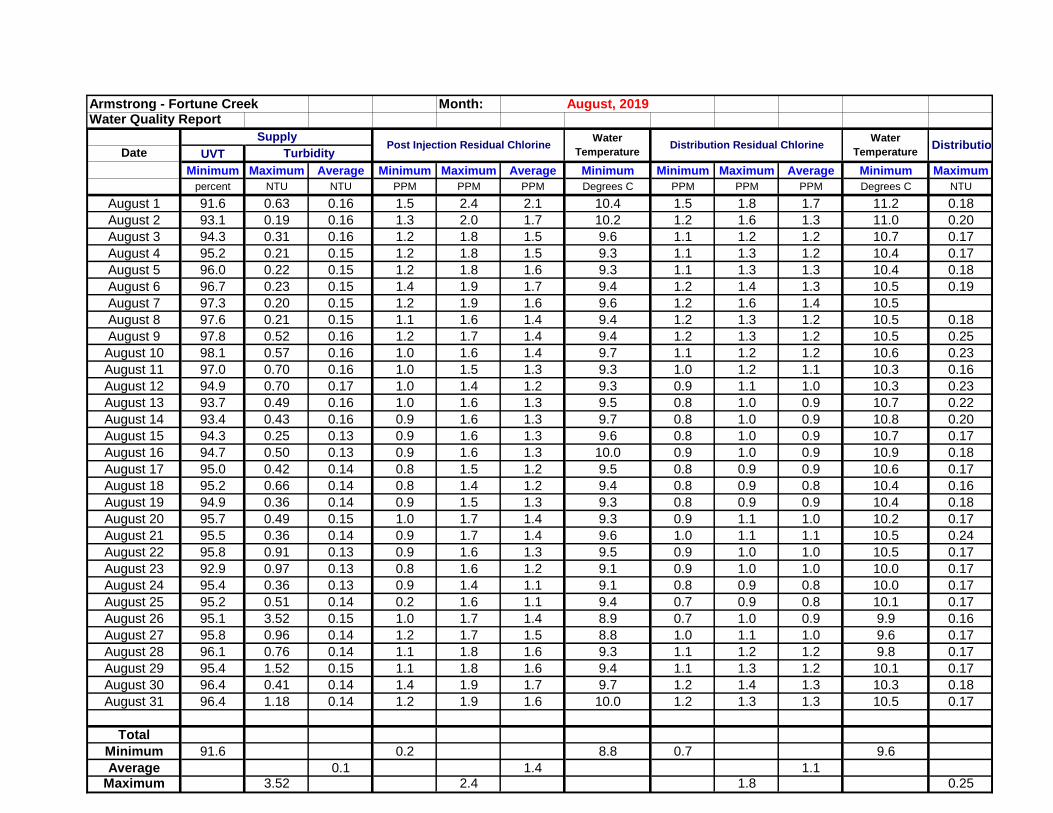
Chemical Summary Schedule ‘A’ analysis is done every year on the surface source and every three (3) years on our ground water sources, we also tested for THM’s three (3) times this year with no unusual results noted. Average turbidity for the year was 0.21 NTU and during freshet the high spiked above 3.5 NTU on 4 days but dropped back and was easily managed. (See Appendix 1 “Monitoring Results – Water Quality Report”).
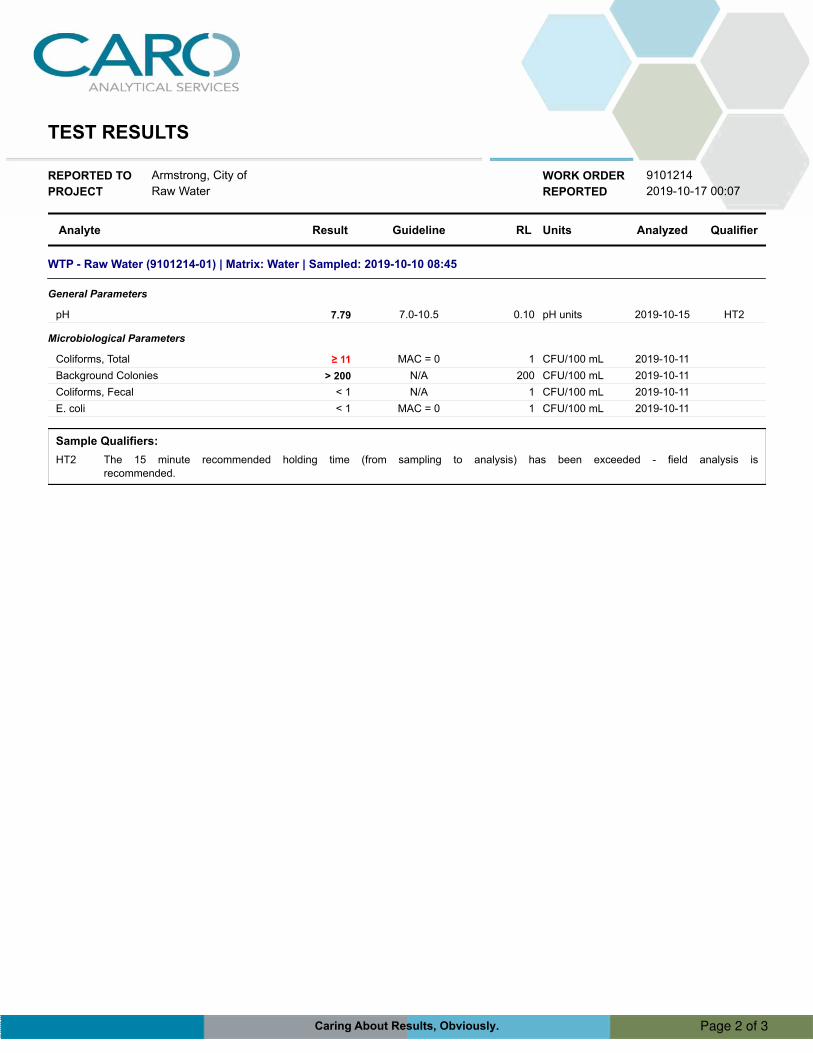
Source Sampling The City of Armstrong took 10 raw water samples this year from the surface source. No unexpected results noted.
Chlorine Residual The City has continual chlorine residual monitoring at our water treatment plant for reservoir dosing residual and at the distribution of the reservoir through a SCADA system. As well we manually check 8 sites per month while doing sampling. In 2019 our distribution residuals had a high of 1.9 mg/l on:
• May 27, 2019
Distribution residuals had a low of 0.6 ppm on April 21 and June 29, 2019. We did not have any issues with maintaining chlorine residuals in our system when on surface water.
2019 Water System Works – Completed or Ongoing This includes planned line replacements, upgrading, as well as water breaks and repairs. In either case the City follows industry standards for the disinfection of new water lines or repairs made to existing lines before opening them to the rest of the water system. The following list includes work done in 2019:
Water • Unidirectional flushing program in progress • Yearly hydrant maintenance • Valve exercising • There were no Water Main Breaks in 2019 • There were Service line breaks at the following locations:
o 2414 Pheasant Ridge Dr o 2255 Fletcher Ave o 3190 Smith Dr
Wells • Well Head Protection Plan was in place as of 2008 • General Maintenance
Dams & Storage Reservoirs • Vegetation maintenance • Cleaning of reservoirs • Install new log boom on North Silver Star Lake • Yearly dam safety inspection

City of Armstrong Water System 2019 Annual Report
Page 3
2020 Plans • Work at intake to water treatment plant • Vegetation maintenance (ongoing), at Dams and reservoirs • New water main installation on Sage Ave
General Comments The water quality was excellent in 2019. The spring freshet was manageable and we did not need to switch to our groundwater source for this year. The water treatment plant ran well in its ninth year with just the regular maintenance.
Backflow Prevention Program The City of Armstrong has had an active backflow program in place since 1999. All commercial and industrial buildings that require a service connection to supply water from the City’s water system must have a backflow prevention assembly installed at their expense as per the City of Armstrong Water and Sewer Regulation Establishment Bylaw No. 1722.
Armstrong backflow assembly testing statistics for 2019:
• 230 total backflow assemblies; • 195 assemblies tested and passed • 17 assemblies are classified as minor and the City does not require testing. • 8 assemblies are on vacant buildings not using water and the City does not require testing
until status changes. • 10 assemblies were not tested in 2019 which required testing, follow up occurred with the
owners of the assemblies that were delinquent.
The type, size and location of the backflow assembly are specified by the City. Applicants for building permits, where a commercial or industrial business is being constructed, pay a deposit before the building permit is issued to ensure the installation of a backflow assembly.
The City of Armstrong does not test private assemblies. Assemblies on private property are the responsibility of the property owners, the City is to be provided with annual test reports completed by certified testers.
The types of backflow assemblies required will depend upon the degree of hazard to our water system that is present in a business operation, as per CSA Standards.

City of Armstrong Water System 2019 Annual Report
Page 4
Appendix 1 – Monitoring Results

City of Armstrong Water System 2019 Annual Report
Page 5
Water Sampling Sites
Site Number Site Location Address Distribution Point
1 City Hall – Lunchroom Sink
3570 Bridge Street Armstrong Middle
2 City Shop – Lunchroom Sink
2950 Patterson Avenue Armstrong Middle
3 Water Treatment Plan – Raw Water Analyzer
End of Reservoir Road Spallumcheen Start
4 First Customer - Taken from tap in chlorine room at Reservoir
End of Reservoir Road Spallumcheen First
5 Pleasant Valley Well - Meter Pit Sample Tap
Across from PVSS Armstrong End
6 Round Prairie Meter Pit - Sample Tap
3965 Wood Avenue Armstrong End
7 Highland Park Meter Pit - Sample Tap
Corner of Highland Park Cres & Young Road, Spallumcheen End
8 Meighan Creek - Sample Tap
2259 Hunter Avenue Armstrong End

City of Armstrong Water System 2019 Annual Report
Page 6
Annual Water Graphs
1,000,000
1,050,000
1,100,000
1,150,000
1,200,000
1,250,000
2015 2016 2017 2018 2019
2015 - 2019 Annual Water Consumption m3
0
50000
100000
150000
200000
250000
Jan Feb Mar Apr May Jun Jul Aug Sep Oct Nov Dec
2015 - 2019 Monthly Water Consumption
2019 2018 2017 2016 2015
City of Armstrong Water System 2019 Annual Report
Page 7
0
1000
2000
3000
4000
5000
6000
7000
Jan Feb Mar Apr May Jun Jul Aug Sep Oct Nov Dec
2019 Water Treatment Plant Daily Flow ThroughHigh/Low/Average m3
High Low Average
0
0.2
0.4
0.6
0.8
1
1.2
1.4
1.6
1.8
2
Jan Feb Mar Apr May Jun Jul Aug Sep Oct Nov Dec
2019 Chlorine Residual
High Low Average

City of Armstrong Water System 2019 Annual Report
Page 8
0
20
40
60
80
100
120
140
160
180
Jan Feb Mar Apr May Jun Jul Aug Sep Oct Nov Dec
2019 Raw Water Coliforms
Coliforms Total Ecoli

City of Armstrong Water System 2019 Annual Report
Page 9
Drinking Water Reports

REPORTED TO Armstrong, City of
REPORTED 2019-01-09 17:11
TEST RESULTS
PROJECT Drinking Water
WORK ORDER 9010391
Analyte Result Guideline RL Units Analyzed Qualifier
Reservoir Sample Site #3 (9010391-01) | Matrix: Water | Sampled: 2019-01-07 08:00
Microbiological Parameters
CFU/100 mL< 1Coliforms, Total 2019-01-071MAC = 0
CFU/100 mL< 1E. coli 2019-01-071MAC = 0
Round Prairie Sample Site #5 (9010391-02) | Matrix: Water | Sampled: 2019-01-07 07:30
Microbiological Parameters
CFU/100 mL< 1Coliforms, Total 2019-01-071MAC = 0
CFU/100 mL< 1E. coli 2019-01-071MAC = 0
Meighan Creek Sample Site #7 (9010391-03) | Matrix: Water | Sampled: 2019-01-07 07:45
Microbiological Parameters
CFU/100 mL< 1Coliforms, Total 2019-01-071MAC = 0
CFU/100 mL< 1E. coli 2019-01-071MAC = 0
Page 2 of 3Rev 2017-11-07 Caring About Results, Obviously. Page 2 of 3

REPORTED TO Armstrong, City of
REPORTED 2019-01-22 17:14
TEST RESULTS
PROJECT Drinking Water
WORK ORDER 9011500
Analyte Result Guideline RL Units Analyzed Qualifier
Reservoir Sample Site #3 (9011500-01) | Matrix: Water | Sampled: 2019-01-21 08:00
Microbiological Parameters
CFU/100 mL< 1Coliforms, Total 2019-01-211MAC = 0
CFU/100 mL< 1E. coli 2019-01-211MAC = 0
P.V. Sample Site #4 (9011500-02) | Matrix: Water | Sampled: 2019-01-21 07:45
Microbiological Parameters
CFU/100 mL< 1Coliforms, Total 2019-01-211MAC = 0
CFU/100 mL< 1E. coli 2019-01-211MAC = 0
Highland Park Sample Site #6 (9011500-03) | Matrix: Water | Sampled: 2019-01-21 07:30
Microbiological Parameters
CFU/100 mL< 1Coliforms, Total 2019-01-211MAC = 0
CFU/100 mL< 1E. coli 2019-01-211MAC = 0
Page 2 of 3Rev 2017-11-07 Caring About Results, Obviously. Page 2 of 3

REPORTED TO Armstrong, City of
REPORTED 2019-02-07 13:16
TEST RESULTS
PROJECT Drinking Water
WORK ORDER 9020221
Analyte Result Guideline RL Units Analyzed Qualifier
Reservoir Sample Site #3 (9020221-01) | Matrix: Water | Sampled: 2019-02-05 08:30
Microbiological Parameters
CFU/100 mL< 1Coliforms, Total 2019-02-051MAC = 0
CFU/100 mL< 1E. coli 2019-02-051MAC = 0
Round Prairie Sample Site #5 (9020221-02) | Matrix: Water | Sampled: 2019-02-05 07:30
Microbiological Parameters
CFU/100 mL< 1Coliforms, Total 2019-02-051MAC = 0
CFU/100 mL< 1E. coli 2019-02-051MAC = 0
Meighan Creek Sample Site #7 (9020221-03) | Matrix: Water | Sampled: 2019-02-05 07:45
Microbiological Parameters
CFU/100 mL< 1Coliforms, Total 2019-02-051MAC = 0
CFU/100 mL< 1E. coli 2019-02-051MAC = 0
Page 2 of 3Rev 2017-11-07 Caring About Results, Obviously. Page 2 of 3

REPORTED TO Armstrong, City of
REPORTED 2019-02-28 15:57
TEST RESULTS
PROJECT Drinking Water
WORK ORDER 9021728
Analyte Result Guideline RL Units Analyzed Qualifier
Reservoir Sample Site #3 (9021728-01) | Matrix: Water | Sampled: 2019-02-26 08:30
Microbiological Parameters
CFU/100 mL< 1Coliforms, Total 2019-02-271MAC = 0
CFU/100 mL< 1E. coli 2019-02-271MAC = 0
P.V. Sample Site #4 (9021728-02) | Matrix: Water | Sampled: 2019-02-26 07:30
Microbiological Parameters
CFU/100 mL< 1Coliforms, Total 2019-02-271MAC = 0
CFU/100 mL< 1E. coli 2019-02-271MAC = 0
Highland Park Sample Site #6 (9021728-03) | Matrix: Water | Sampled: 2019-02-26 07:15
Microbiological Parameters
CFU/100 mL< 1Coliforms, Total 2019-02-271MAC = 0
CFU/100 mL< 1E. coli 2019-02-271MAC = 0
Page 2 of 3Rev 2017-11-07 Caring About Results, Obviously. Page 2 of 3

REPORTED TO Armstrong, City of
REPORTED 2019-03-14 17:15
TEST RESULTS
PROJECT Drinking Water
WORK ORDER 9030906
Analyte Result Guideline RL Units Analyzed Qualifier
Reservoir Sample Site #3 (9030906-01) | Matrix: Water | Sampled: 2019-03-12 07:45
Microbiological Parameters
CFU/100 mL< 1Coliforms, Total 2019-03-131MAC = 0
CFU/100 mL< 1E. coli 2019-03-131MAC = 0
Round Prairie Sample Site #5 (9030906-02) | Matrix: Water | Sampled: 2019-03-12 07:15
Microbiological Parameters
CFU/100 mL< 1Coliforms, Total 2019-03-131MAC = 0
CFU/100 mL< 1E. coli 2019-03-131MAC = 0
Meighan Creek Sample Site #7 (9030906-03) | Matrix: Water | Sampled: 2019-03-12 07:25
Microbiological Parameters
CFU/100 mL< 1Coliforms, Total 2019-03-131MAC = 0
CFU/100 mL< 1E. coli 2019-03-131MAC = 0
Page 2 of 3Rev 2017-11-07 Caring About Results, Obviously. Page 2 of 3

REPORTED TO Armstrong, City of
REPORTED 2019-03-29 11:09
TEST RESULTS
PROJECT Drinking Water
WORK ORDER 9032066
Analyte Result Guideline RL Units Analyzed Qualifier
Reservoir Sample Site #3 (9032066-01) | Matrix: Water | Sampled: 2019-03-26 08:30
Microbiological Parameters
CFU/100 mL< 1Coliforms, Total 2019-03-271MAC = 0
CFU/100 mL< 1E. coli 2019-03-271MAC = 0
P.V. Sample Site #4 (9032066-02) | Matrix: Water | Sampled: 2019-03-26 08:15
Microbiological Parameters
CFU/100 mL< 1Coliforms, Total 2019-03-271MAC = 0
CFU/100 mL< 1E. coli 2019-03-271MAC = 0
Highland Park Sample Site #6 (9032066-03) | Matrix: Water | Sampled: 2019-03-26 07:30
Microbiological Parameters
CFU/100 mL< 1Coliforms, Total 2019-03-271MAC = 0
CFU/100 mL< 1E. coli 2019-03-271MAC = 0
Page 2 of 3Rev 2017-11-07 Caring About Results, Obviously. Page 2 of 3

REPORTED TO Armstrong, City of
REPORTED 2019-04-10 16:47
TEST RESULTS
PROJECT Drinking Water
WORK ORDER 9040744
Analyte Result Guideline RL Units Analyzed Qualifier
Reservoir Sample Site #3 (9040744-01) | Matrix: Water | Sampled: 2019-04-08 08:00
Microbiological Parameters
CFU/100 mL< 1Coliforms, Total 2019-04-091MAC = 0
CFU/100 mL< 1E. coli 2019-04-091MAC = 0
Round Prairie Sample Site #5 (9040744-02) | Matrix: Water | Sampled: 2019-04-08 07:30
Microbiological Parameters
CFU/100 mL< 1Coliforms, Total 2019-04-091MAC = 0
CFU/100 mL< 1E. coli 2019-04-091MAC = 0
Meighan Creek Sample Site #7 (9040744-03) | Matrix: Water | Sampled: 2019-04-08 07:45
Microbiological Parameters
CFU/100 mL< 1Coliforms, Total 2019-04-091MAC = 0
CFU/100 mL< 1E. coli 2019-04-091MAC = 0
Page 2 of 3Rev 2017-11-07 Caring About Results, Obviously. Page 2 of 3

REPORTED TO Armstrong, City of
REPORTED 2019-04-26 10:34
TEST RESULTS
PROJECT Drinking Water
WORK ORDER 9042207
Analyte Result Guideline RL Units Analyzed Qualifier
Reservoir Sample Site #3 (9042207-01) | Matrix: Water | Sampled: 2019-04-24 08:00
Microbiological Parameters
CFU/100 mL< 1Coliforms, Total 2019-04-251MAC = 0
CFU/100 mL< 1E. coli 2019-04-251MAC = 0
P.V. Sample Site #4 (9042207-02) | Matrix: Water | Sampled: 2019-04-24 07:45
Microbiological Parameters
CFU/100 mL< 1Coliforms, Total 2019-04-251MAC = 0
CFU/100 mL< 1E. coli 2019-04-251MAC = 0
Highland Park Sample Site #6 (9042207-03) | Matrix: Water | Sampled: 2019-04-24 07:30
Microbiological Parameters
CFU/100 mL< 1Coliforms, Total 2019-04-251MAC = 0
CFU/100 mL< 1E. coli 2019-04-251MAC = 0
Page 2 of 3Rev 2017-11-07 Caring About Results, Obviously. Page 2 of 3

REPORTED TO Armstrong, City of
REPORTED 2019-05-10 17:17
TEST RESULTS
PROJECT Drinking Water
WORK ORDER 9050823
Analyte Result Guideline RL Units Analyzed Qualifier
Reservoir Sample Site #3 (9050823-01) | Matrix: Water | Sampled: 2019-05-08 08:00
Microbiological Parameters
CFU/100 mL< 1Coliforms, Total 2019-05-091MAC = 0
CFU/100 mL< 1E. coli 2019-05-091MAC = 0
Round Prairie Sample Site #5 (9050823-02) | Matrix: Water | Sampled: 2019-05-08 07:30
Microbiological Parameters
CFU/100 mL< 1Coliforms, Total 2019-05-091MAC = 0
CFU/100 mL< 1E. coli 2019-05-091MAC = 0
Meighan Creek Sample Site #7 (9050823-03) | Matrix: Water | Sampled: 2019-05-08 07:45
Microbiological Parameters
CFU/100 mL< 1Coliforms, Total 2019-05-091MAC = 0
CFU/100 mL< 1E. coli 2019-05-091MAC = 0
Page 2 of 3Rev 2017-11-07 Caring About Results, Obviously. Page 2 of 3

REPORTED TO Armstrong, City of
REPORTED 2019-05-28 14:26
TEST RESULTS
PROJECT Drinking Water
WORK ORDER 9052014
Analyte Result Guideline RL Units Analyzed Qualifier
Reservoir Sample Site #3 (9052014-01) | Matrix: Water | Sampled: 2019-05-22 08:00
Microbiological Parameters
CFU/100 mL< 1Coliforms, Total 2019-05-231MAC = 0
CFU/100 mL< 1E. coli 2019-05-231MAC = 0
P.V. Sample Site #4 (9052014-02) | Matrix: Water | Sampled: 2019-05-22 07:45
Microbiological Parameters
CFU/100 mL< 1Coliforms, Total 2019-05-231MAC = 0
CFU/100 mL< 1E. coli 2019-05-231MAC = 0
Highland Park Sample Site #6 (9052014-03) | Matrix: Water | Sampled: 2019-05-22 07:30
Microbiological Parameters
CFU/100 mL< 1Coliforms, Total 2019-05-231MAC = 0
CFU/100 mL< 1E. coli 2019-05-231MAC = 0
Page 2 of 3Rev 2017-11-07 Caring About Results, Obviously. Page 2 of 3

REPORTED TO Armstrong, City of
REPORTED 2019-06-14 17:44
TEST RESULTS
PROJECT Drinking Water
WORK ORDER 9061014
Analyte Result Guideline RL Units Analyzed Qualifier
Reservoir Sample Site #3 (9061014-01) | Matrix: Water | Sampled: 2019-06-11 08:00
Microbiological Parameters
CFU/100 mL< 1Coliforms, Total 2019-06-111MAC = 0
CFU/100 mL< 1E. coli 2019-06-111MAC = 0
Round Prairie Sample Site #5 (9061014-02) | Matrix: Water | Sampled: 2019-06-11 07:30
Microbiological Parameters
CFU/100 mL< 1Coliforms, Total 2019-06-111MAC = 0
CFU/100 mL< 1E. coli 2019-06-111MAC = 0
Meighan Creek Sample Site #7 (9061014-03) | Matrix: Water | Sampled: 2019-06-11 07:45
Microbiological Parameters
CFU/100 mL< 1Coliforms, Total 2019-06-111MAC = 0
CFU/100 mL< 1E. coli 2019-06-111MAC = 0
Page 2 of 3Rev 2017-11-07 Caring About Results, Obviously. Page 2 of 3

REPORTED TO Armstrong, City of
REPORTED 2019-06-24 12:09
TEST RESULTS
PROJECT Drinking Water
WORK ORDER 9062172
Analyte Result Guideline RL Units Analyzed Qualifier
Reservoir Sample Site #3 (9062172-01) | Matrix: Water | Sampled: 2019-06-20 08:00
Microbiological Parameters
CFU/100 mL< 1Coliforms, Total 2019-06-211MAC = 0
CFU/100 mL< 1E. coli 2019-06-211MAC = 0
P.V. Sample Site #4 (9062172-02) | Matrix: Water | Sampled: 2019-06-20 07:30
Microbiological Parameters
CFU/100 mL< 1Coliforms, Total 2019-06-211MAC = 0
CFU/100 mL< 1E. coli 2019-06-211MAC = 0
Highland Park Sample Site #6 (9062172-03) | Matrix: Water | Sampled: 2019-06-20 07:15
Microbiological Parameters
CFU/100 mL< 1Coliforms, Total 2019-06-211MAC = 0
CFU/100 mL< 1E. coli 2019-06-211MAC = 0
Page 2 of 3Rev 2017-11-07 Caring About Results, Obviously. Page 2 of 3

REPORTED TO Armstrong, City of
REPORTED 2019-07-15 17:45
TEST RESULTS
PROJECT Drinking Water
WORK ORDER 9071109
Analyte Result Guideline RL Units Analyzed Qualifier
Reservoir Sample Site #3 (9071109-01) | Matrix: Water | Sampled: 2019-07-10 08:00
Microbiological Parameters
CFU/100 mL< 1Coliforms, Total 2019-07-111MAC = 0
CFU/100 mL< 1E. coli 2019-07-111MAC = 0
Round Prairie Sample Site #5 (9071109-02) | Matrix: Water | Sampled: 2019-07-10 07:30
Microbiological Parameters
CFU/100 mL< 1Coliforms, Total 2019-07-111MAC = 0
CFU/100 mL< 1E. coli 2019-07-111MAC = 0
Meighan Creek Sample Site #7 (9071109-03) | Matrix: Water | Sampled: 2019-07-10 07:45
Microbiological Parameters
CFU/100 mL< 1Coliforms, Total 2019-07-111MAC = 0
CFU/100 mL< 1E. coli 2019-07-111MAC = 0
Page 2 of 3Rev 2017-11-07 Caring About Results, Obviously. Page 2 of 3
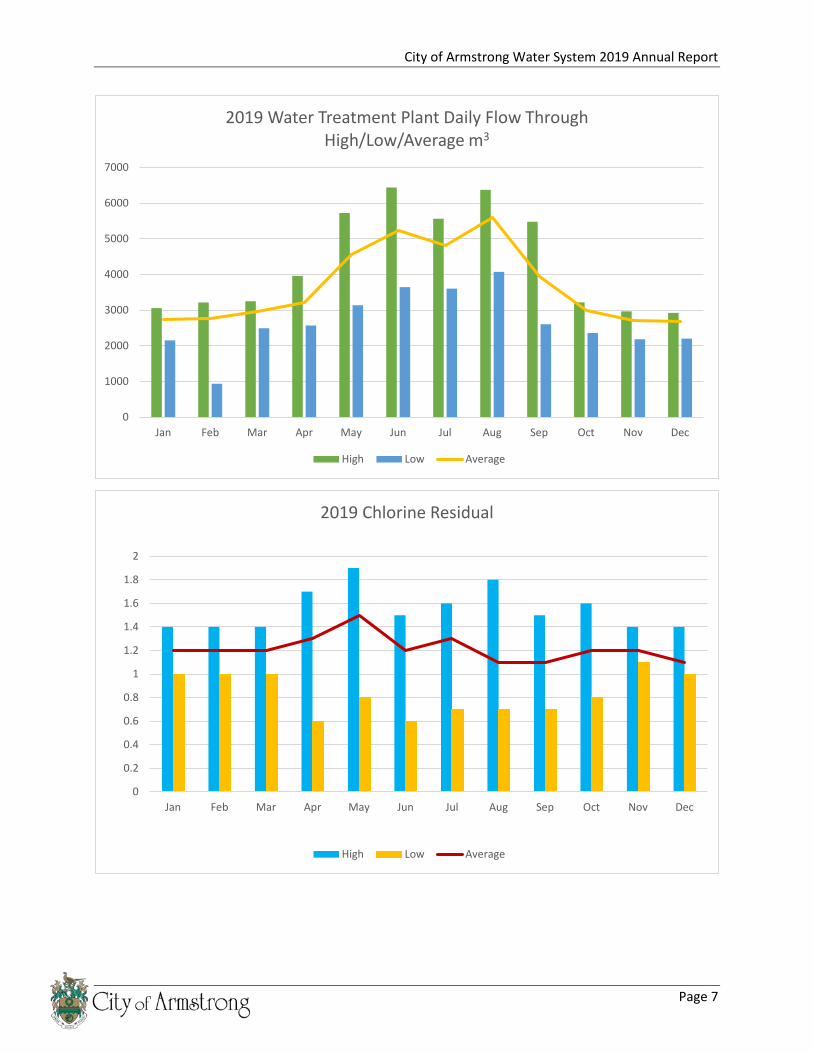
REPORTED TO Armstrong, City of
REPORTED 2019-07-26 17:15
TEST RESULTS
PROJECT Drinking Water
WORK ORDER 9072627
Analyte Result Guideline RL Units Analyzed Qualifier
Reservoir Sample Site #3 (9072627-01) | Matrix: Water | Sampled: 2019-07-25 08:30
Microbiological Parameters
CFU/100 mL< 1Coliforms, Total 2019-07-251MAC = 0
CFU/100 mL< 1E. coli 2019-07-251MAC = 0
P.V. Sample Site #4 (9072627-02) | Matrix: Water | Sampled: 2019-07-25 08:00
Microbiological Parameters
CFU/100 mL< 1Coliforms, Total 2019-07-251MAC = 0
CFU/100 mL< 1E. coli 2019-07-251MAC = 0
Highland Park Sample Site #6 (9072627-03) | Matrix: Water | Sampled: 2019-07-25 07:30
Microbiological Parameters
CFU/100 mL< 1Coliforms, Total 2019-07-251MAC = 0
CFU/100 mL< 1E. coli 2019-07-251MAC = 0
Page 2 of 3Rev 2017-11-07 Caring About Results, Obviously. Page 2 of 3

REPORTED TO Armstrong, City of
REPORTED 2019-08-08 12:30
TEST RESULTS
PROJECT Drinking Water
WORK ORDER 9080317
Analyte Result Guideline RL Units Analyzed Qualifier
Reservoir Sample Site #3 (9080317-01) | Matrix: Water | Sampled: 2019-08-06 08:00
Microbiological Parameters
CFU/100 mL< 1Coliforms, Total 2019-08-061MAC = 0
CFU/100 mL< 1E. coli 2019-08-061MAC = 0
Round Prairie Sample Site #5 (9080317-02) | Matrix: Water | Sampled: 2019-08-06 07:30
Microbiological Parameters
CFU/100 mL< 1Coliforms, Total 2019-08-061MAC = 0
CFU/100 mL< 1E. coli 2019-08-061MAC = 0
Meighan Creek Sample Site #7 (9080317-03) | Matrix: Water | Sampled: 2019-08-06 07:45
Microbiological Parameters
CFU/100 mL< 1Coliforms, Total 2019-08-061MAC = 0
CFU/100 mL< 1E. coli 2019-08-061MAC = 0
Page 2 of 3Rev 2017-11-07 Caring About Results, Obviously. Page 2 of 3

REPORTED TO Armstrong, City of
REPORTED 2019-08-26 10:12
TEST RESULTS
PROJECT Drinking Water
WORK ORDER 9082018
Analyte Result Guideline RL Units Analyzed Qualifier
Reservoir Sample Site #3 (9082018-01) | Matrix: Water | Sampled: 2019-08-21 08:30
Microbiological Parameters
CFU/100 mL< 1Coliforms, Total 2019-08-221MAC = 0
CFU/100 mL< 1E. coli 2019-08-221MAC = 0
P.V. Sample Site #4 (9082018-02) | Matrix: Water | Sampled: 2019-08-21 07:45
Microbiological Parameters
CFU/100 mL< 1Coliforms, Total 2019-08-221MAC = 0
CFU/100 mL< 1E. coli 2019-08-221MAC = 0
Highland Park Sample Site #6 (9082018-03) | Matrix: Water | Sampled: 2019-08-21 07:30
Microbiological Parameters
CFU/100 mL< 1Coliforms, Total 2019-08-221MAC = 0
CFU/100 mL< 1E. coli 2019-08-221MAC = 0
Page 2 of 3Rev 2017-11-07 Caring About Results, Obviously. Page 2 of 3

REPORTED TO Armstrong, City of
REPORTED 2019-09-12 16:43
TEST RESULTS
PROJECT Drinking Water
WORK ORDER 9090876
Analyte Result Guideline RL Units Analyzed Qualifier
Reservoir Sample Site #3 (9090876-01) | Matrix: Water | Sampled: 2019-09-10 08:00
Microbiological Parameters
CFU/100 mL< 1Coliforms, Total 2019-09-111MAC = 0
CFU/100 mL< 1E. coli 2019-09-111MAC = 0
Round Prairie Sample Site #5 (9090876-02) | Matrix: Water | Sampled: 2019-09-10 07:30
Microbiological Parameters
CFU/100 mL< 1Coliforms, Total 2019-09-111MAC = 0
CFU/100 mL< 1E. coli 2019-09-111MAC = 0
Meighan Creek Sample Site #7 (9090876-03) | Matrix: Water | Sampled: 2019-09-10 07:45
Microbiological Parameters
CFU/100 mL< 1Coliforms, Total 2019-09-111MAC = 0
CFU/100 mL< 1E. coli 2019-09-111MAC = 0
Page 2 of 3Rev 2017-11-07 Caring About Results, Obviously. Page 2 of 3

REPORTED TO Armstrong, City of
REPORTED 2019-09-30 10:10
TEST RESULTS
PROJECT Drinking Water
WORK ORDER 9092721
Analyte Result Guideline RL Units Analyzed Qualifier
Reservoir Sample Site #3 (9092721-01) | Matrix: Water | Sampled: 2019-09-26 08:30
Microbiological Parameters
CFU/100 mL< 1Coliforms, Total 2019-09-271MAC = 0
CFU/100 mL< 1E. coli 2019-09-271MAC = 0
P.V. Sample Site #4 (9092721-02) | Matrix: Water | Sampled: 2019-09-26 08:15
Microbiological Parameters
CFU/100 mL< 1Coliforms, Total 2019-09-271MAC = 0
CFU/100 mL< 1E. coli 2019-09-271MAC = 0
Highland Park Sample Site #6 (9092721-03) | Matrix: Water | Sampled: 2019-09-26 08:00
Microbiological Parameters
CFU/100 mL< 1Coliforms, Total 2019-09-271MAC = 0
CFU/100 mL< 1E. coli 2019-09-271MAC = 0
Page 2 of 3Rev 2017-11-07 Caring About Results, Obviously. Page 2 of 3

REPORTED TO Armstrong, City of
REPORTED 2019-10-12 14:06
TEST RESULTS
PROJECT Drinking Water
WORK ORDER 9101217
Analyte Result Guideline RL Units Analyzed Qualifier
Reservoir Sample Site #3 (9101217-01) | Matrix: Water | Sampled: 2019-10-10 08:00
Microbiological Parameters
CFU/100 mL< 1Coliforms, Total 2019-10-111MAC = 0
CFU/100 mL< 1E. coli 2019-10-111MAC = 0
Round Prairie Sample Site #5 (9101217-02) | Matrix: Water | Sampled: 2019-10-10 07:30
Microbiological Parameters
CFU/100 mL< 1Coliforms, Total 2019-10-111MAC = 0
CFU/100 mL< 1E. coli 2019-10-111MAC = 0
Meighan Creek Sample Site #7 (9101217-03) | Matrix: Water | Sampled: 2019-10-10 07:45
Microbiological Parameters
CFU/100 mL< 1Coliforms, Total 2019-10-111MAC = 0
CFU/100 mL< 1E. coli 2019-10-111MAC = 0
Page 2 of 3Rev 2017-11-07 Caring About Results, Obviously. Page 2 of 3

REPORTED TO Armstrong, City of
REPORTED 2019-11-06 10:19
TEST RESULTS
PROJECT Drinking Water
WORK ORDER 9102090
Analyte Result Guideline RL Units Analyzed Qualifier
Reservoir Sample Site #3 (9102090-01) | Matrix: Water | Sampled: 2019-10-22 08:15
Microbiological Parameters
CFU/100 mL< 1Coliforms, Total 2019-10-231MAC = 0
CFU/100 mL< 1E. coli 2019-10-231MAC = 0
P.V. Sample Site #4 (9102090-02) | Matrix: Water | Sampled: 2019-10-22 07:30
Microbiological Parameters
CFU/100 mL< 1Coliforms, Total 2019-10-231MAC = 0
CFU/100 mL< 1E. coli 2019-10-231MAC = 0
Highland Park Sample Site #6 (9102090-03) | Matrix: Water | Sampled: 2019-10-22 07:15
Microbiological Parameters
CFU/100 mL< 1Coliforms, Total 2019-10-231MAC = 0
CFU/100 mL< 1E. coli 2019-10-231MAC = 0
Page 2 of 3Rev 2017-11-07 Caring About Results, Obviously. Page 2 of 3

REPORTED TO Armstrong, City of
REPORTED 2019-11-08 16:51
TEST RESULTS
PROJECT Drinking Water
WORK ORDER N001099
Analyte Result Guideline RL Units Analyzed Qualifier
Reservoir Sample Site #3 (N001099-01) | Matrix: Water | Sampled: 2019-11-06 08:00
Microbiological Parameters
CFU/100 mL< 1Coliforms, Total 2019-11-071MAC = 0
CFU/100 mL< 1E. coli 2019-11-071MAC = 0
Round Prairie Sample Site #5 (N001099-02) | Matrix: Water | Sampled: 2019-11-06 07:15
Microbiological Parameters
CFU/100 mL< 1Coliforms, Total 2019-11-071MAC = 0
CFU/100 mL< 1E. coli 2019-11-071MAC = 0
Meighan Creek Sample Site #7 (N001099-03) | Matrix: Water | Sampled: 2019-11-06 07:30
Microbiological Parameters
CFU/100 mL< 1Coliforms, Total 2019-11-071MAC = 0
CFU/100 mL< 1E. coli 2019-11-071MAC = 0
Page 2 of 3Rev 2017-11-07 Caring About Results, Obviously. Page 2 of 3

REPORTED TO Armstrong, City of
REPORTED 2019-11-20 19:12
TEST RESULTS
PROJECT Drinking Water
WORK ORDER 9110250
Analyte Result Guideline RL Units Analyzed Qualifier
Reservoir Sample Site #3 (9110250-01) | Matrix: Water | Sampled: 2019-11-19 08:00
Microbiological Parameters
CFU/100 mL< 1Coliforms, Total 2019-11-191MAC = 0
CFU/100 mL< 1E. coli 2019-11-191MAC = 0
P.V. Sample Site #4 (9110250-02) | Matrix: Water | Sampled: 2019-11-19 07:30
Microbiological Parameters
CFU/100 mL< 1Coliforms, Total 2019-11-191MAC = 0
CFU/100 mL< 1E. coli 2019-11-191MAC = 0
Highland Park Sample Site #6 (9110250-03) | Matrix: Water | Sampled: 2019-11-19 07:45
Microbiological Parameters
CFU/100 mL< 1Coliforms, Total 2019-11-191MAC = 0
CFU/100 mL< 1E. coli 2019-11-191MAC = 0
Page 2 of 3Rev 2017-11-07 Caring About Results, Obviously. Page 2 of 3

REPORTED TO Armstrong, City of
REPORTED 2019-12-13 15:22
TEST RESULTS
PROJECT Drinking Water
WORK ORDER 9120923
Analyte Result Guideline RL Units Analyzed Qualifier
Reservoir Sample Site #3 (9120923-01) | Matrix: Water | Sampled: 2019-12-10 08:00
Microbiological Parameters
CFU/100 mL< 1Coliforms, Total 2019-12-111MAC = 0
CFU/100 mL< 1E. coli 2019-12-111MAC = 0
Round Prairie Sample Site #5 (9120923-02) | Matrix: Water | Sampled: 2019-12-10 07:30
Microbiological Parameters
CFU/100 mL< 1Coliforms, Total 2019-12-111MAC = 0
CFU/100 mL< 1E. coli 2019-12-111MAC = 0
Meighan Creek Sample Site #7 (9120923-03) | Matrix: Water | Sampled: 2019-12-10 07:45
Microbiological Parameters
CFU/100 mL< 1Coliforms, Total 2019-12-111MAC = 0
CFU/100 mL< 1E. coli 2019-12-111MAC = 0
Page 2 of 3Rev 2017-11-07 Caring About Results, Obviously. Page 2 of 3

REPORTED TO Armstrong, City of
REPORTED 2019-12-23 17:08
TEST RESULTS
PROJECT Drinking Water
WORK ORDER 9121715
Analyte Result Guideline RL Units Analyzed Qualifier
Reservoir Sample Site #3 (9121715-01) | Matrix: Water | Sampled: 2019-12-18 08:30
Microbiological Parameters
CFU/100 mL< 1Coliforms, Total 2019-12-191MAC = 0
CFU/100 mL< 1E. coli 2019-12-191MAC = 0
P.V. Sample Site #4 (9121715-02) | Matrix: Water | Sampled: 2019-12-18 07:15
Microbiological Parameters
CFU/100 mL< 1Coliforms, Total 2019-12-191MAC = 0
CFU/100 mL< 1E. coli 2019-12-191MAC = 0
Highland Park Sample Site #6 (9121715-03) | Matrix: Water | Sampled: 2019-12-18 07:30
Microbiological Parameters
CFU/100 mL< 1Coliforms, Total 2019-12-191MAC = 0
CFU/100 mL< 1E. coli 2019-12-191MAC = 0
Page 2 of 3Rev 2017-11-07 Caring About Results, Obviously. Page 2 of 3

City of Armstrong Water System 2019 Annual Report
Page 34
Raw Water Reports

REPORTED TO Armstrong, City of
REPORTED 2019-01-10 16:23
TEST RESULTS
PROJECT Raw Water
WORK ORDER 9010389
Analyte Result Guideline RL Units Analyzed Qualifier
WTP - Raw Water (9010389-01) | Matrix: Water | Sampled: 2019-01-07 08:15
Microbiological Parameters
CFU/100 mL9Coliforms, Total 2019-01-081MAC = 0
CFU/100 mL< 1Coliforms, Fecal 2019-01-081N/A
CFU/100 mL< 1E. coli 2019-01-081MAC = 0
Page 2 of 3Rev 2017-11-07 Caring About Results, Obviously. Page 2 of 3

REPORTED TO Armstrong, City of
REPORTED 2019-03-29 09:28
TEST RESULTS
PROJECT Raw Water
WORK ORDER 9032067
Analyte Result Guideline RL Units Analyzed Qualifier
WTP - Raw Water (9032067-01) | Matrix: Water | Sampled: 2019-03-26 08:35
General Parameters
pH units8.14pH 2019-03-270.10 HT27.0-10.5
Microbiological Parameters
CFU/100 mL14Coliforms, Total 2019-03-271MAC = 0
CFU/100 mL> 200Background Colonies 2019-03-27200N/A
CFU/100 mL< 1Coliforms, Fecal 2019-03-271N/A
CFU/100 mL< 1E. coli 2019-03-271MAC = 0
Sample Qualifiers:
HT2 The 15 minute recommended holding time (from sampling to analysis) has been exceeded - field analysis is
recommended.
Page 2 of 3Rev 2017-11-07 Caring About Results, Obviously. Page 2 of 3

REPORTED TO Armstrong, City of
REPORTED 2019-05-01 10:13
TEST RESULTS
PROJECT Raw Water
WORK ORDER 9042209
Analyte Result Guideline RL Units Analyzed Qualifier
WTP - Raw Water (9042209-01) | Matrix: Water | Sampled: 2019-04-24 08:30
Microbiological Parameters
CFU/100 mL38Coliforms, Total 2019-04-251MAC = 0
CFU/100 mL> 200Background Colonies 2019-04-25200N/A
CFU/100 mL1Coliforms, Fecal 2019-04-251N/A
CFU/100 mL< 1E. coli 2019-04-251MAC = 0
Page 2 of 3Rev 2017-11-07 Caring About Results, Obviously. Page 2 of 3

REPORTED TO Armstrong, City of
REPORTED 2019-05-14 12:22
TEST RESULTS
PROJECT Raw Water
WORK ORDER 9050827
Analyte Result Guideline RL Units Analyzed Qualifier
WTP - Raw Water (9050827-01) | Matrix: Water | Sampled: 2019-05-08 08:15
General Parameters
pH units6.67pH 2019-05-110.10 HT27.0-10.5
Microbiological Parameters
CFU/100 mL52Coliforms, Total 2019-05-091MAC = 0
CFU/100 mL> 200Background Colonies 2019-05-09200N/A
CFU/100 mL5Coliforms, Fecal 2019-05-091N/A
CFU/100 mL< 1E. coli 2019-05-091MAC = 0
Sample Qualifiers:
HT2 The 15 minute recommended holding time (from sampling to analysis) has been exceeded - field analysis is
recommended.
Page 2 of 3Rev 2017-11-07 Caring About Results, Obviously. Page 2 of 3

REPORTED TO Armstrong, City of
REPORTED 2019-06-14 16:38
TEST RESULTS
PROJECT Raw Water
WORK ORDER 9061015
Analyte Result Guideline RL Units Analyzed Qualifier
WTP - Raw Water (9061015-01) | Matrix: Water | Sampled: 2019-06-11 08:15
General Parameters
pH units7.76pH 2019-06-120.10 HT27.0-10.5
Microbiological Parameters
CFU/100 mL61Coliforms, Total 2019-06-121MAC = 0
CFU/100 mL> 200Background Colonies 2019-06-12200N/A
CFU/100 mL2Coliforms, Fecal 2019-06-121N/A
CFU/100 mL2E. coli 2019-06-121MAC = 0
Sample Qualifiers:
HT2 The 15 minute recommended holding time (from sampling to analysis) has been exceeded - field analysis is
recommended.
Page 2 of 3Rev 2017-11-07 Caring About Results, Obviously. Page 2 of 3

REPORTED TO Armstrong, City of
REPORTED 2019-07-15 16:21
TEST RESULTS
PROJECT Raw Water
WORK ORDER 9071099
Analyte Result Guideline RL Units Analyzed Qualifier
WTP - Raw Water (9071099-01) | Matrix: Water | Sampled: 2019-07-10 08:15
General Parameters
pH units7.98pH 2019-07-110.10 HT27.0-10.5
Microbiological Parameters
CFU/100 mL120Coliforms, Total 2019-07-111MAC = 0
CFU/100 mL> 200Background Colonies 2019-07-11200N/A
CFU/100 mL1Coliforms, Fecal 2019-07-111N/A
CFU/100 mL1E. coli 2019-07-111MAC = 0
Sample Qualifiers:
HT2 The 15 minute recommended holding time (from sampling to analysis) has been exceeded - field analysis is
recommended.
Page 2 of 3Rev 2017-11-07 Caring About Results, Obviously. Page 2 of 3

REPORTED TO Armstrong, City of
REPORTED 2019-09-12 16:44
TEST RESULTS
PROJECT Raw Water
WORK ORDER 9090878
Analyte Result Guideline RL Units Analyzed Qualifier
WTP - Raw Water (9090878-01) | Matrix: Water | Sampled: 2019-09-10 08:15
General Parameters
pH units8.04pH 2019-09-110.10 HT27.0-10.5
Microbiological Parameters
CFU/100 mL170Coliforms, Total 2019-09-111MAC = 0
CFU/100 mL> 200Background Colonies 2019-09-11200N/A
CFU/100 mL1Coliforms, Fecal 2019-09-111N/A
CFU/100 mL1E. coli 2019-09-111MAC = 0
Sample Qualifiers:
HT2 The 15 minute recommended holding time (from sampling to analysis) has been exceeded - field analysis is
recommended.
Page 2 of 3Rev 2017-11-07 Caring About Results, Obviously. Page 2 of 3
REPORTED TO Armstrong, City of
REPORTED 2019-10-17 00:07
TEST RESULTS
PROJECT Raw Water
WORK ORDER 9101214
Analyte Result Guideline RL Units Analyzed Qualifier
WTP - Raw Water (9101214-01) | Matrix: Water | Sampled: 2019-10-10 08:45
General Parameters
pH units7.79pH 2019-10-150.10 HT27.0-10.5
Microbiological Parameters
CFU/100 mL 11Coliforms, Total 2019-10-111MAC = 0
CFU/100 mL> 200Background Colonies 2019-10-11200N/A
CFU/100 mL< 1Coliforms, Fecal 2019-10-111N/A
CFU/100 mL< 1E. coli 2019-10-111MAC = 0
Sample Qualifiers:
HT2 The 15 minute recommended holding time (from sampling to analysis) has been exceeded - field analysis is
recommended.
Page 2 of 3Rev 2017-11-07 Caring About Results, Obviously. Page 2 of 3

REPORTED TO Armstrong, City of
REPORTED 2019-11-14 13:40
TEST RESULTS
PROJECT Raw Water
WORK ORDER N001101
Analyte Result Guideline RL Units Analyzed Qualifier
WTP - Raw Water (N001101-01) | Matrix: Water | Sampled: 2019-11-06 08:15
General Parameters
pH units7.71pH 2019-11-130.10 HT27.0-10.5
Microbiological Parameters
MPN/100 mL83.3Coliforms, Total 2019-11-071.0N/A
MPN/100 mL< 1.0Coliforms, Fecal 2019-11-071.0N/A
MPN/100 mL< 1.0E. coli 2019-11-071.0N/A
Sample Qualifiers:
HT2 The 15 minute recommended holding time (from sampling to analysis) has been exceeded - field analysis is
recommended.
Page 2 of 3Rev 2017-11-07 Caring About Results, Obviously. Page 2 of 3

REPORTED TO Armstrong, City of
REPORTED 2019-12-13 15:14
TEST RESULTS
PROJECT Raw Water
WORK ORDER 9120910
Analyte Result Guideline RL Units Analyzed Qualifier
WTP - Raw Water (9120910-01) | Matrix: Water | Sampled: 2019-12-10 08:30
General Parameters
pH units7.88pH 2019-12-120.10 HT27.0-10.5
Microbiological Parameters
MPN/100 mL14.5Coliforms, Total 2019-12-111.0N/A
MPN/100 mL< 1.0Coliforms, Fecal 2019-12-111.0N/A
MPN/100 mL< 1.0E. coli 2019-12-111.0N/A
Sample Qualifiers:
HT2 The 15 minute recommended holding time (from sampling to analysis) has been exceeded - field analysis is
recommended.
Page 2 of 3Rev 2017-11-07 Caring About Results, Obviously. Page 2 of 3

City of Armstrong Water System 2019 Annual Report
Page 45
Trihalomethane (THM) Reports

REPORTED TO Armstrong, City of
REPORTED 2019-03-02 20:41
TEST RESULTS
PROJECT Trihalomethanes
WORK ORDER 9021753
Analyte Result Guideline RL Units Analyzed Qualifier
THM-PW SHOP (Brown/Soft Cap) (9021753-01) | Matrix: Water | Sampled: 2019-02-26 08:45
Calculated Parameters
mg/L0.0154Total Trihalomethanes N/A0.00400MAC = 0.1
Volatile Organic Compounds (VOC)
mg/L0.0014Bromodichloromethane 2019-03-020.0010N/A
mg/L< 0.0010Bromoform 2019-03-020.0010N/A
mg/L0.0141Chloroform 2019-03-020.0010N/A
mg/L< 0.0010Dibromochloromethane 2019-03-020.0010N/A
2019-03-0295 70-130 Surrogate: Toluene-d8 %
2019-03-02106 70-130 Surrogate: 4-Bromofluorobenzene %
Page 2 of 3Rev 2017-11-07 Caring About Results, Obviously. Page 2 of 3

REPORTED TO Armstrong, City of
REPORTED 2019-05-26 09:06
TEST RESULTS
PROJECT Trihalomethanes
WORK ORDER 9052027
Analyte Result Guideline RL Units Analyzed Qualifier
THM-PW SHOP (Brown/Soft Cap) (9052027-01) | Matrix: Water | Sampled: 2019-05-22 08:30
Calculated Parameters
mg/L0.224Total Trihalomethanes N/A0.0130MAC = 0.1
Volatile Organic Compounds (VOC)
mg/L0.0014Bromodichloromethane 2019-05-220.0010N/A
mg/L< 0.0010Bromoform 2019-05-220.0010N/A
mg/L0.222Chloroform 2019-05-250.0010N/A
mg/L< 0.0010Dibromochloromethane 2019-05-220.0010N/A
2019-05-22110 70-130 Surrogate: Toluene-d8 %
2019-05-22118 70-130 Surrogate: 4-Bromofluorobenzene %
Page 2 of 3Rev 2017-11-07 Caring About Results, Obviously. Page 2 of 3

REPORTED TO Armstrong, City of
REPORTED 2019-11-14 17:12
TEST RESULTS
PROJECT Trihalomethanes
WORK ORDER N001219
Analyte Result Guideline RL Units Analyzed Qualifier
THM-PW SHOP (Brown/Soft Cap) (N001219-01) | Matrix: Water | Sampled: 2019-11-06 08:30
Calculated Parameters
mg/L0.0905Total Trihalomethanes N/A0.00400MAC = 0.1
Volatile Organic Compounds (VOC)
mg/L0.0014Bromodichloromethane 2019-11-140.0010N/A
mg/L< 0.0010Bromoform 2019-11-140.0010N/A
mg/L0.0892Chloroform 2019-11-140.0010N/A
mg/L< 0.0010Dibromochloromethane 2019-11-140.0010N/A
2019-11-1496 70-130 Surrogate: Toluene-d8 %
2019-11-1499 70-130 Surrogate: 4-Bromofluorobenzene %
Page 2 of 3Rev 2017-11-07 Caring About Results, Obviously. Page 2 of 3

City of Armstrong Water System 2019 Annual Report
Page 49
Schedule “A” Water Testing Results

REPORTED TO Armstrong, City of
REPORTED 2019-05-01 17:35
TEST RESULTS
PROJECT Comprehensive Analysis
WORK ORDER 9042345
Analyte Result Uncertainty RL Units Analyzed Qualifier
Surface - Raw (9042345-01) | Matrix: Water | Sampled: 2019-04-24 08:30
Anions
mg/L0.15Chloride 2019-04-270.10± 0.06
mg/L< 0.10Fluoride 2019-04-270.10
mg/L0.034Nitrate (as N) 2019-04-270.010± 0.005
mg/L< 0.010Nitrite (as N) 2019-04-270.010
mg/L14.3Sulfate 2019-04-271.0± 1.7
Calculated Parameters
mg/L71.1Hardness, Total (as CaCO3) N/A0.500
-0.3Langelier Index 2019-05-01-5.0
mg/L84.2Solids, Total Dissolved N/A1.00
General Parameters
mg/L65.2Alkalinity, Total (as CaCO3) 2019-04-261.0± 3.8
mg/L< 1.0Alkalinity, Phenolphthalein (as CaCO3) 2019-04-261.0
mg/L65.2Alkalinity, Bicarbonate (as CaCO3) 2019-04-261.0
mg/L< 1.0Alkalinity, Carbonate (as CaCO3) 2019-04-261.0
mg/L< 1.0Alkalinity, Hydroxide (as CaCO3) 2019-04-261.0
CU10Colour, True 2019-04-265.0± 3
µS/cm155Conductivity (EC) 2019-04-262.0± 4
mg/L< 0.0020Cyanide, Total 2019-04-300.0020
pH units7.88pH 2019-04-260.10 HT2± 0.02
°C22.9Temperature, at pH 2019-04-26 HT2
NTU0.42Turbidity 2019-04-260.10± 0.06
Total Metals
mg/L0.0215Aluminum, total 2019-05-010.0050± 0.0092
mg/L< 0.00020Antimony, total 2019-05-010.00020
mg/L< 0.00050Arsenic, total 2019-05-010.00050
mg/L0.0173Barium, total 2019-05-010.0050± 0.0023
mg/L< 0.0050Boron, total 2019-05-010.0050
mg/L0.000038Cadmium, total 2019-05-010.000010± 0.000017
mg/L25.4Calcium, total 2019-05-010.20± 3.6
mg/L< 0.00050Chromium, total 2019-05-010.00050
mg/L< 0.00010Cobalt, total 2019-05-010.00010
mg/L0.00146Copper, total 2019-05-010.00040± 0.00042
mg/L0.021Iron, total 2019-05-010.010± 0.016
mg/L< 0.00020Lead, total 2019-05-010.00020
mg/L1.87Magnesium, total 2019-05-010.010± 0.26
mg/L0.00067Manganese, total 2019-05-010.00020± 0.00077
mg/L< 0.000010Mercury, total 2019-05-010.000010
mg/L0.00191Molybdenum, total 2019-05-010.00010± 0.00029
mg/L0.00049Nickel, total 2019-05-010.00040± 0.00041
mg/L1.25Potassium, total 2019-05-010.10± 0.23
Page 2 of 5Rev 2017-11-07 Caring About Results, Obviously. Page 2 of 5

REPORTED TO Armstrong, City of
REPORTED 2019-05-01 17:35
TEST RESULTS
PROJECT Comprehensive Analysis
WORK ORDER 9042345
Analyte Result Uncertainty RL Units Analyzed Qualifier
Surface - Raw (9042345-01) | Matrix: Water | Sampled: 2019-04-24 08:30, Continued
Total Metals, Continued
mg/L0.00196Selenium, total 2019-05-010.00050± 0.00045
mg/L1.26Sodium, total 2019-05-010.10± 0.26
mg/L0.117Strontium, total 2019-05-010.0010± 0.014
mg/L0.00121Uranium, total 2019-05-010.000020± 0.00015
mg/L< 0.0040Zinc, total 2019-05-010.0040
Sample Qualifiers:
HT2 The 15 minute recommended holding time (from sampling to analysis) has been exceeded - field analysis is
recommended.
Page 3 of 5Rev 2017-11-07 Caring About Results, Obviously. Page 3 of 5

REPORTED TO Armstrong, City of
REPORTED 2019-09-17 18:42
TEST RESULTS
PROJECT Comprehensive Analysis
WORK ORDER 9090873
Analyte Result Uncertainty RL Units Analyzed Qualifier
PV Well, Schedule A (9090873-01) | Matrix: Water | Sampled: 2019-09-10 08:30
Anions
mg/L1.00Chloride 2019-09-120.10± 0.08
mg/L0.34Fluoride 2019-09-120.10± 0.05
mg/L< 0.010Nitrate (as N) 2019-09-120.010
mg/L< 0.010Nitrite (as N) 2019-09-120.010
mg/L35.9Sulfate 2019-09-121.0± 4.3
Calculated Parameters
mg/L248Hardness, Total (as CaCO3) N/A0.500
1.1Langelier Index 2019-09-17-5.0
mg/L332Solids, Total Dissolved N/A1.00
General Parameters
mg/L285Alkalinity, Total (as CaCO3) 2019-09-111.0± 16
mg/L< 1.0Alkalinity, Phenolphthalein (as CaCO3) 2019-09-111.0
mg/L285Alkalinity, Bicarbonate (as CaCO3) 2019-09-111.0
mg/L< 1.0Alkalinity, Carbonate (as CaCO3) 2019-09-111.0
mg/L< 1.0Alkalinity, Hydroxide (as CaCO3) 2019-09-111.0
CU8.2Colour, True 2019-09-135.0± 2.7
µS/cm554Conductivity (EC) 2019-09-112.0± 13
mg/L< 0.0020Cyanide, Total 2019-09-120.0020
pH units8.21pH 2019-09-110.10 HT2± 0.02
°C23.3Temperature, at pH 2019-09-11 HT2
NTU0.78Turbidity 2019-09-110.10± 0.07
Microbiological Parameters
CFU/100 mL< 1Coliforms, Total 2019-09-111
CFU/100 mL< 1E. coli 2019-09-111
Total Metals
mg/L< 0.0050Aluminum, total 2019-09-130.0050
mg/L< 0.00020Antimony, total 2019-09-130.00020
mg/L0.00753Arsenic, total 2019-09-130.00050± 0.00098
mg/L0.0644Barium, total 2019-09-130.0050± 0.0084
mg/L0.0419Boron, total 2019-09-130.0050± 0.0153
mg/L< 0.000010Cadmium, total 2019-09-130.000010
mg/L64.2Calcium, total 2019-09-130.20± 9.2
mg/L0.00111Chromium, total 2019-09-130.00050± 0.00055
mg/L< 0.00010Cobalt, total 2019-09-130.00010
mg/L< 0.00040Copper, total 2019-09-130.00040
mg/L0.271Iron, total 2019-09-130.010± 0.054
mg/L< 0.00020Lead, total 2019-09-130.00020
mg/L21.2Magnesium, total 2019-09-130.010± 3.0
mg/L0.223Manganese, total 2019-09-130.00020± 0.198
mg/L< 0.000010Mercury, total 2019-09-150.000010
Page 2 of 5Rev 2017-11-07 Caring About Results, Obviously. Page 2 of 5

REPORTED TO Armstrong, City of
REPORTED 2019-09-17 18:42
TEST RESULTS
PROJECT Comprehensive Analysis
WORK ORDER 9090873
Analyte Result Uncertainty RL Units Analyzed Qualifier
PV Well, Schedule A (9090873-01) | Matrix: Water | Sampled: 2019-09-10 08:30, Continued
Total Metals, Continued
mg/L0.0116Molybdenum, total 2019-09-130.00010± 0.0017
mg/L0.00042Nickel, total 2019-09-130.00040± 0.00041
mg/L7.03Potassium, total 2019-09-130.10± 1.10
mg/L< 0.00050Selenium, total 2019-09-130.00050
mg/L28.7Sodium, total 2019-09-130.10± 5.2
mg/L0.622Strontium, total 2019-09-130.0010± 0.076
mg/L0.000050Uranium, total 2019-09-130.000020± 0.000010
mg/L< 0.0040Zinc, total 2019-09-130.0040
Sample Qualifiers:
HT2 The 15 minute recommended holding time (from sampling to analysis) has been exceeded - field analysis is
recommended.
Page 3 of 5Rev 2017-11-07 Caring About Results, Obviously. Page 3 of 5

REPORTED TO Armstrong, City of
REPORTED 2019-11-13 19:06
TEST RESULTS
PROJECT Comprehensive Analysis
WORK ORDER 9102088
Analyte Result Uncertainty RL Units Analyzed Qualifier
Fire Hall Well, Schedule A (9102088-01) | Matrix: Water | Sampled: 2019-10-22 08:30
Anions
mg/L0.56Chloride 2019-10-230.10± 0.07
mg/L0.39Fluoride 2019-10-230.10± 0.05
mg/L< 0.010Nitrate (as N) 2019-10-230.010
mg/L< 0.010Nitrite (as N) 2019-10-230.010
mg/L56.5Sulfate 2019-10-231.0± 6.7
Calculated Parameters
mg/L248Hardness, Total (as CaCO3) N/A0.500
0.8Langelier Index 2019-11-13-5.0
mg/L305Solids, Total Dissolved N/A1.00
General Parameters
mg/L239Alkalinity, Total (as CaCO3) 2019-10-241.0± 13
mg/L< 1.0Alkalinity, Phenolphthalein (as CaCO3) 2019-10-241.0
mg/L239Alkalinity, Bicarbonate (as CaCO3) 2019-10-241.0
mg/L< 1.0Alkalinity, Carbonate (as CaCO3) 2019-10-241.0
mg/L< 1.0Alkalinity, Hydroxide (as CaCO3) 2019-10-241.0
CU< 5.0Colour, True 2019-10-235.0
µS/cm510Conductivity (EC) 2019-10-242.0± 12
mg/L< 0.0020Cyanide, Total 2019-11-070.0020 HT1
pH units8.11pH 2019-10-240.10 HT2± 0.02
°C20.9Temperature, at pH 2019-10-24 HT2
NTU2.63Turbidity 2019-10-230.10± 0.14
Microbiological Parameters
CFU/100 mL< 1Coliforms, Total 2019-10-231
CFU/100 mL< 1E. coli 2019-10-231
Total Metals
mg/L< 0.0050Aluminum, total 2019-10-270.0050
mg/L< 0.00020Antimony, total 2019-10-270.00020
mg/L0.00640Arsenic, total 2019-10-270.00050± 0.00086
mg/L0.0497Barium, total 2019-10-270.0050± 0.0065
mg/L0.0241Boron, total 2019-10-270.0050± 0.0105
mg/L< 0.000010Cadmium, total 2019-10-270.000010
mg/L66.9Calcium, total 2019-10-270.20± 9.5
mg/L< 0.00050Chromium, total 2019-10-270.00050
mg/L< 0.00010Cobalt, total 2019-10-270.00010
mg/L< 0.00040Copper, total 2019-10-270.00040
mg/L0.504Iron, total 2019-10-270.010± 0.097
mg/L0.00079Lead, total 2019-10-270.00020± 0.00025
mg/L19.7Magnesium, total 2019-10-270.010± 2.8
mg/L0.226Manganese, total 2019-10-270.00020± 0.201
mg/L< 0.000010Mercury, total 2019-10-280.000010
Page 2 of 5Rev 2017-11-07 Caring About Results, Obviously. Page 2 of 5

REPORTED TO Armstrong, City of
REPORTED 2019-11-13 19:06
TEST RESULTS
PROJECT Comprehensive Analysis
WORK ORDER 9102088
Analyte Result Uncertainty RL Units Analyzed Qualifier
Fire Hall Well, Schedule A (9102088-01) | Matrix: Water | Sampled: 2019-10-22 08:30, Continued
Total Metals, Continued
mg/L0.00403Molybdenum, total 2019-10-270.00010± 0.00059
mg/L< 0.00040Nickel, total 2019-10-270.00040
mg/L5.61Potassium, total 2019-10-270.10± 0.88
mg/L< 0.00050Selenium, total 2019-10-270.00050
mg/L9.30Sodium, total 2019-10-270.10± 1.70
mg/L0.894Strontium, total 2019-10-270.0010± 0.109
mg/L0.000057Uranium, total 2019-10-270.000020± 0.000011
mg/L< 0.0040Zinc, total 2019-10-270.0040
Sample Qualifiers:
HT1 The sample was prepared and/or analyzed past the recommended holding time.
HT2 The 15 minute recommended holding time (from sampling to analysis) has been exceeded - field analysis is recommended.
Page 3 of 5Rev 2017-11-07 Caring About Results, Obviously. Page 3 of 5

City of Armstrong Water System 2019 Annual Report
Page 56
Water Quality (SCADA Automatic Report)

Armstrong - Fortune Creek Month:Water Quality Report
Date UVT
Minimum Maximum Average Minimum Maximum Average Minimum Minimum Maximum Average Minimum Maximum Average
percent NTU NTU PPM PPM PPM Degrees C PPM PPM PPM Degrees C NTU NTU
January 1 99.0 0.17 0.16 1.5 2.0 1.8 4.9 1.3 1.4 1.4 4.1 0.24 0.23
January 2 99.2 0.19 0.17 1.4 2.0 1.6 5.0 1.3 1.4 1.3 4.2 0.25 0.24
January 3 99.2 0.20 0.16 1.2 1.8 1.5 5.3 1.1 1.3 1.2 4.3 0.26 0.25
January 4 99.2 0.19 0.15 1.1 1.7 1.5 5.5 1.1 1.2 1.1 4.6 0.27 0.26
January 5 99.3 0.15 0.14 1.2 1.8 1.5 5.5 1.1 1.1 1.1 4.7 0.28 0.27
January 6 99.3 0.16 0.15 1.1 1.6 1.5 5.6 1.0 1.1 1.1 4.7 0.29 0.28
January 7 99.4 0.17 0.16 1.1 1.7 1.5 4.9 1.0 1.1 1.0 4.6 0.29 0.29
January 8 99.4 0.17 0.17 1.2 1.7 1.5 4.1 1.0 1.1 1.1 3.8 0.30 0.29
January 9 99.3 0.18 0.17 0.9 1.7 1.5 4.3 1.1 1.1 1.1 3.7 0.31 0.30
January 10 99.2 0.19 0.18 0.9 1.9 1.6 4.9 1.1 1.1 1.1 3.8 0.32 0.31
January 11 99.2 0.20 0.19 0.7 1.8 1.7 5.4 1.1 1.2 1.2 4.3 0.33 0.32
January 12 99.4 0.21 0.20 1.4 1.8 1.6 5.2 1.2 1.2 1.2 4.5 0.34 0.33
January 13 99.3 0.22 0.21 0.4 1.8 1.6 4.9 1.1 1.2 1.2 4.3 0.35 0.34
January 14 99.2 0.23 0.22 1.4 1.9 1.7 4.7 1.1 1.2 1.2 4.2 0.36 0.35
January 15 99.1 0.23 0.23 1.4 1.8 1.6 4.4 1.2 1.3 1.2 3.9 0.36 0.36
January 16 99.0 0.69 0.20 1.5 1.8 1.7 4.3 1.2 1.2 1.2 3.8 0.37 0.36
January 17 99.4 0.14 0.12 1.4 1.9 1.7 4.4 1.2 1.2 1.2 3.8 0.38 0.37
January 18 99.3 0.15 0.14 1.4 1.8 1.7 4.8 1.2 1.3 1.2 3.9 0.39 0.38
January 19 99.2 0.17 0.15 1.5 1.8 1.7 5.3 1.2 1.2 1.2 4.2 0.40 0.39
January 20 99.1 0.18 0.17 1.5 1.8 1.7 5.1 1.2 1.2 1.2 4.3 0.41 0.40
January 21 99.0 0.35 0.16 1.3 1.8 1.7 4.3 1.2 1.2 1.2 3.8 0.42 0.41
January 22 98.8 0.18 0.12 1.0 1.9 1.7 4.4 1.2 1.2 1.2 3.8 0.43 0.42
January 23 98.8 1.06 0.13 1.5 1.9 1.7 4.9 1.2 1.3 1.2 3.9 0.43 0.43
January 24 99.7 0.13 0.13 1.4 1.9 1.7 4.9 1.2 1.3 1.2 4.1 0.44 0.43
January 25 99.7 0.13 0.13 1.4 1.9 1.7 4.9 1.2 1.3 1.2 4.1 0.45 0.44
January 26 99.7 0.13 0.13 1.4 1.9 1.7 5.1 1.2 1.3 1.2 4.1 0.46 0.45
January 27 99.7 0.13 0.13 1.4 1.9 1.7 5.2 1.2 1.3 1.2 4.1 0.47 0.46
January 28 99.7 0.13 0.13 1.5 1.9 1.7 4.7 1.2 1.3 1.3 4.0 0.47 0.25
January 29 99.7 0.13 0.13 1.4 1.9 1.7 4.1 1.2 1.3 1.3 3.4 0.13 0.13
January 30 99.7 0.13 0.13 1.4 1.9 1.7 4.0 1.2 1.3 1.3 3.3 0.13 0.13
January 31 99.7 0.13 0.13 1.4 1.9 1.7 4.6 1.3 1.3 1.3 3.4 0.13 0.1301-Feb-19
Total
Minimum 98.8 0.4 4.0 1.0 3.3
Average 0.2 1.6 1.2 0.3Maximum 1.06 2.0 1.4 0.47
Turbidity
Supply Water
TemperatureDistribution Turbidity
Water
Temperature
January, 2019
Post Injection Residual Chlorine Distribution Residual Chlorine

Armstrong - Fortune Creek Month:Water Quality Report
Date UVT
Minimum Maximum Average Minimum Maximum Average Minimum Minimum Maximum Average Minimum Maximum
percent NTU NTU PPM PPM PPM Degrees C PPM PPM PPM Degrees C NTU
February 1 99.9 0.28 0.21 1.6 1.9 1.8 5.0 1.3 1.3 1.3 3.7 0.13
February 2 99.8 0.13 0.12 1.4 1.9 1.7 4.8 1.2 1.3 1.3 4.1 0.13
February 3 99.6 0.13 0.13 1.4 1.8 1.6 2.6 1.2 1.3 1.2 3.4 0.13
February 4 99.9 0.14 0.13 1.3 1.7 1.6 2.2 1.2 1.2 1.2 1.9 0.13
February 5 99.9 0.14 0.14 1.3 1.7 1.6 2.1 1.2 1.3 1.3 1.4 0.13
February 6 99.9 0.15 0.14 1.3 1.7 1.6 2.3 1.3 1.3 1.3 1.4 0.13
February 7 99.9 0.15 0.15 1.3 1.7 1.5 2.6 1.2 1.4 1.3 1.5 0.13
February 8 99.9 0.16 0.15 1.2 1.6 1.4 3.1 1.2 1.3 1.2 1.7 0.13
February 9 99.9 0.16 0.16 1.1 1.6 1.4 3.1 1.2 1.2 1.2 2.3 0.13
February 10 99.9 0.17 0.16 1.2 1.5 1.4 3.0 1.1 1.2 1.2 2.1 0.13
February 11 99.9 0.17 0.17 1.1 1.5 1.3 2.7 1.1 1.2 1.1 2.1 0.13
February 12 99.9 0.18 0.17 1.0 1.5 1.3 3.2 1.0 1.1 1.1 2.1 0.13
February 13 99.9 0.18 0.18 1.1 1.6 1.4 3.4 1.1 1.2 1.1 2.4 0.13
February 14 99.9 0.18 0.15 1.3 1.5 1.4 3.3 1.1 1.2 1.2 2.5 0.13
February 15 99.9 0.13 0.13 1.3 1.7 1.5 3.6 1.2 1.2 1.2 2.6 0.13
February 16 99.9 0.13 0.13 1.2 1.7 1.4 4.0 1.2 1.2 1.2 2.9 0.13
February 17 99.9 0.13 0.13 1.2 1.6 1.4 4.0 1.1 1.2 1.2 3.2 0.13
February 18 99.9 0.13 0.13 1.3 1.5 1.4 3.5 1.1 1.2 1.2 2.9 0.13
February 19 99.9 0.13 0.13 1.3 1.6 1.4 3.5 1.1 1.2 1.2 2.6 0.13
February 20 99.9 0.13 0.13 1.3 1.6 1.5 3.7 1.2 1.2 1.2 2.6 0.13
February 21 99.9 0.13 0.13 1.1 1.6 1.4 3.8 1.2 1.2 1.2 2.7 0.13
February 22 99.9 0.13 0.13 1.3 1.6 1.4 3.8 1.2 1.2 1.2 2.9 0.13
February 23 99.9 0.13 0.13 1.3 1.5 1.4 3.8 1.2 1.2 1.2 3.0 0.13
February 24 99.9 0.13 0.13 1.3 1.5 1.4 3.9 1.1 1.2 1.2 3.0 0.13
February 25 99.9 0.18 0.13 1.3 1.6 1.4 3.4 1.1 1.2 1.2 2.7 0.14
February 26 100.0 0.20 0.15 1.2 1.5 1.4 2.8 1.1 1.2 1.2 2.1 0.19
February 27 100.0 0.29 0.16 1.2 1.6 1.4 2.7 1.1 1.2 1.2 2.0 0.16
February 28 100.0 0.13 0.13 1.3 1.6 1.4 3.4 1.1 1.2 1.2 2.0 0.16
March 2
March 304-Mar-19
Total
Minimum 99.6 1.0 2.1 1.0 1.4
Average 0.1 1.5 1.2Maximum 0.29 1.9 1.4 0.19
Distribution TurbidityWater
TemperatureTurbidity
February, 2019
SupplyPost Injection Residual Chlorine
Water
TemperatureDistribution Residual Chlorine

Average
NTU
0.13
0.13
0.13
0.13
0.13
0.13
0.13
0.13
0.13
0.13
0.13
0.13
0.13
0.13
0.13
0.13
0.13
0.13
0.13
0.13
0.13
0.13
0.13
0.13
0.13
0.14
0.14
0.16
0.1
Distribution Turbidity

* Fortune Creet tondr:
utsr'|bilimTrti*r
i*rrrI'TU
o.t3o_13
tt 13
o.13o.13o_13
tr't3nfi0.130.130.130.140.'l.l0.13tt14o.15ll- 1.1
nfio14fi1do14u.'t4n.fi0,Is(l15t].14tl.1dt
o_14
o1
trruO,Ho.140.13
La, lrtorlO.IF0.14o,13o.t3o_14
o140.1.1
0.1.111.15
0.15o1co.'t7o.mB.:Ao.Hto14D1Cau0.15u.zto.?Ea.13D,'t6o.15u.18
O,ZB
Ur*rrfu;rcrltrcllirirnOqccgC
a3a622TE
-T?-21a5a5z93.Sa83.ue23.13,23.53?3.73.8e5404-1.L24.3d,54.?4.5rt-44.4{.4.l-5
t7
ll.tdtrlL. A.ddal Gllrrhr
ffi
1"2
t?t1
t27
t2t2
t.7"l.Z
t?
t11
11
t3t4
14
1.
1
t
I
r2
t2
7
TEtz
t1
t2
td
1.1
t4
1:
t.
t:1:
t1tt11
1
1
1
1
t1
1Z
l111111'l11t1
t'l,t
11
t.4
1,
t"1,
I
tr
1:t.
Vrtttr ot'g-rrrr
IinhonOrcre C
.E
r-l
:gid-3?
"u4.t!4-t,8
4-t5
4.2a
4?I
505.1
Ii-23.4
"55.8
r3
,.?
i36
.9
{
a
I
lrt H.clL. nrr'u.rl ClL.ft
pFra
14
4
151..t
1.4
1..1
41,4
'1.5
1,5
)
15
71.3
't.3
l.r
1.{
1
1
1
1S
pFtt
1.5
1A)
1g
1.71.7
1.7
2.02..7
a.'lI
?.1
1
1.
1.1
1.
1-
?
7t
F}H1l12L?1eTrt2Lz17tt1.2
121.3teL2rz.1Z1eo,ot3L21ALZLU13121,7
1.?t51.?'t.6
t6
0.n
Detc
11:TIz]. r2L'tzrE-
0.13o.Ie
t13]":12
).len12
tll:t0.tl
n-t4
t3].t}.T]
0_14
015
nllt,E
1
Nt5nf70"lltRZ:I0-tos0"1?0.18o-E0"tEtr18otto,1r013D_SO
0,30fi21o-43t].?1ottomnm0.alaaB"247-83u-30?38o.24nztn24
t.tt3
tno
ffi.0
{n0fir01m.CIffi.0:t1.6s-8
s"3sEt ttffi1ffi"9sl0ffi.1sl1s1s5llE I37.?tr.4tr-2:n_fls.1s.6llas
tletefrZ
rrclr'l{1
Flareh 13
.,
Itlgrclr 19
lrtatchZ0
lilarc*r?6Fl€rch27
ItlerehZS
Lrhrmlrrerme
ItLrd
{rrclr
srdherch:rch
{arch 1'
arch'l
arch'lrclr'
rrcharehiryoh?
rrchi
larch i
areh l
ola
t
tt
F
H

Armstrong - Fortune Creek Month:Water Quality Report
Date UVTMinimum Maximum Average Minimum Maximum Average Minimum Minimum Maximum Average Minimum Maximum Average
percent NTU NTU PPM PPM PPM Degrees C PPM PPM PPM Degrees C NTU NTUApril 1 98.9 0.22 0.15 1.6 2.0 1.9 5.5 1.4 1.4 1.4 4.8 0.17 0.15April 2 89.6 10.00 0.20 1.7 2.1 1.9 5.6 1.4 1.4 1.4 4.8 0.18 0.16April 3 98.5 0.25 0.16 1.7 2.1 1.9 5.8 1.4 1.4 1.4 4.8 0.18 0.16April 4 98.3 0.27 0.17 1.6 2.1 1.9 5.9 1.4 1.4 1.4 4.9 0.30 0.16April 5 97.8 0.25 0.17 0.1 2.1 1.9 6.1 1.4 1.4 1.4 5.0 0.17 0.16April 6 96.6 0.40 0.19 1.6 2.1 1.9 5.9 1.3 1.4 1.3 5.2 0.19 0.17April 7 96.8 0.33 0.19 1.5 2.2 1.9 6.0 1.2 1.3 1.3 5.1 0.19 0.17April 8 97.3 0.36 0.22 1.6 2.1 1.9 5.7 1.2 1.4 1.3 5.1 0.20 0.16April 9 97.5 0.43 0.26 1.7 2.4 2.0 6.2 1.3 1.4 1.4 5.1 0.17 0.16April 10 97.0 0.37 0.23 1.8 2.1 1.9 6.2 1.3 1.4 1.4 5.3 0.19 0.16April 11 95.9 0.44 0.21 1.4 2.1 1.6 5.9 1.2 1.4 1.3 5.2 0.20 0.18April 12 96.4 0.36 0.19 1.2 1.6 1.5 6.0 1.2 1.3 1.2 5.2 0.20 0.18April 13 96.2 0.28 0.19 1.4 1.7 1.5 6.1 1.2 1.3 1.3 5.2 0.18 0.17April 14 96.0 0.29 0.20 1.3 1.6 1.5 6.1 1.2 1.3 1.2 5.2 0.25 0.16April 15 96.8 0.32 0.20 1.4 1.7 1.6 6.0 1.2 1.3 1.3 5.3 0.21 0.16April 16 97.5 0.25 0.20 1.4 1.7 1.6 5.9 1.3 1.4 1.3 5.2 0.16 0.15April 17 97.1 0.93 0.22 1.3 1.7 1.6 6.4 1.3 1.4 1.4 5.3 0.21 0.16April 18 93.1 0.47 0.25 1.2 2.5 1.6 6.9 1.4 1.4 1.4 5.7 0.20 0.17April 19 87.5 2.90 0.42 1.4 1.7 1.6 6.9 1.0 1.4 1.2 5.7 0.48 0.28April 20 84.4 1.13 0.37 1.4 1.6 1.5 6.1 0.7 1.0 0.9 5.3 0.45 0.42April 21 84.7 0.69 0.28 1.2 2.3 1.8 5.8 0.6 0.8 0.7 5.0 0.40 0.34April 22 84.4 0.36 0.27 1.9 2.4 2.2 6.3 0.7 1.3 1.0 5.0 0.53 0.24April 23 82.8 1.41 0.31 2.1 2.4 2.3 6.5 1.3 1.4 1.3 4.9 0.21 0.20April 24 80.9 0.52 0.35 2.0 2.7 2.4 5.4 1.0 1.3 1.1 5.1 0.29 0.24April 25 73.7 10.00 5.38 2.3 3.0 2.6 4.8 1.1 1.4 1.2 4.8 0.28 0.26April 26 78.1 10.00 3.50 0.4 2.9 2.6 5.2 1.3 1.5 1.4 4.8 0.28 0.24April 27 78.4 0.34 0.17 2.3 2.9 2.5 5.4 1.3 1.5 1.3 5.0 0.23 0.21April 28 67.7 0.44 0.15 2.3 2.8 2.6 5.2 1.2 1.5 1.3 4.7 0.22 0.20April 29 0.0 0.45 0.14 2.2 2.9 2.6 4.8 1.4 1.7 1.5 4.6 0.26 0.18April 30 85.5 0.72 0.14 2.2 2.8 2.5 4.7 1.5 1.7 1.6 4.6 0.20 0.18May 12-May-19Total
Minimum 0.0 0.1 4.7 0.6 4.6Average 0.5 2.0 1.3 0.2
Maximum 10.00 3.0 1.7 0.53
Distribution TurbidityWater TemperatureTurbidity
April, 2019
SupplyPost Injection Residual Chlorine Water
Temperature Distribution Residual Chlorine

Armstrong - Fortune Creek Month:Water Quality Report
Date UVTMinimum Maximum Average Minimum Maximum Average Minimum Minimum Maximum Average Minimum Maximum Average
percent NTU NTU PPM PPM PPM Degrees C PPM PPM PPM Degrees C NTU NTUMay 1 85.9 0.62 0.14 2.0 2.7 2.4 5.3 1.4 1.5 1.5 4.7 0.23 0.17May 2 86.4 0.34 0.13 2.0 2.8 2.5 5.8 1.4 1.5 1.4 5.1 0.18 0.17May 3 85.8 0.19 0.13 2.1 2.8 2.5 5.7 1.4 1.5 1.5 5.4 0.21 0.16May 4 83.7 0.41 0.15 2.2 2.9 2.5 6.1 1.4 1.5 1.5 5.6 0.18 0.16May 5 81.7 0.78 0.21 2.1 2.8 2.5 5.7 1.3 1.4 1.3 5.8 0.26 0.19May 6 79.5 0.91 0.27 2.1 2.9 2.6 6.1 1.2 1.3 1.3 5.8 0.31 0.25May 7 76.6 1.26 0.39 2.3 3.2 2.8 5.6 1.1 1.4 1.2 5.9 0.37 0.30May 8 73.9 1.40 0.54 2.6 3.4 3.0 6.3 1.3 1.5 1.4 6.0 0.52 0.43May 9 72.4 1.34 0.64 2.7 3.6 3.1 6.0 1.3 1.6 1.4 6.0 0.66 0.54
May 10 68.9 2.00 0.75 2.8 3.7 3.3 6.2 1.2 1.6 1.4 6.1 0.67 0.55May 11 65.4 2.95 1.24 2.0 4.0 3.4 6.8 1.1 1.4 1.2 6.6 0.98 0.79May 12 63.6 2.26 1.33 2.9 4.0 3.6 9.1 1.0 1.2 1.1 6.8 1.68 1.21May 13 60.2 1.85 1.02 3.0 4.7 3.7 7.3 0.8 1.8 1.2 6.9 1.45 1.08May 14 63.2 3.76 1.11 0.6 3.9 3.5 6.8 1.4 1.7 1.5 7.0 0.95 0.78May 15 63.5 2.46 1.06 3.2 5.0 4.3 6.7 1.4 1.7 1.6 6.6 1.50 1.12May 16 67.8 1.09 0.67 3.3 5.0 4.2 7.4 1.7 1.9 1.8 6.9 0.87 0.68May 17 68.1 2.51 0.75 3.0 4.2 3.7 7.0 1.5 1.7 1.6 7.1 0.78 0.67May 18 69.3 0.69 0.59 3.1 4.0 3.6 6.8 1.4 1.5 1.5 6.9 0.72 0.65May 19 70.6 0.72 0.56 3.3 4.1 3.8 7.0 1.3 1.6 1.5 6.9 0.65 0.57May 20 72.2 1.28 0.48 3.1 4.1 3.7 6.9 1.6 1.8 1.7 7.1 0.56 0.52May 21 73.5 1.83 0.43 3.2 3.8 3.5 7.0 1.6 1.7 1.7 7.1 0.51 0.46May 22 72.5 0.44 0.36 3.1 3.7 3.5 7.0 1.5 1.8 1.7 7.2 0.44 0.41May 23 76.4 0.50 0.36 3.3 3.9 3.5 7.6 1.6 1.8 1.7 7.6 0.41 0.37May 24 72.7 2.73 0.58 2.5 3.4 3.0 7.3 1.3 1.6 1.5 7.6 0.40 0.37May 25 71.6 2.24 0.79 2.8 3.2 3.0 7.6 1.2 1.4 1.3 7.8 1.02 0.73May 26 74.1 0.72 0.47 2.9 3.4 3.1 7.5 1.3 1.7 1.5 7.7 0.75 0.59May 27 76.6 0.65 0.41 2.6 3.3 3.0 7.4 1.5 1.9 1.7 7.7 0.52 0.45May 28 76.1 0.76 0.37 2.4 3.0 2.8 7.1 1.4 1.7 1.6 8.0 0.45 0.41May 29 78.8 0.43 0.34 2.7 3.1 2.9 7.9 1.4 1.5 1.4 8.4 0.44 0.37May 30 79.5 0.39 0.32 2.6 3.1 2.9 8.5 1.4 1.6 1.5 8.9 0.43 0.36May 31 80.8 0.36 0.30 2.6 3.0 2.8 8.9 1.3 1.5 1.4 9.1 0.36 0.3401-Jun-19Total
Minimum 60.2 0.6 5.3 0.8 4.7Average 0.5 3.2 1.5 0.5
Maximum 3.76 5.0 1.9 1.68
Distribution TurbidityWater TemperatureTurbidity
May, 2019
SupplyPost Injection Residual Chlorine Water
Temperature Distribution Residual Chlorine

Armstrong - Fortune Creek Month:Water Quality Report
Date UVTMinimum Maximum Average Minimum Maximum Average Minimum Minimum Maximum Average Minimum Maximum Average
percent NTU NTU PPM PPM PPM Degrees C PPM PPM PPM Degrees C NTU NTUJune 1 82.1 0.37 0.30 2.6 3.0 2.8 8.9 1.3 1.5 1.4 9.3 0.35 0.33June 2 83.2 0.35 0.28 2.4 3.0 2.7 9.1 1.3 1.5 1.4 9.4 0.34 0.33June 3 84.3 0.36 0.27 2.4 2.8 2.6 9.5 1.3 1.4 1.3 9.6 0.34 0.32June 4 80.9 0.36 0.27 2.2 2.7 2.5 8.7 1.2 1.4 1.3 8.9 0.34 0.31June 5 86.8 0.30 0.24 2.3 2.6 2.4 8.7 1.2 1.4 1.3 8.8 0.30 0.28June 6 87.6 0.27 0.22 2.1 2.9 2.3 8.3 1.3 1.5 1.4 8.6 0.27 0.26June 7 88.3 0.40 0.21 2.0 2.4 2.2 8.0 1.3 1.4 1.4 8.1 0.26 0.24June 8 84.8 0.58 0.24 1.9 2.4 2.2 8.0 1.2 1.4 1.3 8.1 0.23 0.22June 9 86.9 0.25 0.20 2.1 2.4 2.2 7.8 1.2 1.3 1.2 8.1 0.31 0.24June 10 87.5 0.25 0.20 2.1 2.5 2.3 8.3 1.2 1.4 1.3 8.4 0.23 0.22June 11 88.7 0.24 0.18 1.9 2.7 2.3 9.1 1.3 1.5 1.4 8.8 1.19 0.22June 12 89.5 0.22 0.17 1.5 2.4 1.9 9.4 1.2 1.4 1.3 9.7 0.23 0.21June 13 90.3 0.21 0.17 1.3 1.9 1.7 10.1 1.2 1.5 1.4 10.2 0.22 0.21June 14 91.2 0.22 0.18 1.3 1.6 1.5 10.1 1.1 1.2 1.2 10.3 0.22 0.20June 15 92.0 0.21 0.18 1.3 1.6 1.5 10.0 1.1 1.2 1.1 10.3 0.21 0.19June 16 92.8 0.24 0.18 1.3 1.6 1.5 9.9 1.1 1.3 1.2 10.1 0.20 0.19June 17 93.4 0.23 0.19 1.3 1.7 1.5 10.3 1.2 1.3 1.2 10.5 0.20 0.18June 18 94.0 0.33 0.20 0.0 2.3 1.4 10.0 1.2 1.3 1.2 10.7 0.19 0.18June 19 94.5 0.22 0.17 1.2 1.8 1.5 8.8 1.2 1.3 1.2 9.7 0.19 0.18June 20 93.1 0.21 0.16 1.4 1.8 1.6 8.2 1.1 1.3 1.2 8.9 0.18 0.17June 21 92.1 0.19 0.16 1.5 1.8 1.7 8.2 1.1 1.2 1.1 8.9 0.19 0.18June 22 92.0 0.17 0.15 1.5 1.9 1.7 9.0 1.0 1.1 1.1 9.4 0.18 0.17June 23 91.8 0.17 0.15 1.5 1.9 1.7 9.1 1.0 1.1 1.1 10.0 0.17 0.16June 24 91.2 0.19 0.15 1.5 1.8 1.6 8.9 1.0 1.1 1.0 9.8 0.18 0.17June 25 91.9 0.16 0.14 1.5 1.8 1.6 8.3 0.9 1.1 1.0 9.5 0.17 0.16June 26 92.9 0.25 0.15 1.5 1.9 1.6 8.5 1.0 1.2 1.1 9.5 0.17 0.16June 27 92.0 0.20 0.15 1.4 1.8 1.6 8.7 1.0 1.2 1.1 9.5 0.18 0.17June 28 87.8 0.31 0.16 1.3 1.7 1.5 8.7 0.9 1.0 1.0 9.5 0.19 0.17June 29 88.1 0.17 0.15 1.4 2.7 1.6 8.4 0.6 0.9 0.8 9.4 0.21 0.20June 30 88.7 0.34 0.18 1.9 2.7 2.2 8.4 0.6 1.5 1.2 9.5 0.18 0.17July 1
2-Jul-19Total
Minimum 80.9 0.0 7.8 0.6 8.1Average 0.2 1.9 1.2 0.2
Maximum 0.58 3.0 1.5 1.19
Distribution TurbidityWater TemperatureTurbidity
June, 2019
SupplyPost Injection Residual Chlorine Water
Temperature Distribution Residual Chlorine

Armstrong - Fortune Creek Month:Water Quality Report
Date UVTMinimum Maximum Average Minimum Maximum Average Minimum Minimum Maximum Average Minimum Maximum Average
percent NTU NTU PPM PPM PPM Degrees C PPM PPM PPM Degrees C NTU NTUJuly 1 90.8 0.24 0.14 1.6 2.3 1.9 8.8 1.2 1.5 1.3 9.7 0.17 0.16July 2 92.0 0.17 0.14 1.6 2.1 1.9 9.5 1.2 1.3 1.3 10.0 0.18 0.16July 3 92.5 0.40 0.18 1.7 2.0 1.9 9.2 1.2 1.3 1.3 10.1 0.18 0.17July 4 88.2 0.41 0.21 1.0 2.3 1.9 9.4 1.2 1.3 1.3 10.2 0.17 0.16July 5 67.7 10.00 0.53 1.9 2.6 2.3 10.0 1.0 1.2 1.1 10.2 0.39 0.30July 6 72.4 0.84 0.38 2.0 3.4 2.7 10.3 0.7 1.0 0.8 10.8 0.49 0.40July 7 73.7 0.79 0.27 2.4 3.5 2.9 10.4 0.8 1.3 1.0 11.2 0.39 0.31July 8 75.3 1.11 0.21 2.1 3.7 2.9 10.1 1.0 1.6 1.3 11.1 0.32 0.24July 9 80.8 0.42 0.19 1.7 2.9 2.5 10.2 1.2 1.5 1.4 11.0 0.22 0.20July 10 83.7 0.43 0.19 0.7 2.7 2.3 10.8 1.2 1.4 1.3 11.3 0.23 0.19July 11 84.7 0.25 0.17 1.8 2.5 2.3 10.5 1.1 1.3 1.2 11.4 0.19 0.18July 12 85.8 0.21 0.17 2.1 2.7 2.4 10.7 1.2 1.4 1.3 11.4 0.20 0.18July 13 87.2 0.20 0.15 1.9 2.7 2.4 10.5 1.3 1.6 1.5 11.4 0.31 0.17July 14 88.8 0.18 0.15 1.9 2.6 2.4 10.5 1.4 1.6 1.6 11.3 0.19 0.17July 15 90.1 0.18 0.14 1.5 3.9 2.1 10.1 1.3 1.5 1.4 11.0 0.18 0.17July 16 91.3 0.18 0.14 1.6 2.4 2.0 10.2 1.2 1.5 1.4 10.9 0.18 0.17July 17 90.3 0.23 0.15 1.4 2.0 1.8 10.2 1.1 1.3 1.2 10.9 0.17 0.16July 18 88.2 0.19 0.16 1.2 2.0 1.6 10.0 0.9 1.1 1.1 10.7 0.18 0.17July 19 87.8 0.20 0.16 1.2 2.6 1.9 9.6 0.9 1.0 0.9 10.2 0.18 0.17July 20 88.1 0.17 0.15 1.9 2.4 2.1 9.6 1.0 1.3 1.2 10.3 0.17 0.16July 21 88.7 0.37 0.16 0.5 5.0 2.2 9.5 1.2 1.4 1.3 10.4 0.39 0.19July 22 90.2 0.18 0.15 2.0 2.5 2.3 9.9 1.3 1.6 1.5 10.8 0.33 0.17July 23 91.7 0.29 0.15 1.7 2.6 2.2 10.3 1.4 1.6 1.5 11.1 0.19 0.17July 24 88.3 0.21 0.17 1.5 2.4 2.0 10.4 1.2 1.5 1.4 11.1 0.19 0.17July 25 88.1 0.18 0.16 1.5 2.3 2.0 9.8 1.1 1.4 1.2 10.8 0.20 0.17July 26 89.1 0.24 0.16 1.8 2.4 2.1 9.9 1.2 1.5 1.4 10.8 0.19 0.17July 27 86.4 0.24 0.17 1.5 2.5 2.0 10.4 1.4 1.6 1.5 11.1 0.18 0.16July 28 84.5 0.21 0.17 1.5 2.3 2.0 10.4 1.0 1.4 1.2 11.1 0.21 0.19July 29 85.2 0.27 0.17 1.5 2.4 2.1 10.2 1.0 1.3 1.2 11.2 0.23 0.19July 30 87.6 0.48 0.16 1.8 2.4 2.1 10.5 1.2 1.5 1.4 11.3 0.19 0.17July 31 90.0 0.32 0.16 1.8 2.4 2.2 10.3 1.3 1.6 1.5 11.2 0.20 0.1801-Aug-19Total
Minimum 67.7 0.5 8.8 0.7 9.7Average 0.2 2.2 1.3 0.2
Maximum 10.00 5.0 1.6 0.49
Distribution TurbidityWater TemperatureTurbidity
July, 2019
SupplyPost Injection Residual Chlorine Water
Temperature Distribution Residual Chlorine
Armstrong - Fortune Creek Month:Water Quality Report
Date UVTMinimum Maximum Average Minimum Maximum Average Minimum Minimum Maximum Average Minimum Maximum
percent NTU NTU PPM PPM PPM Degrees C PPM PPM PPM Degrees C NTUAugust 1 91.6 0.63 0.16 1.5 2.4 2.1 10.4 1.5 1.8 1.7 11.2 0.18August 2 93.1 0.19 0.16 1.3 2.0 1.7 10.2 1.2 1.6 1.3 11.0 0.20August 3 94.3 0.31 0.16 1.2 1.8 1.5 9.6 1.1 1.2 1.2 10.7 0.17August 4 95.2 0.21 0.15 1.2 1.8 1.5 9.3 1.1 1.3 1.2 10.4 0.17August 5 96.0 0.22 0.15 1.2 1.8 1.6 9.3 1.1 1.3 1.3 10.4 0.18August 6 96.7 0.23 0.15 1.4 1.9 1.7 9.4 1.2 1.4 1.3 10.5 0.19August 7 97.3 0.20 0.15 1.2 1.9 1.6 9.6 1.2 1.6 1.4 10.5August 8 97.6 0.21 0.15 1.1 1.6 1.4 9.4 1.2 1.3 1.2 10.5 0.18August 9 97.8 0.52 0.16 1.2 1.7 1.4 9.4 1.2 1.3 1.2 10.5 0.25August 10 98.1 0.57 0.16 1.0 1.6 1.4 9.7 1.1 1.2 1.2 10.6 0.23August 11 97.0 0.70 0.16 1.0 1.5 1.3 9.3 1.0 1.2 1.1 10.3 0.16August 12 94.9 0.70 0.17 1.0 1.4 1.2 9.3 0.9 1.1 1.0 10.3 0.23August 13 93.7 0.49 0.16 1.0 1.6 1.3 9.5 0.8 1.0 0.9 10.7 0.22August 14 93.4 0.43 0.16 0.9 1.6 1.3 9.7 0.8 1.0 0.9 10.8 0.20August 15 94.3 0.25 0.13 0.9 1.6 1.3 9.6 0.8 1.0 0.9 10.7 0.17August 16 94.7 0.50 0.13 0.9 1.6 1.3 10.0 0.9 1.0 0.9 10.9 0.18August 17 95.0 0.42 0.14 0.8 1.5 1.2 9.5 0.8 0.9 0.9 10.6 0.17August 18 95.2 0.66 0.14 0.8 1.4 1.2 9.4 0.8 0.9 0.8 10.4 0.16August 19 94.9 0.36 0.14 0.9 1.5 1.3 9.3 0.8 0.9 0.9 10.4 0.18August 20 95.7 0.49 0.15 1.0 1.7 1.4 9.3 0.9 1.1 1.0 10.2 0.17August 21 95.5 0.36 0.14 0.9 1.7 1.4 9.6 1.0 1.1 1.1 10.5 0.24August 22 95.8 0.91 0.13 0.9 1.6 1.3 9.5 0.9 1.0 1.0 10.5 0.17August 23 92.9 0.97 0.13 0.8 1.6 1.2 9.1 0.9 1.0 1.0 10.0 0.17August 24 95.4 0.36 0.13 0.9 1.4 1.1 9.1 0.8 0.9 0.8 10.0 0.17August 25 95.2 0.51 0.14 0.2 1.6 1.1 9.4 0.7 0.9 0.8 10.1 0.17August 26 95.1 3.52 0.15 1.0 1.7 1.4 8.9 0.7 1.0 0.9 9.9 0.16August 27 95.8 0.96 0.14 1.2 1.7 1.5 8.8 1.0 1.1 1.0 9.6 0.17August 28 96.1 0.76 0.14 1.1 1.8 1.6 9.3 1.1 1.2 1.2 9.8 0.17August 29 95.4 1.52 0.15 1.1 1.8 1.6 9.4 1.1 1.3 1.2 10.1 0.17August 30 96.4 0.41 0.14 1.4 1.9 1.7 9.7 1.2 1.4 1.3 10.3 0.18August 31 96.4 1.18 0.14 1.2 1.9 1.6 10.0 1.2 1.3 1.3 10.5 0.17
01-Sep-19Total
Minimum 91.6 0.2 8.8 0.7 9.6Average 0.1 1.4 1.1
Maximum 3.52 2.4 1.8 0.25
Distribution TurbidityWater TemperatureTurbidity
August, 2019
SupplyPost Injection Residual Chlorine Water
Temperature Distribution Residual Chlorine

AverageNTU0.170.180.160.160.160.160.160.160.160.160.150.180.180.170.160.160.160.150.160.160.160.160.160.150.150.160.160.160.160.160.16
0.2
Distribution Turbidity

Armstrong - Fortune Creek Month:Water Quality Report
Date UVT
Minimum Maximum Average Minimum Maximum Average Minimum Minimum Maximum Average Minimum Maximumpercent NTU NTU PPM PPM PPM Degrees C PPM PPM PPM Degrees C NTU
September 1 95.9 0.69 0.14 1.3 1.8 1.6 10.1 1.2 1.3 1.2 10.7 0.17September 2 96.4 1.31 0.15 1.1 1.7 1.5 10.0 1.1 1.2 1.2 10.6 0.21September 3 95.9 0.84 0.14 1.0 1.7 1.5 9.5 1.1 1.2 1.2 10.3 0.17September 4 96.2 0.60 0.15 1.0 1.7 1.4 9.9 1.0 1.1 1.1 10.4 0.19September 5 96.1 1.36 0.16 1.1 1.8 1.5 9.8 1.0 1.2 1.1 10.4 0.19September 6 96.5 0.53 0.15 1.1 1.9 1.5 10.1 1.1 1.3 1.2 10.5 0.19September 7 96.2 1.00 0.15 1.0 1.7 1.4 10.1 1.0 1.2 1.1 10.6 0.16September 8 96.3 0.45 0.15 1.0 1.7 1.3 10.1 1.0 1.1 1.0 10.5 0.17September 9 92.8 0.75 0.18 1.1 1.7 1.4 10.0 0.8 1.0 1.0 10.3 0.18September 10 89.3 0.48 0.17 1.1 2.3 1.9 9.9 0.7 1.1 0.9 10.3 0.22September 11 87.3 0.70 0.21 1.5 2.6 2.0 10.6 0.9 1.2 1.1 10.4 0.28September 12 87.6 0.64 0.18 1.5 4.2 2.3 10.7 0.8 1.0 0.9 10.9 0.27September 13 86.8 0.58 0.21 2.4 2.9 2.7 10.8 1.0 1.5 1.3 11.0 0.30September 14 87.1 0.55 0.19 2.4 3.0 2.7 11.0 1.3 1.5 1.4 11.0 0.25September 15 84.0 0.79 0.22 2.4 2.9 2.6 10.9 1.3 1.4 1.4 10.8 0.23September 16 78.7 4.96 0.25 2.3 2.7 2.5 10.8 1.0 1.3 1.2 10.7 0.35September 17 82.0 0.91 0.20 2.4 2.8 2.6 10.1 1.0 1.2 1.1 10.5 0.28September 18 81.1 0.43 0.20 2.4 2.8 2.6 10.2 1.0 1.1 1.1 10.3 0.26September 19 81.1 0.53 0.20 2.4 2.9 2.7 9.7 0.9 1.1 1.0 10.0 0.31September 20 82.1 1.37 0.19 2.5 2.9 2.7 10.2 0.9 1.2 1.0 10.0 0.22September 21 82.4 0.66 0.18 0.2 3.2 2.7 9.5 1.0 1.2 1.1 9.9 0.25September 22 83.7 2.59 0.19 2.6 3.1 2.8 10.0 1.1 1.2 1.1 9.9 0.20September 23 84.2 0.88 0.18 2.4 2.9 2.6 10.3 1.1 1.3 1.2 10.0 0.21September 24 81.9 3.94 0.22 0.1 5.0 2.3 10.0 1.1 1.2 1.1 10.0 0.25September 25 77.4 0.46 0.15 2.3 2.8 2.6 9.6 1.1 1.3 1.2 9.8 0.24September 26 84.1 0.24 0.15 2.1 2.7 2.4 8.8 1.1 1.2 1.2 9.6 0.25September 27 83.9 0.19 0.13 2.1 2.6 2.4 8.3 1.1 1.2 1.1 8.9 0.25September 28 84.1 0.17 0.13 2.0 2.6 2.3 7.9 1.0 1.1 1.1 8.6 0.20September 29 84.7 0.18 0.12 2.0 2.5 2.3 7.4 1.0 1.2 1.1 8.0 0.23September 30 85.6 0.17 0.12 2.0 2.6 2.4 7.0 1.1 1.3 1.2 7.6 0.30
October 102-Oct-19Total
Minimum 77.4 0.1 7.0 0.7 7.6Average 0.2 2.2 1.1
Maximum 4.96 5.0 1.5 0.35
Distribution TurbidityWater
TemperatureTurbidity
September, 2019
SupplyPost Injection Residual Chlorine
Water Temperature
Distribution Residual Chlorine

AverageNTU
0.160.170.160.170.160.170.160.160.170.200.240.220.230.230.200.290.240.230.220.210.200.190.200.210.200.210.210.190.180.18
0.2
Distribution Turbidity

Armstrong - Fortune Creek Month:Water Quality Report
Date UVT
Minimum Maximum Average Minimum Maximum Average Minimum Minimum Maximum Average Minimum Maximum Averagepercent NTU NTU PPM PPM PPM Degrees C PPM PPM PPM Degrees C NTU NTU
October 1 86.1 0.15 0.12 0.3 2.7 2.3 6.8 1.1 1.4 1.3 7.3 0.23 0.18October 2 83.4 0.28 0.15 2.0 2.4 2.2 7.1 1.1 1.3 1.1 7.3 0.20 0.17October 3 84.8 0.23 0.17 2.0 2.4 2.2 7.7 1.0 1.1 1.0 7.6 0.24 0.22October 4 85.3 0.21 0.17 1.9 2.5 2.2 7.4 0.9 1.1 1.0 7.8 0.25 0.23October 5 85.4 0.21 0.16 2.0 2.5 2.2 8.0 0.9 1.0 0.9 7.8 0.23 0.22October 6 85.7 0.22 0.16 1.9 2.6 2.3 7.6 0.8 1.0 0.9 7.8 0.32 0.22October 7 85.2 0.23 0.17 1.9 2.5 2.3 8.3 0.9 1.1 1.0 7.8 0.31 0.22October 8 84.1 0.26 0.18 1.8 2.4 2.2 6.9 0.9 1.1 1.0 7.4 0.30 0.24October 9 85.3 0.19 0.17 1.9 2.4 2.1 5.7 0.9 1.1 1.0 6.0 0.25 0.23October 10 85.8 0.36 0.18 1.8 2.3 2.1 5.3 0.9 1.0 1.0 5.2 0.24 0.22October 11 86.5 0.39 0.18 1.8 2.3 2.1 5.1 1.0 1.1 1.1 5.0 0.25 0.22October 12 86.5 0.26 0.18 1.9 2.3 2.2 5.7 1.0 1.1 1.1 5.0 0.22 0.21October 13 86.3 0.27 0.18 1.9 2.4 2.2 6.5 1.0 1.1 1.1 5.3 0.22 0.21October 14 86.5 0.30 0.18 1.8 2.4 2.1 6.4 1.0 1.1 1.0 5.9 0.22 0.21October 15 86.3 0.23 0.18 0.1 3.0 2.5 6.6 1.0 1.2 1.0 6.2 0.28 0.22October 16 86.1 0.27 0.18 0.2 3.1 2.5 6.8 1.2 1.5 1.4 6.3 0.22October 17 84.6 0.28 0.20 2.3 2.8 2.6 6.8 1.4 1.5 1.5 6.7 0.25 0.23October 18 82.4 0.31 0.21 2.3 2.7 2.5 6.8 1.2 1.4 1.3 6.7 0.28 0.25October 19 84.3 0.20 0.15 2.2 2.7 2.4 6.7 1.2 1.3 1.2 6.6 0.27 0.23October 20 84.7 0.21 0.15 2.2 2.6 2.4 6.3 1.1 1.2 1.2 6.4 0.29 0.19October 21 85.2 0.26 0.15 2.2 3.0 2.6 6.1 1.1 1.3 1.2 6.1 0.20 0.19October 22 84.2 0.22 0.16 2.6 3.0 2.7 6.5 1.3 1.6 1.4 6.1 0.19October 23 83.1 0.20 0.16 2.1 2.8 2.6 5.9 1.5 1.5 1.5 6.0 0.21 0.20October 24 83.0 0.20 0.15 2.1 2.7 2.5 6.1 1.3 1.5 1.4 5.9 0.21 0.19October 25 82.5 0.31 0.16 0.7 3.5 2.4 6.5 1.2 1.3 1.3 5.9 0.21 0.19October 26 82.6 0.19 0.15 1.8 2.6 2.3 5.9 1.1 1.3 1.2 6.0 0.22 0.21October 27 82.7 0.24 0.14 1.9 2.5 2.2 5.1 1.0 1.1 1.0 5.4 0.21 0.20October 28 83.8 0.22 0.14 2.1 2.7 2.3 4.6 1.0 1.2 1.1 5.0 0.30 0.19October 29 83.9 0.25 0.16 1.9 2.5 2.2 4.2 1.1 1.2 1.2 4.2 0.19October 30 84.9 0.19 0.14 2.0 2.4 2.2 4.2 1.2 1.3 1.2 4.0 0.21 0.20October 31 85.9 0.16 1.9 2.5 2.2 4.4 1.2 1.3 1.3 4.0 0.20 0.18
01-Nov-19Total
Minimum 82.4 0.1 4.2 0.8 4.0Average 0.2 2.3 1.2 0.2
Maximum 0.39 3.5 1.6 0.32
Distribution Turbidity
Water TemperatureTurbidity
October, 2019
SupplyPost Injection Residual Chlorine
Water Temperature
Distribution Residual Chlorine

Armstrong - Fortune Creek Month:Water Quality Report
Date UVT
Minimum Maximum Average Minimum Maximum Average Minimum Minimum Maximum Average Minimum Maximumpercent NTU NTU PPM PPM PPM Degrees C PPM PPM PPM Degrees C NTU
November 1 85.7 0.22 0.16 1.8 2.5 2.2 4.3 1.2 1.3 1.3 4.1 0.24November 2 86.3 0.21 0.15 1.8 2.5 2.2 4.8 1.2 1.3 1.3 4.1 0.20November 3 86.6 0.21 0.15 1.9 2.6 2.2 5.0 1.2 1.3 1.2 4.5 0.21November 4 86.6 0.20 0.15 1.8 2.7 2.3 5.6 1.2 1.3 1.2 4.7 0.20November 5 86.0 0.63 0.16 1.8 2.6 2.3 5.7 1.2 1.3 1.3 5.1 0.20November 6 86.6 0.24 0.14 1.9 2.5 2.2 5.8 1.1 1.3 1.2 5.3 0.23November 7 86.5 0.18 0.14 1.7 2.4 2.1 5.1 1.1 1.2 1.2 4.9 0.20November 8 87.1 0.18 0.14 1.8 2.5 2.2 5.6 1.1 1.2 1.2 4.7 0.18November 9 91.6 0.15 0.12 1.8 2.5 2.2 6.2 1.1 1.3 1.2 4.9 0.18November 10 92.7 0.17 0.11 1.8 2.4 2.1 6.1 1.2 1.3 1.3 5.5 0.16November 11 92.4 0.18 0.11 1.7 2.3 2.1 5.6 1.3 1.3 1.3 5.2 0.19November 12 92.0 0.16 0.11 1.8 2.4 2.2 5.3 1.3 1.4 1.3 4.9 0.15November 13 92.4 0.14 0.11 1.7 2.5 2.1 5.6 1.4 1.4 1.4 4.7 0.16November 14 93.3 0.14 0.11 1.7 2.3 2.1 5.4 1.3 1.4 1.3 4.8 0.15November 15 91.3 0.14 0.11 1.8 2.4 2.1 5.5 1.3 1.3 1.3 5.1 0.15November 16 91.6 0.16 0.11 1.6 2.3 2.0 5.5 1.2 1.3 1.3 5.2 0.15November 17 85.7 4.69 0.19 1.6 2.3 2.0 5.6 1.1 1.2 1.2 5.3 0.15November 18 86.4 0.21 0.14 0.0 4.7 2.0 5.3 1.1 1.2 1.1 5.1 0.23November 19 83.9 0.17 0.12 1.6 2.4 2.0 5.4 1.1 1.2 1.2 5.1 0.21November 20 56.1 0.41 0.12 1.6 2.2 1.9 4.6 1.2 1.2 1.2 4.7 0.17November 21 88.7 0.15 0.12 1.6 2.2 1.9 4.1 1.1 1.3 1.2 4.0 0.18November 22 89.2 0.15 0.11 1.5 2.4 1.9 4.0 1.2 1.3 1.2 3.8 0.16November 23 90.4 0.16 0.11 1.6 2.3 2.0 4.3 1.1 1.2 1.2 3.8 0.15November 24 91.0 0.18 0.11 1.7 2.4 2.0 4.7 1.1 1.2 1.1 3.9 0.15November 25 91.4 0.15 0.11 1.6 2.4 2.0 4.5 1.1 1.2 1.2 4.1 0.25November 26 92.4 0.17 0.12 0.1 2.4 2.0 3.9 1.2 1.3 1.2 3.9 0.16November 27 93.0 0.14 0.11 1.5 2.4 2.0 3.9 1.2 1.4 1.3 3.7 0.16November 28 94.6 0.14 0.11 1.5 2.4 2.0 3.6 1.3 1.4 1.4 3.5 0.16November 29 96.0 0.15 0.11 1.4 2.3 1.9 3.4 1.3 1.4 1.4 3.3 0.17November 30 96.1 0.60 0.12 1.3 2.0 1.7 3.2 1.1 1.3 1.2 3.2 0.16December 1
02-Dec-19Total
Minimum 56.1 0.0 3.2 1.1 3.2Average 0.1 2.1 1.2
Maximum 4.69 4.7 1.4 0.25
Distribution TurbidityWater
TemperatureTurbidity
November, 2019
SupplyPost Injection Residual Chlorine
Water Temperature
Distribution Residual Chlorine

AverageNTU
0.190.190.190.180.180.210.180.170.170.150.150.140.150.140.140.140.140.200.180.160.160.150.140.140.140.150.150.140.140.14
0.2
Distribution Turbidity

Armstrong - Fortune Creek Month:Water Quality Report
Date UVT
Minimum Maximum Average Minimum Maximum Average Minimum Minimum Maximum Average Minimum Maximum Averagepercent NTU NTU PPM PPM PPM Degrees C PPM PPM PPM Degrees C NTU NTU
December 1 66.3 0.17 0.11 1.3 2.0 1.6 3.2 1.0 1.2 1.1 3.1 0.17 0.16December 2 67.6 0.29 0.12 1.5 2.1 1.8 3.6 1.1 1.2 1.1 3.2 0.16 0.15December 3 95.0 0.19 0.12 1.3 2.1 1.8 4.4 1.1 1.2 1.1 3.7 0.16 0.15December 4 95.8 0.18 0.13 1.3 2.1 1.8 4.5 1.1 1.1 1.1 4.1 0.17 0.16December 5 96.2 0.14 0.12 1.4 2.2 1.8 4.3 1.1 1.2 1.1 4.2 0.18 0.16December 6 96.6 0.17 0.12 1.4 2.2 1.9 4.4 1.1 1.2 1.2 4.1 0.16 0.15December 7 96.2 0.66 0.12 1.4 2.2 1.8 4.7 1.1 1.2 1.2 4.2 0.18 0.15December 8 97.0 0.18 0.11 1.4 2.0 1.7 4.3 1.0 1.1 1.1 4.3 0.18 0.16December 9 0.11 0.17 0.11 1.3 2.1 1.7 3.9 1.0 1.1 1.1 3.9 0.15 0.14
December 10 0.11 0.16 0.11 1.4 2.1 1.7 3.9 1.1 1.3 1.2 3.7 0.15 0.14December 11 0.11 0.16 0.11 1.3 2.1 1.8 4.3 1.3 1.4 1.3 3.7 0.15 0.14December 12 0.11 0.15 0.11 1.2 2.1 1.7 4.4 1.3 1.4 1.3 4.0 0.15 0.14December 13 0.11 0.16 0.11 1.2 2.0 1.6 4.6 1.2 1.3 1.2 4.3 0.15 0.14December 14 0.11 0.16 0.11 1.2 1.9 1.5 4.9 1.1 1.2 1.2 4.3 0.15 0.14December 15 0.11 0.17 0.11 1.1 1.9 1.5 4.7 1.1 1.1 1.1 4.4 0.14 0.14December 16 0.11 0.15 0.11 1.1 1.9 1.5 4.1 1.1 1.2 1.1 4.1 0.15 0.14December 17 0.11 0.14 0.11 1.2 1.9 1.6 4.4 1.1 1.2 1.2 4.0 0.15 0.14December 18 0.11 0.16 0.11 1.2 1.9 1.6 4.7 1.1 1.2 1.2 4.0 0.15 0.14December 19 0.11 0.15 0.11 1.1 1.9 1.6 4.6 1.1 1.2 1.2 4.3 0.15 0.14December 20 0.11 0.17 0.12 1.1 1.9 1.6 4.7 1.1 1.2 1.2 4.3 0.15 0.14December 21 96.7 0.19 0.12 1.1 1.8 1.5 4.9 1.1 1.2 1.2 4.4 0.15 0.15December 22 97.2 0.17 0.12 1.1 1.8 1.5 5.0 1.0 1.1 1.0 4.4 0.16 0.15December 23 97.9 0.15 0.11 1.0 1.9 1.5 4.9 1.0 1.1 1.0 4.5 0.16 0.15December 24 98.3 0.16 0.11 1.1 1.8 1.5 4.7 1.1 1.2 1.1 4.2 0.15 0.14December 25 98.5 0.17 0.11 1.0 1.8 1.4 4.7 1.1 1.2 1.1 4.2 0.14 0.14December 26 98.7 0.17 0.11 1.1 1.7 1.4 4.3 1.0 1.1 1.1 4.1 0.14 0.14December 27 98.8 0.14 0.11 1.1 1.9 1.5 4.4 1.0 1.2 1.1 4.0 0.15 0.14December 28 98.8 0.16 0.11 1.2 1.8 1.4 4.6 1.1 1.2 1.1 4.0 0.15 0.14December 29 98.9 0.16 0.11 1.1 1.7 1.4 4.6 1.1 1.1 1.1 4.1 0.15 0.14December 30 98.9 0.16 0.11 1.0 1.8 1.5 4.8 1.1 1.2 1.1 4.1 0.15 0.14December 31 98.8 0.18 0.12 0.8 1.9 1.5 4.1 1.1 1.2 1.2 3.9 0.17 0.15
01-Jan-20Total
Minimum 0.1 0.8 3.2 1.0 3.1Average 0.1 1.6 1.1 0.1
Maximum 0.66 2.2 1.4 0.18
Distribution TurbidityWater
TemperatureTurbidity
December, 2019
SupplyPost Injection Residual Chlorine
Water Temperature
Distribution Residual Chlorine

City of Armstrong Water System 2019 Annual Report
Page 73
Total Flow (SCADA Automatic Report)
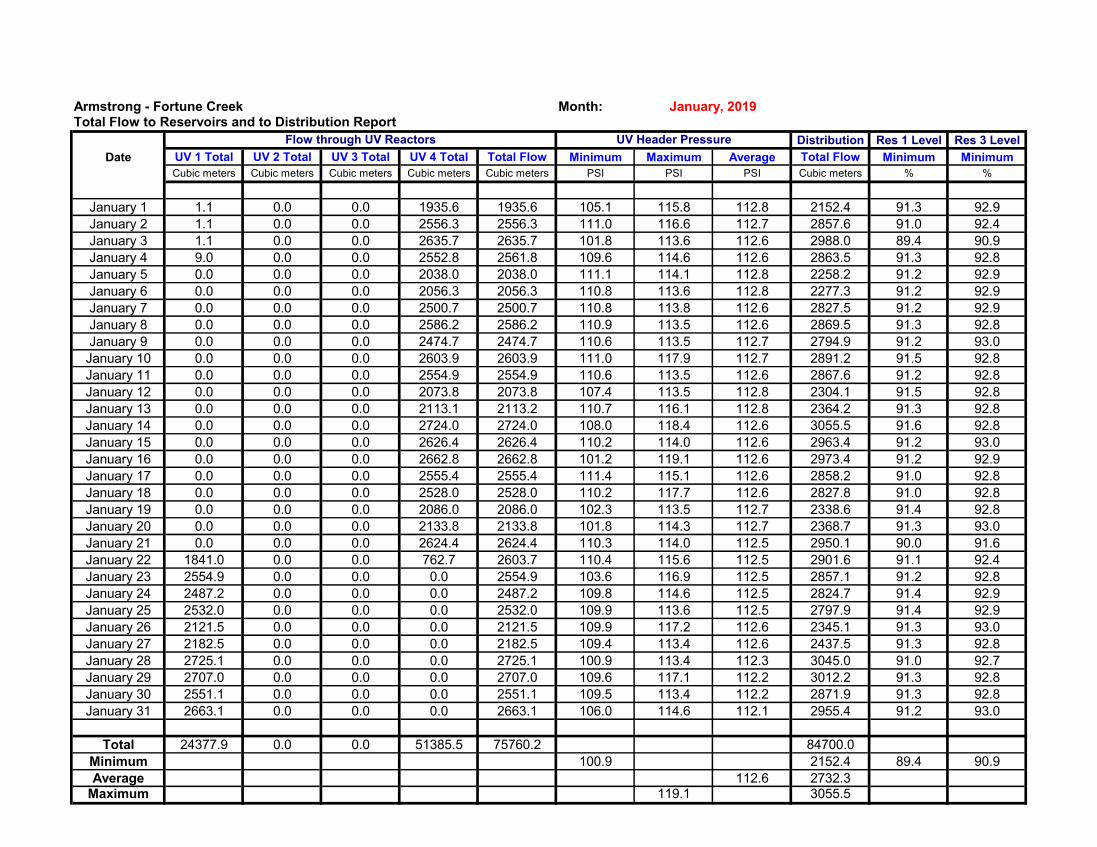
Armstrong - Fortune Creek Month:Total Flow to Reservoirs and to Distribution Report
Distribution Res 1 Level Res 3 Level
Date UV 1 Total UV 2 Total UV 3 Total UV 4 Total Total Flow Minimum Maximum Average Total Flow Minimum Minimum
Cubic meters Cubic meters Cubic meters Cubic meters Cubic meters PSI PSI PSI Cubic meters % %
January 1 1.1 0.0 0.0 1935.6 1935.6 105.1 115.8 112.8 2152.4 91.3 92.9
January 2 1.1 0.0 0.0 2556.3 2556.3 111.0 116.6 112.7 2857.6 91.0 92.4
January 3 1.1 0.0 0.0 2635.7 2635.7 101.8 113.6 112.6 2988.0 89.4 90.9
January 4 9.0 0.0 0.0 2552.8 2561.8 109.6 114.6 112.6 2863.5 91.3 92.8
January 5 0.0 0.0 0.0 2038.0 2038.0 111.1 114.1 112.8 2258.2 91.2 92.9
January 6 0.0 0.0 0.0 2056.3 2056.3 110.8 113.6 112.8 2277.3 91.2 92.9
January 7 0.0 0.0 0.0 2500.7 2500.7 110.8 113.8 112.6 2827.5 91.2 92.9
January 8 0.0 0.0 0.0 2586.2 2586.2 110.9 113.5 112.6 2869.5 91.3 92.8
January 9 0.0 0.0 0.0 2474.7 2474.7 110.6 113.5 112.7 2794.9 91.2 93.0
January 10 0.0 0.0 0.0 2603.9 2603.9 111.0 117.9 112.7 2891.2 91.5 92.8
January 11 0.0 0.0 0.0 2554.9 2554.9 110.6 113.5 112.6 2867.6 91.2 92.8
January 12 0.0 0.0 0.0 2073.8 2073.8 107.4 113.5 112.8 2304.1 91.5 92.8
January 13 0.0 0.0 0.0 2113.1 2113.2 110.7 116.1 112.8 2364.2 91.3 92.8
January 14 0.0 0.0 0.0 2724.0 2724.0 108.0 118.4 112.6 3055.5 91.6 92.8
January 15 0.0 0.0 0.0 2626.4 2626.4 110.2 114.0 112.6 2963.4 91.2 93.0
January 16 0.0 0.0 0.0 2662.8 2662.8 101.2 119.1 112.6 2973.4 91.2 92.9
January 17 0.0 0.0 0.0 2555.4 2555.4 111.4 115.1 112.6 2858.2 91.0 92.8
January 18 0.0 0.0 0.0 2528.0 2528.0 110.2 117.7 112.6 2827.8 91.0 92.8
January 19 0.0 0.0 0.0 2086.0 2086.0 102.3 113.5 112.7 2338.6 91.4 92.8
January 20 0.0 0.0 0.0 2133.8 2133.8 101.8 114.3 112.7 2368.7 91.3 93.0
January 21 0.0 0.0 0.0 2624.4 2624.4 110.3 114.0 112.5 2950.1 90.0 91.6
January 22 1841.0 0.0 0.0 762.7 2603.7 110.4 115.6 112.5 2901.6 91.1 92.4
January 23 2554.9 0.0 0.0 0.0 2554.9 103.6 116.9 112.5 2857.1 91.2 92.8
January 24 2487.2 0.0 0.0 0.0 2487.2 109.8 114.6 112.5 2824.7 91.4 92.9
January 25 2532.0 0.0 0.0 0.0 2532.0 109.9 113.6 112.5 2797.9 91.4 92.9
January 26 2121.5 0.0 0.0 0.0 2121.5 109.9 117.2 112.6 2345.1 91.3 93.0
January 27 2182.5 0.0 0.0 0.0 2182.5 109.4 113.4 112.6 2437.5 91.3 92.8
January 28 2725.1 0.0 0.0 0.0 2725.1 100.9 113.4 112.3 3045.0 91.0 92.7
January 29 2707.0 0.0 0.0 0.0 2707.0 109.6 117.1 112.2 3012.2 91.3 92.8
January 30 2551.1 0.0 0.0 0.0 2551.1 109.5 113.4 112.2 2871.9 91.3 92.8
January 31 2663.1 0.0 0.0 0.0 2663.1 106.0 114.6 112.1 2955.4 91.2 93.001-Feb-19
Total 24377.9 0.0 0.0 51385.5 75760.2 84700.0
Minimum 100.9 2152.4 89.4 90.9
Average 112.6 2732.3Maximum 119.1 3055.5
UV Header Pressure
January, 2019
Flow through UV Reactors

Armstrong - Fortune Creek Month:Total Flow to Reservoirs and to Distribution Report
Distribution Res 1 Level Res 3 Level
Date UV 1 Total UV 2 Total UV 3 Total UV 4 Total Total Flow Minimum Maximum Average Total Flow Minimum Minimum
Cubic meters Cubic meters Cubic meters Cubic meters Cubic meters PSI PSI PSI Cubic meters % %
February 1 2623.1 0.0 0.0 0.0 2623.1 109.2 114.2 112.1 2941.2 91.2 92.9
February 2 2117.7 0.0 0.0 0.0 2117.7 108.1 113.3 112.3 2362.1 91.3 93.0
February 3 2114.0 0.0 0.0 0.0 2114.0 109.1 115.2 112.3 2328.3 91.3 92.9
February 4 2516.4 0.0 0.0 0.0 2516.4 99.8 113.7 111.8 2849.2 90.4 92.0
February 5 2626.5 0.0 0.0 0.0 2626.5 108.0 115.8 112.2 2894.0 91.4 92.7
February 6 2621.7 0.0 0.0 0.0 2621.7 110.8 113.7 112.6 2938.1 91.3 92.9
February 7 2731.8 0.0 0.0 0.0 2731.8 110.6 116.0 112.5 3072.5 91.5 92.8
February 8 2710.1 0.0 0.0 0.0 2710.1 110.2 113.4 112.5 3024.1 91.3 92.7
February 9 2206.8 0.0 0.0 0.0 2206.8 110.8 116.0 112.7 2427.9 91.2 92.9
February 10 2195.5 0.0 0.0 0.0 2195.5 110.9 115.7 112.7 2457.4 91.2 92.8
February 11 2729.6 0.0 0.0 0.0 2729.6 110.7 115.7 112.5 3039.5 91.3 92.7
February 12 2667.5 0.0 0.0 0.0 2667.5 102.1 114.7 112.6 3022.1 91.2 92.8
February 13 2738.8 0.0 0.0 0.0 2738.8 110.8 113.8 112.5 3044.0 91.3 92.9
February 14 2602.6 0.0 0.0 0.0 2602.6 110.8 114.2 112.6 2914.4 91.1 92.5
February 15 2646.5 0.0 0.0 0.0 2646.5 110.6 113.4 112.6 2923.7 91.3 92.9
February 16 2144.8 0.0 0.0 0.0 2144.8 102.7 114.2 112.7 2416.1 91.2 92.9
February 17 2161.6 0.0 0.0 0.0 2161.6 110.4 117.2 112.7 2398.0 91.3 92.8
February 18 2239.3 0.0 0.0 0.0 2239.3 110.7 114.9 112.7 2471.4 91.2 92.8
February 19 2805.5 0.0 0.0 0.0 2805.5 102.5 113.6 112.5 3131.3 90.0 91.5
February 20 2742.2 0.0 0.0 0.0 2742.2 105.9 113.5 112.5 3066.6 89.4 91.4
February 21 2855.8 0.0 0.0 0.0 2855.8 110.5 116.5 112.5 3214.6 89.5 90.9
February 22 2811.1 0.0 0.0 0.0 2811.1 107.9 114.4 112.5 3127.8 89.4 91.2
February 23 2189.7 0.0 0.0 0.0 2189.7 101.0 115.0 112.7 2450.0 91.2 92.8
February 24 2228.7 0.0 0.0 0.0 2228.7 101.7 113.6 112.7 2487.9 91.2 93.0
February 25 2785.2 0.0 0.0 0.0 2785.2 110.3 114.7 112.4 3109.7 89.4 90.9
February 26 2784.9 0.0 0.0 0.0 2784.9 102.7 113.4 112.5 3103.0 89.9 91.7
February 27 2830.7 0.0 0.0 0.0 2830.7 109.9 116.7 112.3 3124.2 89.4 91.4
February 28 2757.7 0.0 0.0 0.0 2757.7 110.1 116.8 112.4 3090.8 92.7 94.5
March 2
March 304-Mar-19
Total 72026.8 0.0 0.0 0.0 72026.8 80364.5
Minimum 99.8 934.5 89.4 90.9
Average 112.5 2771.2Maximum 117.2 3214.6
Flow through UV Reactors UV Header Pressure
February, 2019

Armstrong - Fortune Creek Month:Total Flow to Reservoirs and to Distribution Report
Distribution Res 1 Level Res 3 Level
Date UV 1 Total UV 2 Total UV 3 Total UV 4 Total Total Flow Minimum Maximum Average Total Flow Minimum Minimum
Cubic meters Cubic meters Cubic meters Cubic meters Cubic meters PSI PSI PSI Cubic meters % %
March 1 2702.3 0.2 0.0 0.0 2702.3 107.6 115.1 112.5 3001.6 92.8 94.2
March 2 2238.3 0.3 0.0 0.0 2238.3 110.0 113.4 112.6 2499.6 92.8 94.5
March 3 2296.7 0.3 0.0 0.0 2296.7 105.7 113.7 112.6 2547.1 92.9 94.5
March 4 2817.1 0.4 0.0 0.1 2817.1 107.8 116.4 112.4 3152.5 92.8 94.4
March 5 2790.6 0.4 0.0 0.1 2790.6 99.5 113.9 112.4 3124.0 92.8 94.3
March 6 2807.1 0.5 0.0 0.1 2807.1 109.6 115.7 112.4 3136.5 92.8 94.2
March 7 2760.6 0.5 0.0 0.1 2760.6 107.9 117.0 112.4 3094.1 92.7 94.4
March 8 2817.7 0.6 0.0 0.1 2817.7 109.7 113.3 112.3 3151.9 92.1 94.1
March 9 2234.6 0.7 0.0 0.1 2234.6 98.8 117.9 112.5 2497.0 92.8 94.4
March 10 2250.5 0.7 0.0 0.1 2250.5 109.7 115.8 112.5 2493.8 93.2 94.5
March 11 2747.3 0.8 0.0 0.1 2747.3 103.8 113.3 112.1 3084.1 92.8 94.6
March 12 2760.4 0.8 0.0 0.1 2760.4 98.9 116.3 112.1 3086.2 93.0 94.3
March 13 2784.0 0.9 0.0 0.1 2784.0 100.8 113.3 111.9 3094.3 92.8 94.3
March 14 2847.8 0.9 0.0 0.1 2847.8 98.1 114.1 111.7 3181.9 92.8 94.4
March 15 2786.2 1.0 0.0 0.1 2786.2 107.4 116.1 111.5 3126.6 92.8 94.4
March 16 2319.8 1.0 0.0 0.1 2319.8 107.2 115.2 112.0 2586.2 93.2 94.5
March 17 2312.7 1.1 0.0 0.2 2312.7 106.9 114.8 111.9 2567.9 93.2 94.5
March 18 2824.7 1.1 0.0 0.3 2825.1 101.7 116.6 111.7 3163.5 92.9 94.5
March 19 2867.0 1.2 0.0 0.0 2867.0 109.3 116.3 112.0 3209.4 93.0 94.5
March 20 2892.9 1.2 0.0 0.0 2892.9 101.3 114.8 112.1 3235.3 93.0 94.4
March 21 2799.1 1.3 0.0 0.0 2799.1 101.4 115.3 112.2 3124.3 93.1 94.6
March 22 2773.4 1.3 0.0 0.0 2773.4 109.9 115.3 112.2 3109.8 92.9 94.3
March 23 2345.3 1.4 0.0 0.0 2345.3 109.4 114.7 112.6 2593.7 92.8 94.5
March 24 2312.1 1.4 0.0 0.0 2312.1 109.5 115.8 112.6 2570.5 92.9 94.5
March 25 2882.6 1.5 0.0 0.0 2882.6 99.1 116.2 112.3 3230.2 92.9 94.5
March 26 2818.0 1.5 0.0 0.0 2818.0 100.0 116.3 112.1 3171.4 92.9 94.3
March 27 2907.9 9.2 0.0 0.0 2917.1 108.5 116.7 111.8 3250.0 93.0 94.5
March 28 2887.8 0.0 0.0 0.0 2887.8 107.8 115.2 111.7 3238.0 93.0 94.4
March 29 2910.0 0.0 0.0 0.0 2910.0 107.5 113.6 111.5 3243.6 92.8 94.2
March 30 2392.8 0.0 0.0 0.0 2392.8 96.6 116.4 111.9 2667.0 93.0 94.2
March 31 2481.5 0.0 0.0 0.0 2481.5 106.1 113.2 111.7 2783.9 92.8 94.301-Apr-19
Total 82368.7 32.2 0.0 1.9 82378.3 92015.9
Minimum 96.6 2493.8 92.1 94.1
Average 112.1 2968.3Maximum 117.9 3250.0
Flow through UV Reactors UV Header Pressure
March, 2019

Armstrong - Fortune Creek Month:Total Flow to Reservoirs and to Distribution Report
Distribution Res 1 Level Res 3 LevelDate UV 1 Total UV 2 Total UV 3 Total UV 4 Total Total Flow Minimum Maximum Average Total Flow Minimum Minimum
Cubic meters Cubic meters Cubic meters Cubic meters Cubic meters PSI PSI PSI Cubic meters % %
April 1 3062.1 0.0 0.0 0.0 3062.1 105.3 113.9 110.8 3405.3 91.5 93.0April 2 3000.3 0.0 0.0 0.0 3000.3 100.6 113.7 112.1 3364.4 90.7 91.9April 3 2996.6 0.0 0.0 0.0 2996.6 100.2 114.0 112.5 3353.1 90.9 92.5April 4 3015.9 0.0 0.0 0.0 3015.9 102.0 114.4 112.5 3375.9 92.2 93.7April 5 2934.8 0.0 0.0 0.0 2934.8 99.3 116.3 112.5 3284.5 92.6 94.0April 6 2346.0 0.0 0.0 0.0 2346.0 97.3 113.5 112.7 2610.4 92.8 94.3April 7 2420.9 0.0 0.0 0.0 2420.9 98.1 115.2 112.6 2713.6 92.8 94.4April 8 3036.8 0.0 0.0 0.0 3036.8 98.3 115.8 112.1 3403.9 90.7 92.0April 9 2942.9 0.0 7.2 0.0 2950.1 98.3 116.2 111.8 3281.4 90.8 92.3April 10 2860.2 0.0 0.0 0.0 2860.2 105.7 116.0 110.9 3199.0 91.1 92.7April 11 2998.7 0.0 0.0 0.0 2998.7 97.1 115.3 112.0 3353.7 90.9 92.4April 12 3008.8 0.0 0.0 0.0 3008.8 102.1 115.0 112.5 3369.2 90.8 92.4April 13 2291.7 0.0 0.0 0.0 2291.7 109.2 116.3 112.6 2570.1 92.8 94.4April 14 2502.3 0.0 0.0 0.0 2502.3 104.7 114.9 112.3 2781.5 92.8 94.4April 15 3162.0 0.0 0.0 0.0 3162.0 98.7 114.9 111.2 3530.0 90.8 92.3April 16 3011.7 0.0 0.0 0.0 3011.7 105.2 115.4 110.8 3376.2 92.8 94.3April 17 3043.5 0.0 0.0 0.0 3043.5 101.3 114.2 111.8 3429.7 90.8 92.2April 18 1162.3 1764.4 0.0 0.0 2926.7 101.9 114.5 112.2 3269.7 91.0 92.6April 19 0.0 2376.7 0.0 0.0 2376.7 101.6 114.3 110.2 2639.4 92.8 94.4April 20 0.0 2419.6 0.0 0.0 2419.6 104.6 114.4 111.7 2671.3 92.8 94.4April 21 0.0 2494.6 0.0 0.0 2494.6 98.3 114.9 111.9 2772.4 92.8 94.3April 22 0.0 2865.0 0.0 0.0 2865.0 98.7 115.4 111.3 3198.1 91.1 92.6April 23 0.0 2850.8 0.0 0.0 2850.8 99.0 115.4 110.5 3220.4 92.8 94.3April 24 0.0 3054.3 0.0 0.0 3054.3 89.2 115.3 110.8 3375.2 91.3 92.8April 25 0.0 3073.5 0.0 0.0 3073.5 105.3 115.3 111.4 3438.0 92.6 94.2April 26 0.0 3148.3 0.0 0.0 3148.3 104.9 115.4 111.4 3544.5 92.3 93.9April 27 0.0 2431.6 0.0 0.0 2431.6 106.1 116.2 112.0 2710.2 92.8 94.4April 28 0.0 2875.5 0.0 0.0 2875.5 98.8 118.0 111.7 3209.3 92.8 94.4April 29 0.0 3547.2 0.0 0.0 3547.2 98.9 117.6 111.4 3959.9 90.8 92.3April 30 0.0 3405.4 0.0 0.0 3405.4 104.4 115.0 111.4 3826.4 90.8 92.3May 12-May-19Total 49797.6 36306.9 7.2 0.0 86111.7 96236.7
Minimum 89.2 2570.1 90.7 91.9Average 111.7 3207.9
Maximum 118.0 3959.9
Flow through UV Reactors UV Header Pressure
April, 2019

Armstrong - Fortune Creek Month:Total Flow to Reservoirs and to Distribution Report
Distribution Res 1 Level Res 3 LevelDate UV 1 Total UV 2 Total UV 3 Total UV 4 Total Total Flow Minimum Maximum Average Total Flow Minimum Minimum
Cubic meters Cubic meters Cubic meters Cubic meters Cubic meters PSI PSI PSI Cubic meters % %
May 1 0.0 3441.9 0.0 0.0 3441.9 101.7 116.2 111.1 3860.0 90.8 92.3May 2 0.0 3519.8 0.0 0.0 3519.8 98.5 114.1 111.0 3948.5 90.8 92.3May 3 0.0 3596.5 0.0 0.0 3596.5 106.7 113.6 111.6 4064.4 90.7 92.1May 4 0.0 3039.3 0.0 0.0 3039.3 105.5 113.3 111.3 3383.3 92.8 94.3May 5 0.0 3277.5 0.0 0.0 3277.5 101.7 113.3 110.3 3658.5 90.8 92.4May 6 0.0 3819.9 0.0 0.0 3819.9 88.4 113.3 110.4 4323.6 90.8 92.2May 7 0.0 3897.6 0.0 0.0 3897.6 89.5 113.3 110.3 4383.3 90.8 92.2May 8 1590.7 2594.9 0.0 0.0 4185.6 79.6 144.1 111.0 4717.4 90.6 91.9May 9 2215.0 2229.9 0.0 0.0 4444.9 94.6 129.3 112.1 5020.6 89.7 91.1May 10 2303.7 2318.6 0.0 0.0 4622.3 92.9 145.6 111.9 5205.1 88.1 89.5May 11 2035.8 2047.1 0.0 0.0 4082.9 93.8 147.3 111.9 4616.7 90.7 92.1May 12 2290.4 2298.0 0.0 0.0 4588.4 94.8 144.3 111.4 5180.1 87.6 88.9May 13 624.4 2479.5 1884.3 0.0 4988.2 96.8 120.1 111.7 5664.0 87.6 88.9May 14 1030.8 1206.6 2238.3 0.0 4475.7 93.6 131.0 112.2 5025.7 86.7 88.3May 15 2206.8 0.0 2271.0 0.0 4477.8 88.1 139.9 112.1 5093.8 88.6 90.1May 16 1915.4 0.0 1970.4 0.0 3885.8 93.6 136.4 112.8 4355.1 90.8 92.2May 17 1743.0 48.1 1792.0 0.0 3583.1 90.6 134.1 112.9 4056.3 90.8 92.3May 18 1383.7 0.0 1422.6 0.0 2806.3 96.2 138.9 113.2 3138.6 92.5 94.0May 19 1603.3 0.0 1647.9 0.0 3251.2 91.8 136.9 113.0 3646.8 92.3 93.9May 20 2013.7 0.0 2070.7 0.0 4084.4 90.8 136.0 112.6 4632.0 90.5 92.1May 21 2092.5 0.0 2152.0 0.0 4244.5 96.5 135.7 112.5 4819.4 89.7 91.2May 22 2274.7 0.0 2340.0 0.0 4614.7 98.5 126.1 112.3 5195.2 89.3 90.7May 23 1999.2 0.0 2058.2 0.0 4057.4 108.7 115.4 112.4 4576.6 90.7 92.2May 24 1998.3 0.0 2049.8 0.0 4048.1 88.9 118.4 112.0 4556.1 90.4 91.8May 25 2850.7 0.0 0.0 0.0 2850.7 105.0 135.6 112.1 3207.8 91.7 93.3May 26 3266.8 0.0 0.0 0.0 3266.8 104.6 114.8 112.8 3716.0 92.1 93.6May 27 4482.8 0.0 0.0 0.0 4482.8 104.5 124.7 111.9 5055.2 89.1 90.6May 28 4744.3 0.0 0.0 0.0 4744.3 101.0 123.6 111.8 5357.6 87.8 89.2May 29 4923.9 0.0 0.0 0.0 4923.9 92.5 113.7 111.8 5582.9 84.2 85.6May 30 5037.4 0.0 0.0 0.0 5037.4 105.9 137.2 111.9 5723.0 84.0 85.3May 31 4906.1 0.0 0.0 0.0 4906.1 104.6 113.7 111.7 5545.6 87.9 89.301-Jun-19Total 61533.4 39815.0 23897.3 0.0 125245.7 141309.3
Minimum 79.6 3138.6 84.0 85.3Average 111.9 4558.4
Maximum 147.3 5723.0
Flow through UV Reactors UV Header Pressure
May, 2019

Armstrong - Fortune Creek Month:Total Flow to Reservoirs and to Distribution Report
Distribution Res 1 Level Res 3 Level
Date UV 1 Total UV 2 Total UV 3 Total UV 4 Total Total Flow Minimum Maximum Average Total Flow Minimum MinimumCubic meters Cubic meters Cubic meters Cubic meters Cubic meters PSI PSI PSI Cubic meters % %
June 1 4707.0 0.0 0.0 0.0 4707.0 108.5 114.5 111.9 5330.4 89.6 91.0June 2 5125.5 0.0 0.0 0.0 5125.5 105.8 117.6 111.4 5812.6 87.9 89.4June 3 5267.0 0.0 0.0 0.0 5267.0 107.8 113.6 111.2 5948.1 87.8 89.2June 4 5027.2 0.0 0.0 0.0 5027.2 108.0 114.9 111.6 5695.9 87.8 89.2June 5 4684.5 0.0 0.0 0.0 4684.5 109.4 113.8 111.9 5328.0 85.9 87.5June 6 4920.3 0.0 49.4 0.0 4969.7 108.6 117.0 111.8 5612.4 89.8 91.2June 7 4310.7 0.0 0.0 0.0 4310.7 108.6 116.6 112.1 4842.2 90.7 92.2June 8 3393.9 0.0 0.0 0.0 3393.9 105.2 117.5 112.2 3836.2 90.8 92.3June 9 3685.6 0.0 0.0 0.0 3685.6 109.5 133.8 112.5 4164.7 90.8 92.3June 10 4472.2 0.0 0.0 0.0 4472.2 109.0 113.7 112.0 5047.0 90.7 92.2June 11 5098.0 0.0 0.0 0.0 5098.0 90.8 114.9 111.5 5766.0 84.9 86.3June 12 5484.1 0.0 0.0 0.0 5484.1 109.3 115.1 111.3 6203.5 84.0 85.3June 13 5281.9 0.0 0.0 0.0 5281.9 108.6 113.2 111.3 5992.6 83.9 85.2June 14 5428.3 0.0 0.0 0.0 5428.3 105.5 113.3 111.4 6148.2 83.9 85.2June 15 5127.3 0.0 0.0 0.0 5127.3 108.7 113.9 111.6 5795.4 89.9 91.4June 16 5433.5 0.0 0.0 0.0 5433.5 109.6 114.4 111.5 6158.1 87.8 89.3June 17 5675.4 0.0 0.0 0.0 5675.4 110.6 126.4 111.4 6440.6 83.1 84.5June 18 2782.8 2900.5 0.0 0.0 5683.3 106.6 122.1 111.3 6408.7 83.8 85.0June 19 0.0 5144.3 0.0 0.0 5144.3 106.1 113.4 111.6 5821.7 83.9 85.2June 20 0.0 4581.0 0.0 0.0 4581.0 105.0 131.2 111.9 5151.4 88.7 90.1June 21 0.0 4450.5 0.0 0.0 4450.5 105.0 113.4 111.9 5017.9 90.8 92.2June 22 0.0 3741.7 0.0 0.0 3741.7 106.0 114.0 112.3 4199.6 90.8 92.2June 23 0.0 3515.7 0.0 0.0 3515.7 103.3 135.1 112.4 3965.6 90.9 92.3June 24 0.0 4339.3 0.0 0.0 4339.3 106.4 114.2 112.1 4866.5 90.8 92.3June 25 0.0 4639.6 0.0 0.0 4639.6 105.2 114.4 111.9 5256.1 90.7 92.2June 26 0.0 4759.7 0.0 0.0 4759.7 105.5 122.4 111.8 5357.5 90.2 91.6June 27 0.0 4140.0 0.0 0.0 4140.0 105.4 115.0 112.1 4649.4 90.6 92.1June 28 0.0 4030.5 0.0 0.0 4030.5 105.6 114.1 112.0 4576.4 90.8 92.3June 29 0.0 3239.4 0.0 0.0 3239.4 105.8 114.7 112.4 3644.7 92.7 94.3June 30 0.0 3813.1 0.0 0.0 3813.1 98.8 114.3 112.3 4248.7 90.8 92.3July 102-Jul-19
Total 85905.0 53295.4 49.4 0.0 139249.8 157286.0Minimum 90.8 3644.7 83.1 84.5Average 111.8 5242.9
Maximum 135.1 6440.6
Flow through UV Reactors UV Header Pressure
June, 2019

Armstrong - Fortune Creek Month:Total Flow to Reservoirs and to Distribution Report
Distribution Res 1 Level Res 3 LevelDate UV 1 Total UV 2 Total UV 3 Total UV 4 Total Total Flow Minimum Maximum Average Total Flow Minimum Minimum
Cubic meters Cubic meters Cubic meters Cubic meters Cubic meters PSI PSI PSI Cubic meters % %
July 1 0.0 4156.3 0.0 0.0 4156.3 105.7 114.8 112.1 4702.8 90.9 92.3July 2 0.0 4405.3 0.0 0.0 4405.3 103.6 114.2 112.0 4944.5 90.8 92.1July 3 0.0 4584.3 0.0 0.0 4584.3 98.0 114.2 111.9 5188.5 90.6 91.9July 4 0.0 3888.7 0.0 0.0 3888.7 105.8 114.9 112.2 4386.3 90.8 92.3July 5 0.0 3888.7 0.0 0.0 3888.7 102.4 136.8 111.1 4386.3 90.8 92.3July 6 0.0 3256.7 0.0 0.0 3256.7 100.8 114.4 111.2 3602.4 91.3 92.9July 7 0.0 3256.7 0.0 0.0 3256.7 101.6 114.8 112.1 3602.4 92.7 94.1July 8 0.0 4181.3 0.0 0.0 4181.3 105.6 116.0 111.9 4734.6 90.8 92.3July 9 0.0 4247.6 0.0 0.0 4247.6 105.4 122.4 112.0 4766.9 90.7 92.3July 10 0.0 4082.6 0.0 0.0 4082.6 98.3 114.7 112.1 4586.2 90.7 92.1July 11 0.0 4082.6 0.0 0.0 4082.6 105.6 114.8 112.3 4586.2 90.9 92.5July 12 0.0 4562.9 0.0 0.0 4562.9 106.1 117.0 111.9 5113.9 90.8 92.2July 13 0.0 4562.9 0.0 0.0 4562.9 105.2 114.8 112.1 5113.9 90.8 92.4July 14 0.0 4607.0 0.0 0.0 4607.0 101.6 114.2 111.9 5176.6 90.0 91.4July 15 0.0 4720.9 0.8 0.0 4721.7 104.4 114.3 111.7 5352.6 89.6 90.9July 16 0.0 4774.6 0.8 0.0 4774.6 104.5 113.9 111.7 5407.5 89.5 90.9July 17 0.0 4774.6 0.0 0.0 4774.6 106.7 118.4 112.1 5407.5 90.1 91.5July 18 0.0 4180.3 0.0 0.0 4180.3 97.8 114.1 112.3 4671.5 90.8 92.3July 19 0.0 3950.0 0.0 0.0 3950.0 105.0 115.8 112.2 4455.2 90.7 92.2July 20 0.0 3950.0 0.0 0.0 3950.0 105.2 113.9 112.5 4455.2 91.8 93.4July 21 0.0 3800.9 0.0 0.0 3800.9 96.3 114.7 112.2 4307.5 90.8 92.3July 22 0.0 4620.7 0.0 0.0 4620.7 110.5 115.4 111.8 5184.7 90.7 92.1July 23 0.0 4620.7 0.0 0.0 4620.7 102.7 113.3 112.1 5184.7 90.2 91.6July 24 0.0 4151.4 0.0 0.0 4151.4 108.2 114.5 112.1 4670.6 90.3 91.7July 25 0.0 3981.1 0.0 0.0 3981.1 105.9 113.5 112.2 4506.1 90.7 92.1July 26 0.0 4537.0 0.0 0.0 4537.0 106.6 115.0 111.9 5129.3 90.8 92.2July 27 0.0 4537.0 0.0 0.0 4537.0 107.8 120.4 112.4 5129.3 90.8 92.2July 28 0.0 3638.6 0.0 0.0 3638.6 109.7 115.2 112.2 4085.3 90.8 92.2July 29 0.0 4630.6 0.0 0.0 4630.6 110.5 125.9 111.8 5232.2 90.4 91.8July 30 0.0 4904.0 0.0 0.0 4904.0 108.5 119.0 111.7 5560.1 90.3 91.7July 31 0.0 4904.0 0.0 0.0 4904.0 105.6 114.2 111.7 5560.1 89.7 91.101-Aug-19Total 0.0 132439.9 1.6 0.0 132440.7 149190.9
Minimum 96.3 3602.4 89.5 90.9Average 112.0 4812.6
Maximum 136.8 5560.1
Flow through UV Reactors UV Header Pressure
July, 2019

Armstrong - Fortune Creek Month:Total Flow to Reservoirs and to Distribution Report
Distribution Res 1 Level Res 3 LevelDate UV 1 Total UV 2 Total UV 3 Total UV 4 Total Total Flow Minimum Maximum Average Total Flow Minimum Minimum
Cubic meters Cubic meters Cubic meters Cubic meters Cubic meters PSI PSI PSI Cubic meters % %
August 1 0.0 5228.0 0.0 0.0 5228.0 107.5 113.1 111.5 5902.6 88.3 89.7August 2 0.0 5228.0 0.0 0.0 5228.0 99.5 114.6 111.7 5902.6 83.9 85.2August 3 0.0 4899.0 0.0 0.0 4899.0 90.7 113.2 111.9 5525.6 90.7 92.3August 4 0.0 4569.7 0.0 0.0 4569.7 89.4 114.8 111.8 5171.8 90.3 91.8August 5 0.0 5011.7 0.0 0.0 5011.7 108.2 126.6 111.6 5668.3 87.6 89.1August 6 0.0 5448.9 0.0 0.0 5448.9 110.3 113.1 111.3 6136.2 83.9 85.2August 7 0.0 5638.9 0.0 0.0 5638.9 108.7 127.6 111.2 6370.9 83.9 85.1August 8 0.0 5638.9 0.0 0.0 5638.9 108.7 113.7 111.3 6370.9 83.9 85.2August 9 0.0 5536.4 0.0 0.0 5536.4 106.9 114.9 111.4 6265.1 83.9 85.2August 10 0.0 5424.4 0.0 0.0 5424.4 98.8 115.0 111.9 6128.4 90.8 92.2August 11 0.0 4334.6 0.0 0.0 4334.6 104.7 114.7 112.1 4925.1 90.8 92.1August 12 0.0 4270.7 0.0 0.0 4270.7 100.8 115.3 112.0 4820.6 90.8 92.3August 13 0.0 4533.0 0.0 0.0 4533.0 98.7 115.5 111.9 5076.8 90.8 92.2August 14 0.0 4764.1 0.0 0.0 4764.1 108.1 118.0 111.8 5386.4 90.8 92.2August 15 0.0 4918.0 0.0 0.0 4918.0 89.2 128.3 111.7 5574.5 90.2 91.6August 16 0.0 4918.0 0.0 0.0 4918.0 108.3 115.0 111.7 5574.5 88.4 89.7August 17 0.0 4917.8 0.0 0.0 4917.8 107.0 114.6 112.0 5523.0 90.9 92.2August 18 0.0 4526.1 0.0 0.0 4526.1 98.5 114.5 111.9 5113.4 90.4 91.9August 19 0.0 5443.8 0.0 0.0 5443.8 104.4 115.3 111.4 6158.9 85.1 86.4August 20 0.0 5443.8 0.0 0.0 5443.8 108.3 113.1 111.4 6158.9 86.6 88.1August 21 0.0 5358.6 0.0 0.0 5358.6 105.9 115.7 111.6 6028.4 83.7 84.9August 22 0.0 4865.7 0.0 0.0 4865.7 104.1 114.4 111.8 5507.6 90.4 91.8August 23 0.0 4599.9 0.0 0.0 4599.9 98.6 115.1 111.9 5189.0 89.3 90.7August 24 0.0 4341.5 0.0 0.0 4341.5 98.2 115.2 112.3 4879.8 90.8 92.4August 25 0.0 3595.0 0.0 0.0 3595.0 108.4 115.8 112.2 4069.5 90.8 92.2August 26 0.0 4526.3 0.0 0.0 4526.3 107.2 113.7 111.8 5115.7 90.4 91.7August 27 0.0 4812.3 0.0 0.0 4812.3 106.6 113.6 111.5 5416.6 90.4 91.8August 28 0.0 5037.9 0.0 0.0 5037.9 97.7 114.5 110.9 5674.7 89.9 91.2August 29 0.0 5039.4 0.0 0.0 5039.4 92.8 112.9 110.2 5677.1 90.2 91.5August 30 0.0 5236.4 0.0 0.0 5236.4 104.1 112.6 109.0 5887.7 87.4 88.8August 31 0.0 5238.3 0.0 0.0 5238.3 96.4 112.4 109.9 5890.5 90.8 92.3
01-Sep-19Total 0.0 153345.0 0.0 0.0 153345.0 173091.1
Minimum 89.2 4069.5 83.7 84.9Average 111.5 5583.6
Maximum 128.3 6370.9
Flow through UV Reactors UV Header Pressure
August, 2019

Armstrong - Fortune Creek Month:Total Flow to Reservoirs and to Distribution Report
Distribution Res 1 Level Res 3 Level
Date UV 1 Total UV 2 Total UV 3 Total UV 4 Total Total Flow Minimum Maximum Average Total Flow Minimum MinimumCubic meters Cubic meters Cubic meters Cubic meters Cubic meters PSI PSI PSI Cubic meters % %
September 1 0.0 4423.2 0.0 0.0 4423.2 95.3 114.1 108.7 5006.6 90.8 92.2September 2 0.0 4683.6 0.0 0.0 4683.6 104.0 113.1 111.8 5263.9 90.8 92.2September 3 0.0 4834.6 0.0 0.0 4834.6 100.8 115.2 111.6 5475.4 90.8 92.2September 4 0.0 4836.5 0.0 0.0 4836.5 108.2 116.4 111.9 5478.3 90.5 91.8September 5 0.0 4432.1 0.0 0.0 4432.1 97.6 115.1 111.8 5008.8 90.8 92.1September 6 0.0 4518.8 0.0 0.0 4518.8 106.4 115.4 111.8 5089.2 88.5 89.8September 7 0.0 4520.3 0.0 0.0 4520.3 109.3 113.4 112.3 5091.4 91.1 92.6September 8 0.0 3645.4 0.0 0.0 3645.4 107.2 115.4 112.3 4096.6 90.8 92.3September 9 0.0 3789.9 0.0 0.0 3789.9 95.7 114.9 112.2 4290.9 90.8 92.2September 10 0.0 3791.4 0.0 0.0 3791.4 108.4 113.7 112.0 4292.8 90.9 92.3September 11 0.0 3568.6 0.0 0.0 3568.6 106.6 113.2 111.5 4018.2 91.0 92.5September 12 0.0 3570.0 0.0 0.0 3570.0 108.6 118.3 111.9 4020.0 90.9 92.4September 13 0.0 3575.2 0.0 0.0 3575.2 108.2 115.1 111.6 4016.2 90.0 91.6September 14 0.0 3577.1 0.0 0.0 3577.1 111.6 113.5 112.6 4018.4 91.1 92.7September 15 0.0 2787.2 0.0 0.0 2787.2 111.2 116.2 112.6 3129.0 91.2 92.7September 16 0.0 3329.8 0.0 0.0 3329.8 104.3 118.2 111.5 3703.6 89.9 91.4September 17 0.0 3331.7 0.0 0.0 3331.7 110.1 114.3 112.5 3705.6 91.1 92.7September 18 0.0 3171.5 0.0 0.0 3171.5 109.3 113.5 112.5 3561.3 89.3 90.9September 19 0.0 3221.1 0.0 0.0 3221.1 110.6 120.9 112.5 3601.2 89.3 90.8September 20 0.0 3222.6 0.0 0.0 3222.6 110.2 113.6 112.5 3602.6 91.0 92.6September 21 0.0 3033.9 0.0 0.0 3033.9 94.2 115.0 112.7 3385.0 91.1 92.7September 22 0.0 2561.6 0.0 0.0 2561.6 108.8 120.6 112.8 2860.2 91.1 92.7September 23 0.0 3009.1 0.0 0.0 3009.1 110.1 113.5 112.6 3372.5 89.3 90.9September 24 0.0 3010.7 0.0 0.0 3010.7 101.8 117.1 112.0 3374.1 79.3 80.9September 25 0.0 2880.4 0.0 0.0 2880.4 97.6 116.6 112.6 3233.5 90.4 92.0September 26 0.0 2944.1 0.0 0.0 2944.1 100.5 115.9 112.6 3294.2 91.2 92.8September 27 0.0 2944.9 0.0 0.0 2944.9 99.7 116.9 112.7 3295.5 91.2 92.8September 28 0.0 2800.9 0.0 0.0 2800.9 95.0 115.2 112.8 3144.3 91.2 92.8September 29 0.0 2319.7 0.0 0.0 2319.7 110.1 118.4 112.8 2605.6 91.2 92.8September 30 0.0 2844.0 0.0 0.0 2844.0 104.5 117.1 112.6 3183.2 91.2 92.8
October 102-Oct-19Total 0.0 105179.9 0.0 0.0 105179.9 118217.9
Minimum 94.2 2605.6 79.3 80.9Average 112.1 3940.6
Maximum 120.9 5478.3
Flow through UV Reactors UV Header Pressure
September, 2019

Armstrong - Fortune Creek Month:Total Flow to Reservoirs and to Distribution Report
Distribution Res 1 Level Res 3 Level
Date UV 1 Total UV 2 Total UV 3 Total UV 4 Total Total Flow Minimum Maximum Average Total Flow Minimum MinimumCubic meters Cubic meters Cubic meters Cubic meters Cubic meters PSI PSI PSI Cubic meters % %
October 1 0.0 2880.7 0.0 0.0 2880.7 105.1 115.8 112.6 3205.6 91.2 92.8October 2 0.0 2881.8 0.0 0.0 2881.8 104.6 116.5 112.6 3215.7 91.2 92.8October 3 0.0 2868.6 0.0 0.0 2868.6 99.9 114.6 112.6 3217.2 90.2 91.7October 4 0.0 2853.8 0.0 0.0 2853.8 94.8 118.6 112.6 3190.9 91.2 92.8October 5 0.0 2855.4 0.0 0.0 2855.4 108.2 116.1 112.9 3192.1 91.2 92.8October 6 0.0 2263.2 0.0 0.0 2263.2 87.3 130.8 112.8 2509.0 91.2 92.8October 7 0.0 2838.0 0.0 0.0 2838.0 104.1 116.2 112.6 3190.8 91.1 92.7October 8 0.0 2839.4 0.0 0.0 2839.4 98.3 117.2 112.6 3193.1 91.2 92.8October 9 0.0 2823.3 0.0 0.0 2823.3 99.7 117.3 112.6 3151.9 91.2 92.8October 10 0.0 2778.3 0.0 0.0 2778.3 109.8 128.7 112.7 3121.8 91.2 92.8October 11 0.0 2779.5 0.0 0.0 2779.5 95.8 116.5 112.6 3094.2 91.2 92.8October 12 0.0 2717.1 0.0 0.0 2717.1 109.6 113.7 112.8 3030.3 91.2 92.8October 13 0.0 2194.7 0.0 0.0 2194.7 109.9 116.7 112.8 2421.1 91.2 92.8October 14 0.0 2260.5 0.0 0.0 2260.5 109.1 116.4 112.8 2517.2 91.1 92.8October 15 0.0 2838.2 0.0 0.0 2838.2 97.7 116.8 112.6 3149.0 91.2 92.7October 16 0.0 2839.5 0.0 0.0 2839.5 101.4 116.4 112.2 3151.5 80.2 81.9October 17 0.0 2789.9 0.0 0.0 2789.9 109.0 116.1 112.6 3135.7 91.2 92.7October 18 0.0 2793.0 0.0 0.0 2793.0 104.2 117.0 112.6 3138.1 91.1 92.8October 19 0.0 2763.5 0.0 0.0 2763.5 101.4 116.7 112.8 3060.9 91.1 92.8October 20 0.0 2226.8 0.0 0.0 2226.8 109.9 117.7 112.8 2471.4 91.2 92.8October 21 0.0 2690.3 0.0 0.0 2690.3 100.0 117.0 112.6 3014.2 91.2 92.7October 22 0.0 2709.5 0.0 0.0 2709.5 102.4 115.7 112.6 3017.2 91.1 92.7October 23 0.0 2725.6 0.0 0.0 2725.6 104.1 117.5 112.6 3038.1 91.2 92.7October 24 0.0 2728.6 0.0 0.0 2728.6 105.7 117.4 112.6 3040.0 91.1 92.8October 25 1292.0 2668.1 65.9 0.0 2668.1 106.3 117.6 112.7 2978.3 91.1 92.7October 26 2101.3 1151.0 65.9 0.0 2510.5 86.8 116.8 112.8 2821.0 91.2 92.8October 27 2117.3 0.0 0.0 0.0 2117.3 100.4 117.1 112.8 2356.8 91.2 92.8October 28 2750.8 0.0 0.0 0.0 2750.8 98.8 115.1 112.6 3075.6 91.2 92.7October 29 2753.9 0.0 0.0 0.0 2753.9 98.0 114.1 112.6 3077.6 91.2 92.8October 30 2660.4 0.0 0.0 0.0 2660.4 99.7 122.8 112.6 2970.4 91.2 92.7October 31 2663.4 0.0 0.0 0.0 2663.4 109.7 122.4 112.6 2952.4 91.2 92.8
01-Nov-19Total 16339.2 68758.1 131.7 0.0 83063.4 92699.0
Minimum 86.8 2356.8 80.2 81.9Average 112.7 2990.3
Maximum 130.8 3217.2
Flow through UV Reactors UV Header Pressure
October, 2019

Armstrong - Fortune Creek Month:Total Flow to Reservoirs and to Distribution Report
Distribution Res 1 Level Res 3 Level
Date UV 1 Total UV 2 Total UV 3 Total UV 4 Total Total Flow Minimum Maximum Average Total Flow Minimum MinimumCubic meters Cubic meters Cubic meters Cubic meters Cubic meters PSI PSI PSI Cubic meters % %
November 1 2648.1 0.0 0.0 0.0 2648.1 109.7 118.0 112.6 2965.7 91.2 92.8November 2 2649.5 0.0 0.0 0.0 2649.5 109.6 114.8 112.8 2967.6 91.2 92.8November 3 2185.1 0.0 0.0 0.0 2185.1 97.7 118.2 112.8 2412.6 91.2 92.8November 4 2588.1 0.0 0.0 0.0 2588.1 103.2 115.3 112.4 2890.2 91.1 92.8November 5 2613.6 0.0 0.0 0.0 2613.6 93.9 116.2 111.8 2917.6 91.1 92.8November 6 2615.9 0.0 0.0 0.0 2615.9 109.6 117.5 112.7 2919.9 91.2 92.7November 7 2546.6 0.0 0.0 0.0 2546.6 105.3 115.9 112.6 2849.8 91.2 92.8November 8 2534.1 0.0 0.0 0.0 2534.1 100.5 117.7 112.6 2851.8 91.2 92.8November 9 2473.1 0.0 0.0 0.0 2473.1 103.9 116.7 112.8 2760.9 91.2 92.8November 10 1957.6 0.0 0.0 0.0 1957.6 110.2 120.3 112.8 2185.2 91.2 92.8November 11 1990.5 0.0 0.0 0.0 1990.5 109.8 113.8 112.8 2204.3 91.1 92.8November 12 2510.2 0.0 0.0 0.0 2510.2 97.2 114.8 112.4 2815.7 91.1 92.8November 13 2513.5 0.0 0.0 0.0 2513.5 106.9 117.0 112.2 2817.9 91.2 92.8November 14 2484.0 0.0 0.0 0.0 2484.0 96.5 114.4 112.0 2765.6 91.2 92.8November 15 2372.3 0.0 0.0 0.0 2372.3 99.7 116.2 111.8 2638.0 91.2 92.8November 16 2354.0 0.0 0.0 0.0 2354.0 103.7 116.1 111.8 2618.8 91.2 92.8November 17 2014.7 0.0 0.0 0.0 2014.7 95.7 114.9 111.6 2229.0 91.2 92.8November 18 2016.0 1638.2 0.0 0.0 2539.0 108.8 117.0 112.5 2844.2 90.3 92.0November 19 900.8 2511.8 0.0 0.0 2540.4 95.9 116.5 111.8 2846.0 91.2 92.7November 20 0.0 2513.1 0.0 0.0 2513.1 104.0 114.7 112.2 2788.5 91.2 92.8November 21 0.0 2487.6 0.0 0.0 2487.6 99.1 116.5 112.6 2775.6 91.2 92.8November 22 0.0 2461.7 0.0 0.0 2461.7 98.8 115.1 112.7 2725.5 91.2 92.8November 23 0.0 2363.6 0.0 0.0 2363.6 110.4 117.1 112.8 2631.1 91.3 92.8November 24 0.0 2066.3 0.0 0.0 2066.3 108.8 114.2 112.7 2287.0 91.2 92.8November 25 0.0 2516.7 0.0 0.0 2516.7 102.8 116.8 112.4 2820.5 91.2 92.8November 26 0.0 2521.9 0.0 0.0 2521.9 107.2 117.4 112.2 2823.5 91.2 92.8November 27 0.0 2549.5 0.0 0.0 2549.5 106.2 116.8 111.8 2841.5 91.2 92.8November 28 0.0 2551.4 0.0 0.0 2551.4 105.2 116.6 111.6 2844.6 91.3 92.8November 29 0.0 2474.0 0.0 0.0 2474.0 102.8 113.9 111.4 2736.0 91.3 92.8November 30 0.0 2445.5 0.0 0.0 2445.5 102.9 116.2 112.4 2725.0 91.3 92.8December 1
02-Dec-19Total 43967.7 31101.1 0.0 0.0 73081.5 81499.9
Minimum 93.9 2185.2 90.3 92.0Average 112.3 2716.7
Maximum 120.3 2967.6
Flow through UV Reactors UV Header Pressure
November, 2019
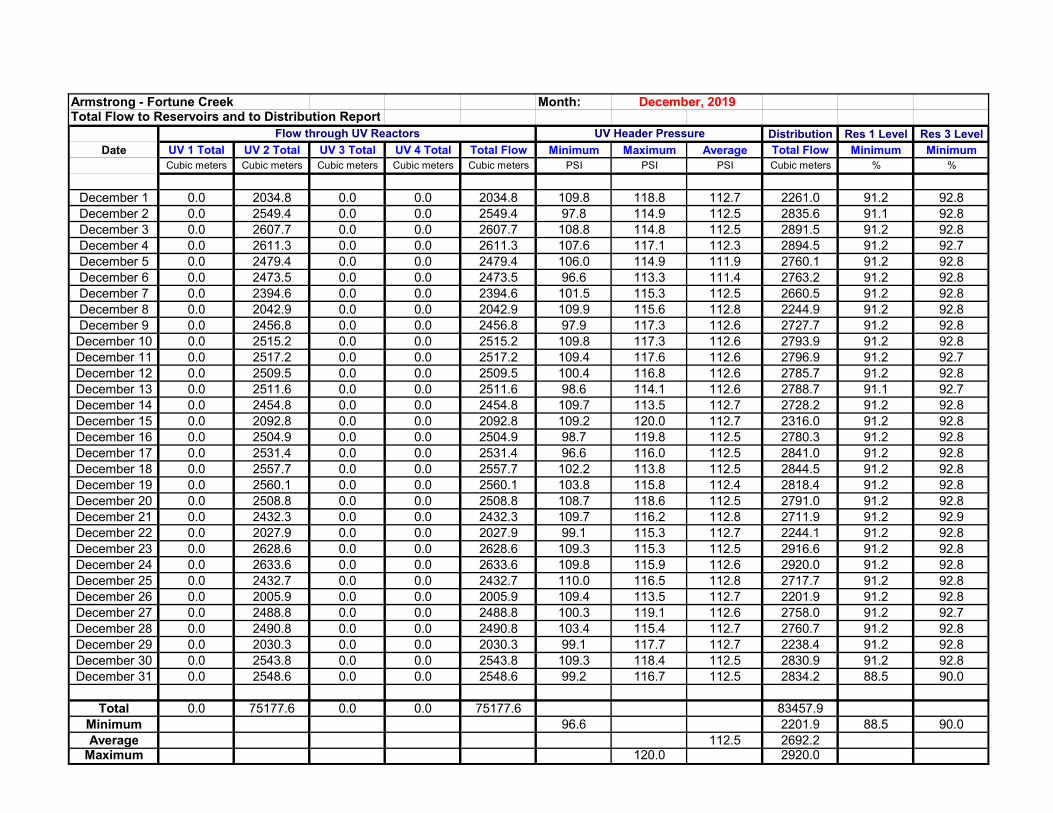
Armstrong - Fortune Creek Month:Total Flow to Reservoirs and to Distribution Report
Distribution Res 1 Level Res 3 Level
Date UV 1 Total UV 2 Total UV 3 Total UV 4 Total Total Flow Minimum Maximum Average Total Flow Minimum MinimumCubic meters Cubic meters Cubic meters Cubic meters Cubic meters PSI PSI PSI Cubic meters % %
December 1 0.0 2034.8 0.0 0.0 2034.8 109.8 118.8 112.7 2261.0 91.2 92.8December 2 0.0 2549.4 0.0 0.0 2549.4 97.8 114.9 112.5 2835.6 91.1 92.8December 3 0.0 2607.7 0.0 0.0 2607.7 108.8 114.8 112.5 2891.5 91.2 92.8December 4 0.0 2611.3 0.0 0.0 2611.3 107.6 117.1 112.3 2894.5 91.2 92.7December 5 0.0 2479.4 0.0 0.0 2479.4 106.0 114.9 111.9 2760.1 91.2 92.8December 6 0.0 2473.5 0.0 0.0 2473.5 96.6 113.3 111.4 2763.2 91.2 92.8December 7 0.0 2394.6 0.0 0.0 2394.6 101.5 115.3 112.5 2660.5 91.2 92.8December 8 0.0 2042.9 0.0 0.0 2042.9 109.9 115.6 112.8 2244.9 91.2 92.8December 9 0.0 2456.8 0.0 0.0 2456.8 97.9 117.3 112.6 2727.7 91.2 92.8December 10 0.0 2515.2 0.0 0.0 2515.2 109.8 117.3 112.6 2793.9 91.2 92.8December 11 0.0 2517.2 0.0 0.0 2517.2 109.4 117.6 112.6 2796.9 91.2 92.7December 12 0.0 2509.5 0.0 0.0 2509.5 100.4 116.8 112.6 2785.7 91.2 92.8December 13 0.0 2511.6 0.0 0.0 2511.6 98.6 114.1 112.6 2788.7 91.1 92.7December 14 0.0 2454.8 0.0 0.0 2454.8 109.7 113.5 112.7 2728.2 91.2 92.8December 15 0.0 2092.8 0.0 0.0 2092.8 109.2 120.0 112.7 2316.0 91.2 92.8December 16 0.0 2504.9 0.0 0.0 2504.9 98.7 119.8 112.5 2780.3 91.2 92.8December 17 0.0 2531.4 0.0 0.0 2531.4 96.6 116.0 112.5 2841.0 91.2 92.8December 18 0.0 2557.7 0.0 0.0 2557.7 102.2 113.8 112.5 2844.5 91.2 92.8December 19 0.0 2560.1 0.0 0.0 2560.1 103.8 115.8 112.4 2818.4 91.2 92.8December 20 0.0 2508.8 0.0 0.0 2508.8 108.7 118.6 112.5 2791.0 91.2 92.8December 21 0.0 2432.3 0.0 0.0 2432.3 109.7 116.2 112.8 2711.9 91.2 92.9December 22 0.0 2027.9 0.0 0.0 2027.9 99.1 115.3 112.7 2244.1 91.2 92.8December 23 0.0 2628.6 0.0 0.0 2628.6 109.3 115.3 112.5 2916.6 91.2 92.8December 24 0.0 2633.6 0.0 0.0 2633.6 109.8 115.9 112.6 2920.0 91.2 92.8December 25 0.0 2432.7 0.0 0.0 2432.7 110.0 116.5 112.8 2717.7 91.2 92.8December 26 0.0 2005.9 0.0 0.0 2005.9 109.4 113.5 112.7 2201.9 91.2 92.8December 27 0.0 2488.8 0.0 0.0 2488.8 100.3 119.1 112.6 2758.0 91.2 92.7December 28 0.0 2490.8 0.0 0.0 2490.8 103.4 115.4 112.7 2760.7 91.2 92.8December 29 0.0 2030.3 0.0 0.0 2030.3 99.1 117.7 112.7 2238.4 91.2 92.8December 30 0.0 2543.8 0.0 0.0 2543.8 109.3 118.4 112.5 2830.9 91.2 92.8December 31 0.0 2548.6 0.0 0.0 2548.6 99.2 116.7 112.5 2834.2 88.5 90.0
01-Jan-20Total 0.0 75177.6 0.0 0.0 75177.6 83457.9
Minimum 96.6 2201.9 88.5 90.0Average 112.5 2692.2
Maximum 120.0 2920.0
Flow through UV Reactors UV Header Pressure
December, 2019

City of Armstrong Water System 2019 Annual Report
Page 86
UV System Performance Report (SCADA Automatic Report)

Armstrong - Fortune Creek Month:UV System Performance Report
Date
Min Avg Min Max Avg Min Max Avg Min Max Avg Min Max Avg
% % mJ/cm^2 mJ/cm^2 mJ/cm^2 mJ/cm^2 mJ/cm^2 mJ/cm^2 mJ/cm^2 mJ/cm^2 mJ/cm^2 mJ/cm^2 mJ/cm^2 mJ/cm^2
January 1 99.01 99.07 0.00 0.00 0.00 0.00 0.00 0.00 0.00 0.00 0.00 25.05 25.07 25.05
January 2 99.16 99.16 0.00 0.00 0.00 0.00 0.00 0.00 0.00 0.00 0.00 24.34 25.07 25.05
January 3 99.20 99.20 0.00 0.00 0.00 0.00 0.00 0.00 0.00 0.00 0.00 20.57 25.09 25.05
January 4 99.24 99.24 0.00 25.11 0.10 0.00 0.00 0.00 0.00 0.00 0.00 24.45 25.07 25.05
January 5 99.28 99.28 0.00 0.00 0.00 0.00 0.00 0.00 0.00 0.00 0.00 25.05 25.07 25.05
January 6 99.32 99.32 0.00 0.00 0.00 0.00 0.00 0.00 0.00 0.00 0.00 25.05 25.07 25.06
January 7 99.36 99.36 0.00 0.00 0.00 0.00 0.00 0.00 0.00 0.00 0.00 25.05 25.07 25.06
January 8 99.40 99.40 0.00 0.00 0.00 0.00 0.00 0.00 0.00 0.00 0.00 25.05 25.07 25.05
January 9 99.29 99.44 0.00 0.00 0.00 0.00 0.00 0.00 0.00 0.00 0.00 25.01 25.07 25.05
January 10 99.18 99.25 0.00 0.00 0.00 0.00 0.00 0.00 0.00 0.00 0.00 25.01 25.07 25.05
January 11 99.23 99.23 0.00 0.00 0.00 0.00 0.00 0.00 0.00 0.00 0.00 25.05 25.07 25.05
January 12 99.36 99.42 0.00 0.00 0.00 0.00 0.00 0.00 0.00 0.00 0.00 25.03 25.07 25.05
January 13 99.27 99.36 0.00 0.00 0.00 0.00 0.00 0.00 0.00 0.00 0.00 0.00 25.07 24.76
January 14 99.17 99.27 0.00 0.00 0.00 0.00 0.00 0.00 0.00 0.00 0.00 25.03 25.07 25.05
January 15 99.08 99.17 0.00 0.00 0.00 0.00 0.00 0.00 0.00 0.00 0.00 25.03 25.07 25.05
January 16 99.02 99.24 0.00 0.00 0.00 0.00 0.00 0.00 0.00 0.00 0.00 25.03 25.11 25.05
January 17 99.43 99.54 0.00 0.00 0.00 0.00 0.00 0.00 0.00 0.00 0.00 25.03 25.07 25.05
January 18 99.31 99.43 0.00 0.00 0.00 0.00 0.00 0.00 0.00 0.00 0.00 25.03 25.07 25.06
January 19 99.20 99.31 0.00 0.00 0.00 0.00 0.00 0.00 0.00 0.00 0.00 25.01 25.07 25.06
January 20 99.08 99.20 0.00 0.00 0.00 0.00 0.00 0.00 0.00 0.00 0.00 25.05 25.07 25.06
January 21 98.96 99.08 0.00 0.00 0.00 0.00 0.00 0.00 0.00 0.00 0.00 25.05 25.07 25.06
January 22 98.85 98.96 0.00 25.14 15.50 0.00 0.00 0.00 0.00 0.00 0.00 0.00 25.07 9.46
January 23 98.78 99.13 24.02 25.13 25.10 0.00 0.00 0.00 0.00 0.00 0.00 0.00 0.00 0.00
January 24 99.69 99.69 25.09 25.13 25.11 0.00 0.00 0.00 0.00 0.00 0.00 0.00 0.00 0.00
January 25 99.69 99.69 25.09 25.13 25.11 0.00 0.00 0.00 0.00 0.00 0.00 0.00 0.00 0.00
January 26 99.69 99.69 25.11 25.13 25.11 0.00 0.00 0.00 0.00 0.00 0.00 0.00 0.00 0.00
January 27 99.69 99.69 25.07 25.13 25.11 0.00 0.00 0.00 0.00 0.00 0.00 0.00 0.00 0.00
January 28 99.69 99.69 25.07 25.13 25.10 0.00 0.00 0.00 0.00 0.00 0.00 0.00 0.00 0.00
January 29 99.69 99.69 25.09 25.11 25.10 0.00 0.00 0.00 0.00 0.00 0.00 0.00 0.00 0.00
January 30 99.69 99.69 25.09 25.14 25.11 0.00 0.00 0.00 0.00 0.00 0.00 0.00 0.00 0.00
January 31 99.69 99.69 25.09 25.13 25.11 0.00 0.00 0.00 0.00 0.00 0.00 0.00 0.00 0.0001-Feb-19
Total
Minimum 98.78 0.00 0.00 0.00 0.00
Average 99.37 7.79 0.00 0.00 17.27Maximum 25.14 0.00 0.00 25.11
UV 4Raw Water
DoseUVT
January, 2019
Dose Dose Dose
UV 1 UV 2 UV 3

Armstrong - Fortune Creek Month:UV System Performance Report
Date
Min Avg Min Max Avg Min Max Avg Min Max Avg Min Max Avg
% % mJ/cm^2 mJ/cm^2 mJ/cm^2 mJ/cm^2 mJ/cm^2 mJ/cm^2 mJ/cm^2 mJ/cm^2 mJ/cm^2 mJ/cm^2 mJ/cm^2 mJ/cm^2
February 1 99.90 99.90 25.07 25.13 25.11 0.00 0.00 0.00 0.00 0.00 0.00 0.00 0.00 0.00
February 2 99.83 99.93 25.11 25.13 25.11 0.00 0.00 0.00 0.00 0.00 0.00 0.00 0.00 0.00
February 3 99.62 99.88 25.11 25.13 25.11 0.00 0.00 0.00 0.00 0.00 0.00 0.00 0.00 0.00
February 4 99.88 99.88 25.06 25.13 25.10 0.00 0.00 0.00 0.00 0.00 0.00 0.00 0.00 0.00
February 5 99.88 99.88 25.05 25.11 25.09 0.00 0.00 0.00 0.00 0.00 0.00 0.00 0.00 0.00
February 6 99.88 99.88 25.09 25.11 25.09 0.00 0.00 0.00 0.00 0.00 0.00 0.00 0.00 0.00
February 7 99.88 99.88 25.09 25.13 25.10 0.00 0.00 0.00 0.00 0.00 0.00 0.00 0.00 0.00
February 8 99.88 99.88 25.09 25.11 25.10 0.00 0.00 0.00 0.00 0.00 0.00 0.00 0.00 0.00
February 9 99.88 99.88 25.09 25.11 25.10 0.00 0.00 0.00 0.00 0.00 0.00 0.00 0.00 0.00
February 10 99.88 99.88 25.05 25.11 25.10 0.00 0.00 0.00 0.00 0.00 0.00 0.00 0.00 0.00
February 11 99.88 99.88 25.03 25.11 25.10 0.00 0.00 0.00 0.00 0.00 0.00 0.00 0.00 0.00
February 12 99.88 99.88 25.09 25.14 25.10 0.00 0.00 0.00 0.00 0.00 0.00 0.00 0.00 0.00
February 13 99.88 99.88 25.09 25.13 25.10 0.00 0.00 0.00 0.00 0.00 0.00 0.00 0.00 0.00
February 14 99.88 99.88 25.09 25.13 25.10 0.00 0.00 0.00 0.00 0.00 0.00 0.00 0.00 0.00
February 15 99.88 99.88 25.09 25.11 25.10 0.00 0.00 0.00 0.00 0.00 0.00 0.00 0.00 0.00
February 16 99.88 99.88 25.09 25.13 25.10 0.00 0.00 0.00 0.00 0.00 0.00 0.00 0.00 0.00
February 17 99.88 99.88 25.09 25.13 25.11 0.00 0.00 0.00 0.00 0.00 0.00 0.00 0.00 0.00
February 18 99.88 99.88 25.09 25.11 25.10 0.00 0.00 0.00 0.00 0.00 0.00 0.00 0.00 0.00
February 19 99.88 99.88 25.09 25.11 25.10 0.00 0.00 0.00 0.00 0.00 0.00 0.00 0.00 0.00
February 20 99.88 99.88 25.09 25.13 25.10 0.00 0.00 0.00 0.00 0.00 0.00 0.00 0.00 0.00
February 21 99.88 99.88 25.08 25.11 25.10 0.00 0.00 0.00 0.00 0.00 0.00 0.00 0.00 0.00
February 22 99.88 99.88 25.07 25.13 25.11 0.00 0.00 0.00 0.00 0.00 0.00 0.00 0.00 0.00
February 23 99.88 99.88 25.09 25.13 25.10 0.00 0.00 0.00 0.00 0.00 0.00 0.00 0.00 0.00
February 24 99.88 99.88 25.09 25.14 25.11 0.00 0.00 0.00 0.00 0.00 0.00 0.00 0.00 0.00
February 25 99.88 99.96 25.07 25.13 25.10 0.00 0.00 0.00 0.00 0.00 0.00 0.00 0.00 0.00
February 26 100.00 100.00 25.09 25.13 25.10 0.00 0.00 0.00 0.00 0.00 0.00 0.00 0.00 0.00
February 27 100.00 100.00 25.09 25.11 25.10 0.00 0.00 0.00 0.00 0.00 0.00 0.00 0.00 0.00
February 28 100.00 100.00 25.09 25.11 25.10 0.00 0.00 0.00 0.00 0.00 0.00 0.00 0.00 0.00
March 2
March 304-Mar-19
Total
Minimum 99.62 25.03 0.00 0.00 0.00
Average 99.90 25.10 0.00 0.00 0.00Maximum 25.14 0.00 0.00 0.00
UVT
Raw Water UV 1 UV 2 UV 3 UV 4
Dose Dose Dose
February, 2019
Dose

Armstrong - Fortune Creek Month:
UV System Performance Report
Date
Min Avg Min Max Avg Min Max Avg Min Max Avg Min Max Avg
% % mJ/cm^2 mJ/cm^2 mJ/cm^2 mJ/cm^2 mJ/cm^2 mJ/cm^2 mJ/cm^2 mJ/cm^2 mJ/cm^2 mJ/cm^2 mJ/cm^2 mJ/cm^2
March 1 100.00 100.00 25.05 25.11 25.10 0.00 0.00 0.00 0.00 0.00 0.00 0.00 0.00 0.00
March 2 100.00 100.00 25.07 25.13 25.10 0.00 0.00 0.00 0.00 0.00 0.00 0.00 0.00 0.00
March 3 100.00 100.00 25.09 25.11 25.10 0.00 0.00 0.00 0.00 0.00 0.00 0.00 0.00 0.00
March 4 100.00 100.00 25.09 25.11 25.10 0.00 0.00 0.00 0.00 0.00 0.00 0.00 0.00 0.00
March 5 100.00 100.00 25.09 25.11 25.10 0.00 0.00 0.00 0.00 0.00 0.00 0.00 0.00 0.00
March 6 100.00 100.00 25.09 25.13 25.10 0.00 0.00 0.00 0.00 0.00 0.00 0.00 0.00 0.00
March 7 100.00 100.00 25.09 25.13 25.11 0.00 0.00 0.00 0.00 0.00 0.00 0.00 0.00 0.00
March 8 100.00 100.00 25.09 25.11 25.10 0.00 0.00 0.00 0.00 0.00 0.00 0.00 0.00 0.00
March 9 100.00 100.00 25.09 25.13 25.11 0.00 0.00 0.00 0.00 0.00 0.00 0.00 0.00 0.00
March 10 100.00 100.00 25.07 25.13 25.10 0.00 0.00 0.00 0.00 0.00 0.00 0.00 0.00 0.00
March 11 100.00 100.00 25.07 25.13 25.11 0.00 0.00 0.00 0.00 0.00 0.00 0.00 0.00 0.00
March 12 94.86 99.29 23.51 25.13 25.10 0.00 0.00 0.00 0.00 0.00 0.00 0.00 0.00 0.00
March 13 98.87 98.87 24.41 25.13 25.10 0.00 0.00 0.00 0.00 0.00 0.00 0.00 0.00 0.00
March 14 98.96 98.96 24.51 25.11 25.10 0.00 0.00 0.00 0.00 0.00 0.00 0.00 0.00 0.00
March 15 99.06 99.08 24.71 25.13 25.11 0.00 0.00 0.00 0.00 0.00 0.00 0.00 0.00 0.00
March 16 99.13 99.13 25.09 25.13 25.11 0.00 0.00 0.00 0.00 0.00 0.00 0.00 0.00 0.00
March 17 99.19 99.19 25.11 25.13 25.11 0.00 0.00 0.00 0.00 0.00 0.00 0.00 0.00 0.00
March 18 99.25 99.25 0.00 25.13 24.78 0.00 0.00 0.00 0.00 0.00 0.00 0.00 0.00 0.00
March 19 99.30 99.32 25.09 25.13 25.11 0.00 0.00 0.00 0.00 0.00 0.00 0.00 0.00 0.00
March 20 99.23 99.30 25.11 25.13 25.11 0.00 0.00 0.00 0.00 0.00 0.00 0.00 0.00 0.00
March 21 99.16 99.23 25.11 25.13 25.11 0.00 0.00 0.00 0.00 0.00 0.00 0.00 0.00 0.00
March 22 99.09 99.16 25.11 25.13 25.11 0.00 0.00 0.00 0.00 0.00 0.00 0.00 0.00 0.00
March 23 98.96 99.08 25.11 25.13 25.12 0.00 0.00 0.00 0.00 0.00 0.00 0.00 0.00 0.00
March 24 98.81 98.96 25.11 25.13 25.11 0.00 0.00 0.00 0.00 0.00 0.00 0.00 0.00 0.00
March 25 97.44 98.42 19.97 25.13 25.10 0.00 0.00 0.00 0.00 0.00 0.00 0.00 0.00 0.00
March 26 90.03 96.59 18.67 25.22 24.90 0.00 0.00 0.00 0.00 0.00 0.00 0.00 0.00 0.00
March 27 96.35 96.82 19.67 25.13 25.08 0.00 25.14 0.10 0.00 0.00 0.00 0.00 0.00 0.00
March 28 96.22 97.64 21.21 25.13 25.09 0.00 0.00 0.00 0.00 0.00 0.00 0.00 0.00 0.00
March 29 98.18 98.37 22.80 25.13 25.11 0.00 0.00 0.00 0.00 0.00 0.00 0.00 0.00 0.00
March 30 98.73 98.78 25.11 25.13 25.11 0.00 0.00 0.00 0.00 0.00 0.00 0.00 0.00 0.00
March 31 98.98 99.02 25.07 25.14 25.11 0.00 0.00 0.00 0.00 0.00 0.00 0.00 0.00 0.00
01-Apr-19
Total
Minimum 90.03 0.00 0.00 0.00 0.00
Average 99.18 25.09 0.00 0.00 0.00
Maximum 25.22 25.14 0.00 0.00
March, 2019
Raw Water UV 1 UV 2 UV 3 UV 4
UVT Dose Dose Dose Dose
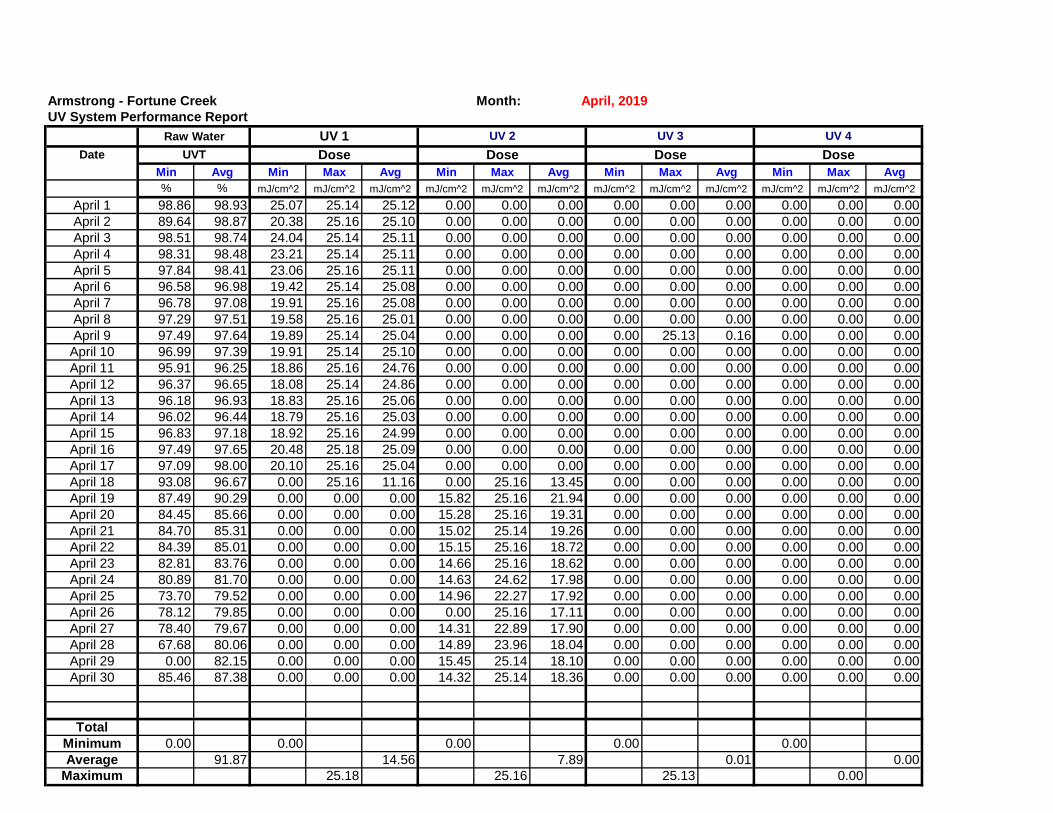
Armstrong - Fortune Creek Month:UV System Performance Report
DateMin Avg Min Max Avg Min Max Avg Min Max Avg Min Max Avg% % mJ/cm^2 mJ/cm^2 mJ/cm^2 mJ/cm^2 mJ/cm^2 mJ/cm^2 mJ/cm^2 mJ/cm^2 mJ/cm^2 mJ/cm^2 mJ/cm^2 mJ/cm^2
April 1 98.86 98.93 25.07 25.14 25.12 0.00 0.00 0.00 0.00 0.00 0.00 0.00 0.00 0.00April 2 89.64 98.87 20.38 25.16 25.10 0.00 0.00 0.00 0.00 0.00 0.00 0.00 0.00 0.00April 3 98.51 98.74 24.04 25.14 25.11 0.00 0.00 0.00 0.00 0.00 0.00 0.00 0.00 0.00April 4 98.31 98.48 23.21 25.14 25.11 0.00 0.00 0.00 0.00 0.00 0.00 0.00 0.00 0.00April 5 97.84 98.41 23.06 25.16 25.11 0.00 0.00 0.00 0.00 0.00 0.00 0.00 0.00 0.00April 6 96.58 96.98 19.42 25.14 25.08 0.00 0.00 0.00 0.00 0.00 0.00 0.00 0.00 0.00April 7 96.78 97.08 19.91 25.16 25.08 0.00 0.00 0.00 0.00 0.00 0.00 0.00 0.00 0.00April 8 97.29 97.51 19.58 25.16 25.01 0.00 0.00 0.00 0.00 0.00 0.00 0.00 0.00 0.00April 9 97.49 97.64 19.89 25.14 25.04 0.00 0.00 0.00 0.00 25.13 0.16 0.00 0.00 0.00April 10 96.99 97.39 19.91 25.14 25.10 0.00 0.00 0.00 0.00 0.00 0.00 0.00 0.00 0.00April 11 95.91 96.25 18.86 25.16 24.76 0.00 0.00 0.00 0.00 0.00 0.00 0.00 0.00 0.00April 12 96.37 96.65 18.08 25.14 24.86 0.00 0.00 0.00 0.00 0.00 0.00 0.00 0.00 0.00April 13 96.18 96.93 18.83 25.16 25.06 0.00 0.00 0.00 0.00 0.00 0.00 0.00 0.00 0.00April 14 96.02 96.44 18.79 25.16 25.03 0.00 0.00 0.00 0.00 0.00 0.00 0.00 0.00 0.00April 15 96.83 97.18 18.92 25.16 24.99 0.00 0.00 0.00 0.00 0.00 0.00 0.00 0.00 0.00April 16 97.49 97.65 20.48 25.18 25.09 0.00 0.00 0.00 0.00 0.00 0.00 0.00 0.00 0.00April 17 97.09 98.00 20.10 25.16 25.04 0.00 0.00 0.00 0.00 0.00 0.00 0.00 0.00 0.00April 18 93.08 96.67 0.00 25.16 11.16 0.00 25.16 13.45 0.00 0.00 0.00 0.00 0.00 0.00April 19 87.49 90.29 0.00 0.00 0.00 15.82 25.16 21.94 0.00 0.00 0.00 0.00 0.00 0.00April 20 84.45 85.66 0.00 0.00 0.00 15.28 25.16 19.31 0.00 0.00 0.00 0.00 0.00 0.00April 21 84.70 85.31 0.00 0.00 0.00 15.02 25.14 19.26 0.00 0.00 0.00 0.00 0.00 0.00April 22 84.39 85.01 0.00 0.00 0.00 15.15 25.16 18.72 0.00 0.00 0.00 0.00 0.00 0.00April 23 82.81 83.76 0.00 0.00 0.00 14.66 25.16 18.62 0.00 0.00 0.00 0.00 0.00 0.00April 24 80.89 81.70 0.00 0.00 0.00 14.63 24.62 17.98 0.00 0.00 0.00 0.00 0.00 0.00April 25 73.70 79.52 0.00 0.00 0.00 14.96 22.27 17.92 0.00 0.00 0.00 0.00 0.00 0.00April 26 78.12 79.85 0.00 0.00 0.00 0.00 25.16 17.11 0.00 0.00 0.00 0.00 0.00 0.00April 27 78.40 79.67 0.00 0.00 0.00 14.31 22.89 17.90 0.00 0.00 0.00 0.00 0.00 0.00April 28 67.68 80.06 0.00 0.00 0.00 14.89 23.96 18.04 0.00 0.00 0.00 0.00 0.00 0.00April 29 0.00 82.15 0.00 0.00 0.00 15.45 25.14 18.10 0.00 0.00 0.00 0.00 0.00 0.00April 30 85.46 87.38 0.00 0.00 0.00 14.32 25.14 18.36 0.00 0.00 0.00 0.00 0.00 0.00May 12-May-19Total
Minimum 0.00 0.00 0.00 0.00 0.00Average 91.87 14.56 7.89 0.01 0.00
Maximum 25.18 25.16 25.13 0.00
UV 4Dose Dose Dose
April, 2019
DoseUVTRaw Water UV 1 UV 2 UV 3

Armstrong - Fortune Creek Month:UV System Performance Report
DateMin Avg Min Max Avg Min Max Avg Min Max Avg Min Max Avg% % mJ/cm^2 mJ/cm^2 mJ/cm^2 mJ/cm^2 mJ/cm^2 mJ/cm^2 mJ/cm^2 mJ/cm^2 mJ/cm^2 mJ/cm^2 mJ/cm^2 mJ/cm^2
May 1 85.92 86.20 0.00 0.00 0.00 14.87 25.16 18.19 0.00 0.00 0.00 0.00 0.00 0.00May 2 86.37 86.57 0.00 0.00 0.00 15.88 25.16 18.34 0.00 0.00 0.00 0.00 0.00 0.00May 3 85.82 86.31 0.00 0.00 0.00 16.37 25.16 18.17 0.00 0.00 0.00 0.00 0.00 0.00May 4 83.69 84.80 0.00 0.00 0.00 15.90 25.18 17.75 0.00 0.00 0.00 0.00 0.00 0.00May 5 81.66 82.49 0.00 0.00 0.00 15.15 25.01 17.83 0.00 0.00 0.00 0.00 0.00 0.00May 6 79.53 80.60 0.00 0.00 0.00 16.11 21.39 17.46 0.00 0.00 0.00 0.00 0.00 0.00May 7 76.59 78.34 0.00 0.00 0.00 16.31 18.09 17.52 0.00 0.00 0.00 0.00 0.00 0.00May 8 73.89 75.53 0.00 25.16 12.09 15.94 25.18 17.86 0.00 0.00 0.00 0.00 0.00 0.00May 9 72.39 73.25 16.20 17.98 17.35 15.99 17.98 17.26 0.00 0.00 0.00 0.00 0.00 0.00May 10 68.88 71.27 16.14 17.96 17.34 15.90 18.00 17.34 0.00 0.00 0.00 0.00 0.00 0.00May 11 65.36 68.05 15.13 18.00 17.42 16.14 18.00 17.40 0.00 0.00 0.00 0.00 0.00 0.00May 12 63.58 64.33 15.79 17.98 17.54 15.39 18.00 17.46 0.00 0.00 0.00 0.00 0.00 0.00May 13 60.16 64.41 0.00 17.98 5.45 11.91 17.98 17.43 0.00 25.18 12.01 0.00 0.00 0.00May 14 63.21 65.52 0.00 25.13 8.60 0.00 17.96 8.85 0.00 25.20 17.12 0.00 0.00 0.00May 15 63.49 65.76 14.40 18.02 17.45 0.00 0.00 0.00 16.41 18.06 17.48 0.00 0.00 0.00May 16 67.80 68.68 15.36 17.98 17.04 0.00 0.00 0.00 16.39 18.00 17.24 0.00 0.00 0.00May 17 68.07 68.91 15.90 18.00 17.13 0.00 25.37 0.68 16.39 18.09 17.24 0.00 0.00 0.00May 18 69.32 70.26 15.49 17.94 17.16 0.00 0.00 0.00 16.41 18.04 17.27 0.00 0.00 0.00May 19 70.55 71.40 16.13 17.98 17.10 0.00 0.00 0.00 16.42 18.04 17.07 0.00 0.00 0.00May 20 72.23 73.15 16.24 18.00 17.15 0.00 0.00 0.00 16.41 18.04 17.20 0.00 0.00 0.00May 21 73.50 74.90 15.58 18.24 17.05 0.00 0.00 0.00 16.39 18.00 17.14 0.00 0.00 0.00May 22 72.54 76.14 16.39 18.99 17.30 0.00 0.00 0.00 16.39 17.96 17.14 0.00 0.00 0.00May 23 76.43 76.71 15.84 19.09 17.23 0.00 0.00 0.00 16.41 18.04 17.18 0.00 0.00 0.00May 24 72.68 76.63 15.88 19.26 17.38 0.00 0.00 0.00 0.00 18.30 17.20 0.00 0.00 0.00May 25 71.56 73.21 15.96 18.06 17.22 0.00 0.00 0.00 0.00 0.00 0.00 0.00 0.00 0.00May 26 74.11 75.41 15.71 18.15 17.08 0.00 0.00 0.00 0.00 0.00 0.00 0.00 0.00 0.00May 27 76.55 77.42 15.36 18.19 17.17 0.00 0.00 0.00 0.00 0.00 0.00 0.00 0.00 0.00May 28 76.09 78.52 15.71 17.98 17.32 0.00 0.00 0.00 0.00 0.00 0.00 0.00 0.00 0.00May 29 78.78 79.45 16.11 17.98 17.34 0.00 0.00 0.00 0.00 0.00 0.00 0.00 0.00 0.00May 30 79.48 80.37 15.62 18.00 17.37 0.00 0.00 0.00 0.00 0.00 0.00 0.00 0.00 0.00May 31 80.76 81.59 15.96 18.00 17.22 0.00 0.00 0.00 0.00 0.00 0.00 0.00 0.00 0.0001-Jun-19Total
Minimum 60.16 0.00 0.00 0.00 0.00Average 75.36 12.53 7.73 6.49 0.00
Maximum 25.16 25.37 25.20 0.00
UVTRaw Water UV 1 UV 2 UV 3 UV 4
Dose Dose Dose
May, 2019
Dose

Armstrong - Fortune Creek Month:UV System Performance Report
DateMin Avg Min Max Avg Min Max Avg Min Max Avg Min Max Avg% % mJ/cm^2 mJ/cm^2 mJ/cm^2 mJ/cm^2 mJ/cm^2 mJ/cm^2 mJ/cm^2 mJ/cm^2 mJ/cm^2 mJ/cm^2 mJ/cm^2 mJ/cm^2
June 1 82.10 82.82 14.55 17.98 17.37 0.00 0.00 0.00 0.00 0.00 0.00 0.00 0.00 0.00June 2 83.20 83.94 15.73 18.09 17.33 0.00 0.00 0.00 0.00 0.00 0.00 0.00 0.00 0.00June 3 84.31 85.02 15.64 18.88 17.30 0.00 0.00 0.00 0.00 0.00 0.00 0.00 0.00 0.00June 4 80.88 86.23 15.79 20.14 17.33 0.00 0.00 0.00 0.00 0.00 0.00 0.00 0.00 0.00June 5 86.75 87.24 16.03 20.85 17.55 0.00 0.00 0.00 0.00 0.00 0.00 0.00 0.00 0.00June 6 87.56 87.91 15.77 21.23 17.32 0.00 0.00 0.00 0.00 25.20 0.40 0.00 0.00 0.00June 7 88.32 88.69 16.01 21.58 17.91 0.00 0.00 0.00 0.00 0.00 0.00 0.00 0.00 0.00June 8 84.82 87.68 16.18 21.26 18.26 0.00 0.00 0.00 0.00 0.00 0.00 0.00 0.00 0.00June 9 86.86 87.15 15.82 20.83 17.85 0.00 0.00 0.00 0.00 0.00 0.00 0.00 0.00 0.00June 10 87.51 88.14 15.52 21.30 17.66 0.00 0.00 0.00 0.00 0.00 0.00 0.00 0.00 0.00June 11 88.68 89.15 15.86 21.13 17.19 0.00 0.00 0.00 0.00 0.00 0.00 0.00 0.00 0.00June 12 89.54 89.99 16.35 21.69 17.31 0.00 0.00 0.00 0.00 0.00 0.00 0.00 0.00 0.00June 13 90.31 90.77 16.39 25.09 17.37 0.00 0.00 0.00 0.00 0.00 0.00 0.00 0.00 0.00June 14 91.17 91.63 16.31 25.16 17.69 0.00 0.00 0.00 0.00 0.00 0.00 0.00 0.00 0.00June 15 92.03 92.41 15.98 25.16 18.23 0.00 0.00 0.00 0.00 0.00 0.00 0.00 0.00 0.00June 16 92.79 93.13 16.41 25.16 18.17 0.00 0.00 0.00 0.00 0.00 0.00 0.00 0.00 0.00June 17 93.45 93.72 15.96 25.16 17.78 0.00 0.00 0.00 0.00 0.00 0.00 0.00 0.00 0.00June 18 93.96 94.24 0.00 25.14 8.58 0.00 25.18 9.29 0.00 0.00 0.00 0.00 0.00 0.00June 19 94.46 94.62 0.00 0.00 0.00 15.69 25.16 18.82 0.00 0.00 0.00 0.00 0.00 0.00June 20 93.09 94.33 0.00 0.00 0.00 16.41 25.16 19.76 0.00 0.00 0.00 0.00 0.00 0.00June 21 92.08 92.35 0.00 0.00 0.00 16.33 25.16 17.88 0.00 0.00 0.00 0.00 0.00 0.00June 22 92.04 92.44 0.00 0.00 0.00 16.42 25.16 19.80 0.00 0.00 0.00 0.00 0.00 0.00June 23 91.78 92.33 0.00 0.00 0.00 16.20 25.31 20.28 0.00 0.00 0.00 0.00 0.00 0.00June 24 91.22 91.47 0.00 0.00 0.00 15.64 25.16 18.05 0.00 0.00 0.00 0.00 0.00 0.00June 25 91.88 92.52 0.00 0.00 0.00 16.33 25.16 17.78 0.00 0.00 0.00 0.00 0.00 0.00June 26 92.86 93.30 0.00 0.00 0.00 16.39 25.16 18.19 0.00 0.00 0.00 0.00 0.00 0.00June 27 91.99 93.24 0.00 0.00 0.00 16.24 25.16 19.16 0.00 0.00 0.00 0.00 0.00 0.00June 28 87.82 90.49 0.00 0.00 0.00 16.05 25.14 18.07 0.00 0.00 0.00 0.00 0.00 0.00June 29 88.07 88.32 0.00 0.00 0.00 15.94 20.70 18.31 0.00 0.00 0.00 0.00 0.00 0.00June 30 88.74 89.77 0.00 0.00 0.00 15.73 23.06 18.09 0.00 0.00 0.00 0.00 0.00 0.00July 1
2-Jul-19Total
Minimum 80.88 0.00 0.00 0.00 0.00Average 90.17 10.27 7.78 0.01 0.00
Maximum 25.16 25.31 25.20 0.00
UV 4Dose Dose Dose
June, 2019
DoseUVTRaw Water UV 1 UV 2 UV 3

Armstrong - Fortune Creek Month:UV System Performance Report
DateMin Avg Min Max Avg Min Max Avg Min Max Avg Min Max Avg% % mJ/cm^2 mJ/cm^2 mJ/cm^2 mJ/cm^2 mJ/cm^2 mJ/cm^2 mJ/cm^2 mJ/cm^2 mJ/cm^2 mJ/cm^2 mJ/cm^2 mJ/cm^2
July 1 90.82 91.70 0.00 0.00 0.00 15.73 25.16 17.88 0.00 0.00 0.00 0.00 0.00 0.00July 2 92.03 92.31 0.00 0.00 0.00 15.24 25.16 18.00 0.00 0.00 0.00 0.00 0.00 0.00July 3 92.54 93.17 0.00 0.00 0.00 16.20 25.16 18.09 0.00 0.00 0.00 0.00 0.00 0.00July 4 88.22 92.39 0.00 0.00 0.00 15.88 24.90 18.37 0.00 0.00 0.00 0.00 0.00 0.00July 5 67.68 80.80 0.00 0.00 0.00 16.03 20.02 17.26 0.00 0.00 0.00 0.00 0.00 0.00July 6 72.43 73.36 0.00 0.00 0.00 15.77 18.17 17.18 0.00 0.00 0.00 0.00 0.00 0.00July 7 73.67 75.19 0.00 0.00 0.00 15.75 18.04 17.21 0.00 0.00 0.00 0.00 0.00 0.00July 8 75.33 79.17 0.00 0.00 0.00 16.07 18.00 17.16 0.00 0.00 0.00 0.00 0.00 0.00July 9 80.76 82.37 0.00 0.00 0.00 15.86 18.00 17.18 0.00 0.00 0.00 0.00 0.00 0.00July 10 83.66 84.62 0.00 0.00 0.00 15.88 18.30 17.26 0.00 0.00 0.00 0.00 0.00 0.00July 11 84.73 85.12 0.00 0.00 0.00 15.81 19.07 17.22 0.00 0.00 0.00 0.00 0.00 0.00July 12 85.79 86.45 0.00 0.00 0.00 15.84 20.01 17.27 0.00 0.00 0.00 0.00 0.00 0.00July 13 87.17 88.00 0.00 0.00 0.00 16.14 21.52 17.41 0.00 0.00 0.00 0.00 0.00 0.00July 14 88.84 89.39 0.00 0.00 0.00 15.92 22.37 17.31 0.00 0.00 0.00 0.00 0.00 0.00July 15 90.05 90.71 0.00 0.00 0.00 0.00 25.16 17.48 0.00 0.00 0.00 0.00 0.00 0.00July 16 91.27 91.71 0.00 0.00 0.00 15.99 25.16 17.63 0.00 0.00 0.00 0.00 0.00 0.00July 17 90.31 91.44 0.00 0.00 0.00 16.27 25.16 18.34 0.00 0.00 0.00 0.00 0.00 0.00July 18 88.22 89.46 0.00 0.00 0.00 16.18 23.53 18.02 0.00 0.00 0.00 0.00 0.00 0.00July 19 87.81 87.97 0.00 0.00 0.00 0.00 25.14 17.53 0.00 0.00 0.00 0.00 0.00 0.00July 20 88.08 88.46 0.00 0.00 0.00 16.33 22.54 18.39 0.00 0.00 0.00 0.00 0.00 0.00July 21 88.74 89.43 0.00 0.00 0.00 0.00 25.14 17.34 0.00 0.00 0.00 0.00 0.00 0.00July 22 90.21 90.97 0.00 0.00 0.00 15.88 22.44 17.56 0.00 0.00 0.00 0.00 0.00 0.00July 23 91.73 92.25 0.00 0.00 0.00 16.41 24.64 18.53 0.00 0.00 0.00 0.00 0.00 0.00July 24 88.32 90.08 0.00 0.00 0.00 15.99 24.66 17.74 0.00 0.00 0.00 0.00 0.00 0.00July 25 88.13 88.51 0.00 0.00 0.00 15.84 20.17 17.49 0.00 0.00 0.00 0.00 0.00 0.00July 26 89.14 90.29 0.00 0.00 0.00 15.73 22.99 17.52 0.00 0.00 0.00 0.00 0.00 0.00July 27 86.36 90.38 0.00 0.00 0.00 16.22 24.17 18.88 0.00 0.00 0.00 0.00 0.00 0.00July 28 84.51 84.95 0.00 0.00 0.00 15.79 18.08 17.26 0.00 0.00 0.00 0.00 0.00 0.00July 29 85.18 86.42 0.00 0.00 0.00 15.90 19.09 17.20 0.00 0.00 0.00 0.00 0.00 0.00July 30 87.61 88.84 0.00 0.00 0.00 16.20 20.66 17.29 0.00 0.00 0.00 0.00 0.00 0.00July 31 89.96 90.89 0.00 0.00 0.00 16.44 22.93 17.73 0.00 0.00 0.00 0.00 0.00 0.0001-Aug-19Total
Minimum 67.68 0.00 0.00 0.00 0.00Average 87.64 0.00 17.64 0.00 0.00
Maximum 0.00 25.16 0.00 0.00
UVTRaw Water UV 1 UV 2 UV 3 UV 4
Dose Dose Dose
July, 2019
Dose

Armstrong - Fortune Creek Month:UV System Performance Report
DateMin Avg Min Max Avg Min Max Avg Min Max Avg Min Max Avg% % mJ/cm^2 mJ/cm^2 mJ/cm^2 mJ/cm^2 mJ/cm^2 mJ/cm^2 mJ/cm^2 mJ/cm^2 mJ/cm^2 mJ/cm^2 mJ/cm^2 mJ/cm^2
August 1 91.63 92.40 0.00 0.00 0.00 15.77 25.16 17.49 0.00 0.00 0.00 0.00 0.00 0.00August 2 93.07 93.68 0.00 0.00 0.00 16.46 25.16 18.69 0.00 0.00 0.00 0.00 0.00 0.00August 3 94.31 94.81 0.00 0.00 0.00 15.92 25.16 19.72 0.00 0.00 0.00 0.00 0.00 0.00August 4 95.24 95.64 0.00 0.00 0.00 15.56 25.16 20.13 0.00 0.00 0.00 0.00 0.00 0.00August 5 95.99 96.36 0.00 0.00 0.00 17.42 25.16 20.34 0.00 0.00 0.00 0.00 0.00 0.00August 6 96.71 96.98 0.00 0.00 0.00 18.56 25.16 20.51 0.00 0.00 0.00 0.00 0.00 0.00August 7 97.26 97.45 0.00 0.00 0.00 18.47 25.18 21.09 0.00 0.00 0.00 0.00 0.00 0.00August 8 97.56 97.77 0.00 0.00 0.00 16.82 25.16 21.74 0.00 0.00 0.00 0.00 0.00 0.00August 9 97.82 98.03 0.00 0.00 0.00 16.95 25.18 22.54 0.00 0.00 0.00 0.00 0.00 0.00August 10 98.07 98.20 0.00 0.00 0.00 17.68 25.18 24.42 0.00 0.00 0.00 0.00 0.00 0.00August 11 97.04 98.01 0.00 0.00 0.00 18.21 25.18 24.43 0.00 0.00 0.00 0.00 0.00 0.00August 12 94.93 95.70 0.00 0.00 0.00 16.31 25.18 21.10 0.00 0.00 0.00 0.00 0.00 0.00August 13 93.67 95.48 0.00 0.00 0.00 16.27 25.18 20.24 0.00 0.00 0.00 0.00 0.00 0.00August 14 93.36 93.88 0.00 0.00 0.00 15.84 25.16 18.41 0.00 0.00 0.00 0.00 0.00 0.00August 15 94.32 94.55 0.00 0.00 0.00 16.39 25.16 18.93 0.00 0.00 0.00 0.00 0.00 0.00August 16 94.73 94.95 0.00 0.00 0.00 16.14 25.18 19.12 0.00 0.00 0.00 0.00 0.00 0.00August 17 95.03 95.25 0.00 0.00 0.00 15.99 25.16 20.71 0.00 0.00 0.00 0.00 0.00 0.00August 18 95.18 95.47 0.00 0.00 0.00 16.26 25.16 19.97 0.00 0.00 0.00 0.00 0.00 0.00August 19 94.94 95.72 0.00 0.00 0.00 16.58 25.16 18.52 0.00 0.00 0.00 0.00 0.00 0.00August 20 95.74 95.86 0.00 0.00 0.00 16.05 25.16 18.76 0.00 0.00 0.00 0.00 0.00 0.00August 21 95.50 95.89 0.00 0.00 0.00 16.48 25.16 19.69 0.00 0.00 0.00 0.00 0.00 0.00August 22 95.79 95.95 0.00 0.00 0.00 16.48 25.16 20.04 0.00 0.00 0.00 0.00 0.00 0.00August 23 92.90 95.89 0.00 0.00 0.00 15.90 25.16 20.79 0.00 0.00 0.00 0.00 0.00 0.00August 24 95.44 95.77 0.00 0.00 0.00 16.26 25.16 22.46 0.00 0.00 0.00 0.00 0.00 0.00August 25 95.24 95.78 0.00 0.00 0.00 0.00 25.18 22.15 0.00 0.00 0.00 0.00 0.00 0.00August 26 95.14 95.91 0.00 0.00 0.00 16.37 25.18 20.30 0.00 0.00 0.00 0.00 0.00 0.00August 27 95.81 96.05 0.00 0.00 0.00 16.44 25.16 19.93 0.00 0.00 0.00 0.00 0.00 0.00August 28 96.14 96.23 0.00 0.00 0.00 16.42 25.16 19.78 0.00 0.00 0.00 0.00 0.00 0.00August 29 95.44 96.38 0.00 0.00 0.00 16.54 25.16 19.87 0.00 0.00 0.00 0.00 0.00 0.00August 30 96.40 96.53 0.00 0.00 0.00 16.56 25.16 19.76 0.00 0.00 0.00 0.00 0.00 0.00August 31 96.45 96.61 0.00 0.00 0.00 16.54 25.16 21.91 0.00 0.00 0.00 0.00 0.00 0.00
01-Sep-19Total
Minimum 91.63 0.00 0.00 0.00 0.00Average 95.91 0.00 20.44 0.00 0.00
Maximum 0.00 25.18 0.00 0.00
UV 4Dose Dose Dose
August, 2019
DoseUVTRaw Water UV 1 UV 2 UV 3

Armstrong - Fortune Creek Month:UV System Performance Report
Date
Min Avg Min Max Avg Min Max Avg Min Max Avg Min Max Avg% % mJ/cm^2 mJ/cm^2 mJ/cm^2 mJ/cm^2 mJ/cm^2 mJ/cm^2 mJ/cm^2 mJ/cm^2 mJ/cm^2 mJ/cm^2 mJ/cm^2 mJ/cm^2
September 1 95.94 96.37 0.00 0.00 0.00 0.00 25.16 20.93 0.00 0.00 0.00 0.00 0.00 0.00September 2 96.40 96.56 0.00 0.00 0.00 16.65 25.16 20.57 0.00 0.00 0.00 0.00 0.00 0.00September 3 95.91 96.64 0.00 0.00 0.00 16.37 25.16 20.50 0.00 0.00 0.00 0.00 0.00 0.00September 4 96.15 96.57 0.00 0.00 0.00 16.44 25.16 21.11 0.00 0.00 0.00 0.00 0.00 0.00September 5 96.07 96.72 0.00 0.00 0.00 16.39 25.18 21.35 0.00 0.00 0.00 0.00 0.00 0.00September 6 96.46 96.81 0.00 0.00 0.00 16.37 25.18 21.31 0.00 0.00 0.00 0.00 0.00 0.00September 7 96.16 96.87 0.00 0.00 0.00 16.80 25.16 22.86 0.00 0.00 0.00 0.00 0.00 0.00September 8 96.31 96.81 0.00 0.00 0.00 16.41 25.18 23.14 0.00 0.00 0.00 0.00 0.00 0.00September 9 92.80 94.86 0.00 0.00 0.00 16.58 25.16 20.97 0.00 0.00 0.00 0.00 0.00 0.00September 10 89.34 93.54 0.00 0.00 0.00 15.69 25.16 20.32 0.00 0.00 0.00 0.00 0.00 0.00September 11 87.26 87.95 0.00 0.00 0.00 16.41 19.78 17.33 0.00 0.00 0.00 0.00 0.00 0.00September 12 87.56 88.33 0.00 0.00 0.00 16.31 19.59 17.73 0.00 0.00 0.00 0.00 0.00 0.00September 13 86.81 87.51 0.00 0.00 0.00 16.20 18.94 17.30 0.00 0.00 0.00 0.00 0.00 0.00September 14 87.06 87.55 0.00 0.00 0.00 16.44 18.94 17.59 0.00 0.00 0.00 0.00 0.00 0.00September 15 84.01 86.88 0.00 0.00 0.00 15.86 18.24 17.50 0.00 0.00 0.00 0.00 0.00 0.00September 16 78.74 82.29 0.00 0.00 0.00 16.03 18.09 17.00 0.00 0.00 0.00 0.00 0.00 0.00September 17 82.02 82.77 0.00 0.00 0.00 16.24 17.98 17.18 0.00 0.00 0.00 0.00 0.00 0.00September 18 81.13 81.59 0.00 0.00 0.00 15.62 18.06 17.13 0.00 0.00 0.00 0.00 0.00 0.00September 19 81.12 81.63 0.00 0.00 0.00 15.66 18.04 17.15 0.00 0.00 0.00 0.00 0.00 0.00September 20 82.12 82.57 0.00 0.00 0.00 16.26 17.89 17.00 0.00 0.00 0.00 0.00 0.00 0.00September 21 82.45 83.61 0.00 0.00 0.00 0.00 25.16 17.08 0.00 0.00 0.00 0.00 0.00 0.00September 22 83.67 84.79 0.00 0.00 0.00 15.81 25.16 17.67 0.00 0.00 0.00 0.00 0.00 0.00September 23 84.15 84.68 0.00 0.00 0.00 15.56 25.33 17.43 0.00 0.00 0.00 0.00 0.00 0.00September 24 81.92 84.91 0.00 0.00 0.00 0.00 25.16 14.58 0.00 0.00 0.00 0.00 0.00 0.00September 25 77.37 85.78 0.00 0.00 0.00 15.26 25.16 18.09 0.00 0.00 0.00 0.00 0.00 0.00September 26 84.13 85.15 0.00 0.00 0.00 15.54 25.18 18.15 0.00 0.00 0.00 0.00 0.00 0.00September 27 83.91 84.10 0.00 0.00 0.00 15.54 24.62 18.27 0.00 0.00 0.00 0.00 0.00 0.00September 28 84.10 84.46 0.00 0.00 0.00 15.98 25.16 18.58 0.00 0.00 0.00 0.00 0.00 0.00September 29 84.68 85.22 0.00 0.00 0.00 15.75 25.16 18.92 0.00 0.00 0.00 0.00 0.00 0.00September 30 85.56 85.87 0.00 0.00 0.00 14.27 25.18 18.32 0.00 0.00 0.00 0.00 0.00 0.00
October 102-Oct-19Total
Minimum 77.37 0.00 0.00 0.00 0.00Average 88.65 0.00 18.77 0.00 0.00
Maximum 0.00 25.33 0.00 0.00
UV 4
Dose Dose Dose
September, 2019
DoseUVT
Raw Water UV 1 UV 2 UV 3

Armstrong - Fortune Creek Month:UV System Performance Report
Date
Min Avg Min Max Avg Min Max Avg Min Max Avg Min Max Avg% % mJ/cm^2 mJ/cm^2 mJ/cm^2 mJ/cm^2 mJ/cm^2 mJ/cm^2 mJ/cm^2 mJ/cm^2 mJ/cm^2 mJ/cm^2 mJ/cm^2 mJ/cm^2
October 1 86.13 86.43 0.00 0.00 0.00 0.00 25.16 17.87 0.00 0.00 0.00 0.00 0.00 0.00October 2 83.38 85.96 0.00 0.00 0.00 15.77 25.16 18.68 0.00 0.00 0.00 0.00 0.00 0.00October 3 84.81 85.24 0.00 0.00 0.00 15.32 25.16 18.45 0.00 0.00 0.00 0.00 0.00 0.00October 4 85.26 85.35 0.00 0.00 0.00 14.42 25.16 18.43 0.00 0.00 0.00 0.00 0.00 0.00October 5 85.41 85.52 0.00 0.00 0.00 15.96 25.16 18.86 0.00 0.00 0.00 0.00 0.00 0.00October 6 85.66 85.83 0.00 0.00 0.00 16.07 25.18 19.00 0.00 0.00 0.00 0.00 0.00 0.00October 7 85.17 85.92 0.00 0.00 0.00 14.89 25.18 18.84 0.00 0.00 0.00 0.00 0.00 0.00October 8 84.14 85.30 0.00 0.00 0.00 15.68 24.73 18.41 0.00 0.00 0.00 0.00 0.00 0.00October 9 85.28 85.66 0.00 0.00 0.00 15.17 25.18 18.82 0.00 0.00 0.00 0.00 0.00 0.00October 10 85.79 86.21 0.00 0.00 0.00 16.07 25.16 18.68 0.00 0.00 0.00 0.00 0.00 0.00October 11 86.53 86.71 0.00 0.00 0.00 15.49 25.16 18.53 0.00 0.00 0.00 0.00 0.00 0.00October 12 86.54 86.83 0.00 0.00 0.00 15.49 25.16 19.53 0.00 0.00 0.00 0.00 0.00 0.00October 13 86.32 86.65 0.00 0.00 0.00 14.51 25.16 19.20 0.00 0.00 0.00 0.00 0.00 0.00October 14 86.47 86.56 0.00 0.00 0.00 15.73 25.16 19.29 0.00 0.00 0.00 0.00 0.00 0.00October 15 86.32 86.43 0.00 0.00 0.00 16.16 25.16 18.50 0.00 0.00 0.00 0.00 0.00 0.00October 16 86.07 86.24 0.00 0.00 0.00 0.00 25.16 16.35 0.00 0.00 0.00 0.00 0.00 0.00October 17 84.64 85.29 0.00 0.00 0.00 16.16 25.16 18.41 0.00 0.00 0.00 0.00 0.00 0.00October 18 82.41 83.58 0.00 0.00 0.00 15.06 23.23 17.94 0.00 0.00 0.00 0.00 0.00 0.00October 19 84.29 84.66 0.00 0.00 0.00 15.45 25.16 19.11 0.00 0.00 0.00 0.00 0.00 0.00October 20 84.70 85.07 0.00 0.00 0.00 15.28 25.16 19.22 0.00 0.00 0.00 0.00 0.00 0.00October 21 85.21 85.54 0.00 0.00 0.00 16.13 25.16 18.84 0.00 0.00 0.00 0.00 0.00 0.00October 22 84.19 84.85 0.00 0.00 0.00 15.30 25.16 18.64 0.00 0.00 0.00 0.00 0.00 0.00October 23 83.12 83.45 0.00 0.00 0.00 15.41 25.16 18.75 0.00 0.00 0.00 0.00 0.00 0.00October 24 82.97 83.23 0.00 0.00 0.00 15.43 24.47 18.35 0.00 0.00 0.00 0.00 0.00 0.00October 25 82.51 83.11 0.00 25.26 8.98 0.00 25.24 9.21 0.00 25.16 0.50 0.00 0.00 0.00October 26 82.56 82.68 14.66 25.13 19.39 0.00 0.00 0.00 0.00 0.00 0.00 0.00 0.00 0.00October 27 82.71 83.11 15.86 25.13 19.76 0.00 0.00 0.00 0.00 0.00 0.00 0.00 0.00 0.00October 28 83.82 83.97 16.07 25.16 20.70 0.00 0.00 0.00 0.00 0.00 0.00 0.00 0.00 0.00October 29 83.88 84.71 15.82 25.18 20.92 0.00 0.00 0.00 0.00 0.00 0.00 0.00 0.00 0.00October 30 84.95 85.69 15.41 25.13 19.57 0.00 0.00 0.00 0.00 0.00 0.00 0.00 0.00 0.00October 31 85.92 86.06 15.62 25.13 19.79 0.00 0.00 0.00 0.00 0.00 0.00 0.00 0.00 0.00
01-Nov-19Total
Minimum 82.41 0.00 0.00 0.00 0.00Average 85.22 4.16 14.71 0.02 0.00
Maximum 25.26 25.24 25.16 0.00
UVT
Raw Water UV 1 UV 2 UV 3 UV 4
Dose Dose Dose
October, 2019
Dose

Armstrong - Fortune Creek Month:UV System Performance Report
Date
Min Avg Min Max Avg Min Max Avg Min Max Avg Min Max Avg% % mJ/cm^2 mJ/cm^2 mJ/cm^2 mJ/cm^2 mJ/cm^2 mJ/cm^2 mJ/cm^2 mJ/cm^2 mJ/cm^2 mJ/cm^2 mJ/cm^2 mJ/cm^2
November 1 85.71 85.99 15.96 25.13 19.48 0.00 0.00 0.00 0.00 0.00 0.00 0.00 0.00 0.00November 2 86.32 86.87 15.81 25.13 20.94 0.00 0.00 0.00 0.00 0.00 0.00 0.00 0.00 0.00November 3 86.63 86.84 15.82 25.13 21.02 0.00 0.00 0.00 0.00 0.00 0.00 0.00 0.00 0.00November 4 86.57 86.66 15.39 25.13 20.15 0.00 0.00 0.00 0.00 0.00 0.00 0.00 0.00 0.00November 5 85.97 86.47 15.79 25.14 19.78 0.00 0.00 0.00 0.00 0.00 0.00 0.00 0.00 0.00November 6 86.57 86.74 15.92 25.14 20.02 0.00 0.00 0.00 0.00 0.00 0.00 0.00 0.00 0.00November 7 86.54 86.84 15.66 25.14 20.27 0.00 0.00 0.00 0.00 0.00 0.00 0.00 0.00 0.00November 8 87.13 87.76 15.28 25.14 20.95 0.00 0.00 0.00 0.00 0.00 0.00 0.00 0.00 0.00November 9 91.56 93.24 17.19 25.14 24.81 0.00 0.00 0.00 0.00 0.00 0.00 0.00 0.00 0.00November 10 92.71 93.02 17.14 25.14 24.95 0.00 0.00 0.00 0.00 0.00 0.00 0.00 0.00 0.00November 11 92.36 92.68 16.84 25.14 24.78 0.00 0.00 0.00 0.00 0.00 0.00 0.00 0.00 0.00November 12 92.01 92.45 16.44 25.14 23.57 0.00 0.00 0.00 0.00 0.00 0.00 0.00 0.00 0.00November 13 92.36 92.91 16.42 25.14 23.76 0.00 0.00 0.00 0.00 0.00 0.00 0.00 0.00 0.00November 14 93.29 93.61 16.54 25.14 24.28 0.00 0.00 0.00 0.00 0.00 0.00 0.00 0.00 0.00November 15 91.29 93.26 16.65 25.14 24.23 0.00 0.00 0.00 0.00 0.00 0.00 0.00 0.00 0.00November 16 91.60 92.46 16.56 25.14 24.70 0.00 0.00 0.00 0.00 0.00 0.00 0.00 0.00 0.00November 17 85.67 91.27 16.48 25.14 24.27 0.00 0.00 0.00 0.00 0.00 0.00 0.00 0.00 0.00November 18 86.38 87.39 0.00 25.13 9.18 0.00 25.16 10.51 0.00 0.00 0.00 0.00 0.00 0.00November 19 83.93 86.01 0.00 0.00 0.00 16.11 25.16 19.22 0.00 0.00 0.00 0.00 0.00 0.00November 20 56.10 81.09 0.00 0.00 0.00 15.73 25.18 19.56 0.00 0.00 0.00 0.00 0.00 0.00November 21 88.71 90.01 0.00 0.00 0.00 16.03 25.16 20.76 0.00 0.00 0.00 0.00 0.00 0.00November 22 89.21 90.03 0.00 0.00 0.00 16.41 25.14 20.82 0.00 0.00 0.00 0.00 0.00 0.00November 23 90.38 90.75 0.00 0.00 0.00 16.84 25.16 22.00 0.00 0.00 0.00 0.00 0.00 0.00November 24 90.99 91.28 0.00 0.00 0.00 15.96 25.16 22.29 0.00 0.00 0.00 0.00 0.00 0.00November 25 91.45 91.75 0.00 0.00 0.00 16.29 25.16 21.59 0.00 0.00 0.00 0.00 0.00 0.00November 26 92.36 94.30 0.00 0.00 0.00 16.13 25.16 23.72 0.00 0.00 0.00 0.00 0.00 0.00November 27 92.99 94.21 0.00 0.00 0.00 16.22 25.16 23.35 0.00 0.00 0.00 0.00 0.00 0.00November 28 94.56 95.64 0.00 0.00 0.00 16.82 25.16 23.97 0.00 0.00 0.00 0.00 0.00 0.00November 29 95.97 96.44 0.00 0.00 0.00 16.44 25.16 24.16 0.00 0.00 0.00 0.00 0.00 0.00November 30 96.13 96.78 0.00 0.00 0.00 16.63 25.16 24.93 0.00 0.00 0.00 0.00 0.00 0.00December 1
02-Dec-19Total
Minimum 56.10 0.00 0.00 0.00 0.00Average 90.49 13.04 9.23 0.00 0.00
Maximum 25.14 25.18 0.00 0.00
UV 4
Dose Dose Dose
November, 2019
DoseUVT
Raw Water UV 1 UV 2 UV 3

Armstrong - Fortune Creek Month:UV System Performance Report
Date
Min Avg Min Max Avg Min Max Avg Min Max Avg Min Max Avg% % mJ/cm^2 mJ/cm^2 mJ/cm^2 mJ/cm^2 mJ/cm^2 mJ/cm^2 mJ/cm^2 mJ/cm^2 mJ/cm^2 mJ/cm^2 mJ/cm^2 mJ/cm^2
December 1 66.34 89.80 0.00 0.00 0.00 16.16 25.16 22.67 0.00 0.00 0.00 0.00 0.00 0.00December 2 67.64 87.93 0.00 0.00 0.00 16.35 25.16 22.85 0.00 0.00 0.00 0.00 0.00 0.00December 3 94.96 95.76 0.00 0.00 0.00 16.48 25.16 23.67 0.00 0.00 0.00 0.00 0.00 0.00December 4 95.78 96.05 0.00 0.00 0.00 16.39 25.16 23.87 0.00 0.00 0.00 0.00 0.00 0.00December 5 96.22 96.49 0.00 0.00 0.00 16.88 25.16 24.13 0.00 0.00 0.00 0.00 0.00 0.00December 6 96.58 96.71 0.00 0.00 0.00 16.42 25.16 24.43 0.00 0.00 0.00 0.00 0.00 0.00December 7 96.23 96.87 0.00 0.00 0.00 16.74 25.16 24.92 0.00 0.00 0.00 0.00 0.00 0.00December 8 96.99 97.24 0.00 0.00 0.00 17.29 25.16 24.99 0.00 0.00 0.00 0.00 0.00 0.00December 9 97.45 97.59 0.00 0.00 0.00 17.17 25.16 24.75 0.00 0.00 0.00 0.00 0.00 0.00December 10 97.60 97.69 0.00 0.00 0.00 17.34 25.16 24.92 0.00 0.00 0.00 0.00 0.00 0.00December 11 97.50 97.65 0.00 0.00 0.00 17.25 25.14 24.67 0.00 0.00 0.00 0.00 0.00 0.00December 12 97.70 97.77 0.00 0.00 0.00 18.00 25.16 24.73 0.00 0.00 0.00 0.00 0.00 0.00December 13 97.76 97.90 0.00 0.00 0.00 18.73 25.18 24.99 0.00 0.00 0.00 0.00 0.00 0.00December 14 97.71 98.04 0.00 0.00 0.00 19.07 25.16 25.09 0.00 0.00 0.00 0.00 0.00 0.00December 15 98.11 98.24 0.00 0.00 0.00 19.39 25.16 25.09 0.00 0.00 0.00 0.00 0.00 0.00December 16 98.31 98.45 0.00 0.00 0.00 19.26 25.16 25.10 0.00 0.00 0.00 0.00 0.00 0.00December 17 98.41 98.50 0.00 0.00 0.00 19.16 25.14 25.09 0.00 0.00 0.00 0.00 0.00 0.00December 18 98.51 98.58 0.00 0.00 0.00 19.86 25.16 25.09 0.00 0.00 0.00 0.00 0.00 0.00December 19 98.56 98.62 0.00 0.00 0.00 19.63 25.16 25.09 0.00 0.00 0.00 0.00 0.00 0.00December 20 98.31 98.52 0.00 0.00 0.00 19.84 25.16 25.10 0.00 0.00 0.00 0.00 0.00 0.00December 21 96.74 97.65 0.00 0.00 0.00 18.34 25.16 25.07 0.00 0.00 0.00 0.00 0.00 0.00December 22 97.24 97.72 0.00 0.00 0.00 17.59 25.16 25.07 0.00 0.00 0.00 0.00 0.00 0.00December 23 97.95 98.16 0.00 0.00 0.00 18.38 25.16 25.06 0.00 0.00 0.00 0.00 0.00 0.00December 24 98.31 98.44 0.00 0.00 0.00 19.52 25.18 25.11 0.00 0.00 0.00 0.00 0.00 0.00December 25 98.51 98.60 0.00 0.00 0.00 20.27 25.16 25.12 0.00 0.00 0.00 0.00 0.00 0.00December 26 98.66 98.74 0.00 0.00 0.00 20.12 25.16 25.11 0.00 0.00 0.00 0.00 0.00 0.00December 27 98.77 98.83 0.00 0.00 0.00 20.34 25.16 25.11 0.00 0.00 0.00 0.00 0.00 0.00December 28 98.81 98.88 0.00 0.00 0.00 19.76 25.16 25.11 0.00 0.00 0.00 0.00 0.00 0.00December 29 98.86 98.92 0.00 0.00 0.00 20.94 25.16 25.12 0.00 0.00 0.00 0.00 0.00 0.00December 30 98.87 98.95 0.00 0.00 0.00 19.91 25.16 25.10 0.00 0.00 0.00 0.00 0.00 0.00December 31 98.81 98.96 0.00 0.00 0.00 0.00 25.26 24.05 0.00 0.00 0.00 0.00 0.00 0.00
01-Jan-20Total
Minimum 66.34 0.00 0.00 0.00 0.00Average 97.36 0.00 24.72 0.00 0.00
Maximum 0.00 25.26 0.00 0.00
UVT
Raw Water UV 1 UV 2 UV 3 UV 4
Dose Dose Dose
December, 2019
Dose

City of Armstrong Water System 2019 Annual Report
Page 99
Appendix 2 – Emergency Response Deviation Plan

Section 4 Deviation Response Plan
Background:
The surface water supply from Fortune Creek has the potential to contain pathogenic or disease causing microorganisms. As it is not practical or technically feasible to monitor for all pathogens (protozoa, bacteria, enteric viruses) in drinking water, microbiological guidelines are used to indicate the presence of organisms and effective treatment. To ensure that the water is potable (safe) a disinfection system using chlorine and ultra violet light has been implemented. The amount of chlorine that is added to the water is adequate to achieve the desired disinfection but not excessive as undesirable taste and odor will result. The water is sampled at various points throughout the water distribution system on a specified frequency and sent to a certified laboratory for analysis.
Water Quality and Disinfection:
Chlorine readily combines with organic compounds. In order to achieve disinfection, enough chlorine must be added to result in a free chlorine residual concentration of adequate strength. Good quality water requires a much lower dose of chlorine than poor quality. The resulting concentration and the contact time is crucial to achieving adequate disinfection.
Chlorine, when combined with organics, creates undesirable disinfection by products (THM’s). For this reason, when the Fortune Creek source becomes undesirable, as indicated by a turbidity of greater than 3.5, its use is discontinued and the alternate groundwater sources are used. Groundwater sources are disinfected with 12% hypo.
Water Quality and Turbidity:
The City of Armstrong monitors for cloudiness or turbidity continually through a SCADA system. Cloudy water is created when fine particles like sediment or organic matter end up in our water source usually due to heavy rain or during spring freshet. As turbidity increases our ability to adequately disinfect becomes more difficult. When the turbidity exceeds 3.5 Nephelometric Turbidity Unit (NTU) the use of surface water will be discontinued in favor of groundwater. In the event groundwater cannot be used (problems with the wells) Interior Health would be notified and a water quality advisory will be issued on the City’s web site. If the turbidity continues to rise and exceeds 5 NTU, and groundwater cannot be used Interior health would be notified and a boil water notice would be issued.
Testing Frequency:
The Drinking Water Protection Act, S.C.B. 2001, requires that where the population serviced is less than 5,000 a minimum of 4 samples per month be taken (see Section 5 – Drinking Water Quality Sampling Program).

Section 4 – Deviation Response Plan
In Addition:
The Operating Permit issued by Interior Health contains a condition that a drinking water sampling program be implemented. This program includes raw water, THM’s, aesthetic constituents and 6 microbiological samples per month from various locations within the City of Armstrong.
Testing Locations:
The location of samples is random between a total of 6 sites as shown on the site location (see Section 5 – Drinking Water Quality Sampling Program).
Monitoring of Effective Treatment:
All drinking water supplies should be analyzed routinely for coliform bacteria. The presence of excess total coliforms indicates that the disinfection is inadequate, but an immediate health hazard is unlikely. The presence of any Escherichia coliform (E. Coli) indicates that an immediate health hazard does exist. There should be a free chlorine residual at all points of the distribution system. This is defined as a minimum residual of 0.2 mg/l total at the end point. In order to achieve this, experience has shown that the free chlorine residual at the point where the water leaves the reservoir should be above 0.5 mg/l. This is the point that a continuous on line chlorine analyzer has been installed and a SCADA system is used to record and alarm the chlorine residual. In order to achieve a 0.5 mg/l free chlorine leaving the reservoir, it is necessary to dose the raw water at about 0.9 mg/l under normal operating conditions and higher if the water quality is not excellent.
In spite of maintaining adequate free chlorine residual, the routine microbiological sampling may detect the presence of coliforms. If unacceptable conditions exist, action must be taken to protect the health of the water customers. It should be noted that total coliform only without the presence of faecal coliform indicates a soil or vegetation source and faecal coliform results from a faecal matter source from a warm-blooded animal. Faecal coliform will also result in total coliform but not the opposite.
The following conditions are considered to be in compliance with providing safe water for consumers and no action is deemed necessary:
1. No sample should contain more than 10 total coliform organisms per 100 ml, none of which should be E. coli;
2. No consecutive sample from the same site should show the presence of coliform organisms;
3. Not more than one sample from a set of samples taken from the community on any given day should show the presence of coliform organisms. (Less than 1.1 mpn is the same as zero – no action needed.)
4. No raw water sample should contain more than 20 E. coli.

Section 4 – Deviation Response Plan
IF ANY OF THE ABOVE CRITERIA ARE EXCEEDED, CORRECTIVE ACTION SHOULD BE TAKEN IMMEDIATELY
REFER TO DEVIATION RESPONSE BELOW.
Deviation Response:
There are three types of public notification recommended by the Drinking Water Officer. These are: “Water Quality Advisory”; “Boil Water Notice”; and, “Do Not Use Water Notice”.
1. Water Quality Advisory:
A “Water Quality Advisory” will be issued as a precautionary measure when a health risk assessment determines that the risk to drinking water users is low.
2. Boil Water Notice:
A “Boil Water Notice” will be issued when a health risk assessment determines that an identified threat is a risk to drinking water and alternate source is not available.
3. Do Not Use Water Notice:
A “Do Not Use Water Notice” would be used in those situations where there is an immediate threat or a possible unknown threat to water quality has occurred due to:
• Terrorist acts; • Vandalism; or • Acts of nature.
The “Do Not Use Water Notice” must be used in those situations where boiling water will not remove or reduce the risk or threat to the water quality.
The implications for action of each form of public notification are as follows:
Water Quality Advisory:
• Requires immediate follow-up action; • Requires identification of cause and response; • Requires immediate follow-up response by operator and/or EHO/PHI; • May require re-testing of drinking water; • May require operating, maintenance and monitoring records; • Requires emergency response plan implementation and review;

Section 4 – Deviation Response Plan
Boil Water Notice:
• Provides more time to evaluate course of action once issued; • Requires immediate inspection by operators; • Requires follow-up inspections by PHI/DWO or PHE; • Requires identification of cause and responses; • Requires additional testing of drinking water; • Requires activation of emergency response plans; • May require emergency response plan review.
Do Not Use Water:
• Requires identification of an immediate or unknown potential threat, such as: o Terrorist acts; o Natural disasters; o Extreme conservation requirements; o Sewage contamination; o Vandalism; o Chemical threat or contamination;
• May require emergency response plan implementation and review.
Public notification must be given when a monitored parameter in relation to the drinking water exceeds an established standard or there is, was or may be a threat to the drinking water. The public notification must be made in a manner approved by the drinking water officer. The public notification should state why the notice is given and what actions should be taken.

Responsibility of the Sample Taker:
• Clearly label all sample bottles; • Adhere to appropriate sampling techniques to avoid contamination; • Ship to lab in a timely manner – maximum time is 24 hours from sample to receipt; • Store appropriately if shipping is to be delayed.
Responsibility of the Testing Laboratory:
• Sample analysis in an approved manner; • Report any E. Coli immediately to owner and Health.
Issuing a Boil Water Notice (BWN):
It may become necessary to issue a boil advisory due to known or suspected micro biological contamination. If there is any doubt, then an advisory is issued. Recent research indicates that holding water at a rolling boil for one minute will inactivate all waterborne pathogenic micro-organisms.
Management, Staff and Elected Officials will be advised first, City residents will be advised by radio broadcast on two local stations, information posted on the City’s website, and advertising in two local newspapers. High risk or high volume users will be advised by telephone. The Water Districts will be advised by a single telephone call to a contact person at each Water District and they will be responsible for contacting all their patrons. There exist a number of users outside the boundary of the City, and they will be contacted by telephone, see Section 2, Schedule C. Newspaper and radio ads would run until BWN is rescinded.
A boil notice will be rescinded after two consecutive sets of samples have returned to acceptable levels and the Health Department concurs.

City of Armstrong Water System 2019 Annual Report
Page 105
Appendix 3 - Certificates
CERTIFICATE ofCLASSIFICATION
EOCPt/
This is to certify that:
Dated: July 29,2019
At: Burnaby, BC
Valid until: July 29,2024
Facility No.2308
has been classified as a
Class ll WT Facility
City rl Atmstrong S0cterTrestmentPtsnt
CHAIR, BOARD OF DIRECTORS
A socieg incorporated under the Society Act, S.B.C. 3-28724
CHIEF EXECUTIVE OFFICER
/
,/,r/
EOCP
CERTIFICATE ofCLASSIFICATION
This is to certifu that:
Dated: August 20,2419
At: Burnaby, BC
Valid until: August 20,2024
Facility No. 725
has been classified as a
Class ll WD System
Citg rl Arrnstrong !0at erDistribution tgstem
CHAIR, BOARD OF DIRECTORS
A society incorporated under the Society Act, S.B.C. 5-28724
CHIEF EXECUTIVE OFFICER

This is to certify that: Blaine StewartBy examination has qualified as a
Water Distribution OperatorLevel I
Certification No. 7886Valid until: 31 December 2020 A society incorporated under the Society Act, S.B.C. S-28724

This is to certify that: Blaine StewartBy examination has qualified as a
Water Treatment OperatorLevel I
Certification No. 7886Valid until: 31 December 2020 A society incorporated under the Society Act, S.B.C. S-28724

This is to certify that: Chad PounderBy examination has qualified as a
Water Distribution OperatorLevel MUI
Certification No. 8549Valid until: 31 December 2020 A society incorporated under the Society Act, S.B.C. S-28724

This is to certify that: Chad PounderBy examination has qualified as a
Water Treatment OperatorLevel I
Certification No. 8549Valid until: 31 December 2020 A society incorporated under the Society Act, S.B.C. S-28724

CERTIFICATEOF
COMPLETIONISSUED TO
KERRYFOXIN RECOGNITION OF COMPLETION OF
"Dam Inspection & Maintenance,
SPONSORED BY THE BRITISH COLUMBIA WATER AND WASTE ASSOCIATION
October 16,2007Kamloops, BC
BCWWA0.6 CEU'S WILL BE AWARDED FOR THIS COI]RSE

CERTIFICATEOF
COMPLËTIONISSUED TO
RICKBRONSOI{IN RECOGNITION OF COMPLETION OF
ttl)am Inspection & Maintenance"
SPONSORED BY THE BRITISH COLUMBIA WATER AND WASTE ASSOCIATION
October 16,2007Kamloops, BC
JACKBCWWA
EN
0.6 CEU'S WILL BE AWARDED FOR THIS COI]RSE
This is to certify that: Kerry FoxBy examination has qualified as a
Water Distribution OperatorLevel II
Certification No. 4852Valid until: 31 December 2020 A society incorporated under the Society Act, S.B.C. S-28724

This is to certify that: Kerry FoxBy examination has qualified as a
Water Treatment OperatorLevel II
Certification No. 4852Valid until: 31 December 2020 A society incorporated under the Society Act, S.B.C. S-28724

This is to certify that: Rick BronsonBy examination has qualified as a
Water Distribution OperatorLevel I
Certification No. 4848Valid until: 31 December 2020 A society incorporated under the Society Act, S.B.C. S-28724

This is to certify that: Rick BronsonBy examination has qualified as a
Water Treatment OperatorLevel I
Certification No. 4848Valid until: 31 December 2020 A society incorporated under the Society Act, S.B.C. S-28724
This is to certify that: Russell SoanesBy examination has qualified as a
Water Distribution OperatorLevel I
Certification No. 1000551Valid until: 31 December 2020 A society incorporated under the Society Act, S.B.C. S-28724