Embed Size (px)
Citation preview

Water Supply Project Eastern and Midlands Region Water Supply Options Working Paper Appendix B Strategic Environmental Assessment (2007-2011) Source Yield Review
June 2015 Revision A01

150525WSP1_AppendixB(Source)_A01.doc
Contents
1 Introduction 1
2 Source Yield Review Methodology 2
2.1 Previous Yield Assessment and Findings – Preliminary Report 2010 2
2.2 Source Yield Review Methodology 3
3 River Shannon Options Source Yield Review 4
3.1 River Shannon Model 4
3.2 Lough Ree Yield Review 5
3.3 Lough Derg Yield Review 9
3.4 Parteen Basin Yield Review 11
4 Liffey/ Barrow Conjunctive Use 13
4.1 Introduction 13
4.2 Constraints imposed by flood protection 13
4.3 Scenario 1 14
4.4 Scenario 2 14
4.5 Scenario 3 15
4.6 Scenario 4 15
4.7 Conclusions on River Barrow Conjunctive use with the existing Liffey abstractions 16
5 Groundwater 17
6 Source Yield Review Outcomes 19
Appendix B1: Review of EDA Groundwater Report 2008
1 Introduction & Background 1
2 Key Concepts & Terminology 2
3 Review Process 4
3.1 General 4
3.2 Methodology used in the groundwater report (EDA, 2008) 4
3.3 Overview of data and legislation updates since 2008 6
3.4 Hydrogeological regime 7
3.5 Updated ‘developable resource’ estimates 10
3.6 Water Framework Directive Quantitative Objectives 13
4 Conclusions 16
5 References 17

150525WSP1_AppendixB(Source)_A01.doc

150525WSP1_AppendixB(Source)_A01.doc 1
1 Introduction
This report outlines the Source Yield Review carried out as part of Phase 1 of the option appraisal methodology.
Figure 1-A Options Appraisal Methodology

150525WSP1_AppendixB(Source)_A01.doc 2
2 Source Yield Review Methodology
2.1 Previous Yield Assessment and Findings – Preliminary Report 2010
Assessment of the Source Yield within the Preliminary Report varied by source water body:
• Shannon & Liffey/Barrow Options yield were assessed via hydraulic and hydrological modelling of catchment rainfall and study of gauging station records.
• For groundwater, the capability of regional aquifers was estimated by a specialist Groundwater Consultant.
• For Desalination, abstracting from the Irish Sea, the source yield issue did not arise.
A summary of the findings of the assessment was provided in Table 5.4 of the Preliminary Report. The most relevant points of the assessment have been extracted and presented in Table 2-A below.
Option Yield Assessment
A – Lough Ree (Direct).
Would require change in sluice operations at Athlone in order to comply with ESB regulations for water levels. Change in operation of sluices would require widespread stakeholder agreement. Change could increase risk of flooding – Lough Ree & Callows. Abstraction increases durations of minimum flow periods.
B - Lough Derg (Direct).
No change in lake levels. Reduced flows as a result of abstraction marginally increases residence times in lakes during dry periods. Requires agreement with ESB to modify power generation activities due to 1% - 2% reduction in average water flows.
C – Parteen Basin (Direct)
No change in lake levels. No increase in residence times. Requires agreement with ESB to modify power generation activities due to 1% - 2% reduction in average water flows.
D – Lough Ree and Lough Derg
Phase 1 requirement requires modification to operation of sluices which may marginally increase flood risk as per Option A. Requires ESB agreement.
E – Lough Ree and Storage
Abstractions can be achieved in compliance with ESB regulations. Abstraction may require minor modification to sluice operations, particularly in dry periods.
F2 – Lough Derg and Storage
With ESB co-operation (Ardnacrusha), Lough Derg on its own (as per Option B) does not require storage back up to maintain water levels, but storage offsets potential residence time impacts.
G – Lough Ree with Impoundment
Abstractions can be achieved in compliance with ESB regulations with minor modification to sluice operations.
H – Desalination No limitation on abstraction of sea water. I – Groundwater Groundwater for public supply is not available in sufficiently sustainable
quantities to cover long term needs. J – Liffey – Barrow Conjunctive Use
Sustainable availability of water from this option is too low to be considered as a strategic supply source.
Table 2-A Summary of Yield Assessment from the Preliminary Report1
In completion of the yield assessment, it was noted in the Preliminary Report that Option 1 – Groundwater and Option J – Liffey Barrow Conjunctive use were not
1 Extracts from table 5.4 & 5.5 of the preliminary Report

150525WSP1_AppendixB(Source)_A01.doc 3
considered further when technical & modelling assessments identified that neither option could provide the capacity for meeting supply needs. The remaining options were assigned a relative rating of Major Negative (- -) through to Major Positive (+ +) to individually evaluate each water supply option. This rating was combined alongside the other evaluation criteria and recommendations provided on the top four options. 2.2 Source Yield Review Methodology
Based on the assessment of the previous evaluation findings, as outlined above, this latest review proceeded as follows:
• Each source body will be considered in isolation.
• The re-evaluation process will be split and presented broadly under the following headings:
• Shannon Options Yield Review
• Liffey/Barrow Yield Review
• Groundwater Yield Review
The removal of desalination from the source yield assessment in the Preliminary Report, since yield from the sea is not an issue, remains valid, and as such it was not considered further in this Source Yield review.
150525WSP1_AppendixB(Source)_A01.doc 4
3 River Shannon Options Source Yield Review
3.1 River Shannon Model
The hydraulic and a hydrological model of the Upper Shannon River Basin, used in the Preliminary Report to evaluate the impact of water abstraction, consisted of 3 models:
• A hydrological model (MIKE 11 NAM) to describe the flows, the runoff pattern in the catchments and the inflow to the river.
• A river model (MIKE 11 HD) to describe the flows in the river and channels.
• A simplified lake model to describe the flow in the two main lake systems.
The model was calibrated for the years of 1989, 1995 and 2000, which included both prolonged dry and flood periods. Model runs were undertaken for simulated water abstraction associated with each new water supply option. The results were interrogated and are reported on in the relative assessments outlined above. This model used in the Preliminary Report was made available for validation. Upon investigation, the model was found to reproduce the reported results in the Preliminary Report for the 1995 (drought year) calibration simulation. 3.1.1 River Shannon River Regulations and Guidelines2
The main body of the River Shannon, in periods of normal flow, is controlled largely by the operating regulations and procedures of control structures and weirs and sluices along its route. ESB manages the three lakes on the Shannon in accordance with the Regulations and Guidelines for the Control of the River Shannon. These Regulations and Guidelines do not have any Statutory basis but take account of flooding, navigation, low flow management and safety and reflect the outcomes of longstanding consultation with key affected parties. Their key objectives are:
• To ensure weir and embankment safety at both Lough Allen and at the Lower Shannon Controls (i.e. the embankments at Parteen Basin and Ardnacrusha).
• To maintain, as far as possible, minimum and seasonal navigation levels in the main lakes.
• To minimise flooding as far as possible for the agricultural sector and the general public.
2 The River Shannon Level Operation Review Report (Jacobs Engineering Ireland Ltd, 2012) provides a detailed breakdown of the operating regulations and procedures used on the river channel (http://shannoncframstudy.ie/).

150525WSP1_AppendixB(Source)_A01.doc 5
3.1.2 Review of Source Yield Assessment
In consideration of the modelling work presented within the Preliminary Report and the constraints defined within The Regulations and Guidelines for the Control of the River Shannon; the sustainability of yield of an abstraction was defined as: “the ability to maintain statutory water levels within the source water body, without significant impact on residence time”. For the purposes of this review, a technically unsustainable option will therefore be defined as an option unable to maintain statutory water levels in its source water body. It is recognised that options taken forward through Phase 1 of the options appraisal methodology must later be appraised on potential impact on residence time within water bodies. As noted above, the ESB control the water levels within the lakes of the River Shannon, from which the new supply options under consideration include abstraction from Lough Ree, Lough Derg and Parteen Basin. 3.2 Lough Ree Yield Review
3.2.1 Controls on Lough Ree
The Regulations and Guidelines related to Lough Ree are summarised in Table 3-A.
Period Description Value
(NB. All levels relate to Malin Head Datum) April to June Target Level If > 35.1mOD reduce to 34.95mOD July to mid August Target Level If > 35.0mOD reduce to 34.85mOD Mid August to October
Target Level 34.49mOD by mid October
April to mid August Minimum Normal Operational Level
34.79mOD
Mid August to mid October
Minimum Normal Operational Level
34.49mOD
Mid October to end March
Minimum Normal Operational Level
34.18mOD
All year Minimum Navigation Level
34.18mOD
All year Downstream Level requiring Sluice Closure
33.42mOD
All year Minimum Downstream Flow Rate
12m³/sec (maintained by sluice gate operation when lake level lower than 34.79mOD)
Table 3-A Regulation and Guidelines related to Lough Ree
This is presented graphically in Figure 3-A.

150525WSP1_AppendixB(Source)_A01.doc 6
Figure 3-A Regulation and Guidelines in Respect of Levels in Lough Ree
The Regulations and Guidelines for the Control of the River Shannon require the gradual draw down of Lough Ree water levels in the period from April to October so as to ensure storage is optimised for flood management. Draw down, by opening the sluices on the Athlone weir, takes place only if the downstream levels permit, i.e. levels must be less than 34.2mOD Malin Head. 3.2.2 Flow Regime in Lough Ree
The minimum pass forward flow from Lough Ree is approximately 12m³/sec determined from water levels and weir discharge calculations when applying the Regulations and Guidelines for the Control of the River Shannon, which is maintained by the sluice gate operation in Athlone when the lake level is lower than 34.79mOD. Lough Ree acts as a reservoir for the Lower Shannon and the Shannon between Lough Ree and Lough Derg has a very low gradient. In the summers of 1989, 1995 and 2000, the Shannon experienced extreme low flows and in such conditions flow velocities are extremely low and the river suffers from algal growth. The discharge from Lough Ree at Athlone is not measured. Calculated values for discharge from Lough Ree at Athlone are derived from water level measurements at Coosan and from sluice gate openings at the weir at Athlone. It can be concluded that the discharge values from Lough Ree at Athlone are at best an estimate. Actual measured discharges or a reliable low flow stage discharge relationship does not exist at Athlone. A flow measurement device was installed at Athlone, but consistent low flow data has not materialised since its installation. Discharge at Athlone weir is likely to be higher than that measured from the sluice gate openings as the structure is large and is known to be less than watertight in places. The minimum discharge of 12m³/s is therefore likely to be exceeded in all scenarios.

150525WSP1_AppendixB(Source)_A01.doc 7
3.2.3 Recorded Water Levels in Lough Ree
Water Levels recorded by the ESB in Lough Ree at The Thatch, Coosan for the drought year 1995 show that the Target Water Levels set out in the Regulations and Guidelines for the Control of the River Shannon were not achieved for the period May to September. Similarly in 1989, Target Water Levels were not achieved for the period June to September. In 2000, recorded water levels were marginally below the Target Water Levels for the months of July and August.
Figure 3-B: 1995 Recorded Water Level Comparison with Regulation and Guideline Levels in
Lough Ree
3.2.4 Impact of abstraction from Lough Ree
Four new water supply options include abstraction from Lough Ree, namely:
• Option A – Lough Ree (Direct)
• Option D – Lough Ree and Lough Derg
• Option E – Lough Ree and Storage
• Option G – Lough Ree with Impoundment
Abstraction associated with each option differs in accordance to the operating regimes developed. These are summarised as follows in Table 3-B:

150525WSP1_AppendixB(Source)_A01.doc 8
Calendar Month
Abstraction (Ml/d)
Option A Option D Option E Option G
January 350 250* 600 420
February 350 250* 600 420
March 350 250* 600 420
April 350 250* 600 420
May 350 250* 60 80
June 350 250* 60 80
July 350 250* 60 80
August 350 250* 60 80
September 350 250* 600 420
October 350 250* 600 420
November 350 250* 600 420
December 350 250* 600 420
Table 3-B Seasonal variation in abstraction rates with different options
* Part abstraction from L. Ree
While peak abstraction varies across both options and calendar month, all require a minimum of 60Ml/d to be abstracted from Lough Ree in the summer months of July through August. As noted above, in the baseline 1995 drought period, using the current control structures, and applying implementation of the current operating regimes, the minimum normal operation level was not maintained within Lough Ree even without abstraction. It can therefore be stated that any additional abstraction from the Shannon system upstream of the Athlone Weir would serve only to exacerbate the 1995 drought year scenario. 3.2.5 Conclusion: Abstraction from Lough Ree
While previous modelling has simulated a scenario where water levels could be maintained, this review was influenced by the previously noted limitations in operation of the sluice gates at Athlone. The greater control which can be assigned to the operation of the sluice gates in hydraulic modelling of the system does not reflect the manually operated, judgement based controls currently employed and as such this information was considered secondary to the anecdotal evidence available on water levels from the baseline 1995 scenario. It is therefore considered justifiable that all options sourcing water from Lough Ree be considered unreasonable alternatives, from a yield viewpoint, and removed from further consideration.

150525WSP1_AppendixB(Source)_A01.doc 9
3.3 Lough Derg Yield Review
3.3.1 Controls on Lough Derg
Lough Derg is regulated by the ESB with flows and lake levels managed and controlled through the operation of the sluices on Parteen Weir. The sluices control the water supply into the Ardnacrusha headrace for power generation and also control the water flows in the Shannon River downstream of the weir. The Regulations and Guidelines related to Lough Derg are summarised in Table 3-C below.
Description Value (NB. All levels relate to Malin Head Datum)
Maximum Normal Operation Level 30.86mOD Minimum Normal Operating Level 30.40mOD Minimum Level to Facilitate Navigation 30.10mOD Minimum Statutory Low Water Level 29.30mOD Dam Crest Level 32.30mOD Maximum Level Parteen Basin 31.30mOD Minimum Level Parteen Basin 29.90mOD Compensation Flow to River Shannon at Parteen Weir
10m³/sec
Flow through fish pass at Ardnacrusha 0.7m³/sec Water abstraction at Headrace – Cloonlara for Clareville WTP
0.4m³/sec
Table 3-C Regulation and Guidelines related to Lough Derg
3.3.2 Flow Regime in Lough Derg
During non-flood periods the entire outflow from Lough Derg is used for Power Generation at Ardnacrusha apart from:
• Compensation flows to the River Shannon downstream of Parteen Weir of 10m³/sec.
• Flow through the fish pass at Ardnacrusha of 0.7m³/sec.
• Water abstraction at the headrace in Cloonlara for Clareville Water Treatment Plant, which serves Limerick City3.
During flood periods, Ardnacrusha generates power at the maximum throughput and with excess flood flows discharged from Parteen Weir to the River Shannon. 3.3.3 Recorded Water Levels in Lough Derg
Lough Derg’s water levels are normally managed within a narrow operating band of 460mm. Water Levels, recorded by the ESB in Lough Derg for the drought years 1995 and 2000, did not drop below the Minimum Normal Operating Level of 30.40mOD (Malin Head). In 1989 recorded water levels dropped below the Minimum
3 This latter existing abstraction of 0.4 m³/sec is not to be confused with the proposed abstraction of
330 Ml/d which is equivalent to a flow of the order of 4 m³/sec for the Water Supply Project:-Eastern
and Midlands Region

150525WSP1_AppendixB(Source)_A01.doc 10
Normal Operating Level for a period in October as a result of the need for additional power generation at Ardnacrusha. 3.3.4 Impact of abstraction from Lough Derg
The following options include abstraction from Lough Derg and have been reviewed with respect to yield issues.
• Option B - Lough Derg (Direct)
• Option F – Lough Derg and Storage
(a) Option B – Abstraction from Lough Derg (Direct)
Flows into, and through, Lough Derg would be reduced by the amount of water abstracted resulting in:
• Ardnacrusha generation activities reduced to reflect the 1% to 2% reduction in flows. Thus no impact on lake levels or downstream compensation flows would occur.
• Marginal increase in water residence times were projected (increase from 123 days to 130 days in dry years)4.
With historic anecdotal evidence indicating that statutory water levels were maintained for the drought years 1995 and 2000, a continuous abstraction of 350Ml/d from Lough Derg is technically feasible, from a yield viewpoint, with minor modifications to ESB generation at Ardnacrusha. Discussions have commenced with ESB on this topic. (b) Option F2 – Abstraction from Lough Derg with Storage
Option F ultimately requires an abstraction of 410Ml/d from Lough Derg for 10 months of the year and a reduced abstraction of 50Ml/d during the 2 month period from mid August to mid October. Flows into and through Lough Derg would be reduced by the amount of water abstracted resulting in:
• Ardnacrusha generation activities reduced to reflect the 1% to 2% reduction in flows. Thus no impact would occur on lake levels or downstream compensation flows.
• Increases in the residence times in Lough Derg would be minimised through the incorporation of raw water storage as part of the proposed abstraction regime.
With historic anecdotal evidence indicating that statutory water levels were maintained for the drought years 1995 and 2000, an abstraction of 410Ml/d for 10 months of the year and a reduced abstraction of 50Ml/d during the 2 month period from mid August to mid October from Lough Derg would be technically feasible, from a yield point of view, with minor modifications to ESB generating output. Discussions have commenced with ESB on this topic.
4 This effect will be further investigated as part of the modelling work currently under way on Lough
Derg.

150525WSP1_AppendixB(Source)_A01.doc 11
3.3.5 Environmental impacts noted in the SEA Environmental Report
The impacts of a marginal increase in low flow residence time were assessed in the SEA Environmental Report; which concluded that it is unlikely to have adverse impacts on biodiversity (not deemed to have significant environmental impacts on a European Site). The SEA Environmental Report also identified that abstraction may potentially influence the ecology of the system through impacts on nutrient flushing and phytoplankton ecology, which could have potential knock-on influences up through the trophic levels, i.e. aquatic plants, fish, etc. The possibility that minor changes to residence time may lead to significant changes in nutrient and phytoplankton dynamics in Lough Derg was considered unlikely in the SEA Environmental Report; however, it was recognised that while abstraction without impact on water level would be possible by agreement with ESB, research and modelling on the possible impacts on residence time would be required. The process of building that hydrodynamic model of Lough Derg/Parteen Basin has now commenced, and the water quality monitoring survey which has also commenced will provide the data necessary to calibrate it. Prior to this, it has been necessary to view Lough Derg as a single homogeneous water body for the purposes of estimating residence time, and impacts upon it. The model will advance the state of knowledge in the SEA, (for which purpose it was recommended by the SEA), and it will examine the different bays and flow patterns in the Lough, which might result in different low-flow residence times in different parts of the water body. That will have a bearing on whether raw water storage, proposed at Garryhinch, can successfully mitigate the impacts on residence time, throughout the water body, of a seasonally varied abstraction from the North Eastern sector of Lough Derg. It should be noted that residence time impact on Lough Derg would not be a factor in abstraction at Parteen Basin, since all water abstracted at Parteen would already have travelled through Lough Derg, as it naturally does at present. As Parteen Basin is an existing storage facility for Ardnacrusha, no additional storage would be required. 3.4 Parteen Basin Yield Review
3.4.1 Controls on Parteen Basin
Parteen Basin is regulated by the ESB with flows and lake levels managed and controlled through the operation of the sluices on Parteen Weir. The sluices control the water supply into the Ardnacrusha headrace for power generation and also control the water flows in the Shannon River downstream of the weir. The Regulations and Guidelines related to Parteen Basin are summarised in Table 3-D:

150525WSP1_AppendixB(Source)_A01.doc 12
Description Value
(NB. All levels relate to Malin Head Datum)
Minimum Level Ardnacrusha 28.80mOD Minimum Level Headrace to ensure 28.80mOD at Ardnacrusha 29.90mOD
Minimum Level in Parteen Basin to ensure 28.80mOD at Ardnacrusha 30.00mOD
Minimum Level in Parteen Basin for dam safety 29.90mOD Maximum Level in Parteen Basin for dam safety 31.30mOD Minimum Level Pier Head 30.40mOD Minimum Normal Operating Level in Lough Derg 30.40mOD Minimum Level to Facilitate Navigation in Lough Derg 30.10mOD Maximum Normal Operating Level Lough Derg 30.86mOD
Table 3-D Regulation and Guidelines related to Parteen Basin
3.4.2 Flow Regime in Parteen Basin
During non-flood periods the entire outflow from Parteen Basin is used for Power Generation at Ardnacrusha apart from:
• Compensation flows to the River Shannon downstream of Parteen Weir of 10m³/sec.
• Flow through the fish pass at Ardnacrusha of 0.7m³/sec.
• Water abstraction at the headrace in Cloonlara for Clareville Water Treatment Plant.
During flood periods Ardnacrusha generates power at the maximum throughput of 400m³/s and excess flood flows are discharged from Parteen Weir to the River Shannon. 3.4.3 Recorded Water Levels in Parteen Basin
Parteen Basin’s water levels are managed within a normal operating band of 460mm. Water Levels, recorded by the ESB in Parteen Basin for the drought years 1995, 1989 and 2000, did not drop below the Minimum Level of 30.00mOD (Malin Head). 3.4.4 Impact of abstraction from Parteen Basin
A continuous abstraction of 350Ml/d (4.05 m³/sec) from Parteen Basin is technically feasible, with minor modifications to ESB generating output at Ardnacrusha. There would be no impact on:
• Compensation flows for the River Shannon downstream of Parteen Weir.
• Minimum operational water levels in Lough Derg.
• Minimum navigational water levels in Lough Derg.
• Water abstraction for the Clareville WTP.

150525WSP1_AppendixB(Source)_A01.doc 13
4 Liffey/ Barrow Conjunctive Use
4.1 Introduction
This option was examined in the context of drawing upon autumn, winter and spring flows on the River Barrow and using them to supplement the existing Liffey source, in a conjunctive strategy with the Ballymore Eustace (BME) and Leixlip Water Treatment Plants. The Option was modelled in the Preliminary Report on the assumption that flows would be pumped to the BME Intake, and the model covered 54 years of record (1950 - 2004), including the extreme drought years of 1975-76, 1984 and 1995. The model assumed that a steady abstraction of 225 Ml/d would take place at Leixlip WTP, and would be supported by water releases from Pollaphuca. It then examined different scenarios of combination of water imports from the Barrow, with water treatment at BME, to examine how much yield increase could be achieved, over the combined yield of the two WTPs on the Liffey, which was assessed at 533 Ml/d. The model examined the historical record and essentially replicated it, in each year of record, as if the modelled water supply abstractions had been in place instead of the actual rates of water abstraction at the time. The model also incorporated a facility to apply various rules of control of the releases at Pollaphuca, depending on conditions elsewhere in the system. Since the historical record included a number of significant drought years, such as 1975, 1976, 1984 and 1995, and given that the 1976 event is regarded as a 50 year return period drought in the east of Ireland, then the results provided a robust test of the reliability of the proposed abstraction combinations with the proposed operating rules. In summertime, when abstraction from the Barrow would have to be discontinued, the full combined raw water requirement would then have to be taken from Pollaphuca. This approach would essentially curtail abstraction from Pollaphuca in winter months, in order to have a chance of a higher reservoir level, from which the full combined abstraction could be sustainably abstracted in the following summer months. The modelled conditions in the Preliminary Report should now be seen against the commissioning of a new Water Treatment Plant at Srowland, near Athy, in summer 2013, which abstracts 38 Ml/d (40 Ml/d gross abstraction) for supply to Kildare, within the Dublin Water Supply Area. 4.2 Constraints imposed by flood protection
On Pollaphuca, the Maximum Crest Level of the dam is 189.59 mOD, but for reasons of flood control, the Normal High Level of Stored Water is 186.30 mOD. The band above that level is controlled to attenuate floods passing through, to avoid flooding in the Liffey catchment downstream. When water levels on Pollaphuca exceed 186.30 mOD, the model was programmed to spill the surplus, to return water level to 186.30 mOD. Releases from Pollaphuca to the Upper Liffey, through the power turbines at Golden Falls, were modelled under all scenarios to sustain the intended 225 Ml/d abstraction from Leixlip Reservoir, while ensuring that compensation water spilled through the turbines at Leixlip was also a minimum 2 m3/s.

150525WSP1_AppendixB(Source)_A01.doc 14
If however, the releases from Pollaphuca were prompted, not by calls for raw water augmentation to supply Leixlip WTP, but because water level had risen into the upper flood control band on Pollaphuca, then that was indicative of an inefficient scenario which had got the balance wrong between pumping water from the Barrow in winter, to supply all required water from Pollaphuca in summer. Involuntary spillages from Pollaphuca were recognised by the model as indicating that the modelled scenario was unable to efficiently balance wet and dry conditions over the years, to avoid spilling water to waste. Such water would arguably be needlessly pumped from the Barrow, if it resulted in holding water in Pollaphuca ready for a drought that did not materialise, and with later winter inflows to Pollaphuca then forcing involuntary spillage to the Liffey. A number of Scenarios were examined. 4.3 Scenario 1
Period River Barrow to BME
Pollaphuca to BME
Total
October to June 80 Ml/d 280 Ml/d 360 Ml/d July to September 0 360 Ml/d 360 Ml/d
Table 4-A Scenario 1
Abstracting 80 Ml/d from the Barrow in each month, except July, August and September of each year, (if confirmed environmentally sustainable on the Barrow) would permit a restrained drawoff from Pollaphuca of 280 Ml/d over the same period, in a combined demand of 360 Ml/d, which is 42 Ml/d over the planned conjunctive use at present. Even this initial abstraction scenario from the Barrow, at 80 Ml/d, was however found to be inefficient in that almost half the pumped volume in the long term of record was involuntarily spilled from Pollaphuca under flood control rules. 4.4 Scenario 2
Period River Barrow to BME
Pollaphuca to BME
Total
October to May 120 Ml/d 280 Ml/d 400 Ml/d June to September - 400 Ml/d 400 Ml/d
Table 4-B Scenario 2
A greater abstraction of 120 Ml/d from the Barrow, over a shorter time frame in the months from October to May each year, was modelled with a curtailed drawoff from Pollaphuca of 280 Ml/d over the same period, in an increased combined demand of 400 Ml/d. In June each year, the combined 400 Ml/d was modelled as being abstracted from Pollaphuca until the following October. This scenario was found not to be sustainable in an extreme drought such as 1975-76. The volume of involuntary spillages in almost every modelled year of record substantially exceeded the quantity of water pumped from the Barrow, indicating high inefficiency in the scenario.

150525WSP1_AppendixB(Source)_A01.doc 15
The Preliminary Report acknowledged that, if there are any involuntary spillages in a strategy involving part pumping, the opportunity cost of the spilled water is very expensive, because, the marginal cost of spilled water, is the cost of pumped water against a high head. 4.5 Scenario 3
Period River Barrow to BME
Pollaphuca to BME
Total
October to April 160 Ml/d 260 Ml/d 420 Ml/d May to September - 420 Ml/d 420 Ml/d
Table 4-C Scenario 3
In Scenario 3, in the period from October to April inclusive, 160 Ml/d was modelled as pumped from the Barrow, with a more restrained 260 Ml/d abstracted in parallel from Pollaphuca at the same time. On May 1st each year, the combined abstraction of 420 Ml/d was wholly applied to the Pollaphuca Reservoir until the following October. It was found in the Preliminary Report that this scenario would also have failed, in an extreme drought year, such as 1975-76, and the volume of involuntary spillages to the Liffey would again have significantly exceeded the volume of water pumped from the Barrow, because the storage band on Pollaphuca was too narrow to manage the water passing through it. 4.6 Scenario 4
Period River Barrow to BME
Pollaphuca to BME
Total
November to April 200 Ml/d 240 Ml/d 440 Ml/d May to October - 440 Ml/d 440 Ml/d
Table 4-D Scenario 4
In Scenario No. 4, a larger quantity, 200 Ml/d, was modelled as pumped from the Barrow, but only for the period from November to April inclusive, where higher flows could possibly have sustained it. This was accompanied by a curtailed abstraction of 240 Ml/d from Pollaphuca during the same period, later stepped up to the full combined 440 Ml/d for the period from May to October in each year. Numbers of days in the record where the scenario would have failed increased over previous scenarios, and the volumes of water involuntarily spilled were almost always significantly greater than the volume pumped, indicating again a fundamental imbalance, primarily due to the level constraints on the Pollaphuca reservoir. If 100% efficiency is assigned to the two drought years of 1975 and 1976 (where all water which was pumped in the model, was productively used), modelling showed that there would have been some benefit in eight other years of the 50 year record, but at generally low efficiencies, less than 20% in all but one. For 40 years of the 54 year record, there would have been water spilled to waste from Pollaphuca, well in excess of that pumped from the Barrow, indicating high inefficiency.

150525WSP1_AppendixB(Source)_A01.doc 16
4.7 Conclusions on River Barrow Conjunctive use with the existing Liffey abstractions
In examining these conjunctive use scenarios, the Preliminary Report found that more water would have been spilled involuntarily to waste, than would have been pumped at heavy cost from the Barrow. Only in a severe drought, which had the characteristic of a dry preceding winter, would imported pumped water be likely to result in 100% of the pumped water being retained and productively used overall. In other less severe droughts, the Report found that there would be marginal benefits from pumping, but only in the sense that of all the water pumped, up to 20% of it might not be lost, which is a very low efficiency. The environmental impacts on the River Barrow of abstracting significant quantities of water in addition to the 40 Ml/d abstraction by Kildare County Council at Srowland near Athy were recognised as a substantial risk on this Option. Problems of securing stakeholder consent to development of autumn and late spring flows on the Barrow would be very appreciable, and would be difficult to justify given the risk that such water export might be accompanied by involuntary spillages of equivalent amounts in the receiving catchment at other times. Accordingly, it is our view that the River Barrow could not be expected to sustainably supplement the yield of the Liffey system by more than 20-40Ml/d, and accordingly it is not proposed to carry it forward as a primary source option. However, if a pipeline route from the Shannon were to pass close to the Srowland WTP north of Athy, and so provide a conduit for winter flows of treated water from the Barrow into a Shannon-Liffey system, then this connection could be examined as a productive seasonal use of headroom capacity at Srowland, subject to securing permission to adjust the Water Rights Order there.

150525WSP1_AppendixB(Source)_A01.doc 17
5 Groundwater
An SEA and a Preliminary Report which appraised options and identified a preferred new major supply source to meet the long term demand of the Dublin Region was prepared by RPS-Veolia JV (2010). As part of that study, the option of using groundwater was investigated by Eugene Daly & Associates5 (EDA) (2008). As part of the Source Yield Assessment a review was undertaken of the groundwater report (EDA, 2008) in order to inform the technical options assessment to enable recommendations on water supply options. This review (appended in Appendix B1) incorporated an assessment of the principles and methodology, coupled with an examination of new legislation, new and updated relevant datasets and consideration of WFD Quantitative Objectives. The main data and legislative updates since 2008 include new and revised Geological Survey of Ireland geological/hydrogeological data layers/information, revised and updated EPA WFD Risk Assessments, and the Groundwater Regulations 2010. The 2014 Review found that the general approach undertaken in 2008 was reasonable and valid. It was concluded that the rationale and filtering process to assess the bulk ability of the groundwater resources in the study area to meet the identified long term demand was appropriate, and was sufficiently robust to indicate whether or not groundwater alone is a viable major source of water. The 2014 review notes
• The suggested resource using the EDA methodology is approximately 100-124 Ml/d. Updated average annual recharge estimates to the bedrock aquifers are generally less than those used in the original EDA (2008) assessment. This is largely due to updated and completed national groundwater vulnerability maps, and refined recharge coefficients, used in this review.
• Application of WFD quantitative objectives methodology to assess the available regional groundwater resource suggests volumes (representing average conditions) are in the order of 115 Ml/d. This is comparable to the estimates indicated in the EDA (2008) report and to the estimates using updated data/datasets.
Any proposal to develop an aquifer to provide part of the demand would have to locate, test and prove the yield of the aquifer. It would have to do so under the Water Framework Directive and Groundwater Regulations obligation not to bring about a significant impact on terrestrial ecosystems dependent upon groundwater. Hydrogeological information to properly model this interaction between groundwater, and dependent surface water ecosystems, for substantial abstractions on a regional scale is not yet well established. If that standard can be approached in a particular case, the groundwater resource must then be sustainably developed as wellfields, where cones of depression can be locally modelled, where legally robust water rights can be obtained, and where source water quality can be protected by appropriate land use restrictions.
5 As part of public consultation on the SEA and the investigation of groundwater, comment was
received on the Eugene Daly study stating the position that the study was very conservative and that a
much higher figure (197Ml/d) may be available (see Appendix F).

150525WSP1_AppendixB(Source)_A01.doc 18
The 2014 Review concludes that the hydrogeological regime comprises aquifers that cannot support the defined demand volumes. However, it is noted that the potential available resource, whilst insufficient to yield the overall project demand, could benefit the scheme through conjunctive use and/or emergency or backup supply or additional support, where it can be proven to be sustainable in the manner outlined above..

150525WSP1_AppendixB(Source)_A01.doc 19
6 Source Yield Review Outcomes
The outcome of the review of the options from the viewpoint of yield of water is presented in Table 6-A:-
Option
Option A – Lough Ree (Direct)
Regulatory minimum water levels cannot be attained for the 1995 drought year, and on yield considerations it is not proposed to further assess this option.
Option B – Lough Derg (Direct).
Regulatory minimum water levels can be attained in the 1995 drought year.
Option C – Parteen Basin (Direct)
Regulatory minimum water levels can be attained in the 1995 drought year.
Option D – Lough Ree and Lough Derg
Regulatory minimum water levels cannot be attained in Lough Ree for the 1995 drought year, and on yield considerations it is not proposed to further assess this option.
Option E – Lough Ree and Storage
Regulatory minimum water levels cannot be attained for the 1995 drought year, and on yield considerations it is not proposed to further assess this option.
Option F2 – Lough Derg and Storage
Regulatory minimum water levels can be attained in the 1995 drought year.
Option G – Lough Ree with Impoundment
Regulatory minimum water levels cannot be attained for the 1995 drought year and on yield considerations it is not proposed to further assess this option.
Option H – Desalination
No requirement to review under yield assessment
Option I – Groundwater
Groundwater for public supply is not sustainably available in sufficient quantities to meet long term demands.
Option J – Conjunctive use of the River Barrow
The River Barrow could not be expected to sustainably supplement the yield of the Liffey system by more than 20-40Ml/d, and accordingly it is not proposed to further assess this option.
Table 6-A Summary of review outcome
Options B, C, F2, and H have been found not to be constrained on yield and are therefore recommended to be carried forward for more detailed option appraisal.

150525WSP1_AppendixB(Source)_A01.doc 20

150525WSP1_AppendixB(Source)_A01.doc
Appendix B1: Review of EDA Groundwater Report 2008

150525WSP1_AppendixB(Source)_A01.doc

150525WSP1_AppendixB(Source)_A01.doc
Water Supply Project – Dublin Region Groundwater - Review of EDA Groundwater Report 2008
150525WSP1_AppendixB(Source)_A01.doc
Contents
1 Introduction & Background 1
2 Key Concepts & Terminology 2
3 Review Process 4
3.1 General 4
3.2 Methodology used in the groundwater report (EDA, 2008) 4
3.3 Overview of data and legislation updates since 2008 6
3.4 Hydrogeological regime 7
3.5 Updated ‘developable resource’ estimates 10
3.6 Water Framework Directive Quantitative Objectives 13
4 Conclusions 16
5 References 17
150525WSP1_AppendixB(Source)_A01.doc
Index of Tables
Table 3-1 Identified Aquifer units (EDA, 2008) to be developable
resources 5
Table 3-2 Estimates of ‘developable resource’ as defined by EDA (2008) 12
Table 3-3 WFD status and risk of relevant groundwater bodies 13
Table 3-4 Water balance - Available groundwater resource and nominal capacity 15

150525WSP1_AppendixB(Source)_A01.doc
Index of Figures
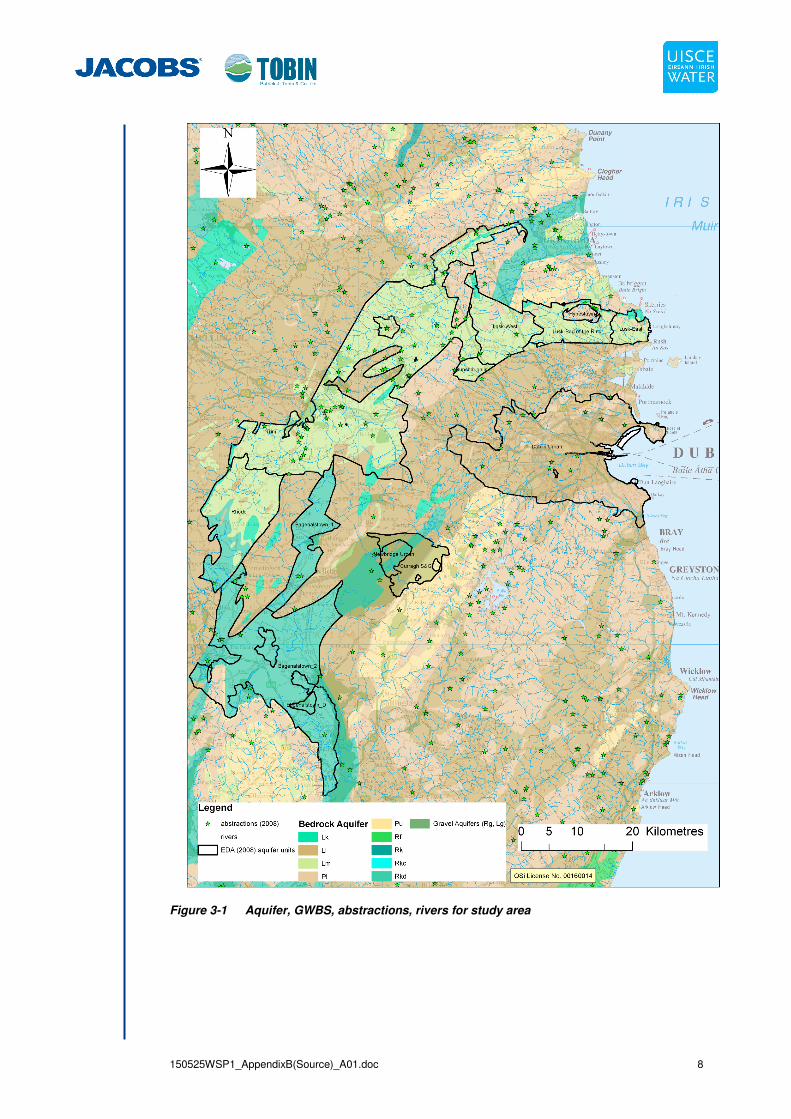
Figure 3-1 Aquifer, GWBS, abstractions, rivers for study area 8
Figure 3-2 Recharge GSI 2013 for area of interest 9

150525WSP1_AppendixB(Source)_A01.doc 1
1 Introduction & Background
As part of a preliminary source options appraisal by Jacobs-TOBIN, a review was required of the groundwater report (EDA, 2008) in order to inform the technical options assessment to enable recommendations on water supply options. The approach of the review of the groundwater option and recommendations of the EDA report (2008) incorporated an assessment of the principles and methodology, coupled with a review of new legislation, and new and updated relevant data (sets) and consideration of WFD Quantitative Objectives.

150525WSP1_AppendixB(Source)_A01.doc 2
2 Key Concepts & Terminology
A groundwater body is a management unit based on geological and hydrogeological properties, and surface water and groundwater divides. A detailed approach to defining and delineating groundwater bodies in Ireland is provided in Guidance Document No. 2 prepared by the Groundwater Working Group (2005). The Geological Survey of Ireland delineated the groundwater bodies as part of the initial River Basin District characterisation (EPA, 2005). EDA (2008) used the groundwater bodies as defined by the GSI as the basic building block to assess the groundwater resource. For the purposes of the Water Framework Directive (WFD) the EPA carry out inter alia quantitative and qualitative tests on groundwater bodies and classify them as either ‘Poor’ or ‘Good’ status for quantitative and chemical elements. There are four quantitative tests:
1. Water balance test (abstraction/recharge) 2. Ground Water Dependent Terrestrial Ecosystems (GWDTE) test 3. Saline intrusion 4. Surface water test
The criteria for failing the WFD quantitative tests (Abstraction/recharge), i.e., the groundwater body would be at a ‘Poor Status’ are as follows:
• Abstraction represents more than 80% recharge.
• Evidence of declining water levels and abstractions are >20% recharge.
• GWDTE damaged, along with evidence of declining water levels and abstractions are >5% recharge.
The available groundwater resource described in the Groundwater Regulations (2010):
“means the long-term annual average rate of overall recharge of the body of
groundwater less the long-term annual rate of flow required to achieve the
ecological quality objectives for associated surface waters specified under
Article 4 of Directive 2000/60/EC, to avoid any significant diminution in the
ecological status of such waters and to avoid any significant damage to
associated terrestrial ecosystems”
The ‘developable resource’ is the term used by EDA (2008) to estimate the volume of groundwater that is potentially available for abstraction. It takes account of recharge, abstraction and uses a coefficient of 25% based on expert judgment and experience against the estimated potential resource to determine the “developable resource”. Recharge and recharge coefficient Hunter Williams et al. (2013) state that the “amount of water that is available to recharge the body of groundwater is given by the total rainfall minus the actual evapotranspiration from plants and from the soil surface (the hydrologically effective rainfall), and minus the surface runoff and interflow. The recharge coefficient value is determined mainly by the permeability and thickness of the superficial deposits that overlie the country’s aquifers”.

150525WSP1_AppendixB(Source)_A01.doc 3
Transmissivity (m2/d) is defined as the rate at which water can pass through the full aquifer thickness. Simply stated, it is the hydraulic conductivity multiplied by the saturated aquifer thickness.

150525WSP1_AppendixB(Source)_A01.doc 4
3 Review Process
3.1 General
The general process consists of an overview of the methodology to determine the resource potential and the data used therein by EDA (2008). Consideration was given to updated and new datasets, and WFD quantitative objectives, relevant to assessing the resource potential and to the overall option of using groundwater as a primary option to meeting the project demand.
3.2 Methodology used in the groundwater report (EDA, 2008)
The outline approach undertaken by EDA (2008) to assess the groundwater resource capable of meeting the project demand was as follows:
• Select the aquifers and groundwater bodies within a defined study area around Dublin.
• Estimate the ‘potential resource’ by calculating recharge and subtracting cumulative pumping and baseflow estimates.
• Determine the ‘developable resource’ through the application of a coefficient based on expert judgement/experience.
The over-riding conclusion was that groundwater on its own would not be able to supply the required projected demand and that the best use of the limited resource would be in a supplementary capacity. The steps followed in the EDA methodology are examined in more detail as follows. 1. By reviewing and selecting regionally and locally important bedrock and gravel
aquifers 19 ‘aquifer units’ were identified (Tables 5 and 6, EDA, 2008). EDA (2008) then worked out a ‘corrected outcrop area’ for each of the identified units, for instance by trimming less permeable geological formations from groundwater bodies. This initial filter is appropriate in the context of examining regional groundwater resources that could potentially provide large groundwater abstractions. The bedrock aquifers comprise fissured rock units with varying degrees of connectivity and all have low storage characteristics.
2. Recharge and ‘existing demands’ estimates were then computed to determine
the ‘potential resource’ (Table 6, EDA, 2008). This step used the available groundwater vulnerability maps, recharge coefficients, the 2005 abstraction register and also used low flow indices to derive an estimate required to maintain baseflow. The estimate to allow for baseflow depended on the aquifer classification and EDA (2008) indicates a maximum of 5 l/s/km2 for a regionally important aquifer. There is a lack of information on the hydrological standards required to support ecosystems and wetlands. Baseflow and low flow indices are good surrogates. The WFD risk assessment for quantitative objectives uses 20% in the case of bedrock aquifers to assess impact potential of abstraction to allow sufficient baseflow to rivers.
3. Using thresholds of 20 Ml/d, and an 80 km distance filter, EDA selected ‘aquifer
units’ appropriate to the scale of demand required (Table 7, EDA, 2008) which

150525WSP1_AppendixB(Source)_A01.doc 5
were considered potentially large enough to be assessed further to determine the ‘developable resource’. Given the scale and project criteria, this is an appropriate approach. EDA (2008) reported that the resultant 6 ‘aquifer units’ provide a sufficiently large enough potential resource to be examined further (Table 3-1).
Table 3-1 Identified Aquifer units (EDA, 2008) to be developable resources
4. EDA (2008) applied an appropriate fraction based on experience of groundwater
exploration and development of 25-30% to the ‘potential resource’ to calculate the ‘developable resource’. This constraint consists of a range of factors with no guidance available to base a specific value. As such, there is nothing by which to either support or dispute this fraction. However, given the typical hydrogeological regime and the historical development of groundwater, this report would tentatively support a relatively low starting point. As a comparative validation, an investigation and exploration for a large sustainable groundwater supply to augment the water supplies of East Meath, South Louth and Drogheda examined 675 km2, drilled over 60 boreholes and quantified the sustainable groundwater resource that would not risk WFD quantitative objectives as being in the order of 22 Ml/d (WYG Tobin JV, 2009; Conroy, 2007). It is notable that yield estimation based on over two years research on an aquifer of 675km² in extent, and similar in characteristics just north of Bog of the Ring, yielded only 22Ml/d. In terms of an EDA constraint multiplier, and given this is broadly an equivalent hydrogeological regime, this approximates to less than 10% of the area and available recharge, which is less than the 25-30% used by EDA (2008).
In conclusion, the rationale and filtering process to assess the bulk ability of the groundwater resources in the study area to meet the identified long term demand is appropriate and sufficiently robust to indicate whether or not groundwater alone is a viable major source of water.

150525WSP1_AppendixB(Source)_A01.doc 6
3.3 Overview of data and legislation updates since 2008
The main relevant developments have been identified since 2008 are as follows:
• Geological Survey of Ireland (GSI):– new and revised geological/hydrogeological data layers/information.
• EPA:– Revised & updated WFD Risk Assessments (www.epa.ie; www.wfdireland.ie).
• Legislation:– Groundwater Regulations 2010.
Geological Survey of Ireland: The relevant data and data layers relevant to a technical regional assessment of groundwater resources that have been updated and/or published by the GSI are as follows:
• Groundwater Vulnerability: Complete national groundwater vulnerability coverage is now available. Counties that were not mapped at the time of the EDA (2008) assessment included Louth, Westmeath, Carlow, and the majority of county Dublin. The counties or portions of counties at the time that were mapped included Laois, Meath, Kildare, Wicklow and a portion of north county Dublin (the Bog of the Ring). In completing the national coverage previously mapped areas were updated, including Wicklow, Laois, Kildare and Meath.
• Groundwater Recharge: GSI have updated and revised the national groundwater recharge map based on an updated and completed national groundwater vulnerability map and its’ inherent parent maps (subsoil permeability and depth to bedrock), refined recharge coefficients and a 5 km by 5 km rainfall grid available by Met Éireann (Hunter Williams et al., 2013). The refined and improved recharge coefficients are based on largely on research into recharge mechanisms (Misstear et al., 2007, 2008, 2009a, b).
WFD Status: An updated risk assessment was conducted in 2009 to implement further WFD characterisations with respect to groundwater abstractions, taking account of an updated abstractions register and an updated recharge map (CDM, 2009). In relation to the study area for the Water Supply Project, the Bog of the Ring groundwater body was (and currently remains) designated ‘at-risk of not achieving good status’ under this test evidenced by declining water levels. This is discussed later in consideration of WFD objectives. Legislation: The Environmental Objectives (Groundwater) Regulations (2010) strengthen existing provisions of the Water Framework Directive regarding quantitative and qualitative status. The regulations and the WFD are receptor orientated rather than emission orientated and one of the most relevant definitions in the context of this report is the definition of the ‘available groundwater resource’, which:
“means the long-term annual average rate of overall recharge of the body of
groundwater less the long-term annual rate of flow required to achieve the
ecological quality objectives for associated surface waters specified under
Article 4 of Directive 2000/60/EC, to avoid any significant diminution in the

150525WSP1_AppendixB(Source)_A01.doc 7
ecological status of such waters and to avoid any significant damage to
associated terrestrial ecosystems”
This is particularly relevant as it constrains the available resource and differs to the EDA concept of a ‘developable resource’ which seeks to simply estimate the potential volume of water available for abstraction. However, there is a factor of safety applied in the EDA estimate – 25%, which may or may not be closely aligned to ecological requirements of associated surface waters. 3.4 Hydrogeological regime
The hydrogeological regime is documented in various documents (for instance: DELG et al., 1999, EPA, 2005, Fitzsimons, et al., 2005; Hunter-Williams et al., 2013). The entire country is classified as an aquifer (Fitzsimons, et al., 2005). A portion of the aquifer map is shown in Figure 3-1. The categories indicate the hydrogeological regime present in an area and describe the value of the resource and the manner and behaviour in which groundwater moves and is stored. In the bedrock aquifers groundwater flows through fissures (solutionally enlarged in karstic aquifers) and between the grains that constitute sand and gravel aquifers. Low transmissivity (less than 50 m2/d, and often less than 10 m2/d) and low specific yield (less than 1%) typifies the poorly productive aquifers (Ll, Pl, Pu). Groundwater flow tends to be restricted to upper shallow bedrock in a poorly connected fracture network. The productive fissured aquifers (Lm, Rk) are typically more transmissive (typically greater than 50 to 100 m2/d) and somewhat greater specific yields (1-2%) (Hunter-Williams, et al, 2013). Groundwater flow tends to occur in extensive zones shallow and deep bedrock where greater connectivity exists throughout the fracture network. Recharge is governed by the recharge coefficient value which is determined mainly by the permeability and thickness of the superficial deposits that overlie the country’s aquifers. However, recharge to the poorly productive aquifers is limited and there are caps of 100 mm/yr to 200 mm/yr applied (Hunter-Williams, et al., 2013). A portion of the national recharge map is given in Figure 3-2.
150525WSP1_AppendixB(Source)_A01.doc 8
Figure 3-1 Aquifer, GWBS, abstractions, rivers for study area

150525WSP1_AppendixB(Source)_A01.doc 9
Figure 3-2 Recharge GSI 2013 for area of interest

150525WSP1_AppendixB(Source)_A01.doc 10
3.5 Updated ‘developable resource’ estimates
The purpose of this section is to apply updated data and datasets to the EDA (2008) ‘aquifer units’ to compute an updated ‘developable resource’ as defined by EDA (2008) and compare to previous estimates. Recharge The average recharge was computed in GIS for each of the units using the current recharge map (Table 3-2). A direct comparison was undertaken for the Loughshinny, Allenwood, Ballyadams-Milford and the Lucan (Trim/Enfield) Aquifer units as termed by EDA (2008). It can be seen that the average recharge is generally less for these units with the exception of the Lucan (Trim/Enfield) Unit. The predominant reason for a change in the recharge estimates are new and updated groundwater vulnerability maps. In the case of the Lucan (Trim/Enfield) Unit, the estimate of recharge is greater as EDA (2008) has appeared to have applied a low recharge coefficient – in the order of 35% (155 mm/ yr). For the Mid-Kildare unit, the area applied in the EDA (2008) report is 35 km2 but it is unclear what portion of the eastern half of the aquifer this refers to. The Newbridge and Curragh East groundwater bodies are 23 and 67 km2 respectively. For the purposes of the calculations in this report, an estimate of recharge and ‘developable resource’ are provided for the eastern half of the aquifer (90km2) and then also compared to an area difference of approximately a 1/3 to the EDA estimate (whilst a crude comparison not doing so distorts the comparison). The Newbridge and Curragh East groundwater bodies are 23 and 67km2 respectively. However, the area applied in the EDA (2008) report is 35km2 but it is unclear what portion of the eastern half of the aquifer this refers to. For the purposes of the report an estimate of recharge and ‘developable resource’ are provided for the entire eastern portion (Newbridge and Curragh East) and also compared to 30% of the EDA (2008) estimate. For the Dublin Lucan unit, no direct recharge figure is reported in the EDA (2008) report. Overall, where readily computable, recharge on review is 24% to 46% lower in three of the main comparable bedrock aquifer units and 35% higher in one unit than the EDA (2008) estimates. Existing Demands in the EDA (2008) report essentially consisted of abstraction data and estimates of baseflow requirements. The calculations used the National abstraction register available at the time and baseflow indices dependent on the dominant aquifer regime. Updates to the ‘existing demands’ are given in Table 3-2. Potential Resource and Developable Resource EDA (2008) calculated the ‘developable resource’ based on a fraction (‘constraint multiplier’) of 25-30% of the ‘potential resource’ (being recharge minus the ‘existing demand’). An updated estimate of the ‘developable resource’ is presented in Table 3-2 and, depending on the area used to compute the Mid-Kildare aquifer unit resource, is broadly equivalent to that estimated previously (EDA, 2008). With the exception of the Lucan (Trim/Enfield) aquifer unit the ‘developable resource’ of the other bedrock units (Loughshinny, Allenwood, Ballyadams) is less than previously estimated, principally due to lower annual average recharge estimates.

150525WSP1_AppendixB(Source)_A01.doc 11
Overall the total ‘developable resources’ are in the order of 100 to 125 Ml/d using the EDA methodology. Conclusion: The computation of the ‘developable resource’ (EDA, 2008) using updated data, particularly the application of the updated recharge map indicates that the groundwater resource is insufficient to supply the project demand of 350 Ml/d and broadly supports the estimates of the EDA (2008) report. Declining groundwater levels in the Bog of the Ring well field indicate the difficulty of providing a sustainable groundwater source from relatively low permeability bedrock largely overlain by relatively thick low permeability subsoil.

150525WSP1_AppendixB(Source)_A01.doc 12
Table 3-2 Estimates of ‘developable resource’ as defined by EDA (2008)

150525WSP1_AppendixB(Source)_A01.doc 13
3.6 Water Framework Directive Quantitative Objectives
Application of the WFD and GW Quantitative Objectives to this assessment provides another means of assessing the available groundwater resource, particularly as these provisions of these objectives give the necessary framework to Groundwater Resource evaluation. The WFD quantitative tests considered the impact of abstraction on the groundwater body as a whole in terms of recharge and the impact on rivers and groundwater dependent terrestrial ecosystems. There is a lack of information available on the flow standards required in rivers to support ecosystems and groundwater dependent terrestrial ecosystems. The criteria for failing the quantitative objectives, i.e., the groundwater body is at ‘Poor Status’ or at Risk of being at Poor Status are as follows:
• Abstraction represents more than 80% recharge;
• Evidence of declining water levels and abstractions are >20% recharge;
• GWDTE damaged and evidence of declining water levels and abstractions are >5% recharge.
The EPA are responsible for classifying and designating status and risk of surface water and groundwater bodies. Currently the groundwater bodies that make up the EDA (2008) aquifer units are classified as being at ‘Good Status’. However, the risk designations are variable (Table 3-3).
Table 3-3 WFD status and risk of relevant groundwater bodies
The water balance assessment abstraction/ratios (based on 2009 abstractions and current recharge estimates) are given in Table 3-4 which include the component groundwater bodies of the Loughshinny aquifer unit. When the Loughshinny Group is examined, in terms of its component groundwater bodies, the individual ratios are notably higher. In considering the feasibility of abstracting water from these aquifer units/groundwater bodies, without risk of failing WFD quantitative objectives, the projected available groundwater resource is computed (Table 3-4). The threshold for this exercise was set at 20% of available recharge (30% for the gravel aquifer) which is the threshold used for the water balance assessment (GW Working Group document No. 5, 2005). The resultant computed volume of the available groundwater resource is approximately 147 Ml/d. Subtracted from this, is the current

150525WSP1_AppendixB(Source)_A01.doc 14
abstraction based on the 2009 register to give the nominal ‘capacity’, i.e., the potential volume on top of what is currently being abstracted without failing WFD objectives (Table 3-4). The resultant ‘capacity’ suggests a resource in the order of 115 Ml/d. This estimate is comparable to the estimates computed using the EDA methodology and the updated datasets which suggest 100-124 Ml/d depending on the area used for the gravel aquifer. Comments: It is suggested that these estimates are considered to represent average groundwater conditions. Additional assessments of the ecological flows needed to support the rivers and wetlands in the catchments within the groundwater bodies are needed for detailed assessment. The abstraction register which was current at September 2008 (CDM, 2009) is undoubtedly out of date and does not include unknown or unregistered abstractions such as some golf clubs, commercial/industrial, farms and quarries. Documented declining water levels in the Bog of the Ring well field, due to over abstraction, highlight the limited resource associated with the general hydrogeological regime that typifies much of the study area. Similar difficulties have been encountered in County Monaghan (Misstear et al., 2008) where long term declining levels have been observed to due over abstraction and limited recharge. The hydrogeological assessment conducted for the East Meath, South Louth and Drogheda Water Improvement Scheme consisted of over 60 boreholes and covered an equivalent hydrogeological terrain of approximately 675 km2. The assessment demonstrated that the groundwater resource within the study area is capable of providing significant yields, in the order of 22 Ml/d, which would maintain WFD quantitative objectives. However, the resource is insufficient to meet the full augmentation requirements of the scheme requirements nor did it match the initial average sustainable yield estimates of approximately 33-41 Ml/d. The study illustrates the limited regional resources in the general eastern portion of the country.

150525WSP1_AppendixB(Source)_A01.doc 15
Table 3-4 Water balance - Available groundwater resource and nominal capacity

150525WSP1_AppendixB(Source)_A01.doc 16
4 Conclusions
• The methodology employed by EDA (2008) set about examining the regional groundwater resource to provide 350 Ml/d. The report concluded that the groundwater resource is limited. Application of more recent data/datasets suggest a similar resource magnitude to those originally estimated by EDA (2008).
• The suggested resource using the EDA methodology is approximately 100-124 Ml/d. Average annual recharge estimates to the bedrock aquifers are generally less than those data used in the original EDA (2008) assessment. This largely due to updated and completed national groundwater vulnerability maps and refined recharge coefficients.
• Application of WFD quantitative objectives methodology to assess the available regional groundwater resource suggests volumes (representing average conditions) are in the order of 115 Ml/d. This is comparable to the estimates indicated in the EDA (2008) report and to the estimates using updated data/datasets.
• Further information would be required on abstraction volumes and the ecological flow requirements of the rivers and wetlands in order to predict impacts of abstraction on ecosystems.
• The hydrogeological regime comprises aquifers that cannot support the defined demand volumes.
• The potential available resource, whilst insufficient to yield the overall project demand, could benefit the scheme through conjunctive use and/or emergency or backup supply or additional support.

150525WSP1_AppendixB(Source)_A01.doc 17
5 References
Conroy, M. (2007) East Meath, South Louth And Drogheda Water Improvement Scheme, Investigation of Groundwater Potential for augmentation of public supply. IAH Conference Tullamore 2007. CDM (2009). Further Characterisation/Programmes of Measures. Groundwater Abstractions Pressure Assessment. Final report, February 2009. Dublin City Council, Dublin. EDA (2008). Groundwater Resources of the Central Leinster Area and their potential to augment the Dublin Region Water Supply. Appendix 0 in Volume 2 of the Preliminary Report for the Water Supply Project – Dublin Region (RPS, 2010). EPA (2005). The Characterisation and Analysis of Ireland’s River Basin Districts. National Summary Report, 148pp. Environmental Objectives (Groundwater) Regulations (2010). S.I. No. 9 of 2010. Groundwater Working Group (2005). Guidance Document No. GW 2. Water Framework Directive (WFD) River Basin District Management Systems: Approach to Delineation of Groundwater Bodies, 16pp. Groundwater Working Group (2005). Guidance Document No. GW 5. Water Framework Directive (WFD) River Basin District Management Systems: Guidance on the assessment of the impact of groundwater abstractions, 15pp. Hunter Williams, N.H., Misstear, B.D.R., Daly, D., and M. Lee (2013). Development of a national groundwater recharge map for the Republic of Ireland. Quarterly Journal of Engineering Geology and Hydrogeology, Vol. 46. RPS-Veolia JV (2010). Preliminary Report Water Supply Dublin Region. Report on behalf of Dublin City Council. Misstear, B.D.R. & Fitzsimons, V.P. (2007). Estimating recharge in fractured bedrock aquifers in Ireland. In: Krásný, J. & Sharp, J.M. (eds) Groundwater in Fractured Rocks. IAH Selected Paper Series, 9, 243–257. Misstear, B.D.R., Brown, L. & Hunter Williams, N.H. (2008). Groundwater recharge to a fractured limestone aquifer overlain by glacial till in County Monaghan, Ireland. Quarterly Journal of Engineering Geology and Hydrogeology, 41, 465–476. Misstear, B.D.R., Brown, L. & Daly, D. (2009a). A methodology for making initial estimates of groundwater recharge from groundwater vulnerability mapping. Hydrogeology Journal, 17, 275–285. Misstear, B.D.R., Brown, L. & Johnston, P.M. (2009b). Estimation of groundwater recharge in a major sand and gravel aquifer in Ireland using multiple approaches. Hydrogeology Journal, 17, 693–706.
150525WSP1_AppendixB(Source)_A01.doc 18
WYG Tobin JV (2009). Preliminary Engineering Report Volume 5 of 7 Hydrogeological Report for the East Meath South Louth Drogheda Water Improvement Scheme. Meath County Council.